Embed Size (px)
Citation preview
REGIONAL FISHERIES LIVELIHOODS PROGRAMME FOR SOUTH AND SOUTHEAST ASIA (RFLP) – VIET NAM
---------------------------------------------------------
BASELINE SURVEY
VOLUME 2: BASELINE SURVEY RESULTS FOR QUANG TRI PROVINCE
Activity 4.1.1: Survey of income and gender situation in target communes Activity 4.1.2: Identification of needs and priorities
For the Regional Fisheries Livelihoods Programme for South and Southeast Asia – Viet Nam
Prepared by
Le Thi Hoa Sen, Ph.D. Ho Le Phi Khanh, M.Sc.
Truong Van Tuyen, Ph.D.
Centre for Community Research and Development (CCRD)
Thua Thien Hue, April 2011

Baseline Survey Volume 2: Baseline Survey Results for Quang Tri Province
2
This publication has been made with the financial support of the Spanish Agency of
International Cooperation for Development (AECID) through an FAO trust-fund project, the
Regional Fisheries Livelihoods Programme (RFLP) for South and Southeast Asia -
GCP/RAS/237/SPA. The content of this publication does not necessarily reflect the opinion
of AECID, FAO, RFLP, or MARD.
All rights reserved. Reproduction and dissemination of material in this information product
for educational and other non-commercial purposes are authorized without any prior written
permission from the copyright holders provided the source is fully acknowledged.
Reproduction of material in this information product for resale or other commercial purposes
is prohibited without written permission of the copyright holders. Applications for such
permission should be addressed to:
Chief
Electronic Publishing Policy and Support Branch
Communication Division
FAO
Viale delle Terme di Caracalla, 00153 Rome, Italy
or by e-mail to:
© FAO 2011
For bibliographic purposes, please reference this publication as:
Le, T. H. S., Ho, L. P. K. & Truong, V. T. (2011). Baseline survey volume 2: Baseline
survey results for Quang Tri Province. Regional Fisheries Livelihoods Programme for South
and Southeast Asia (GCP/RAS/237/SPA) Field Project Document 2011/VIE/5E.
Baseline Survey Volume 2: Baseline Survey Results for Quang Tri Province
3
Table of Contents
LIST OF FIGURES AND TABLES .................................................................................................... 4
LIST OF ACRONYMS ........................................................................................................................ 6
TERMINOLOGIES, INTERPRETATION, AND DEFINITIONS ................................................. 7
EXECUTIVE SUMMARY .................................................................................................................. 8
I. PROFILE OF SURVEYED COMMUNES AND HOUSEHOLDS ............................................ 11
1. FISHERY SECTOR OF THE PROVINCE ............................................................................................. 11
2. CHARACTERISTIC OF THE SURVEYED COMMUNES ....................................................................... 11
3. CHARACTERISTICS OF THE HOUSEHOLD RESPONDENTS ............................................................... 14
II. BASELINE ANALYSIS FOR FIVE OUTPUTS ........................................................................ 16
1. FISHERIES CO-MANAGEMENT ...................................................................................................... 16
1.1 Existing policies and institutions that have influence on co-management and areas for
strengthening them ...................................................................................................................... 16
1.2 Key governmental fisheries management stakeholders ........................................................ 16
1.3 The community-based fisheries management ....................................................................... 16
1.4 Perception of fishers on the fisheries management and conflict resolution systems ............ 17
1.5 Understanding and expectation on the concept “co-management” among fishers and
government staff ......................................................................................................................... 18
1.6 Participation in fisheries management .................................................................................. 20
1.7 Fishers and resource managers’ perception on state of the fisheries resources and benefits
from fisheries .............................................................................................................................. 20
2. SAFETY AT SEA ............................................................................................................................. 22
2.1 Awareness of, perception, and access to safety at sea information ...................................... 22
2.2 Compliance with safety at sea regulations ............................................................................ 24
2.3 Fishing accidents and effectiveness of rescue systems ......................................................... 26
2.4 Fishers’ knowledge and confidence in rescue practice at sea ............................................... 30
3. POST HARVEST AND MARKETING ................................................................................................. 31
3.1 Post-harvest skills, knowledge and practices ........................................................................ 31
3.2 Post-harvest facilities ............................................................................................................ 32
3.3 Market of fisheries products ................................................................................................. 33
3.4 Quality control of fishery products ....................................................................................... 35
3.5 Policies and institutions related to fisheries post-harvest ..................................................... 36
3.6 Funding and staff deployed for post-harvest ........................................................................ 37
4. LIVELIHOOD DIVERSIFICATION AND ENHANCEMENT ................................................................... 38
4.1 Livelihood activities ............................................................................................................. 38
4.2 Fishers’ satisfaction and attitude towards their livelihoods .................................................. 39
4.3 Factors affecting livelihood change ...................................................................................... 40
4.4 Income and livelihood diversification .................................................................................. 40
4.5 Supporting services for livelihood enhancement and diversification ................................... 41
5. MICROFINANCE ............................................................................................................................ 44
5.1 Formal and informal financial institutions operating in the communes ............................... 44
5.2 Perception of formal financial institutions on fisheries activities and the proportion of fisher
among their clientele base ........................................................................................................... 44
5.3 Fishers’ awareness of and access to financial services in the communes ............................. 44
5.4 Fishers’ awareness and access to subsidized credit lines ...................................................... 46
5.5 Potential for saving mobilization .......................................................................................... 47
III. PROPOSED RFLP OUTPUT INDICATORS ........................................................................... 49
REFERENCES .................................................................................................................................... 52
ANNEX: SUMMARY OF SURVEY RESPONSES......................................................................... 53

Baseline Survey Volume 2: Baseline Survey Results for Quang Tri Province
4
List of Figures and Tables
Figure 1: Map of surveyed sites ............................................................................................................ 11
Figure 2: Fishers’ awareness on basic safety items/equipment during fishing at sea ........................... 25
Figure 3: Mechanism for accident reporting and rescue ....................................................................... 28
Figure 4: Fishers’ perception on effectiveness of rescue activities ....................................................... 29
Table 1: Number of fishing villages and poverty rate in the surveyed communes in 2010 .................. 12
Table 2: Household categories by livelihood type of the surveyed communes in 2010 ....................... 13
Table 3: Types of fisheries -based households in surveyed communes in 2010 ................................... 13
Table 4: GDP structure of the surveyed communes in 2010 ................................................................ 14
Table 5: Age and sex of the household respondents ............................................................................. 14
Table 6: Classification of the surveyed households by poverty and fishery activity ............................ 15
Table 7: Classification of the surveyed household members by labor type .......................................... 15
Table 8: Effectiveness of community-based fisheries management systems ....................................... 17
Table 9: Effectiveness of governmental fisheries management systems .............................................. 18
Table 10: Effectiveness of conflict resolution systems ......................................................................... 18
Table 11: Respondents’ awareness of fisheries “co-management” ...................................................... 19
Table 12: Perception on overall usefulness of fisheries co-management in fishery resources
management and livelihood improvement ............................................................................................ 19
Table 13: Stakeholder participation in fisheries management .............................................................. 20
Table 14: Fishers and resource managers’ perception on state of the fisheries resources in the last five
years ...................................................................................................................................................... 21
Table 15: Fishers and resource managers’ perception on state of the fisheries resources in the next five
years ...................................................................................................................................................... 22
Table 16: Perception on the share of benefits from fisheries resources ................................................ 22
Table 17: Stakeholder awareness on safety at sea information and regulations ................................... 23
Table 18: Stakeholder perception on access to safety at sea information ............................................. 23
Table 19: Fishers’ satisfaction with safety at sea channels .................................................................. 24
Table 20: Government staff satisfaction with safety at sea channels .................................................... 24
Table 21: Fishers’ assessment of usefulness of safety at sea information ............................................ 24
Table 22: Fishers’ compliance with safety at sea regulations ............................................................... 25
Table 23: Boat registration and inspection in Quang Tri Province....................................................... 26
Table 24: Number of fishing accidents during the last five years in the surveyed communes ............. 29
Table 25: Fishers’ participation in training on avoiding rescuing practices at sea ............................... 30
Table 26: Fishers’ confidence in avoiding accident at sea .................................................................... 30
Table 27: Fishers’ confidence in rescuing practices at sea ................................................................... 31
Table 28: Fishers’ skills and knowledge on post-harvest ..................................................................... 31
Table 29: Fishers’ participation in the training on post-harvest practices during the last three years .. 32
Table 30: Post-harvest facilities of the fishers in the surveyed communes in 2010 ............................. 32
Table 31: Fishery products and productivity in surveyed commune in 2010 ....................................... 33
Table 32: Market chain of fishery products in the surveyed communes in 2010 ................................. 34
Table 33: Respondent opinion on degree of dependence of fishers on middle traders ......................... 34
Table 34: Fisher perception on type of market of their fisheries products ........................................... 35
Table 35: Percentage of exported fishery products in 2010 .................................................................. 35
Table 36: Number of fish trading and fish processing units inspected and certified ............................ 36
Table 37: Fisher and processor satisfaction with the support from fisheries post-harvest institutions . 37
Table 38: Degree of confidence of officers working on post-harvest fisheries in performing post-
harvest techniques and practices ........................................................................................................... 38
Table 39: Fishers’ perception on the livelihood opportunities compared to five years ago ................. 39
Table 40: Fishers’ satisfaction with current livelihoods ....................................................................... 39
Table 41: Fishers’ attitude towards changing or diversifying livelihoods ............................................ 40
Table 42: Average income from main income sources of surveyed households in 2010 .................... 41
Table 43: Number of major income sources of HH .............................................................................. 41

Baseline Survey Volume 2: Baseline Survey Results for Quang Tri Province
5
Table 44: Fishers’ awareness on the availability of supporting institutions/programmes for livelihood
enhancement and diversification ........................................................................................................... 42
Table 45: Fishers’ access of the supporting services for livelihood enhancement and diversification . 42
Table 46: Fishers’ satisfaction with the supporting services for livelihood enhancement and
diversification ....................................................................................................................................... 43
Table 47: Fishers’ perception on the usefulness of the supporting services for livelihood enhancement
and diversification ................................................................................................................................. 43
Table 48: Fishers’ awareness of the availability of financial services .................................................. 45
Table 49: Fishers’ awareness of the procedures/regulations of financial services ............................... 45
Table 50: Fishers’ perception on possibility of access of credit when in need ..................................... 46
Table 51: Fishers’ choice of financial services when in need ............................................................... 46
Table 52: Fishers’ satisfaction with formal and informal financial services ........................................ 46
Table 53: Fishers’ awareness of subsidized credit line ......................................................................... 47
Table 54: Fishers’ perception of the importance of savings ................................................................. 47
Table 55: Fishers’ willingness to save .................................................................................................. 48
Table 56: Fishers saving capacity ......................................................................................................... 48

Baseline Survey Volume 2: Baseline Survey Results for Quang Tri Province
6
List of Acronyms
AgriBank Vietnam Bank for Agriculture and Rural Development
CCRD Centre for Community Research and Development
CPC Commune People’s Committee
DARD Department of Agriculture and Rural Development
DOIT Department of Industry and Trade
DOLISA Department of Labor, Invalids, and Social Affairs
FA Fisheries Association
FM Frequency Modulation
GDP Gross Domestic Product
HH Household
HP Horsepower
MARD Ministry of Agriculture and Rural Development
PPC Provincial People’s Committee
RFLP Regional Fisheries Livelihoods Programme
SDAFFQA Sub-Department of Agro-Forestry-Fishery Quality Assurance
SDECAFIREP Sub-Department of Capture Fisheries and Resources Protection
VBARD Vietnam Bank for Agriculture and Rural Development
VBSP Vietnam Bank for Social Policies
VND Vietnamese Dong
VINAFIS Vietnam Fisheries Society

Baseline Survey Volume 2: Baseline Survey Results for Quang Tri Province
7
Terminologies, Interpretation, and Definitions Target communes Five RFLP target communes in Quang Tri.
Control commune The communes that are not RFLP target communes, but
selected to provide control data in this survey (Vinh Thach
Commune).
Fisher(s) / Fishing HH The consulted / interviewed persons who do fishing, not
including aquaculture or fish processing households.
Female Female respondents in the household survey.
Male Male respondents in the household survey.
Resource managers Staff of SDECAFIREP, District DARD, District Extension
Station, and CPCs who were consulted in this survey.
Inshore fishing Fishing in the sea within 24 nautical miles from the coast.
The fishing is normally carried out within 24 hours.
Formal services/systems Services / systems controlled by the State or that are legally
recognized.
Informal services/systems Community-based or private services / system without
legal status.
Nhom hui One of the Rotating Savings and Credit Associations,
ROSCAs, where a group of individuals (normally 10
people) agree to meet for a defined period of time
(normally 10 months) in order to save and borrow money
together.
Fisheries co-management A partnership arrangement, in which the community of
local resource users (fishers), government, other
stakeholders (boat owners, fish traders, boat builders,
businesspeople, etc.), and external agents (non-
governmental organizations, academic and research
institutions, etc.) share the responsibility and authority for
the management of the fisheries.
Baseline Survey Volume 2: Baseline Survey Results for Quang Tri Province
8
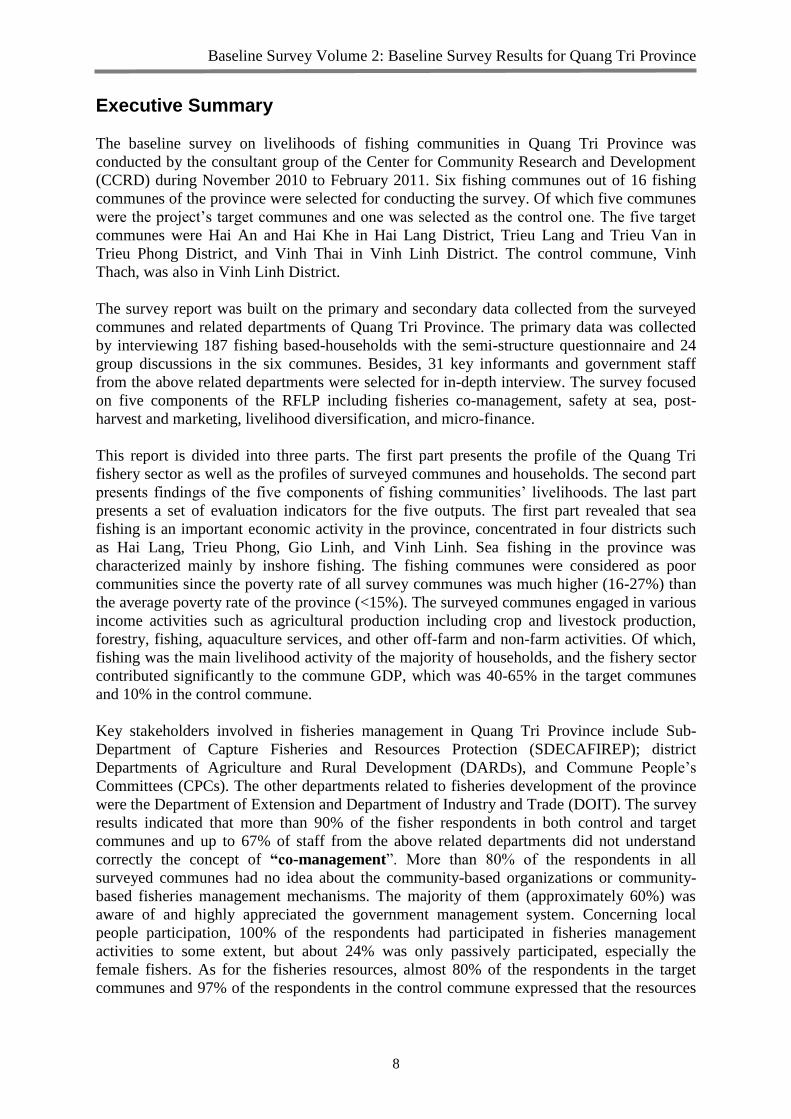
Executive Summary
The baseline survey on livelihoods of fishing communities in Quang Tri Province was
conducted by the consultant group of the Center for Community Research and Development
(CCRD) during November 2010 to February 2011. Six fishing communes out of 16 fishing
communes of the province were selected for conducting the survey. Of which five communes
were the project’s target communes and one was selected as the control one. The five target
communes were Hai An and Hai Khe in Hai Lang District, Trieu Lang and Trieu Van in
Trieu Phong District, and Vinh Thai in Vinh Linh District. The control commune, Vinh
Thach, was also in Vinh Linh District.
The survey report was built on the primary and secondary data collected from the surveyed
communes and related departments of Quang Tri Province. The primary data was collected
by interviewing 187 fishing based-households with the semi-structure questionnaire and 24
group discussions in the six communes. Besides, 31 key informants and government staff
from the above related departments were selected for in-depth interview. The survey focused
on five components of the RFLP including fisheries co-management, safety at sea, post-
harvest and marketing, livelihood diversification, and micro-finance.
This report is divided into three parts. The first part presents the profile of the Quang Tri
fishery sector as well as the profiles of surveyed communes and households. The second part
presents findings of the five components of fishing communities’ livelihoods. The last part
presents a set of evaluation indicators for the five outputs. The first part revealed that sea
fishing is an important economic activity in the province, concentrated in four districts such
as Hai Lang, Trieu Phong, Gio Linh, and Vinh Linh. Sea fishing in the province was
characterized mainly by inshore fishing. The fishing communes were considered as poor
communities since the poverty rate of all survey communes was much higher (16-27%) than
the average poverty rate of the province (<15%). The surveyed communes engaged in various
income activities such as agricultural production including crop and livestock production,
forestry, fishing, aquaculture services, and other off-farm and non-farm activities. Of which,
fishing was the main livelihood activity of the majority of households, and the fishery sector
contributed significantly to the commune GDP, which was 40-65% in the target communes
and 10% in the control commune.
Key stakeholders involved in fisheries management in Quang Tri Province include Sub-
Department of Capture Fisheries and Resources Protection (SDECAFIREP); district
Departments of Agriculture and Rural Development (DARDs), and Commune People’s
Committees (CPCs). The other departments related to fisheries development of the province
were the Department of Extension and Department of Industry and Trade (DOIT). The survey
results indicated that more than 90% of the fisher respondents in both control and target
communes and up to 67% of staff from the above related departments did not understand
correctly the concept of “co-management”. More than 80% of the respondents in all
surveyed communes had no idea about the community-based organizations or community-
based fisheries management mechanisms. The majority of them (approximately 60%) was
aware of and highly appreciated the government management system. Concerning local
people participation, 100% of the respondents had participated in fisheries management
activities to some extent, but about 24% was only passively participated, especially the
female fishers. As for the fisheries resources, almost 80% of the respondents in the target
communes and 97% of the respondents in the control commune expressed that the resources

Baseline Survey Volume 2: Baseline Survey Results for Quang Tri Province
9
were equally distributed among users. They all, however, expressed the decrease in the
fisheries resources in the past five years and continuing degrading in the future.
Regarding safety at sea awareness and information, more than 80% of the respondents in the
target communes and 100% of the respondents in the control one were aware or very aware
of the safety at sea information. It was revealed that there were various information channels
at their communities such as radio, TV, commune loudspeaker/broadcasting system, and cell
phones. More than 66% of the respondents in the target communes and 100% of the
respondents in the control commune highly appreciated these information channels because
of the usefulness and easy access. However, there were still about 34% of the respondents in
the target communes who did not appreciate the current information channels in their
commune.
Although a high percentage of the respondents was aware of safety at sea regulations, limited
number of the respondents actually complied with such regulations. Among them, regulations
on lifebuoy, boat registration, and inspection were commonly followed in all surveyed
communes with more than 74% of the respondents. The other regulations were not commonly
applied. The survey result also showed that, although not many fishers (35%) were trained on
at-sea rescue skills, 100% of the respondents felt confident in avoiding accidents at sea and
appreciated their the community rescuing activities.
In terms of post-harvest and marketing aspects of the fishing communities, fishers
commonly applied manual post-harvest methods for preserving and processing the fishery
products. The fishers in the surveyed communes usually used icing, salting, drying, and
grilling. Among these measures, icing and salting were the most popular measures, and more
than 90% of fishers were self-claimed to be very skillful with the techniques. Fish processing
was mainly for fish sauce or fermented fish. Both post-harvest and processing measures used
in the surveyed communes were almost from the local indigenous knowledge and experience.
Although there have been a few training courses on processing techniques for processing
households, they were not applicable for the communities.
More than 80% of fishing products in the target communes were sold as fresh products, and
less than 20% were processed. In the control commune, processed products occupied about
40%. More than 50% of the fishery products were sold to the middle traders and local
markets. Several products such as swimming crab (ghe, Charybdis and Portunus spp.) and
squid were sold mainly to the middle traders; hence, the price depended on them very much.
Sub-Department of Agro-Forestry-Fisheries Quality Assurance (SDAFFQA) at the provincial
DARD and district DOIT were the ones in charging for controlling the quality of fishery
products. Although there have been several policies to support the development of fish
processing activities in the province, only a limited number of fish processing and trading
households have been actually inspected and certified (only 6 out of 150 households).
Concerning the livelihood diversification and enhancement, the surveyed fishing
communes were engaged in various livelihood activities such as fishing, aquaculture
production, crop production, animal husbandry, hire labor, small business, and fish
processing. However, fishing was the main livelihood activity, but its contribution had been
decreasing over time. Hence, more than 76% of the respondents in the target communes and
around 86% of the respondents in the control commune were unsatisfied with their current
livelihood activities. They would like to change or diversify their livelihood activities.

Baseline Survey Volume 2: Baseline Survey Results for Quang Tri Province
10
Recently, there have been many livelihood supporting programs in these communes such as
supporting credit programs, technical assistance, marketing, and input supply programs.
However, the percentage of households having more than two major income sources
occupied only 25% of the respondents. Although 100% of the respondents were aware of
these programs, less than 40% of the respondents were satisfied with their function.
On microfinance services, there were both formal and informal credit suppliers working in
the surveyed communes. Majority of the respondents preferred formal credit suppliers to
informal ones, especially VBSP. However, only 48% of the respondents in the target
communes and 25% of the respondents in the control commune could access this credit line.
For Vietnam Bank for Agriculture and Rural Development (AgriBank or VBARD), fishing
households were hesitant to access to it because of high interest rate and collateral
requirement. Interestingly, more than 70% of the respondents in both target and control
communes were aware of the importance of saving, especially female fishers. All of them
were willing to save with the average amount of 135,000 dongs/household/month.1
The last section of the report presents a set of indicators for the RFLP, which were proposed
based on the baseline survey results.
1 1 USD = 21,000 VND as of April 2011.

Baseline Survey Volume 2: Baseline Survey Results for Quang Tri Province
11
Figure 1: Map of surveyed sites
Vinh Thai
Vinh
Thach
Trieu
Lang Trieu Van
Hai An
Hai Khe
I. Profile of Surveyed Communes and Households 1. Fishery sector of the province
Quang Tri Province is located in central Vietnam and is 69.3 km long and 75.4 km wide. It is
bordered by Quang Binh Province to the north, Thua Thien Hue Province to the south, Lao
PDR to the west, and the Eastern Sea to the east. The province has about 75 km of coastline,
two river estuaries namely Cua Tung and Cua Viet, and a large fishing ground of 8,400 sq.
km with a variety of valuable seafood such as tiger prawn (Penaeus spp.), cuttlefish, greater
amberjack (Seriola dumerili), and sea-cucumber. In 2010, the catching productivity reached
17,500 tons.
The fishery sector in Quang Tri Province
has two components including fishing
and aquaculture production, of which the
former has been divided into two parts:
marine/sea and inland fisheries.
Geographically, sea fishing is undertaken
in four districts: Hai Lang, Trieu Phong,
Vinh Linh, and Gio Linh. Sea fishing is
considered as one of the key potential
sectors for socio-economic development
in coastal areas. Among coastal
communes, 16 communes have fishing
communities. Among these, six
communes (Table 1) were selected for the
baseline survey. Five communes were
pre-selected as they are the RFLP’s target
communes. The control commune (Vinh
Thach) was selected based in consultation
with Quang Tri SDECAFIREP.2 The
locations of these communes are shown
in Figure 1.
In 2010, there were about 2,459 fishing
vessels in the province, which were
distributed mainly in four coastal districts
including Vinh Linh, Gio Linh, Trieu Phong, and Hai Lang. Of which, 2,039 boats were less
than 20 HP. The number of boats having capacity from 20 HP to 90 HP was 345 while that of
over 90 HP was 75 (Quang Tri SDECAFIREP, 2010). Most of these vessels have been
registered except for 257 boats, which have capacity less than 20 HP and do not have
sufficient legal documents for registering.
2. Characteristic of the surveyed communes
Characteristics of the surveyed communes including proportion of fishing villages, fishing
households, poverty rate, and household categories by industries and GDP structure of the
2 Refer section 2.2. of the Volume 1: Baseline Survey and Methodologies for criteria of selection of the control
commune.

Baseline Survey Volume 2: Baseline Survey Results for Quang Tri Province
12
commune are described in this section. In Hai Lang and Trieu Phong Districts, majority of
villages of the surveyed communes were practicing fishing activities. While in Vinh Linh
District, the proportion of villages of the surveyed communes involved in fishing activities
was very low (Table 1). In Vinh Thai, only 4 out of 7 villages engaged fishing activities and
it was only 1 out of 10 villages in Vinh Thach, the control commune. Poverty rate was still
high in most of the surveyed communes. The lowest poverty was in Vinh Thach Commune
with 16% and highest in Trieu Van Commune with 27% in 2010. It was much higher than the
provincial poverty average of 15%.
Table 1: Number of fishing villages and poverty rate in the surveyed communes in 2010
Commune No of
villages
No of fishing
villages
No of HHs No of
poor HHs3
% of
poor HHs
Hai An 4 4 1,143 190 17.0
Hai Khe 2 2 525 118 22.5
Trieu Van 4 3 696 188 27.0
Trieu Lang 6 6 890 231 26.0
Vinh Thai 7 4 755 132 17.4
Vinh Thach
(control)
10 1 852 137 16.0
(Source: Hai An CPC, 2010; Hai Khe CPC, 2010; Trieu Lang CPC, 2010; Trieu Van CPC,
2010; Vinh Thach CPC, 2010; and Vinh Thai CPC, 2010)
Household classification by livelihood in the surveyed communes shows that, among the
categories, the fishery category occupied the highest proportion ranging from 35% in Trieu
Van Commune to 75% in Hai An Commune (Table 2). In other communes such as Hai Khe,
Trieu Lang, and Vinh Thai, fisheries occupied 60, 40, and 60% respectively. Farming
households also shared the second large proportion in such communes. The highest
proportion of farming household was in Trieu Van Commune with 52% and the lowest was
in Hai An Commune with 14%. The higher percentage of farming households is, the lower
proportion of fishery households is, and vice verse. The households engaging in services and
other earning activities occupied a small proportion in all communes -- not more than 20%
households in most of the surveyed communes engaged in service activities for earning.
3 Poor households were classified based on Vietnamese poverty lines 2006-2010, i.e. the average income per
person in the household was lower than 200,000 VND/month/person in rural area.

Baseline Survey Volume 2: Baseline Survey Results for Quang Tri Province
13
Table 2: Household categories by livelihood type of the surveyed communes in 2010
Commune Farming HHs
(%)
Fishery HH
(%)
Service HHs
(%)
Others
(%)
Hai An 14 75 9 2
Hai Khe 20 60 11 9
Trieu Van 52 35 7 6
Trieu Lang 40 40 10 10
Vinh Thai 17 60 20 3
Vinh Thach
(control)
38 36 6 20
(Source: Hai An CPC, 2010; Hai Khe CPC, 2010; Trieu Lang CPC, 2010; Trieu Van CPC,
2010; Vinh Thach CPC, 2010; and Vinh Thai CPC, 2010)
The Quang Tri coastal area is characterized mainly by the shallow seashore (bai ngang).
Therefore, only inshore fishing was practiced in all surveyed communes. Fresh water
aquaculture production was also found in most of the surveyed communes. However, number
of households engaged in aquaculture occupied a minor proportion as compared to brackish
water aquaculture production (Table 3). Brackish aquaculture, especially shrimp farming was
booming both in number of households and areas of production in Trieu Van, Trieu Lang,
and Vinh Thach Communes during the last three years. In these three communes, the number
of fishing households had been decreasing, and the number of aquaculture households had
been increasing, while processing households remained unchanged with a limited number of
10- 12 households.
Table 3: Types of fisheries -based households in surveyed communes in 2010
Commune Inshore fishing
HHs
Aquaculture
HHs
Fish
processing
HHs
Fisheries
service HHs
Hai An 438 15 23 3
Hai Khe 416 26 14 5
Trieu Van 106 75 12 0
Trieu Lang 350 620 10 0
Vinh Thai 358 14 28 0
Vinh Thach 320 4 2 0
(Source: Hai An CPC, 2010; Hai Khe CPC, 2010; Trieu Lang CPC, 2010; Trieu Van CPC,
2010; Vinh Thach CPC, 2010; and Vinh Thai CPC, 2010)
The surveyed communes were engaged in various income generating activities such as
agricultural production including crop and livestock production, forestry, fishery, services,
and other off-farm and non-farm activities. In surveyed communes of Trieu Phong and Hai
Lang Districts, fishery contributed a largest proportion in the commune GDP, the highest in
Hai Khe Commune with 65% (Table 4). The two communes of Vinh Linh District had the
lowest share of the fishery sector in the commune’s GDP, especially Vinh Thach Commune
with only 10%.
Baseline Survey Volume 2: Baseline Survey Results for Quang Tri Province
14
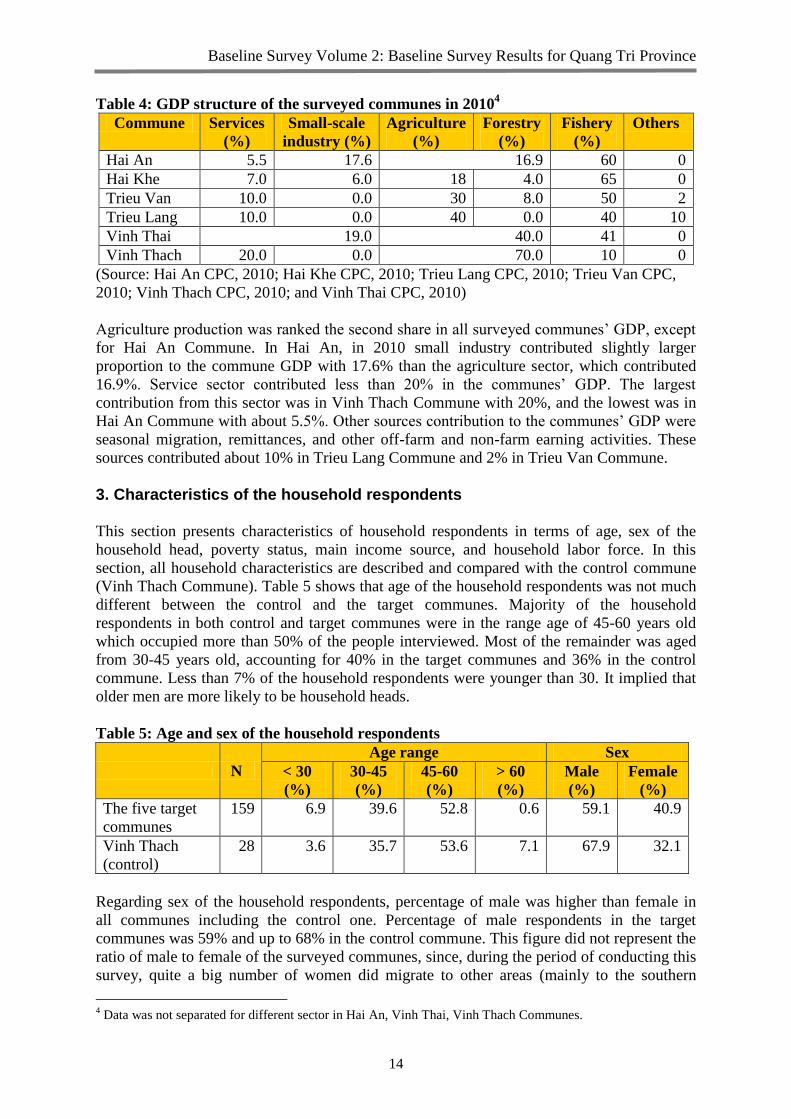
Table 4: GDP structure of the surveyed communes in 20104
Commune Services
(%)
Small-scale
industry (%)
Agriculture
(%)
Forestry
(%)
Fishery
(%)
Others
Hai An 5.5 17.6 16.9 60 0
Hai Khe 7.0 6.0 18 4.0 65 0
Trieu Van 10.0 0.0 30 8.0 50 2
Trieu Lang 10.0 0.0 40 0.0 40 10
Vinh Thai 19.0 40.0 41 0
Vinh Thach 20.0 0.0 70.0 10 0
(Source: Hai An CPC, 2010; Hai Khe CPC, 2010; Trieu Lang CPC, 2010; Trieu Van CPC,
2010; Vinh Thach CPC, 2010; and Vinh Thai CPC, 2010)
Agriculture production was ranked the second share in all surveyed communes’ GDP, except
for Hai An Commune. In Hai An, in 2010 small industry contributed slightly larger
proportion to the commune GDP with 17.6% than the agriculture sector, which contributed
16.9%. Service sector contributed less than 20% in the communes’ GDP. The largest
contribution from this sector was in Vinh Thach Commune with 20%, and the lowest was in
Hai An Commune with about 5.5%. Other sources contribution to the communes’ GDP were
seasonal migration, remittances, and other off-farm and non-farm earning activities. These
sources contributed about 10% in Trieu Lang Commune and 2% in Trieu Van Commune.
3. Characteristics of the household respondents
This section presents characteristics of household respondents in terms of age, sex of the
household head, poverty status, main income source, and household labor force. In this
section, all household characteristics are described and compared with the control commune
(Vinh Thach Commune). Table 5 shows that age of the household respondents was not much
different between the control and the target communes. Majority of the household
respondents in both control and target communes were in the range age of 45-60 years old
which occupied more than 50% of the people interviewed. Most of the remainder was aged
from 30-45 years old, accounting for 40% in the target communes and 36% in the control
commune. Less than 7% of the household respondents were younger than 30. It implied that
older men are more likely to be household heads.
Table 5: Age and sex of the household respondents
N
Age range Sex
< 30
(%)
30-45
(%)
45-60
(%)
> 60
(%)
Male
(%)
Female
(%)
The five target
communes
159 6.9 39.6 52.8 0.6 59.1 40.9
Vinh Thach
(control)
28 3.6 35.7 53.6 7.1 67.9 32.1
Regarding sex of the household respondents, percentage of male was higher than female in
all communes including the control one. Percentage of male respondents in the target
communes was 59% and up to 68% in the control commune. This figure did not represent the
ratio of male to female of the surveyed communes, since, during the period of conducting this
survey, quite a big number of women did migrate to other areas (mainly to the southern
4 Data was not separated for different sector in Hai An, Vinh Thai, Vinh Thach Communes.

Baseline Survey Volume 2: Baseline Survey Results for Quang Tri Province
15
provinces) for earning. In addition, normally more men attended meetings than women,
especially meetings on fishing activities because fishing is an activity for men.
Poverty rate of the surveyed communes is compatible with the surveyed communes’
characteristic which was mentioned earlier that percentage of the non-poor respondents in the
control commune was much higher than the target communes. The percentage of the non-
poor respondents in the target communes was 61.3%, and it was up to 89.3% in the control
commune. Among households in the target communes 91% were classified as fishing
households and 0.9% were aquaculture ones. Among fishing households, 6.7% were involved
in processing activities. While in Vinh Thach Commune, almost 100% of the households
depend mainly on fishing activities for their income, and there was no fish processing
activities. In fact, all processing households in the surveyed communes were of small-scale,
and most of processed products were used for household consumption only.
Table 6: Classification of the surveyed households by poverty and fishery activity
by poverty (100%) by fishery activity (100%) Non-poor Observed
poor5
Certified
poor6
Fishing
HHs
Processing
HHs
Aquaculture
HHs
The five target
communes 61.6 15.1 23.3 91.0 6.7 0.9
Vinh Thach
(control) 89.3 7.1 3.6 100.0 0.0 0.0
(Source: Hai An CPC, 2010; Hai Khe CPC, 2010; Trieu Lang CPC, 2010; Trieu Van CPC,
2010; Vinh Thach CPC, 2010; and Vinh Thai CPC, 2010)
Manual labour is an important income source for fishing households. In general, the family
size of all surveyed communes was quite large with more than five people in the control
commune and almost six people in the target communes. However, the analysis shows high
variation and no significant difference between the target and the control communes. Labor
force per household as well as number of fisheries laborer per household were not difference
between the target and control communes with 1 out of 3 laborer per household was fishery
laborer (Table 7).
Table 7: Classification of the surveyed household members by labor type
N No of people per
HH
No of laborer
per HH
No of fisheries
laborer per HH
The five target
communes
159 6 3 1
Vinh Thach
(control)
28 5 3 1
5 Those who not officially certified as the poor by the Government but they self-reported as poor and the
enumerators assessed their poverty based on their housing and property in their home. 6 Those who are certified as the poor by the Government (according to Vietnamese 2006-2010 poverty line)
Baseline Survey Volume 2: Baseline Survey Results for Quang Tri Province
16
II. Baseline Analysis for Five Outputs 1. Fisheries Co-management
1.1 Existing policies and institutions that have influence on co-management and areas for strengthening them
At the central government, a series of policies regarding to fisheries management have been
promulgated. These documents provide concrete guidelines as well as encourage the local
areas to establish and implement fisheries co-management based on specific characteristics of
each locality. The Fishery Law on 26 November 2001 states that the government has policy
to protect and develop aquatic resources and create the conditions for organizations and
individuals to exploit fishery products sufficiently as well as protect the living environment
of fishery species. Recently, the amendment to the Fishery Law has mentioned the
empowerment of fisheries management to the local associations such as inland or coastal
water surface allocation to fishers for management purposes. Besides, the Ministry of
Agriculture and Rural Development (MARD) has proposed to the government the adjustment
related to the allocation of territorial water to provinces and delegation of management
responsibilities to local governments. At the provincial level, until today, there are no policies
related to fisheries co-management. However, in some target communes (e.g., Hai An and
Hai Khe), the villagers have been assisted to establish self-managed groups, which are
responsible for monitoring and protecting fishing gears and boats of villagers.
1.2 Key governmental fisheries management stakeholders
The stakeholders involved in fisheries management including provincial Sub-Department of
Capture Fisheries and Resources Protection (SDECAFIREP), District Departments of
Agriculture and Rural Development (DARDs), and Commune People’s Committees (CPCs).
The first and third stakeholders directly manage fishery activities while district DARDs play
an intermediary role. The baseline survey indicated the following:
Provincial SDECAFIREP is in charge of managing fisheries resources for the whole
province.
District DARDs are acting as intermediary advisors for CPCs in implementing resource
management.
CPCs are in charge of management of fisheries activities in communes. In communes,
the vice chairpersons are responsible for economic affairs including dealing with issues
related to fisheries. In addition, the police at the commune level are assigned to
cooperate with self-management groups to conduct patrolling and to deal with people
caught using banned fishing gears.
1.3 The community-based fisheries management
Beside the government management systems, which belong to the DARD at all levels, there
were no formal community-based management systems in the fisheries sector in all surveyed
communes. In all communes except for Hai An and Hai Khe, fishery activities were self-
managed by the fisher communities with their own regulations (i.e., informal management).
Based on interests and relationships, fishers were grouped into cooperatives for fishing,
processing and selling the products. The group leader was responsible for management of
group members to obey the community regulations.

Baseline Survey Volume 2: Baseline Survey Results for Quang Tri Province
17
However, in 2010, the provincial DARD together with the VINAFIS planned to establish
fishing and processing associations in these communes including aquaculture production.
Following such discussion, each surveyed commune formed a group with 8-11 members
depending on the commune population and number of villages to improve people’s
awareness in fisheries management and mobilize people to join the FA later on. These groups
will be the leaders or core member of the commune cooperative and fisheries associations
(FAs) in the future. Within the cooperative, commune FAs will be established and considered
as community-based fisheries management unit. In Hai An and Hai Khe Communes, under
the decision of provincial Border Guard, each commune located on the fringe of coastal area
has been mobilized to established a self-management group. This group is in charge of
cooperating with Border Guard in conducting patrolling around coastal areas.
1.4 Perception of fishers on the fisheries management and conflict resolution systems
Since people were not aware of the existence of any community-based fisheries management
system, up to 71.5% of the respondents in the target communes and 95.9% of the respondents
in the control commune had no ideas about the effectiveness of this management mechanism.
Male fishers were more aware of the existing self-help fisher groups and the government
policies on establishing cooperatives and FAs than female fishers.7 Therefore, more male
fishers appreciated the effectiveness of such community-based management systems than
female fishers.
Table 8: Effectiveness of community-based fisheries management systems
N Very effective
(%)
Effective
(%)
Not effective
(%)
No idea
(%)
Target communes 159 9.8 18.7 0 71.5
- Male 95 12.3 23.4 0 64.3
- Female 64 2.5 12.6 0 84.9
Control commune 28 0.9 3.2 0 95.9
- Male 19 1.4 3.5 0 95.1
- Female 9 2.3 3.6 0 94.1
Concerning management activities of DARD and other stakeholders in fishery sectors, almost
90% of the respondents in both target and control communes expressed the effectiveness of
this management system (Table 9). Male fishers appreciated the government management
system more than female fishers. In the target communes, 12.9% of the female respondents
perceived that the government management system is ineffective, and up to 49.2% of the
female respondents in the control commune had the same opinion. In fact, in both target and
control communes, fishery activities are controlled and managed by CPC and the Border
Guard. For this reason, many of the respondents were aware of this system.
7 Female fishers here mean female respondents or women respondents who belong to fishing households.
Baseline Survey Volume 2: Baseline Survey Results for Quang Tri Province
18
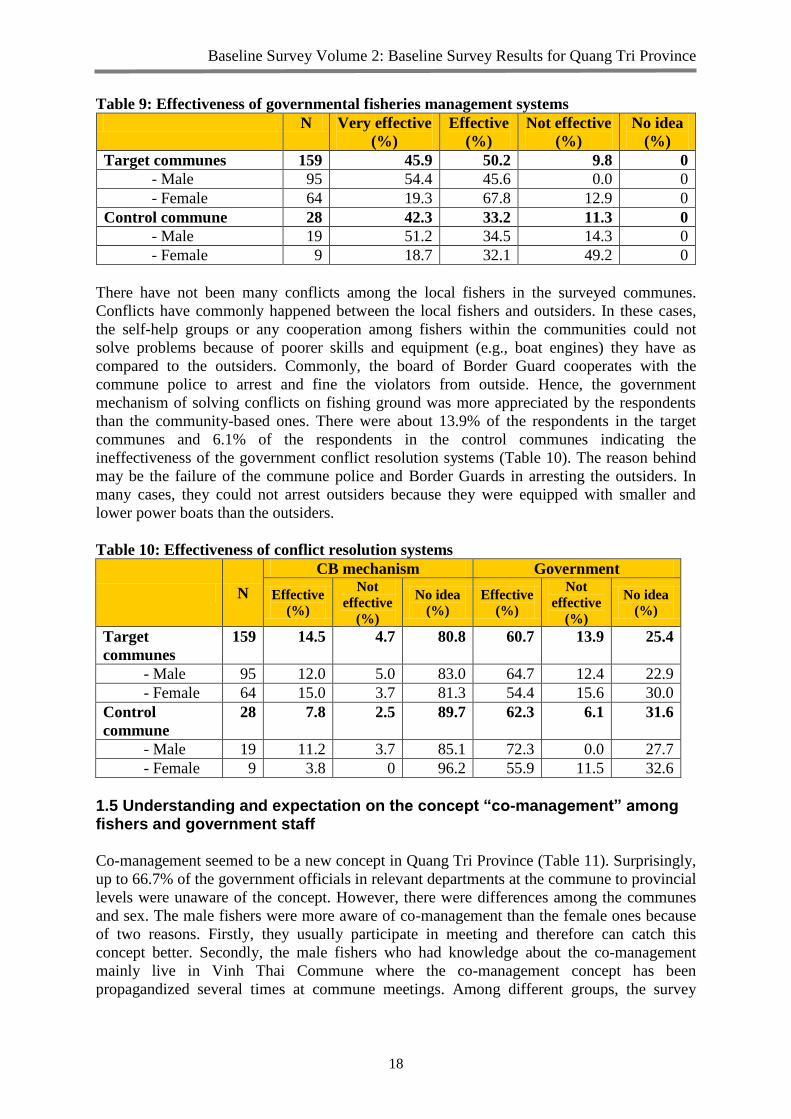
Table 9: Effectiveness of governmental fisheries management systems
N Very effective
(%)
Effective
(%)
Not effective
(%)
No idea
(%)
Target communes 159 45.9 50.2 9.8 0
- Male 95 54.4 45.6 0.0 0
- Female 64 19.3 67.8 12.9 0
Control commune 28 42.3 33.2 11.3 0
- Male 19 51.2 34.5 14.3 0
- Female 9 18.7 32.1 49.2 0
There have not been many conflicts among the local fishers in the surveyed communes.
Conflicts have commonly happened between the local fishers and outsiders. In these cases,
the self-help groups or any cooperation among fishers within the communities could not
solve problems because of poorer skills and equipment (e.g., boat engines) they have as
compared to the outsiders. Commonly, the board of Border Guard cooperates with the
commune police to arrest and fine the violators from outside. Hence, the government
mechanism of solving conflicts on fishing ground was more appreciated by the respondents
than the community-based ones. There were about 13.9% of the respondents in the target
communes and 6.1% of the respondents in the control communes indicating the
ineffectiveness of the government conflict resolution systems (Table 10). The reason behind
may be the failure of the commune police and Border Guards in arresting the outsiders. In
many cases, they could not arrest outsiders because they were equipped with smaller and
lower power boats than the outsiders.
Table 10: Effectiveness of conflict resolution systems
N
CB mechanism Government
Effective
(%)
Not
effective
(%)
No idea
(%)
Effective
(%)
Not
effective
(%)
No idea
(%)
Target
communes
159 14.5 4.7 80.8 60.7 13.9 25.4
- Male 95 12.0 5.0 83.0 64.7 12.4 22.9
- Female 64 15.0 3.7 81.3 54.4 15.6 30.0
Control
commune
28 7.8 2.5 89.7 62.3 6.1 31.6
- Male 19 11.2 3.7 85.1 72.3 0.0 27.7
- Female 9 3.8 0 96.2 55.9 11.5 32.6
1.5 Understanding and expectation on the concept “co-management” among fishers and government staff
Co-management seemed to be a new concept in Quang Tri Province (Table 11). Surprisingly,
up to 66.7% of the government officials in relevant departments at the commune to provincial
levels were unaware of the concept. However, there were differences among the communes
and sex. The male fishers were more aware of co-management than the female ones because
of two reasons. Firstly, they usually participate in meeting and therefore can catch this
concept better. Secondly, the male fishers who had knowledge about the co-management
mainly live in Vinh Thai Commune where the co-management concept has been
propagandized several times at commune meetings. Among different groups, the survey

Baseline Survey Volume 2: Baseline Survey Results for Quang Tri Province
19
revealed that inshore fishing households were more awareness of co-management than other
groups.
Both government staffs and local people who were aware of co-management indicated that
co-management was a management system that all related parties or stakeholders play similar
roles in management. Several others expressed that co-management referred to the
participation and role of local people in management of the resources.
Table 11: Respondents’ awareness of fisheries “co-management”
Target group N Very aware
(%)
Aware
(%)
Not aware
(%)
Target communes 159 1.3 6.9 91.8
- Male 94 2.1 11.7 86.2
- Female 65 0 0 100
Fishing HHs 156 2.5 20 77.5
Aquaculture HHs 3 0 33.3 66.6
Government staff 12 16.7 16.7 66.7
Control commune 28 0 7.1 92.9
- Male 19 0 5.3 94.7
- Female 9 0 11.1 88.9
Regarding the perception of the respondents about the usefulness of the co-management
mechanism, the result seemed to be consistent with the respondents’ awareness on this
management mechanism. It means that the people, who are aware of co-management,
appreciate the usefulness of this management mechanism more than the others. More than
90% of the respondents who were not aware of co-management did not known whether this
management mechanism useful or not. About 8.2% of the respondents in the target
communes and 5.1% in the control commune recognized the usefulness of co-management,
especially female fishers (Table 12).
Table 12: Perception on overall usefulness of fisheries co-management in fishery
resources management and livelihood improvement
Target group N Very useful
(%)
Useful
(%)
Not useful
(%)
No idea
(%)
Target communes 159 1.3 6.9 0 91.8
- Male 94 2.1 11.7 0 86.2
- Female 65 0.0 0.0 0 100.0
Government staff 12 16.7 16.7 0 66.7
Control commune 28 0.0 5.1 0 94.9
- Male 19 0.0 5.5 0 94.5
- Female 9 0.0 0.0 0 100.0

Baseline Survey Volume 2: Baseline Survey Results for Quang Tri Province
20
1.6 Participation in fisheries management
In comparison to the control commune, the respondents in the target communes were more
actively participated in fisheries management. More than 76% of fishers in the target
communes expressed that they had participated actively in fisheries management activities,
while in the control commune, this figure was only 21%. The reasons may be, firstly, the
target communes located on the fringe of sea and depended completely on aquatic resource
for socio-economic activities, and they have therefore higher concern on their resource status.
In order to ensure the livelihoods of local people, many programs had been conducted at the
localities including the program of aquatic protection, the propaganda program on fishing
gears, and program on building “3-luon”8 net model or drag-net model. According to the
government staff, most of these programs attracted the involvement of inhabitants very well
because it was launched based on their needs. The second reason why the local people at
target commune participated more actively in fisheries management would be that it was their
main source of income. More than 60% of household income of target communes comes
from aquatic exploitation. For that reason, they have participated in fisheries management as
the mean of ensuring their livelihoods.
Table 13: Stakeholder participation in fisheries management
Target group N Actively participate9
(%)
Passively participate10
(%)
Target communes 159 76.1 23.9
- Male 94 86.2 13.8
- Female 65 61.5 38.5
Government staff 12 64.7 35.3
Control commune 28 21.4 78.6
- Male 19 21.0 79.0
- Female 9 22.2 77.8
1.7 Fishers and resource managers’ perception on state of the fisheries resources and benefits from fisheries
Generally, 94.3% and 92.8% of the respondents at target and control communes respectively
indicated the degradation of fisheries resources in the last five years, especially the sharp
reduction of shrimp and squid, caused by different reasons including over-exploitation of
boats from other provinces. According to the interviewees, annually, more than 10 boats with
strong engines come into these localities and undertake illegal fishing. They also steal local
people’s fishing gears while the local government is unable to do anything about it. The rest
of the respondents (3.1%) mentioned the increase of fisheries resources due to the new kind
of fishing gears that they have adopted and uncertainty of locating fish stocks.
Degradation of fisheries resources was also evidenced by the loss of certain fishery species
such as the disappearance of cuttlefish (muc nang, Sepia spp.), sea crab (Charybdis and
Portunus spp.), and Bombay duck fish (ca khoai, Harpadon nehereus). This problem was
mentioned by the majority of the respondents at Hai An and Hai Khe Communes. A male
8 3-luon is the height of fishing net, about 90 cm
9 Actively participate means the participants share their views, opinions in the meetings / fisheries management
activities and / or voluntarily make some kind of contribution to the meetings, fisheries management activities 10
Passively participate means the participants are not willing to make any contribution; they are invited / forced
to participate,

Baseline Survey Volume 2: Baseline Survey Results for Quang Tri Province
21
fisher at Hai Khe Commune stated that: “five years ago, many squid species were available in
this area and many households conducted and developed fishery product processing. Our
dried squid product was well known at that time. However, in recent years, due to the
vanishing of these fishery species, fish processing has gone down. Some of households had to
change their income generation activities to secure their livelihoods. Instruments for fish
processing such as drying-room and drying-fan were rusted because they have not been used
for a long time.”
Table 14: Fishers and resource managers’ perception on state of the fisheries resources
in the last five years
Target group N Increase
(%)
Decrease
(%)
No change
(%)
No idea
(%)
Target communes 159 3.1 94.3 2.5 0.0
- Male 94 1.1 95.7 3.2 0.0
- Female 65 6.2 84.6 9.2 0.0
Resources managers 12 25.8 74.2 0.0 0.0
Control commune 28 0.0 92.8 2.6 3.6
- Male 19 0.0 84.2 15.8 0
- Female 9 0.0 88.9 0.0 11.1
Regarding to the prediction on fishery resource status in the next five years, 78.6% of the
interviewees said that the resource would certainly be decreased while there were 5% of the
respondents expressed that the fishery resources would be increased because of the adoption
of new fishing gears such as pomfret drag-net and squid traps. Many training courses and
models related to fishing activities have been provided to the fishing communities aiming at
increasing fish catch for the coastal inhabitants. Initially, these models themselves have
supported the fishers some advantages in exploiting fishery resource. However, because of
the limitation of budget, such models have not been expanded yet. That may be the reason
why about 5% of the respondents believed in fishery resource would be increasing.
Almost 95% of the resource managers including staffs of SDECAFIREP and DARDs as well
as vice-chairpersons of CPCs predicted the reduction in fishery resources in the next five
years. Reasons include the development of industrial sector in Quang Tri leading to water
pollution and intensification of fishing. These concerns contribute to their perception on the
availability of fishery resources.
Baseline Survey Volume 2: Baseline Survey Results for Quang Tri Province
22
Table 15: Fishers and resource managers’ perception on state of the fisheries resources
in the next five years
Target group N Increase
(%)
Decrease
(%)
No change
(%)
No idea
(%)
Target communes 159 5.0 78.6 3.1 13.2
- Male 94 5.3 86.2 2.1 6.4
- Female 65 4.6 67.7 4.6 23.1
Resources managers 12 5 95 0 0
Control commune 28
Fishers 28 0 96.5 0 3.5
- Male 19 0 100 0 0
- Female 9 0 88.9 0 11.1
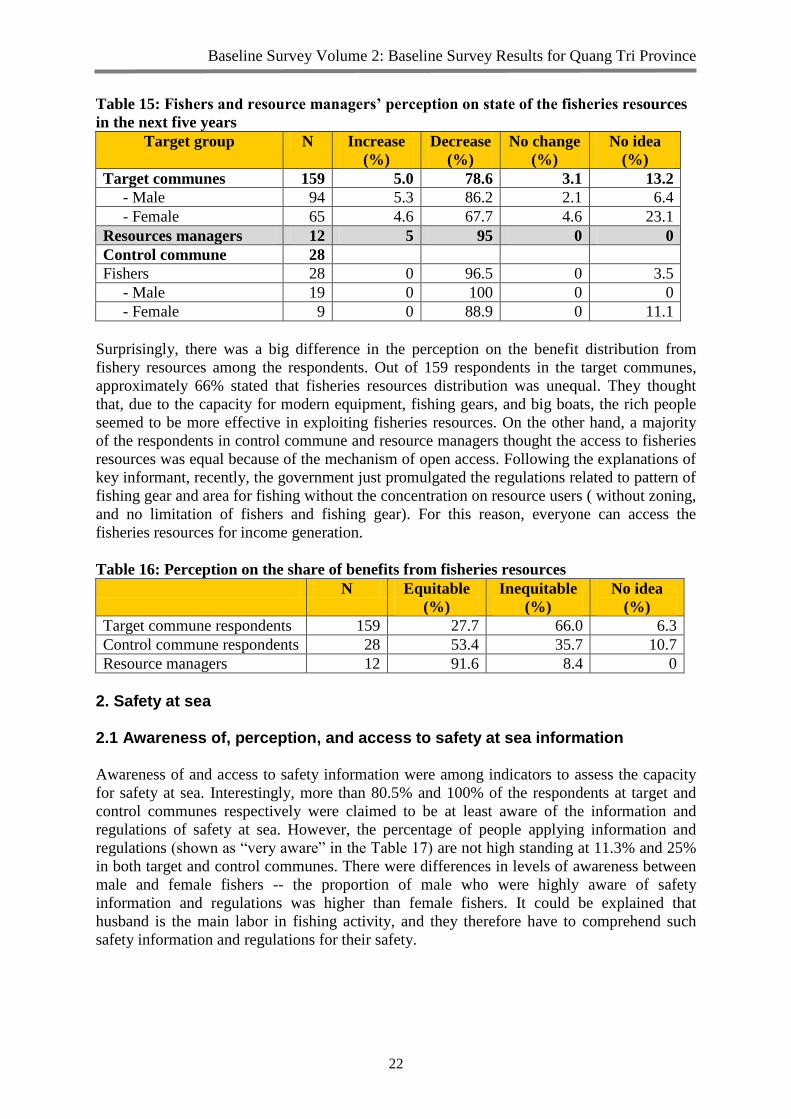
Surprisingly, there was a big difference in the perception on the benefit distribution from
fishery resources among the respondents. Out of 159 respondents in the target communes,
approximately 66% stated that fisheries resources distribution was unequal. They thought
that, due to the capacity for modern equipment, fishing gears, and big boats, the rich people
seemed to be more effective in exploiting fisheries resources. On the other hand, a majority
of the respondents in control commune and resource managers thought the access to fisheries
resources was equal because of the mechanism of open access. Following the explanations of
key informant, recently, the government just promulgated the regulations related to pattern of
fishing gear and area for fishing without the concentration on resource users ( without zoning,
and no limitation of fishers and fishing gear). For this reason, everyone can access the
fisheries resources for income generation.
Table 16: Perception on the share of benefits from fisheries resources
N Equitable
(%)
Inequitable
(%)
No idea
(%)
Target commune respondents 159 27.7 66.0 6.3
Control commune respondents 28 53.4 35.7 10.7
Resource managers 12 91.6 8.4 0
2. Safety at sea 2.1 Awareness of, perception, and access to safety at sea information
Awareness of and access to safety information were among indicators to assess the capacity
for safety at sea. Interestingly, more than 80.5% and 100% of the respondents at target and
control communes respectively were claimed to be at least aware of the information and
regulations of safety at sea. However, the percentage of people applying information and
regulations (shown as “very aware” in the Table 17) are not high standing at 11.3% and 25%
in both target and control communes. There were differences in levels of awareness between
male and female fishers -- the proportion of male who were highly aware of safety
information and regulations was higher than female fishers. It could be explained that
husband is the main labor in fishing activity, and they therefore have to comprehend such
safety information and regulations for their safety.

Baseline Survey Volume 2: Baseline Survey Results for Quang Tri Province
23
Table 17: Stakeholder awareness on safety at sea information and regulations
Target group N Very aware
(%)
Aware (%) Not aware
(%)
Target communes 159 11.3 69.2 19.5
- Male 94 16.0 67.0 17.0
- Female 65 4.6 72.3 23.1
Government staff 12 75.0 25.0 0.0
Control commune 28 25.0 75.0 0.0
- Male 19 15.8 84.2 0.0
- Female 9 44.4 55.6 0.0
On the capacity to access to sea information and regulations, most of the respondents
expressed that they received safe at sea information in their communes. In Quang Tri
Province, the government offices from provincial to commune levels have the annual plans
for disaster and accident prevention at sea as well as propagandize them widely to the whole
community through village and commune loudspeakers or village meetings. For this reason,
more than 60% of the interviewees mentioned that the access to such information was easily.
However, about 26% of the respondents, especially male fishers in the target communes
perceived that it is difficult for them to access the safety at sea information.
Table 18: Stakeholder perception on access to safety at sea information
Target group N Easy
(%)
Difficult
(%)
No idea
(%)
Target communes 159 66.0 25.8 8.2
- Male 94 68.1 28.7 3.2
- Female 65 63.1 21.5 15.4
Government staff 12 100.0 0.0 0.0
Control commune 28 100.0 0.0 0.0
- Male 19 100.0 0.0 0.0
- Female 9 100.0 0.0 0.0
In the surveyed communes, there were six main communication channels including radio,
coastal radio station, coastal border post communication systems, television, commune
broadcasting systems, and personal communication device (mobile phone) (Table 19).
Among these, radio, television, and mobile phone were three major communication means
that the respondents highly appreciated for their safety. People were not familiar with the
coastal border post communication systems and commune broadcasting systems, therefore,
most of the respondents could not express their satisfaction with such channels.

Baseline Survey Volume 2: Baseline Survey Results for Quang Tri Province
24
Table 19: Fishers’ satisfaction with safety at sea channels (N = 187)
Channels Satisfied
(%)
Not satisfied
(%)
No idea
(%)
Radio 93.1 3.7 3.2
Coastal radio station 26.2 7.0 66.8
Coastal border post communication systems 21.9 16.6 61.5
TV 91.4 3.8 4.8
Commune broadcasting systems 47.6 32.6 19.8
Personal communication (mobile phone) 83.4 9.1 7.5
According to the government staff, all of means of media were still in good condition. Each
village had been equipped with FM system and loud speakers in order to broadcast the
information related to safety at sea for the communities on time. For this reason, almost
100% of interviewed staff felt satisfied with existing information channels.
Table 20: Government staff satisfaction with safety at sea channels
Channels N Satisfied
(%)
Not satisfied
(%)
No idea
(%)
Radio 6 100 0 0
Coastal radio station 8 100 0 0
TV 8 87.5 12.5 0
Commune broadcasting systems 8 100 0 0
Personal communication (mobile) 12 100 0 0
Due to the livelihood dependence of coastal people, all of information related to safety at sea
has been considered important to local people. For this reason, nearly 100% of the
respondents in both target and control communes recognized the usefulness of this kind of
information.
Table 21: Fishers’ assessment of usefulness of safety at sea information
N Useful
(%)
Not useful
(%)
No idea
(%)
Target communes 159 98.1 0 1.9
Control commune 28 100 0 0
2.2 Compliance with safety at sea regulations
The regulations on the safety at sea comprises of the articles related to safety equipment for
human and boats. The regulations require three main items including life-vest, lifebuoy, and
communication devices. The survey revealed that 100% of the respondents at target and
control communes understood the requirement of using life-vest and communication devices
when go fishing (Figure 2). As for the life-buoy, most of local people at target and control
communes are inshore fishers who normally use small-power boats. These boats go and back
in a day, and they therefore have not paid much attention on the lifebuoy for their safe at sea.

Baseline Survey Volume 2: Baseline Survey Results for Quang Tri Province
25
Figure 2: Fishers’ awareness on basic safety items/equipment during fishing at sea
Regulations on safety at sea comprise of many articles that ensure the safety of fishers.
However, the level of compliance with safety at sea measures varied among the items as well
as between the target and control communes. Life vests have been applied by 73.5% of the
respondents at the target communes whereas this percentage just stood at 39.3% at the control
commune. Due to the low power of fishing boats, most of the interviewees at both target and
control communes indicated non-application of regulations on preventing and fighting fire. In
short, in spite of the existing awareness of regulation on safety at sea, the percentage of
fishers applying fire prevention and fighting regulations was not high.
Table 22: Fishers’ compliance with safety at sea regulations
Surveyed communes Applied
(%)
Not applied
(%)
Not required
(%)
Target communes (N=159)
Regulation on life vest 73.5 25.2 1.3
Regulation on lifebuoy 39.0 52.8 8.2
Regulation on communication
instrument 15.7 75.5 8.8
Regulation on preventing and fighting
fire 1.9 88.0 10.1
Boat registration 88.0 6.3 5.7
Operational certificate 79.2 16.4 4.4
Control commune (N=28)
Regulation on life vest 39.3 57.1 3.6
Regulation on lifebuoy 21.5 71.4 7.1
Regulation on communication
instrument 32.1 64.3 3.6
Regulation on preventing and fighting
fire 3.5 92.9 3.6
Boat registration 89.3 3.6 7.1
Operational certificate 67.9 25.0 7.1

Baseline Survey Volume 2: Baseline Survey Results for Quang Tri Province
26
According to the statistical data from the SDECAFIREP, there were totally 2,459 fishing
boats in coastal areas of Quang Tri Province. Among these, 90% of fishing boats are
registered; the rest boats were mainly small power with less than 20 HP. Regarding the
inspection, 100% of boats with more than 20 HP (420 boats) have been inspected. It means
that 100% of fishers have been following the provincial regulations on fishing boat
management.
Table 23: Boat registration and inspection in Quang Tri Province
No Boat by capacity No of boat registered No of boat
inspected in 2010
1 < 20 HP 1,782 0
2 20-<50 HP 297 297
3 50-<90 HP 48 48
4 > 90 HP 75 75
Total 2,202 420
In the surveyed communes, 1,034 fishing boats out of the total 1,149 boats (90%) were
registered in 2010. The remaining 115 unregistered fishing boats had a capacity less than 20
HP and did not have sufficient legal documents for registering.
2.3 Fishing accidents and effectiveness of rescue systems
Fishing accidents and rescue systems are structured from the central government to the
commune level. Basically, the central government controls rescue systems through decisions
and directives related to regulations on preventing fishing accidents such as Directive No
22/2006/CT-TTg on enhancing the activities for securing the fishing boat, Decree No
22/2010/ND-CP on managing fishing activities at sea, and Decision No 1041/QD-TTg on
approving the project on ensuring informational system at sea. According to Decision No
137/2007/QĐ-TTg on 21 August 2001, rescue system involves the State to the commune
level, involving many stakeholders at different levels.
At province level, the system of rescue at sea has been regulated by two main policies related
to fishing activity management and natural disaster mitigation. Quang Tri Provincial People’s
Committee (PPC) promulgated Directive No 07/2009/CT-UBND on 29 June 2009 to enhance
boat and fishing management involving many stakeholders. Following this directive, district
and commune authorities cooperate with the SDECAFIREP to conduct training and
propagandize the regulations on safety at sea including registration, inspection, and fishing
grounds locations to fishers.
Besides, local governments supply concrete guidance on establishing fishery groups or
squads to assist mutually in fishing and responding to the accidents and problems at sea.
DARD has been responsible for supplying concrete guidance through SDECAFIREP in
cooperation with local authorities and other stakeholders to understand the quantity, quality,
and type of boats and fishing activities in order to orient the fishery sector development
sustainably and effectively. Moreover, DARD has delegated responsibility to SDECAFIREP
to patrol, prevent, and tackle illegal fishing activities as well as to improve informational
system on natural disasters to fishers. Directive No 07 also regulates the mission of
guaranteed border command to cooperate with DARD and other appropriate authorities to
control and monitor fishing boats at sea. Particularly, the coastal border police has to work
Baseline Survey Volume 2: Baseline Survey Results for Quang Tri Province
27
with SDECAFIREP, waterway traffic police, and local governments to control closely the
inspection and registration of fishing boats. The border guaranteed command is willing to
arrange their force to rescue fishing boats when disaster or accidents happens. The rest of
stakeholders in relation to fishing activities management are police and Department of
Information and Communication, being responsible for cooperating with DARD to ensure the
safety for fishers and conducting the propagandizes to fishers about weather forecast as well
as information related to floods and storms.
On the assignment related to natural disaster damage prevention and rescuing, Quang Tri
PPC proposed Directive No 08/CT-UBND on 24 June 2010 to detail out the central
government Directive No 808/CT-TTg on reduction of damage due to floods and storms.
Directive No 08 regulated that the commander of the flood prevention and rescuing at the
provincial level consolidates the board of flood prevention and rescuing at localities. The
commander also prepares a plan to cope with natural disaster annually and to improve the
information system from the provincial to local levels to report the happening of floods or
storms in time. The coastal district and commune authorities project and plan the boat
registration and provide forecast weather information to fishers. Particularly, local
governments have to set up a detail plan to cope with most unfavorable situation in order to
minimize the disaster damage. Directive No 08 also prescribes the responsibilities of
provincial border command to manage the fishing boats such as registration, itinerary of boat,
and mooring in storm shelter areas.
Baseline Survey Volume 2: Baseline Survey Results for Quang Tri Province
28
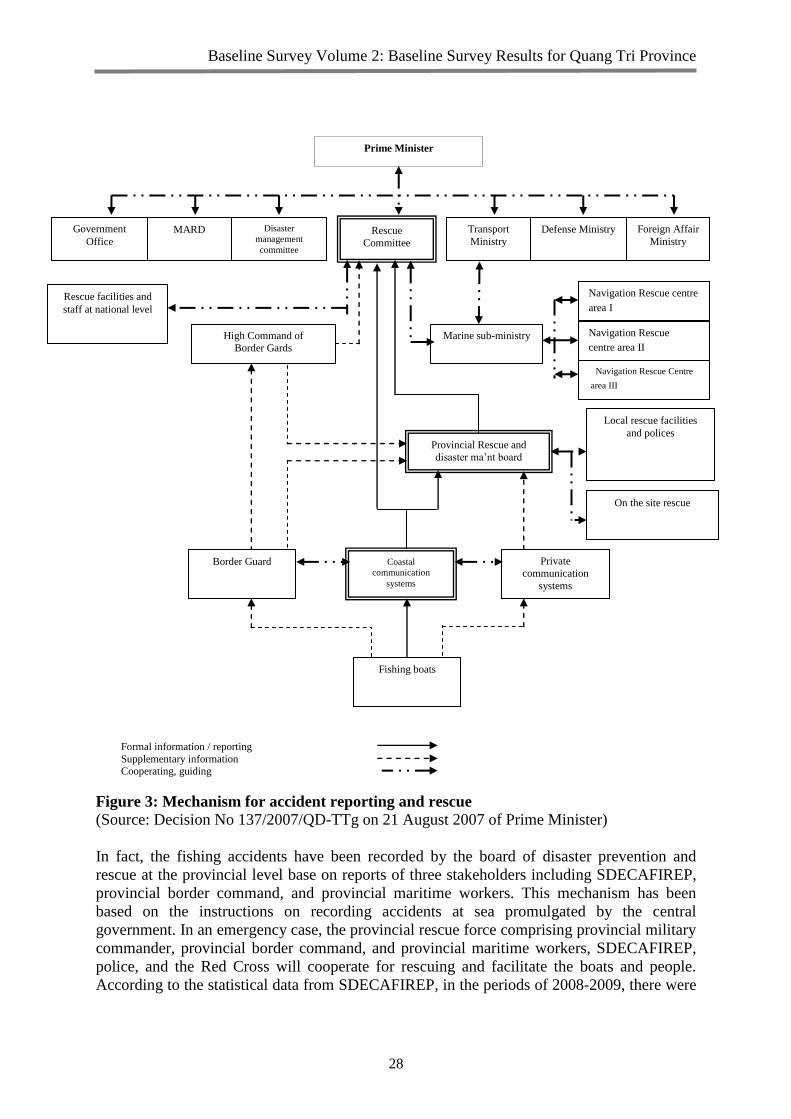
Figure 3: Mechanism for accident reporting and rescue
(Source: Decision No 137/2007/QD-TTg on 21 August 2007 of Prime Minister)
In fact, the fishing accidents have been recorded by the board of disaster prevention and
rescue at the provincial level base on reports of three stakeholders including SDECAFIREP,
provincial border command, and provincial maritime workers. This mechanism has been
based on the instructions on recording accidents at sea promulgated by the central
government. In an emergency case, the provincial rescue force comprising provincial military
commander, provincial border command, and provincial maritime workers, SDECAFIREP,
police, and the Red Cross will cooperate for rescuing and facilitate the boats and people.
According to the statistical data from SDECAFIREP, in the periods of 2008-2009, there were
Rescue
Committee
Disaster
management
committee
Coastal
communication
systems
Fishing boats
Private
communication
systems
Navigation Rescue centre
area I ICentre - Area
I Centre - Area I
MARD Defense Ministry Foreign Affair
Ministry
Transport
Ministry
Border Guard
Formal information / reporting
Supplementary information Cooperating, guiding
Provincial Rescue and
disaster ma’nt board
Prime Minister
Marine sub-ministry
Government
Office
Rescue facilities and
staff at national level
Local rescue facilities
and polices
On the site rescue
Navigation Rescue
centre area IItre - Area
II igation Rescue Centre -
Area II
Navigation Rescue Centre
area III Rescue Centre
- Area III - Area III
High Command of
Border Gards
Baseline Survey Volume 2: Baseline Survey Results for Quang Tri Province
29
16 accidents happened on the Quang Tri territorial water of which one accident was caused
by shipwreck while the rest were caused by disaster.
In the target communes, in recent years, there were about 27 accidents happened. These
accidents were almost due to the unpredictable weather conditions, especially typhoon. As a
result, about 15 boats were totally damaged with one person died. There were six cases that
fishers lost all their fishing equipments and boats. There were no accidents at sea was
recorded in the control commune (Table 24).
Table 24: Number of fishing accidents during the last five years in the surveyed
communes
Type of accident No of
accidents No of deaths
No. Damaged
boats Lost value
Target communes 27 1 15 6
Control commune 0 0 0 0 Note: “lost value” means number of accidents that caused total loss of fishing equipments including boat, net,
fishing gear, and other equipments.
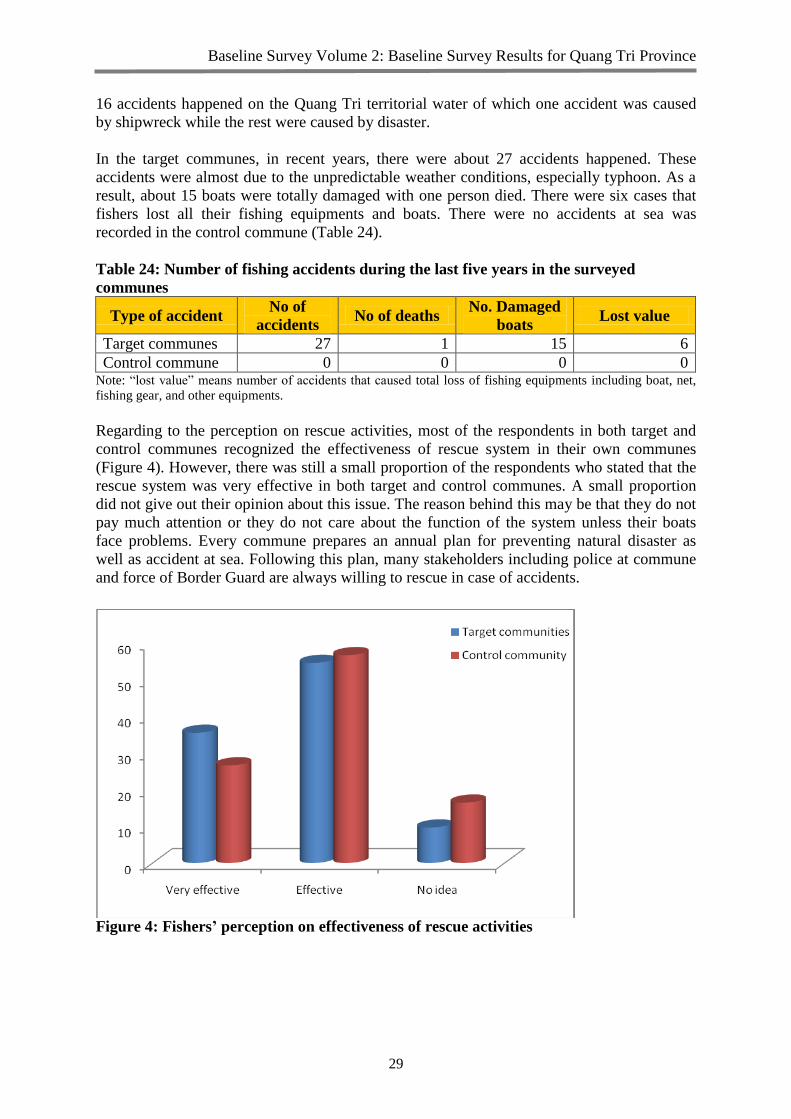
Regarding to the perception on rescue activities, most of the respondents in both target and
control communes recognized the effectiveness of rescue system in their own communes
(Figure 4). However, there was still a small proportion of the respondents who stated that the
rescue system was very effective in both target and control communes. A small proportion
did not give out their opinion about this issue. The reason behind this may be that they do not
pay much attention or they do not care about the function of the system unless their boats
face problems. Every commune prepares an annual plan for preventing natural disaster as
well as accident at sea. Following this plan, many stakeholders including police at commune
and force of Border Guard are always willing to rescue in case of accidents.
Figure 4: Fishers’ perception on effectiveness of rescue activities
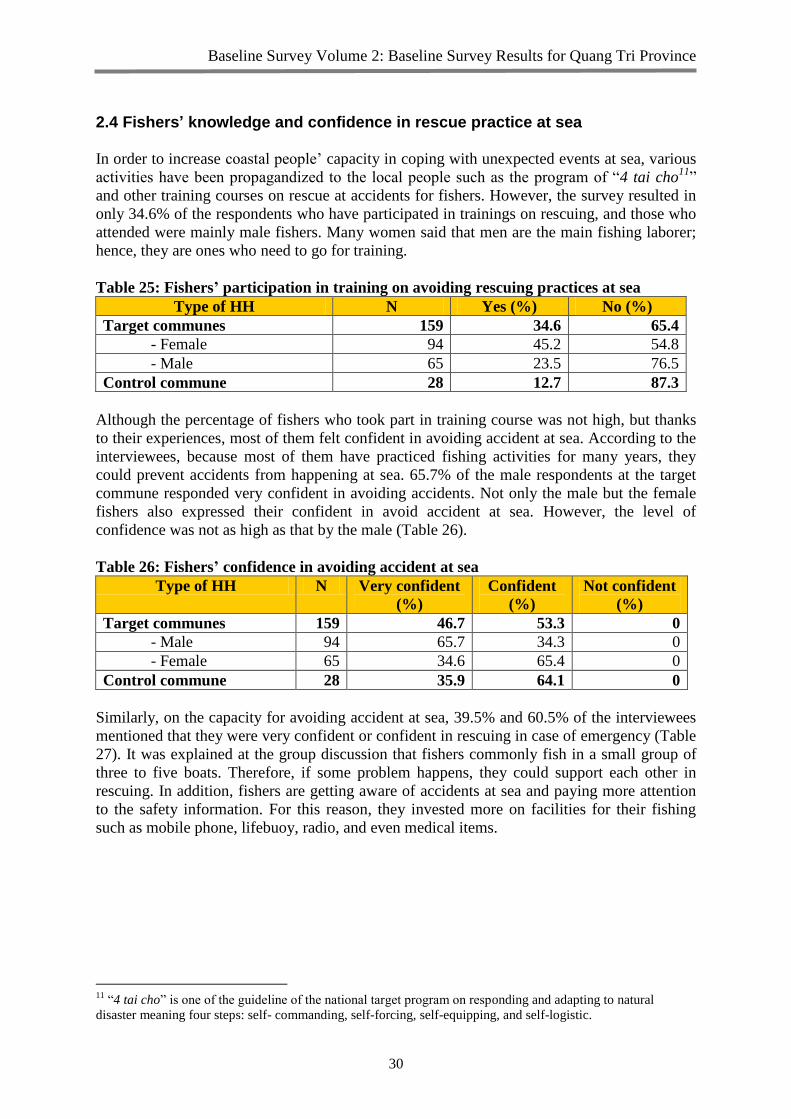
Baseline Survey Volume 2: Baseline Survey Results for Quang Tri Province
30
2.4 Fishers’ knowledge and confidence in rescue practice at sea
In order to increase coastal people’ capacity in coping with unexpected events at sea, various
activities have been propagandized to the local people such as the program of “4 tai cho11
”
and other training courses on rescue at accidents for fishers. However, the survey resulted in
only 34.6% of the respondents who have participated in trainings on rescuing, and those who
attended were mainly male fishers. Many women said that men are the main fishing laborer;
hence, they are ones who need to go for training.
Table 25: Fishers’ participation in training on avoiding rescuing practices at sea
Type of HH N Yes (%) No (%)
Target communes 159 34.6 65.4
- Female 94 45.2 54.8
- Male 65 23.5 76.5
Control commune 28 12.7 87.3
Although the percentage of fishers who took part in training course was not high, but thanks
to their experiences, most of them felt confident in avoiding accident at sea. According to the
interviewees, because most of them have practiced fishing activities for many years, they
could prevent accidents from happening at sea. 65.7% of the male respondents at the target
commune responded very confident in avoiding accidents. Not only the male but the female
fishers also expressed their confident in avoid accident at sea. However, the level of
confidence was not as high as that by the male (Table 26).
Table 26: Fishers’ confidence in avoiding accident at sea
Type of HH N Very confident
(%)
Confident
(%)
Not confident
(%)
Target communes 159 46.7 53.3 0
- Male 94 65.7 34.3 0
- Female 65 34.6 65.4 0
Control commune 28 35.9 64.1 0
Similarly, on the capacity for avoiding accident at sea, 39.5% and 60.5% of the interviewees
mentioned that they were very confident or confident in rescuing in case of emergency (Table
27). It was explained at the group discussion that fishers commonly fish in a small group of
three to five boats. Therefore, if some problem happens, they could support each other in
rescuing. In addition, fishers are getting aware of accidents at sea and paying more attention
to the safety information. For this reason, they invested more on facilities for their fishing
such as mobile phone, lifebuoy, radio, and even medical items.
11
“4 tai cho” is one of the guideline of the national target program on responding and adapting to natural
disaster meaning four steps: self- commanding, self-forcing, self-equipping, and self-logistic.
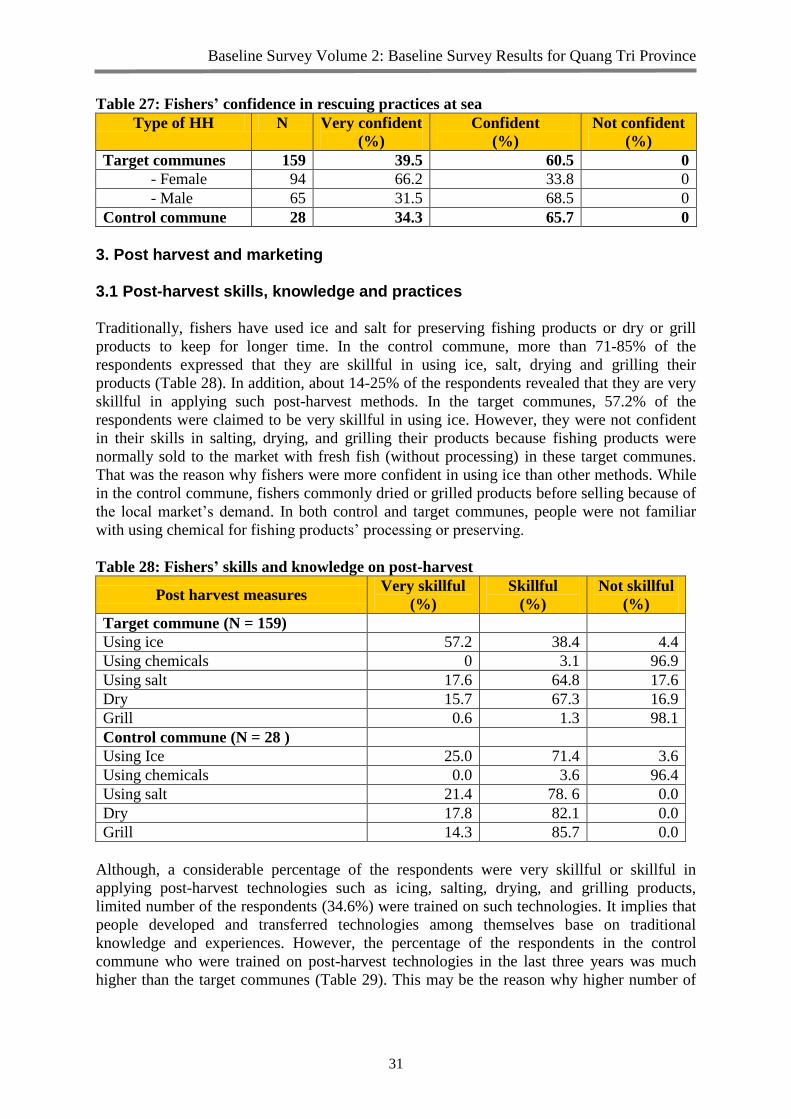
Baseline Survey Volume 2: Baseline Survey Results for Quang Tri Province
31
Table 27: Fishers’ confidence in rescuing practices at sea
Type of HH N Very confident
(%)
Confident
(%)
Not confident
(%)
Target communes 159 39.5 60.5 0
- Female 94 66.2 33.8 0
- Male 65 31.5 68.5 0
Control commune 28 34.3 65.7 0
3. Post harvest and marketing
3.1 Post-harvest skills, knowledge and practices
Traditionally, fishers have used ice and salt for preserving fishing products or dry or grill
products to keep for longer time. In the control commune, more than 71-85% of the
respondents expressed that they are skillful in using ice, salt, drying and grilling their
products (Table 28). In addition, about 14-25% of the respondents revealed that they are very
skillful in applying such post-harvest methods. In the target communes, 57.2% of the
respondents were claimed to be very skillful in using ice. However, they were not confident
in their skills in salting, drying, and grilling their products because fishing products were
normally sold to the market with fresh fish (without processing) in these target communes.
That was the reason why fishers were more confident in using ice than other methods. While
in the control commune, fishers commonly dried or grilled products before selling because of
the local market’s demand. In both control and target communes, people were not familiar
with using chemical for fishing products’ processing or preserving.
Table 28: Fishers’ skills and knowledge on post-harvest
Post harvest measures Very skillful
(%)
Skillful
(%)
Not skillful
(%)
Target commune (N = 159)
Using ice 57.2 38.4 4.4
Using chemicals 0 3.1 96.9
Using salt 17.6 64.8 17.6
Dry 15.7 67.3 16.9
Grill 0.6 1.3 98.1
Control commune (N = 28 )
Using Ice 25.0 71.4 3.6
Using chemicals 0.0 3.6 96.4
Using salt 21.4 78. 6 0.0
Dry 17.8 82.1 0.0
Grill 14.3 85.7 0.0
Although, a considerable percentage of the respondents were very skillful or skillful in
applying post-harvest technologies such as icing, salting, drying, and grilling products,
limited number of the respondents (34.6%) were trained on such technologies. It implies that
people developed and transferred technologies among themselves base on traditional
knowledge and experiences. However, the percentage of the respondents in the control
commune who were trained on post-harvest technologies in the last three years was much
higher than the target communes (Table 29). This may be the reason why higher number of
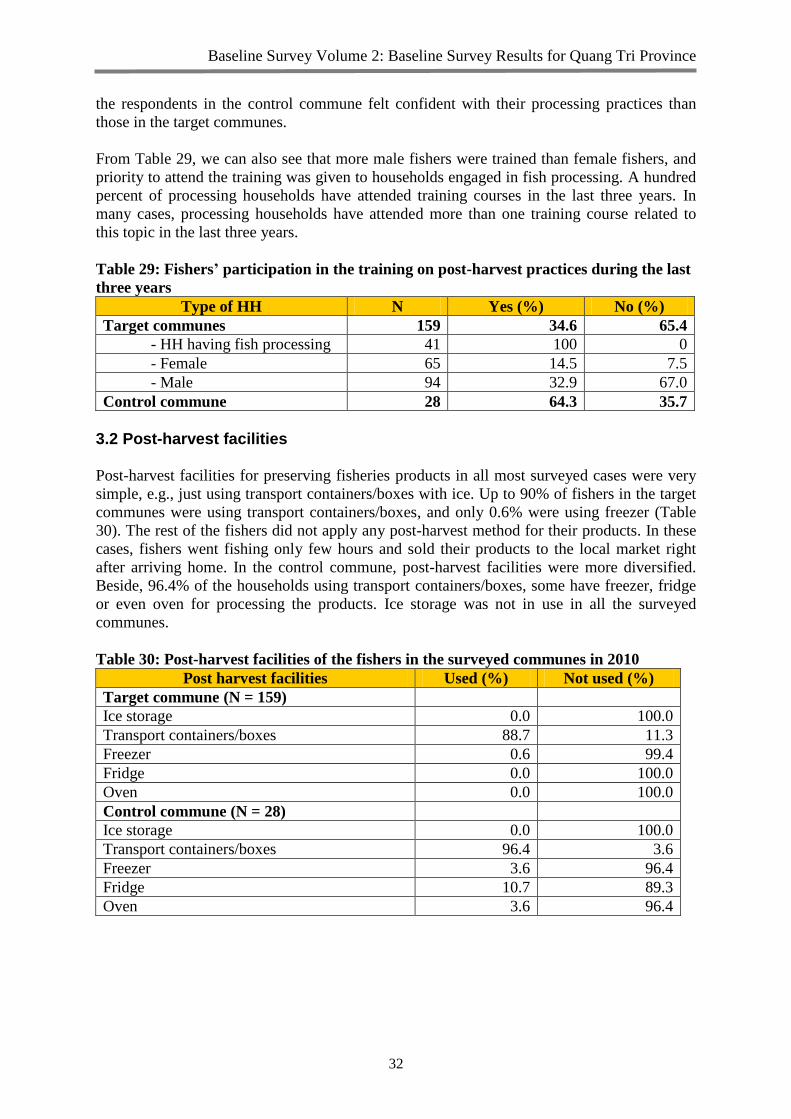
Baseline Survey Volume 2: Baseline Survey Results for Quang Tri Province
32
the respondents in the control commune felt confident with their processing practices than
those in the target communes.
From Table 29, we can also see that more male fishers were trained than female fishers, and
priority to attend the training was given to households engaged in fish processing. A hundred
percent of processing households have attended training courses in the last three years. In
many cases, processing households have attended more than one training course related to
this topic in the last three years.
Table 29: Fishers’ participation in the training on post-harvest practices during the last
three years
Type of HH N Yes (%) No (%)
Target communes 159 34.6 65.4
- HH having fish processing 41 100 0
- Female 65 14.5 7.5
- Male 94 32.9 67.0
Control commune 28 64.3 35.7
3.2 Post-harvest facilities
Post-harvest facilities for preserving fisheries products in all most surveyed cases were very
simple, e.g., just using transport containers/boxes with ice. Up to 90% of fishers in the target
communes were using transport containers/boxes, and only 0.6% were using freezer (Table
30). The rest of the fishers did not apply any post-harvest method for their products. In these
cases, fishers went fishing only few hours and sold their products to the local market right
after arriving home. In the control commune, post-harvest facilities were more diversified.
Beside, 96.4% of the households using transport containers/boxes, some have freezer, fridge
or even oven for processing the products. Ice storage was not in use in all the surveyed
communes.
Table 30: Post-harvest facilities of the fishers in the surveyed communes in 2010
Post harvest facilities Used (%) Not used (%)
Target commune (N = 159)
Ice storage 0.0 100.0
Transport containers/boxes 88.7 11.3
Freezer 0.6 99.4
Fridge 0.0 100.0
Oven 0.0 100.0
Control commune (N = 28)
Ice storage 0.0 100.0
Transport containers/boxes 96.4 3.6
Freezer 3.6 96.4
Fridge 10.7 89.3
Oven 3.6 96.4

Baseline Survey Volume 2: Baseline Survey Results for Quang Tri Province
33
3.3 Market of fisheries products
3.3.1 Type of fisheries products (fresh and processed products) and production in surveyed communes in 2010
Fishery products in the surveyed communes were shrimp, crab, sea crab (ghe, Charybdis and
Portunus spp.) and various kinds of fishes. In 2010, the average fishery production of the five
target communes was 1,055 tons, of which, 83% was fresh and 17% was sold as processed
products. In both control and target communes, fresh products were the majority of products
sold. This may lead to risk and reduced profits for fishers.
Table 31: Fishery products and productivity in surveyed commune in 2010
Production
(tons)
Fresh products
(%)
Processed products
(%)
Target communes 1,055 83 17
Trieu Lang 158 80 20
Trieu Van 135 82 18
Hai An 267 85 15
Hai Khe 312 75 25
Vinh Thai 183 93 7
Control commune 160 60 40
(Source: Hai An CPC, 2010; Hai Khe CPC, 2010; Trieu Van CPC, 2010; Trieu Lang CPC,
2010; Vinh Thai CPC, 2010; Vinh Thach CPC, 2010)
Drying, grilling, fish sauce making, and salted/fermented fish production were the major
processing methods practiced by people in the surveyed communes. For fresh products,
fishers usually used ice for preserving.
3.3.2 Fish processing factories in the province
There was no fish processing factories in Quang Tri Province. Almost all fishery products
were processed manually based on traditional experiences and were mainly for home
consumption and sale in local markets. However, a small proportion of high value fishery
products have been sold to fishery factories in other provinces such as Thua Thien Hue, Da
Nang, or Hai Phong for processing.
3.3.3 Fisheries products’ market chain
Beside household consumption, fishery products in the surveyed communes were distributed
to four major stakeholders along the market chain, namely fish processing factories, middle
traders, local fish processors and local markets. Table 32 was calculated on the percentage of
each fishery product sold to different market actors. The distribution of fishery products was
different from product to product. Fish was mainly sold at the local market, while green crab
and squid were mainly sold to the middle traders. In general, more than half of the all fishery
products were sold to middle traders or local market. Less than 3% went to processing
factories or local fish processor. The percentage of the respondents who do not know where
their sold products went was approximately over 30% because these interviewees were
mostly male whereas their wives were responsible for selling fishery products. For that
reason, they were not aware of the market chain.

Baseline Survey Volume 2: Baseline Survey Results for Quang Tri Province
34
Table 32: Market chain of fishery products in the surveyed communes in 2010 (%
product)
Product Fish
processing
factory
Middle
trader
Local fish
processor
Local
market
Other No idea
Shrimp 1.3 28.2 0.3 24.9 0.0 45.3
Crab 1.7 27.9 1.9 7.4 0.0 60.4
Green crab 2.1 58.1 2.3 16.7 0.0 22.0
Fish 1.6 36.7 0.9 52.9 0.0 7.9
Squid 1.9 44.8 0.6 16.2 0.0 35.8
Dried squid 0.0 14.8 1.3 5.3 0.0 77.4
Dried fish 0.0 10.6 0.6 18.2 2.6 67.9
Grilled fish 0.0 9.4 0.0 31.3 1.4 57.9
Fish sauce 0.0 60.0 0.0 35.0 5.0 0.0
Fermented
fish
0.0 75.0 0.0 20.0 5.0 0.0
Since a large proportion of fishery products were sold to the middle traders, the majority of
the respondents pointed out the high and very high degree of dependence on them, especially
for green crab and squid sales.
Table 33: Respondent opinion on degree of dependence of fishers on middle traders
Product N Very high
(%)
High
(%)
Not at all
(%)
No idea
(%)
Prawn 187 42.1 12 11.3 34.6
Crab 157 37.1 4.4 5.7 52.8
Green crab 109 54.1 16.4 9.4 20.1
Fish 187 34.6 32.1 30.2 3.1
Squid 143 44.7 15.1 14.5 25.8
Dried squid 78 25.8 4.4 5.7 64.1
Dried fish 129 25.2 9.4 10.1 55.4
Grilled fish 89 24.5 13.2 20.1 42.1
Fish sauce 65 30.5 42.7 26.8 0.0
Fermented fish 54 25.6 65.7 8.7 0.0
The majority of the respondents in all surveyed communes did not know well where their
fishing products were going to be consumed. This was true especially dried squid, crab, and
dried and grilled fish (Table 34). The percentage was based on the number of the respondents
being aware of places where their fishery products were consumed. About 43 to 76% of the
respondents replied that their fishery products including finfish, green crab, shrimp, and squid
were consumed within the province. About 11% of green crab, 10% of squid, and less than
10% of other products were consumed in national markets. Only few were exported to other
countries. Fish sauce and salted fish were mainly produced for the provincial market.

Baseline Survey Volume 2: Baseline Survey Results for Quang Tri Province
35
Table 34: Fisher perception on type of market of their fisheries products (%)
Product Provincial
market
National
market
International
market
No idea
Shrimp 43.1 6.6 1.9 48.4
Crab 30 2.7 0.0 67.3
Green crab 50.8 11.3 0.6 37.1
Fish 76.2 7.6 0.5 15.7
Squid 43.9 10.2 0.3 48.4
Dried squid 18.3 1.2 0.0 80.5
Dried fish 27.7 0.6 0.0 71.7
Grilled fish 38.1 0.3 0.0 61.6
Fish sauce 100 0.0 0.0 0.0
Salted fish 100 0.0 0.0 0.0
3.4 Quality control of fishery products
The Sub-Department of Agro-Forestry-Fishery Quality Assurance (SDAFFQA) at DARD
and district Department of Industry and Trade (DOIT) were the ones in charge of controlling
the quality of fishery products. However, it is a relatively young and new department with
responsibilities. Therefore, the information on fishery quality control was limited. In the
surveyed communes, most of key informants indicated that about 90% of the aquaculture
products were exported, which also implies that a large proportion of fishery products in the
commune meet export standards. The leader of Trieu Phong Industry Department stated that
if quality control standards were strictly enforced, no fishery products other than wild caught
products would meet export standards.
The main exported fishery products from Quang Tri Province were aquaculture products and
natural sea crabs (ghe, Charybdis and Portunus spp.), squid, etc. Among surveyed
communes, Trieu Lang and Trieu Van had the largest volume of export due to booming
aquaculture production in the coastal areas and the development of new technologies for
catching green crabs (Table 35). The proportion of exported fishery products was similar for
the target communes and the control one, with the exception of Trieu Lang and Trieu Van,
which had significant exports of aquatic product.
Table 35: Percentage of exported fishery products in 2010
% of exported fishery products
The whole province 30.0
Hai Lang 25.0
Hai An 30.0
Hai Khe 24.0
Trieu Phong 30.0
Trieu Lang 80.0
Trieu Van 94.5
Vinh Linh 30.0
Vinh Thai 36.0
Vinh Thach 30.0
(Source: Hai An CPC, 2010; Hai Khe CPC, 2010; Trieu Van CPC, 2010; Trieu Lang CPC,
2010; Vinh Thai CPC, 2010; Vinh Thach CPC, 2010 and DARD 2011)

Baseline Survey Volume 2: Baseline Survey Results for Quang Tri Province
36
Although fish processing within the province was mainly done manually, a few processing
households had been inspected and had been certified by related departments, especially by
the district Department of Trade and Industry and the provincial DARD. Out of about 150
trading households/units within Quang Tri Province, six had been inspected, and five had
been certified for operation (Table 36). For fish processing, most of the 345 fishery-
processing units in the province were processing fish sauce and dried salted fish. Among
those, 13 units had been inspected, and 11 had been certified. To date, two fish traders and
two fish processors have been issued with trademarks.
Table 36: Number of fish trading and fish processing units inspected and certified
No of units Inspected Certified Trade mark
Fish trade 150 6 5 2
Dried products 15 1 0 1
Fish sauce and
fermented fish 330 12 11 1
3.5 Policies and institutions related to fisheries post-harvest
According to Mr. Dinh of SDAFFQA, there are four ongoing activities to improve post-
harvest activities in the province, namely: (i) the establishment of this new division that is
meant to improve local capacity in processing the fishery products, (ii) annually organization
of trainings for improving processing skills for local fishery communities, (iii) the
establishment of fishing and processing cooperatives in the fishery communities, and (iv)
establishment of credit programs for promoting fish processing units at the fishery
communities. Activities (ii) and (iv) have been implemented in the surveyed communes and
are popular with the local people. Activity (iii) has been just commenced with the first
formation of cooperatives and FA management boards in each fishing commune in the
province.
According to Mr. Dinh, because SDAFFQA is still young, many other related departments
have to be involved in this task. At present, besides the provincial and district DARDs, the
extension center and extension station and district DOITs are also involved in fisheries post-
harvest activities. At the local level, CPCs, village leaders, and mass organizations play
important roles in carried out any activities related to fishery post-harvest. In many cases,
SDAFFQA or the provincial DARD worked directly with the commune and village leaders
on related issues.
Local people’s assessment on function of these institutions is presented in Table 37. Almost
95-99% people could not give their ideas about the effectiveness of such institutions in terms
of fisheries post-harvest. The reasons for this may be that (i) not many activities on post-
harvest technologies had been transferred to the communities by these institutions, (ii) any
activities related to post-harvest had been mainly dealt with by processing households, and
(iii) decline in fishery productivity for processing was also a reason for not applying new
post-harvest technologies. In addition, some processing households (normally with small-
scale processing units) in Trieu Van, Trieu Lang and Vinh Thai Communes expressed that
processing techniques transferring by the above institutions were more complicated than their
own methods. Applying such new techniques may result in healthier products, but the taste is
not as good as traditionally made product.

Baseline Survey Volume 2: Baseline Survey Results for Quang Tri Province
37
Table 37: Fisher and processor satisfaction with the support from fisheries post-harvest
institutions (N = 159)
Supporting Institution Satisfied
(%)
Not satisfied
(%)
No idea
(%)
SDAFFQA 0.0 1.3 98.7
District DOITs 0.0 0.0 100.0
District DARDs 3.8 0.6 95.6
Extension centers 0.0 4.4 95.6
CPCs, village leaders 1.3 1.3 97.5
Mass organizations 1.3 0.6 98.1
For the bigger units of fish processing, which had trade marks in Trieu Lang Commune or
Hai An Commune, processors were satisfied with the support provided by government
institutions to their business. They attended several training courses on processing
techniques, visited demonstration models, supporting with funds and processing equipment.
3.6 Funding and staff deployed for post-harvest 3.6.1 Funding for post-harvest sector
Generally, there has not been a specific policy on funding support for the post-harvest sector.
Supporting for post-harvest was integrated into programs related to industrial extension and
vocational training. Recently, Quang Tri PPC promulgated Decision No 11/2010/QD-UBND
on 19 May 2010 to list and set standards for vocations for enterprises and production
facilities. According to this decision, people who conduct fish processing in a large scale
would be granted with 1,100,000 VND for three months of training. However, the survey
indicated that few people were paying much attention to this grant due to the minor amount
of money and the strict selection process. The vice chairman of Hai An Commune stated that
“though all of us are aware of this policy, we have not obtained anything from it. Firstly, the
amount of money is small, which is considered insufficient for developing post-harvest
activities. Secondly, the grant is also based on the selection of Department of Labor, Invalids,
and Social Affairs (DOLISA) as well as DOIT. Therefore, not all of people received this
fund.” Similarly, the result of in-depth interview from process households revealed that, for
ten years, they had received no money for supporting post-harvest activities from the
government at the commune level. It was revealed from all surveyed communes that there
was no fund from the commune budget allocated for this sector.
3.6.2 Number of fish processing staff at different levels
According to the representative of the provincial DARD, there are no staff specialized in
post-harvest fisheries in the province. Most staff currently dealing with this job have a
background on agriculture production or aquaculture production. These staff have been
working for the provincial or district DARDs. The four provincial staff annually attended
short training courses on post-harvest technologies and skills to train local people. Results of
interview show that all officials at district and provincial levels were confident of their skills
and knowledge for training local people. Surprisingly, 40% of the staff at the commune level
felt very confident, and 60% were confident of their skills.

Baseline Survey Volume 2: Baseline Survey Results for Quang Tri Province
38
Table 38: Degree of confidence of officers working on post-harvest fisheries in
performing post-harvest techniques and practices
N Very confident
(%)
Confident
(%)
Not confident
(%)
Provincial staff 4 0 100 0
District staff 3 0 100 0
Commune staff 5 40 60 0
4. Livelihood diversification and enhancement 4.1 Livelihood activities
Livelihood activities at both target and control communes have been diversified and include
fishing, aquaculture production, crop production, animal husbandry, hired labor, small
businesses, and fish processing. The majority of local people are engaged in fishing activities.
However, in recent years, due to the reduction in fish catch, some inhabitants have changed
their income generation activities, which include migration to other cities for laboring and
farm production. The vice chairman of Hai An Commune stated that “if local people depend
on fishing completely, they will have no chance to increase their income because this activity
is getting worse and worse as shown by the sharp reduction in fish catch. They have to
develop other ways to earn money through other types of work such as cultivating crops on
sandy land, investing more on pig breeding, migrating to Ho Chi Minh City, Ha Noi, or
Laos.” Fishing as a livelihood activity is threatened by the unsustainable illegal fishing of
large boats from other provinces. Moreover, fishing is not possible from October to
December due to the bad weather conditions. This problem also affects negatively to
processing households. A fish processor stated that “Many years ago, I did not have enough
time for sleeping because I was so busy to manage fish processing activities such as drying
squids and fish. I used to hire more than seven labourers for this activity. However, now I
have to work as a mechanic as well to ensure my income. Many processing facilities are no
longer used.” Clearly, due to the heavy dependence on fishing, resource shortage has resulted
in many livelihood problems for local people. In an attempt to increase the livelihood
activities of local people, DARD and its extension center have been conducted some
extension programs on new fishing gears, sandy aquaculture systems, and pig breeding.
As for the participations in livelihood activities, the survey indicated that male fishers were
responsible for the fishing while the women were in charge of selling and processing fishery
products. However, in the summer season, children also helped their parents with fishing
activities such as transporting fishery products from boat to home or to markets or repair
fishing nets. Additionally, the result of group discussions showed that both male and female
fishers played an important role in making decisions related to their livelihood and social
activities. However, male fishers usually decided the working plan and the female fishers
often kept money and estimated production costs and investment.
Regarding the perception on well-being and poorness, all of them indicated the well-being of
households could be assessed with the criteria such as two-floored houses, diverse income
sources, education of children, and number of well-paid labor. Male fishers in particular
wanted sufficient money to afford beer instead of rice wine, to drink coffee in the morning,
and to gamble whereas women were more concerned with the kind of foods they can buy
from the market as an indicator of well-being. On the perception of poorness, most of the
male and female fishers agreed that the poor were people who lived in temporary houses, had
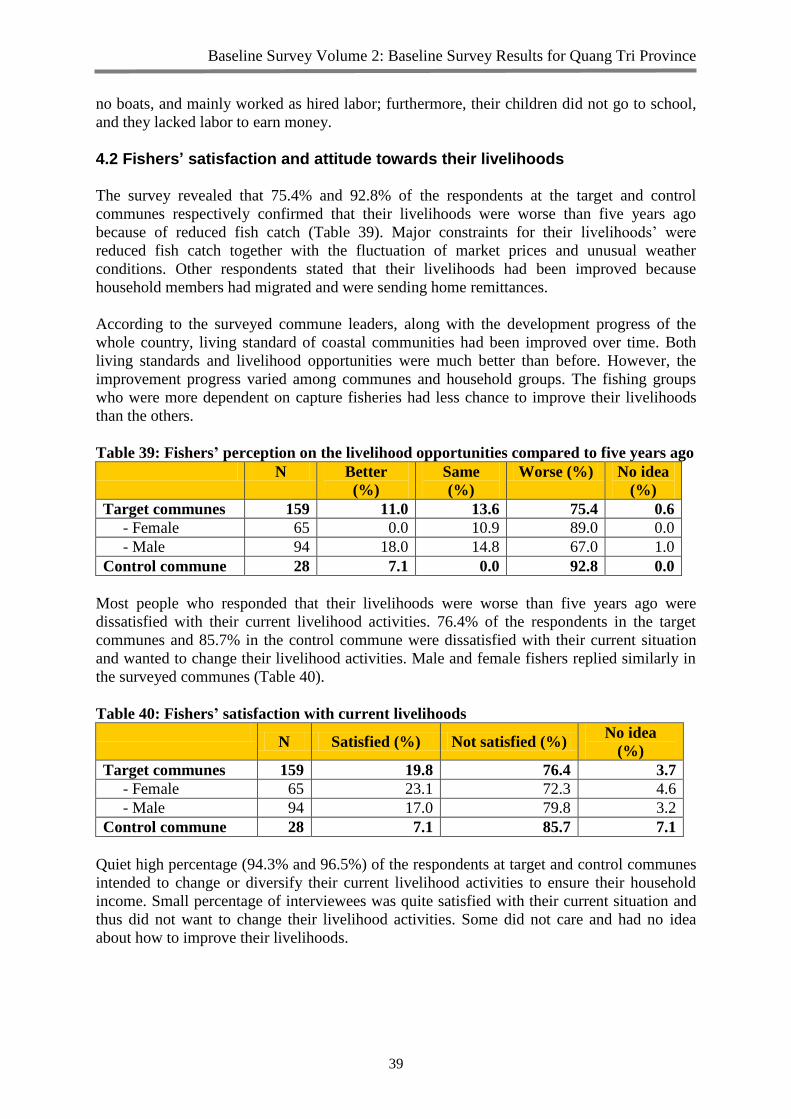
Baseline Survey Volume 2: Baseline Survey Results for Quang Tri Province
39
no boats, and mainly worked as hired labor; furthermore, their children did not go to school,
and they lacked labor to earn money.
4.2 Fishers’ satisfaction and attitude towards their livelihoods
The survey revealed that 75.4% and 92.8% of the respondents at the target and control
communes respectively confirmed that their livelihoods were worse than five years ago
because of reduced fish catch (Table 39). Major constraints for their livelihoods’ were
reduced fish catch together with the fluctuation of market prices and unusual weather
conditions. Other respondents stated that their livelihoods had been improved because
household members had migrated and were sending home remittances.
According to the surveyed commune leaders, along with the development progress of the
whole country, living standard of coastal communities had been improved over time. Both
living standards and livelihood opportunities were much better than before. However, the
improvement progress varied among communes and household groups. The fishing groups
who were more dependent on capture fisheries had less chance to improve their livelihoods
than the others.
Table 39: Fishers’ perception on the livelihood opportunities compared to five years ago
N Better
(%)
Same
(%)
Worse (%) No idea
(%)
Target communes 159 11.0 13.6 75.4 0.6
- Female 65 0.0 10.9 89.0 0.0
- Male 94 18.0 14.8 67.0 1.0
Control commune 28 7.1 0.0 92.8 0.0
Most people who responded that their livelihoods were worse than five years ago were
dissatisfied with their current livelihood activities. 76.4% of the respondents in the target
communes and 85.7% in the control commune were dissatisfied with their current situation
and wanted to change their livelihood activities. Male and female fishers replied similarly in
the surveyed communes (Table 40).
Table 40: Fishers’ satisfaction with current livelihoods
N Satisfied (%) Not satisfied (%)
No idea
(%)
Target communes 159 19.8 76.4 3.7
- Female 65 23.1 72.3 4.6
- Male 94 17.0 79.8 3.2
Control commune 28 7.1 85.7 7.1
Quiet high percentage (94.3% and 96.5%) of the respondents at target and control communes
intended to change or diversify their current livelihood activities to ensure their household
income. Small percentage of interviewees was quite satisfied with their current situation and
thus did not want to change their livelihood activities. Some did not care and had no idea
about how to improve their livelihoods.

Baseline Survey Volume 2: Baseline Survey Results for Quang Tri Province
40
Table 41: Fishers’ attitude towards changing or diversifying livelihoods
N Intend to
change (%)
Not intend to
change (%)
No idea
(%)
Target communes 159 94.3 3.8 1.9
- Female 65 95.4 3.1 1.5
- Male 94 93.6 4.2 2.1
Control commune 29 96.6 0.0 3.4
4.3 Factors affecting livelihood change
All information related to factors affecting to livelihood change was collected through key
informant interview and group discussion. The results revealed that factors affecting
livelihood changes could be categorized into two groups: enabling factors and hindering
factors, of which the former facilitates the enhancement of livelihood activities of local
people while the later prevents such.
Enabling factors
High percentage of labor
Good infrastructure (except Hai Khe
Commune)
Support from mass organization at the
commune level
The cooperation and agreement of CPCs
The enthusiasm of commune leaders
Programs funded by the Government such as
supporting oil for boat program, subsidized
credit line program, and the program of
training for rural labor
Model of fishing gears, crop production in
sandy land, and pig breeding granted by the
extension center and district DARDs
Hindering factors
Low technique in fishing and fish
processing
Low capacity for accessing
information related to market
Lack of capital for investment and
reproduction
Low capacity for consumption fishery
product
Threats
The fluctuation output price
Unsustainable over-fishing by large
external vessels
Lack of market
4.4 Income and livelihood diversification
Table 42 presented income sources and levels of income of the household respondents in the
surveyed communes. The table shows that the total income per household at the study site
was about 19,000,000 VND/year, of which fishing activity contributed more than 11,000,000
VND, or approximately 66.7% of the total. This figure confirmed that the level of livelihood
dependence on fishing activities of respondent households was high. Other sources of income
such as small business, hire labor, and fish processing only provided minor percentages of the
total household income.

Baseline Survey Volume 2: Baseline Survey Results for Quang Tri Province
41
Table 42: Average income from main income sources of surveyed households in 2010
(million VND)
Income
per HH
Income
per
capita
Income
from
fishing
Income from
fish
processing
Income
from
small
business
Income
from other
activities
N 159.0 159.0 140.0 13.0 8.0 141.0
Mean 19.4 2.3 11.8 2.1 3.1 3.0
SD 4.1 0.4 6.2 1.3 1.7 1.4
Median 12.0 17.5 5.0 2.0 5.0 4.5
Min 2.0 10.0 0.1 0.5 2.0 2.0
Max 25.0 20.0 30.0 5.0 15.0 5.0
Diversification of income sources is a way to sustain and ensure the livelihoods of
marginalized people, especially those from fishing communities. That was also one of the
governmental targets in recent years. However, the results of interviewing 187 households in
the surveyed communes showed an opposite picture (Table 43). Fishing was still the single
major source of income for more than 17% and 11% of households at target and control
communes respectively. The number of households with more than two sources of income
was only 25.2% of the interviewed households in target communes. The reasons behind this
may be that the respondents did not consider the seasonal or temporary income activities that
provide minor family income. They may have only considered those activities that they
conducted nearly all year around and on which most household members were involved with.
Table 43: Number of major income sources of HH
Number of HH %
Target commune 159 100
- HHs having only one major income source (fishing) 28 17.6
- HHs having two major income sources 91 57.2
- HHs having more than two major income sources 40 25.2
Control commune 28 100
- HHs having only one major income source (fishing) 3 11
- HHs having two major income sources 16 57
- HHs having more than two major income sources 9 32
In both target and control communes, households who reported having only one major
income source explained that their family was heavily dependent on fishing. Although, they
have other sources of income, these sources were unstable and contribute significantly less to
family income than fishing.
4.5 Supporting services for livelihood enhancement and diversification Interestingly, 100% of the respondents including male and female fishers were aware of the
existence of programs and institutions including credit program, technical assistance
program, support to consume fishery products, marketing program, and input support for
fisheries activity. These programs aimed at supporting livelihoods of local people (Table 44).
The reason for this high rate of knowledge was awareness raising activities of the local mass
organizations. According to the result of key informant interview, most of these programs

Baseline Survey Volume 2: Baseline Survey Results for Quang Tri Province
42
had been integrated in the village meetings or mass organization meetings in order to inform
to villagers widely.
Table 44: Fishers’ awareness on the availability of supporting institutions/programmes
for livelihood enhancement and diversification
N Very aware
(%)
Aware
(%)
Not aware
(%)
Target communes 159 0.0 100.0 0
- Female 65 0.0 100.0 0
- Male 94 0.0 100.0 0
Control commune 28 3.6 46.4 50
Although most of the respondents could access information about supported programmes, not
all people were actually supported by these programmes. In evaluation of such services, the
credit supply service was received the highest appreciation by the respondents with 53.5%
because of the easy access to the service. Support for production inputs and marketing were
also appreciated by local people. However, many respondents still complained about the
services for the small size of support and the long waiting time. 25.8% of the respondents
stated that accessing credit services was difficult. About 11.9–29.6% of the respondents could
not evaluate these services because they had never accessed or had not yet received sufficient
information about these services.
Table 45: Fishers’ access of the supporting services for livelihood enhancement and
diversification
Supporting services Easy
(%)
Difficult
(%)
Not at all
(%)
No idea
(%)
Target commune (N = 159)
Loan 53.5 25.8 8.8 12.0
Technical assistance 37.7 5.7 27.0 29.6
Marketing 41.5 15.7 15.1 27.7
Input supply 47.2 12.6 22 18.2
Control commune (N = 28)
Loan 46.4 46.4 7.1 0.0
Technical assistance 42.9 10.7 46.4 0.0
Marketing 64.3 14.3 17.9 3.6
Input supply 46.4 32.1 17.9 3.6
Satisfaction is another criterion for the evaluation of support services for people’s
livelihoods. Although, a large proportion of people appreciated the credit service, input
supply and marketing services as they found it easy to access these services, 33.9% of the
respondents were dissatisfied with the quality of these services (Table 46), while 30.2% did
not express any opinion. The reasons behind this could be (i) they have not participated in
mass organization meetings and therefore are not eligible for VBSP loans and (ii) due to
outstanding credit, VBSP rules bar them from being allowed to take another loan.
The supply of inputs was only given to boat owners. Villagers who do not own boats were
not be supported by this program. That may be part of the reason why 45.3% of the
respondents replied they had no idea about their satisfaction with this program.
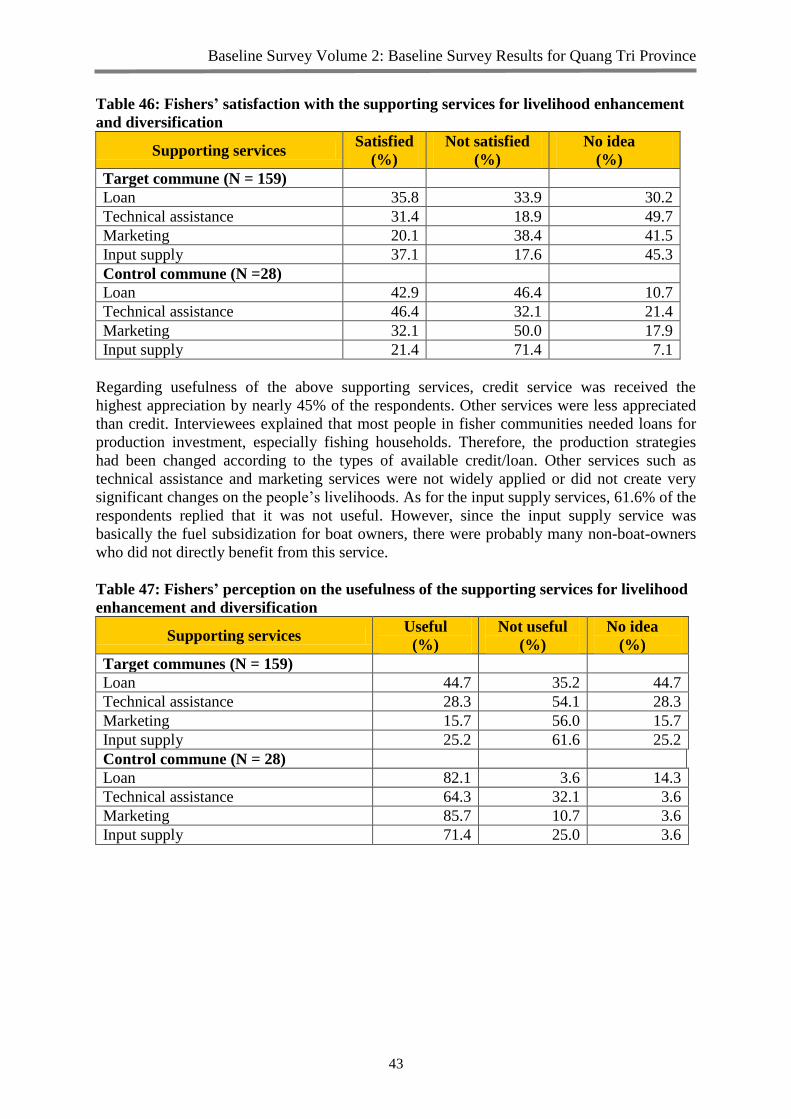
Baseline Survey Volume 2: Baseline Survey Results for Quang Tri Province
43
Table 46: Fishers’ satisfaction with the supporting services for livelihood enhancement
and diversification
Supporting services Satisfied
(%)
Not satisfied
(%)
No idea
(%)
Target commune (N = 159)
Loan 35.8 33.9 30.2
Technical assistance 31.4 18.9 49.7
Marketing 20.1 38.4 41.5
Input supply 37.1 17.6 45.3
Control commune (N =28)
Loan 42.9 46.4 10.7
Technical assistance 46.4 32.1 21.4
Marketing 32.1 50.0 17.9
Input supply 21.4 71.4 7.1
Regarding usefulness of the above supporting services, credit service was received the
highest appreciation by nearly 45% of the respondents. Other services were less appreciated
than credit. Interviewees explained that most people in fisher communities needed loans for
production investment, especially fishing households. Therefore, the production strategies
had been changed according to the types of available credit/loan. Other services such as
technical assistance and marketing services were not widely applied or did not create very
significant changes on the people’s livelihoods. As for the input supply services, 61.6% of the
respondents replied that it was not useful. However, since the input supply service was
basically the fuel subsidization for boat owners, there were probably many non-boat-owners
who did not directly benefit from this service.
Table 47: Fishers’ perception on the usefulness of the supporting services for livelihood
enhancement and diversification
Supporting services Useful
(%)
Not useful
(%)
No idea
(%)
Target communes (N = 159)
Loan 44.7 35.2 44.7
Technical assistance 28.3 54.1 28.3
Marketing 15.7 56.0 15.7
Input supply 25.2 61.6 25.2
Control commune (N = 28)
Loan 82.1 3.6 14.3
Technical assistance 64.3 32.1 3.6
Marketing 85.7 10.7 3.6
Input supply 71.4 25.0 3.6
Baseline Survey Volume 2: Baseline Survey Results for Quang Tri Province
44
5. Microfinance 5.1 Formal and informal financial institutions operating in the communes
In target and control communes, financial institutions are comprised of both formal
organizations and informal groups. The formal organizations are mainly composed of two
bank systems including Vietnam Bank for Social Policy (VBSP) and Vietnam Bank for
Agriculture and Rural Development (AgriBank or VBARD). The mechanisms of financial
services provided by these banks are quite different. VBSP provides their services through
guarantee in group lending and joint liability whereas AgriBank gives loans based on
collateral. As for the informal credit source, both target and control communes have private
moneylenders and rotation credit-saving groups called “nhom hui.” One of the highlighted
characteristics of these two informal financial institutions is the mechanism of loaning based
on the relationship and the trust between the credit owners and the borrowers.
5.2 Perception of formal financial institutions on fisheries activities and the proportion of fisher among their clientele base
The reported perception of formal institutions on fishery activities was dissimilar for the
different banks in Quang Tri Province. VBSP provides smaller loan sizes than the AgriBank.
Therefore, the borrowers normally take VBSP loan for house repairs and to buy fishing gears.
In communes, the Farmer’s Union and the Women’s Union are responsible for monitoring
the repayment of interests. As the loans are small, the VBSP does not worry too much about
loan non-repayment. Because other banks are providing larger loans, they have to be very
careful about the risk of loan non-repayment. According to the AgriBank staff, some
borrowers use loans to fund shrimp production, which the banks sees as a high risk operation.
For this reason, AgriBank staff always conduct a careful assessment of loan applicants before
deciding whether to give loans. AgriBank staff in Trieu Phong District stated that the bank
were no longer providing loans for shrimp farming as its risk was too high.
AgriBank covers agriculture, fishing, and business clients similarly. Staff of the Trieu Phong
AgriBank branch in Bo Ban Town stated that 50% of their clients in 2010 were from coastal
communities. However, more than 80% of the loans taken by coastal communities were used
for agriculture production (crop and livestock) or for small businesses. Less than 20% were
invested in capture fishing or fish processing.
It was revealed by in-depth interviews that although demand for loans was very high in all
surveyed communes, a very low percentage of fishing households had actually accessed the
AgriBank because of the high interest rates and complicated procedures. Fishing households
preferred VBSP to other bank systems because of the low interest rates (e.g., 0.65%/month
compared to 1.2%/month of AgriBank).
5.3 Fishers’ awareness of and access to financial services in the communes
Credit was one of the most common supporting services in the local communities. More than
83.7% of the respondents were aware of different local credit sources (Table 48), of which
20.8% were well aware of each financial service including the location, loan size, interest,
and time scale. All information about financial services came through the Women’s Union
and the Farmer’s Union in each village. Villagers, both men and women, had good access to
these services.

Baseline Survey Volume 2: Baseline Survey Results for Quang Tri Province
45
Table 48: Fishers’ awareness of the availability of financial services
N Very aware
(%)
Aware
(%)
Not aware
(%)
Target communes 159 20.8 62.9 16.3
- Male 94 22.3 57.5 20.2
- Female 65 18.5 70.8 10.7
Control commune 28 14.3 71.4 14.3
Besides being aware of credit source availability, most of interviewees were aware of loan
application procedures, required application forms, time, and place for submitting their
forms. Among the three main credit sources at target and control communes, AgriBank had
the highest proportion of people (51.9%) who were aware of its procedures (Table 49).
However, the percentage of people who were very aware of AgriBank’ procedures was lower
than for the VBSP. According to leaders of the commune Farmer’s Union, VBSP staff
usually come to Farmer’s Union and Women’s Union meetings to collect loan interest and to
explain about the process of loan application in order to facilitate local access to credit.
Accordingly, many villagers were very aware of the procedures to apply for loans.
Table 49: Fishers’ awareness of the procedures/regulations of financial services
Type of
respondents
N Very aware
(%)
Aware
(%)
Not aware
(%)
VBSP Total 187 26.2 49.2 24.6
- Male 113 21.2 49.6 29.2
- Female 74 33.8 48.6 17.6
VBARD/AgriBank Total 187 14.4 51.9 33.7
- Male 113 14.1 54.0 31.9
- Female 74 14.9 48.6 36.5
Private financial
services
Total 187 16.6 35.8 47.6
- Male 113 16.8 34.5 48.7
- Female 74 16.2 37.9 45.9
Although the percentage of the interviewees’ understanding of the availability as well as the
procedures of loan application was quite high, not all of the respondents could actually access
the credit when in need. The survey results indicated that only 47.8% of the interviewees
answered that they could access the credit easily (Table 50). There was no significant
difference between male and female perception on the possibility of access to credits when in
need in the surveyed communes. However, the proportion of the respondents who had easy
access to credit resources was significantly lower at control commune (17.8%) than the target
communes (47.8%). The rest of them felt difficult or even impossible to access credit
resources.

Baseline Survey Volume 2: Baseline Survey Results for Quang Tri Province
46
Table 50: Fishers’ perception on possibility of access of credit when in need
N Easy
(%)
Difficulty
(%)
Can’t access
(%)
No idea
(%)
Target communes 159 47.8 42.7 8.2 1.3
- Male 94 44.7 43.6 9.6 2.1
- Female 65 52.3 41.5 6.2 0.0
Control commune 28 17.8 78.6 3.6 0.0
The survey result showed that formal credit service was most preferred by 77.4% of
respondent in target communes and 85.71% of respondent in control commune. Although
informal service did not require a lot of paperwork with simple procedures, this system was
not preferred by many people because of its high interest rate, high risks, and trust or
relationship with credit providers that borrowers must have. In practice, the informal creditors
have been supplying the financial services only to their acquaintances that they knew well.
Hence, most of the respondents would like to access the formal credit system when in need.
Table 51: Fishers’ choice of financial services when in need
N Formal
service (%)
Informal
services (%)
Project
Services (%)
Target communes 159 77.4 21.4 1.2
- Female 65 72.3 26.2 1.5
- Male 94 80.8 18.1 1.1
Control commune 28 85.7 3.6 10.7
For the formal credit suppliers, majority of the respondents preferred VBSP to AgriBank. It
was evidenced by 64.2% of the respondents expressed satisfaction with VBSP (Table 52).
According to the villagers’ opinions, although the loan size from VBSP was not as big as
other banks, the procedure was not complicated, and it did not require collateral. Besides, the
schedule of settlement was comfortable for the borrowers. Those were the main reasons why
a larger proportion of the respondents were satisfied with VBSP than the other financial
service providers.
Table 52: Fishers’ satisfaction with formal and informal financial services (N = 187)
Satisfied
(%)
Not satisfied
(%)
No idea
(%)
VBSP 64.2 19.2 16.6
AgriBank 34.2 26.7 39.1
Private financial services 28.3 17.1 54.6
5.4 Fishers’ awareness and access to subsidized credit lines 5.4.1 Describing subsidized credit lines at the study site
Most of the subsidized credit programs at both target and control communes have been
implemented by VBSP through various schemes including credit for the poor, credit for
students, credit for sanitation works, credit for fishing activities investment, and credit for
petroleum and gas. Although these programs have the same interest rates, the loan sizes are
different, with the credit for poor being the biggest with a maximum of VND 20,000,000 per
household, while the credit for education is the smallest in its loan size. These programs have

Baseline Survey Volume 2: Baseline Survey Results for Quang Tri Province
47
been conducted through mass organizations at the locality including the Farmer’s Union and
the Women’s Union who are responsible for advising clients and collecting application forms
to submit to branch of VBSP in the district. Moreover, the mass organizations were in charge
of timely collecting interest from the borrowers within their commune for the bank.
5.4.2 Fishers’ awareness of and access to subsidized credit lines
The survey indicated that more than 70% of the respondents were aware or very aware of
subsidized credit lines, of which the credit for the poor program had been received significant
attention from villagers. Less respondents were aware of the credit programs for investment
in new boats or for oil and gas because these programs were normally integrated into other
development programs such as training on safety at sea regulations or new techniques of
fishing for fishers. These programs were not as regularly offered as other subsidized credit
programs.
Table 53: Fishers’ awareness of subsidized credit line (N=187)
Very aware
(%)
Aware
(%)
Not aware
(%)
Credit for the poor 17.6 59.9 22.5
Credit for student 15.5 63.6 20.9
Credit for sanitation works 4.3 27.8 67.9
Credit for fishing investment 2.1 11.8 86.1
Credit for petroleum 2.2 6.9 90.9
5.5 Potential for saving mobilization
In both target and control communes, almost 70% of the respondents recognized the
importance of savings. It was agreed by the respondents that saving was not only important to
their current production but also for the future. The female respondents were more aware of
the importance of saving than male (Table 54). In recent years, there had been many
constraints in their lives such as the damage caused by natural disasters, the reduction of fish
catch, and the fluctuation of input and output prices. For this reason, savings could help them
to have enough money for investment for production activities.
Table 54: Fishers’ perception of the importance of savings
N Very important
(%)
Important
(%)
Not important
(%)
Target communes 159 71.7 27.7 0.6
- Male 94 69.1 29.8 1.1
- Female 65 75.4 24.6 0.0
Control commune 28 67.9 32.1 0.0
Accordingly, more than 73.6% and 75% of the respondents in target and control communes
respectively expressed their willingness to save. More female fishers (87.69%) were willing
to save than male fishers, reflecting their capacity for managing household finances.
However, there were still about 25% of the respondents in the target and the control
communes who were not willing to save.

Baseline Survey Volume 2: Baseline Survey Results for Quang Tri Province
48
Table 55: Fishers’ willingness to save
N Willing
(%)
Not willing
(%)
Can’t decide
(%)
Target communes 159 73.6 8.8 17.6
- Male 94 63.8 9.6 26.6
- Female 65 87.7 7.7 4.6
Control commune 28 75.0 21.4 3.6
Households in target communes reported the average savings of VND 135,000 per month
against VND 129,000 per month for those in control commune (Table 56). Some fishing
households in the target communes were saving more than VND 2,000,000 per month while
the maximum saving capacity in the control commune was only VND 1,000,000 per month.
Fishing households reported that they were able to save more money than aquaculture
households. The reason for the above was that aquaculture production, particularly shrimp
culture, requires significant investment. Thus, aquaculturists tend to pay more attention to
borrowing rather than saving money.
Table 56: Fishers saving capacity
N N of
HH
making
saving
% of HH
making
saving
Average
amount
per
month
(VND)
Max
amount
per
month
(VND)
Min
amount
per month
(VND)
Target communes 159 107 67.3 134,872 2,000,000 10,000
- e fishing HH 156 105 67.3 65,769 300,000 20,000
- Aquaculture HH 3 2 66.6 75,000 100,000 50,000
Control commune 28 21 75.0 128,611 1,000,000 10,000

III. Proposed RFLP Output Indicators
Based on the baseline survey results, a set of indicators were drafted and discussed at a validation workshop. Those indicators were drafted for
each of the five RFLP outputs together with proposed interventions.
Output 1: Fisheries Co-management
Indicators Baseline (2010) Target (2013) Proposed activities
Fisheries association (FA) established in each target
commune
0 FA 1 FA
(in each target
commune)
Support to establish FAs
FAs allocated with fishing rights 0 FA 3 FAs Supporting in fishing rights allocation
Percentage of fishers who are “very aware” and
“aware” of co-management increased
8.2 % 60 % Training and awareness raising for fisher
community members
Percentage of women who are “very aware” and
“aware” of co-management increased
0 % 50 % Training and involvement of women in co-
management activities and FAs
Government officials understood co-management 33.4 % 100 % Training and awareness raising for
government staff
Percentage of fishers who judge that co-
management contributes to fisheries management
and livelihood improvement increased
8.2 % 50 % Support to the establishment of fisheries co-
management pilots
Support to diversifying livelihoods
Percentage of community members who feel they
are actively contributing to fisheries co-
management increased
76 % 100 % Support to the establishment of fisheries co-
management pilots
Conduct information sharing and awareness
raising campaigns

Baseline Survey Volume 2: Baseline Survey Results for Quang Tri Province
50
Output 2: Safety at Sea and Vulnerability Reduction
Indicators Baseline (2010) Target (2013) Proposed activities
Percentage of fishers who feel they understand
information and regulations on safety at sea
increased
80 % 100 % Training and awareness raising for fishers
Support improved information dissemination
systems
Fisheries management officials understand clearly
about information and regulations on safety at sea
75 % 100 %
Fishers’ confidence in rescuing practices at sea 60.5% 100 % Training and awareness raising for fisher
community members
Provision of some basic safety equipment
Percentage of fishers complying with safety at sea
regulations increased
78 % 100 % Increasing awareness
Redrafting some regulations
Fishers satisfied with the effectiveness of rescue
service operation
60 % 100 % Support the establishment and training of
local rescue groups
Provide training for fisher community
members on sea rescue and avoiding
accidents at sea
Fishers received basic safety at sea training 34.6 % 100 %
Fishers feel confident in avoiding accidents at sea 53.3 % 100 %

Baseline Survey Volume 2: Baseline Survey Results for Quang Tri Province
51
Output 3: Post Harvest and Marketing
Indicators Baseline (2010) Target (2013) Proposed activities
Fish processing units/households trained on food
hygiene and safety
34.6 % 70 % Training and awareness raising on food
hygiene and safety for fish processing
households
Fish processing units/households issued with
quality trademark
0.6 % 20 % Inspecting, monitoring and proposing
indicators for licensing activities
Fishers trained on post-harvest fisheries (this should
focus on large towns and cities and/or boat owners)
34.6 % 50 % Training on on-board post-harvest handling
of aquatic products for fishers
Organizing field visits to exemplary food
safety and hygiene sites
Fishers become skilled at least two post-harvest
methods
14 % 80 %
The percentage of fishers depended on middle
traders reduced
65 % 50 %
Outputs 4 & 5: Livelihood Diversification and Micro-Finance
Indicators Baseline (2010) Target (2013) Proposed activities
Percentage of households having more than two
livelihood activities increased
25.2 % 50 % Support pilot diversified livelihood
activities
Provide training on diversified livelihoods
activities to all stakeholders
Provide support to solve the constraints of
current livelihood activities
Percentage of households satisfied with their
livelihoods increased
20 % 45 %
The percentage of households obtained informal
loans reduced
21.3 % 10 % Facilitate the development of credit
channels for women
Facilitate the establishment of credit
channels for fisher communities
Awareness raising and sharing information
on credit channels activities which are
appropriate to fisher communities
Percentage of women obtained informal loans
reduced
26.2 % 10 %
Percentage of fishers that are aware of credit
channels and credit regulations increased
62.9 % 100 %
Percentage of fishers who judge that accessing
credit is easy increased
48 % 80 %

References Government of Vietnam. (2007). Decision No.137/2007/QĐ-TTg dated 21/8/2007 on
approval of the project on organization of communication systems to prevent and fight
disaster at sea.
Hai An CPC. (2010). Socio-economic development reports. Unpublished government report.
Hai Khe CPC. (2010). Socio-economic development reports. Unpublished government report.
Quang Tri PPC. (2009). The Directive No 07/2009/CT-UBND on 29th
June 2009 to enhance
the boat and fishing management involving many stakeholders.
Quang Tri PPC. (2010). The Decision No 11/2010/QD-UBND on 19th
May 2010 to list and
norm vocations for enterprises and production facilities.
Quang Tri PPC. (2010). The Directive No 08/CT-UBND on 24th
June 2010 to specify the
Central government directive No 808/CT-TTg about the entrustment of restricting damage
due to floods and storms.
Quang Tri DARD. (2010). Annual report on the fishery production sector in Quang Tri
Province.
Quang Tri SDECAFIREP. (2010). Report on fishery sector of the province in 2010.
Unpublished government report.
Trieu Lang CPC. (2010). Socio-economic development reports. Unpublished government
report.
Trieu Van CPC. (2010). Socio-economic development reports. Unpublished government
report.
Vinh Thach CPC. (2010). Socio-economic development reports. Unpublished government
report.
Vinh Thai CPC. (2010). Socio-economic development reports. Unpublished government
report.

Baseline Survey Volume 2: Baseline Survey Results for Quang Tri Province
53
Annex: Summary of Survey Responses
SECTION 1: CO-MANAGEMENT
1.1 To what extent are you aware of the term Fisheries co-management (FCM)?
Target group N Very aware
(%)
Aware
(%)
Not aware
(%)
Target communes 159
Fishers 159 1.3 6.9 91.8
- Male 94 2.1 11.7 86.2
- Female 65 0 0 100
- Inshore fishing HH 156 2.5 20 77.5
- Aquaculture HH 3 0 33.3 66.6
Government staff 12 16.7 16.7 66.7
Control commune 28
Fishers 28 0 7.1 92.9
- Male 19 0 5.3 94.7
- Female 9 0 11.1 88.9
1.2 What do you think about the overall usefulness of FCM in fisheries resources
management?
Target group N Very useful
(%)
Useful (%) Not useful
(%)
No idea
(%)
Target communes 159
Fishers 159 1.3 6.9 0 91.8
- Male 94 2.1 11.7 0 86.2
- Female 65 0 0 0 100
Government staff 12 16.7 16.7 0 66.7
Control commune 28
Fishers 28 0 5.1 0 94.9
- Male 19 0 5.5 0 94.5
- Female 9 0 0 0 100
1.3 What do you think about the overall usefulness of FCM in fisheries livelihoods
improvement?
Target group N Very useful
(%)
Useful (%) Not useful
(%)
No idea
(%)
Target communes 159
Fishers 159 1.3 6.9 0 91.8
- Male 94 2.1 11.7 0 86.2
- Female 65 0 0 0 100
Government staff 12 16.7 16.7 0 66.7
Control commune 28
Fishers 28 0 5.1 0 94.9
- Male 19 0 5.5 0 94.5
- Female 9 0 0 0 100

Baseline Survey Volume 2: Baseline Survey Results for Quang Tri Province
54
1.4 What do you think about the effectiveness of formal fisheries management systems?
N Very effective
(%)
Effective
(%)
Not effective
(%)
No idea
(%)
Target communes 159 45.9 50.2 0 9.8
- Male 95 54.4 45.6 0 0
- Female 64 19.3 67.8 0 12.9
Control commune 28 42.3 33.2 0 11.3
- Male 19 51.2 34.5 0 14.3
- Female 9 18.7 32.1 0 49.2
1.5 What do you think about the effectiveness of informal fisheries management systems?
N Very effective
(%)
Effective
(%)
Not effective
(%)
No idea
(%)
Target communes 159 9.8 18.7 0 71.5
- Male 95 12.3 23.4 0 64.3
- Female 64 2.5 12.6 0 84.9
Control commune 28 0.9 3.2 0 95.9
- Male 19 1.4 3.5 0 95.1
- Female 9 2.3 3.6 0 94.1
1.6 Which members in your family often participate in fisheries management activities?
N Male
(%)
Female
(%)
Both
(%)
None
(%)
Target communes 159 68 30.1 1.9 0
- Male 95 70.2 29.6 0.2 0
- Female 64 66.5 30.1 3.4 0
Control commune 28 64.8 31.8 3.4 0
- Male 19 67.9 29.4 2.7 0
- Female 9 61.2 32.1 6.7 0
1.7 To what extent did you participate in fisheries management activities?
Target group N Actively participate
(%)
Passively participate
(%)
Target communes 159
Fishers 159 76.1 23.9
- Male 94 86.2 13.8
- Female 65 61.5 38.5
Government staff 12 64.7 35.3
Control commune 28
Fishers 28 21.4 78.6
- Male 19 21 79
- Female 9 22.2 77.8
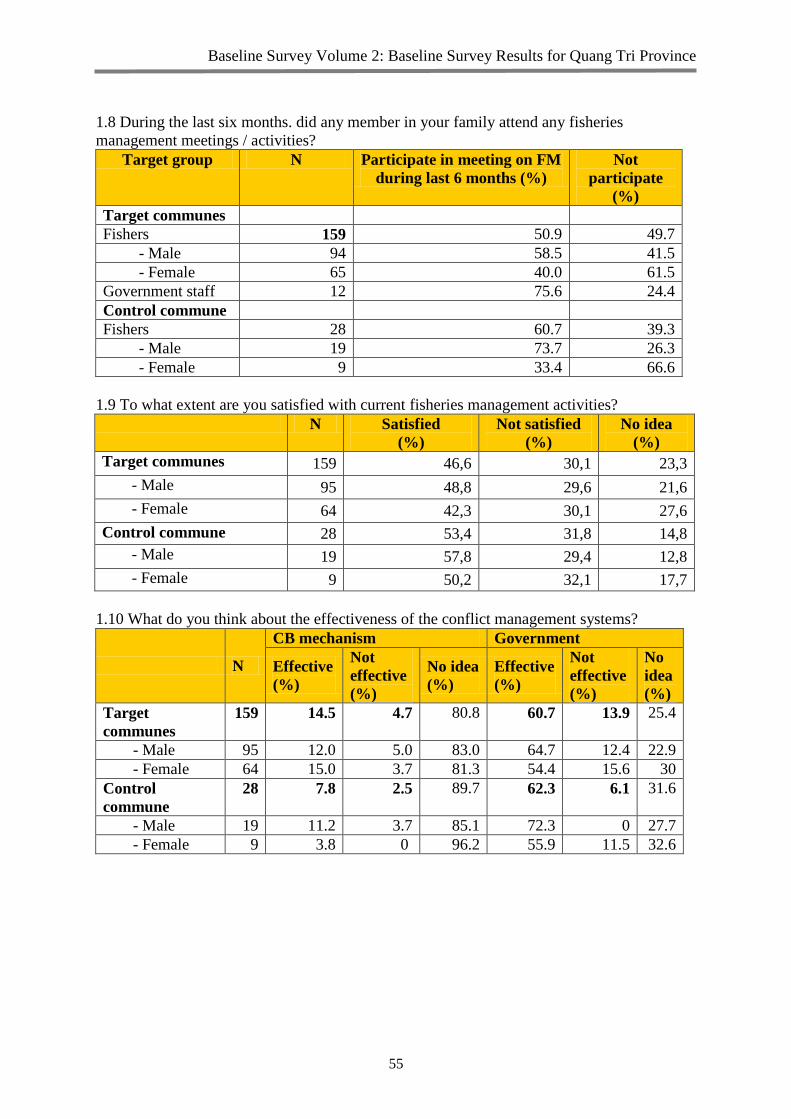
Baseline Survey Volume 2: Baseline Survey Results for Quang Tri Province
55
1.8 During the last six months. did any member in your family attend any fisheries
management meetings / activities?
Target group N Participate in meeting on FM
during last 6 months (%)
Not
participate
(%)
Target communes
Fishers 159 50.9 49.7
- Male 94 58.5 41.5
- Female 65 40.0 61.5
Government staff 12 75.6 24.4
Control commune
Fishers 28 60.7 39.3
- Male 19 73.7 26.3
- Female 9 33.4 66.6
1.9 To what extent are you satisfied with current fisheries management activities?
N Satisfied
(%)
Not satisfied
(%)
No idea
(%)
Target communes 159 46,6 30,1 23,3
- Male 95 48,8 29,6 21,6
- Female 64 42,3 30,1 27,6
Control commune 28 53,4 31,8 14,8
- Male 19 57,8 29,4 12,8
- Female 9 50,2 32,1 17,7
1.10 What do you think about the effectiveness of the conflict management systems?
N
CB mechanism Government
Effective
(%)
Not
effective
(%)
No idea
(%)
Effective
(%)
Not
effective
(%)
No
idea
(%)
Target
communes
159 14.5 4.7 80.8 60.7 13.9 25.4
- Male 95 12.0 5.0 83.0 64.7 12.4 22.9
- Female 64 15.0 3.7 81.3 54.4 15.6 30
Control
commune
28 7.8 2.5 89.7 62.3 6.1 31.6
- Male 19 11.2 3.7 85.1 72.3 0 27.7
- Female 9 3.8 0 96.2 55.9 11.5 32.6

Baseline Survey Volume 2: Baseline Survey Results for Quang Tri Province
56
1.11 What are your opinions about fisheries resources during the last five years?
Target group N Increase
(%)
Decrease
(%)
No change
(%)
No idea
(%)
Target communes
Fishers 159 3.1 94.3 2.5 0
- Male 94 1.1 95.7 3.2 0
- Female 65 6.2 84.6 9.2 0
Resources managers 12 25.8 74.2 0 0
Control commune 28
Fishers 28 0 92.8 2.6 3.6
- Male 19 0 84.2 15.8 0
- Female 9 88.9 0 11.1
1.12 What are your opinions about fisheries resources during the next five years?
Target group N Increase
(%)
Decrease
(%)
No change
(%)
No idea
(%)
Target communes 159
Fishers 159 5.0 78.6 3.1 13.2
- Male 94 5.3 86.2 2.1 6.4
- Female 65 4.6 67.7 4.6 23.1
Resources managers 12 5 95 0 0
Control commune 28
Fishers 28 0 96.5 0 3.5
- Male 19 0 100 0 0
- Female 9 0 88.9 0 11.1
1.12 What do you think about level of the equity in getting benefits from fisheries among
different resource user groups?
N Equitable
(%)
Inequitable
(%)
No idea
(%)
Target commune respondents 159 27.7 66.0 6.3
Control commune respondents 28 53.4 35.7 10.7
1.13a Who have more benefits from fishery resources?
N Poor
(%)
Non-poor (%) The same
(%)
No idea
(%)
Target communes 159 0 35.6 61.2 3.2
- Male 95 0 32.6 67.4 2.1
- Female 64 0 43.2 56.8 4.7
Control commune 28 0 42.1 40.2 17.7
- Male 19 0 43.7 40.7 15.6
- Female 9 0 35.6 42.2 22.2
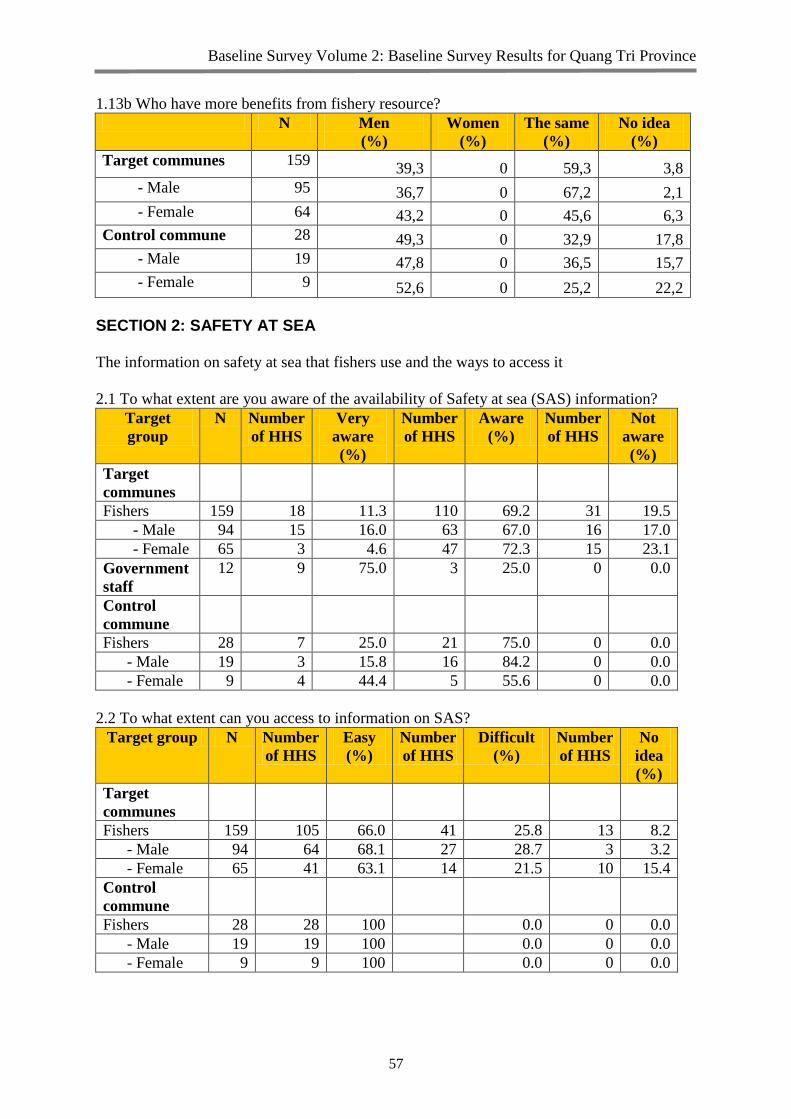
Baseline Survey Volume 2: Baseline Survey Results for Quang Tri Province
57
1.13b Who have more benefits from fishery resource?
N Men
(%)
Women
(%)
The same
(%)
No idea
(%)
Target communes 159 39,3 0 59,3 3,8
- Male 95 36,7 0 67,2 2,1
- Female 64 43,2 0 45,6 6,3
Control commune 28 49,3 0 32,9 17,8
- Male 19 47,8 0 36,5 15,7
- Female 9 52,6 0 25,2 22,2
SECTION 2: SAFETY AT SEA
The information on safety at sea that fishers use and the ways to access it
2.1 To what extent are you aware of the availability of Safety at sea (SAS) information?
Target
group
N Number
of HHS
Very
aware
(%)
Number
of HHS
Aware
(%)
Number
of HHS
Not
aware
(%)
Target
communes
Fishers 159 18 11.3 110 69.2 31 19.5
- Male 94 15 16.0 63 67.0 16 17.0
- Female 65 3 4.6 47 72.3 15 23.1
Government
staff
12 9 75.0 3 25.0 0 0.0
Control
commune
Fishers 28 7 25.0 21 75.0 0 0.0
- Male 19 3 15.8 16 84.2 0 0.0
- Female 9 4 44.4 5 55.6 0 0.0
2.2 To what extent can you access to information on SAS?
Target group N Number
of HHS
Easy
(%)
Number
of HHS
Difficult
(%)
Number
of HHS
No
idea
(%)
Target
communes
Fishers 159 105 66.0 41 25.8 13 8.2
- Male 94 64 68.1 27 28.7 3 3.2
- Female 65 41 63.1 14 21.5 10 15.4
Control
commune
Fishers 28 28 100 0.0 0 0.0
- Male 19 19 100 0.0 0 0.0
- Female 9 9 100 0.0 0 0.0
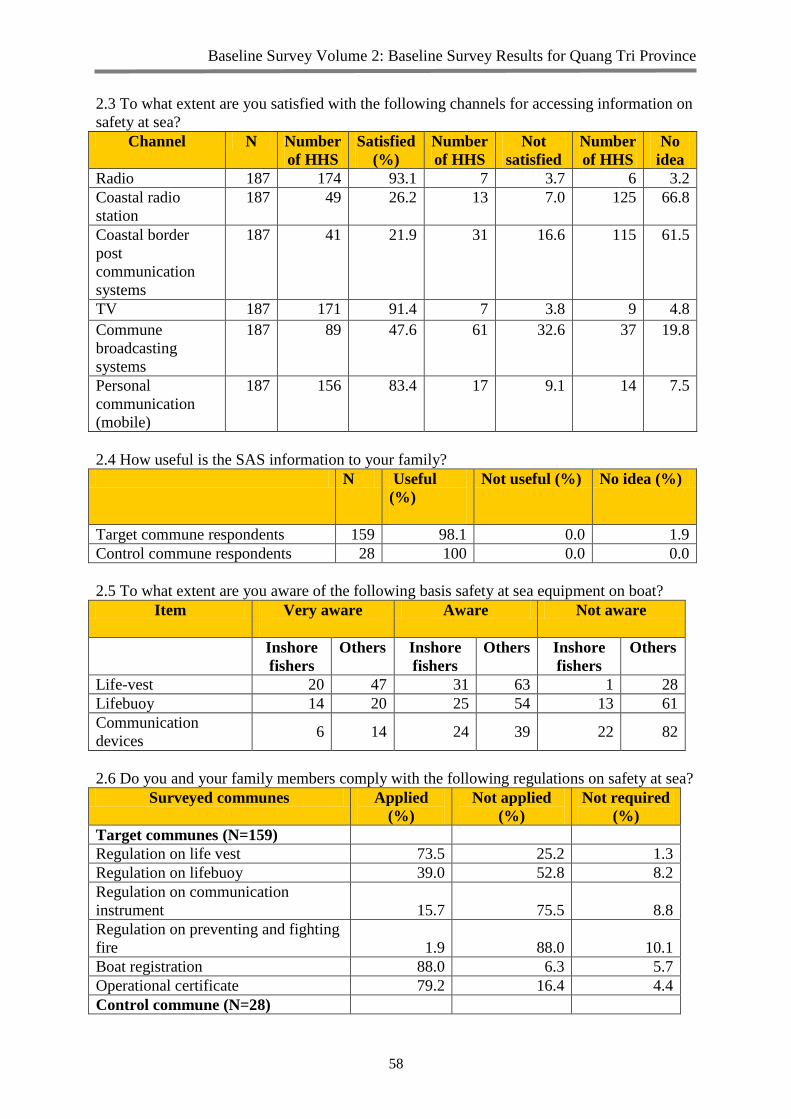
Baseline Survey Volume 2: Baseline Survey Results for Quang Tri Province
58
2.3 To what extent are you satisfied with the following channels for accessing information on
safety at sea?
Channel N Number
of HHS
Satisfied
(%)
Number
of HHS
Not
satisfied
Number
of HHS
No
idea
Radio 187 174 93.1 7 3.7 6 3.2
Coastal radio
station
187 49 26.2 13 7.0 125 66.8
Coastal border
post
communication
systems
187 41 21.9 31 16.6 115 61.5
TV 187 171 91.4 7 3.8 9 4.8
Commune
broadcasting
systems
187 89 47.6 61 32.6 37 19.8
Personal
communication
(mobile)
187 156 83.4 17 9.1 14 7.5
2.4 How useful is the SAS information to your family?
N Useful
(%)
Not useful (%) No idea (%)
Target commune respondents 159 98.1 0.0 1.9
Control commune respondents 28 100 0.0 0.0
2.5 To what extent are you aware of the following basis safety at sea equipment on boat?
Item Very aware
Aware Not aware
Inshore
fishers
Others Inshore
fishers
Others Inshore
fishers
Others
Life-vest 20 47 31 63 1 28
Lifebuoy 14 20 25 54 13 61
Communication
devices 6 14 24 39 22 82
2.6 Do you and your family members comply with the following regulations on safety at sea?
Surveyed communes Applied
(%)
Not applied
(%)
Not required
(%)
Target communes (N=159)
Regulation on life vest 73.5 25.2 1.3
Regulation on lifebuoy 39.0 52.8 8.2
Regulation on communication
instrument 15.7 75.5 8.8
Regulation on preventing and fighting
fire 1.9 88.0 10.1
Boat registration 88.0 6.3 5.7
Operational certificate 79.2 16.4 4.4
Control commune (N=28)

Baseline Survey Volume 2: Baseline Survey Results for Quang Tri Province
59
Regulation on life vest 39.3 57.1 3.6
Regulation on lifebuoy 21.5 71.4 7.1
Regulation on communication
instrument 32.1 64.3 3.6
Regulation on preventing and fighting
fire 3.5 92.9 3.6
Boat registration 89.3 3.6 7.1
Operational certificate 67.9 25.0 7.1
2.7 During the last 12 months, how many inspections were made with your boat(s)?
No Boat by capacity No of
boat
Boat registration Boat inspection
Number % Number %
1 < 20 HP 149 130 87.2 0 0.0
2 20-<50 HP 37 34 92.0 0 0.0
2.8 What do you think about the effectiveness of the systems for responding safety issues and
disasters?
Type of HH N Very
effective
Effective Ineffective No idea
Target communes 159 27.0 30.2 30.8 11.9
- Inshore fishing HHs 156 26.3 30.1 31.4 12.2 - Agricultural HHs 3 66.7 33.3 0.0 0.0 - Female 65 30.7 18.5 29.3 21.5
- Male 94 24.5 38.3 31.9 4.3
Control commune 28 57.1 28.6 14.3 0.0
2.9 Have you or your family members ever been trained in avoiding and dealing with
accidents at sea?
Type of HH N Yes (%) No (%)
Target communes 159 32.1 67.9
- Inshore fishing HHs 156 32.1 67.9 - Agricultural HHs 3 33.3 66.7 - Female 65 44.6 55.4
- Male 94 23.4 76.6
Control commune 28 32.1 67.9
2.10 How confident are you to avoid accidents at sea?
Type of HH N Very confident
(%)
Confident (%) Not confident
(%)
Target communes 159 7.5 48.4 44.0
- Inshore fishing HHs 156 7.7 47.4 44.9 - Agricultural HHs 3 0.0 100 0.0
- Female 65 0.0 47.7 52.3
- Male 94 12.8 48.9 38.3
Control commune 28 21.4 60.7 17.9

Baseline Survey Volume 2: Baseline Survey Results for Quang Tri Province
60
2.11. How confident are you to deal with accidents at sea?
Type of HH N Very confident
(%)
Confident (%) Not confident
(%)
Target communes 159 3.8 51.6 44.6
- Inshore fishing HHs 156 3.8 51.3 44.9
- Agricultural HHs 3 66.7 33.3 0.0
- Female 65 0.0 43.1 56.9
- Male 94 6.4 57.4 36.2
Control commune 28 17.9 67.9 14.2
SECTION 3: POST HARVEST AND MARKETING
Post-harvest skills, knowledge, and practices.
3.1 To what extent are you aware of the following post-harvest methods?
Post harvest
measures
N Very
skillful
(%)
Number
of HHS
Skillful
(%)
Number
of HHS
Not
skillful
(%)
Number
of HHS
Target
commune
159
Using ice 159 57.2 91 38.4 61 4.4 7
Using
chemicals
159 0 0 3.1 5 96.9 154
Using salt 159 17.6 28 64.8 103 17.6 28
Dry 159 15.7 25 67.3 107 16.9 27
Grill 159 0.6 1 1.3 2 98.1 156
Control
commune
28
Using Ice 28 25 7 71.4 20 3.6 1
Using
chemicals
28 0
0
3.6
1
96.4
27
Using salt 28 21.4 6 78. 6 22 0 0
Dry 28 17.8 5 82.1 23 0 0
Grill 28 14.3 4 85.7 24 0 0

Baseline Survey Volume 2: Baseline Survey Results for Quang Tri Province
61
3.2 Have you or your family members attended a training course on post-harvest during the
last three years?
Type of HH N Yes (%) Number of
HHS No (%)
Number of
HHS
Target communes
- Inshore fishing HH 159 34.6 55 65.4 104
- HH having fish
processing 41 100 41 0 0
- Female 65 35.4 23 64.6 42
- Male 94 32.9 31 67.1 63
Control commune 28 64. 3 18 35.7 10
3.3 Availability, status and utilization of post-harvest facilities
Post harvest facilities N Used
(%)
Number
of HHS
Not used
(%)
Number of
HHS
Ice storage 159 0 18 100 159
Transport cages 159 88.7 158 11.3 18
Freezer 159 0.6 159 99.4 158
Fridge 159 0 159 100 159
Oven 159 0 100 159
Control commune 28 28
Ice storage 28 0 1 100 28
Transport cages 28 96.4 27 3.6 1
Freezer 28 3.6 25 96.4 27
Fridge 28 10.7 27 89.3 25
Oven 28 3.6 1 96.4 27
3.4 To whom did you sell your fish / fisheries products last year? Product Fish
proce
ssing
facto
ries
N of
HHS
Middle
traders
N of
HHS
Local
fish
proces
sor
N of
HH
S
Loc
al
mar
ket
N of
HH
S
Oth
er
N of
HHS
No
idea
N
of
H
H
S
Shrimp
1.3 2 28.2 45 0.3 1
24.
9 40 3.1 5 42.1 66
Crab 1.7 3 28.0 45 1.9 3 7.4 12 0.0 0 61.0 96
Green
crab 1.5 2 58.1 92 2.3 4
16.
1 26 0.0 0 22.0 35
Fish
1.6 3 36.7 58 0.9 2
52.
9 83 0.0 0 7.9 13
Squid
1.9 3 44.8 71 0.6 1
16.
2 26 0.0 0 36.5 58
Dried
squid 0.0 0 14.8 24 1.3 2 5.3 9 0.0 0 78.6
12
4
Dried
fish 0.0 0 10.6 17 0.6 1
18.
2 29 2.6 4 67.9
10
8
Grilled 0.0 0 9.4 15 0.0 0 31. 50 1.4 2 57.9 92

Baseline Survey Volume 2: Baseline Survey Results for Quang Tri Province
62
fish 3
Fish
sauce
Fermen
ted fish
3.5 Respondent’s opinion on Degree of dependence of fishers on middle traders
Product N Very
high
N of
HHS
High N of
HHS
Not at
all
N of
HHS
No
idea
N of
HHS
Prawn 159 42.14 59 11.95 7 11.32 9 34.59 84
Crab 159 37.11 86 4.40 26 5.66 15 52.83 32
Green crab 159 54.09 55 16.35 51 9.43 48 20.13 5
Fish 159 34.59 71 32.08 24 30.19 23 3.14 41
Squid 159 44.65 41 15.09 7 14.47 9 25.79 102
Dried squid 159 25.79 40 4.40 15 5.66 16 64.15 88
Dried fish 159 25.16 59 9.43 7 10.06 9 55.35 84
Grilled fish 159 24.53 86 13.21 26 20.13 15 42.14 32
Fish sauce
Mắm
3.6 Where did you sell your fish / fisheries products last year?
Product Provincial
market
N of
HHS
National
market
N of
HHS
International
market
N of
HHS
No
idea
N of
HHS
Shrimp 43.08 68 6.60 10 1.89 3 48.43 77
Crab 30.00 48 2.70 4 0.00 0 67.30 107
Green
crab 50.75 81 11.32 18 0.63 1 37.11 59
Fish 76.16 121 7.61 12 0.50 1 15.72 25
Squid 42.14 67 10.06 16 0.63 1 47.17 75
Dried
squid 18.30 29 1.19 2 0.00 0 80.50 128
Dried
fish 27.67 44 0.63 1 0.00 0 71.70 114
Grilled
fish 38.05 60 0.31 0 0.00 0 61.64 98
Fish
sauce
100 100
Salted
fish
100 100
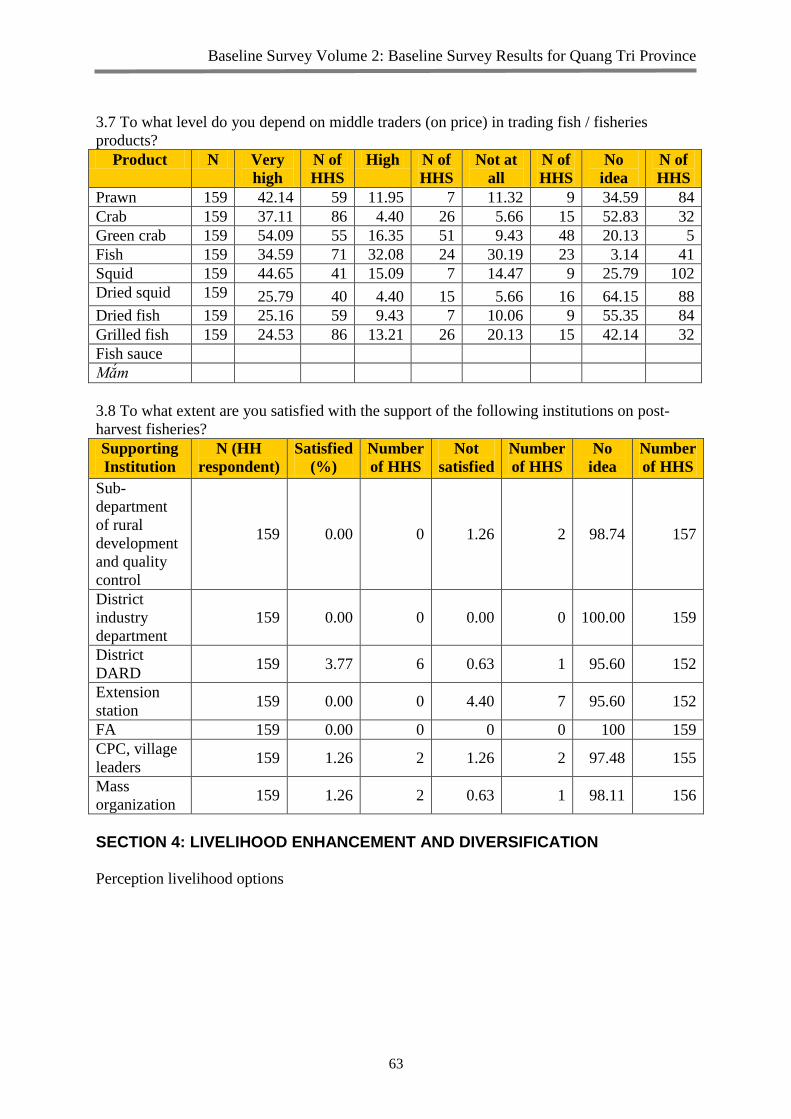
Baseline Survey Volume 2: Baseline Survey Results for Quang Tri Province
63
3.7 To what level do you depend on middle traders (on price) in trading fish / fisheries
products?
Product N Very
high
N of
HHS
High N of
HHS
Not at
all
N of
HHS
No
idea
N of
HHS
Prawn 159 42.14 59 11.95 7 11.32 9 34.59 84
Crab 159 37.11 86 4.40 26 5.66 15 52.83 32
Green crab 159 54.09 55 16.35 51 9.43 48 20.13 5
Fish 159 34.59 71 32.08 24 30.19 23 3.14 41
Squid 159 44.65 41 15.09 7 14.47 9 25.79 102
Dried squid 159 25.79 40 4.40 15 5.66 16 64.15 88
Dried fish 159 25.16 59 9.43 7 10.06 9 55.35 84
Grilled fish 159 24.53 86 13.21 26 20.13 15 42.14 32
Fish sauce
Mắm
3.8 To what extent are you satisfied with the support of the following institutions on post-
harvest fisheries?
Supporting
Institution
N (HH
respondent)
Satisfied
(%)
Number
of HHS
Not
satisfied
Number
of HHS
No
idea
Number
of HHS
Sub-
department
of rural
development
and quality
control
159 0.00 0 1.26 2 98.74 157
District
industry
department
159 0.00 0 0.00 0 100.00 159
District
DARD 159 3.77 6 0.63 1 95.60 152
Extension
station 159 0.00 0 4.40 7 95.60 152
FA 159 0.00 0 0 0 100 159
CPC, village
leaders 159 1.26 2 1.26 2 97.48 155
Mass
organization 159 1.26 2 0.63 1 98.11 156
SECTION 4: LIVELIHOOD ENHANCEMENT AND DIVERSIFICATION
Perception livelihood options

Baseline Survey Volume 2: Baseline Survey Results for Quang Tri Province
64
4.1 What do you think about the livelihood opportunities for fishing communities compared
to five years ago?
N Better
(%)
Same (%) Worse
(%)
No idea
(%)
Target communes 159 10.7 13.2 75.8 0.6
- Female 65 0 10.8 87.7 1.5
- Male 94 18.1 14.9 67.0 1.1
Inshore fishing HH 156 10.3 13.5 76.3 0.6
Other 3 33.3 0 66.7 0
Control commune 28 7.1 0 92.9 0
4.2 Can you give an approximate income amount for the following livelihood activities in
2009?
Indicator
Average
income per
HH
Average
income
per capita
Average
income
from fishing
Average
income from
fish
processing
Average
income from
other
activities
Target
communes
N 159 872 144 13 143
Mean 18,789,940 3,426,147 11,864,580 4,469,231 8,944,755
Inshore
fishing HH N 156 856 137 13 136
Mean 18,619,230 3,393,224 12,083,940 4,469,231 8,757,353
Other HH N 3 16 3 1 1
Mean 17,000,000 3,187,500 10,333,330 5,000,000 5,000,000
Control
commune N 28 137 28 2 26
Mean 13,510,710 2,761,314 8,964,286 5,500,000 4,896,154
4.3 To what extent are you satisfied with your family current livelihoods?
N Satisfied
(%)
Not satisfied
(%)
No idea (%)
Target communes 159 19.5 76.7 3.8
- Female 65 23.1 72.3 4.6
- Male 94 17.0 79.8 3.2
Inshore fishing HH 156 20.5 75.6 3.9
Other 3 0 100 0
Control commune 28 7.1 85.7 7.1
4.4 Do you want to diversify your family livelihoods?
N Intended to
change %)
Not-intended to
change (%)
No idea
(%)
Target communes 159 94.3 3.8 1.9
- Female 65 95.4 3.1 1.5
- Male 94 93.6 4.3 2.1
Inshore fishing HH 156 94.2 3.9 1.9
Other 3 100 0 0
HH having processing 0 0 0 0
Control commune 28 96.6 0 3.5

Baseline Survey Volume 2: Baseline Survey Results for Quang Tri Province
65
4.5 To what extent are you aware of the supporting services for livelihood enhancement and
diversification?
N Very aware
(%)
Aware (%) Not aware
(%)
Target communes 159 0 100 0
- Female 65 0 100 0
- Male 94 0 100 0
Inshore fishing HH 156 0 100 0
HH having processing 0 0 0 0
Other 3 0 100 0
Control commune 28 3.57 46.43 50
4.6 To what extent can you access to the following supporting services for livelihood
enhancement and diversification?
Supporting services N (HH
respondent)
Easy
(%)
Difficult
(%)
Not at all
(%)
No idea
(%)
Target communes
Loan 159 53.5 25.8 8.8 12.0
Technical assistance 159 37.7 5.7 27.0 29.6
Marketing 159 41.5 15.7 15.1 27.7
Input supply 159 47.2 12.6 22 18.2
Control commune 28
Loan 28 46.4 46.4 7.1 0
Technical assistance 28 42.9 10.7 46.4 0
Marketing 28 64.3 14.3 17.9 3.6
Input supply 28 46.4 32.1 17.9 3.6
4.7 To what extent are you satisfied with the quality and cost of the following supporting
services for livelihood enhancement and diversification?
Supporting services N (HH
respondent)
Satisfied (%) Not satisfied
(%)
No idea (%)
Target communes
Loan 159 35.9 34 30.1
Technical assistance 159 31.5 18.9 49.7
Marketing 159 20.1 38.4 41.5
Input supply 159 37.1 17.6 45.3
Control commune
Loan 28 42.9 46.4 10.7
Technical assistance 28 46.4 32.1 21.4
Marketing 28 32.1 50.0 17.9
Input supply 28 21.4 71.4 7.1
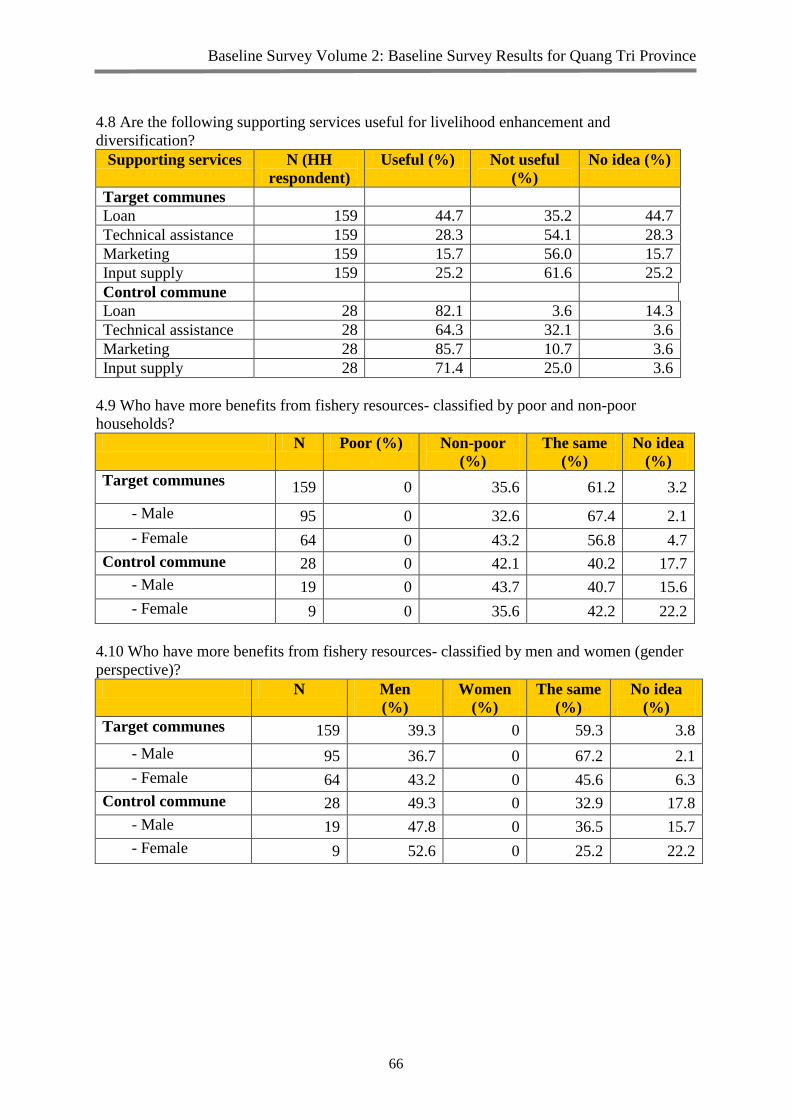
Baseline Survey Volume 2: Baseline Survey Results for Quang Tri Province
66
4.8 Are the following supporting services useful for livelihood enhancement and
diversification?
Supporting services N (HH
respondent)
Useful (%) Not useful
(%)
No idea (%)
Target communes
Loan 159 44.7 35.2 44.7
Technical assistance 159 28.3 54.1 28.3
Marketing 159 15.7 56.0 15.7
Input supply 159 25.2 61.6 25.2
Control commune
Loan 28 82.1 3.6 14.3
Technical assistance 28 64.3 32.1 3.6
Marketing 28 85.7 10.7 3.6
Input supply 28 71.4 25.0 3.6
4.9 Who have more benefits from fishery resources- classified by poor and non-poor
households?
N Poor (%) Non-poor
(%)
The same
(%)
No idea
(%)
Target communes 159 0 35.6 61.2 3.2
- Male 95 0 32.6 67.4 2.1
- Female 64 0 43.2 56.8 4.7
Control commune 28 0 42.1 40.2 17.7
- Male 19 0 43.7 40.7 15.6
- Female 9 0 35.6 42.2 22.2
4.10 Who have more benefits from fishery resources- classified by men and women (gender
perspective)?
N Men
(%)
Women
(%)
The same
(%)
No idea
(%)
Target communes 159 39.3 0 59.3 3.8
- Male 95 36.7 0 67.2 2.1
- Female 64 43.2 0 45.6 6.3
Control commune 28 49.3 0 32.9 17.8
- Male 19 47.8 0 36.5 15.7
- Female 9 52.6 0 25.2 22.2
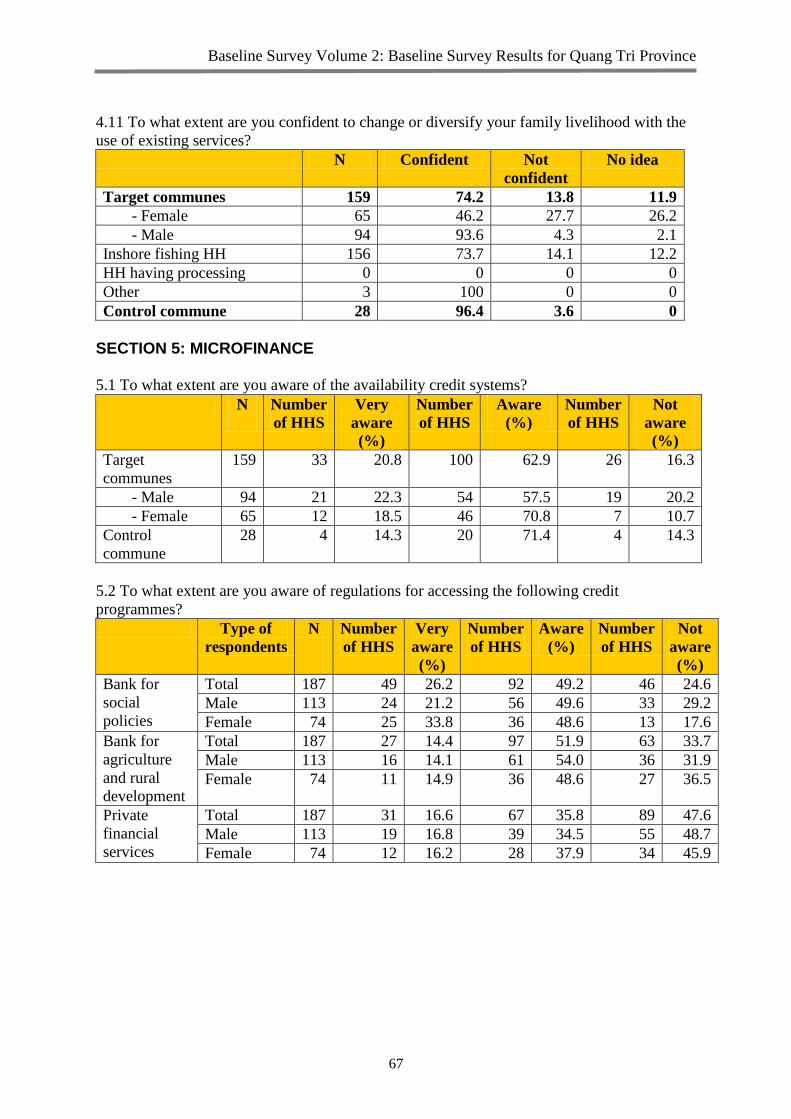
Baseline Survey Volume 2: Baseline Survey Results for Quang Tri Province
67
4.11 To what extent are you confident to change or diversify your family livelihood with the
use of existing services?
N Confident Not
confident
No idea
Target communes 159 74.2 13.8 11.9
- Female 65 46.2 27.7 26.2
- Male 94 93.6 4.3 2.1
Inshore fishing HH 156 73.7 14.1 12.2
HH having processing 0 0 0 0
Other 3 100 0 0
Control commune 28 96.4 3.6 0
SECTION 5: MICROFINANCE
5.1 To what extent are you aware of the availability credit systems?
N
Number
of HHS
Very
aware
(%)
Number
of HHS
Aware
(%)
Number
of HHS
Not
aware
(%)
Target
communes
159 33 20.8 100 62.9 26 16.3
- Male 94 21 22.3 54 57.5 19 20.2
- Female 65 12 18.5 46 70.8 7 10.7
Control
commune
28 4 14.3 20 71.4 4 14.3
5.2 To what extent are you aware of regulations for accessing the following credit
programmes?
Type of
respondents
N Number
of HHS
Very
aware
(%)
Number
of HHS
Aware
(%)
Number
of HHS
Not
aware
(%)
Bank for
social
policies
Total 187 49 26.2 92 49.2 46 24.6
Male 113 24 21.2 56 49.6 33 29.2
Female 74 25 33.8 36 48.6 13 17.6
Bank for
agriculture
and rural
development
Total 187 27 14.4 97 51.9 63 33.7
Male 113 16 14.1 61 54.0 36 31.9
Female 74 11 14.9 36 48.6 27 36.5
Private
financial
services
Total 187 31 16.6 67 35.8 89 47.6
Male 113 19 16.8 39 34.5 55 48.7
Female 74 12 16.2 28 37.9 34 45.9
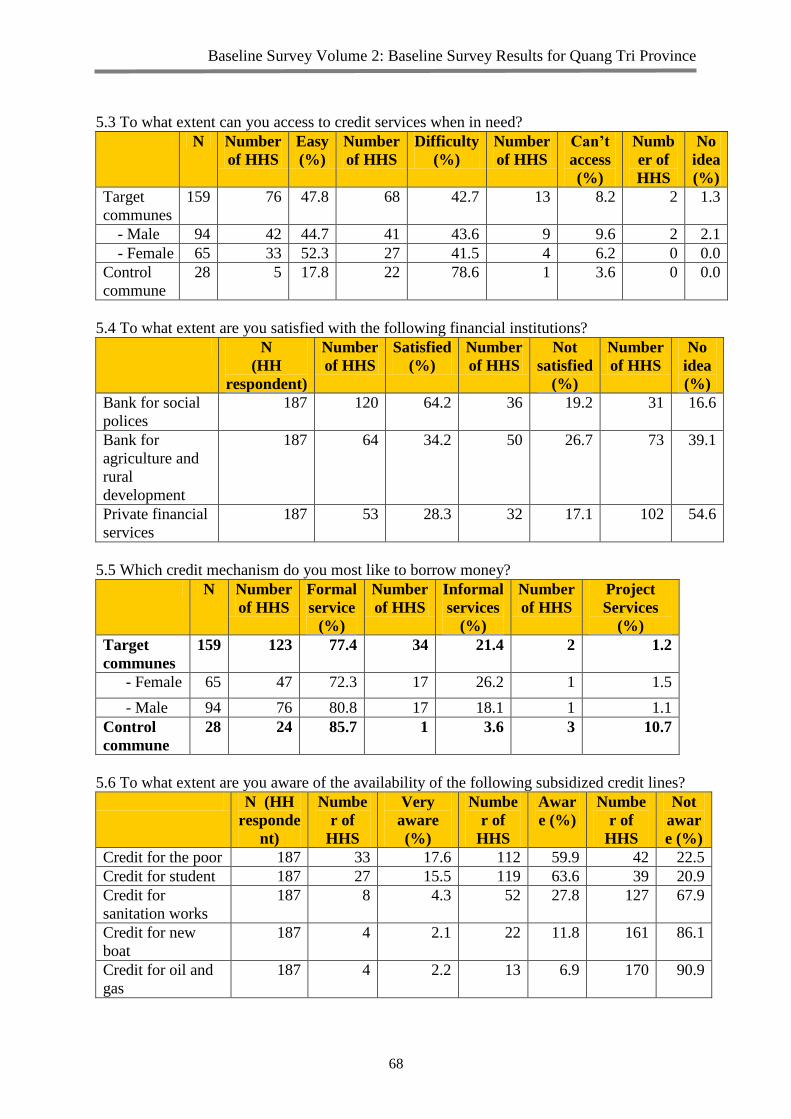
Baseline Survey Volume 2: Baseline Survey Results for Quang Tri Province
68
5.3 To what extent can you access to credit services when in need?
N Number
of HHS
Easy
(%)
Number
of HHS
Difficulty
(%)
Number
of HHS
Can’t
access
(%)
Numb
er of
HHS
No
idea
(%)
Target
communes
159 76 47.8 68 42.7 13 8.2 2 1.3
- Male 94 42 44.7 41 43.6 9 9.6 2 2.1
- Female 65 33 52.3 27 41.5 4 6.2 0 0.0
Control
commune
28 5 17.8 22 78.6 1 3.6 0 0.0
5.4 To what extent are you satisfied with the following financial institutions?
N
(HH
respondent)
Number
of HHS
Satisfied
(%)
Number
of HHS
Not
satisfied
(%)
Number
of HHS
No
idea
(%)
Bank for social
polices
187 120 64.2 36 19.2 31 16.6
Bank for
agriculture and
rural
development
187 64 34.2 50 26.7 73 39.1
Private financial
services
187 53 28.3 32 17.1 102 54.6
5.5 Which credit mechanism do you most like to borrow money?
N Number
of HHS
Formal
service
(%)
Number
of HHS
Informal
services
(%)
Number
of HHS
Project
Services
(%)
Target
communes
159
123 77.4 34 21.4 2 1.2
- Female 65 47 72.3 17 26.2 1 1.5
- Male 94 76 80.8 17 18.1 1 1.1
Control
commune
28 24 85.7 1 3.6 3 10.7
5.6 To what extent are you aware of the availability of the following subsidized credit lines?
N (HH
responde
nt)
Numbe
r of
HHS
Very
aware
(%)
Numbe
r of
HHS
Awar
e (%)
Numbe
r of
HHS
Not
awar
e (%)
Credit for the poor 187 33 17.6 112 59.9 42 22.5
Credit for student 187 27 15.5 119 63.6 39 20.9
Credit for
sanitation works
187 8 4.3 52 27.8 127 67.9
Credit for new
boat
187 4 2.1 22 11.8 161 86.1
Credit for oil and
gas
187 4 2.2 13 6.9 170 90.9

Baseline Survey Volume 2: Baseline Survey Results for Quang Tri Province
69
5.7 During the last five years, which of the following financial services did you borrow
money?
No of HH accessed to
financial services
Average
amount
Max
amount
Min
amount
No of HH %
Bank for social
polices
104 55.61 9,520,000 50,000,000 1,000,000
Bank for agriculture
and rural
development
38 20.32 3,270,000 50,000,000 3,000,000
Private financial
services
62 33.16 6,480,000 100,000,000 2,000,000
5.8 Are you eligible to get loan from any above subsidized credit lines?
N Number
of HHS
Eligible
(%)
Number
of HHS
Not
eligible
(%)
Number
of HHS
Not
know
(%)
Target
communes
respondents
159 75 47.2 79 49.7 5 3.2
Control
commune
respondents
28 7 25 21 75.0 0 0
5.9 Have you ever borrowed money from any of following subsidized credit lines during the
last three years?
N Number
of HHS
% accessed
Target communes respondents 159 72 45.3
Control commune respondents 28 6 21.4
5.10 In your opinion, how important is it for saving?
N Number
of HHS
Very
important
(%)
Number
of HHS
Important
(%)
Number
of HHS
Not
important
(%)
Target
communes
159 114 71.7 44 27.7 1 0.6
- Male 94 65 69.1 28 29.8 1 1.1
- Female 65 49 75.4 16 24.6 0 0
Control
commune
28 19 67.9 9 32.1 0 0

Baseline Survey Volume 2: Baseline Survey Results for Quang Tri Province
70
5.11 If there is a reliable and convenient financial organization for you to deposit your
savings, are you willing to make saving?
N Number
of HHS
Willing
(%)
Number
of HHS
Not
willing
(%)
Number
of HHS
Can’t
decide
(%)
Target
communes
159 117 73.6 14 8.8 28 17.6
- Male 94 60 63.8 9 9.6 25 26.6
- Female 65 57 87.7 5 7.7 3 4.6
Control
commune
28 21 75.0 6 21.4 1 3.6
5.12 How much can your family mobilize for saving per month?
N No of
HH
making
saving
(%)
Average
amount
per
month
(VND)
Max
amount
per
month
(VND)
Min
amount
per month
(VND)
Target communes 159 107 67.3 134,872 2,000,000 10,000
- Inshore fishing HH 156 105 67.3 65,769 300,000 20,000
- Aquaculture HH 3 2 66.6 75,000 100,000 50,000
control commune 28 21 75.0 128,611 1,000,000 10,000