Embed Size (px)
Citation preview
Regiona l In te r-annua l Wind Speed and Wind Production Variab ility ac ros s Canada
Milena Dimitrijevic 31 May 2012
CMOS 2012 Congress / AMS 21st NWP and 25th WAF Conferences
Experts in renewable energy
Onshore & Offshore Wind Wave & Tidal Solar PV & CSP
The world’s largest renewable energy consultancy
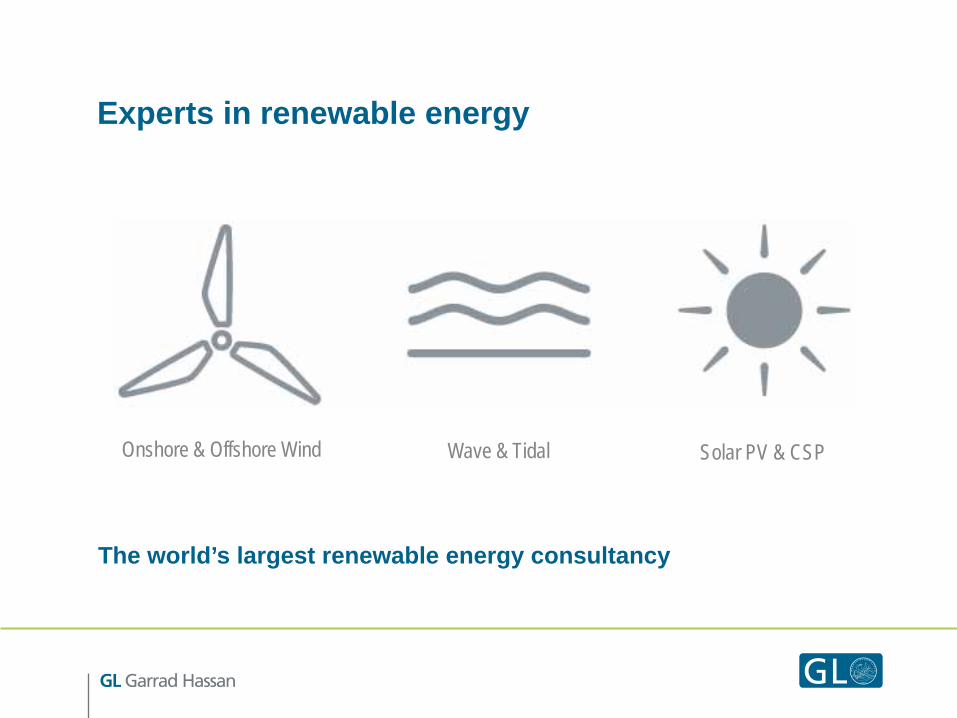
Geographical reach Almost 1000 staff, in 42 locations, across 24 countries
Heerenveen Sint Maarten Kaiser-Wilhelm- Koog
Vancouver Ottawa
Portland San Diego
Montreal Peterborough
Austin Querétaro
Porto Alegre Santiago
Bristol Cork
Beijing Seoul Tokyo Shanghai Mumbai Bangalore Newcastle Melbourne Wellington
Paris
Izmir Cairo
Copenhagen Hinnerup Oldenburg Hamburg Warsaw
Lisbon Barcelona Zaragoza Madrid
Imola
London
Slough
Glasgow
Cape Town
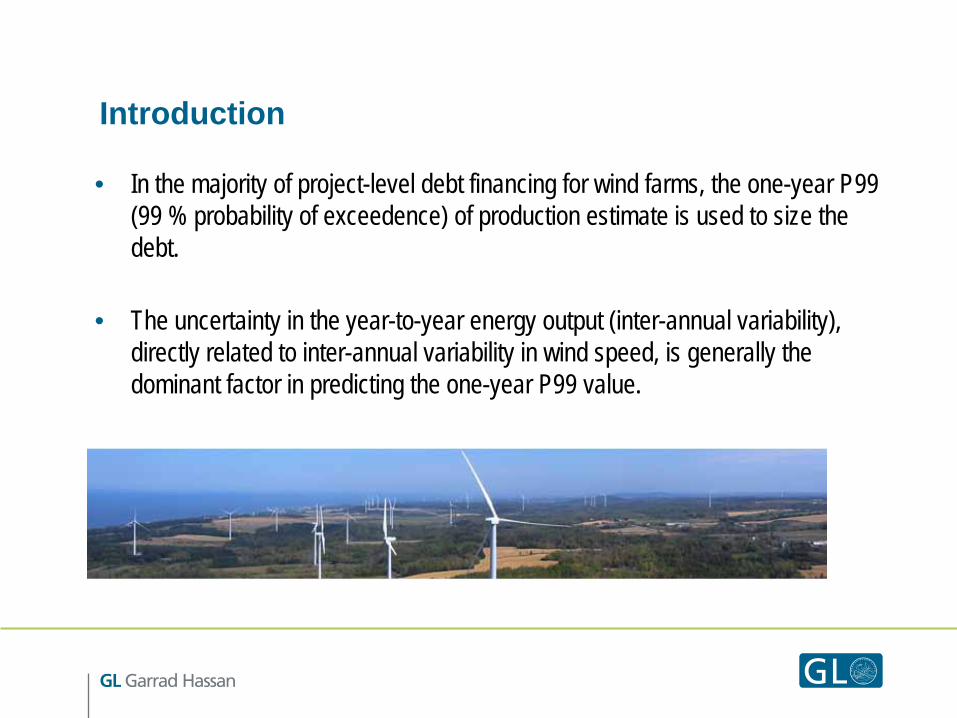
Introduction • In the majority of project-level debt financing for wind farms, the one-year P99
(99 % probability of exceedence) of production estimate is used to size the debt.
• The uncertainty in the year-to-year energy output (inter-annual variability),
directly related to inter-annual variability in wind speed, is generally the dominant factor in predicting the one-year P99 value.
IAV definition • Inter-annual variability (IAV) is variation in energy production from one year to
another.
• It is defined as standard deviation of annual energy divided by overall mean value.
• This is then used to evaluate the uncertainty in wind farm production estimates (known as P90, P95 and P99 values of exceedance levels from P50 base case).
• Although all these P-values are important, P99 is usually used to size the debt. • Generally, IAV is the most dominant factor in predicting one-year P99 value.
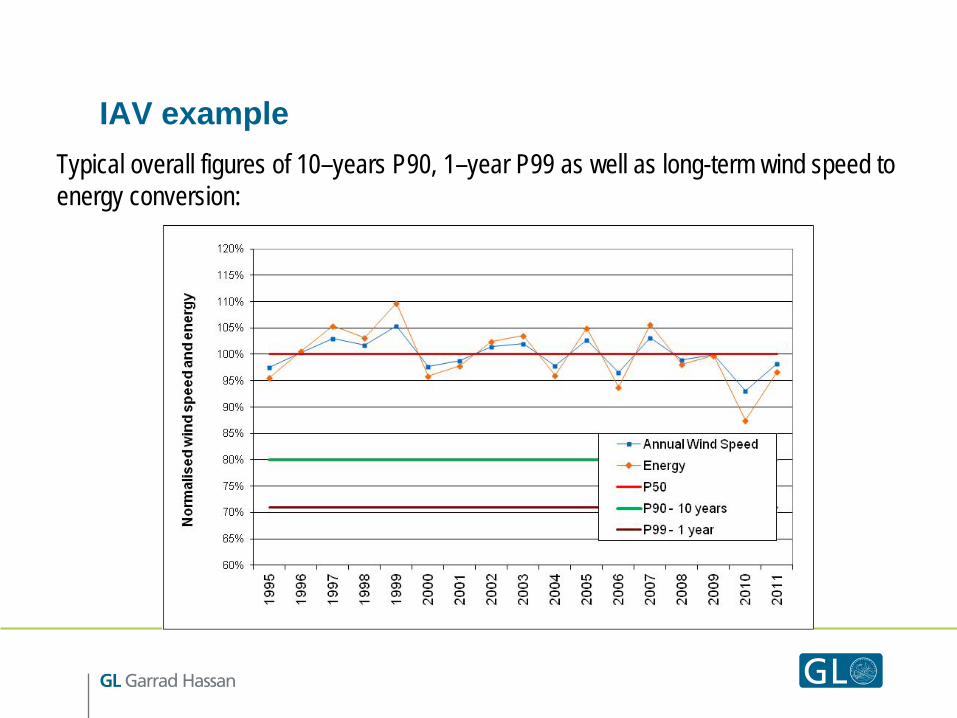
IAV example Typical overall figures of 10–years P90, 1–year P99 as well as long-term wind speed to energy conversion:
Objectives of the presentation • The main objective of the presentation is to examine current approaches in
evaluating the IAV in energy production, its main sources, magnitude and geographic variation.
• Among the factors influencing IAV in energy production, the most important is IAV in wind speed; in absence of sufficiently long measurements at project sites, long-term reference stations are used in evaluation of IAV in wind speeds.
• For comparison purposes, other possible alternatives, such as re-analysis data, are investigated.
• Other sources of IAV in energy production will also be listed and quantified based on data from operating wind farms.
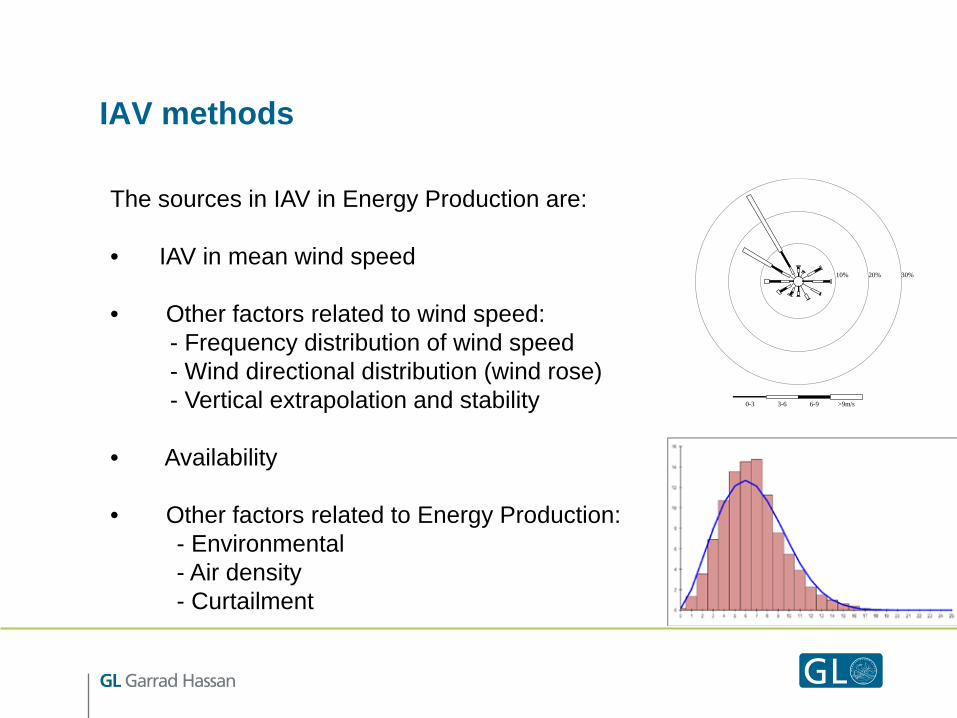
IAV methods The sources in IAV in Energy Production are: • IAV in mean wind speed
• Other factors related to wind speed: - Frequency distribution of wind speed - Wind directional distribution (wind rose) - Vertical extrapolation and stability • Availability
• Other factors related to Energy Production: - Environmental - Air density - Curtailment
30%20%10%
0-3 3-6 6-9 >9m/s
IAV in Wind speed methods
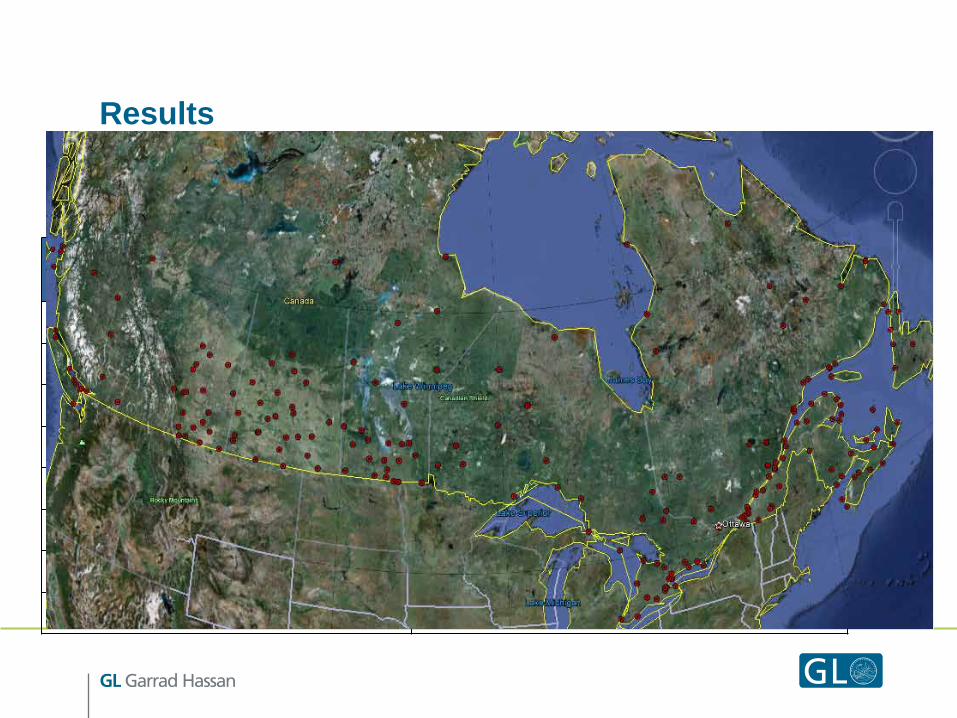
• The main source of IAV in Energy production is IAV in wind speed. Environment Canada station data are used with the following criteria for selecting periods in evaluation of inter-annual variability of wind:
-Monthly recovery rate greater than 90% -At least 10 years of available data, starting 1995 -Less than 2 % change in cumulative IAV when adding additional year -220 stations used at the end -Re-analysis data sets are evaluated for comparison purposes but not
integrated into map • Other sources of IAV in Energy production are evaluated based on data from
operational wind farms.
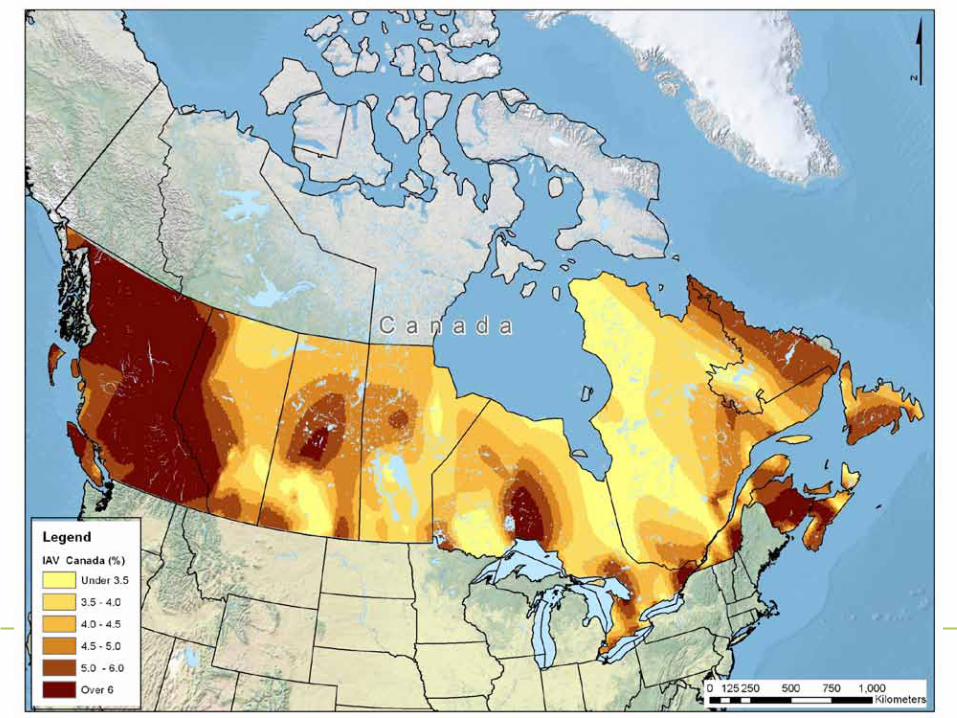
Results .
Results
• Generally, approx. 10-15 years of measurements are available, though 30 years are necessary for proper climatological period representation
• Geographic distribution of measurement points is non-uniform and some
regions do not possess a sufficient number of long-term stations • Most Environment Canada stations have measurements at low height of 10 m • Re-analysis data sets show lower IAV numbers compared with IAV calculated
based on Environment Canada station data • Uncertainty exists whether future wind variability will remain the same as that
observed historically .
Results
• Generally, approx. 10-15 years of measurements are available, though 30 years are necessary for proper climatological period representation
Province Number of Stations considered
Alberta 37 (21)
British Columbia 29 (21)
Manitoba 32 (26)
Ontario 55 (39)
Quebec 61 (52)
Saskatchewan 31 (26)
Atlantic 42 (29)
Total 287
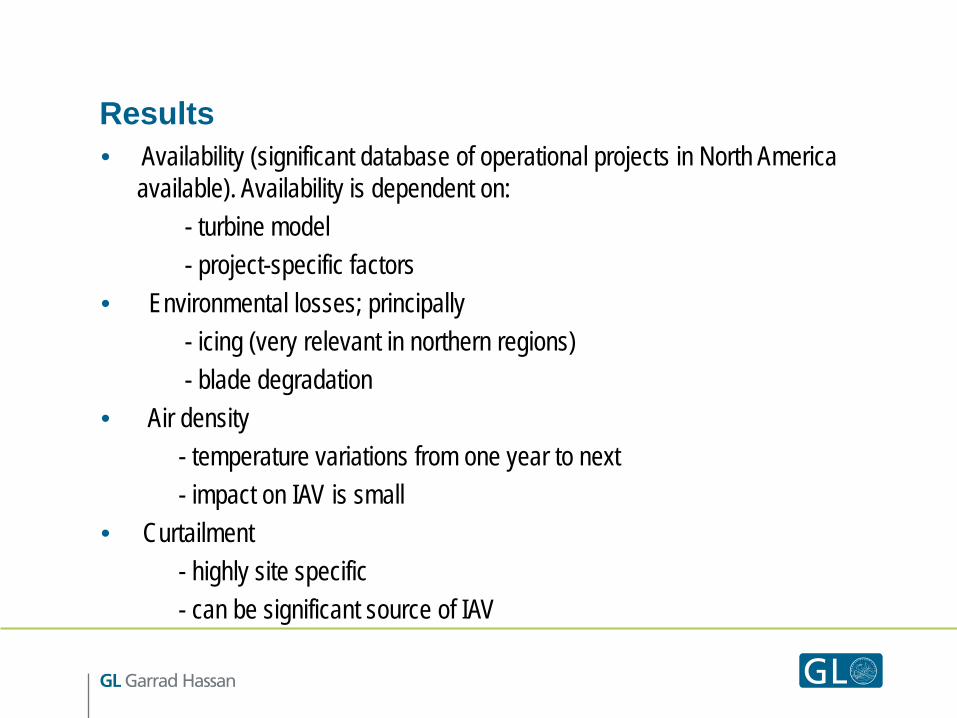
Results • Availability (significant database of operational projects in North America
available). Availability is dependent on: - turbine model - project-specific factors • Environmental losses; principally - icing (very relevant in northern regions) - blade degradation • Air density - temperature variations from one year to next - impact on IAV is small • Curtailment - highly site specific - can be significant source of IAV
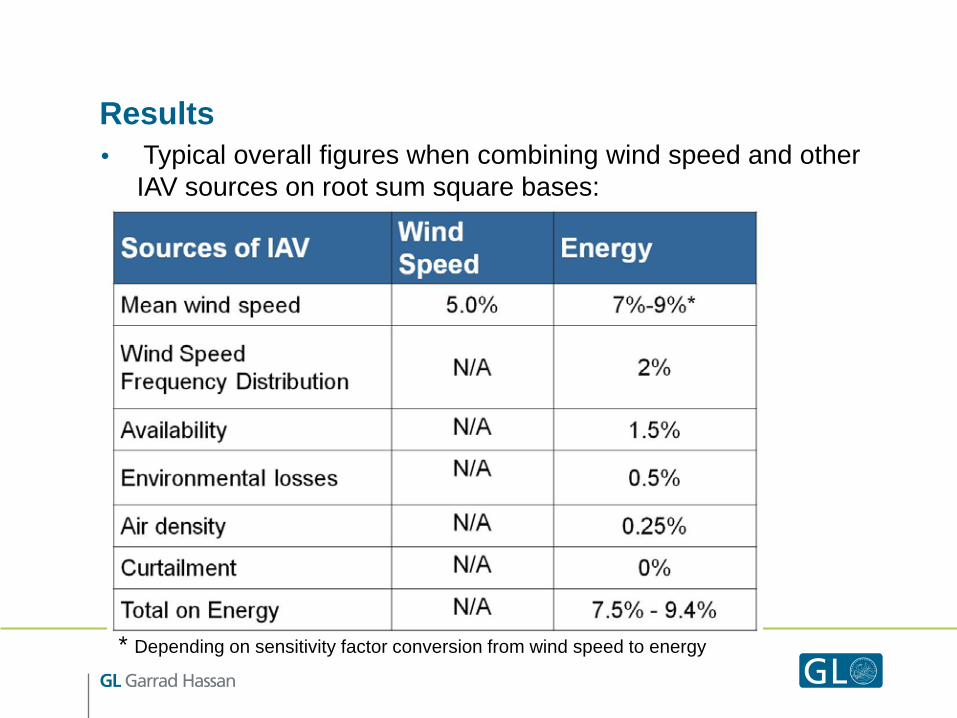
Results • Typical overall figures when combining wind speed and other
IAV sources on root sum square bases:
* Depending on sensitivity factor conversion from wind speed to energy
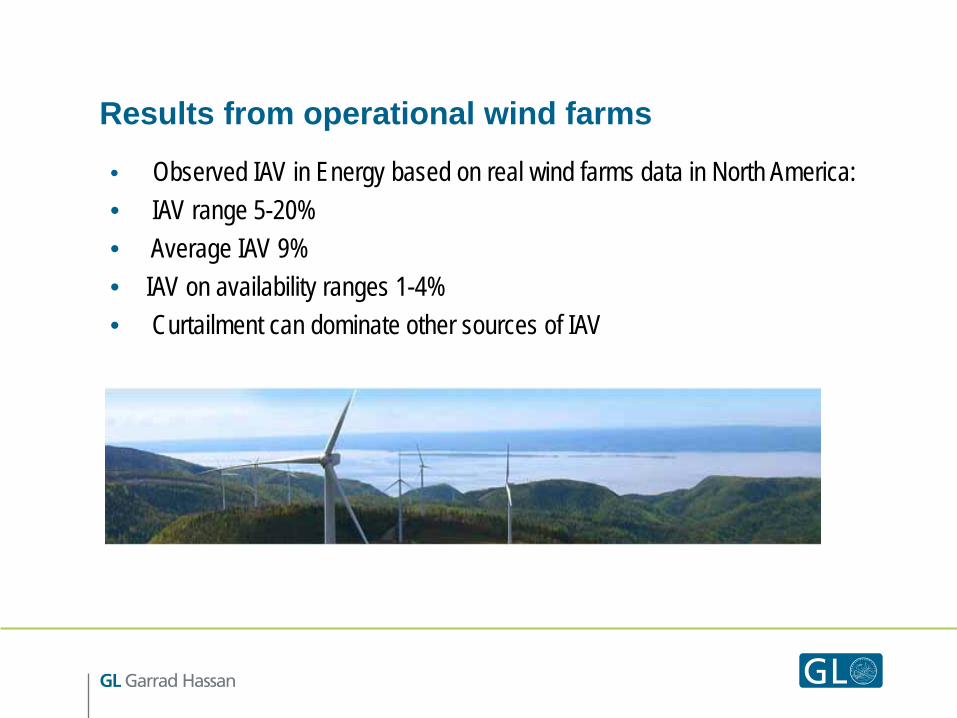
Results from operational wind farms
• Observed IAV in Energy based on real wind farms data in North America: • IAV range 5-20% • Average IAV 9% • IAV on availability ranges 1-4% • Curtailment can dominate other sources of IAV .
Conclusion • The main factor influencing the value of one-year P99 is inter-annual variability
in energy production • The major contributor to the IAV in Energy production is IAV in wind speed;
more data from tall towers needed for better evaluation; however other contributors should not be neglected
• IAV based on data from operating wind farms in North America suggests that Energy IAV is:
- site specific - availability is influenced by turbine model and type - curtailment may be dominant factor in some cases

Thank you
www.gl-garradhassan.com
![An Open-Access Web-Based Tool to Access Global, Hourly ... · practical global wind power availability [50,51], inter-annual wind power production variability [42], and wind variability](https://img.pdfslide.net/doc/110x75/60456687923b036b1f3b92b0/an-open-access-web-based-tool-to-access-global-hourly-practical-global-wind.jpg)


![Effects of Wind Turbine Generators on Inter-Area ...€¦ · and implemented in PST [18] is used in this work. The model can represent up to an entire wind power plant and has been](https://img.pdfslide.net/doc/110x75/5f55659c676e891d48309e9d/effects-of-wind-turbine-generators-on-inter-area-and-implemented-in-pst-18.jpg)