Embed Size (px)
Citation preview
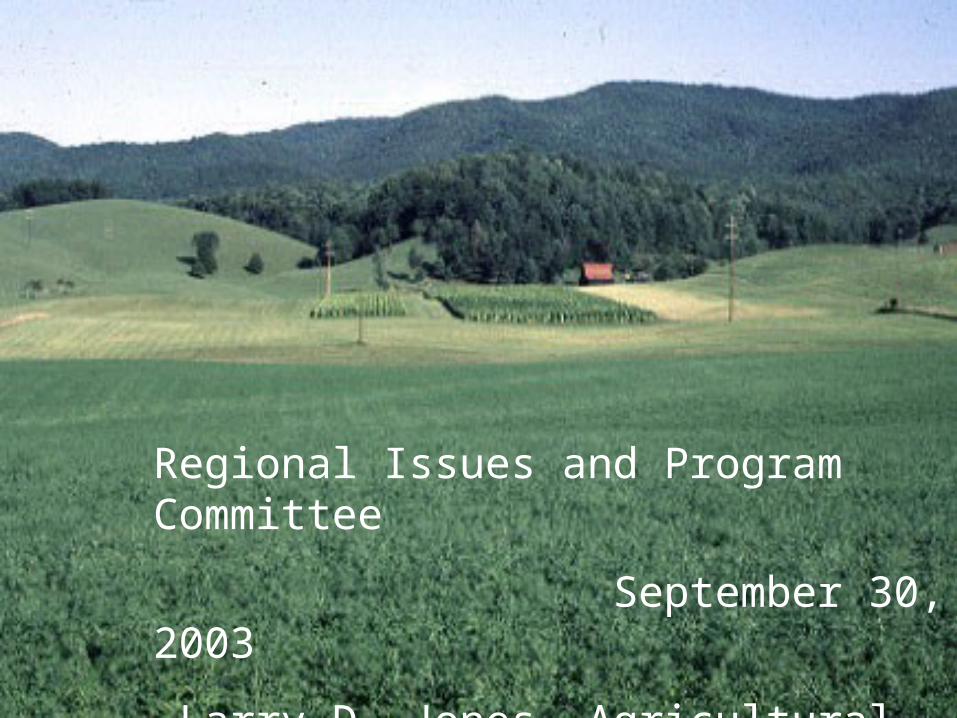
Regional Issues and Program Committee
September 30, 2003
Larry D. Jones, Agricultural Economics

Farm Numbers, Kentucky1940-2001
88
267
0
50
100
150
200
250
300
1940
1945
1950
1955
1960
1965
1970
1975
1980
1985
1990
1995
2001
2002
Thousands
Year
Farm Numbers
Source: Ky Ag. Statistics

WHAT IS A FARM?

What is a Farm?• Government says that a farm is a
business that has $1000 gross sales of food and fiber per year
• OR
• Could sell $1000 annually

Farm Cash Receipts—Kentucky1991-2002
0
500
1000
1500
2000
2500
3000
3500
4000
Source: KY Agricultural Statistics
Millions $
Total
Livestock
Crops

Kentucky Crop Receipts, 2002 ($1.15 Billion)
443
555
6583
5 Tobacco
Row Crops
Hay
Hort
Other
Millions $Source: KY Ag. Statistics

Kentucky Livestock Receipts, 2002($1.96 Billion)
406
506
20974
760
Cattle/CalvesPoultryDairy ProductsHogsHorses/Mules
Source: KY Ag Statistics
Millions $

D istribution of K Y Farm C ash R eceipts-1991 and 2002
15%
26%
2%24%
8%
15%
10%
H orses
T obacco
P oultry
B eef
D airy
R ow C rops
O ther
2 4 %
1 4 %
1 6 %
1 3%
7 %
1 8%
8 %
1991 = $3 .2 B illion 2002 = $3 .11 B illion


Net Cash Returns from Ag. SalesKY and U.S. Avg. Per Farm
8270
12660
9055
15801
11909
22260
0
5000
10000
15000
20000
25000
1987 1992 1997
KYUS
Dollars Per Farm
Year Source: 1997 Census
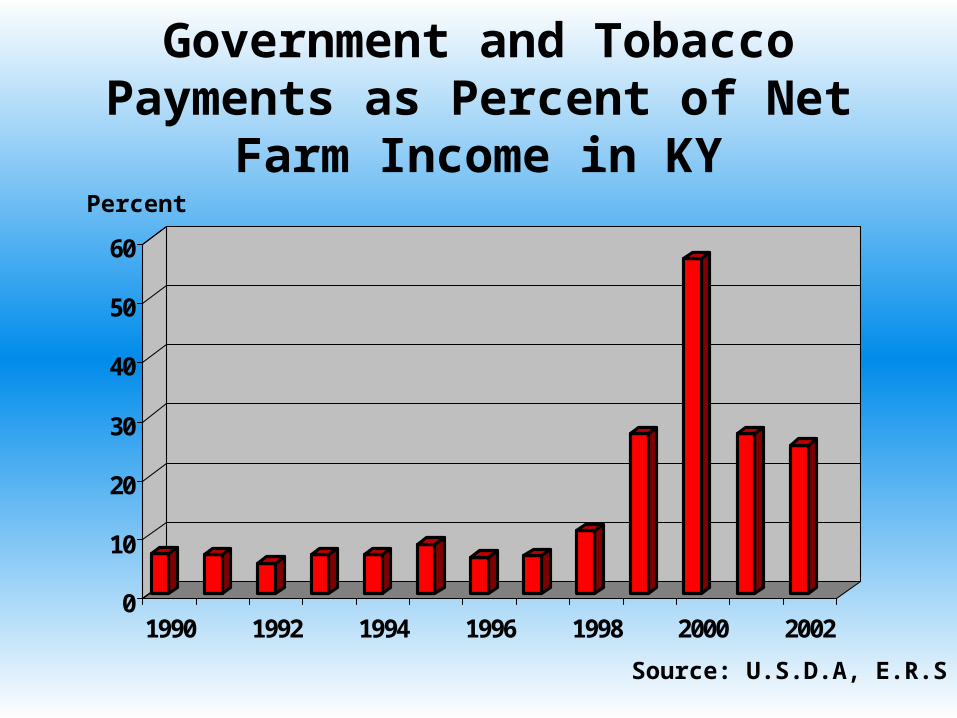
Government and Tobacco Payments as Percent of Net Farm Income in KY
0
10
20
30
40
50
60
1990 1992 1994 1996 1998 2000 2002
Source: U.S.D.A, E.R.S
Percent

KY Ag. Production-2002 Commodity National Rank
• Burley Tobacco 1• Equine 1• Other Hay 3• Beef Cows 8• Poultry 12• Corn 15• Soybeans 15• Milk Cows 18• Hogs 19• Alfalfa Hay 27

Type of Farm Organization
9%4%
1%
86%
Individual
Partnership
Family Corporation
Non-FamilyCorporation
Source: 1997 Agriculture Census

U.S. vs. Kentucky Farmer Profile
• 88% Caucasian
• 18,500 African-Amer.
• 10, 638 Native Amer.
• 8,731 Asian Amer.
• 27,717 Hispanic
• 7.6% Female Operated
• 98% Caucasian
• 523 African Amer.
• 123 Native Amer.
• 38 Asian Amer.
• 405 Hispanic
• 9% Female Operated
Source: 1997 Ag. Census
United States Kentucky
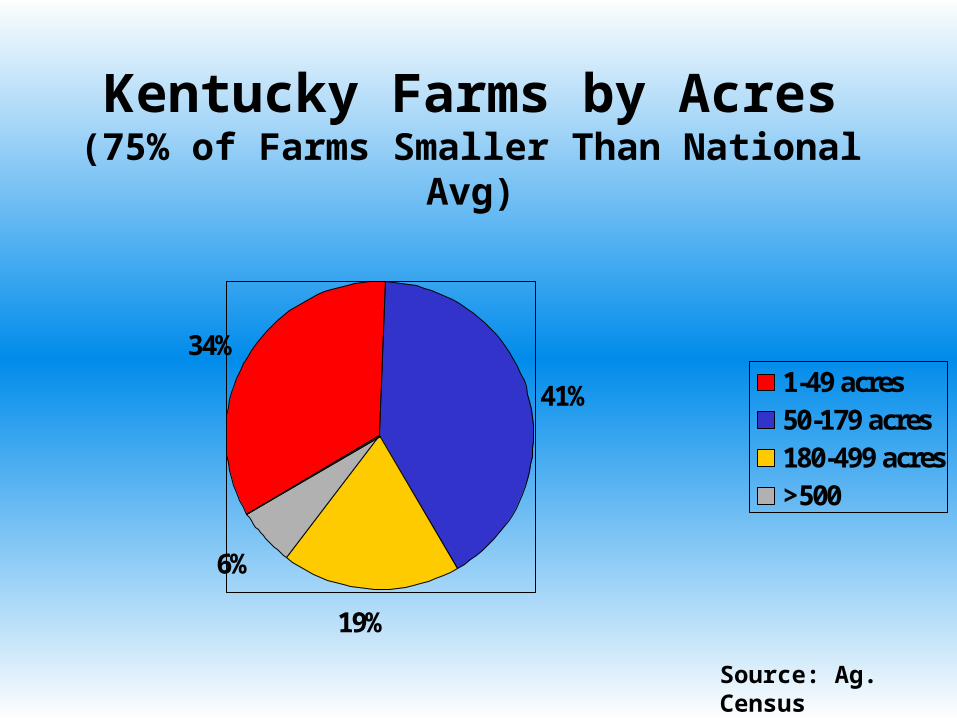
Kentucky Farms by Acres(75% of Farms Smaller Than National Avg)
34%
41%
19%
6%
1-49 acres50-179 acres180-499 acres>500
Source: Ag. Census

Farms and Sales of Ag Products
50
2
31
1115
31
4
56
0
10
20
30
40
50
60
<$10,000 <$100,000 <$499,000 >$500,000
% Farms% Sales
Source: 1997 Ag. Census
Percent
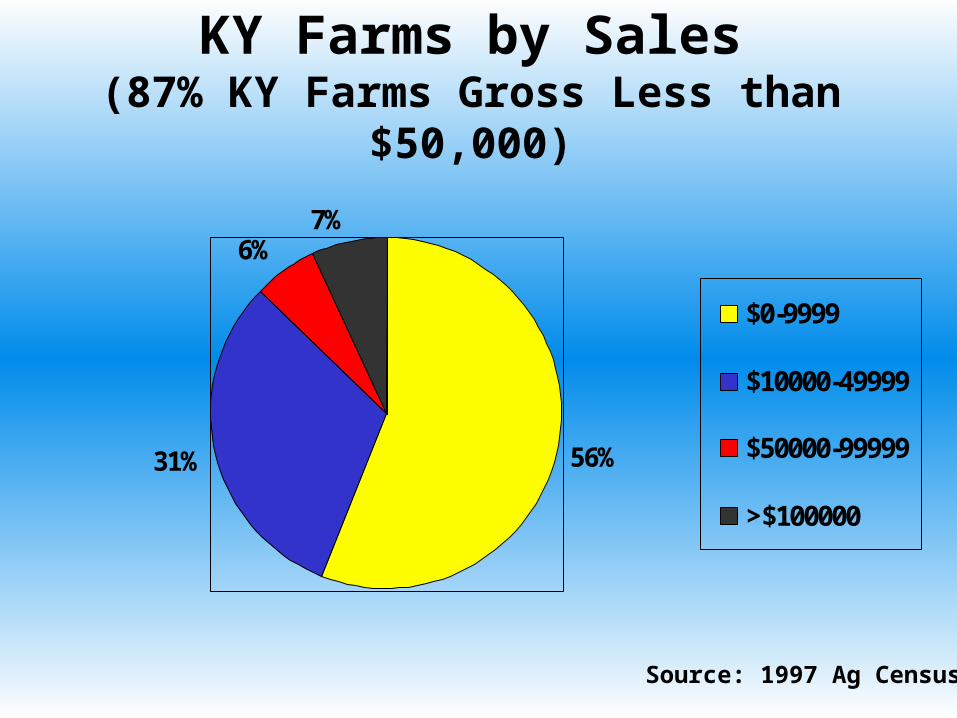
KY Farms by Sales(87% KY Farms Gross Less than $50,000)
56%31%
6%7%
$0-9999
$10000-49999
$50000-99999
>$100000
Source: 1997 Ag Census

Sources of Income for Average Farm Household
(Farm Income is 10% of Total)
10%
53%
18%
7%
12%Farm Income
Wages/Salaries
Off Farm Business
Interest/Dividends
Other Off-FarmIncome
Source: USDA Ag. Resource Mgt. Study

Average Farm and Off-Farm Income for Farm Households
-3438
16,142
44,131
164,469
49,377
38,177
34,460
36,289
-50000 0 50000 100000 150000 200000
< $50,000
$50,000-$249,999
$250,000-$499,999
>$500,000
Off Farm
Farm
Dollars
Size
USDA Ag. Resource Mgt. Study

Importance of Agriculture in Kentucky
• Farming represents 3.2% of state’s economic activity and 6.2% of jobs
• Forestry, inputs, and processing means added 9.5% of economic activity and 11.8% of jobs
• Adding retailing means entire system equals 16.2% of state’s economy and 21.1% of the jobs
Source: Godley and JonesIMPLAN, 2001
Current Trends in Agriculture
• Walmartization of production
• Globalization rewards low cost managers
• New trade agreements
• Shifting role of government policy
• Push for diversification, but….
• Widespread restructuring of agribusiness

Current Trends in Agriculture
• Products replace commodities
• Product safety concerns will grow
• Environmental factors influence location and concentration
• Technology explosion accelerates
• Information is “new” source of competitive advantage

Implications for Markets
• Evolution from commodities to components
• Price change from food and feed to component pricing
• Farm marketing-price takers to negotiators
• Contracting expands
• Markets become “thin”
• Value of information

SUMMARY
• Basic underlying trends continuing
• Think broadly of agriculture—it’s a system to produce and deliver consumer goods
• Importance of healthy rural economies to farm families
• Don’t underestimate the value of objective information in the current environment