Embed Size (px)
Citation preview
Northern Rural Training and Employment Consortium (NoRTEC)
Regional Labor Market Profile and Industry/Sector Analysis
November 2016 Prepared for:
NoRTEC Workforce Development Board Michael Cross, Executive Director
Regional Labor Market Profile and
Industry/Sector Analysis
Acknowledgements:
This report was compiled by:
1630 N Meridian Street, Suite 430
Indianapolis, IN 46202
317.894.5508
www.tpma-inc.com
Alliance for Workforce Development
Siskiyou Training and Employment Center
Del Norte Workforce Center
Smart Business Resource Center
Job Training Center
C o n t e n t s
Regional Labor Market Profile and
Industry/Sector Analysis
CONTENTS
Executive Summary ___________________________________________________________ 1
Key Findings ______________________________________________________________________ 2
Recommendations _________________________________________________________________ 5
NoRTEC Region _______________________________________________________________ 9
Demographic and Labor Force Characteristics ____________________________________________ 9
Human Capital ____________________________________________________________________ 15
Industry Sector Analysis ____________________________________________________________ 18
Occupation Analysis _______________________________________________________________ 22
High Demand Jobs – Education and Training ____________________________________________ 25
Job Postings Data _________________________________________________________________ 29
Detailed Industry Analysis ___________________________________________________________ 36
Appendices
Appendix A:
Data Sources and Glossary of Key Terms _______________________________________________ 69
Industry Sector Definitions __________________________________________________________ 70
Appendix B:
Regional Input Session Takeaways ____________________________________________________ 74
Appendix C:
NoRTEC Regional Survey Summary ____________________________________________________ 76
Appendix D:
Job Boards – North State Grow Manufacturing Roundtable & Expo __________________________ 95
Regional Labor Market Profile and
Industry/Sector Analysis
P a g e | 1
Executive Summary The purpose of this Regional Labor Market Profile and Industry/Sector Analysis is to provide the Northern
Rural Training and Employment Consortium (NoRTEC) region with data to inform strategic decisions
designed to strengthen communities across the region through a strong and collaborative workforce
development network. Ultimately, the data will be used to:
Develop sector partnerships within the priority industry sectors
Identify and promote career pathways
Identify and promote the most in-demand occupations that can also inform career guidance and
coaching
Help the workforce development board prioritize and focus on common sectors
Guide efforts in concert with economic development within the region
The report includes both quantitative and qualitative data regarding past, current and projected
economic trends for the region’s 11 counties: Butte, Del Norte, Lassen, Modoc, Nevada, Plumas, Shasta,
Sierra, Siskiyou, Tehama, and Trinity counties.
Data examined include age and race trends and projections; income and poverty; human capital and
labor force; unemployment; commuting patterns; employment by industry; employment by occupation;
industry and occupation connections; and industry sectors. Priority was placed on the identification of
industry sectors that: are growing, are economically vital to the region, include occupations with a wide
variety of entry-level educational requirements, and pay a relatively higher wage compared to other
industries.
Data were gathered from a variety of public and proprietary data sources and a survey of nearly 300
regional employers. Input sessions with each of the counties were held in May 2016 to validate and
supplement the quantitative data. Participants within the county and community participants included
key stakeholders, service providers, and employers.
Based on an analysis of the quantitative and qualitative information gathered, the following section
outlines the key findings, including strengths and challenges within the region, as well as recommended
industry sectors to emphasize for purposes of workforce planning and resource allocation.

Regional Labor Market Profile and
Industry/Sector Analysis
P a g e | 2
Key Findings The overall strengths and challenges within the region fall into three overarching themes:
Theme 1: Rurality Strength: The region possesses a high quality of life for those who value the rural lifestyle that the region
offers. During the input sessions, it was mentioned time and time again that the region’s unique lifestyle
may be a valuable tool for business recruitment. The overall rural setting is the foundation for many of
the region’s industry strengths.
Challenge: Because of the vast, rural nature of the region, there are infrastructure gaps such as access to
high speed internet. This will impact both business and talent attraction. Housing is a challenge within the
region. In some cases, there is a lack of rental properties, which is challenging for areas with a large
seasonal workforce. In other areas, the available housing is so expensive that it is difficult to attract entry-
level workers. However, the most significant challenge the region faces is an aging, flat-growth
population. This will put a significant strain on workforce availability over the next several years.
Key Points:
Important employment sectors within the region include: Government; Agriculture; and Tourism.
These tend to be significant employment sectors in rural areas across the nation.
The region’s population marginally grew by 1.3% as compared to the rest of the state, which
grew by 9.3%. Population growth is projected to remain flat through 2020. In fact, the working
age population, defined as 20-64, is projected to decrease, partly due to retirements and flat
population growth. This will put a strain on existing employers.
The region is less racially diverse than California and the US, although minority populations are
growing in size and share of the region’s population.
Due to the presence of the Agriculture sector within many of the counties, seasonal and migrant
farmworkers comprise a large portion of the workforce. Because many of these jobs are seasonal
or temporary, the monthly employment and unemployment within the region varies greatly.
Historically, the Government sector, which includes education, state and federal government, has
employed the most workers. However, the Health Care sector has demonstrated the most
significant growth and is projected to dominate future employment growth.
Across all regional input sessions, attendees recognized that the NoRTEC region possesses a high
quality of life that should be marketed as part of an overall talent attraction effort.
While participants within the input sessions noted the high-quality of life present within the
region, many of the survey respondents also indicated challenges with recruiting employees to a
rural region. This indicates that future job candidates will likely be those who prefer a rural
lifestyle.

Regional Labor Market Profile and
Industry/Sector Analysis
P a g e | 3
Theme 2: Educational Attainment Strength: The region has a higher percentage of those within its population who have some college
and/or an Associate’s degree or higher. This percentage is significantly higher than the rest of the state,
the US and other comparison communities. This presents opportunities for upskilling, and the current
level of educational attainment within the region matches well with in-demand jobs.
Challenge: Unfortunately, jobs that are available for the current educational attainment level within the
region do not always pay well. Also, workers who have some college and choose to finish their studies
may not be pursuing fields that lead to current in demand occupations.
Key Points
Many in-demand jobs tend to be entry-level rungs on the career ladder. For example, 13 of the
20 occupations with the greatest number of projected openings pay median wages between
$10.00 and $15.00. Of the 20 occupations, just two require education beyond an Associate’s
degree.
Top jobs within the region, by largest share of employment, tend to be within the food
service/tourism industry. However, several Health Care industry occupations, including
Registered Nurses, pay higher-than-average wages and are expected to have a relatively high
number of annual openings over the next 5 years.
The overall median household income within the region is lower, while the poverty rate tends to
be higher as compared to the rest of the state and nation.
Based on survey results, the most significant challenges for employers within the region are (1) to
find qualified candidates to hire, generally speaking, and (2) to find prospects to fill high-skill
positions. Finding employees with necessary soft skills was also indicated as a significant
workforce challenge.

Regional Labor Market Profile and
Industry/Sector Analysis
P a g e | 4
Theme 3: Geography Strength: The presence of the two border states of Oregon and Nevada present opportunities for cross-
border collaboration, while the vast size of the region also presents opportunities for in-region
collaboration.
Challenge: It is time and resource intensive to work across states with a diversified approach to problem
solving.
Key Points:
While the NoRTEC region is geographically large and diverse, input sessions showed a willingness
and enthusiasm for various organizations to work together for the “common good.”
Because the region is geographically vast, lacks a large population center, is sparsely populated
overall, and borders two states, commuting patterns for the NoRTEC region are unlike many
other workforce regions in the country. Del Norte, Siskiyou, and Modoc Counties border southern
Oregon and exchange commuters with counties across state lines. The same is the case with
Nevada, Lassen, and Sierra and Plumas Counties. All four border Nevada, and workers from each
county cross the border to Reno for employment. These unique commuting conditions lead to a
need for cross-state collaboration for more impactful workforce development strategies.
Although counties throughout the NoRTEC region share similarities in industry sectors,
occupations, and business needs, input session participants in counties along the Oregon and
Nevada borders often identified more strongly with communities in these states than with other
parts of the NoRTEC region.
Regional Labor Market Profile and
Industry/Sector Analysis
P a g e | 5
Opportunities and Needs An analysis of the quantitative and qualitative data as well as the strengths and challenges presented
above yielded several clear opportunities and needs for the NoRTEC region.
While entrepreneurship and small business development are not industry sectors and can occur
within any private industry, they were mentioned as an opportunity and need in nearly every input
session and are a recommended focus for NoRTEC.
An entrepreneurship and small business strategy could fill in some of the service gaps that exist in
the smaller, more isolated communities and could engage those workers not suited to a typical
nine-to-five job.
There is a need for greater youth engagement for talent retention and to provide youth with work
experience.
While the NoRTEC region is vast, there is the need for sustained engagement of partners across
the 11 counties. There are also opportunities to engage with organizations across state lines in
order to take advantage of the interstate workforce that commutes across state lines.
A focus on better broadband and housing infrastructure will help with workforce attraction.
Research indicates that the Information Technology (IT) sector is an emerging opportunity;
however, for it to be successful throughout the entire region, it will be necessary to provide a more
robust broadband infrastructure.
The region should focus on priority sectors for workforce development. Identifying priority sectors
can create a common focus among partners and guide efforts with regional economic
development. It is also a way to identify and promote the most in-demand occupations within the
region, while also informing career guidance and coaching.
Recommendations Recommended priority sectors for the NoRTEC region include: Health Care, Manufacturing, Information
Technology (IT), Agriculture, and Tourism. These recommendations are based on an analysis of
employment trends within each of the 11 counties and the region as a whole. Generally, these sectors
meet a combination of the following criteria:
High historical employment growth
Projected growth through 2020
Employ a disproportionately high number of employees within the region
Provide employment opportunities with relatively higher wages
Provide employment opportunities with career pathways
Each sector is present to some degree within each of the 11 NoRTEC counties; however, some sectors are
a better fit for certain counties than for others. These variances are outlined below.
Regional Labor Market Profile and
Industry/Sector Analysis
P a g e | 6
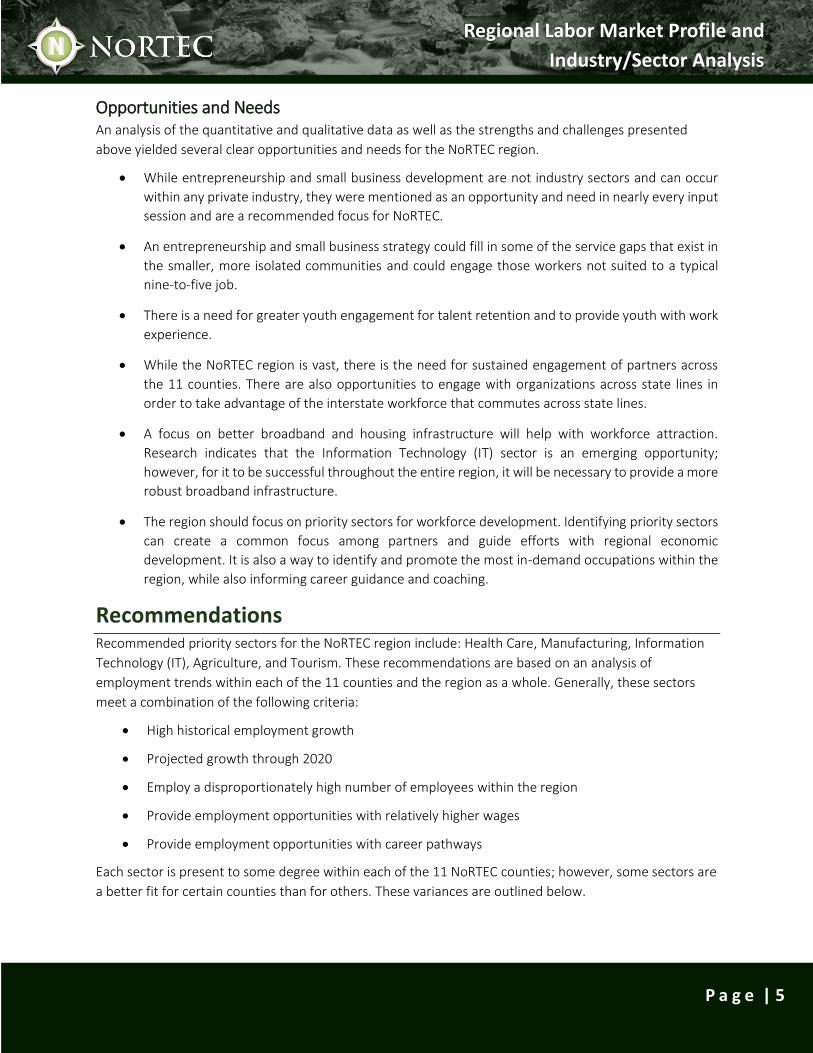
Health Care Recommended for the region and particularly for: Butte,
Del Norte, Lassen, Nevada, Plumas, Shasta, Sierra,
Siskiyou, Tehama and Trinity Counties, as it is either a
major employer or is projected to experience significant
growth.
Recommended because: Health Care is the second
largest sector, by total employment, within the 11-
county region. It has added the greatest number of jobs
since 2010 and is projected to add the most jobs, by far,
through 2020. Seven of the top ten high-demand
occupations are within the Health Care sector.
High-demand Health Care occupations include: Personal Care Aides, Home Health Aides, Registered Nurses,
Nursing Assistants, Social and Human Service Assistants, and Licensed Practical and Licensed Vocational
Nurses.
Each of these occupations is projected to add more than 150 jobs through 2020, with Personal Care Aides
projected to add the most, at 1,734. Of these occupations, Registered Nurses earn the highest median
wage of $37.56/hr and are required to have a minimum of an Associate’s degree.1 Licensed Practical and
Licensed Vocation Nurses earn the next highest median wage of $23.66/hr and are required to have a
postsecondary non-degree award. The other occupations, while paying a lower wage on average, require
only a high school diploma or less and so can be good initial rungs on the Health Care career ladder for job
seekers who lack postsecondary credentials.
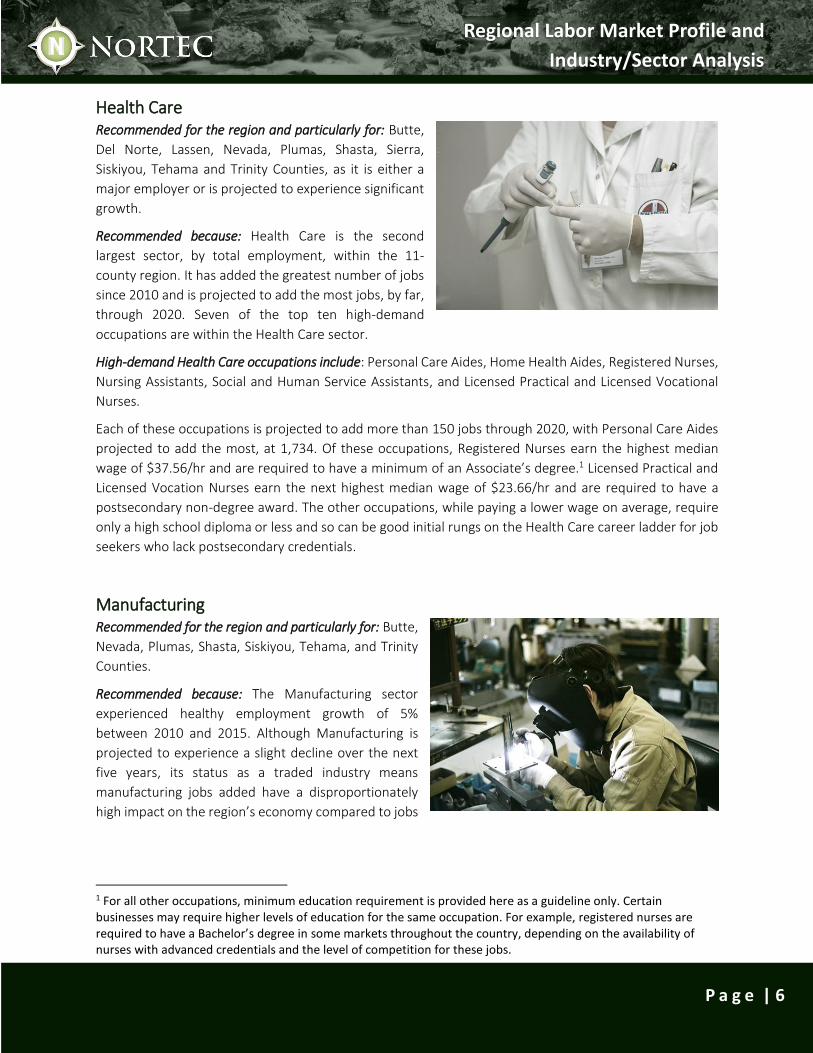
Manufacturing Recommended for the region and particularly for: Butte,
Nevada, Plumas, Shasta, Siskiyou, Tehama, and Trinity
Counties.
Recommended because: The Manufacturing sector
experienced healthy employment growth of 5%
between 2010 and 2015. Although Manufacturing is
projected to experience a slight decline over the next
five years, its status as a traded industry means
manufacturing jobs added have a disproportionately
high impact on the region’s economy compared to jobs
1 For all other occupations, minimum education requirement is provided here as a guideline only. Certain businesses may require higher levels of education for the same occupation. For example, registered nurses are required to have a Bachelor’s degree in some markets throughout the country, depending on the availability of nurses with advanced credentials and the level of competition for these jobs.
Regional Labor Market Profile and
Industry/Sector Analysis
P a g e | 7
in other many other industries. On average for each full-time manufacturing job created, 3.4 full-time jobs
are created in nonmanufacturing industries.2
Key subsectors of Manufacturing fall within two categories: Wood Products and Food Processing.
Specifically, they include: Sawmills and Wood Preservation; Other Wood Product Manufacturing; Beverage
Manufacturing; Fruit and Vegetable Preserving and Specialty Food Manufacturing; Other Miscellaneous
Manufacturing; and Bakeries and Tortilla Manufacturing. Of these, Other Wood Product Manufacturing
and Bakeries and Tortilla Manufacturing have experienced the greatest growth. Other growing and
emerging subsectors include Architectural and Structural Metals Manufacturing and Grain and Oilseed
Milling.
High-demand Manufacturing occupations include: Bakers; Sewing Machine Operators; Welders, Cutters,
Solderers, and Brazers; Food Batchmakers; Meat, Poultry, and Fish Cutters and Trimmers; and Industrial
Machinery Mechanics.
Each occupation category is projected to add at least ten new jobs through 2020, with Bakers leading the
way with 31 new jobs. Of these, Industry Machinery Mechanics earn the highest wage of $23.08/hr and
must hold only a high school diploma.
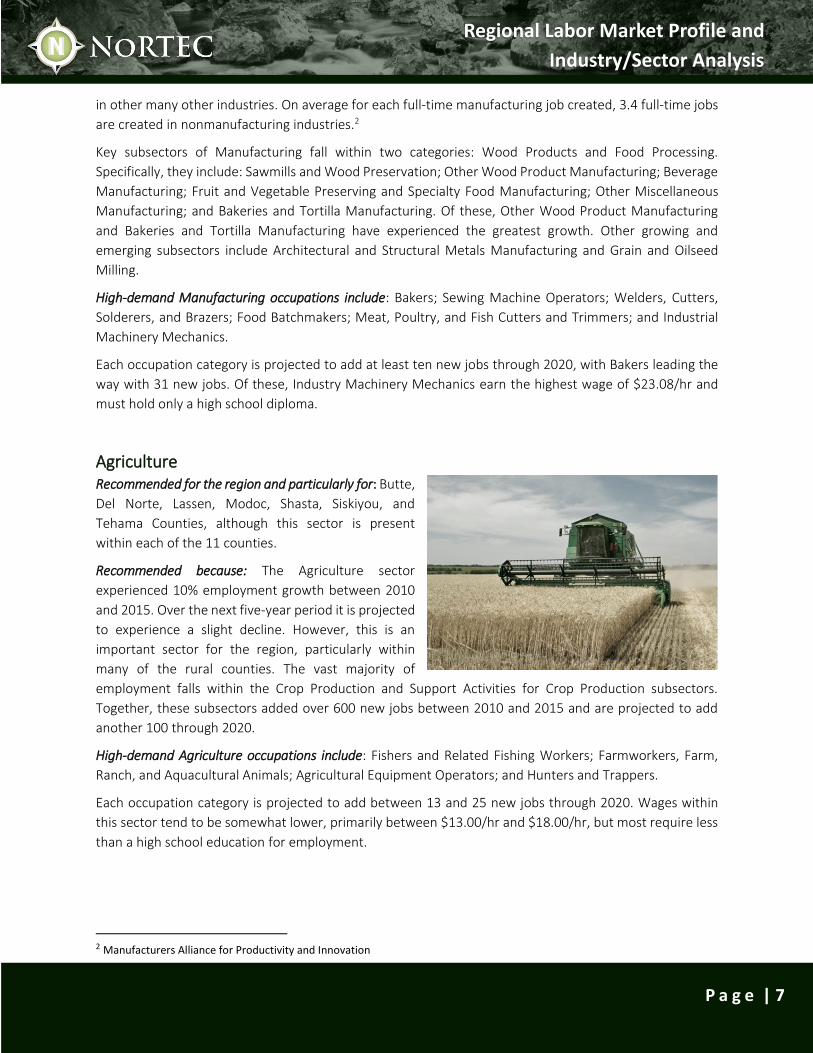
Agriculture Recommended for the region and particularly for: Butte,
Del Norte, Lassen, Modoc, Shasta, Siskiyou, and
Tehama Counties, although this sector is present
within each of the 11 counties.
Recommended because: The Agriculture sector
experienced 10% employment growth between 2010
and 2015. Over the next five-year period it is projected
to experience a slight decline. However, this is an
important sector for the region, particularly within
many of the rural counties. The vast majority of
employment falls within the Crop Production and Support Activities for Crop Production subsectors.
Together, these subsectors added over 600 new jobs between 2010 and 2015 and are projected to add
another 100 through 2020.
High-demand Agriculture occupations include: Fishers and Related Fishing Workers; Farmworkers, Farm,
Ranch, and Aquacultural Animals; Agricultural Equipment Operators; and Hunters and Trappers.
Each occupation category is projected to add between 13 and 25 new jobs through 2020. Wages within
this sector tend to be somewhat lower, primarily between $13.00/hr and $18.00/hr, but most require less
than a high school education for employment.
2 Manufacturers Alliance for Productivity and Innovation
Regional Labor Market Profile and
Industry/Sector Analysis
P a g e | 8
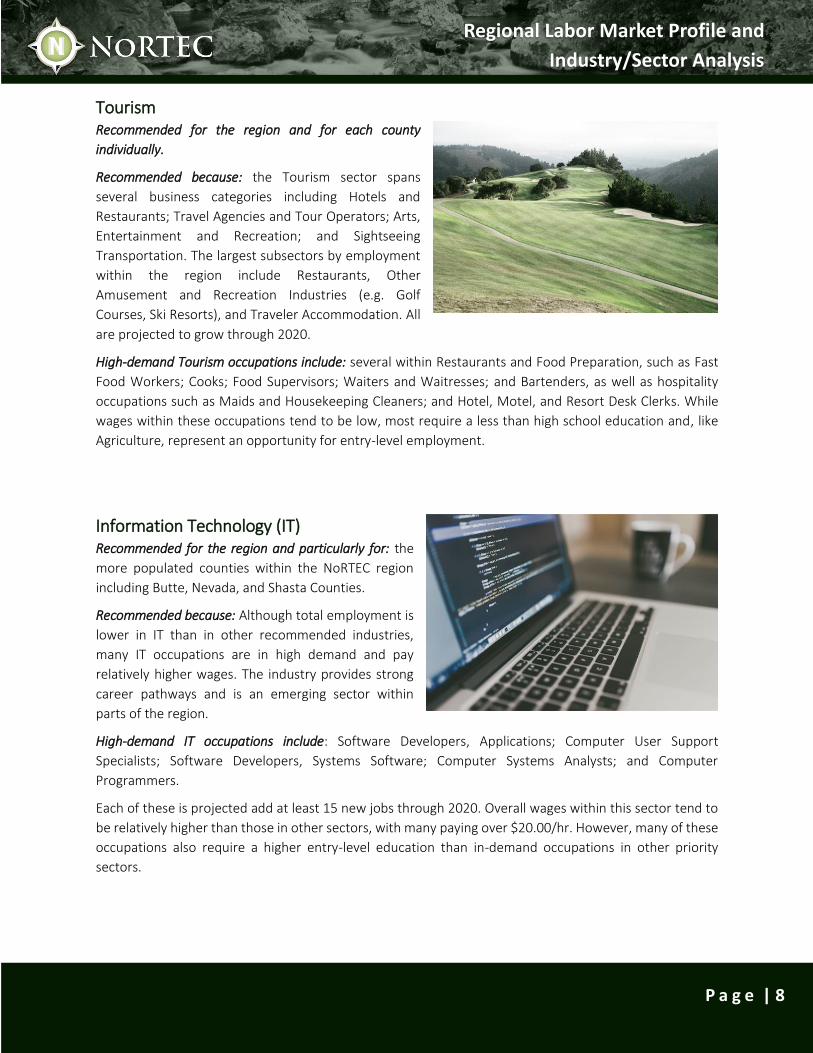
Tourism Recommended for the region and for each county
individually.
Recommended because: the Tourism sector spans
several business categories including Hotels and
Restaurants; Travel Agencies and Tour Operators; Arts,
Entertainment and Recreation; and Sightseeing
Transportation. The largest subsectors by employment
within the region include Restaurants, Other
Amusement and Recreation Industries (e.g. Golf
Courses, Ski Resorts), and Traveler Accommodation. All
are projected to grow through 2020.
High-demand Tourism occupations include: several within Restaurants and Food Preparation, such as Fast
Food Workers; Cooks; Food Supervisors; Waiters and Waitresses; and Bartenders, as well as hospitality
occupations such as Maids and Housekeeping Cleaners; and Hotel, Motel, and Resort Desk Clerks. While
wages within these occupations tend to be low, most require a less than high school education and, like
Agriculture, represent an opportunity for entry-level employment.
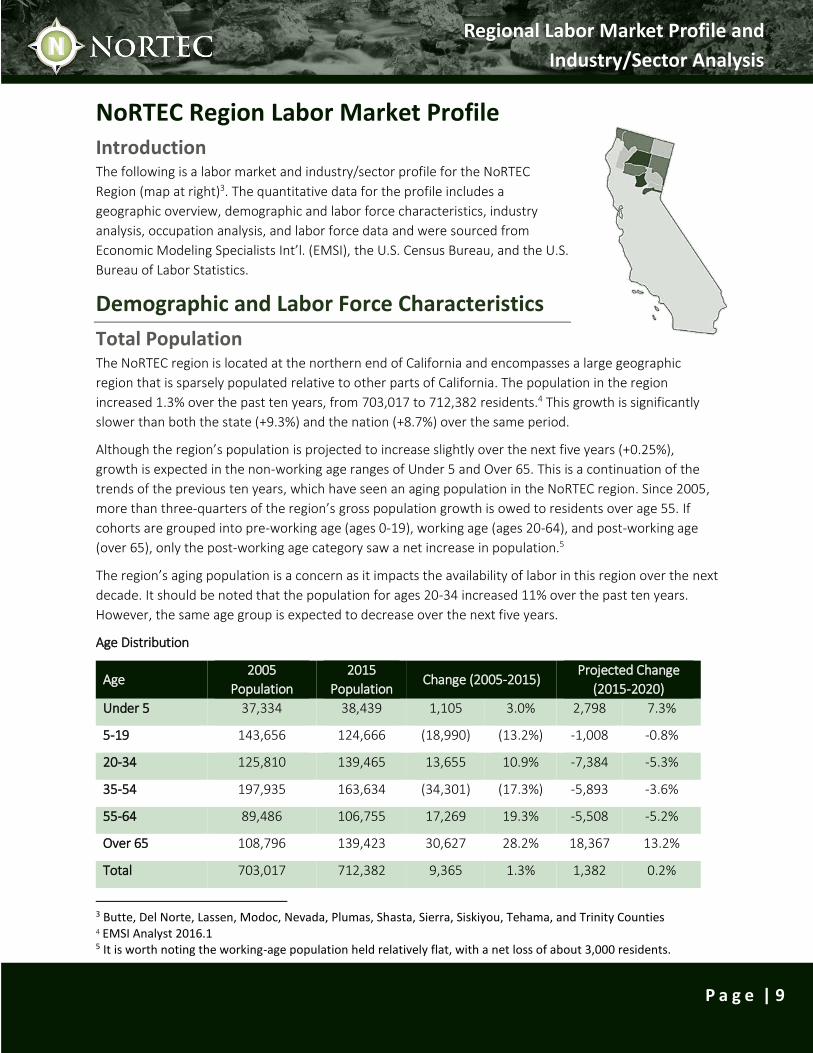
Information Technology (IT) Recommended for the region and particularly for: the
more populated counties within the NoRTEC region
including Butte, Nevada, and Shasta Counties.
Recommended because: Although total employment is
lower in IT than in other recommended industries,
many IT occupations are in high demand and pay
relatively higher wages. The industry provides strong
career pathways and is an emerging sector within
parts of the region.
High-demand IT occupations include: Software Developers, Applications; Computer User Support
Specialists; Software Developers, Systems Software; Computer Systems Analysts; and Computer
Programmers.
Each of these is projected add at least 15 new jobs through 2020. Overall wages within this sector tend to
be relatively higher than those in other sectors, with many paying over $20.00/hr. However, many of these
occupations also require a higher entry-level education than in-demand occupations in other priority
sectors.
Regional Labor Market Profile and
Industry/Sector Analysis
P a g e | 9
NoRTEC Region Labor Market Profile
Introduction The following is a labor market and industry/sector profile for the NoRTEC
Region (map at right)3. The quantitative data for the profile includes a
geographic overview, demographic and labor force characteristics, industry
analysis, occupation analysis, and labor force data and were sourced from
Economic Modeling Specialists Int’l. (EMSI), the U.S. Census Bureau, and the U.S.
Bureau of Labor Statistics.
Demographic and Labor Force Characteristics
Total Population The NoRTEC region is located at the northern end of California and encompasses a large geographic
region that is sparsely populated relative to other parts of California. The population in the region
increased 1.3% over the past ten years, from 703,017 to 712,382 residents.4 This growth is significantly
slower than both the state (+9.3%) and the nation (+8.7%) over the same period.
Although the region’s population is projected to increase slightly over the next five years (+0.25%),
growth is expected in the non-working age ranges of Under 5 and Over 65. This is a continuation of the
trends of the previous ten years, which have seen an aging population in the NoRTEC region. Since 2005,
more than three-quarters of the region’s gross population growth is owed to residents over age 55. If
cohorts are grouped into pre-working age (ages 0-19), working age (ages 20-64), and post-working age
(over 65), only the post-working age category saw a net increase in population.5
The region’s aging population is a concern as it impacts the availability of labor in this region over the next
decade. It should be noted that the population for ages 20-34 increased 11% over the past ten years.
However, the same age group is expected to decrease over the next five years.
Age Distribution
Age 2005
Population
2015
Population Change (2005-2015)
Projected Change
(2015-2020)
Under 5 37,334 38,439 1,105 3.0% 2,798 7.3%
5-19 143,656 124,666 (18,990) (13.2%) -1,008 -0.8%
20-34 125,810 139,465 13,655 10.9% -7,384 -5.3%
35-54 197,935 163,634 (34,301) (17.3%) -5,893 -3.6%
55-64 89,486 106,755 17,269 19.3% -5,508 -5.2%
Over 65 108,796 139,423 30,627 28.2% 18,367 13.2%
Total 703,017 712,382 9,365 1.3% 1,382 0.2%
3 Butte, Del Norte, Lassen, Modoc, Nevada, Plumas, Shasta, Sierra, Siskiyou, Tehama, and Trinity Counties 4 EMSI Analyst 2016.1 5 It is worth noting the working-age population held relatively flat, with a net loss of about 3,000 residents.
Regional Labor Market Profile and
Industry/Sector Analysis
P a g e | 10
Comparisons of Population Projections
The NoRTEC region’s combination of geographic magnitude and population sparsity makes it unique
among regions in the United States. As a result, it is difficult to find comparable areas across the US. The
Bend, Oregon, and Boise, Idaho, regions come closest, as they are large, multi-county regions, with rural
populations in the western U.S.
While NoRTEC’s aging population is mirrored across the state, nation, and comparison regions, these
other regions are not facing similar declines in the working age population (age 20-64). This signals a need
for talent retention and attraction for NoRTEC that is more significant than it is in other places.
Age NoRTEC 2015-
2020 Growth
Bend, OR6
2015-2020
Growth
Boise, ID
MSA7 2015-
2020 Growth
California
2015-2020
Growth
US 2015-2020
Growth
Under 5 7.3% 13.6% 15.4% 9.1% 7.7%
5-19 -0.8% -1.1% 1.1% -0.9% -0.3%
20-34 -5.3% 2.2% 3.2% 0.8% 0.8%
35-54 -3.6% 3.2% 3.1% -0.4% -1.8%
55-64 -5.2% 0.4% 6.0% 6.7% 4.5%
Over 65 13.2% 23.2% 24.7% 17.0% 14.7%
Total 0.2% 6.3% 6.7% 3.5% 2.9%
6 Bend, OR includes Crook, Deschutes, and Jefferson Counties. 7 Boise, ID MSA includes Ada, Boise, Canyon, Gem, and Owyhee Counties
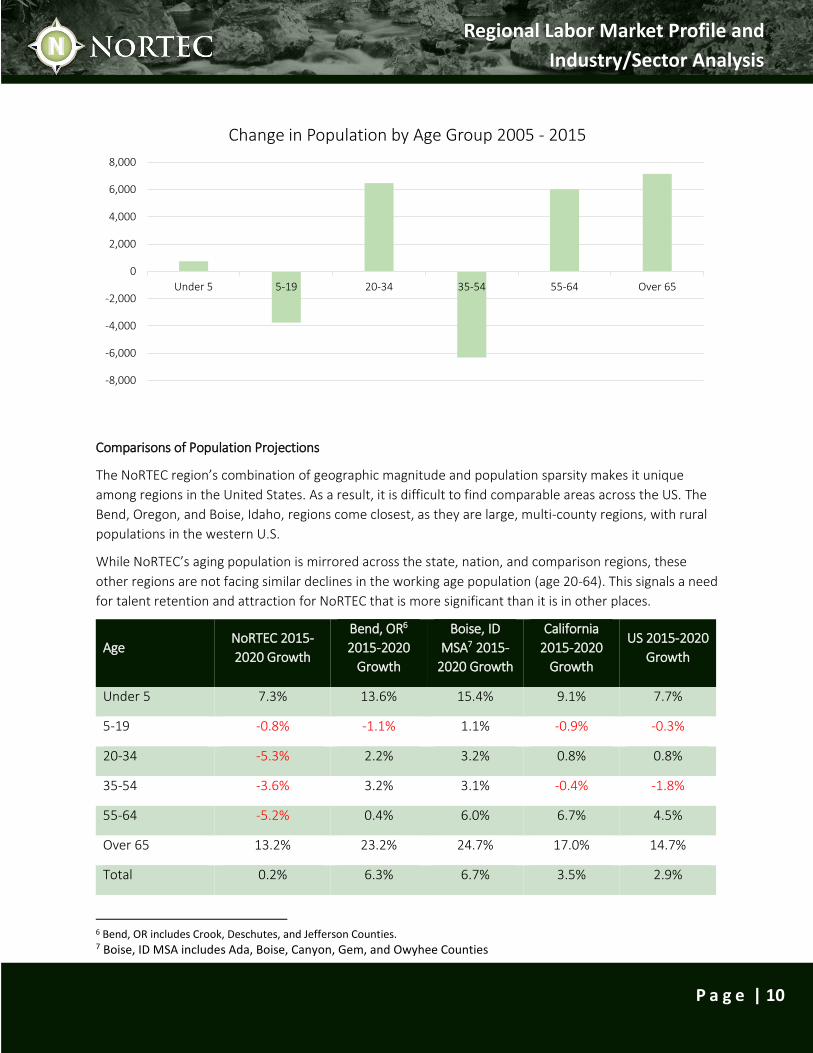
-8,000
-6,000
-4,000
-2,000
0
2,000
4,000
6,000
8,000
Under 5 5-19 20-34 35-54 55-64 Over 65
Change in Population by Age Group 2005 - 2015
Regional Labor Market Profile and
Industry/Sector Analysis
P a g e | 11
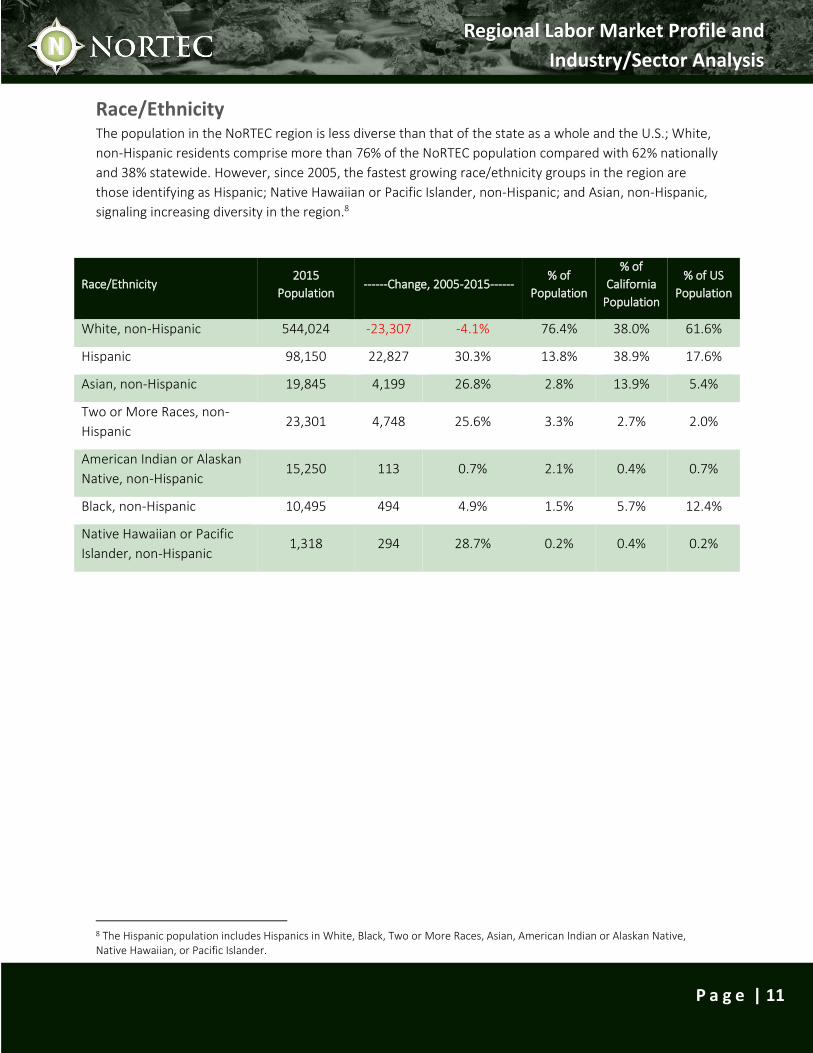
Race/Ethnicity
The population in the NoRTEC region is less diverse than that of the state as a whole and the U.S.; White,
non-Hispanic residents comprise more than 76% of the NoRTEC population compared with 62% nationally
and 38% statewide. However, since 2005, the fastest growing race/ethnicity groups in the region are
those identifying as Hispanic; Native Hawaiian or Pacific Islander, non-Hispanic; and Asian, non-Hispanic,
signaling increasing diversity in the region.8
Race/Ethnicity 2015
Population ------Change, 2005-2015------
% of
Population
% of
California
Population
% of US
Population
White, non-Hispanic 544,024 -23,307 -4.1% 76.4% 38.0% 61.6%
Hispanic 98,150 22,827 30.3% 13.8% 38.9% 17.6%
Asian, non-Hispanic 19,845 4,199 26.8% 2.8% 13.9% 5.4%
Two or More Races, non-
Hispanic 23,301 4,748 25.6% 3.3% 2.7% 2.0%
American Indian or Alaskan
Native, non-Hispanic 15,250 113 0.7% 2.1% 0.4% 0.7%
Black, non-Hispanic 10,495 494 4.9% 1.5% 5.7% 12.4%
Native Hawaiian or Pacific
Islander, non-Hispanic 1,318 294 28.7% 0.2% 0.4% 0.2%
8 The Hispanic population includes Hispanics in White, Black, Two or More Races, Asian, American Indian or Alaskan Native, Native Hawaiian, or Pacific Islander.
Regional Labor Market Profile and
Industry/Sector Analysis
P a g e | 12
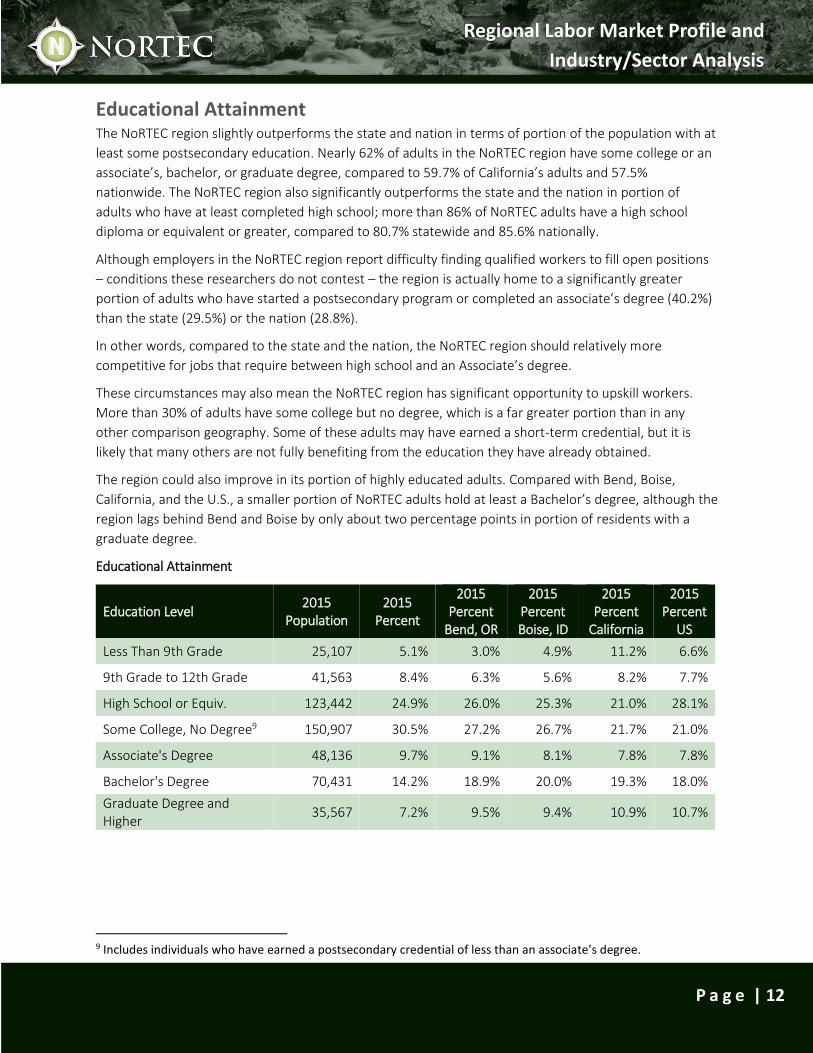
Educational Attainment The NoRTEC region slightly outperforms the state and nation in terms of portion of the population with at
least some postsecondary education. Nearly 62% of adults in the NoRTEC region have some college or an
associate’s, bachelor, or graduate degree, compared to 59.7% of California’s adults and 57.5%
nationwide. The NoRTEC region also significantly outperforms the state and the nation in portion of
adults who have at least completed high school; more than 86% of NoRTEC adults have a high school
diploma or equivalent or greater, compared to 80.7% statewide and 85.6% nationally.
Although employers in the NoRTEC region report difficulty finding qualified workers to fill open positions
– conditions these researchers do not contest – the region is actually home to a significantly greater
portion of adults who have started a postsecondary program or completed an associate’s degree (40.2%)
than the state (29.5%) or the nation (28.8%).
In other words, compared to the state and the nation, the NoRTEC region should relatively more
competitive for jobs that require between high school and an Associate’s degree.
These circumstances may also mean the NoRTEC region has significant opportunity to upskill workers.
More than 30% of adults have some college but no degree, which is a far greater portion than in any
other comparison geography. Some of these adults may have earned a short-term credential, but it is
likely that many others are not fully benefiting from the education they have already obtained.
The region could also improve in its portion of highly educated adults. Compared with Bend, Boise,
California, and the U.S., a smaller portion of NoRTEC adults hold at least a Bachelor’s degree, although the
region lags behind Bend and Boise by only about two percentage points in portion of residents with a
graduate degree.
Educational Attainment
Education Level 2015
Population 2015
Percent
2015 Percent
Bend, OR
2015 Percent Boise, ID
2015 Percent
California
2015 Percent
US
Less Than 9th Grade 25,107 5.1% 3.0% 4.9% 11.2% 6.6%
9th Grade to 12th Grade 41,563 8.4% 6.3% 5.6% 8.2% 7.7%
High School or Equiv. 123,442 24.9% 26.0% 25.3% 21.0% 28.1%
Some College, No Degree9 150,907 30.5% 27.2% 26.7% 21.7% 21.0%
Associate's Degree 48,136 9.7% 9.1% 8.1% 7.8% 7.8%
Bachelor's Degree 70,431 14.2% 18.9% 20.0% 19.3% 18.0%
Graduate Degree and Higher
35,567 7.2% 9.5% 9.4% 10.9% 10.7%
9 Includes individuals who have earned a postsecondary credential of less than an associate’s degree.
Regional Labor Market Profile and
Industry/Sector Analysis
P a g e | 13
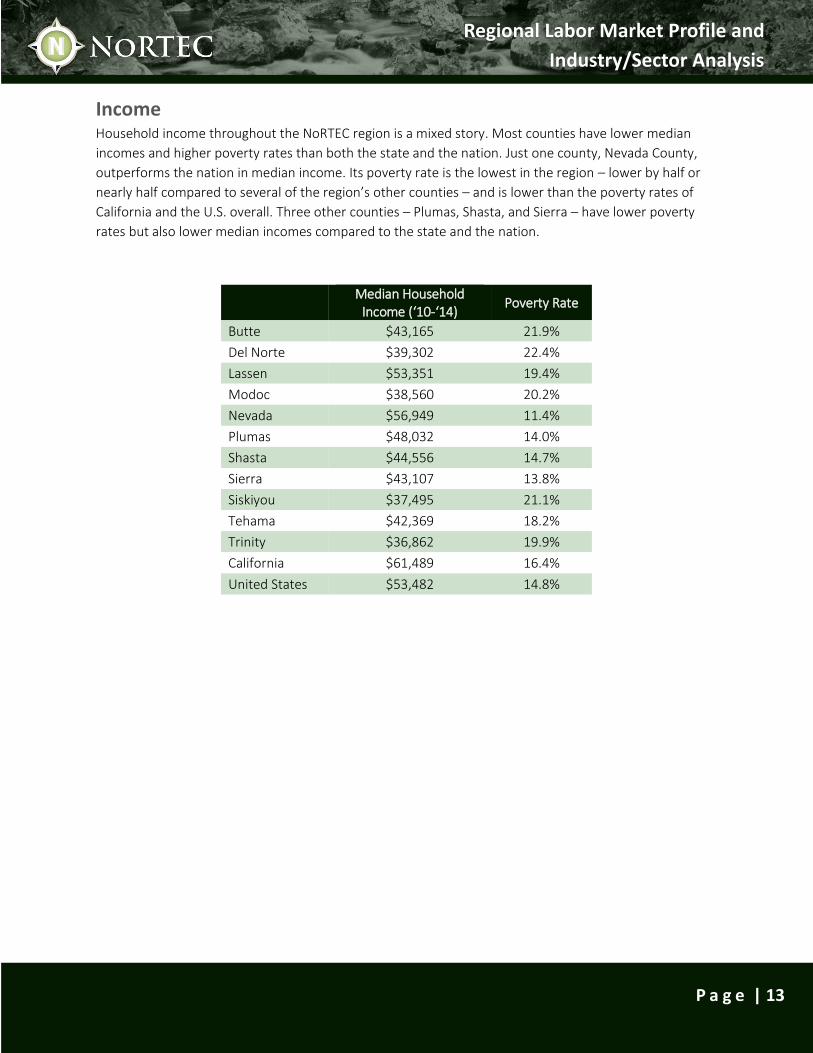
Income Household income throughout the NoRTEC region is a mixed story. Most counties have lower median
incomes and higher poverty rates than both the state and the nation. Just one county, Nevada County,
outperforms the nation in median income. Its poverty rate is the lowest in the region – lower by half or
nearly half compared to several of the region’s other counties – and is lower than the poverty rates of
California and the U.S. overall. Three other counties – Plumas, Shasta, and Sierra – have lower poverty
rates but also lower median incomes compared to the state and the nation.
Median Household
Income (‘10-‘14) Poverty Rate
Butte $43,165 21.9%
Del Norte $39,302 22.4%
Lassen $53,351 19.4%
Modoc $38,560 20.2%
Nevada $56,949 11.4%
Plumas $48,032 14.0%
Shasta $44,556 14.7%
Sierra $43,107 13.8%
Siskiyou $37,495 21.1%
Tehama $42,369 18.2%
Trinity $36,862 19.9%
California $61,489 16.4%
United States $53,482 14.8%
Regional Labor Market Profile and
Industry/Sector Analysis
P a g e | 14
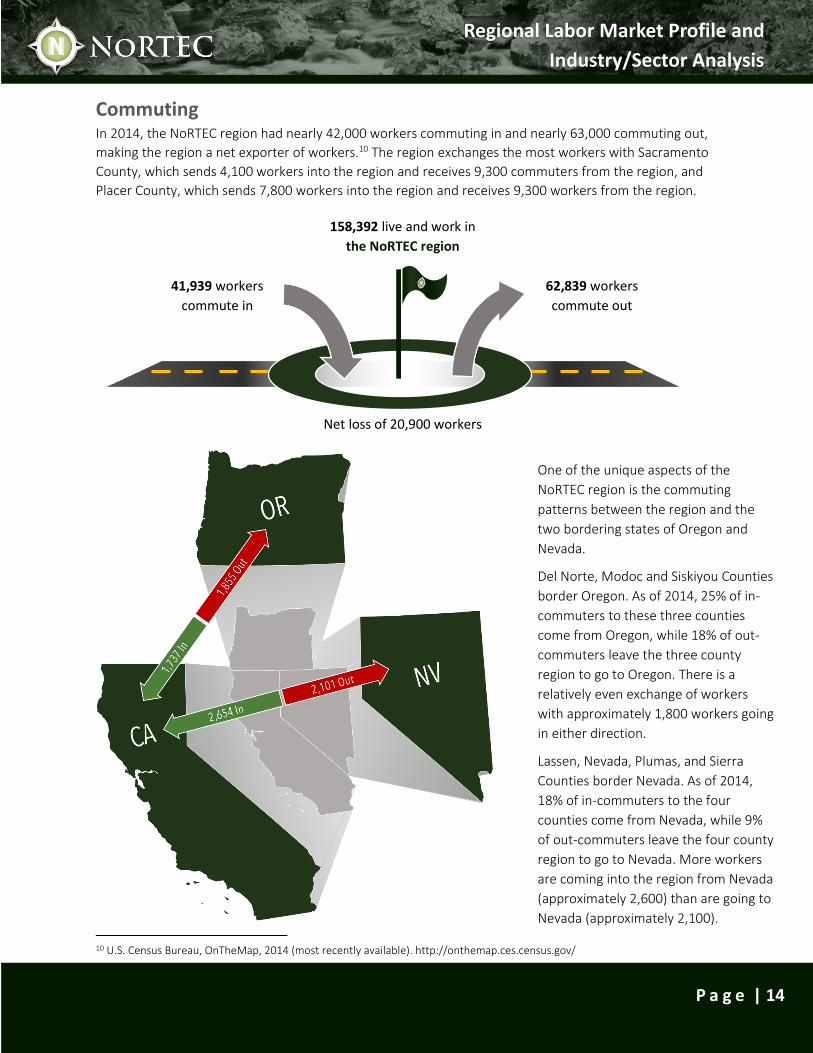
Commuting
In 2014, the NoRTEC region had nearly 42,000 workers commuting in and nearly 63,000 commuting out,
making the region a net exporter of workers.10 The region exchanges the most workers with Sacramento
County, which sends 4,100 workers into the region and receives 9,300 commuters from the region, and
Placer County, which sends 7,800 workers into the region and receives 9,300 workers from the region.
10 U.S. Census Bureau, OnTheMap, 2014 (most recently available). http://onthemap.ces.census.gov/
41,939 workers
commute in
62,839 workers
commute out
158,392 live and work in
the NoRTEC region
Net loss of 20,900 workers
One of the unique aspects of the
NoRTEC region is the commuting
patterns between the region and the
two bordering states of Oregon and
Nevada.
Del Norte, Modoc and Siskiyou Counties
border Oregon. As of 2014, 25% of in-
commuters to these three counties
come from Oregon, while 18% of out-
commuters leave the three county
region to go to Oregon. There is a
relatively even exchange of workers
with approximately 1,800 workers going
in either direction.
Lassen, Nevada, Plumas, and Sierra
Counties border Nevada. As of 2014,
18% of in-commuters to the four
counties come from Nevada, while 9%
of out-commuters leave the four county
region to go to Nevada. More workers
are coming into the region from Nevada
(approximately 2,600) than are going to
Nevada (approximately 2,100).
Regional Labor Market Profile and
Industry/Sector Analysis
P a g e | 15
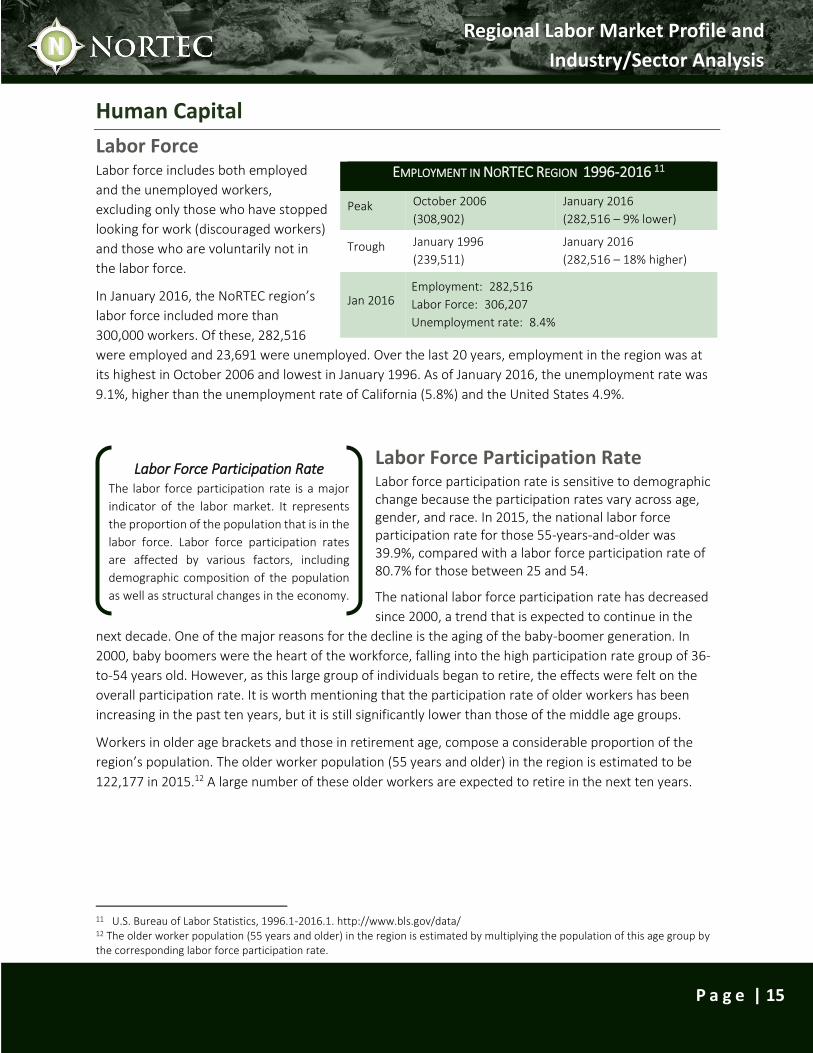
Human Capital
Labor Force Labor force includes both employed
and the unemployed workers,
excluding only those who have stopped
looking for work (discouraged workers)
and those who are voluntarily not in
the labor force.
In January 2016, the NoRTEC region’s
labor force included more than
300,000 workers. Of these, 282,516
were employed and 23,691 were unemployed. Over the last 20 years, employment in the region was at
its highest in October 2006 and lowest in January 1996. As of January 2016, the unemployment rate was
9.1%, higher than the unemployment rate of California (5.8%) and the United States 4.9%.
Labor Force Participation Rate Labor force participation rate is sensitive to demographic change because the participation rates vary across age, gender, and race. In 2015, the national labor force participation rate for those 55-years-and-older was 39.9%, compared with a labor force participation rate of 80.7% for those between 25 and 54.
The national labor force participation rate has decreased
since 2000, a trend that is expected to continue in the
next decade. One of the major reasons for the decline is the aging of the baby-boomer generation. In
2000, baby boomers were the heart of the workforce, falling into the high participation rate group of 36-
to-54 years old. However, as this large group of individuals began to retire, the effects were felt on the
overall participation rate. It is worth mentioning that the participation rate of older workers has been
increasing in the past ten years, but it is still significantly lower than those of the middle age groups.
Workers in older age brackets and those in retirement age, compose a considerable proportion of the
region’s population. The older worker population (55 years and older) in the region is estimated to be
122,177 in 2015.12 A large number of these older workers are expected to retire in the next ten years.
11 U.S. Bureau of Labor Statistics, 1996.1-2016.1. http://www.bls.gov/data/ 12 The older worker population (55 years and older) in the region is estimated by multiplying the population of this age group by the corresponding labor force participation rate.
EMPLOYMENT IN NORTEC REGION 1996-2016 11
Peak October 2006
(308,902)
January 2016
(282,516 – 9% lower)
Trough January 1996
(239,511)
January 2016
(282,516 – 18% higher)
Jan 2016 Employment: 282,516 Labor Force: 306,207
Unemployment rate: 8.4%
Labor Force Participation Rate The labor force participation rate is a major
indicator of the labor market. It represents
the proportion of the population that is in the
labor force. Labor force participation rates
are affected by various factors, including
demographic composition of the population
as well as structural changes in the economy.
Regional Labor Market Profile and
Industry/Sector Analysis
P a g e | 16
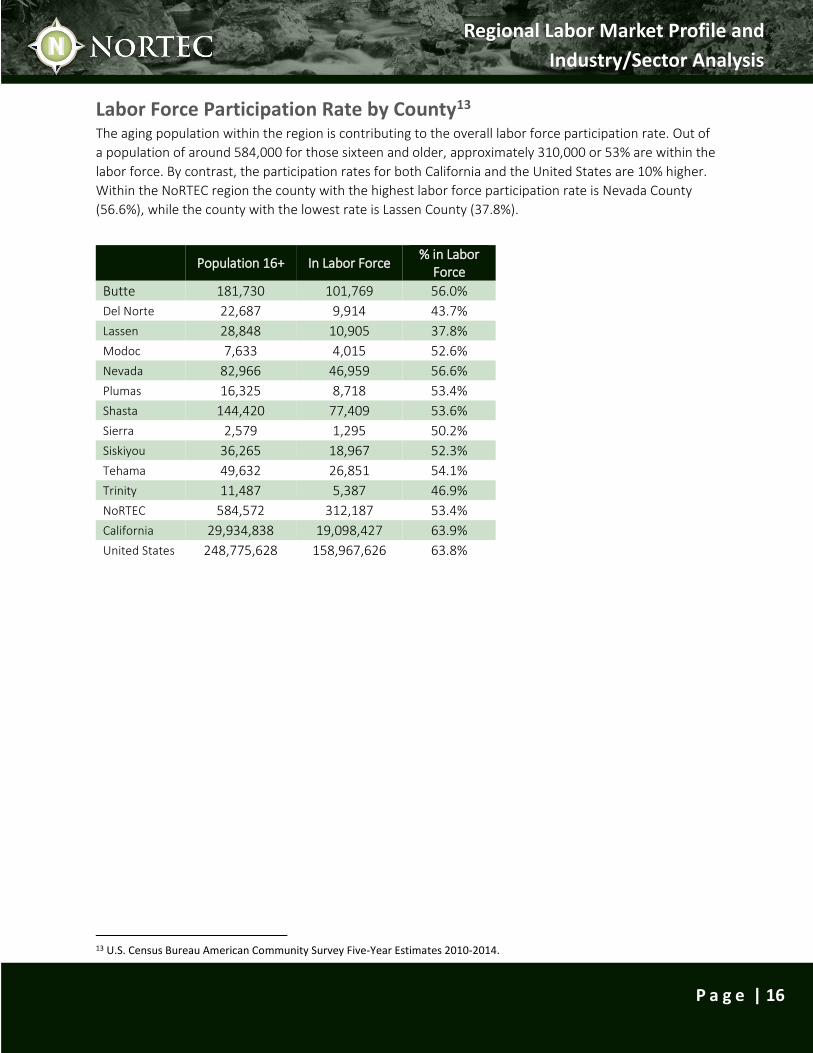
Labor Force Participation Rate by County13 The aging population within the region is contributing to the overall labor force participation rate. Out of
a population of around 584,000 for those sixteen and older, approximately 310,000 or 53% are within the
labor force. By contrast, the participation rates for both California and the United States are 10% higher.
Within the NoRTEC region the county with the highest labor force participation rate is Nevada County
(56.6%), while the county with the lowest rate is Lassen County (37.8%).
13 U.S. Census Bureau American Community Survey Five-Year Estimates 2010-2014.
Population 16+ In Labor Force % in Labor
Force
Butte 181,730 101,769 56.0%
Del Norte 22,687 9,914 43.7%
Lassen 28,848 10,905 37.8%
Modoc 7,633 4,015 52.6%
Nevada 82,966 46,959 56.6%
Plumas 16,325 8,718 53.4%
Shasta 144,420 77,409 53.6%
Sierra 2,579 1,295 50.2%
Siskiyou 36,265 18,967 52.3%
Tehama 49,632 26,851 54.1%
Trinity 11,487 5,387 46.9%
NoRTEC 584,572 312,187 53.4%
California 29,934,838 19,098,427 63.9%
United States 248,775,628 158,967,626 63.8%
Regional Labor Market Profile and
Industry/Sector Analysis
P a g e | 17
As noted previously, individuals can be members of the labor force even if they are not currently
employed. Those who are not employed but who are actively looking for work are classified by the U.S.
Department of Labor as unemployed. Like participation rates, what is considered a normal
unemployment rate varies from region to region based on demographics of each population. Generally
speaking, unemployment tends to spike during recessions and following major layoffs or relocations,
eventually settling to a more normal and stable rate as individuals adjust to the new availability of
employment opportunities. Prolonged periods of unusually high unemployment rates are typically a
signal that the supply of workers is not in balance with demand for workers.
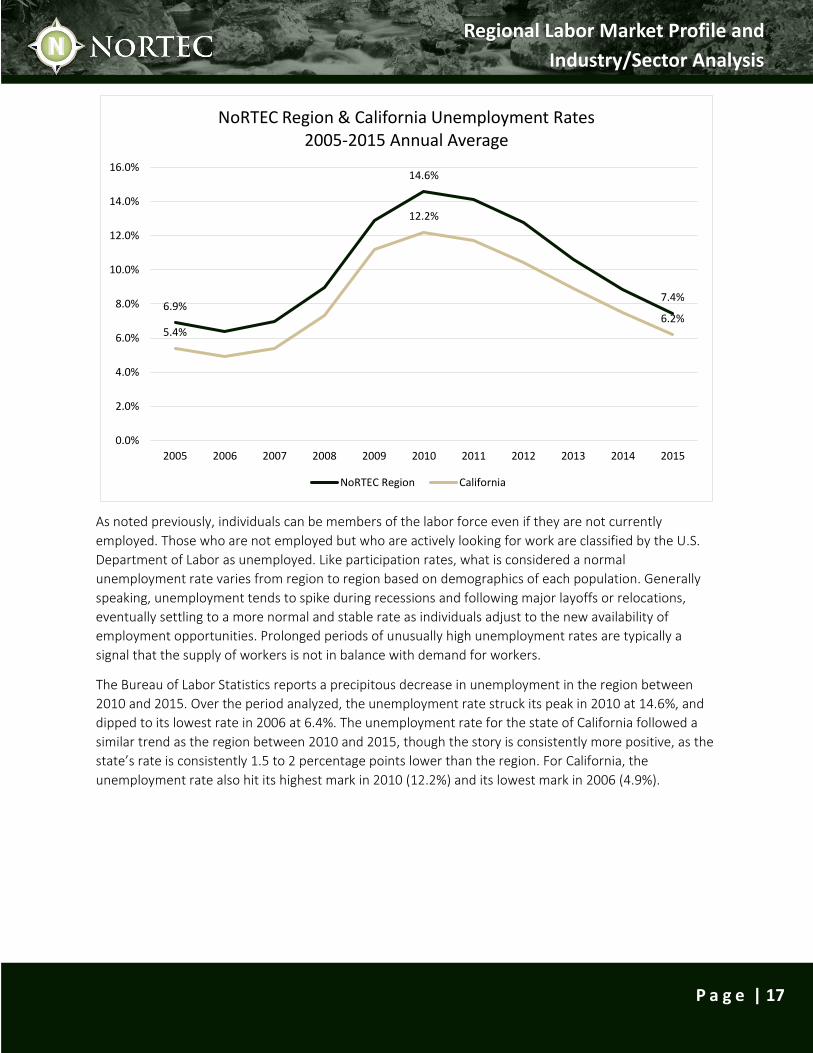
The Bureau of Labor Statistics reports a precipitous decrease in unemployment in the region between
2010 and 2015. Over the period analyzed, the unemployment rate struck its peak in 2010 at 14.6%, and
dipped to its lowest rate in 2006 at 6.4%. The unemployment rate for the state of California followed a
similar trend as the region between 2010 and 2015, though the story is consistently more positive, as the
state’s rate is consistently 1.5 to 2 percentage points lower than the region. For California, the
unemployment rate also hit its highest mark in 2010 (12.2%) and its lowest mark in 2006 (4.9%).
6.9%
14.6%
7.4%
5.4%
12.2%
6.2%
0.0%
2.0%
4.0%
6.0%
8.0%
10.0%
12.0%
14.0%
16.0%
2005 2006 2007 2008 2009 2010 2011 2012 2013 2014 2015
NoRTEC Region & California Unemployment Rates2005-2015 Annual Average
NoRTEC Region California
Regional Labor Market Profile and
Industry/Sector Analysis
P a g e | 18
Industry Sector Analysis
Industry data are classified according to the types of goods and services that are rendered by businesses.
These data indicate past and projected growth trends by sector and reveal sectors in which the region is
well suited to be competitive.
A chart and several tables are displayed related to industry data. Each of the figures data are in
descending order according to 2015 employment. Other data displayed include:
Employment growth over the past five years
Forecasted growth over the next five years
Growth due to competitive effect (CE)
Location quotient (LQ)
The competitive effect (CE) shows, statistically, the amount of job growth that occurred due to regional
factors. CE is calculated by comparing regional growth to the national growth numbers and rate for each
sector. In other words, a positive number indicates the region experienced more growth than was
expected based on national industry performance.
Location Quotient (LQ) measures the employment concentration of an industry in a region and helps to
demonstrate what makes a particular region’s economy unique. LQs greater than 1.0 mean industry-
employment concentration in the region is greater than the national average. LQs above 1.25 generally
indicate concentrations worth noting and also typically indicate that local demand for the products or
services produced by that industry have been met. Above this threshold the industry is likely exporting
products or services outside of the region. In other words these may be industries bringing money into
the region, rather than circulating money already present within the region.14
14 Data from this section are from Economic Modeling Specialists International (EMSI), 2016.1 Class of Worker.
Regional Labor Market Profile and
Industry/Sector Analysis
P a g e | 19
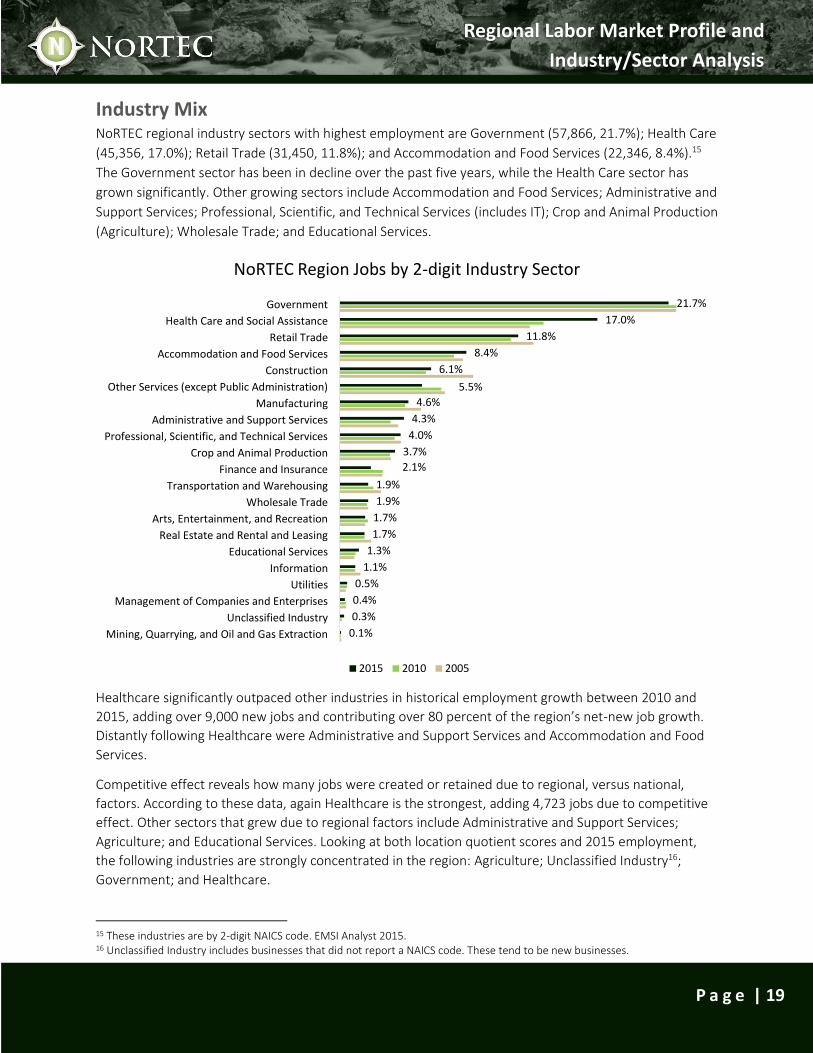
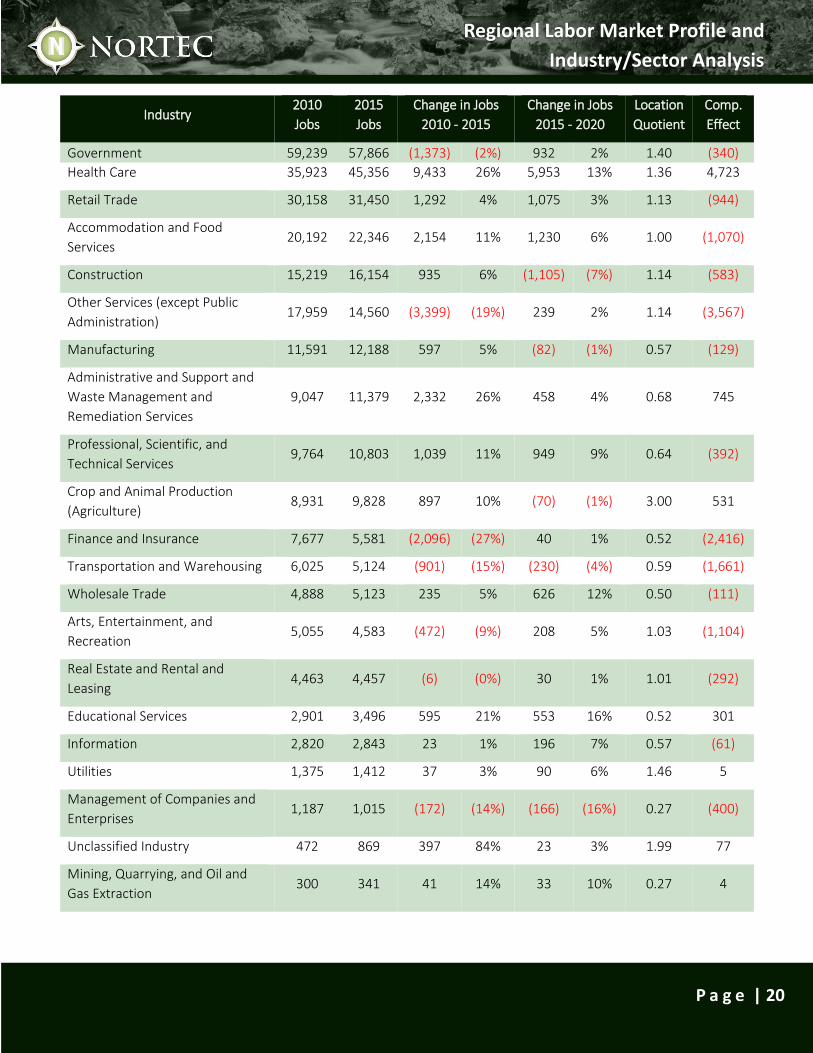
Industry Mix NoRTEC regional industry sectors with highest employment are Government (57,866, 21.7%); Health Care
(45,356, 17.0%); Retail Trade (31,450, 11.8%); and Accommodation and Food Services (22,346, 8.4%).15
The Government sector has been in decline over the past five years, while the Health Care sector has
grown significantly. Other growing sectors include Accommodation and Food Services; Administrative and
Support Services; Professional, Scientific, and Technical Services (includes IT); Crop and Animal Production
(Agriculture); Wholesale Trade; and Educational Services.
Healthcare significantly outpaced other industries in historical employment growth between 2010 and
2015, adding over 9,000 new jobs and contributing over 80 percent of the region’s net-new job growth.
Distantly following Healthcare were Administrative and Support Services and Accommodation and Food
Services.
Competitive effect reveals how many jobs were created or retained due to regional, versus national,
factors. According to these data, again Healthcare is the strongest, adding 4,723 jobs due to competitive
effect. Other sectors that grew due to regional factors include Administrative and Support Services;
Agriculture; and Educational Services. Looking at both location quotient scores and 2015 employment,
the following industries are strongly concentrated in the region: Agriculture; Unclassified Industry16;
Government; and Healthcare.
15 These industries are by 2-digit NAICS code. EMSI Analyst 2015. 16 Unclassified Industry includes businesses that did not report a NAICS code. These tend to be new businesses.
0.1%
0.3%
0.4%
0.5%
1.1%
1.3%
1.7%
1.7%
1.9%
1.9%
2.1%
3.7%
4.0%
4.3%
4.6%
5.5%
6.1%
8.4%
11.8%
17.0%
21.7%
Mining, Quarrying, and Oil and Gas Extraction
Unclassified Industry
Management of Companies and Enterprises
Utilities
Information
Educational Services
Real Estate and Rental and Leasing
Arts, Entertainment, and Recreation
Wholesale Trade
Transportation and Warehousing
Finance and Insurance
Crop and Animal Production
Professional, Scientific, and Technical Services
Administrative and Support Services
Manufacturing
Other Services (except Public Administration)
Construction
Accommodation and Food Services
Retail Trade
Health Care and Social Assistance
Government
NoRTEC Region Jobs by 2-digit Industry Sector
2015 2010 2005
Regional Labor Market Profile and
Industry/Sector Analysis
P a g e | 20
Industry 2010
Jobs
2015
Jobs
Change in Jobs
2010 - 2015
Change in Jobs
2015 - 2020
Location
Quotient
Comp.
Effect
Government 59,239 57,866 (1,373) (2%) 932 2% 1.40 (340)
Health Care 35,923 45,356 9,433 26% 5,953 13% 1.36 4,723
Retail Trade 30,158 31,450 1,292 4% 1,075 3% 1.13 (944)
Accommodation and Food
Services 20,192 22,346 2,154 11% 1,230 6% 1.00 (1,070)
Construction 15,219 16,154 935 6% (1,105) (7%) 1.14 (583)
Other Services (except Public
Administration) 17,959 14,560 (3,399) (19%) 239 2% 1.14 (3,567)
Manufacturing 11,591 12,188 597 5% (82) (1%) 0.57 (129)
Administrative and Support and
Waste Management and
Remediation Services
9,047 11,379 2,332 26% 458 4% 0.68 745
Professional, Scientific, and
Technical Services 9,764 10,803 1,039 11% 949 9% 0.64 (392)
Crop and Animal Production
(Agriculture) 8,931 9,828 897 10% (70) (1%) 3.00 531
Finance and Insurance 7,677 5,581 (2,096) (27%) 40 1% 0.52 (2,416)
Transportation and Warehousing 6,025 5,124 (901) (15%) (230) (4%) 0.59 (1,661)
Wholesale Trade 4,888 5,123 235 5% 626 12% 0.50 (111)
Arts, Entertainment, and
Recreation 5,055 4,583 (472) (9%) 208 5% 1.03 (1,104)
Real Estate and Rental and
Leasing 4,463 4,457 (6) (0%) 30 1% 1.01 (292)
Educational Services 2,901 3,496 595 21% 553 16% 0.52 301
Information 2,820 2,843 23 1% 196 7% 0.57 (61)
Utilities 1,375 1,412 37 3% 90 6% 1.46 5
Management of Companies and
Enterprises 1,187 1,015 (172) (14%) (166) (16%) 0.27 (400)
Unclassified Industry 472 869 397 84% 23 3% 1.99 77
Mining, Quarrying, and Oil and
Gas Extraction 300 341 41 14% 33 10% 0.27 4
Regional Labor Market Profile and
Industry/Sector Analysis
P a g e | 21
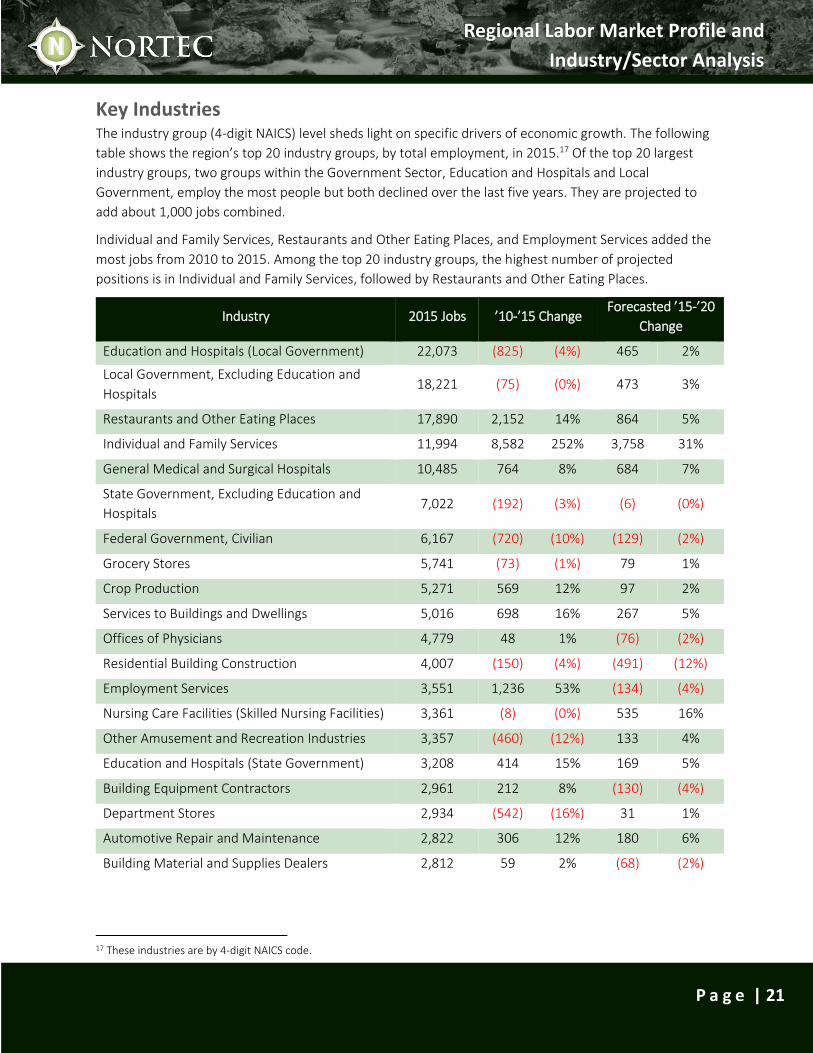
Key Industries
The industry group (4-digit NAICS) level sheds light on specific drivers of economic growth. The following
table shows the region’s top 20 industry groups, by total employment, in 2015.17 Of the top 20 largest
industry groups, two groups within the Government Sector, Education and Hospitals and Local
Government, employ the most people but both declined over the last five years. They are projected to
add about 1,000 jobs combined.
Individual and Family Services, Restaurants and Other Eating Places, and Employment Services added the
most jobs from 2010 to 2015. Among the top 20 industry groups, the highest number of projected
positions is in Individual and Family Services, followed by Restaurants and Other Eating Places.
Industry 2015 Jobs ’10-’15 Change Forecasted ’15-’20
Change
Education and Hospitals (Local Government) 22,073 (825) (4%) 465 2%
Local Government, Excluding Education and
Hospitals 18,221 (75) (0%) 473 3%
Restaurants and Other Eating Places 17,890 2,152 14% 864 5%
Individual and Family Services 11,994 8,582 252% 3,758 31%
General Medical and Surgical Hospitals 10,485 764 8% 684 7%
State Government, Excluding Education and
Hospitals 7,022 (192) (3%) (6) (0%)
Federal Government, Civilian 6,167 (720) (10%) (129) (2%)
Grocery Stores 5,741 (73) (1%) 79 1%
Crop Production 5,271 569 12% 97 2%
Services to Buildings and Dwellings 5,016 698 16% 267 5%
Offices of Physicians 4,779 48 1% (76) (2%)
Residential Building Construction 4,007 (150) (4%) (491) (12%)
Employment Services 3,551 1,236 53% (134) (4%)
Nursing Care Facilities (Skilled Nursing Facilities) 3,361 (8) (0%) 535 16%
Other Amusement and Recreation Industries 3,357 (460) (12%) 133 4%
Education and Hospitals (State Government) 3,208 414 15% 169 5%
Building Equipment Contractors 2,961 212 8% (130) (4%)
Department Stores 2,934 (542) (16%) 31 1%
Automotive Repair and Maintenance 2,822 306 12% 180 6%
Building Material and Supplies Dealers 2,812 59 2% (68) (2%)
17 These industries are by 4-digit NAICS code.
Regional Labor Market Profile and
Industry/Sector Analysis
P a g e | 22
Occupation Analysis An examination of occupational demand is separate and distinct from industry analysis because industries
require a mix of occupations to function. For example, the Manufacturing sector employs occupations
that might be traditionally defined as “manufacturing occupations” – called Production occupations at the
broadest level of occupation classification. The Manufacturing sector, however, also employs managers,
accountants, maintenance and repair personnel, administrative support staff, lawyers, and many other
occupational categories necessary for the industry’s survival. As a workforce development board,
NoRTEC’s mission is to serve individual job seekers and businesses more specifically than serving as
catalysts for industry-specific development. As such, it’s important to understand the specific
occupational roles that are required to keep local businesses flourishing.
The occupational analysis that follows provides a view of the most critical occupations within the region
from an overarching economic perspective and specifically related to some of the key industries that
were highlighted previously.
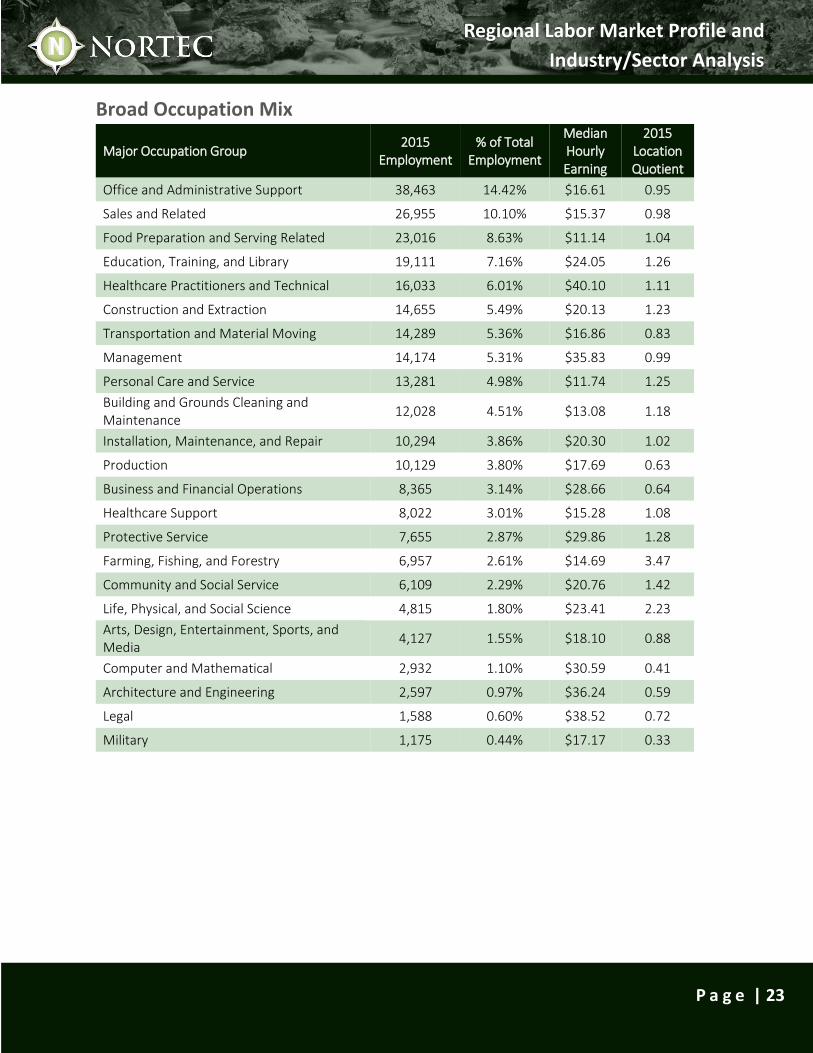
Occupational Groups The region’s top occupation groups18 by total number of jobs include:
Office and Administrative Support (38,463 jobs)
Sales and Related (26,955 jobs)
Food Preparation and Serving Related (23,016 jobs)
Education, Training, and Library (19,111 jobs)
Healthcare Practitioners and Technical (16,033 jobs)
Median hourly earnings at this broad level of occupational classification range from $11.14/hour for Food
Preparation and Serving Occupations to $40.10/hour for Healthcare Practitioners and Technical
Occupations.
As noted in the industry analysis section, location quotient scores can indicate fields where the region has
a strong competitive advantage over other regions in United States. Occupational groups with high LQs
include:
Farming, Fishing and Forestry (3.47)
Life, Physical, and Social Science (2.23)
Community and Social Service (1.42)
Education, Training, and Library (1.26)
Personal Care and Service (1.25)
These are the occupation groups for which the region is highly specialized. For example, jobs in Farming,
Fishing, and Forestry make up 3.5x more of the employment base than they do nationally.
18 Includes 23 major occupational groups at the 2-digic Standard Occupation Classification (SOC) code level
Regional Labor Market Profile and
Industry/Sector Analysis
P a g e | 23
Broad Occupation Mix
Major Occupation Group 2015
Employment % of Total
Employment
Median Hourly Earning
2015 Location Quotient
Office and Administrative Support 38,463 14.42% $16.61 0.95
Sales and Related 26,955 10.10% $15.37 0.98
Food Preparation and Serving Related 23,016 8.63% $11.14 1.04
Education, Training, and Library 19,111 7.16% $24.05 1.26
Healthcare Practitioners and Technical 16,033 6.01% $40.10 1.11
Construction and Extraction 14,655 5.49% $20.13 1.23
Transportation and Material Moving 14,289 5.36% $16.86 0.83
Management 14,174 5.31% $35.83 0.99
Personal Care and Service 13,281 4.98% $11.74 1.25
Building and Grounds Cleaning and Maintenance
12,028 4.51% $13.08 1.18
Installation, Maintenance, and Repair 10,294 3.86% $20.30 1.02
Production 10,129 3.80% $17.69 0.63
Business and Financial Operations 8,365 3.14% $28.66 0.64
Healthcare Support 8,022 3.01% $15.28 1.08
Protective Service 7,655 2.87% $29.86 1.28
Farming, Fishing, and Forestry 6,957 2.61% $14.69 3.47
Community and Social Service 6,109 2.29% $20.76 1.42
Life, Physical, and Social Science 4,815 1.80% $23.41 2.23
Arts, Design, Entertainment, Sports, and Media
4,127 1.55% $18.10 0.88
Computer and Mathematical 2,932 1.10% $30.59 0.41
Architecture and Engineering 2,597 0.97% $36.24 0.59
Legal 1,588 0.60% $38.52 0.72
Military 1,175 0.44% $17.17 0.33
Regional Labor Market Profile and
Industry/Sector Analysis
P a g e | 24
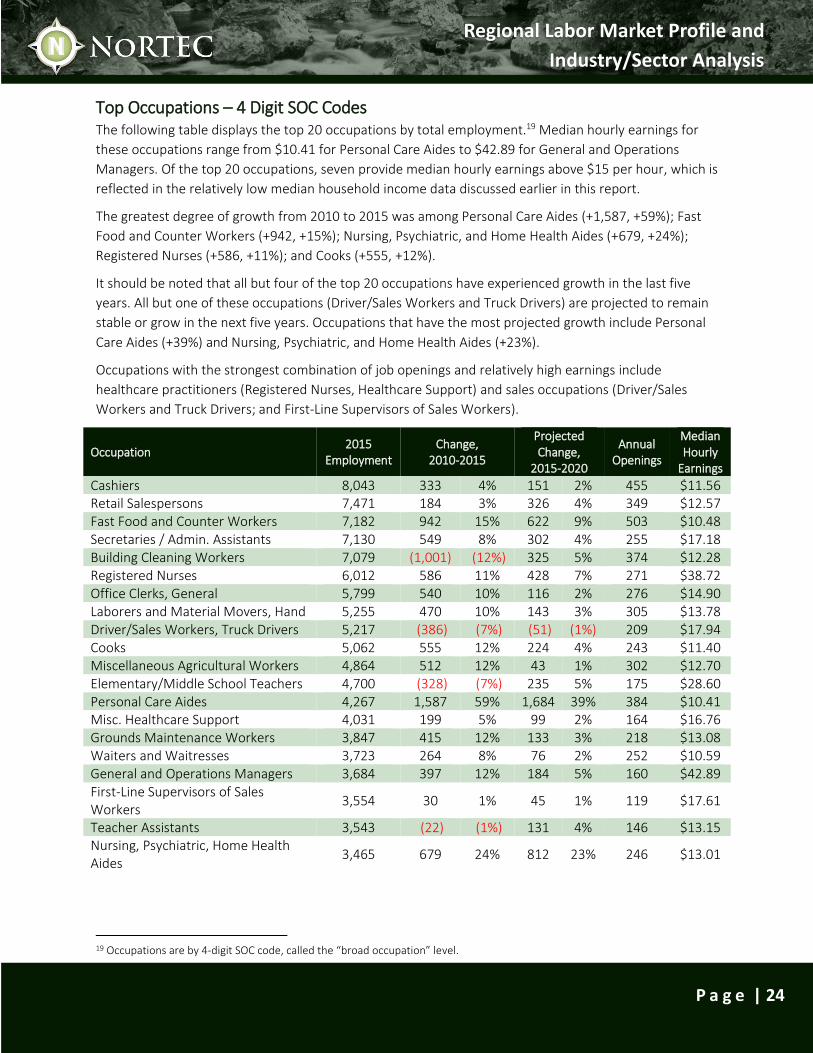
Top Occupations – 4 Digit SOC Codes The following table displays the top 20 occupations by total employment.19 Median hourly earnings for
these occupations range from $10.41 for Personal Care Aides to $42.89 for General and Operations
Managers. Of the top 20 occupations, seven provide median hourly earnings above $15 per hour, which is
reflected in the relatively low median household income data discussed earlier in this report.
The greatest degree of growth from 2010 to 2015 was among Personal Care Aides (+1,587, +59%); Fast
Food and Counter Workers (+942, +15%); Nursing, Psychiatric, and Home Health Aides (+679, +24%);
Registered Nurses (+586, +11%); and Cooks (+555, +12%).
It should be noted that all but four of the top 20 occupations have experienced growth in the last five
years. All but one of these occupations (Driver/Sales Workers and Truck Drivers) are projected to remain
stable or grow in the next five years. Occupations that have the most projected growth include Personal
Care Aides (+39%) and Nursing, Psychiatric, and Home Health Aides (+23%).
Occupations with the strongest combination of job openings and relatively high earnings include
healthcare practitioners (Registered Nurses, Healthcare Support) and sales occupations (Driver/Sales
Workers and Truck Drivers; and First-Line Supervisors of Sales Workers).
Occupation 2015
Employment Change,
2010-2015
Projected Change,
2015-2020
Annual Openings
Median Hourly
Earnings
Cashiers 8,043 333 4% 151 2% 455 $11.56
Retail Salespersons 7,471 184 3% 326 4% 349 $12.57
Fast Food and Counter Workers 7,182 942 15% 622 9% 503 $10.48
Secretaries / Admin. Assistants 7,130 549 8% 302 4% 255 $17.18
Building Cleaning Workers 7,079 (1,001) (12%) 325 5% 374 $12.28
Registered Nurses 6,012 586 11% 428 7% 271 $38.72
Office Clerks, General 5,799 540 10% 116 2% 276 $14.90
Laborers and Material Movers, Hand 5,255 470 10% 143 3% 305 $13.78
Driver/Sales Workers, Truck Drivers 5,217 (386) (7%) (51) (1%) 209 $17.94
Cooks 5,062 555 12% 224 4% 243 $11.40
Miscellaneous Agricultural Workers 4,864 512 12% 43 1% 302 $12.70
Elementary/Middle School Teachers 4,700 (328) (7%) 235 5% 175 $28.60
Personal Care Aides 4,267 1,587 59% 1,684 39% 384 $10.41
Misc. Healthcare Support 4,031 199 5% 99 2% 164 $16.76
Grounds Maintenance Workers 3,847 415 12% 133 3% 218 $13.08
Waiters and Waitresses 3,723 264 8% 76 2% 252 $10.59
General and Operations Managers 3,684 397 12% 184 5% 160 $42.89
First-Line Supervisors of Sales Workers
3,554 30 1% 45 1% 119 $17.61
Teacher Assistants 3,543 (22) (1%) 131 4% 146 $13.15
Nursing, Psychiatric, Home Health Aides
3,465 679 24% 812 23% 246 $13.01
19 Occupations are by 4-digit SOC code, called the “broad occupation” level.
Regional Labor Market Profile and
Industry/Sector Analysis
P a g e | 25
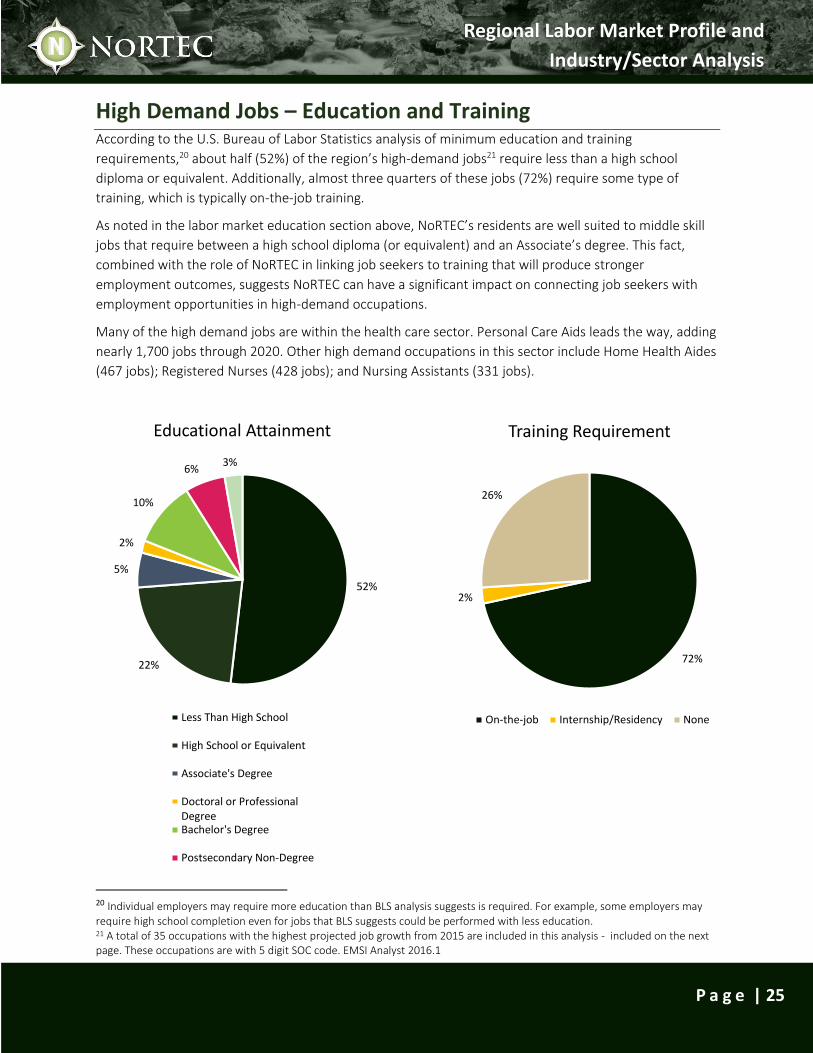
High Demand Jobs – Education and Training According to the U.S. Bureau of Labor Statistics analysis of minimum education and training
requirements,20 about half (52%) of the region’s high-demand jobs21 require less than a high school
diploma or equivalent. Additionally, almost three quarters of these jobs (72%) require some type of
training, which is typically on-the-job training.
As noted in the labor market education section above, NoRTEC’s residents are well suited to middle skill
jobs that require between a high school diploma (or equivalent) and an Associate’s degree. This fact,
combined with the role of NoRTEC in linking job seekers to training that will produce stronger
employment outcomes, suggests NoRTEC can have a significant impact on connecting job seekers with
employment opportunities in high-demand occupations.
Many of the high demand jobs are within the health care sector. Personal Care Aids leads the way, adding
nearly 1,700 jobs through 2020. Other high demand occupations in this sector include Home Health Aides
(467 jobs); Registered Nurses (428 jobs); and Nursing Assistants (331 jobs).
20 Individual employers may require more education than BLS analysis suggests is required. For example, some employers may require high school completion even for jobs that BLS suggests could be performed with less education. 21 A total of 35 occupations with the highest projected job growth from 2015 are included in this analysis - included on the next page. These occupations are with 5 digit SOC code. EMSI Analyst 2016.1
72%
2%
26%
Training Requirement
On-the-job Internship/Residency None
52%
22%
5%
2%
10%
6%3%
Educational Attainment
Less Than High School
High School or Equivalent
Associate's Degree
Doctoral or ProfessionalDegreeBachelor's Degree
Postsecondary Non-Degree
Regional Labor Market Profile and
Industry/Sector Analysis
P a g e | 26
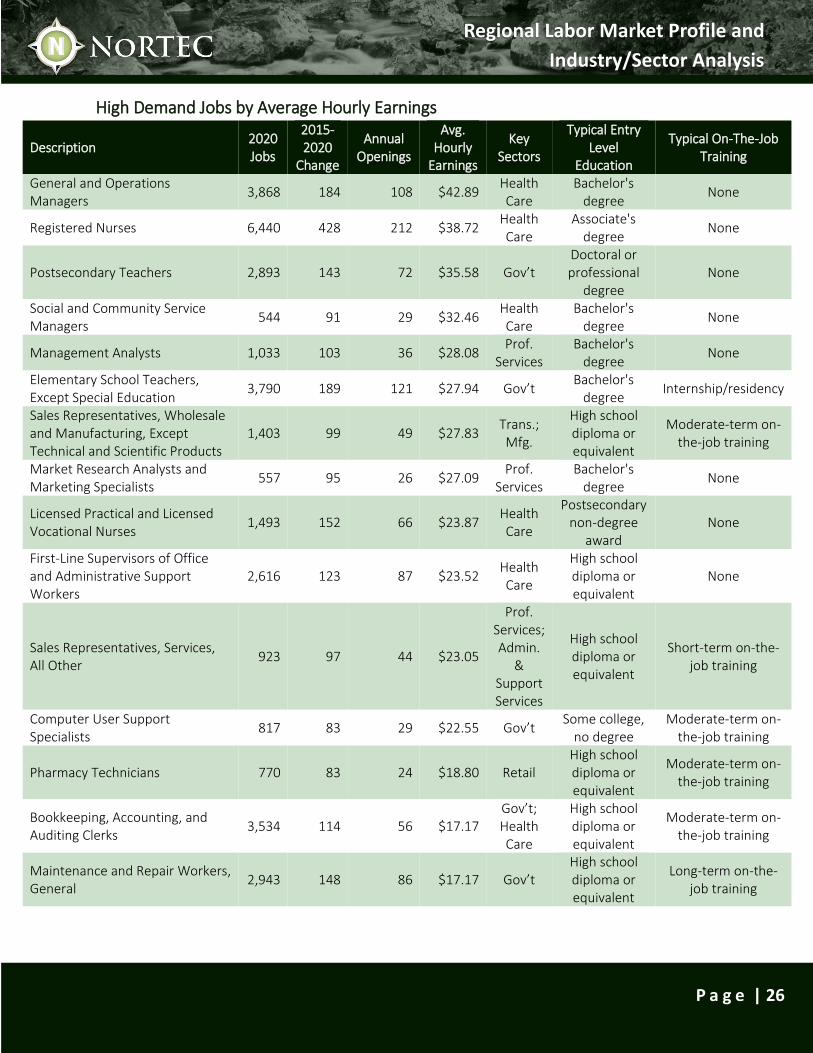
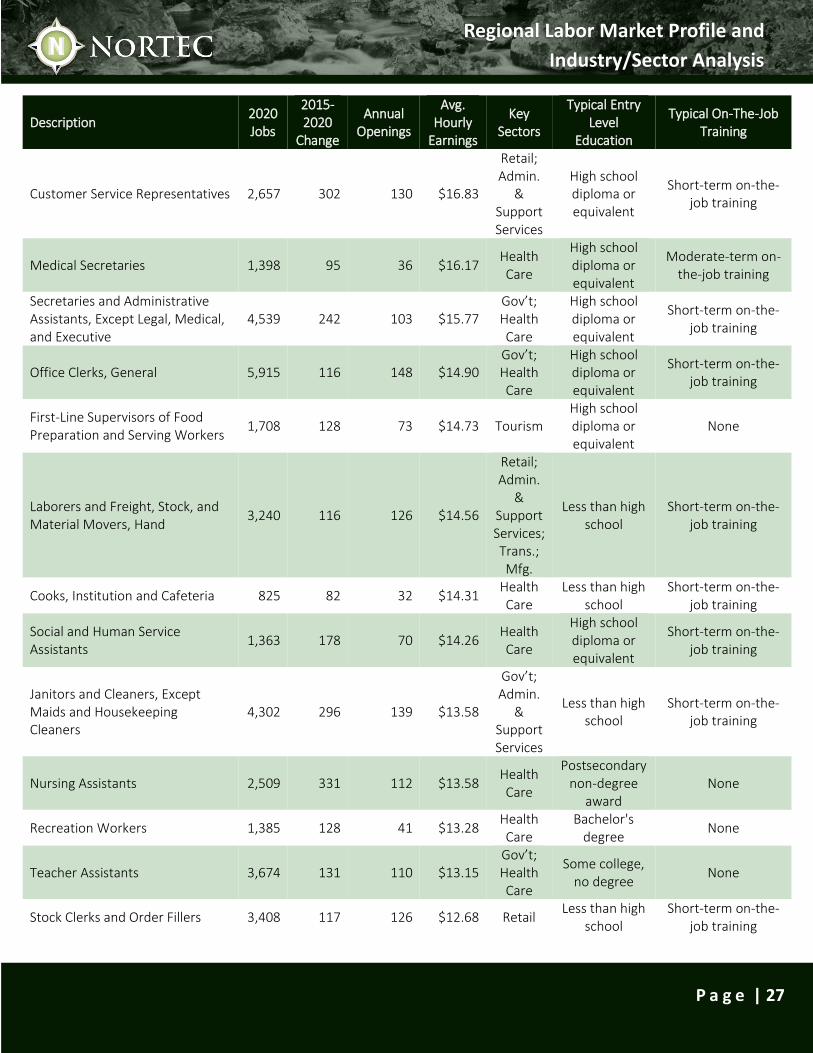
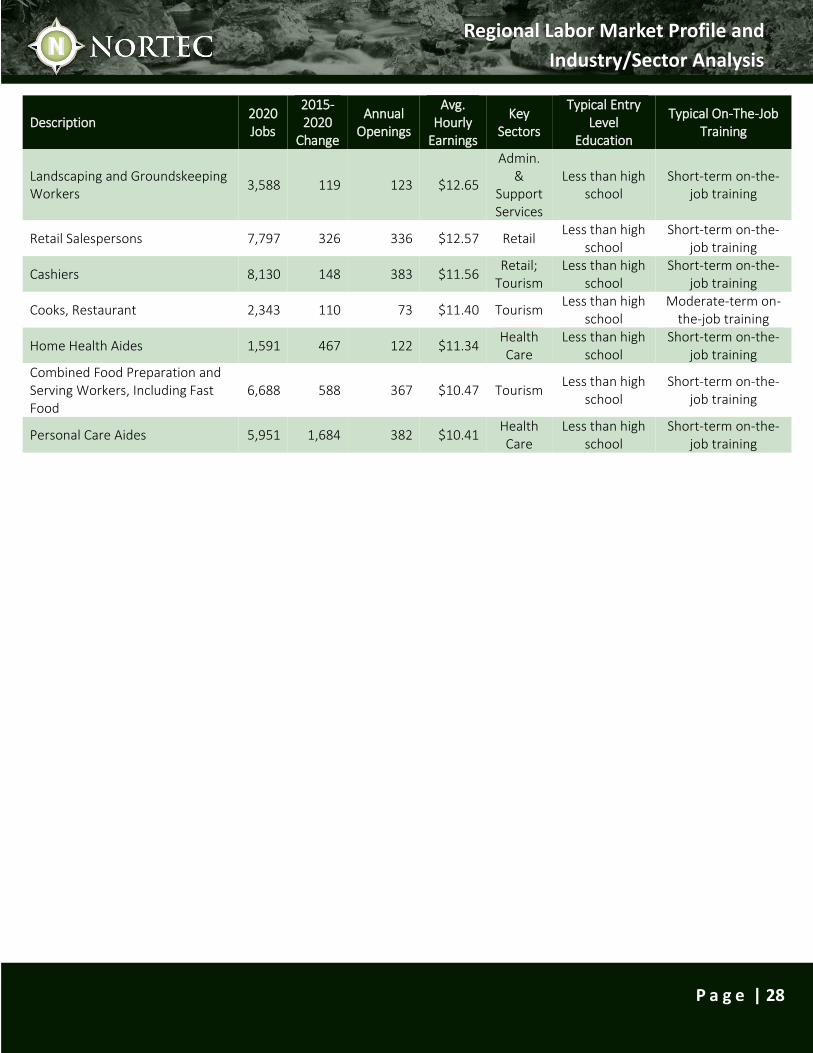
High Demand Jobs by Average Hourly Earnings
Description 2020 Jobs
2015-2020
Change
Annual Openings
Avg. Hourly
Earnings
Key Sectors
Typical Entry Level
Education
Typical On-The-Job Training
General and Operations Managers
3,868 184 108 $42.89 Health Care
Bachelor's degree
None
Registered Nurses 6,440 428 212 $38.72 Health Care
Associate's degree
None
Postsecondary Teachers 2,893 143 72 $35.58 Gov’t Doctoral or professional
degree None
Social and Community Service Managers
544 91 29 $32.46 Health Care
Bachelor's degree
None
Management Analysts 1,033 103 36 $28.08 Prof.
Services Bachelor's
degree None
Elementary School Teachers, Except Special Education
3,790 189 121 $27.94 Gov’t Bachelor's
degree Internship/residency
Sales Representatives, Wholesale and Manufacturing, Except Technical and Scientific Products
1,403 99 49 $27.83 Trans.; Mfg.
High school diploma or equivalent
Moderate-term on-the-job training
Market Research Analysts and Marketing Specialists
557 95 26 $27.09 Prof.
Services Bachelor's
degree None
Licensed Practical and Licensed Vocational Nurses
1,493 152 66 $23.87 Health Care
Postsecondary non-degree
award None
First-Line Supervisors of Office and Administrative Support Workers
2,616 123 87 $23.52 Health Care
High school diploma or equivalent
None
Sales Representatives, Services, All Other
923 97 44 $23.05
Prof. Services; Admin.
& Support Services
High school diploma or equivalent
Short-term on-the-job training
Computer User Support Specialists
817 83 29 $22.55 Gov’t Some college,
no degree Moderate-term on-
the-job training
Pharmacy Technicians 770 83 24 $18.80 Retail High school diploma or equivalent
Moderate-term on-the-job training
Bookkeeping, Accounting, and Auditing Clerks
3,534 114 56 $17.17 Gov’t; Health Care
High school diploma or equivalent
Moderate-term on-the-job training
Maintenance and Repair Workers, General
2,943 148 86 $17.17 Gov’t High school diploma or equivalent
Long-term on-the-job training
Regional Labor Market Profile and
Industry/Sector Analysis
P a g e | 27
Description 2020 Jobs
2015-2020
Change
Annual Openings
Avg. Hourly
Earnings
Key Sectors
Typical Entry Level
Education
Typical On-The-Job Training
Customer Service Representatives 2,657 302 130 $16.83
Retail; Admin.
& Support Services
High school diploma or equivalent
Short-term on-the-job training
Medical Secretaries 1,398 95 36 $16.17 Health Care
High school diploma or equivalent
Moderate-term on-the-job training
Secretaries and Administrative Assistants, Except Legal, Medical, and Executive
4,539 242 103 $15.77 Gov’t; Health Care
High school diploma or equivalent
Short-term on-the-job training
Office Clerks, General 5,915 116 148 $14.90 Gov’t; Health Care
High school diploma or equivalent
Short-term on-the-job training
First-Line Supervisors of Food Preparation and Serving Workers
1,708 128 73 $14.73 Tourism High school diploma or equivalent
None
Laborers and Freight, Stock, and Material Movers, Hand
3,240 116 126 $14.56
Retail; Admin.
& Support Services; Trans.; Mfg.
Less than high school
Short-term on-the-job training
Cooks, Institution and Cafeteria 825 82 32 $14.31 Health Care
Less than high school
Short-term on-the-job training
Social and Human Service Assistants
1,363 178 70 $14.26 Health Care
High school diploma or equivalent
Short-term on-the-job training
Janitors and Cleaners, Except Maids and Housekeeping Cleaners
4,302 296 139 $13.58
Gov’t; Admin.
& Support Services
Less than high school
Short-term on-the-job training
Nursing Assistants 2,509 331 112 $13.58 Health Care
Postsecondary non-degree
award None
Recreation Workers 1,385 128 41 $13.28 Health Care
Bachelor's degree
None
Teacher Assistants 3,674 131 110 $13.15 Gov’t; Health Care
Some college, no degree
None
Stock Clerks and Order Fillers 3,408 117 126 $12.68 Retail Less than high
school Short-term on-the-
job training
Regional Labor Market Profile and
Industry/Sector Analysis
P a g e | 28
Description 2020 Jobs
2015-2020
Change
Annual Openings
Avg. Hourly
Earnings
Key Sectors
Typical Entry Level
Education
Typical On-The-Job Training
Landscaping and Groundskeeping Workers
3,588 119 123 $12.65
Admin. &
Support Services
Less than high school
Short-term on-the-job training
Retail Salespersons 7,797 326 336 $12.57 Retail Less than high
school Short-term on-the-
job training
Cashiers 8,130 148 383 $11.56 Retail;
Tourism Less than high
school Short-term on-the-
job training
Cooks, Restaurant 2,343 110 73 $11.40 Tourism Less than high
school Moderate-term on-
the-job training
Home Health Aides 1,591 467 122 $11.34 Health Care
Less than high school
Short-term on-the-job training
Combined Food Preparation and Serving Workers, Including Fast Food
6,688 588 367 $10.47 Tourism Less than high
school Short-term on-the-
job training
Personal Care Aides 5,951 1,684 382 $10.41 Health Care
Less than high school
Short-term on-the-job training
Regional Labor Market Profile and
Industry/Sector Analysis
P a g e | 29
Job Postings Data The following data come from Emsi’s job posting analytics22 of the top 35 in demand occupations,
collected from de-duplicated, online job ads.
Job postings data, though valuable to understand near-real-time changes in the skills employers advertise
as in-demand, are limited by the online nature of the data, the very real differences in the habits of
posting job ads versus actually filling the position, and the abilities of employers to accurately convey the
skills and certifications they seek. In other words, job postings data can underrepresent real occupational
demand, especially in industries that hire through word of mouth, through low-tech means, or for
businesses that post a single job ad but intend to hire many people for the same job (which sometimes
occurs for fast food and retail service jobs). Job postings data can also overstate real occupational
demand, in industries that “fish” for candidates by posting a greater number of differently worded job
ads than they intend to fill.
It is important, then, to interpret the following data as a representation of employers’ stated in-demand
skills, for those employers who post jobs online. Unless otherwise stated, the timeframe for the data is
August 2015 through August 2016.
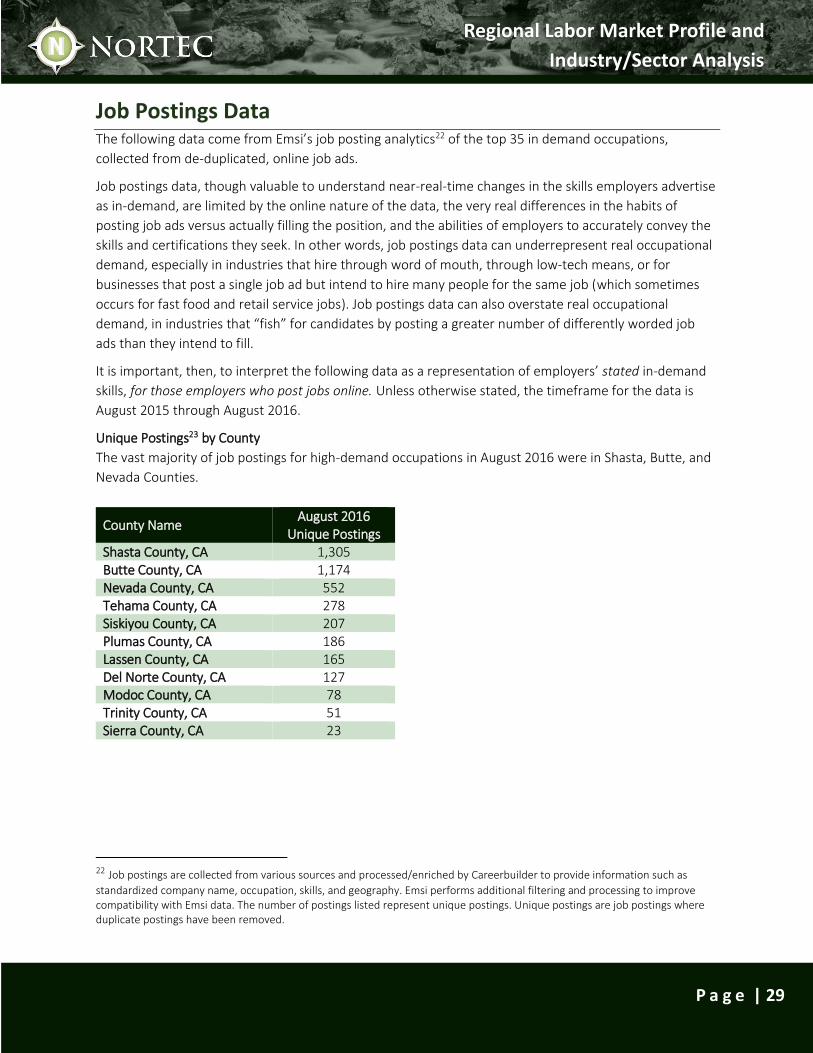
Unique Postings23 by County
The vast majority of job postings for high-demand occupations in August 2016 were in Shasta, Butte, and
Nevada Counties.
County Name August 2016
Unique Postings Shasta County, CA 1,305 Butte County, CA 1,174 Nevada County, CA 552 Tehama County, CA 278 Siskiyou County, CA 207 Plumas County, CA 186 Lassen County, CA 165 Del Norte County, CA 127 Modoc County, CA 78 Trinity County, CA 51 Sierra County, CA 23
22 Job postings are collected from various sources and processed/enriched by Careerbuilder to provide information such as
standardized company name, occupation, skills, and geography. Emsi performs additional filtering and processing to improve compatibility with Emsi data. The number of postings listed represent unique postings. Unique postings are job postings where duplicate postings have been removed.
Regional Labor Market Profile and
Industry/Sector Analysis
P a g e | 30
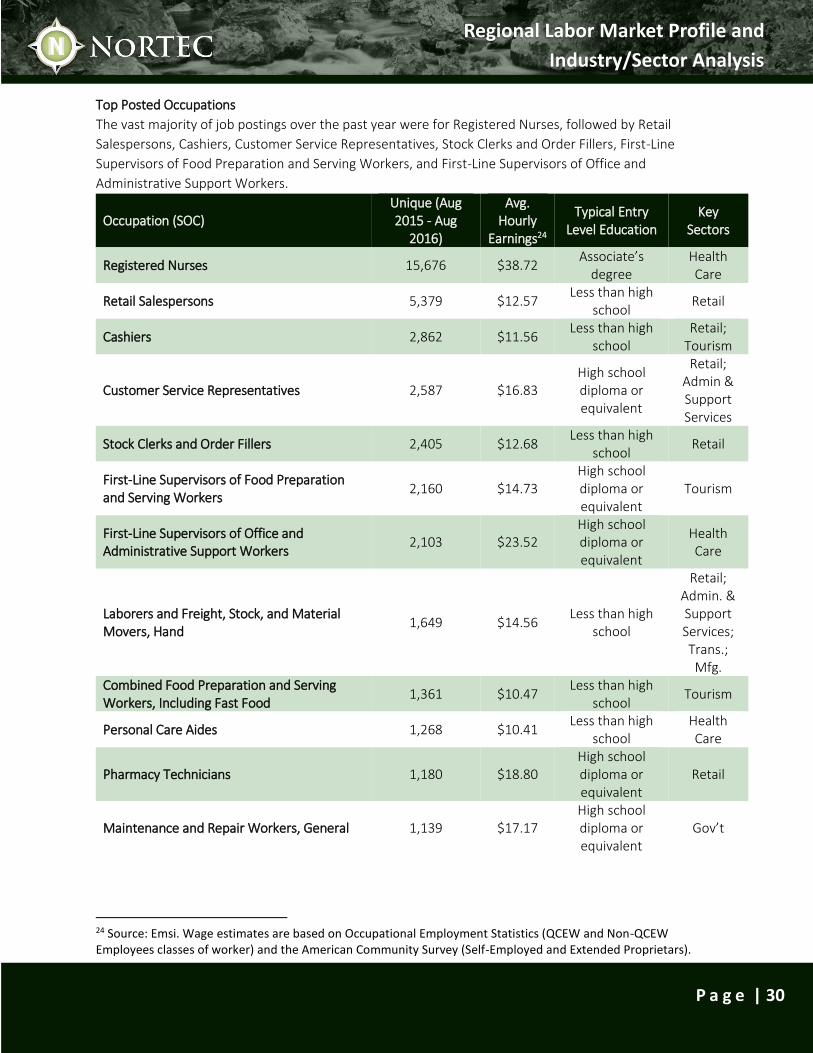
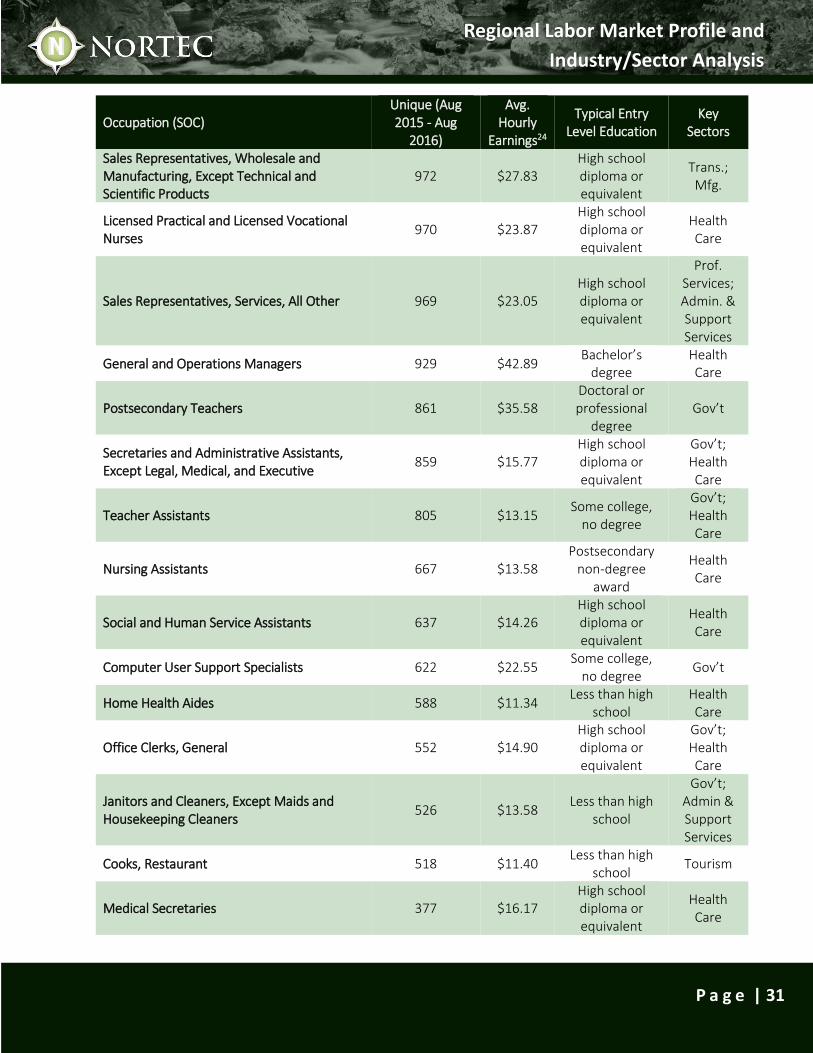
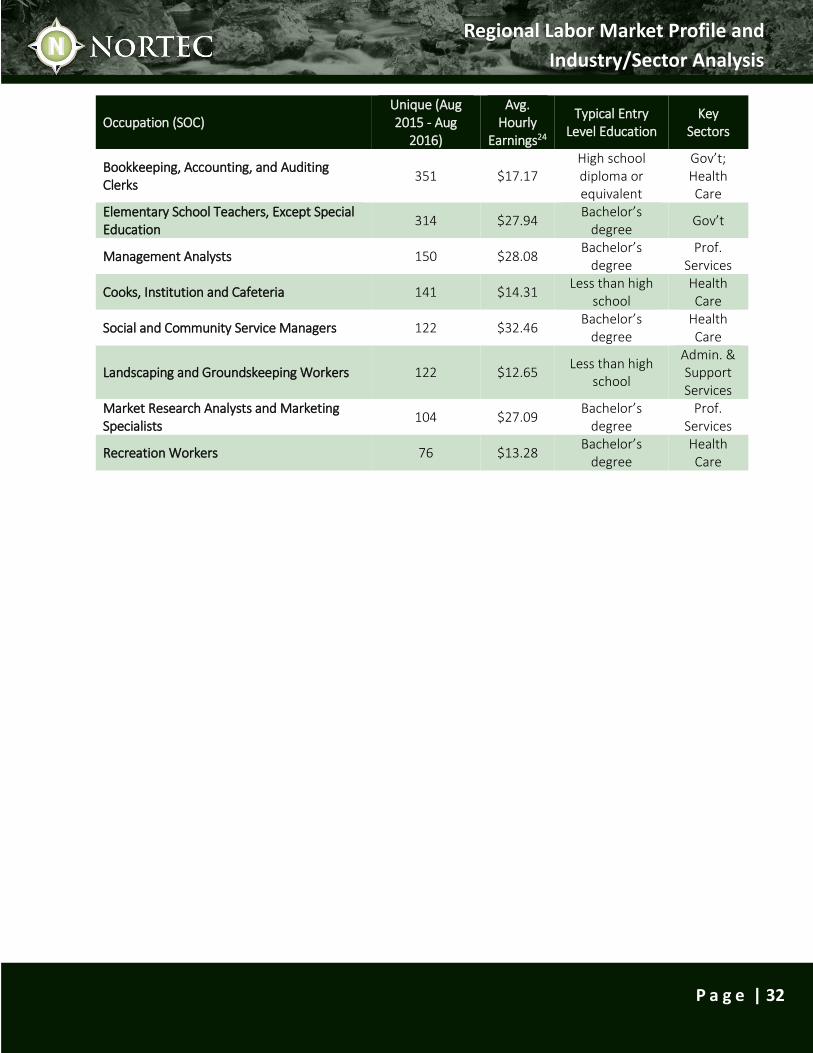
Top Posted Occupations
The vast majority of job postings over the past year were for Registered Nurses, followed by Retail
Salespersons, Cashiers, Customer Service Representatives, Stock Clerks and Order Fillers, First-Line
Supervisors of Food Preparation and Serving Workers, and First-Line Supervisors of Office and
Administrative Support Workers.
Occupation (SOC) Unique (Aug 2015 - Aug
2016)
Avg. Hourly
Earnings24
Typical Entry Level Education
Key Sectors
Registered Nurses 15,676 $38.72 Associate’s
degree Health Care
Retail Salespersons 5,379 $12.57 Less than high
school Retail
Cashiers 2,862 $11.56 Less than high
school Retail;
Tourism
Customer Service Representatives 2,587 $16.83 High school diploma or equivalent
Retail; Admin & Support Services
Stock Clerks and Order Fillers 2,405 $12.68 Less than high
school Retail
First-Line Supervisors of Food Preparation and Serving Workers
2,160 $14.73 High school diploma or equivalent
Tourism
First-Line Supervisors of Office and Administrative Support Workers
2,103 $23.52 High school diploma or equivalent
Health Care
Laborers and Freight, Stock, and Material Movers, Hand
1,649 $14.56 Less than high
school
Retail; Admin. & Support Services; Trans.; Mfg.
Combined Food Preparation and Serving Workers, Including Fast Food
1,361 $10.47 Less than high
school Tourism
Personal Care Aides 1,268 $10.41 Less than high
school Health Care
Pharmacy Technicians 1,180 $18.80 High school diploma or equivalent
Retail
Maintenance and Repair Workers, General 1,139 $17.17 High school diploma or equivalent
Gov’t
24 Source: Emsi. Wage estimates are based on Occupational Employment Statistics (QCEW and Non-QCEW Employees classes of worker) and the American Community Survey (Self-Employed and Extended Proprietars).
Regional Labor Market Profile and
Industry/Sector Analysis
P a g e | 31
Occupation (SOC) Unique (Aug 2015 - Aug
2016)
Avg. Hourly
Earnings24
Typical Entry Level Education
Key Sectors
Sales Representatives, Wholesale and Manufacturing, Except Technical and Scientific Products
972 $27.83 High school diploma or equivalent
Trans.; Mfg.
Licensed Practical and Licensed Vocational Nurses
970 $23.87 High school diploma or equivalent
Health Care
Sales Representatives, Services, All Other 969 $23.05 High school diploma or equivalent
Prof. Services; Admin. & Support Services
General and Operations Managers 929 $42.89 Bachelor’s
degree Health Care
Postsecondary Teachers 861 $35.58 Doctoral or professional
degree Gov’t
Secretaries and Administrative Assistants, Except Legal, Medical, and Executive
859 $15.77 High school diploma or equivalent
Gov’t; Health Care
Teacher Assistants 805 $13.15 Some college,
no degree
Gov’t; Health Care
Nursing Assistants 667 $13.58 Postsecondary
non-degree award
Health Care
Social and Human Service Assistants 637 $14.26 High school diploma or equivalent
Health Care
Computer User Support Specialists 622 $22.55 Some college,
no degree Gov’t
Home Health Aides 588 $11.34 Less than high
school Health Care
Office Clerks, General 552 $14.90 High school diploma or equivalent
Gov’t; Health Care
Janitors and Cleaners, Except Maids and Housekeeping Cleaners
526 $13.58 Less than high
school
Gov’t; Admin & Support Services
Cooks, Restaurant 518 $11.40 Less than high
school Tourism
Medical Secretaries 377 $16.17 High school diploma or equivalent
Health Care
Regional Labor Market Profile and
Industry/Sector Analysis
P a g e | 32
Occupation (SOC) Unique (Aug 2015 - Aug
2016)
Avg. Hourly
Earnings24
Typical Entry Level Education
Key Sectors
Bookkeeping, Accounting, and Auditing Clerks
351 $17.17 High school diploma or equivalent
Gov’t; Health Care
Elementary School Teachers, Except Special Education
314 $27.94 Bachelor’s
degree Gov’t
Management Analysts 150 $28.08 Bachelor’s
degree Prof.
Services
Cooks, Institution and Cafeteria 141 $14.31 Less than high
school Health Care
Social and Community Service Managers 122 $32.46 Bachelor’s
degree Health Care
Landscaping and Groundskeeping Workers 122 $12.65 Less than high
school
Admin. & Support Services
Market Research Analysts and Marketing Specialists
104 $27.09 Bachelor’s
degree Prof.
Services
Recreation Workers 76 $13.28 Bachelor’s
degree Health Care
Regional Labor Market Profile and
Industry/Sector Analysis
P a g e | 33
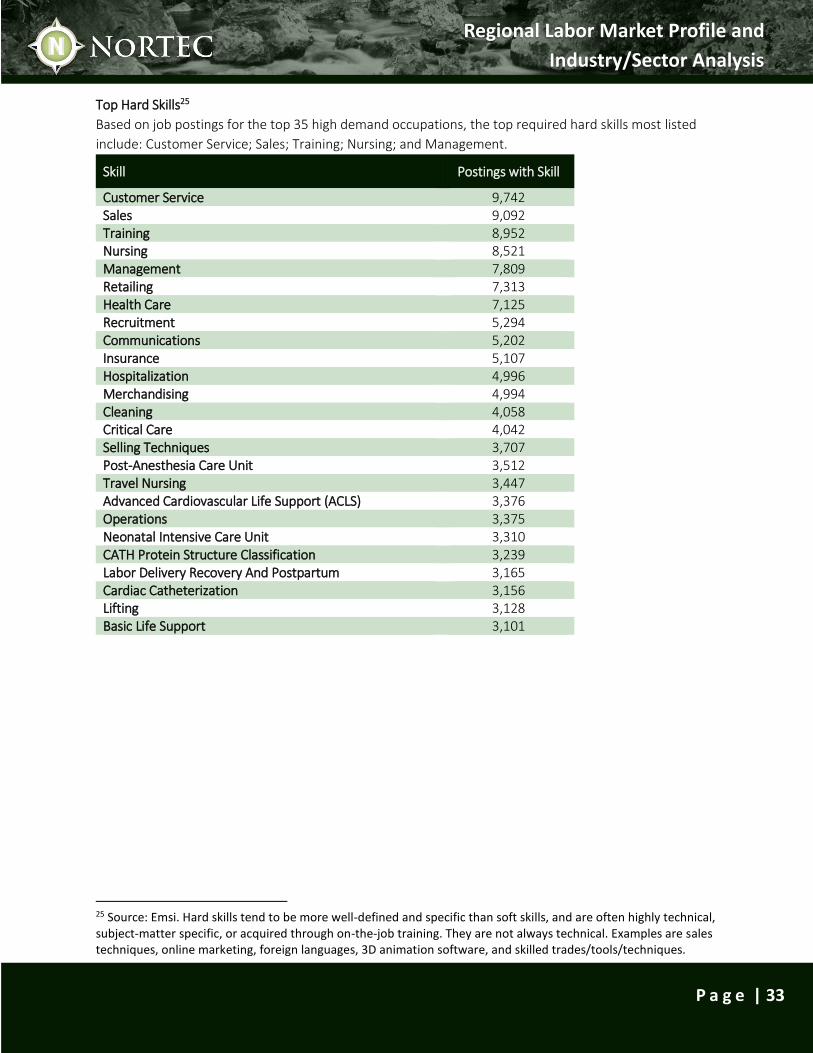
Top Hard Skills25
Based on job postings for the top 35 high demand occupations, the top required hard skills most listed
include: Customer Service; Sales; Training; Nursing; and Management.
Skill Postings with Skill
Customer Service 9,742 Sales 9,092 Training 8,952 Nursing 8,521 Management 7,809 Retailing 7,313 Health Care 7,125 Recruitment 5,294 Communications 5,202 Insurance 5,107 Hospitalization 4,996 Merchandising 4,994 Cleaning 4,058 Critical Care 4,042 Selling Techniques 3,707 Post-Anesthesia Care Unit 3,512 Travel Nursing 3,447 Advanced Cardiovascular Life Support (ACLS) 3,376 Operations 3,375 Neonatal Intensive Care Unit 3,310 CATH Protein Structure Classification 3,239 Labor Delivery Recovery And Postpartum 3,165 Cardiac Catheterization 3,156 Lifting 3,128 Basic Life Support 3,101
25 Source: Emsi. Hard skills tend to be more well-defined and specific than soft skills, and are often highly technical, subject-matter specific, or acquired through on-the-job training. They are not always technical. Examples are sales techniques, online marketing, foreign languages, 3D animation software, and skilled trades/tools/techniques.
Regional Labor Market Profile and
Industry/Sector Analysis
P a g e | 34
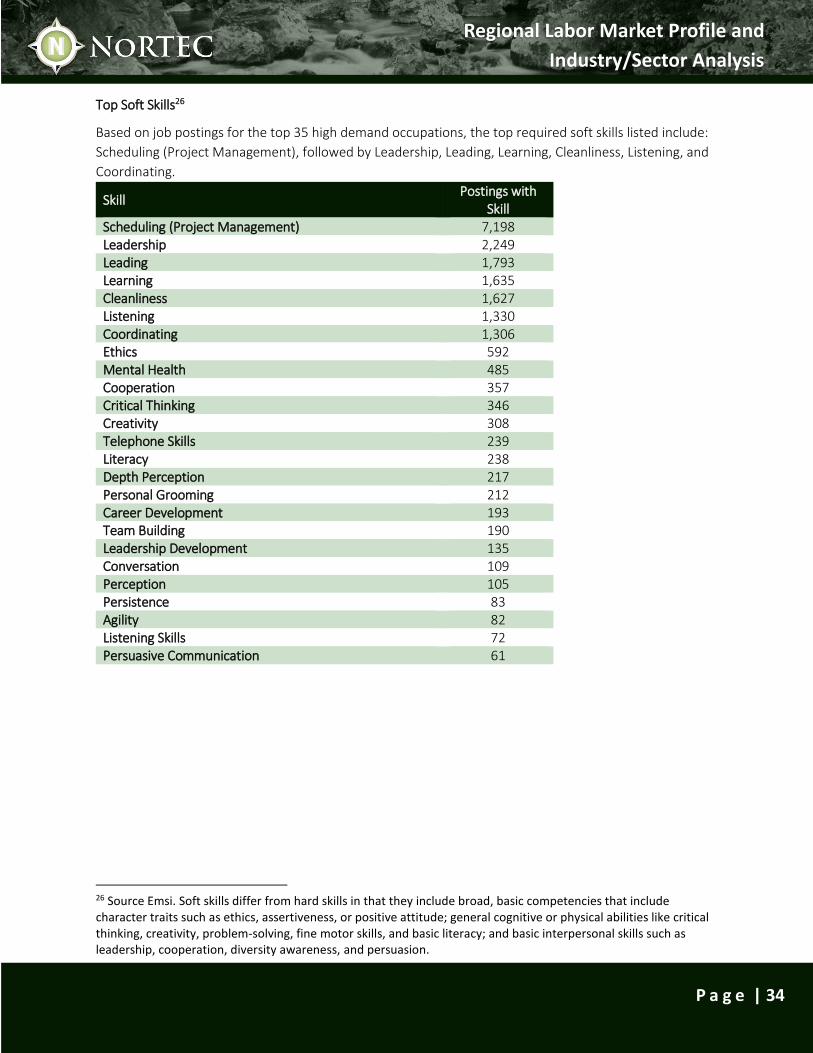
Top Soft Skills26
Based on job postings for the top 35 high demand occupations, the top required soft skills listed include:
Scheduling (Project Management), followed by Leadership, Leading, Learning, Cleanliness, Listening, and
Coordinating.
Skill Postings with
Skill Scheduling (Project Management) 7,198 Leadership 2,249 Leading 1,793 Learning 1,635 Cleanliness 1,627 Listening 1,330 Coordinating 1,306 Ethics 592 Mental Health 485 Cooperation 357 Critical Thinking 346 Creativity 308 Telephone Skills 239 Literacy 238 Depth Perception 217 Personal Grooming 212 Career Development 193 Team Building 190 Leadership Development 135 Conversation 109 Perception 105 Persistence 83 Agility 82 Listening Skills 72 Persuasive Communication 61
26 Source Emsi. Soft skills differ from hard skills in that they include broad, basic competencies that include character traits such as ethics, assertiveness, or positive attitude; general cognitive or physical abilities like critical thinking, creativity, problem-solving, fine motor skills, and basic literacy; and basic interpersonal skills such as leadership, cooperation, diversity awareness, and persuasion.
Regional Labor Market Profile and
Industry/Sector Analysis
P a g e | 35
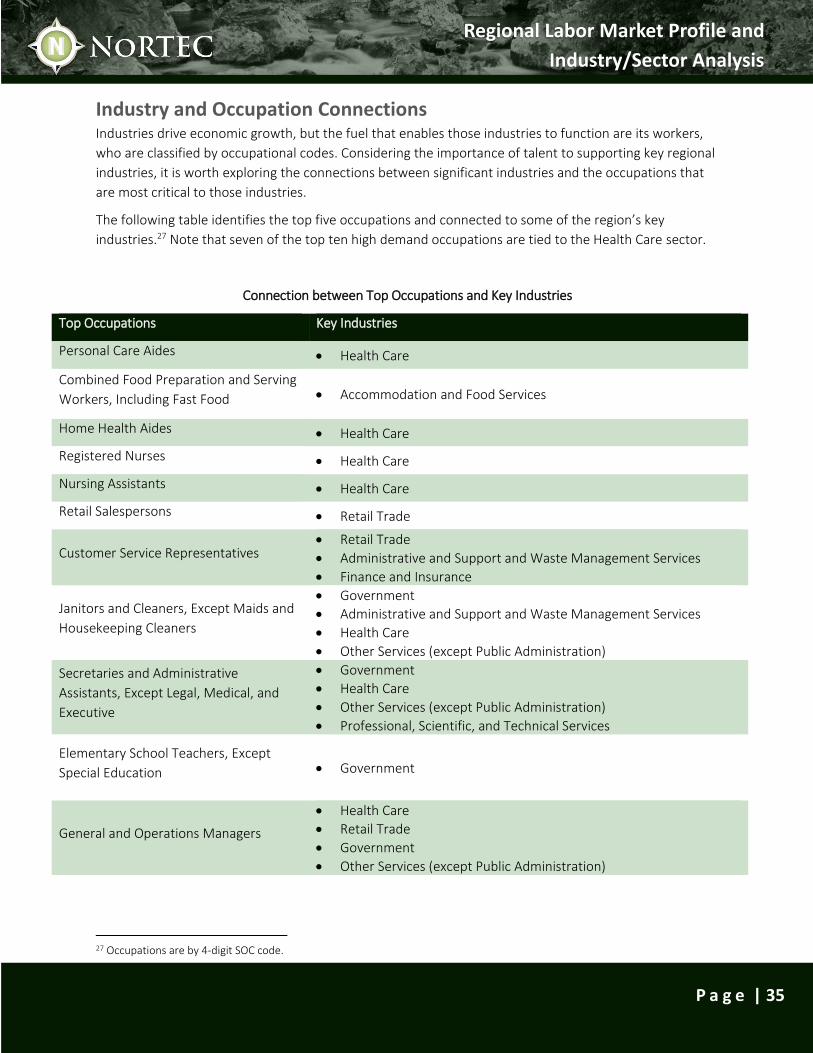
Industry and Occupation Connections
Industries drive economic growth, but the fuel that enables those industries to function are its workers,
who are classified by occupational codes. Considering the importance of talent to supporting key regional
industries, it is worth exploring the connections between significant industries and the occupations that
are most critical to those industries.
The following table identifies the top five occupations and connected to some of the region’s key
industries.27 Note that seven of the top ten high demand occupations are tied to the Health Care sector.
27 Occupations are by 4-digit SOC code.
Connection between Top Occupations and Key Industries
Top Occupations Key Industries
Personal Care Aides Health Care
Combined Food Preparation and Serving
Workers, Including Fast Food Accommodation and Food Services
Home Health Aides Health Care
Registered Nurses Health Care
Nursing Assistants Health Care
Retail Salespersons Retail Trade
Customer Service Representatives Retail Trade
Administrative and Support and Waste Management Services
Finance and Insurance
Janitors and Cleaners, Except Maids and
Housekeeping Cleaners
Government
Administrative and Support and Waste Management Services
Health Care
Other Services (except Public Administration)
Secretaries and Administrative
Assistants, Except Legal, Medical, and
Executive
Government
Health Care
Other Services (except Public Administration)
Professional, Scientific, and Technical Services
Elementary School Teachers, Except
Special Education Government
General and Operations Managers
Health Care
Retail Trade
Government
Other Services (except Public Administration)
Regional Labor Market Profile and
Industry/Sector Analysis
P a g e | 36
Detailed Industry Analysis The following section provides an in-depth look at sectors that are important to the regional economy.
These industry sectors include: Health Care; Manufacturing; Information Technology (IT); Agriculture; and
Tourism. For each of these sectors, the top sub sectors by employment are listed by 4-digit NAICS code,
as well as the staffing patterns for each sector. The staffing patterns show the top occupations by
employment at the 4-digit SOC level. Trends in employment and wage information are also provided.
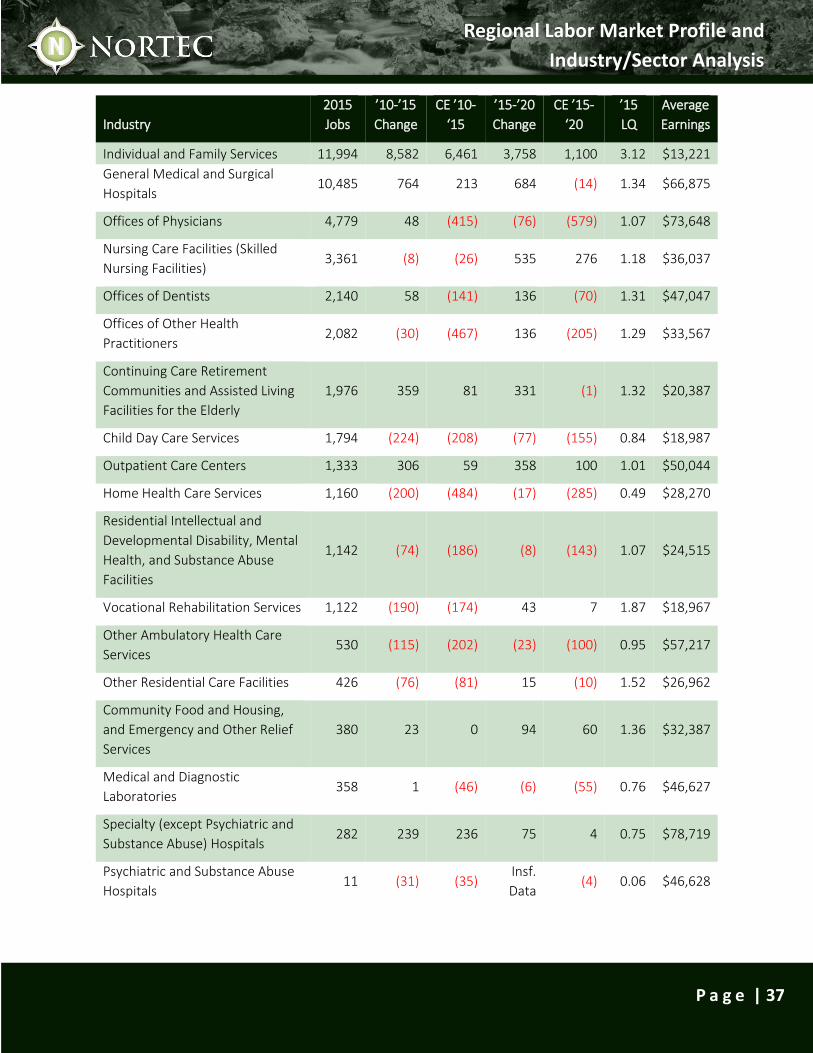
Health Care by Employment – (4-Digit NAICS) The largest sectors by employment include Individual and Family Services (11,994); General Medical and
Surgical Hospitals (10,485); Offices of Physicians (4,779); and Nursing Care Facilities (Skilled Nursing
Facilities) (3,361). Individual and Family Services and Vocational Rehabilitation Services have the highest
LQ. Over the past five years the most significant growth has been within Individual and Family Services
and General Medical and Surgical Hospitals. Both are projected to grow over the next five years to 2020,
with especially high growth in Individual and Family Services.
The individual industries within the Health Care sector are a mix of high-paying and low-paying. The
sector paying the highest average wages is Specialty (except Psychiatric and Substance Abuse) Hospitals
($78,719), while the sector with the lowest average wages is Individual and Family Services ($13,221). It is
worth noting that this sector is also one of the largest employers in the County and it is a growing sector.
Regional Labor Market Profile and
Industry/Sector Analysis
P a g e | 37
Industry
2015
Jobs
’10-’15
Change
CE ’10-
‘15
’15-’20
Change
CE ’15-
‘20
’15
LQ
Average
Earnings
Individual and Family Services 11,994 8,582 6,461 3,758 1,100 3.12 $13,221
General Medical and Surgical
Hospitals 10,485 764 213 684 (14) 1.34 $66,875
Offices of Physicians 4,779 48 (415) (76) (579) 1.07 $73,648
Nursing Care Facilities (Skilled
Nursing Facilities) 3,361 (8) (26) 535 276 1.18 $36,037
Offices of Dentists 2,140 58 (141) 136 (70) 1.31 $47,047
Offices of Other Health
Practitioners 2,082 (30) (467) 136 (205) 1.29 $33,567
Continuing Care Retirement
Communities and Assisted Living
Facilities for the Elderly
1,976 359 81 331 (1) 1.32 $20,387
Child Day Care Services 1,794 (224) (208) (77) (155) 0.84 $18,987
Outpatient Care Centers 1,333 306 59 358 100 1.01 $50,044
Home Health Care Services 1,160 (200) (484) (17) (285) 0.49 $28,270
Residential Intellectual and
Developmental Disability, Mental
Health, and Substance Abuse
Facilities
1,142 (74) (186) (8) (143) 1.07 $24,515
Vocational Rehabilitation Services 1,122 (190) (174) 43 7 1.87 $18,967
Other Ambulatory Health Care
Services 530 (115) (202) (23) (100) 0.95 $57,217
Other Residential Care Facilities 426 (76) (81) 15 (10) 1.52 $26,962
Community Food and Housing,
and Emergency and Other Relief
Services
380 23 0 94 60 1.36 $32,387
Medical and Diagnostic
Laboratories 358 1 (46) (6) (55) 0.76 $46,627
Specialty (except Psychiatric and
Substance Abuse) Hospitals 282 239 236 75 4 0.75 $78,719
Psychiatric and Substance Abuse
Hospitals 11 (31) (35)
Insf.
Data (4) 0.06 $46,628
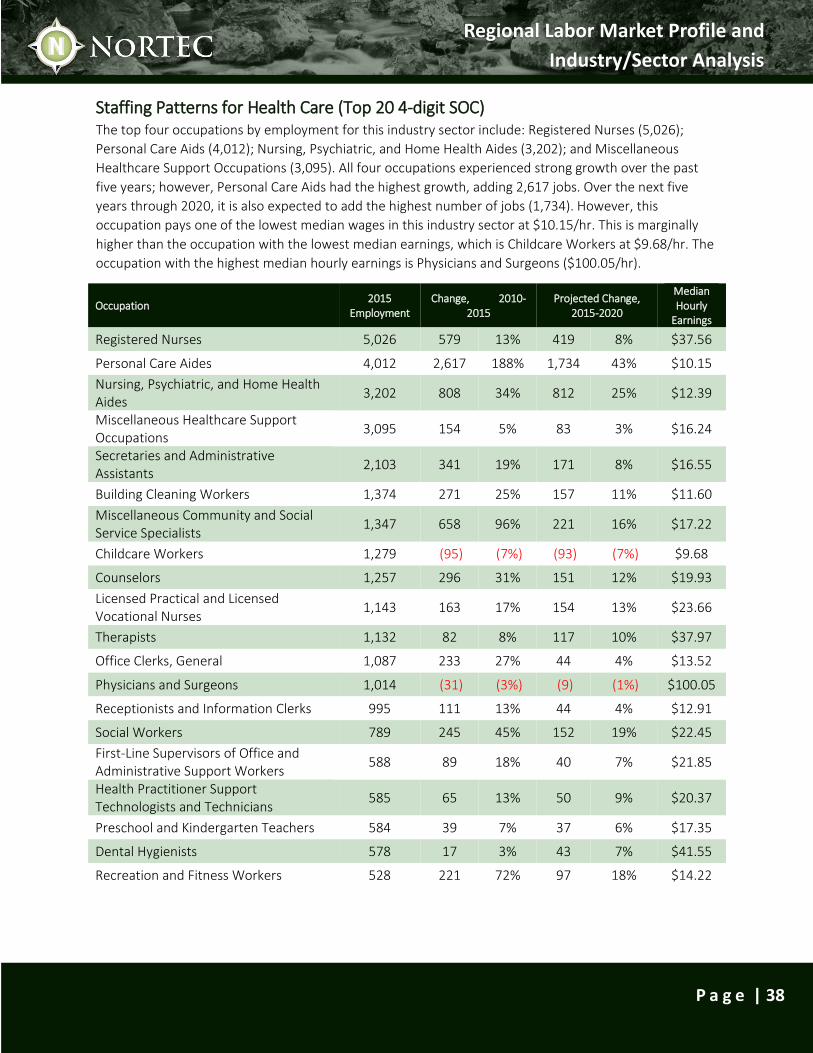
Regional Labor Market Profile and
Industry/Sector Analysis
P a g e | 38
Staffing Patterns for Health Care (Top 20 4-digit SOC) The top four occupations by employment for this industry sector include: Registered Nurses (5,026);
Personal Care Aids (4,012); Nursing, Psychiatric, and Home Health Aides (3,202); and Miscellaneous
Healthcare Support Occupations (3,095). All four occupations experienced strong growth over the past
five years; however, Personal Care Aids had the highest growth, adding 2,617 jobs. Over the next five
years through 2020, it is also expected to add the highest number of jobs (1,734). However, this
occupation pays one of the lowest median wages in this industry sector at $10.15/hr. This is marginally
higher than the occupation with the lowest median earnings, which is Childcare Workers at $9.68/hr. The
occupation with the highest median hourly earnings is Physicians and Surgeons ($100.05/hr).
Occupation 2015
Employment Change, 2010-
2015 Projected Change,
2015-2020
Median Hourly
Earnings
Registered Nurses 5,026 579 13% 419 8% $37.56
Personal Care Aides 4,012 2,617 188% 1,734 43% $10.15
Nursing, Psychiatric, and Home Health Aides
3,202 808 34% 812 25% $12.39
Miscellaneous Healthcare Support Occupations
3,095 154 5% 83 3% $16.24
Secretaries and Administrative Assistants
2,103 341 19% 171 8% $16.55
Building Cleaning Workers 1,374 271 25% 157 11% $11.60
Miscellaneous Community and Social Service Specialists
1,347 658 96% 221 16% $17.22
Childcare Workers 1,279 (95) (7%) (93) (7%) $9.68
Counselors 1,257 296 31% 151 12% $19.93
Licensed Practical and Licensed Vocational Nurses
1,143 163 17% 154 13% $23.66
Therapists 1,132 82 8% 117 10% $37.97
Office Clerks, General 1,087 233 27% 44 4% $13.52
Physicians and Surgeons 1,014 (31) (3%) (9) (1%) $100.05
Receptionists and Information Clerks 995 111 13% 44 4% $12.91
Social Workers 789 245 45% 152 19% $22.45
First-Line Supervisors of Office and Administrative Support Workers
588 89 18% 40 7% $21.85
Health Practitioner Support Technologists and Technicians
585 65 13% 50 9% $20.37
Preschool and Kindergarten Teachers 584 39 7% 37 6% $17.35
Dental Hygienists 578 17 3% 43 7% $41.55
Recreation and Fitness Workers 528 221 72% 97 18% $14.22
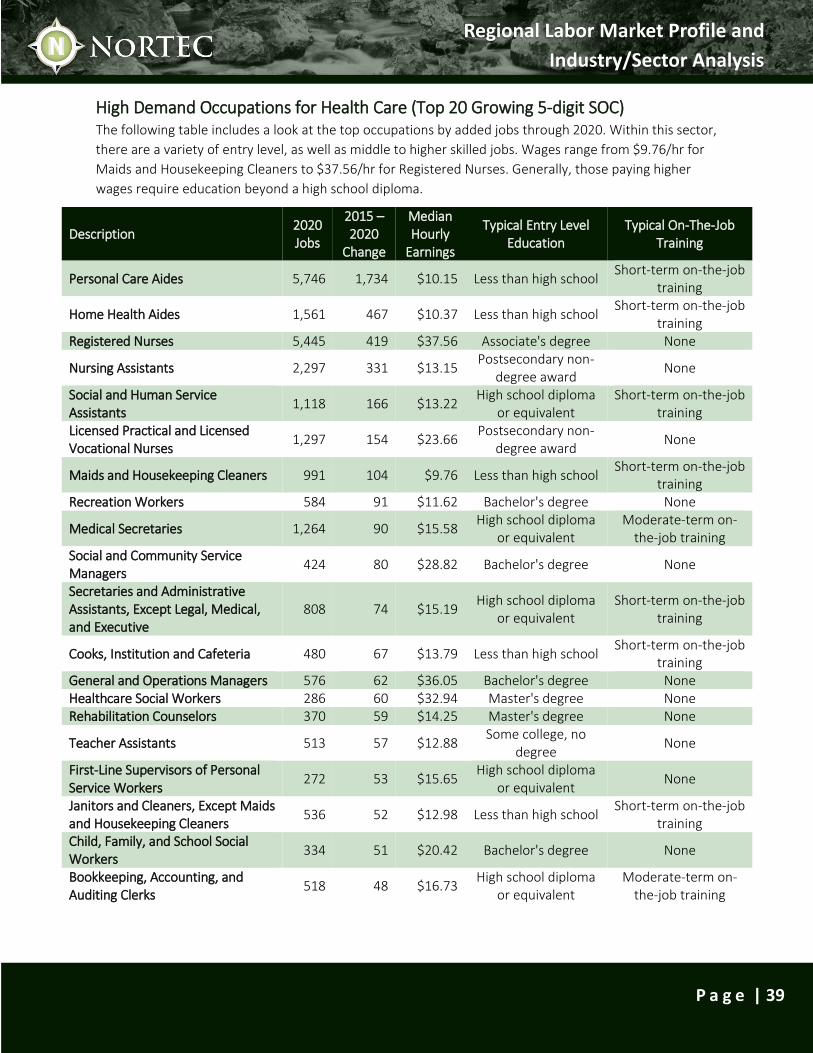
Regional Labor Market Profile and
Industry/Sector Analysis
P a g e | 39
High Demand Occupations for Health Care (Top 20 Growing 5-digit SOC) The following table includes a look at the top occupations by added jobs through 2020. Within this sector,
there are a variety of entry level, as well as middle to higher skilled jobs. Wages range from $9.76/hr for
Maids and Housekeeping Cleaners to $37.56/hr for Registered Nurses. Generally, those paying higher
wages require education beyond a high school diploma.
Description 2020 Jobs
2015 – 2020
Change
Median Hourly
Earnings
Typical Entry Level Education
Typical On-The-Job Training
Personal Care Aides 5,746 1,734 $10.15 Less than high school Short-term on-the-job
training
Home Health Aides 1,561 467 $10.37 Less than high school Short-term on-the-job
training Registered Nurses 5,445 419 $37.56 Associate's degree None
Nursing Assistants 2,297 331 $13.15 Postsecondary non-
degree award None
Social and Human Service Assistants
1,118 166 $13.22 High school diploma
or equivalent Short-term on-the-job
training Licensed Practical and Licensed Vocational Nurses
1,297 154 $23.66 Postsecondary non-
degree award None
Maids and Housekeeping Cleaners 991 104 $9.76 Less than high school Short-term on-the-job
training Recreation Workers 584 91 $11.62 Bachelor's degree None
Medical Secretaries 1,264 90 $15.58 High school diploma
or equivalent Moderate-term on-
the-job training Social and Community Service Managers
424 80 $28.82 Bachelor's degree None
Secretaries and Administrative Assistants, Except Legal, Medical, and Executive
808 74 $15.19 High school diploma
or equivalent Short-term on-the-job
training
Cooks, Institution and Cafeteria 480 67 $13.79 Less than high school Short-term on-the-job
training General and Operations Managers 576 62 $36.05 Bachelor's degree None Healthcare Social Workers 286 60 $32.94 Master's degree None Rehabilitation Counselors 370 59 $14.25 Master's degree None
Teacher Assistants 513 57 $12.88 Some college, no
degree None
First-Line Supervisors of Personal Service Workers
272 53 $15.65 High school diploma
or equivalent None
Janitors and Cleaners, Except Maids and Housekeeping Cleaners
536 52 $12.98 Less than high school Short-term on-the-job
training Child, Family, and School Social Workers
334 51 $20.42 Bachelor's degree None
Bookkeeping, Accounting, and Auditing Clerks
518 48 $16.73 High school diploma
or equivalent Moderate-term on-
the-job training
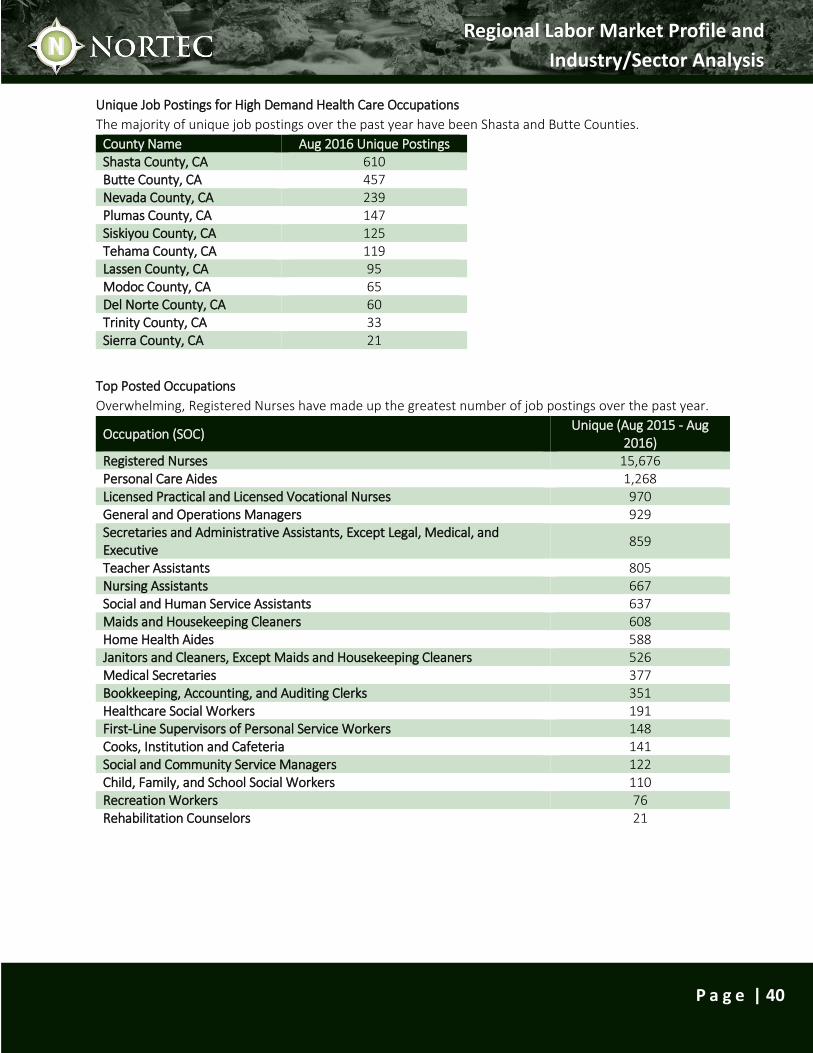
Regional Labor Market Profile and
Industry/Sector Analysis
P a g e | 40
Unique Job Postings for High Demand Health Care Occupations
The majority of unique job postings over the past year have been Shasta and Butte Counties.
County Name Aug 2016 Unique Postings Shasta County, CA 610 Butte County, CA 457 Nevada County, CA 239 Plumas County, CA 147 Siskiyou County, CA 125 Tehama County, CA 119 Lassen County, CA 95 Modoc County, CA 65 Del Norte County, CA 60 Trinity County, CA 33 Sierra County, CA 21
Top Posted Occupations
Overwhelming, Registered Nurses have made up the greatest number of job postings over the past year.
Occupation (SOC) Unique (Aug 2015 - Aug
2016) Registered Nurses 15,676 Personal Care Aides 1,268 Licensed Practical and Licensed Vocational Nurses 970 General and Operations Managers 929 Secretaries and Administrative Assistants, Except Legal, Medical, and Executive
859
Teacher Assistants 805 Nursing Assistants 667 Social and Human Service Assistants 637 Maids and Housekeeping Cleaners 608 Home Health Aides 588 Janitors and Cleaners, Except Maids and Housekeeping Cleaners 526 Medical Secretaries 377 Bookkeeping, Accounting, and Auditing Clerks 351 Healthcare Social Workers 191 First-Line Supervisors of Personal Service Workers 148 Cooks, Institution and Cafeteria 141 Social and Community Service Managers 122 Child, Family, and School Social Workers 110 Recreation Workers 76 Rehabilitation Counselors 21
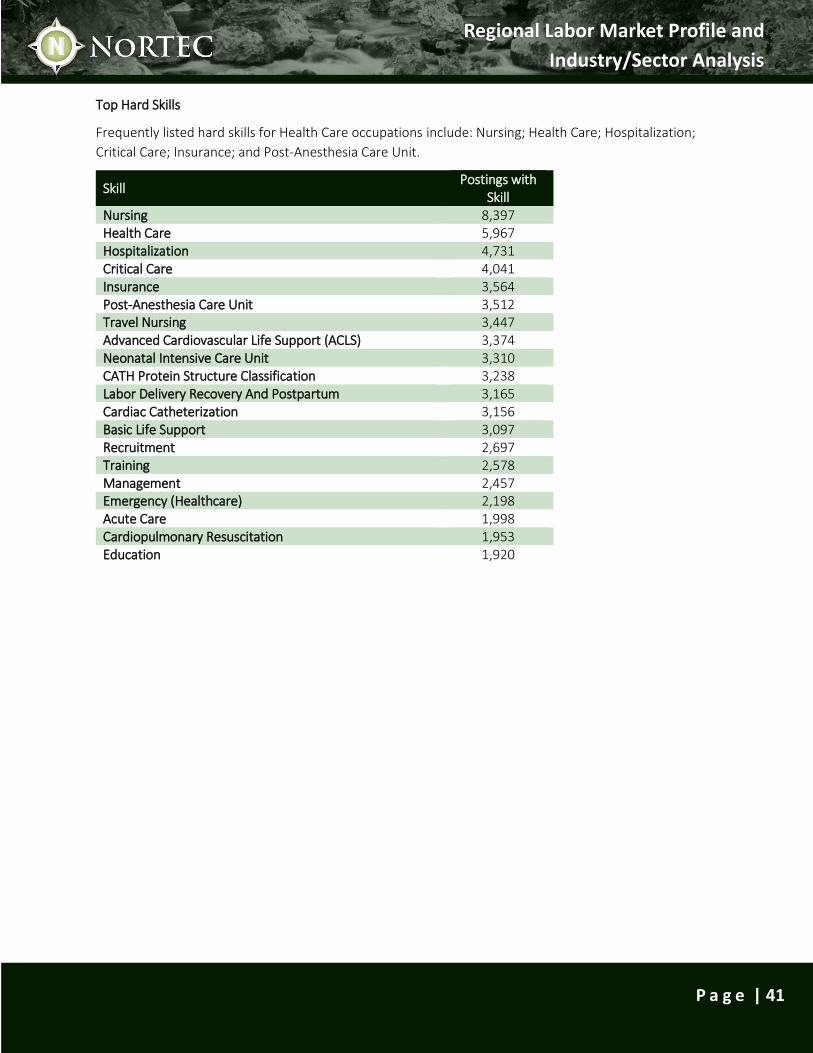
Regional Labor Market Profile and
Industry/Sector Analysis
P a g e | 41
Top Hard Skills
Frequently listed hard skills for Health Care occupations include: Nursing; Health Care; Hospitalization;
Critical Care; Insurance; and Post-Anesthesia Care Unit.
Skill Postings with
Skill Nursing 8,397 Health Care 5,967 Hospitalization 4,731 Critical Care 4,041 Insurance 3,564 Post-Anesthesia Care Unit 3,512 Travel Nursing 3,447 Advanced Cardiovascular Life Support (ACLS) 3,374 Neonatal Intensive Care Unit 3,310 CATH Protein Structure Classification 3,238 Labor Delivery Recovery And Postpartum 3,165 Cardiac Catheterization 3,156 Basic Life Support 3,097 Recruitment 2,697 Training 2,578 Management 2,457 Emergency (Healthcare) 2,198 Acute Care 1,998 Cardiopulmonary Resuscitation 1,953 Education 1,920
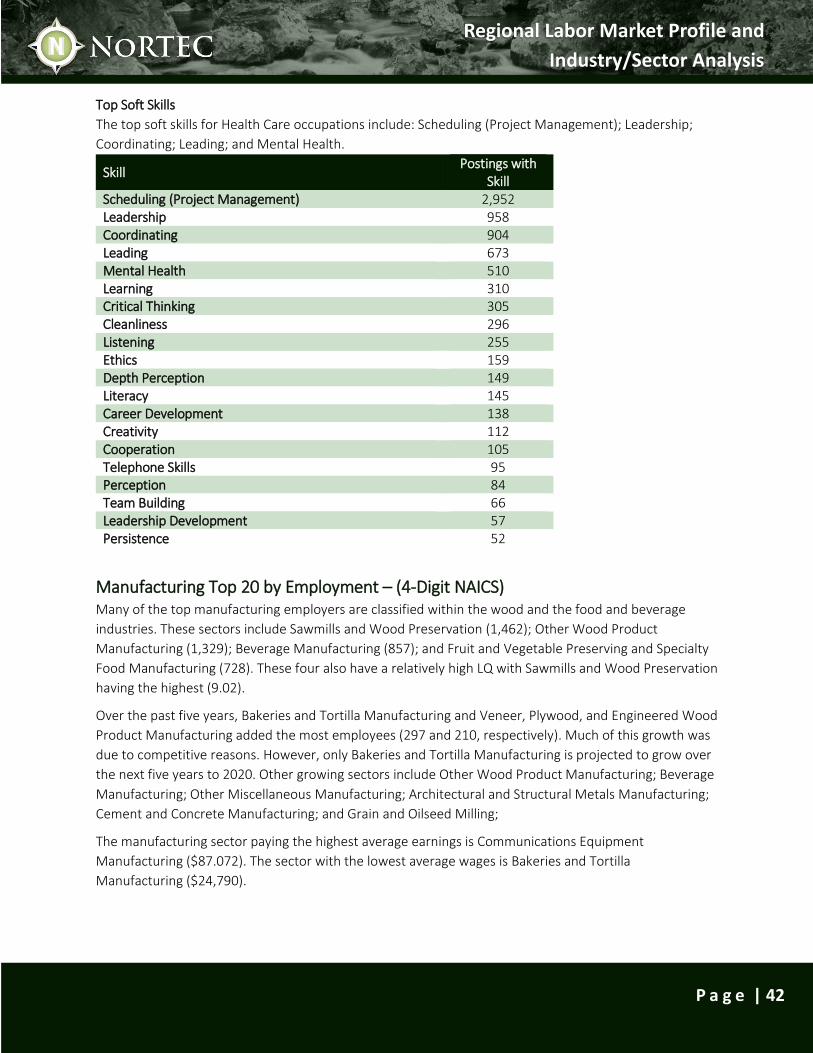
Regional Labor Market Profile and
Industry/Sector Analysis
P a g e | 42
Top Soft Skills
The top soft skills for Health Care occupations include: Scheduling (Project Management); Leadership;
Coordinating; Leading; and Mental Health.
Skill Postings with
Skill Scheduling (Project Management) 2,952 Leadership 958 Coordinating 904 Leading 673 Mental Health 510 Learning 310 Critical Thinking 305 Cleanliness 296 Listening 255 Ethics 159 Depth Perception 149 Literacy 145 Career Development 138 Creativity 112 Cooperation 105 Telephone Skills 95 Perception 84 Team Building 66 Leadership Development 57 Persistence 52
Manufacturing Top 20 by Employment – (4-Digit NAICS) Many of the top manufacturing employers are classified within the wood and the food and beverage
industries. These sectors include Sawmills and Wood Preservation (1,462); Other Wood Product
Manufacturing (1,329); Beverage Manufacturing (857); and Fruit and Vegetable Preserving and Specialty
Food Manufacturing (728). These four also have a relatively high LQ with Sawmills and Wood Preservation
having the highest (9.02).
Over the past five years, Bakeries and Tortilla Manufacturing and Veneer, Plywood, and Engineered Wood
Product Manufacturing added the most employees (297 and 210, respectively). Much of this growth was
due to competitive reasons. However, only Bakeries and Tortilla Manufacturing is projected to grow over
the next five years to 2020. Other growing sectors include Other Wood Product Manufacturing; Beverage
Manufacturing; Other Miscellaneous Manufacturing; Architectural and Structural Metals Manufacturing;
Cement and Concrete Manufacturing; and Grain and Oilseed Milling;
The manufacturing sector paying the highest average earnings is Communications Equipment
Manufacturing ($87.072). The sector with the lowest average wages is Bakeries and Tortilla
Manufacturing ($24,790).
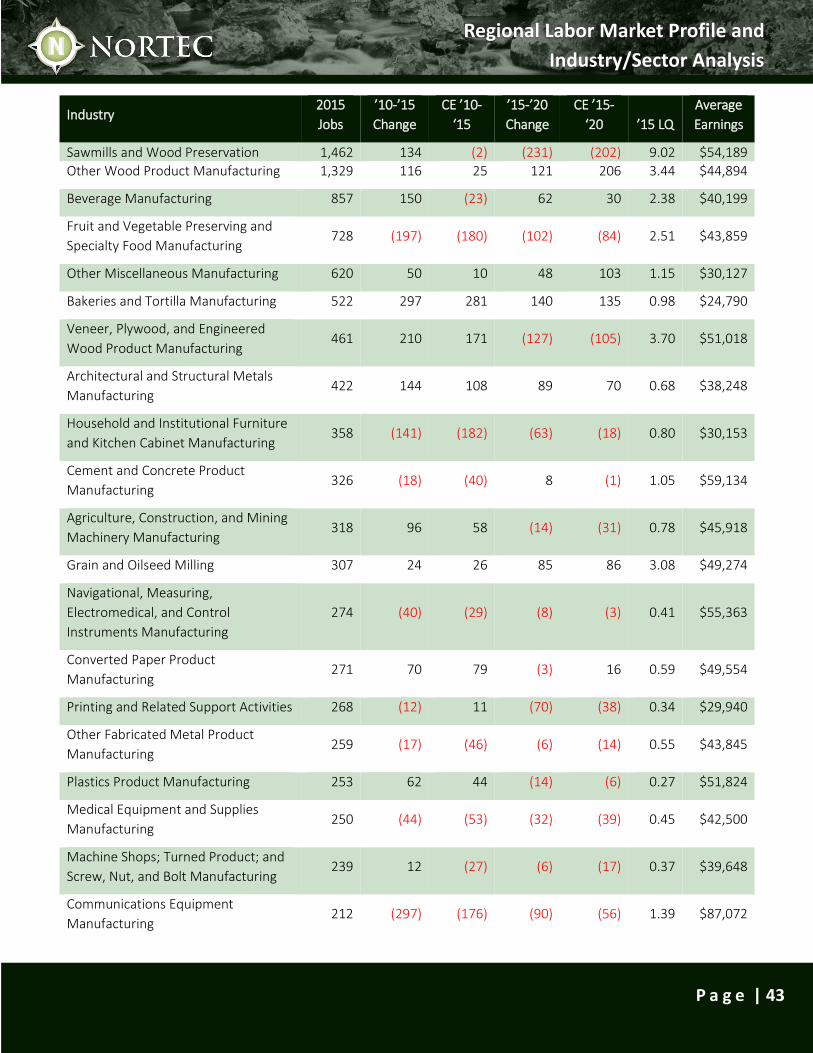
Regional Labor Market Profile and
Industry/Sector Analysis
P a g e | 43
Industry 2015
Jobs
’10-’15
Change
CE ’10-
‘15
’15-’20
Change
CE ’15-
‘20 ’15 LQ
Average
Earnings
Sawmills and Wood Preservation 1,462 134 (2) (231) (202) 9.02 $54,189
Other Wood Product Manufacturing 1,329 116 25 121 206 3.44 $44,894
Beverage Manufacturing 857 150 (23) 62 30 2.38 $40,199
Fruit and Vegetable Preserving and
Specialty Food Manufacturing 728 (197) (180) (102) (84) 2.51 $43,859
Other Miscellaneous Manufacturing 620 50 10 48 103 1.15 $30,127
Bakeries and Tortilla Manufacturing 522 297 281 140 135 0.98 $24,790
Veneer, Plywood, and Engineered
Wood Product Manufacturing 461 210 171 (127) (105) 3.70 $51,018
Architectural and Structural Metals
Manufacturing 422 144 108 89 70 0.68 $38,248
Household and Institutional Furniture
and Kitchen Cabinet Manufacturing 358 (141) (182) (63) (18) 0.80 $30,153
Cement and Concrete Product
Manufacturing 326 (18) (40) 8 (1) 1.05 $59,134
Agriculture, Construction, and Mining
Machinery Manufacturing 318 96 58 (14) (31) 0.78 $45,918
Grain and Oilseed Milling 307 24 26 85 86 3.08 $49,274
Navigational, Measuring,
Electromedical, and Control
Instruments Manufacturing
274 (40) (29) (8) (3) 0.41 $55,363
Converted Paper Product
Manufacturing 271 70 79 (3) 16 0.59 $49,554
Printing and Related Support Activities 268 (12) 11 (70) (38) 0.34 $29,940
Other Fabricated Metal Product
Manufacturing 259 (17) (46) (6) (14) 0.55 $43,845
Plastics Product Manufacturing 253 62 44 (14) (6) 0.27 $51,824
Medical Equipment and Supplies
Manufacturing 250 (44) (53) (32) (39) 0.45 $42,500
Machine Shops; Turned Product; and
Screw, Nut, and Bolt Manufacturing 239 12 (27) (6) (17) 0.37 $39,648
Communications Equipment
Manufacturing 212 (297) (176) (90) (56) 1.39 $87,072
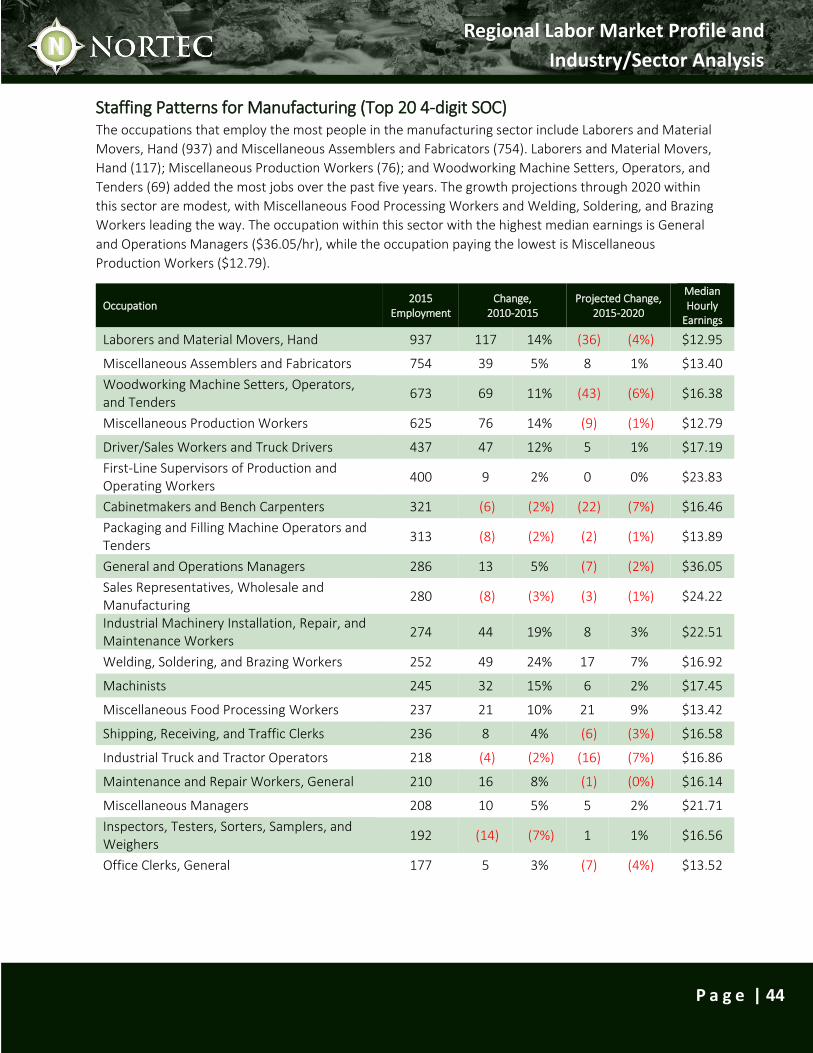
Regional Labor Market Profile and
Industry/Sector Analysis
P a g e | 44
Staffing Patterns for Manufacturing (Top 20 4-digit SOC) The occupations that employ the most people in the manufacturing sector include Laborers and Material
Movers, Hand (937) and Miscellaneous Assemblers and Fabricators (754). Laborers and Material Movers,
Hand (117); Miscellaneous Production Workers (76); and Woodworking Machine Setters, Operators, and
Tenders (69) added the most jobs over the past five years. The growth projections through 2020 within
this sector are modest, with Miscellaneous Food Processing Workers and Welding, Soldering, and Brazing
Workers leading the way. The occupation within this sector with the highest median earnings is General
and Operations Managers ($36.05/hr), while the occupation paying the lowest is Miscellaneous
Production Workers ($12.79).
Occupation 2015
Employment Change,
2010-2015 Projected Change,
2015-2020
Median Hourly
Earnings
Laborers and Material Movers, Hand 937 117 14% (36) (4%) $12.95
Miscellaneous Assemblers and Fabricators 754 39 5% 8 1% $13.40
Woodworking Machine Setters, Operators, and Tenders
673 69 11% (43) (6%) $16.38
Miscellaneous Production Workers 625 76 14% (9) (1%) $12.79
Driver/Sales Workers and Truck Drivers 437 47 12% 5 1% $17.19
First-Line Supervisors of Production and Operating Workers
400 9 2% 0 0% $23.83
Cabinetmakers and Bench Carpenters 321 (6) (2%) (22) (7%) $16.46
Packaging and Filling Machine Operators and Tenders
313 (8) (2%) (2) (1%) $13.89
General and Operations Managers 286 13 5% (7) (2%) $36.05
Sales Representatives, Wholesale and Manufacturing
280 (8) (3%) (3) (1%) $24.22
Industrial Machinery Installation, Repair, and Maintenance Workers
274 44 19% 8 3% $22.51
Welding, Soldering, and Brazing Workers 252 49 24% 17 7% $16.92
Machinists 245 32 15% 6 2% $17.45
Miscellaneous Food Processing Workers 237 21 10% 21 9% $13.42
Shipping, Receiving, and Traffic Clerks 236 8 4% (6) (3%) $16.58
Industrial Truck and Tractor Operators 218 (4) (2%) (16) (7%) $16.86
Maintenance and Repair Workers, General 210 16 8% (1) (0%) $16.14
Miscellaneous Managers 208 10 5% 5 2% $21.71
Inspectors, Testers, Sorters, Samplers, and Weighers
192 (14) (7%) 1 1% $16.56
Office Clerks, General 177 5 3% (7) (4%) $13.52
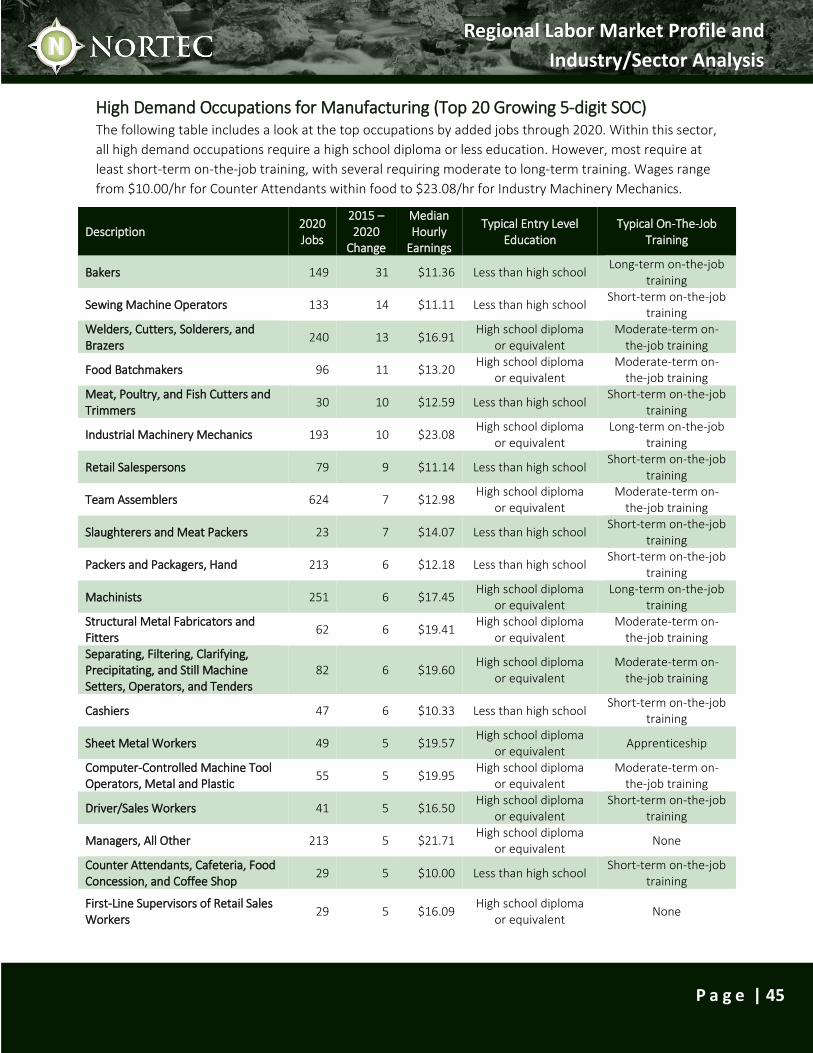
Regional Labor Market Profile and
Industry/Sector Analysis
P a g e | 45
High Demand Occupations for Manufacturing (Top 20 Growing 5-digit SOC) The following table includes a look at the top occupations by added jobs through 2020. Within this sector,
all high demand occupations require a high school diploma or less education. However, most require at
least short-term on-the-job training, with several requiring moderate to long-term training. Wages range
from $10.00/hr for Counter Attendants within food to $23.08/hr for Industry Machinery Mechanics.
Description 2020 Jobs
2015 – 2020
Change
Median Hourly
Earnings
Typical Entry Level Education
Typical On-The-Job Training
Bakers 149 31 $11.36 Less than high school Long-term on-the-job
training
Sewing Machine Operators 133 14 $11.11 Less than high school Short-term on-the-job
training Welders, Cutters, Solderers, and Brazers
240 13 $16.91 High school diploma
or equivalent Moderate-term on-
the-job training
Food Batchmakers 96 11 $13.20 High school diploma
or equivalent Moderate-term on-
the-job training Meat, Poultry, and Fish Cutters and Trimmers
30 10 $12.59 Less than high school Short-term on-the-job
training
Industrial Machinery Mechanics 193 10 $23.08 High school diploma
or equivalent Long-term on-the-job
training
Retail Salespersons 79 9 $11.14 Less than high school Short-term on-the-job
training
Team Assemblers 624 7 $12.98 High school diploma
or equivalent Moderate-term on-
the-job training
Slaughterers and Meat Packers 23 7 $14.07 Less than high school Short-term on-the-job
training
Packers and Packagers, Hand 213 6 $12.18 Less than high school Short-term on-the-job
training
Machinists 251 6 $17.45 High school diploma
or equivalent Long-term on-the-job
training Structural Metal Fabricators and Fitters
62 6 $19.41 High school diploma
or equivalent Moderate-term on-
the-job training Separating, Filtering, Clarifying, Precipitating, and Still Machine Setters, Operators, and Tenders
82 6 $19.60 High school diploma
or equivalent Moderate-term on-
the-job training
Cashiers 47 6 $10.33 Less than high school Short-term on-the-job
training
Sheet Metal Workers 49 5 $19.57 High school diploma
or equivalent Apprenticeship
Computer-Controlled Machine Tool Operators, Metal and Plastic
55 5 $19.95 High school diploma
or equivalent Moderate-term on-
the-job training
Driver/Sales Workers 41 5 $16.50 High school diploma
or equivalent Short-term on-the-job
training
Managers, All Other 213 5 $21.71 High school diploma
or equivalent None
Counter Attendants, Cafeteria, Food Concession, and Coffee Shop
29 5 $10.00 Less than high school Short-term on-the-job
training
First-Line Supervisors of Retail Sales Workers
29 5 $16.09 High school diploma
or equivalent None
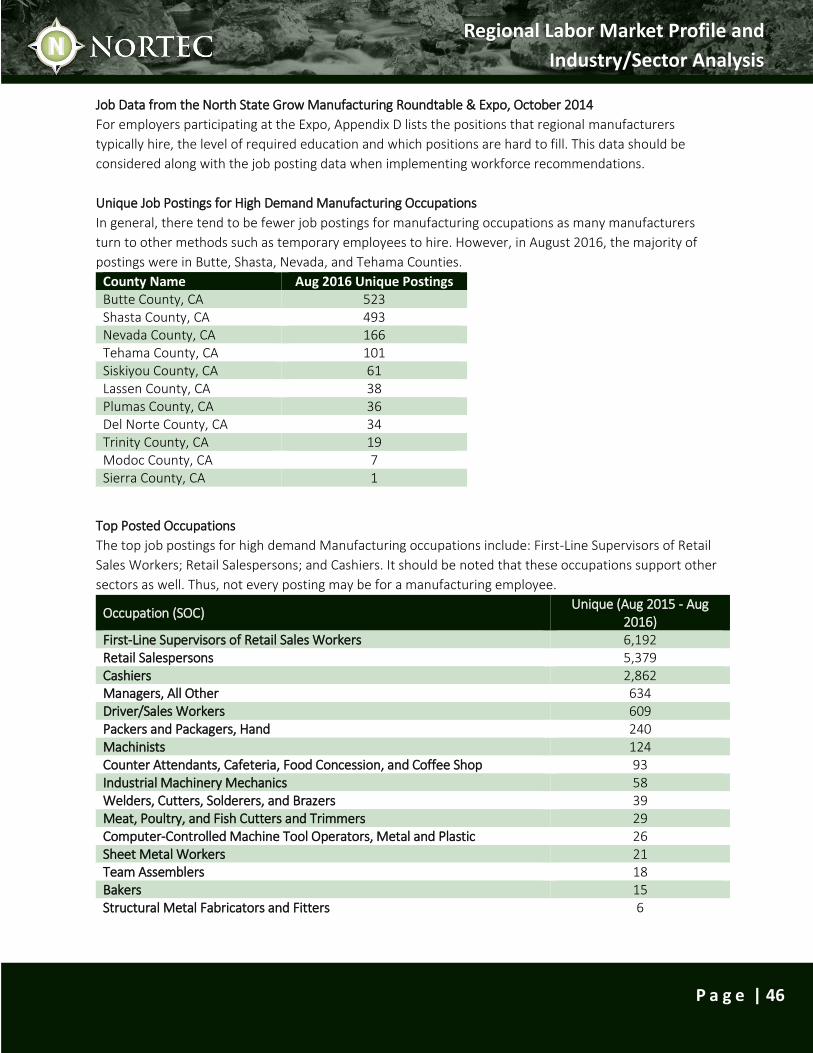
Regional Labor Market Profile and
Industry/Sector Analysis
P a g e | 46
Job Data from the North State Grow Manufacturing Roundtable & Expo, October 2014
For employers participating at the Expo, Appendix D lists the positions that regional manufacturers
typically hire, the level of required education and which positions are hard to fill. This data should be
considered along with the job posting data when implementing workforce recommendations.
Unique Job Postings for High Demand Manufacturing Occupations
In general, there tend to be fewer job postings for manufacturing occupations as many manufacturers
turn to other methods such as temporary employees to hire. However, in August 2016, the majority of
postings were in Butte, Shasta, Nevada, and Tehama Counties.
County Name Aug 2016 Unique Postings Butte County, CA 523 Shasta County, CA 493 Nevada County, CA 166 Tehama County, CA 101 Siskiyou County, CA 61 Lassen County, CA 38 Plumas County, CA 36 Del Norte County, CA 34 Trinity County, CA 19 Modoc County, CA 7 Sierra County, CA 1
Top Posted Occupations
The top job postings for high demand Manufacturing occupations include: First-Line Supervisors of Retail
Sales Workers; Retail Salespersons; and Cashiers. It should be noted that these occupations support other
sectors as well. Thus, not every posting may be for a manufacturing employee.
Occupation (SOC) Unique (Aug 2015 - Aug
2016) First-Line Supervisors of Retail Sales Workers 6,192 Retail Salespersons 5,379 Cashiers 2,862 Managers, All Other 634 Driver/Sales Workers 609 Packers and Packagers, Hand 240 Machinists 124 Counter Attendants, Cafeteria, Food Concession, and Coffee Shop 93 Industrial Machinery Mechanics 58 Welders, Cutters, Solderers, and Brazers 39 Meat, Poultry, and Fish Cutters and Trimmers 29 Computer-Controlled Machine Tool Operators, Metal and Plastic 26 Sheet Metal Workers 21 Team Assemblers 18 Bakers 15 Structural Metal Fabricators and Fitters 6
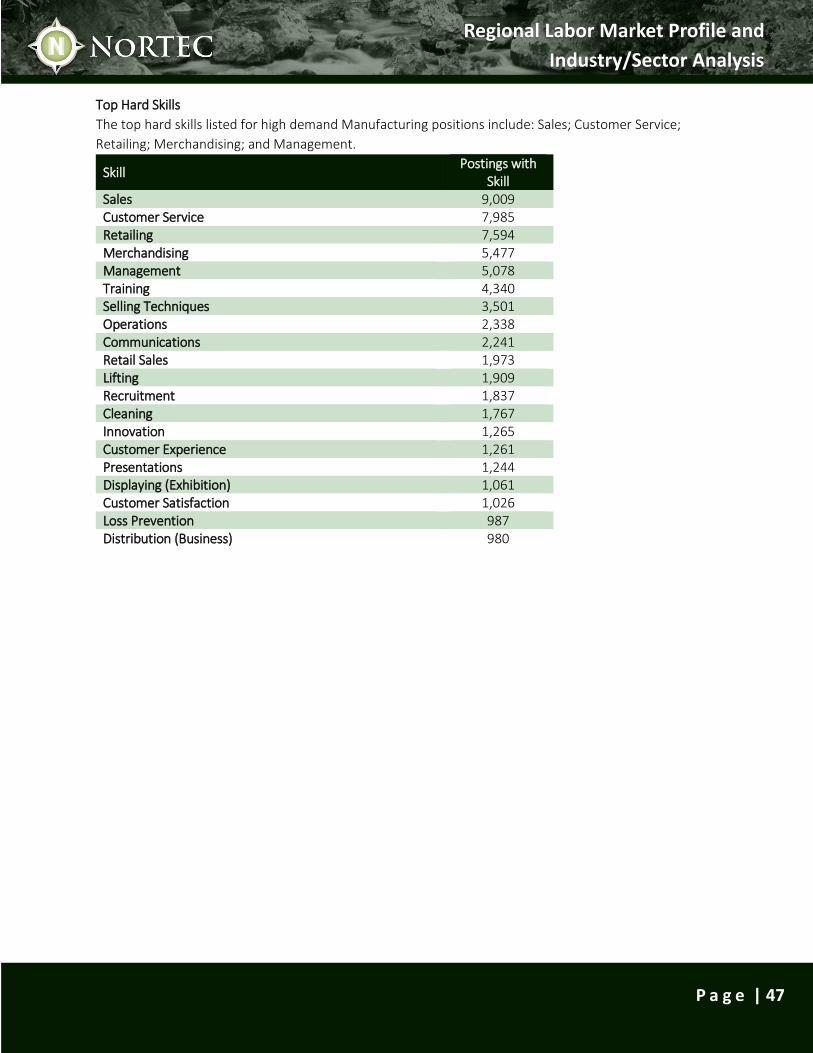
Regional Labor Market Profile and
Industry/Sector Analysis
P a g e | 47
Top Hard Skills
The top hard skills listed for high demand Manufacturing positions include: Sales; Customer Service;
Retailing; Merchandising; and Management.
Skill Postings with
Skill Sales 9,009 Customer Service 7,985 Retailing 7,594 Merchandising 5,477 Management 5,078 Training 4,340 Selling Techniques 3,501 Operations 2,338 Communications 2,241 Retail Sales 1,973 Lifting 1,909 Recruitment 1,837 Cleaning 1,767 Innovation 1,265 Customer Experience 1,261 Presentations 1,244 Displaying (Exhibition) 1,061 Customer Satisfaction 1,026 Loss Prevention 987 Distribution (Business) 980

Regional Labor Market Profile and
Industry/Sector Analysis
P a g e | 48
Top Soft Skills
Frequently listed soft skills within job postings for Manufacturing jobs include: Scheduling (Project
Management); Leadership; Leading; Learning; and Listening.
Skill Postings with
Skill Scheduling (Project Management) 3,555 Leadership 1,723 Leading 1,209 Learning 640 Listening 615 Cleanliness 533 Creativity 441 Ethics 362 Creative Problem-Solving 281 Coordinating 170 Team Building 139 Cooperation 137 Personal Grooming 119 Assertiveness 87 Conversation 79 Career Development 78 Tenacity 49 Leadership Development 48 Public Speaking 45 Team Leading 41
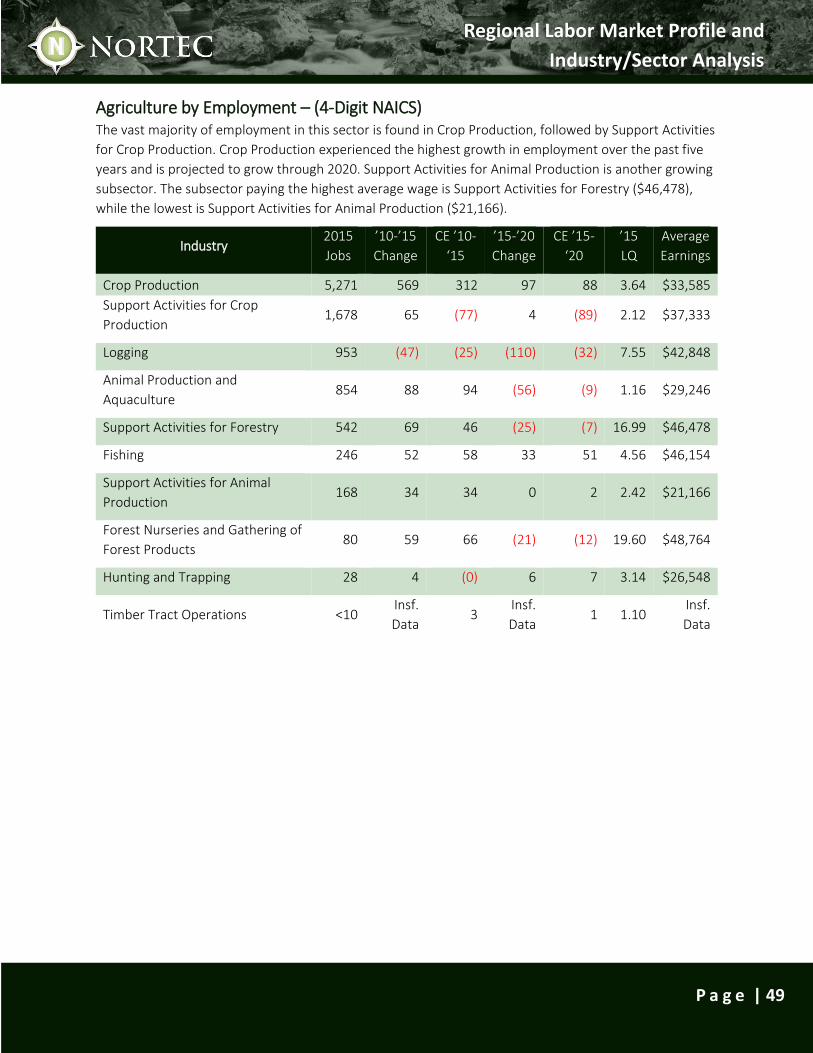
Regional Labor Market Profile and
Industry/Sector Analysis
P a g e | 49
Agriculture by Employment – (4-Digit NAICS) The vast majority of employment in this sector is found in Crop Production, followed by Support Activities
for Crop Production. Crop Production experienced the highest growth in employment over the past five
years and is projected to grow through 2020. Support Activities for Animal Production is another growing
subsector. The subsector paying the highest average wage is Support Activities for Forestry ($46,478),
while the lowest is Support Activities for Animal Production ($21,166).
Industry 2015
Jobs
’10-’15
Change
CE ’10-
‘15
’15-’20
Change
CE ’15-
‘20
’15
LQ
Average
Earnings
Crop Production 5,271 569 312 97 88 3.64 $33,585
Support Activities for Crop
Production 1,678 65 (77) 4 (89) 2.12 $37,333
Logging 953 (47) (25) (110) (32) 7.55 $42,848
Animal Production and
Aquaculture 854 88 94 (56) (9) 1.16 $29,246
Support Activities for Forestry 542 69 46 (25) (7) 16.99 $46,478
Fishing 246 52 58 33 51 4.56 $46,154
Support Activities for Animal
Production 168 34 34 0 2 2.42 $21,166
Forest Nurseries and Gathering of
Forest Products 80 59 66 (21) (12) 19.60 $48,764
Hunting and Trapping 28 4 (0) 6 7 3.14 $26,548
Timber Tract Operations <10 Insf.
Data 3
Insf.
Data 1 1.10
Insf.
Data
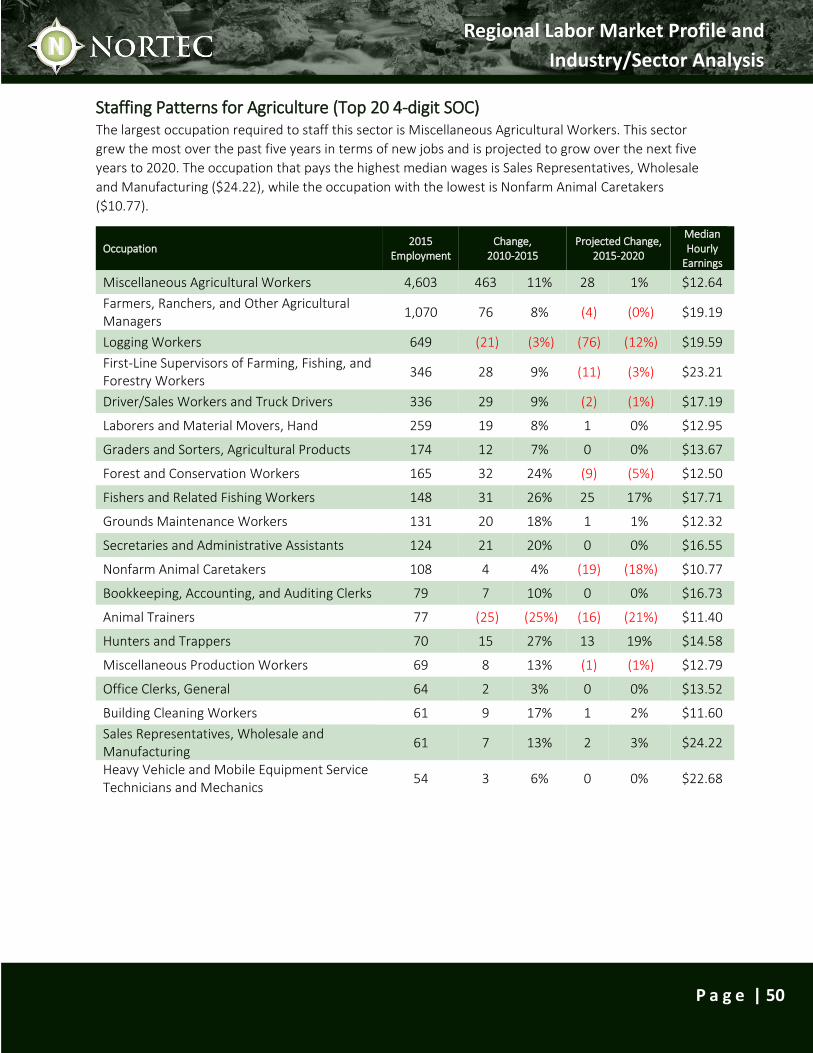
Regional Labor Market Profile and
Industry/Sector Analysis
P a g e | 50
Staffing Patterns for Agriculture (Top 20 4-digit SOC) The largest occupation required to staff this sector is Miscellaneous Agricultural Workers. This sector
grew the most over the past five years in terms of new jobs and is projected to grow over the next five
years to 2020. The occupation that pays the highest median wages is Sales Representatives, Wholesale
and Manufacturing ($24.22), while the occupation with the lowest is Nonfarm Animal Caretakers
($10.77).
Occupation 2015
Employment Change,
2010-2015 Projected Change,
2015-2020
Median Hourly
Earnings
Miscellaneous Agricultural Workers 4,603 463 11% 28 1% $12.64
Farmers, Ranchers, and Other Agricultural Managers
1,070 76 8% (4) (0%) $19.19
Logging Workers 649 (21) (3%) (76) (12%) $19.59
First-Line Supervisors of Farming, Fishing, and Forestry Workers
346 28 9% (11) (3%) $23.21
Driver/Sales Workers and Truck Drivers 336 29 9% (2) (1%) $17.19
Laborers and Material Movers, Hand 259 19 8% 1 0% $12.95
Graders and Sorters, Agricultural Products 174 12 7% 0 0% $13.67
Forest and Conservation Workers 165 32 24% (9) (5%) $12.50
Fishers and Related Fishing Workers 148 31 26% 25 17% $17.71
Grounds Maintenance Workers 131 20 18% 1 1% $12.32
Secretaries and Administrative Assistants 124 21 20% 0 0% $16.55
Nonfarm Animal Caretakers 108 4 4% (19) (18%) $10.77
Bookkeeping, Accounting, and Auditing Clerks 79 7 10% 0 0% $16.73
Animal Trainers 77 (25) (25%) (16) (21%) $11.40
Hunters and Trappers 70 15 27% 13 19% $14.58
Miscellaneous Production Workers 69 8 13% (1) (1%) $12.79
Office Clerks, General 64 2 3% 0 0% $13.52
Building Cleaning Workers 61 9 17% 1 2% $11.60
Sales Representatives, Wholesale and Manufacturing
61 7 13% 2 3% $24.22
Heavy Vehicle and Mobile Equipment Service Technicians and Mechanics
54 3 6% 0 0% $22.68
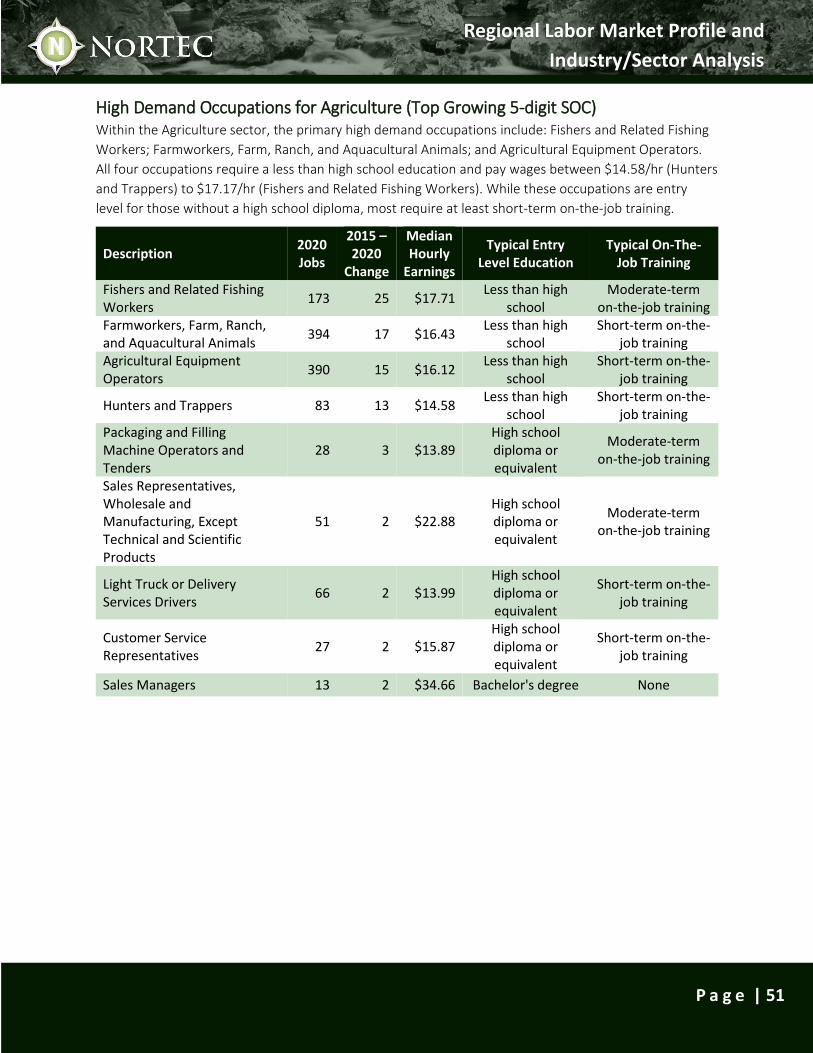
Regional Labor Market Profile and
Industry/Sector Analysis
P a g e | 51
High Demand Occupations for Agriculture (Top Growing 5-digit SOC) Within the Agriculture sector, the primary high demand occupations include: Fishers and Related Fishing
Workers; Farmworkers, Farm, Ranch, and Aquacultural Animals; and Agricultural Equipment Operators.
All four occupations require a less than high school education and pay wages between $14.58/hr (Hunters
and Trappers) to $17.17/hr (Fishers and Related Fishing Workers). While these occupations are entry
level for those without a high school diploma, most require at least short-term on-the-job training.
Description 2020 Jobs
2015 – 2020
Change
Median Hourly
Earnings
Typical Entry Level Education
Typical On-The-Job Training
Fishers and Related Fishing Workers
173 25 $17.71 Less than high
school Moderate-term
on-the-job training Farmworkers, Farm, Ranch, and Aquacultural Animals
394 17 $16.43 Less than high
school Short-term on-the-
job training Agricultural Equipment Operators
390 15 $16.12 Less than high
school Short-term on-the-
job training
Hunters and Trappers 83 13 $14.58 Less than high
school Short-term on-the-
job training Packaging and Filling Machine Operators and Tenders
28 3 $13.89 High school diploma or equivalent
Moderate-term on-the-job training
Sales Representatives, Wholesale and Manufacturing, Except Technical and Scientific Products
51 2 $22.88 High school diploma or equivalent
Moderate-term on-the-job training
Light Truck or Delivery Services Drivers
66 2 $13.99 High school diploma or equivalent
Short-term on-the-job training
Customer Service Representatives
27 2 $15.87 High school diploma or equivalent
Short-term on-the-job training
Sales Managers 13 2 $34.66 Bachelor's degree None
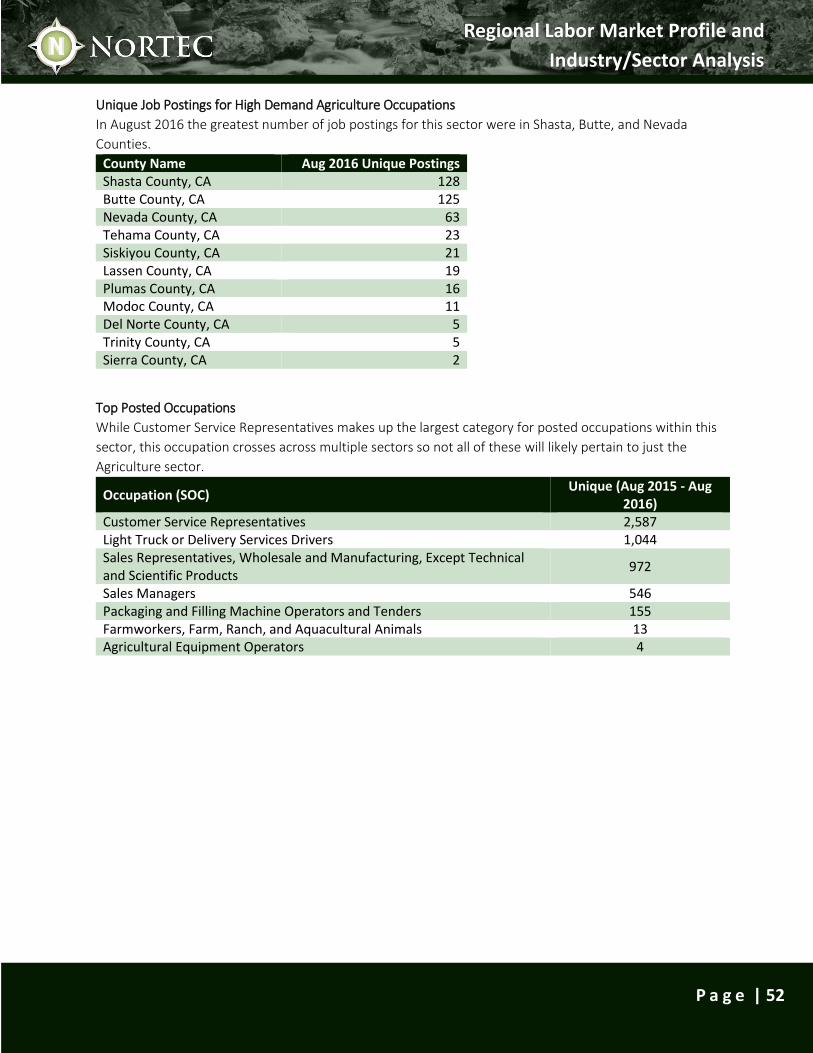
Regional Labor Market Profile and
Industry/Sector Analysis
P a g e | 52
Unique Job Postings for High Demand Agriculture Occupations
In August 2016 the greatest number of job postings for this sector were in Shasta, Butte, and Nevada
Counties.
County Name Aug 2016 Unique Postings Shasta County, CA 128 Butte County, CA 125 Nevada County, CA 63 Tehama County, CA 23 Siskiyou County, CA 21 Lassen County, CA 19 Plumas County, CA 16 Modoc County, CA 11 Del Norte County, CA 5 Trinity County, CA 5 Sierra County, CA 2
Top Posted Occupations
While Customer Service Representatives makes up the largest category for posted occupations within this
sector, this occupation crosses across multiple sectors so not all of these will likely pertain to just the
Agriculture sector.
Occupation (SOC) Unique (Aug 2015 - Aug
2016) Customer Service Representatives 2,587 Light Truck or Delivery Services Drivers 1,044 Sales Representatives, Wholesale and Manufacturing, Except Technical and Scientific Products
972
Sales Managers 546 Packaging and Filling Machine Operators and Tenders 155 Farmworkers, Farm, Ranch, and Aquacultural Animals 13 Agricultural Equipment Operators 4
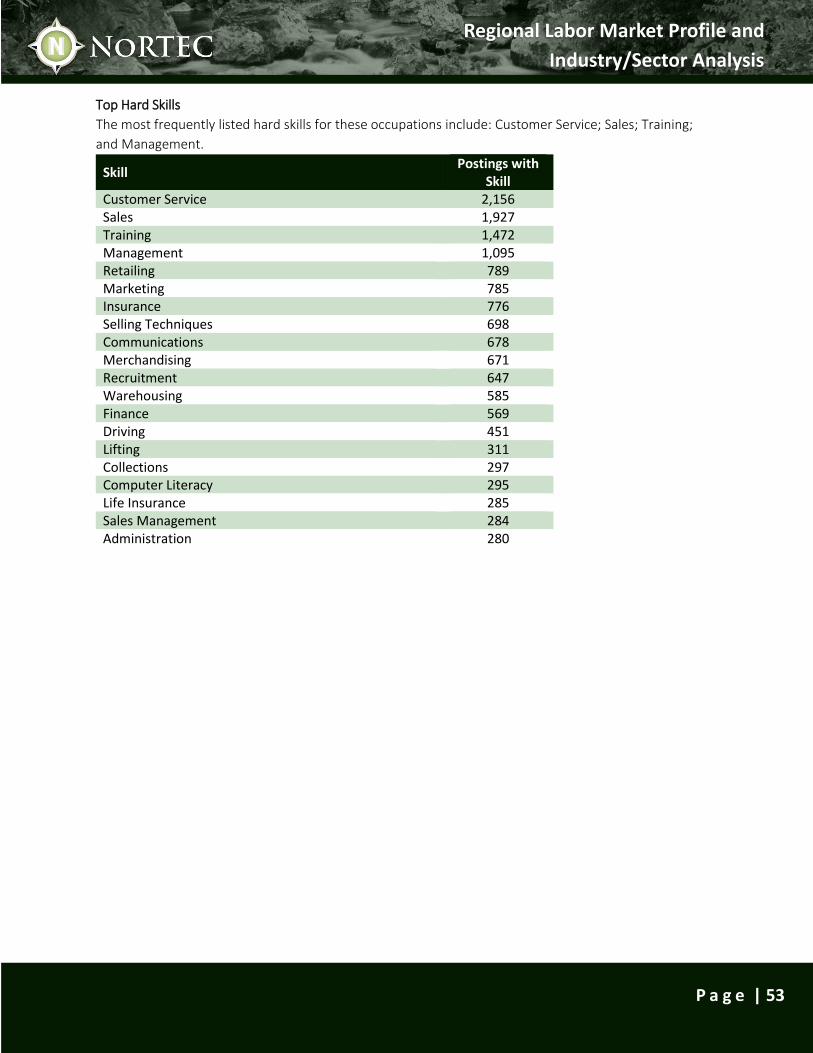
Regional Labor Market Profile and
Industry/Sector Analysis
P a g e | 53
Top Hard Skills
The most frequently listed hard skills for these occupations include: Customer Service; Sales; Training;
and Management.
Skill Postings with
Skill Customer Service 2,156 Sales 1,927 Training 1,472 Management 1,095 Retailing 789 Marketing 785 Insurance 776 Selling Techniques 698 Communications 678 Merchandising 671 Recruitment 647 Warehousing 585 Finance 569 Driving 451 Lifting 311 Collections 297 Computer Literacy 295 Life Insurance 285 Sales Management 284 Administration 280

Regional Labor Market Profile and
Industry/Sector Analysis
P a g e | 54
Top Soft Skills
The most frequently listed soft skills amongst high demand occupations include: Scheduling (Project
Management); Leadership; Leading; and Listening.
Skill Postings with
Skill Scheduling (Project Management) 849 Leadership 255 Leading 211 Listening 175 Learning 130 Coordinating 119 Telephone Skills 77 Creativity 55 Literacy 32 Listening Skills 27 Career Development 26 Ethics 21 Critical Thinking 20 Creative Problem-Solving 19 Cleanliness 18 Active Listening 17 Assertiveness 13 Self-Sufficiency 13 Active Learning 12 Deductive Reasoning 12
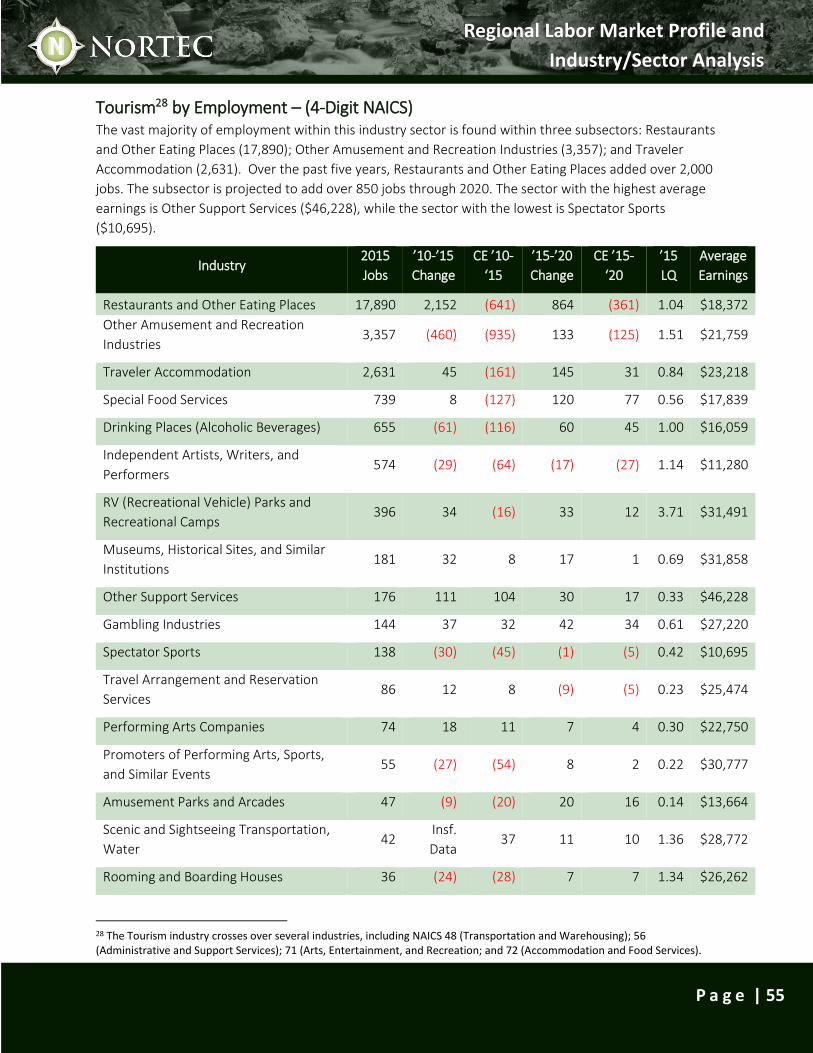
Regional Labor Market Profile and
Industry/Sector Analysis
P a g e | 55
Tourism28 by Employment – (4-Digit NAICS) The vast majority of employment within this industry sector is found within three subsectors: Restaurants
and Other Eating Places (17,890); Other Amusement and Recreation Industries (3,357); and Traveler
Accommodation (2,631). Over the past five years, Restaurants and Other Eating Places added over 2,000
jobs. The subsector is projected to add over 850 jobs through 2020. The sector with the highest average
earnings is Other Support Services ($46,228), while the sector with the lowest is Spectator Sports
($10,695).
Industry 2015
Jobs
’10-’15
Change
CE ’10-
‘15
’15-’20
Change
CE ’15-
‘20
’15
LQ
Average
Earnings
Restaurants and Other Eating Places 17,890 2,152 (641) 864 (361) 1.04 $18,372
Other Amusement and Recreation
Industries 3,357 (460) (935) 133 (125) 1.51 $21,759
Traveler Accommodation 2,631 45 (161) 145 31 0.84 $23,218
Special Food Services 739 8 (127) 120 77 0.56 $17,839
Drinking Places (Alcoholic Beverages) 655 (61) (116) 60 45 1.00 $16,059
Independent Artists, Writers, and
Performers 574 (29) (64) (17) (27) 1.14 $11,280
RV (Recreational Vehicle) Parks and
Recreational Camps 396 34 (16) 33 12 3.71 $31,491
Museums, Historical Sites, and Similar
Institutions 181 32 8 17 1 0.69 $31,858
Other Support Services 176 111 104 30 17 0.33 $46,228
Gambling Industries 144 37 32 42 34 0.61 $27,220
Spectator Sports 138 (30) (45) (1) (5) 0.42 $10,695
Travel Arrangement and Reservation
Services 86 12 8 (9) (5) 0.23 $25,474
Performing Arts Companies 74 18 11 7 4 0.30 $22,750
Promoters of Performing Arts, Sports,
and Similar Events 55 (27) (54) 8 2 0.22 $30,777
Amusement Parks and Arcades 47 (9) (20) 20 16 0.14 $13,664
Scenic and Sightseeing Transportation,
Water 42
Insf.
Data 37 11 10 1.36 $28,772
Rooming and Boarding Houses 36 (24) (28) 7 7 1.34 $26,262
28 The Tourism industry crosses over several industries, including NAICS 48 (Transportation and Warehousing); 56 (Administrative and Support Services); 71 (Arts, Entertainment, and Recreation; and 72 (Accommodation and Food Services).
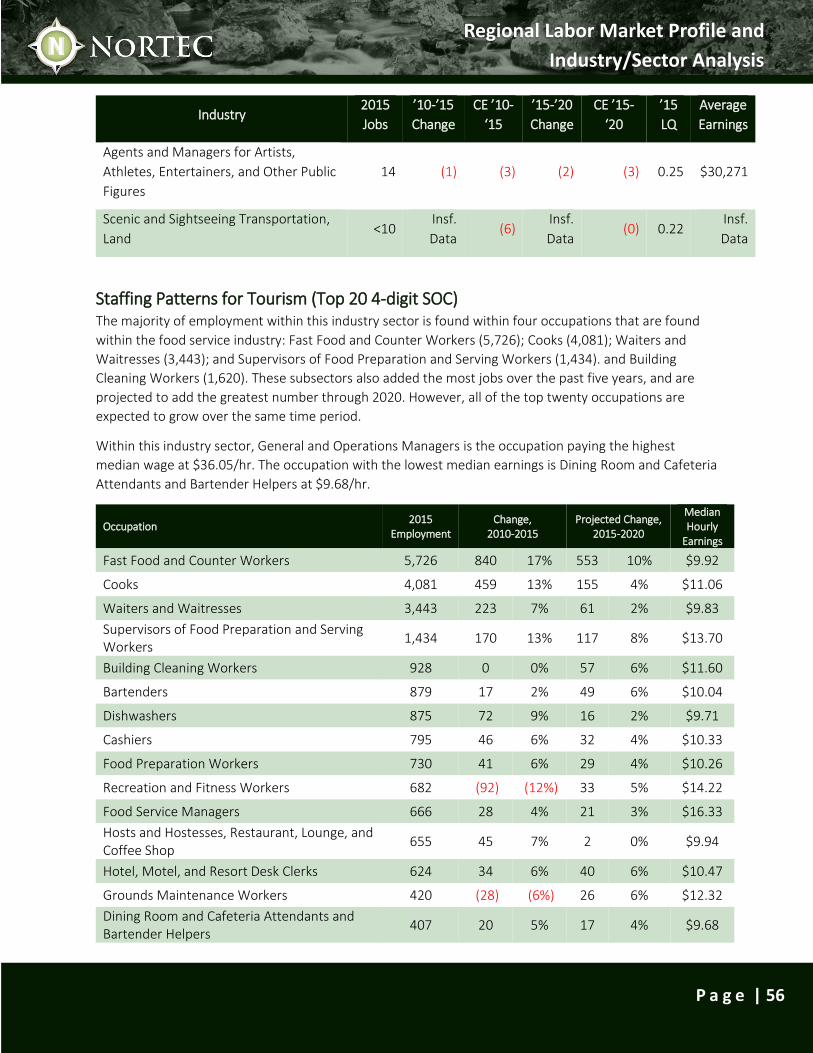
Regional Labor Market Profile and
Industry/Sector Analysis
P a g e | 56
Industry 2015
Jobs
’10-’15
Change
CE ’10-
‘15
’15-’20
Change
CE ’15-
‘20
’15
LQ
Average
Earnings
Agents and Managers for Artists,
Athletes, Entertainers, and Other Public
Figures
14 (1) (3) (2) (3) 0.25 $30,271
Scenic and Sightseeing Transportation,
Land <10
Insf.
Data (6)
Insf.
Data (0) 0.22
Insf.
Data
Staffing Patterns for Tourism (Top 20 4-digit SOC) The majority of employment within this industry sector is found within four occupations that are found
within the food service industry: Fast Food and Counter Workers (5,726); Cooks (4,081); Waiters and
Waitresses (3,443); and Supervisors of Food Preparation and Serving Workers (1,434). and Building
Cleaning Workers (1,620). These subsectors also added the most jobs over the past five years, and are
projected to add the greatest number through 2020. However, all of the top twenty occupations are
expected to grow over the same time period.
Within this industry sector, General and Operations Managers is the occupation paying the highest
median wage at $36.05/hr. The occupation with the lowest median earnings is Dining Room and Cafeteria
Attendants and Bartender Helpers at $9.68/hr.
Occupation 2015
Employment Change,
2010-2015 Projected Change,
2015-2020
Median Hourly
Earnings
Fast Food and Counter Workers 5,726 840 17% 553 10% $9.92
Cooks 4,081 459 13% 155 4% $11.06
Waiters and Waitresses 3,443 223 7% 61 2% $9.83
Supervisors of Food Preparation and Serving Workers
1,434 170 13% 117 8% $13.70
Building Cleaning Workers 928 0 0% 57 6% $11.60
Bartenders 879 17 2% 49 6% $10.04
Dishwashers 875 72 9% 16 2% $9.71
Cashiers 795 46 6% 32 4% $10.33
Food Preparation Workers 730 41 6% 29 4% $10.26
Recreation and Fitness Workers 682 (92) (12%) 33 5% $14.22
Food Service Managers 666 28 4% 21 3% $16.33
Hosts and Hostesses, Restaurant, Lounge, and Coffee Shop
655 45 7% 2 0% $9.94
Hotel, Motel, and Resort Desk Clerks 624 34 6% 40 6% $10.47
Grounds Maintenance Workers 420 (28) (6%) 26 6% $12.32
Dining Room and Cafeteria Attendants and Bartender Helpers
407 20 5% 17 4% $9.68
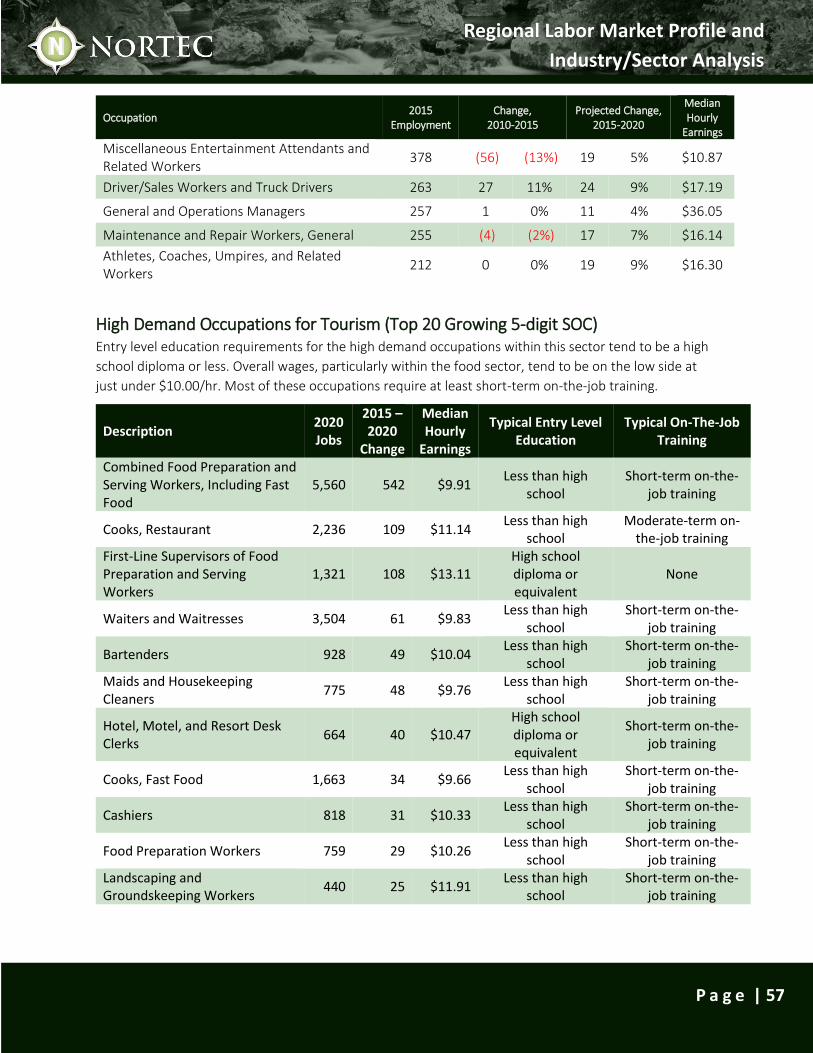
Regional Labor Market Profile and
Industry/Sector Analysis
P a g e | 57
Occupation 2015
Employment Change,
2010-2015 Projected Change,
2015-2020
Median Hourly
Earnings
Miscellaneous Entertainment Attendants and Related Workers
378 (56) (13%) 19 5% $10.87
Driver/Sales Workers and Truck Drivers 263 27 11% 24 9% $17.19
General and Operations Managers 257 1 0% 11 4% $36.05
Maintenance and Repair Workers, General 255 (4) (2%) 17 7% $16.14
Athletes, Coaches, Umpires, and Related Workers
212 0 0% 19 9% $16.30
High Demand Occupations for Tourism (Top 20 Growing 5-digit SOC) Entry level education requirements for the high demand occupations within this sector tend to be a high
school diploma or less. Overall wages, particularly within the food sector, tend to be on the low side at
just under $10.00/hr. Most of these occupations require at least short-term on-the-job training.
Description 2020 Jobs
2015 – 2020
Change
Median Hourly
Earnings
Typical Entry Level Education
Typical On-The-Job Training
Combined Food Preparation and Serving Workers, Including Fast Food
5,560 542 $9.91 Less than high
school Short-term on-the-
job training
Cooks, Restaurant 2,236 109 $11.14 Less than high
school Moderate-term on-
the-job training First-Line Supervisors of Food Preparation and Serving Workers
1,321 108 $13.11 High school diploma or equivalent
None
Waiters and Waitresses 3,504 61 $9.83 Less than high
school Short-term on-the-
job training
Bartenders 928 49 $10.04 Less than high
school Short-term on-the-
job training Maids and Housekeeping Cleaners
775 48 $9.76 Less than high
school Short-term on-the-
job training
Hotel, Motel, and Resort Desk Clerks
664 40 $10.47 High school diploma or equivalent
Short-term on-the-job training
Cooks, Fast Food 1,663 34 $9.66 Less than high
school Short-term on-the-
job training
Cashiers 818 31 $10.33 Less than high
school Short-term on-the-
job training
Food Preparation Workers 759 29 $10.26 Less than high
school Short-term on-the-
job training Landscaping and Groundskeeping Workers
440 25 $11.91 Less than high
school Short-term on-the-
job training
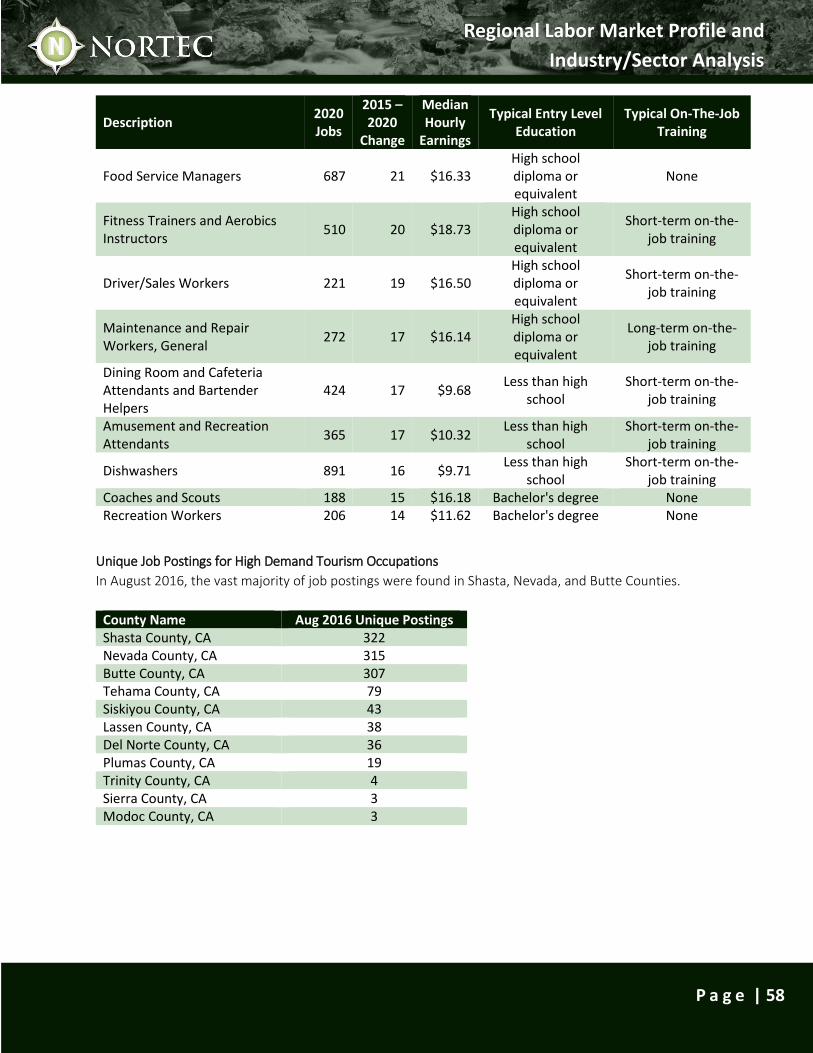
Regional Labor Market Profile and
Industry/Sector Analysis
P a g e | 58
Description 2020 Jobs
2015 – 2020
Change
Median Hourly
Earnings
Typical Entry Level Education
Typical On-The-Job Training
Food Service Managers 687 21 $16.33 High school diploma or equivalent
None
Fitness Trainers and Aerobics Instructors
510 20 $18.73 High school diploma or equivalent
Short-term on-the-job training
Driver/Sales Workers 221 19 $16.50 High school diploma or equivalent
Short-term on-the-job training
Maintenance and Repair Workers, General
272 17 $16.14 High school diploma or equivalent
Long-term on-the-job training
Dining Room and Cafeteria Attendants and Bartender Helpers
424 17 $9.68 Less than high
school Short-term on-the-
job training
Amusement and Recreation Attendants
365 17 $10.32 Less than high
school Short-term on-the-
job training
Dishwashers 891 16 $9.71 Less than high
school Short-term on-the-
job training Coaches and Scouts 188 15 $16.18 Bachelor's degree None Recreation Workers 206 14 $11.62 Bachelor's degree None
Unique Job Postings for High Demand Tourism Occupations
In August 2016, the vast majority of job postings were found in Shasta, Nevada, and Butte Counties.
County Name Aug 2016 Unique Postings Shasta County, CA 322 Nevada County, CA 315 Butte County, CA 307 Tehama County, CA 79 Siskiyou County, CA 43 Lassen County, CA 38 Del Norte County, CA 36 Plumas County, CA 19 Trinity County, CA 4 Sierra County, CA 3 Modoc County, CA 3
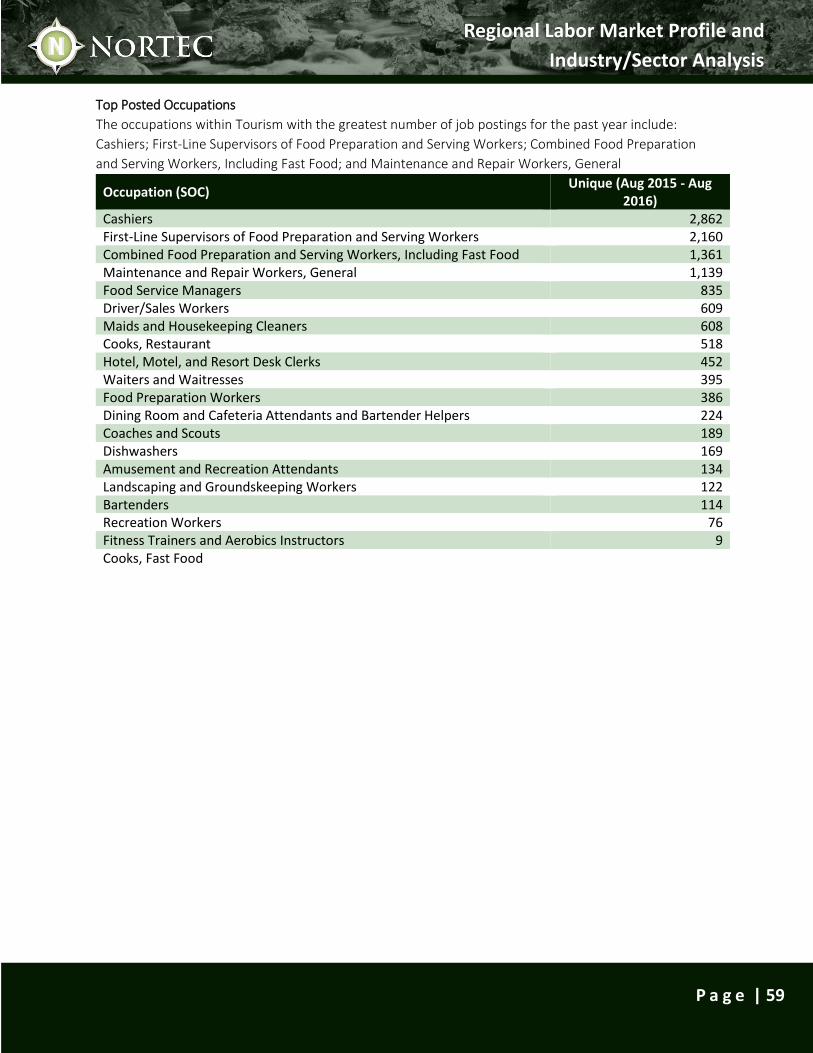
Regional Labor Market Profile and
Industry/Sector Analysis
P a g e | 59
Top Posted Occupations
The occupations within Tourism with the greatest number of job postings for the past year include:
Cashiers; First-Line Supervisors of Food Preparation and Serving Workers; Combined Food Preparation
and Serving Workers, Including Fast Food; and Maintenance and Repair Workers, General
Occupation (SOC) Unique (Aug 2015 - Aug
2016) Cashiers 2,862 First-Line Supervisors of Food Preparation and Serving Workers 2,160 Combined Food Preparation and Serving Workers, Including Fast Food 1,361 Maintenance and Repair Workers, General 1,139 Food Service Managers 835 Driver/Sales Workers 609 Maids and Housekeeping Cleaners 608 Cooks, Restaurant 518 Hotel, Motel, and Resort Desk Clerks 452 Waiters and Waitresses 395 Food Preparation Workers 386 Dining Room and Cafeteria Attendants and Bartender Helpers 224 Coaches and Scouts 189 Dishwashers 169 Amusement and Recreation Attendants 134 Landscaping and Groundskeeping Workers 122 Bartenders 114 Recreation Workers 76 Fitness Trainers and Aerobics Instructors 9 Cooks, Fast Food
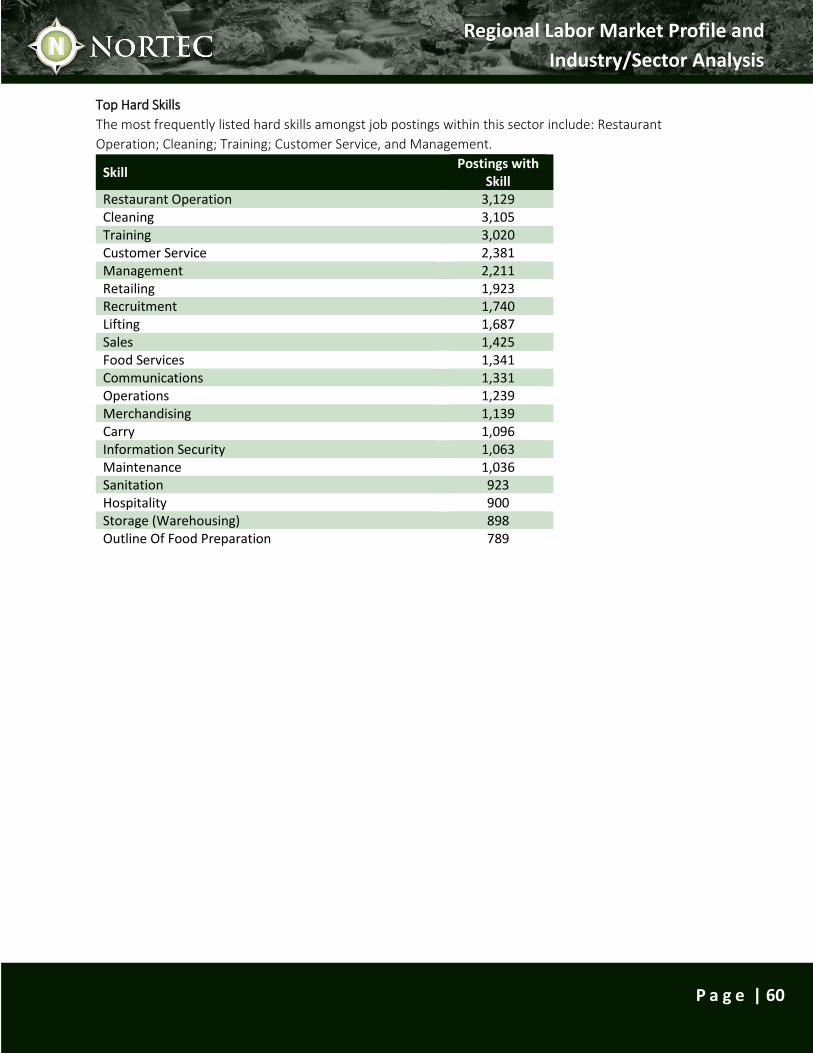
Regional Labor Market Profile and
Industry/Sector Analysis
P a g e | 60
Top Hard Skills
The most frequently listed hard skills amongst job postings within this sector include: Restaurant
Operation; Cleaning; Training; Customer Service, and Management.
Skill Postings with
Skill Restaurant Operation 3,129 Cleaning 3,105 Training 3,020 Customer Service 2,381 Management 2,211 Retailing 1,923 Recruitment 1,740 Lifting 1,687 Sales 1,425 Food Services 1,341 Communications 1,331 Operations 1,239 Merchandising 1,139 Carry 1,096 Information Security 1,063 Maintenance 1,036 Sanitation 923 Hospitality 900 Storage (Warehousing) 898 Outline Of Food Preparation 789
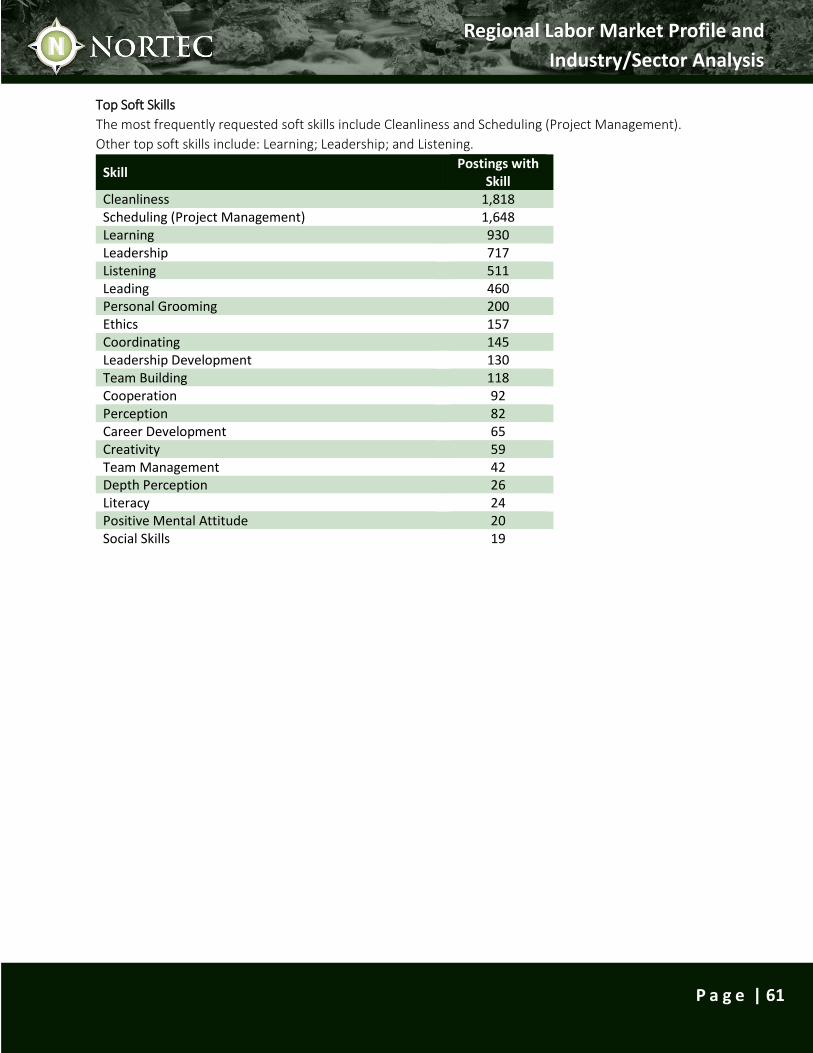
Regional Labor Market Profile and
Industry/Sector Analysis
P a g e | 61
Top Soft Skills
The most frequently requested soft skills include Cleanliness and Scheduling (Project Management).
Other top soft skills include: Learning; Leadership; and Listening.
Skill Postings with
Skill Cleanliness 1,818 Scheduling (Project Management) 1,648 Learning 930 Leadership 717 Listening 511 Leading 460 Personal Grooming 200 Ethics 157 Coordinating 145 Leadership Development 130 Team Building 118 Cooperation 92 Perception 82 Career Development 65 Creativity 59 Team Management 42 Depth Perception 26 Literacy 24 Positive Mental Attitude 20 Social Skills 19
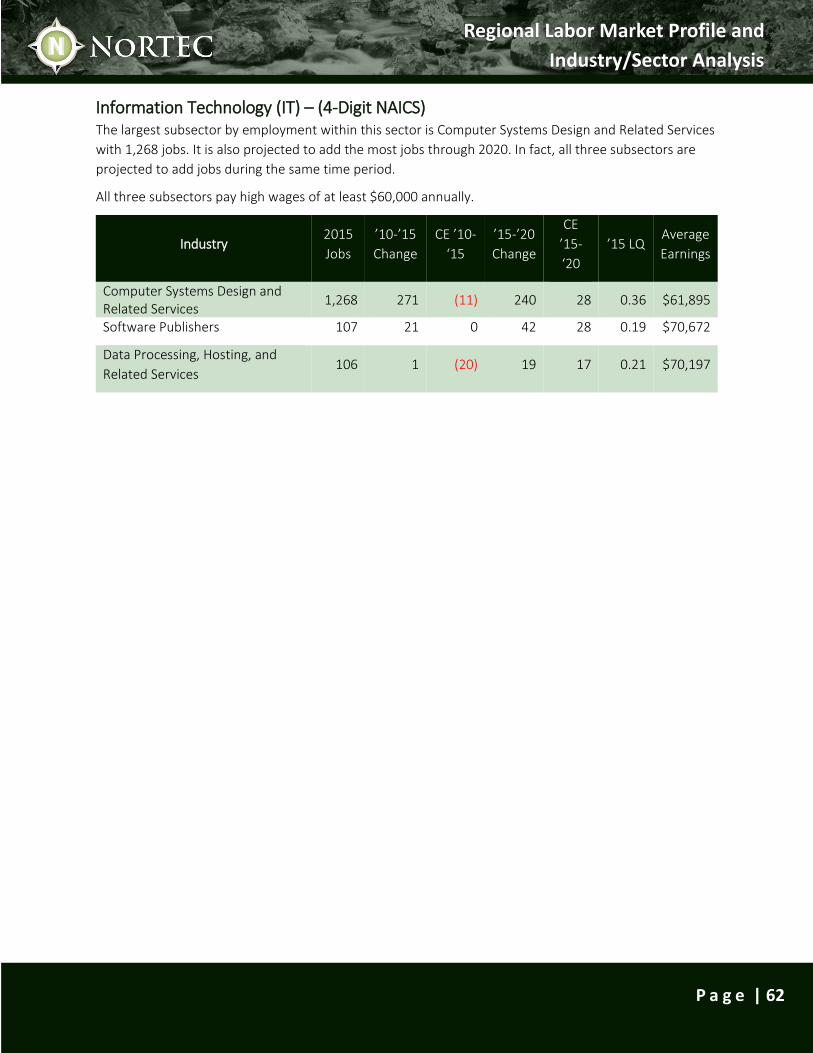
Regional Labor Market Profile and
Industry/Sector Analysis
P a g e | 62
Information Technology (IT) – (4-Digit NAICS) The largest subsector by employment within this sector is Computer Systems Design and Related Services
with 1,268 jobs. It is also projected to add the most jobs through 2020. In fact, all three subsectors are
projected to add jobs during the same time period.
All three subsectors pay high wages of at least $60,000 annually.
Industry 2015
Jobs
’10-’15
Change
CE ’10-
‘15
’15-’20
Change
CE
’15-
‘20
’15 LQ Average
Earnings
Computer Systems Design and Related Services
1,268 271 (11) 240 28 0.36 $61,895
Software Publishers 107 21 0 42 28 0.19 $70,672
Data Processing, Hosting, and
Related Services 106 1 (20) 19 17 0.21 $70,197
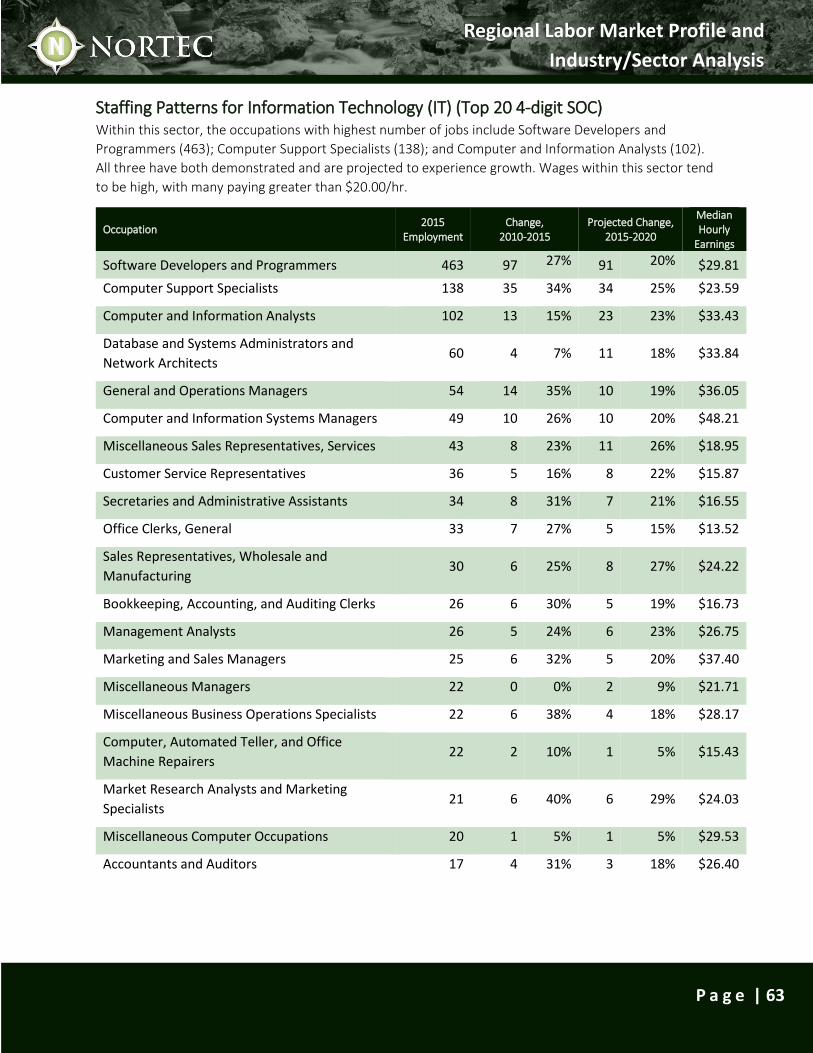
Regional Labor Market Profile and
Industry/Sector Analysis
P a g e | 63
Staffing Patterns for Information Technology (IT) (Top 20 4-digit SOC) Within this sector, the occupations with highest number of jobs include Software Developers and
Programmers (463); Computer Support Specialists (138); and Computer and Information Analysts (102).
All three have both demonstrated and are projected to experience growth. Wages within this sector tend
to be high, with many paying greater than $20.00/hr.
Occupation 2015
Employment Change,
2010-2015 Projected Change,
2015-2020
Median Hourly
Earnings
Software Developers and Programmers 463 97 27% 91 20% $29.81
Computer Support Specialists 138 35 34% 34 25% $23.59
Computer and Information Analysts 102 13 15% 23 23% $33.43
Database and Systems Administrators and
Network Architects 60 4 7% 11 18% $33.84
General and Operations Managers 54 14 35% 10 19% $36.05
Computer and Information Systems Managers 49 10 26% 10 20% $48.21
Miscellaneous Sales Representatives, Services 43 8 23% 11 26% $18.95
Customer Service Representatives 36 5 16% 8 22% $15.87
Secretaries and Administrative Assistants 34 8 31% 7 21% $16.55
Office Clerks, General 33 7 27% 5 15% $13.52
Sales Representatives, Wholesale and
Manufacturing 30 6 25% 8 27% $24.22
Bookkeeping, Accounting, and Auditing Clerks 26 6 30% 5 19% $16.73
Management Analysts 26 5 24% 6 23% $26.75
Marketing and Sales Managers 25 6 32% 5 20% $37.40
Miscellaneous Managers 22 0 0% 2 9% $21.71
Miscellaneous Business Operations Specialists 22 6 38% 4 18% $28.17
Computer, Automated Teller, and Office
Machine Repairers 22 2 10% 1 5% $15.43
Market Research Analysts and Marketing
Specialists 21 6 40% 6 29% $24.03
Miscellaneous Computer Occupations 20 1 5% 1 5% $29.53
Accountants and Auditors 17 4 31% 3 18% $26.40
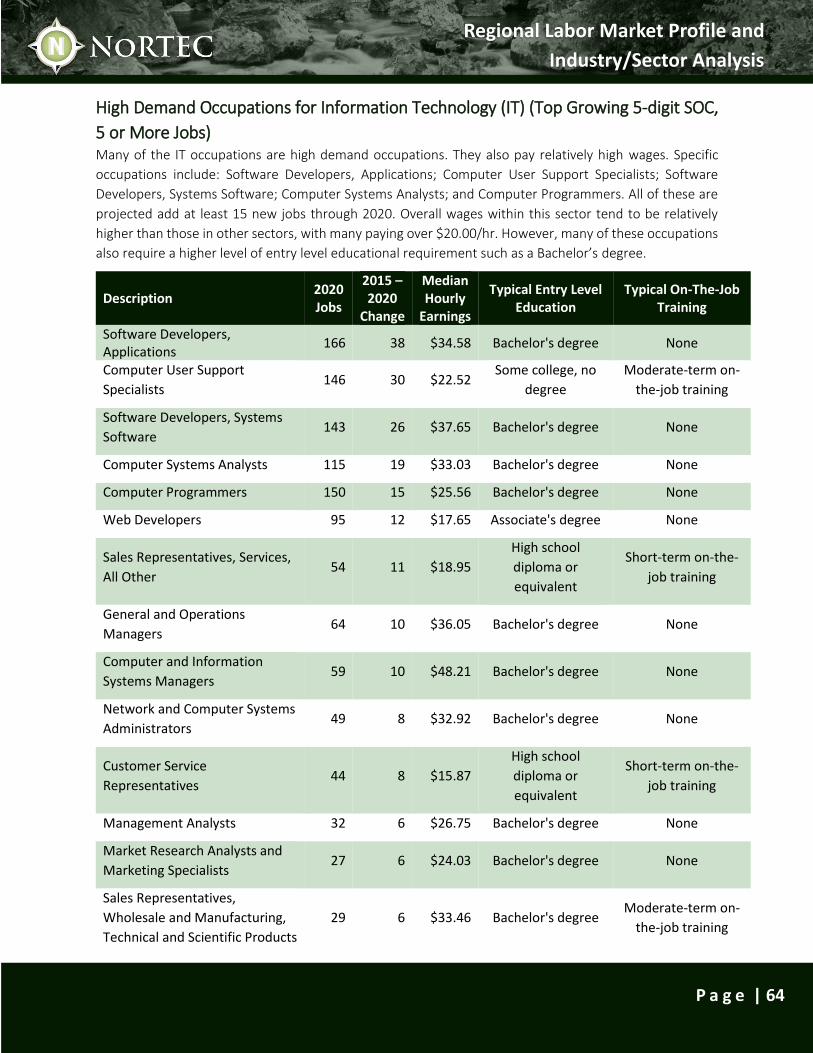
Regional Labor Market Profile and
Industry/Sector Analysis
P a g e | 64
High Demand Occupations for Information Technology (IT) (Top Growing 5-digit SOC,
5 or More Jobs) Many of the IT occupations are high demand occupations. They also pay relatively high wages. Specific
occupations include: Software Developers, Applications; Computer User Support Specialists; Software
Developers, Systems Software; Computer Systems Analysts; and Computer Programmers. All of these are
projected add at least 15 new jobs through 2020. Overall wages within this sector tend to be relatively
higher than those in other sectors, with many paying over $20.00/hr. However, many of these occupations
also require a higher level of entry level educational requirement such as a Bachelor’s degree.
Description 2020 Jobs
2015 – 2020
Change
Median Hourly
Earnings
Typical Entry Level Education
Typical On-The-Job Training
Software Developers, Applications
166 38 $34.58 Bachelor's degree None
Computer User Support
Specialists 146 30 $22.52
Some college, no
degree
Moderate-term on-
the-job training
Software Developers, Systems
Software 143 26 $37.65 Bachelor's degree None
Computer Systems Analysts 115 19 $33.03 Bachelor's degree None
Computer Programmers 150 15 $25.56 Bachelor's degree None
Web Developers 95 12 $17.65 Associate's degree None
Sales Representatives, Services,
All Other 54 11 $18.95
High school
diploma or
equivalent
Short-term on-the-
job training
General and Operations
Managers 64 10 $36.05 Bachelor's degree None
Computer and Information
Systems Managers 59 10 $48.21 Bachelor's degree None
Network and Computer Systems
Administrators 49 8 $32.92 Bachelor's degree None
Customer Service
Representatives 44 8 $15.87
High school
diploma or
equivalent
Short-term on-the-
job training
Management Analysts 32 6 $26.75 Bachelor's degree None
Market Research Analysts and
Marketing Specialists 27 6 $24.03 Bachelor's degree None
Sales Representatives,
Wholesale and Manufacturing,
Technical and Scientific Products
29 6 $33.46 Bachelor's degree Moderate-term on-
the-job training
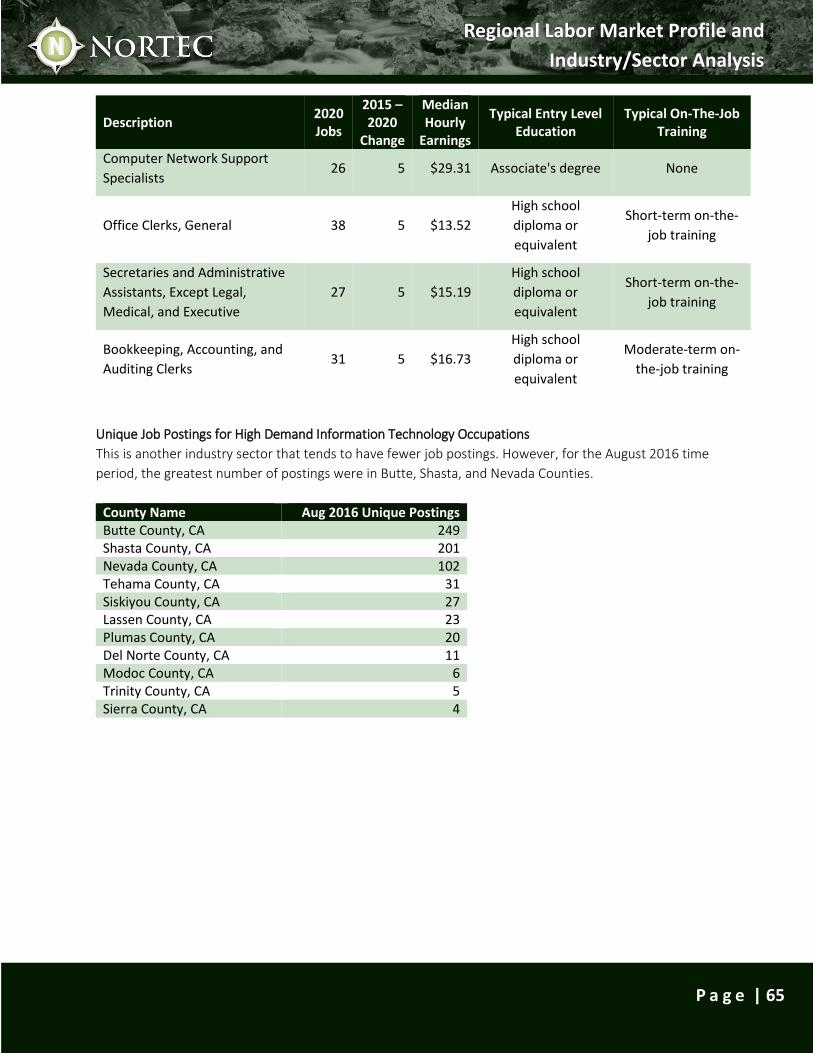
Regional Labor Market Profile and
Industry/Sector Analysis
P a g e | 65
Description 2020 Jobs
2015 – 2020
Change
Median Hourly
Earnings
Typical Entry Level Education
Typical On-The-Job Training
Computer Network Support
Specialists 26 5 $29.31 Associate's degree None
Office Clerks, General 38 5 $13.52
High school
diploma or
equivalent
Short-term on-the-
job training
Secretaries and Administrative
Assistants, Except Legal,
Medical, and Executive
27 5 $15.19
High school
diploma or
equivalent
Short-term on-the-
job training
Bookkeeping, Accounting, and
Auditing Clerks 31 5 $16.73
High school
diploma or
equivalent
Moderate-term on-
the-job training
Unique Job Postings for High Demand Information Technology Occupations
This is another industry sector that tends to have fewer job postings. However, for the August 2016 time
period, the greatest number of postings were in Butte, Shasta, and Nevada Counties.
County Name Aug 2016 Unique Postings Butte County, CA 249 Shasta County, CA 201 Nevada County, CA 102 Tehama County, CA 31 Siskiyou County, CA 27 Lassen County, CA 23 Plumas County, CA 20 Del Norte County, CA 11 Modoc County, CA 6 Trinity County, CA 5 Sierra County, CA 4
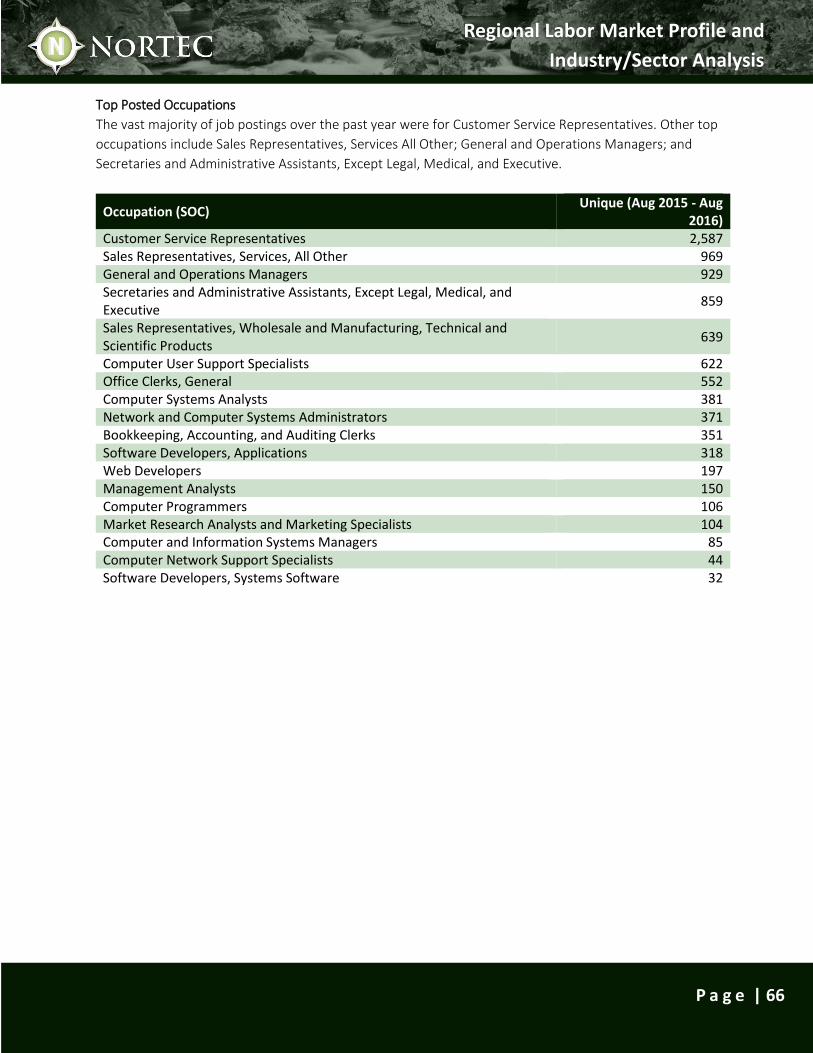
Regional Labor Market Profile and
Industry/Sector Analysis
P a g e | 66
Top Posted Occupations
The vast majority of job postings over the past year were for Customer Service Representatives. Other top
occupations include Sales Representatives, Services All Other; General and Operations Managers; and
Secretaries and Administrative Assistants, Except Legal, Medical, and Executive.
Occupation (SOC) Unique (Aug 2015 - Aug
2016) Customer Service Representatives 2,587 Sales Representatives, Services, All Other 969 General and Operations Managers 929 Secretaries and Administrative Assistants, Except Legal, Medical, and Executive
859
Sales Representatives, Wholesale and Manufacturing, Technical and Scientific Products
639
Computer User Support Specialists 622 Office Clerks, General 552 Computer Systems Analysts 381 Network and Computer Systems Administrators 371 Bookkeeping, Accounting, and Auditing Clerks 351 Software Developers, Applications 318 Web Developers 197 Management Analysts 150 Computer Programmers 106 Market Research Analysts and Marketing Specialists 104 Computer and Information Systems Managers 85 Computer Network Support Specialists 44 Software Developers, Systems Software 32
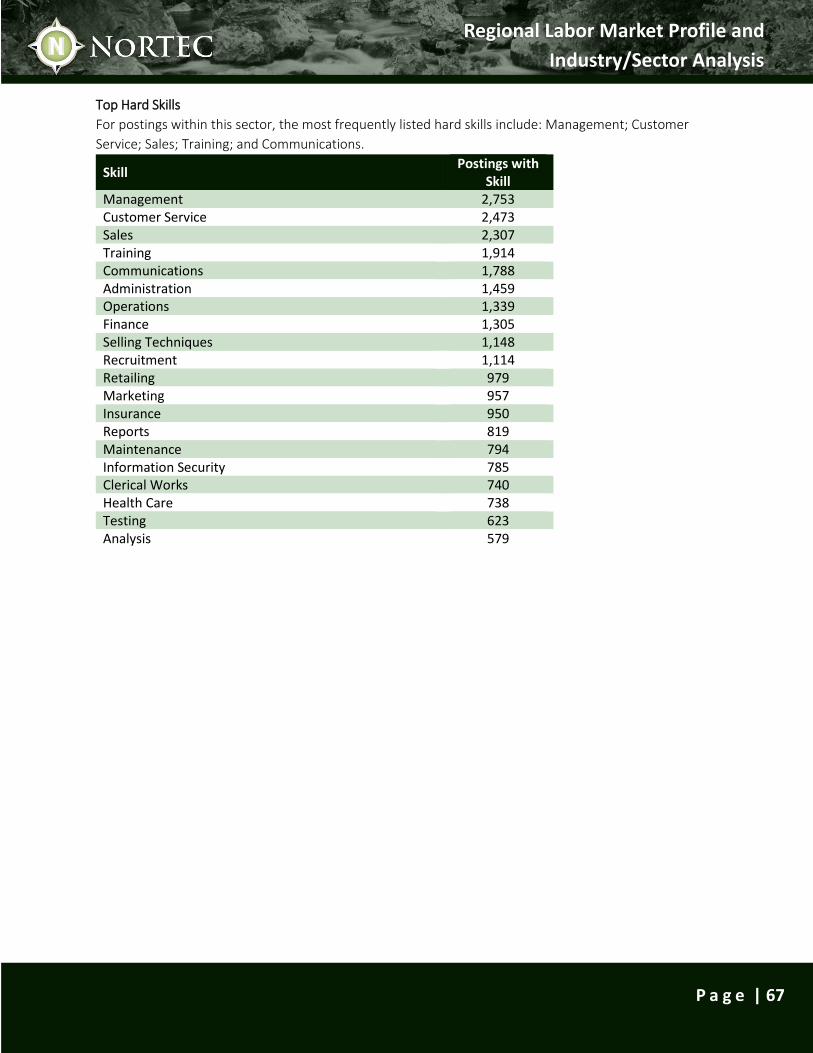
Regional Labor Market Profile and
Industry/Sector Analysis
P a g e | 67
Top Hard Skills
For postings within this sector, the most frequently listed hard skills include: Management; Customer
Service; Sales; Training; and Communications.
Skill Postings with
Skill Management 2,753 Customer Service 2,473 Sales 2,307 Training 1,914 Communications 1,788 Administration 1,459 Operations 1,339 Finance 1,305 Selling Techniques 1,148 Recruitment 1,114 Retailing 979 Marketing 957 Insurance 950 Reports 819 Maintenance 794 Information Security 785 Clerical Works 740 Health Care 738 Testing 623 Analysis 579
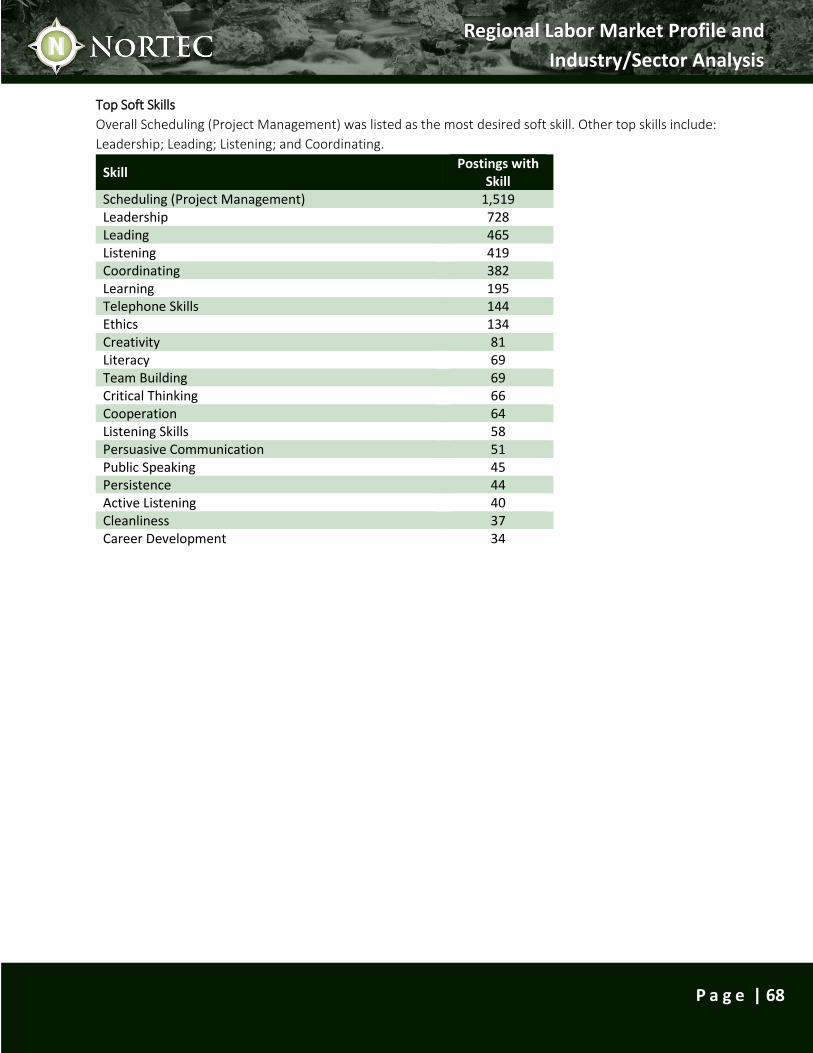
Regional Labor Market Profile and
Industry/Sector Analysis
P a g e | 68
Top Soft Skills
Overall Scheduling (Project Management) was listed as the most desired soft skill. Other top skills include:
Leadership; Leading; Listening; and Coordinating.
Skill Postings with
Skill Scheduling (Project Management) 1,519 Leadership 728 Leading 465 Listening 419 Coordinating 382 Learning 195 Telephone Skills 144 Ethics 134 Creativity 81 Literacy 69 Team Building 69 Critical Thinking 66 Cooperation 64 Listening Skills 58 Persuasive Communication 51 Public Speaking 45 Persistence 44 Active Listening 40 Cleanliness 37 Career Development 34
Regional Labor Market Profile and
Industry/Sector Analysis
P a g e | 69
Appendix A: Data Sources and Glossary of Key Terms
Data Sources All data and analysis for this report are directly or indirectly derived from information provided by either the U.S. Bureau of the Census or U.S. Bureau of Labor Statistics:
Economic Modeling Specialists International (EMSI), 2016.1 Class of Worker data (based on the U.S. Quarterly Census of Employment and Wages) and general demographic estimates
U.S. Census American Community Survey 2010-2014 Estimates
U.S. Census OnTheMap
Competitive Effect Used in conjunction with "Shift-Share Analysis" techniques29, The Competitive Effect metric seeks to isolate the influence of local dynamics from the influence of non-local factors on industries' employment growth or decline. A positive number indicates that the study area experienced more growth within a particular industry than would have been expected from non-local trends; the magnitude of The Competitive Effect indicates the strength of the purely local influence on the industry's employment change.
Location Quotient Location Quotient (LQ) measures the relative importance of an industry's employment to a particular region, and uses the straightforward formula: [% of total local employment/% of total national employment]. Location Quotients are one of the most common and important indicators of local economic characteristics; LQ's greater than 1.25 are typically considered to be the threshold for identifying an industry as especially relatively strong.
NAICS Codes (The North American Industry Classification System) NAICS is the standard used by Federal statistical agencies in classifying business establishments for the purpose of collecting, analyzing, and publishing statistical data related to the U.S. business economy. The numbering structure is hierarchical in nature, meaning that fewer digits are broader in their meaning, while longer (up to six) digits provider greater specificity.
SOC Codes (Standard Occupational Classification) The 2000 Standard Occupational Classification (SOC) System was developed in response to a growing need for a universal occupational classification system. Such a classification system allows government agencies and private industry to produce comparable data. Users of occupational data include government program managers, industrial and labor relations practitioners, students considering career training, job seekers, vocational training schools, and employers wishing to set salary scales or locate a new plant. It is used by federal agencies collecting occupational data, providing a standard means to
29 Shift share is a standard regional analysis method that attempts to determine how much of regional job growth can be attributed to national trends and how much is due to unique regional factors. Shift share helps answer why employment is growing or declining in a regional industry, cluster, or occupation.
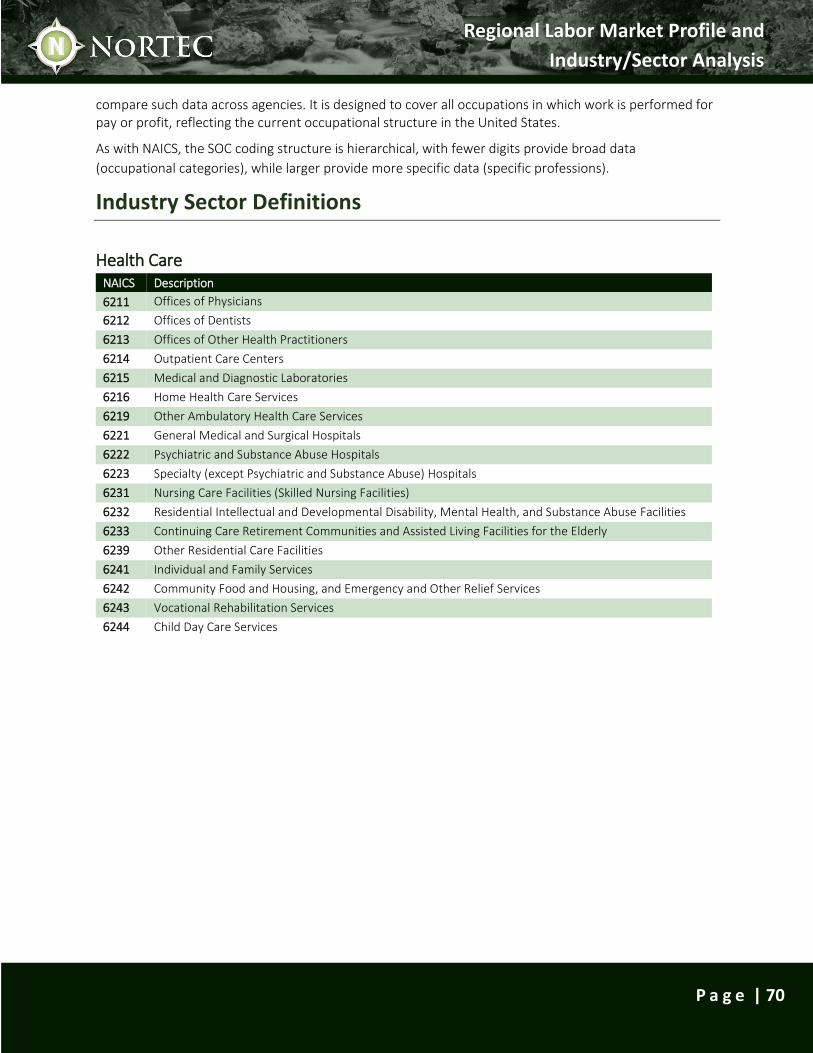
Regional Labor Market Profile and
Industry/Sector Analysis
P a g e | 70
compare such data across agencies. It is designed to cover all occupations in which work is performed for pay or profit, reflecting the current occupational structure in the United States.
As with NAICS, the SOC coding structure is hierarchical, with fewer digits provide broad data
(occupational categories), while larger provide more specific data (specific professions).
Industry Sector Definitions
Health Care NAICS Description
6211 Offices of Physicians
6212 Offices of Dentists
6213 Offices of Other Health Practitioners
6214 Outpatient Care Centers
6215 Medical and Diagnostic Laboratories
6216 Home Health Care Services
6219 Other Ambulatory Health Care Services
6221 General Medical and Surgical Hospitals
6222 Psychiatric and Substance Abuse Hospitals
6223 Specialty (except Psychiatric and Substance Abuse) Hospitals
6231 Nursing Care Facilities (Skilled Nursing Facilities)
6232 Residential Intellectual and Developmental Disability, Mental Health, and Substance Abuse Facilities
6233 Continuing Care Retirement Communities and Assisted Living Facilities for the Elderly
6239 Other Residential Care Facilities
6241 Individual and Family Services
6242 Community Food and Housing, and Emergency and Other Relief Services
6243 Vocational Rehabilitation Services
6244 Child Day Care Services
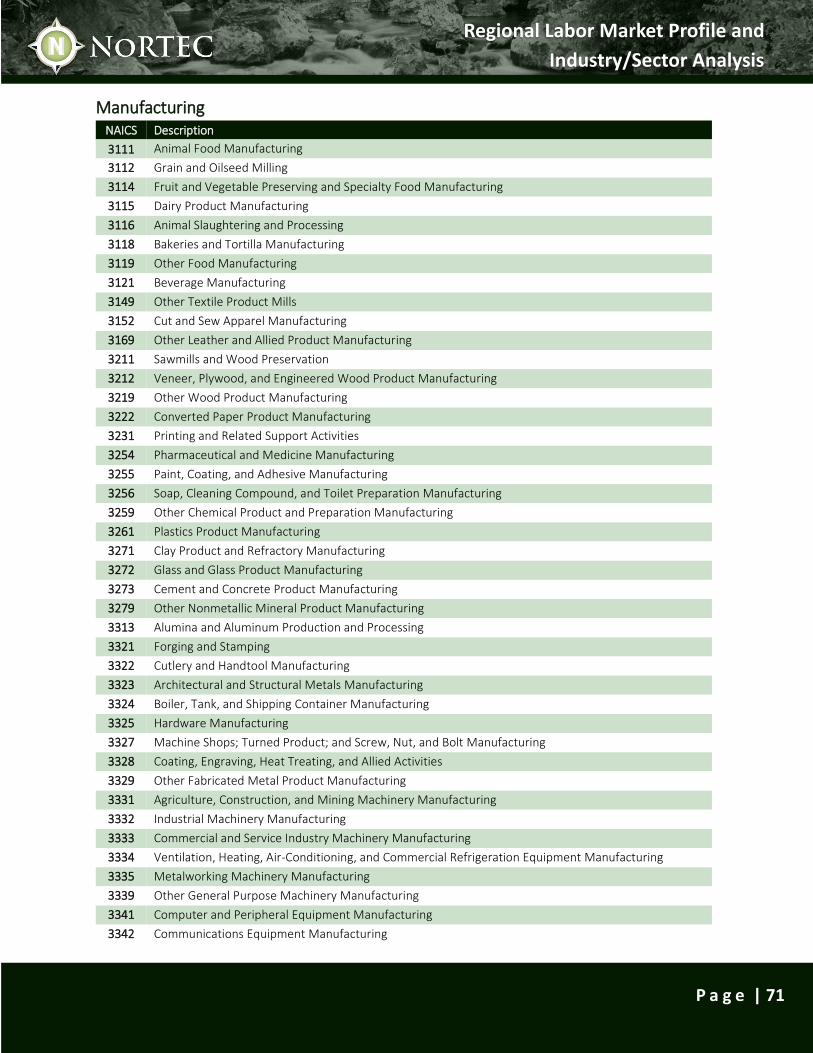
Regional Labor Market Profile and
Industry/Sector Analysis
P a g e | 71
Manufacturing NAICS Description
3111 Animal Food Manufacturing
3112 Grain and Oilseed Milling
3114 Fruit and Vegetable Preserving and Specialty Food Manufacturing
3115 Dairy Product Manufacturing
3116 Animal Slaughtering and Processing
3118 Bakeries and Tortilla Manufacturing
3119 Other Food Manufacturing
3121 Beverage Manufacturing
3149 Other Textile Product Mills
3152 Cut and Sew Apparel Manufacturing
3169 Other Leather and Allied Product Manufacturing
3211 Sawmills and Wood Preservation
3212 Veneer, Plywood, and Engineered Wood Product Manufacturing
3219 Other Wood Product Manufacturing
3222 Converted Paper Product Manufacturing
3231 Printing and Related Support Activities
3254 Pharmaceutical and Medicine Manufacturing
3255 Paint, Coating, and Adhesive Manufacturing
3256 Soap, Cleaning Compound, and Toilet Preparation Manufacturing
3259 Other Chemical Product and Preparation Manufacturing
3261 Plastics Product Manufacturing
3271 Clay Product and Refractory Manufacturing
3272 Glass and Glass Product Manufacturing
3273 Cement and Concrete Product Manufacturing
3279 Other Nonmetallic Mineral Product Manufacturing
3313 Alumina and Aluminum Production and Processing
3321 Forging and Stamping
3322 Cutlery and Handtool Manufacturing
3323 Architectural and Structural Metals Manufacturing
3324 Boiler, Tank, and Shipping Container Manufacturing
3325 Hardware Manufacturing
3327 Machine Shops; Turned Product; and Screw, Nut, and Bolt Manufacturing
3328 Coating, Engraving, Heat Treating, and Allied Activities
3329 Other Fabricated Metal Product Manufacturing
3331 Agriculture, Construction, and Mining Machinery Manufacturing
3332 Industrial Machinery Manufacturing
3333 Commercial and Service Industry Machinery Manufacturing
3334 Ventilation, Heating, Air-Conditioning, and Commercial Refrigeration Equipment Manufacturing
3335 Metalworking Machinery Manufacturing
3339 Other General Purpose Machinery Manufacturing
3341 Computer and Peripheral Equipment Manufacturing
3342 Communications Equipment Manufacturing
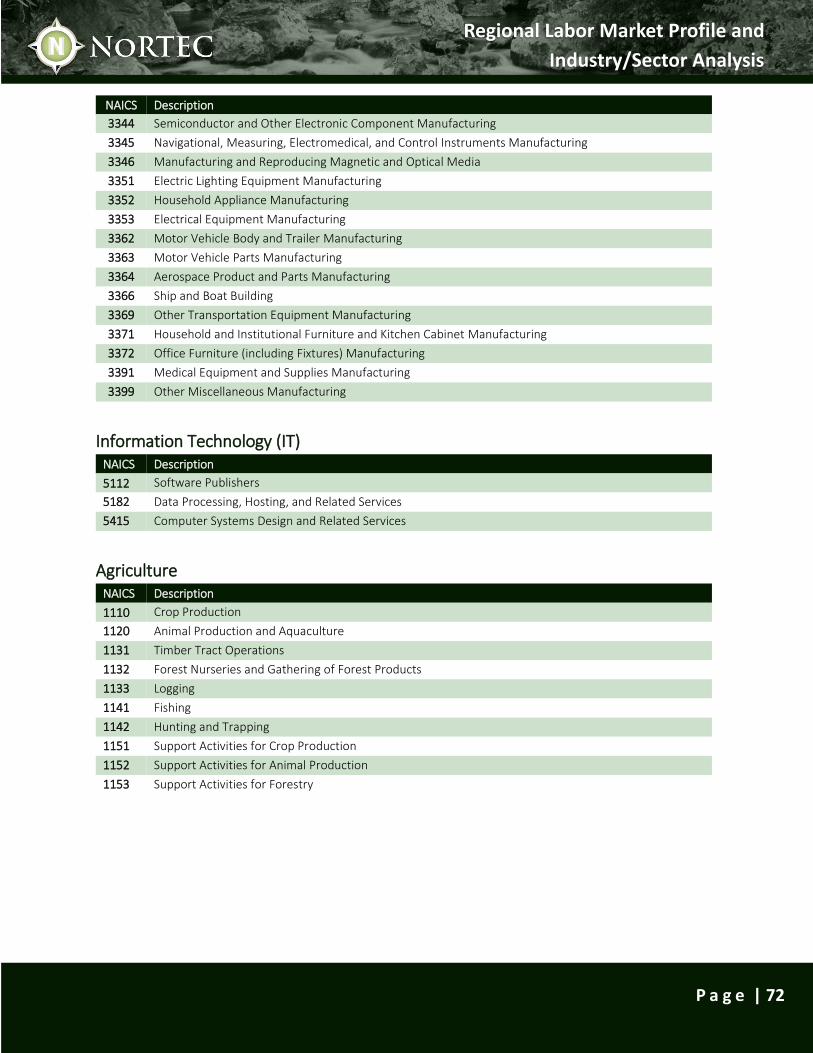
Regional Labor Market Profile and
Industry/Sector Analysis
P a g e | 72
NAICS Description
3344 Semiconductor and Other Electronic Component Manufacturing
3345 Navigational, Measuring, Electromedical, and Control Instruments Manufacturing
3346 Manufacturing and Reproducing Magnetic and Optical Media
3351 Electric Lighting Equipment Manufacturing
3352 Household Appliance Manufacturing
3353 Electrical Equipment Manufacturing
3362 Motor Vehicle Body and Trailer Manufacturing
3363 Motor Vehicle Parts Manufacturing
3364 Aerospace Product and Parts Manufacturing
3366 Ship and Boat Building
3369 Other Transportation Equipment Manufacturing
3371 Household and Institutional Furniture and Kitchen Cabinet Manufacturing
3372 Office Furniture (including Fixtures) Manufacturing
3391 Medical Equipment and Supplies Manufacturing
3399 Other Miscellaneous Manufacturing
Information Technology (IT) NAICS Description
5112 Software Publishers
5182 Data Processing, Hosting, and Related Services
5415 Computer Systems Design and Related Services
Agriculture NAICS Description
1110 Crop Production
1120 Animal Production and Aquaculture
1131 Timber Tract Operations
1132 Forest Nurseries and Gathering of Forest Products
1133 Logging
1141 Fishing
1142 Hunting and Trapping
1151 Support Activities for Crop Production
1152 Support Activities for Animal Production
1153 Support Activities for Forestry
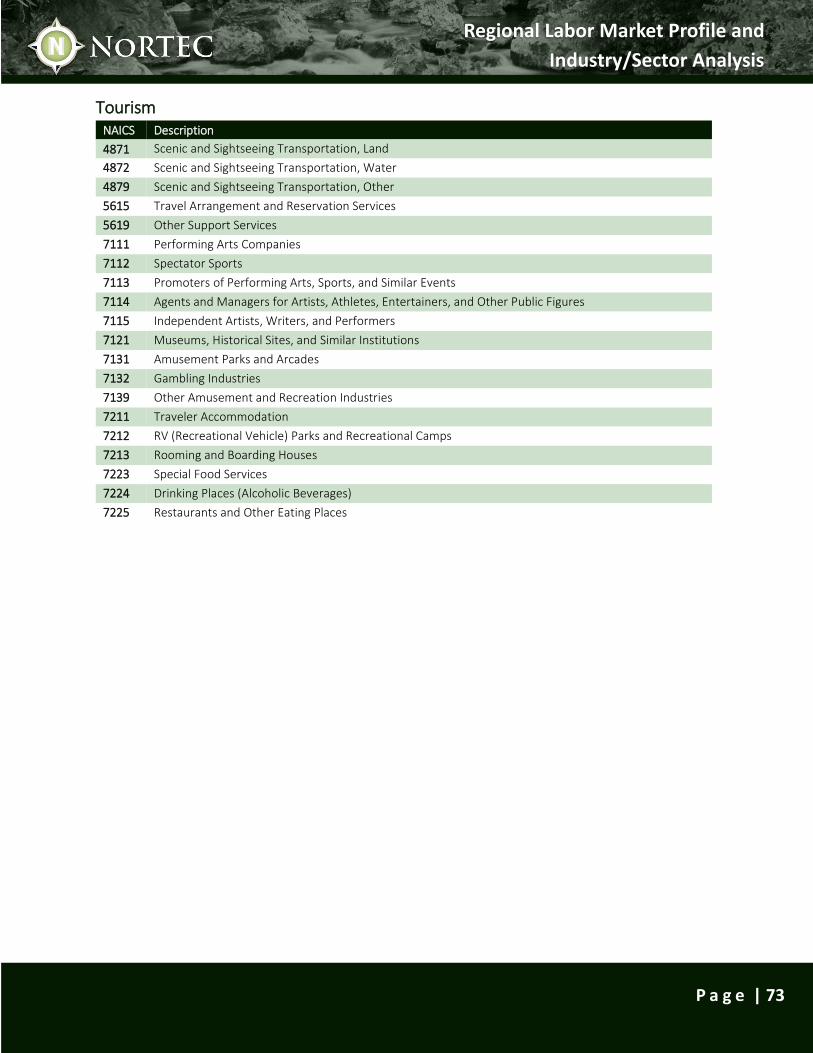
Regional Labor Market Profile and
Industry/Sector Analysis
P a g e | 73
Tourism NAICS Description
4871 Scenic and Sightseeing Transportation, Land
4872 Scenic and Sightseeing Transportation, Water
4879 Scenic and Sightseeing Transportation, Other
5615 Travel Arrangement and Reservation Services
5619 Other Support Services
7111 Performing Arts Companies
7112 Spectator Sports
7113 Promoters of Performing Arts, Sports, and Similar Events
7114 Agents and Managers for Artists, Athletes, Entertainers, and Other Public Figures
7115 Independent Artists, Writers, and Performers
7121 Museums, Historical Sites, and Similar Institutions
7131 Amusement Parks and Arcades
7132 Gambling Industries
7139 Other Amusement and Recreation Industries
7211 Traveler Accommodation
7212 RV (Recreational Vehicle) Parks and Recreational Camps
7213 Rooming and Boarding Houses
7223 Special Food Services
7224 Drinking Places (Alcoholic Beverages)
7225 Restaurants and Other Eating Places

Regional Labor Market Profile and
Industry/Sector Analysis
P a g e | 74
Appendix B: Regional Input Session Takeaways
May 2016
Over the course of two weeks in May, 2016, sixteen input sessions were conducted across the region,
with at least one in each of the 11 counties. Local businesses and community partners were invited to
provide input on the greatest opportunities and challenges for the local economy, the services available
to assist with business growth, and the greatest workforce needs for employers. Each county had its own
unique set of takeaways and priorities, however, the following themes were identified as important
across the region as a whole.
• The active participation and enthusiasm in each of the input sessions across the region was
impressive and indicates a high level of engagement and interest in contributing to the
implementation of a regional strategy. Moving forward, it will be critical to continue to
communicate with these participants and other community members to harness this energy
into coordinated action.
• There was a common theme across input sessions of recognition that Northern California is
different from the rest of California in a lot of ways, and state policies often seem to disregard
this. There is a need for advocacy for the region – to bring awareness to its differences and
what it is like for businesses to operate in this area.
• One of the biggest strengths that surfaced across the region was the high quality of life that is
available in the area. People live in the area because they want to and want to pursue a certain
lifestyle. This can be valuable in talent attraction efforts if this message can be developed and
used for recruitment.
• A great challenge of the region is its size and the vast geography that it covers. Logistically, this
can make collaboration difficult, but the geography also varies extensively, leading to different
economic strengths in different communities. Despite this barrier, there seemed to be a
willingness that would support collaborative efforts if a mechanism for communication and
“sharing wins” could be developed.
• Across the region, participants recognized that youth engagement was crucial to building the
future workforce. Many youth do not have a full understanding of the opportunities that are
available to them locally after graduation, and that there are careers they can pursue without
leaving to get a four year degree. Educating more on these opportunities through more
connections with education and business and promoting work-based learning activities at a
younger age can help to keep young people engaged in their local communities.

Regional Labor Market Profile and
Industry/Sector Analysis
P a g e | 75
• Entrepreneurship and small business development was mentioned as an opportunity and a
need in nearly every input session. This can be an important strategy to fill in some of the
service gaps that exist in the smaller, more isolated communities. It was also cited as a strategy
to engage those who are not suited for a typical nine to five job. Entrepreneurship can help
capture some of the creativity and alternate ways of thinking that can often be written off as a
lack of interest in working.
• Housing was mentioned as a challenge in almost every county across the region. In some areas,
the housing stock is so low that there aren’t available properties for workers coming in from
outside of the area, especially rental properties. The lack of rental properties is also particularly
challenging for areas with a large seasonal workforce. In other areas, the available housing is
so expensive that it is difficult to attract entry-level workers who will not be earning enough to
afford the available properties.
• Another infrastructure barrier that was frequently mentioned was access to high speed
internet. Most communities across the region do not have fiber access or broadband, which
affects both business and talent attraction.
Regional Labor Market Profile and
Industry/Sector Analysis
P a g e | 76
Appendix C: NoRTEC Regional Survey Summary March – July, 2016
TPMA in collaboration with NoRTEC and its service providers developed a survey designed to engage
regional employers and to better understand current workforce trends and needs in the NoRTEC region.
In doing so, our consulting team collaborated with NoRTEC and its service providers, which included a
diverse group of workforce development, economic development, and other community organizations.
Over a four-month period the survey was distributed via email and completed through face-to-face
meetings with employers. Survey questions were focused on the following topics:
Industry and business demographics;
Employment numbers and projections;
Labor market “churn”;
Skill needs and gaps;
Education and training requirements;
Desired industry recognized credentials; and
Training challenges.
Just under 300 employers participated in the survey. The following includes a summary, analysis and key
findings.
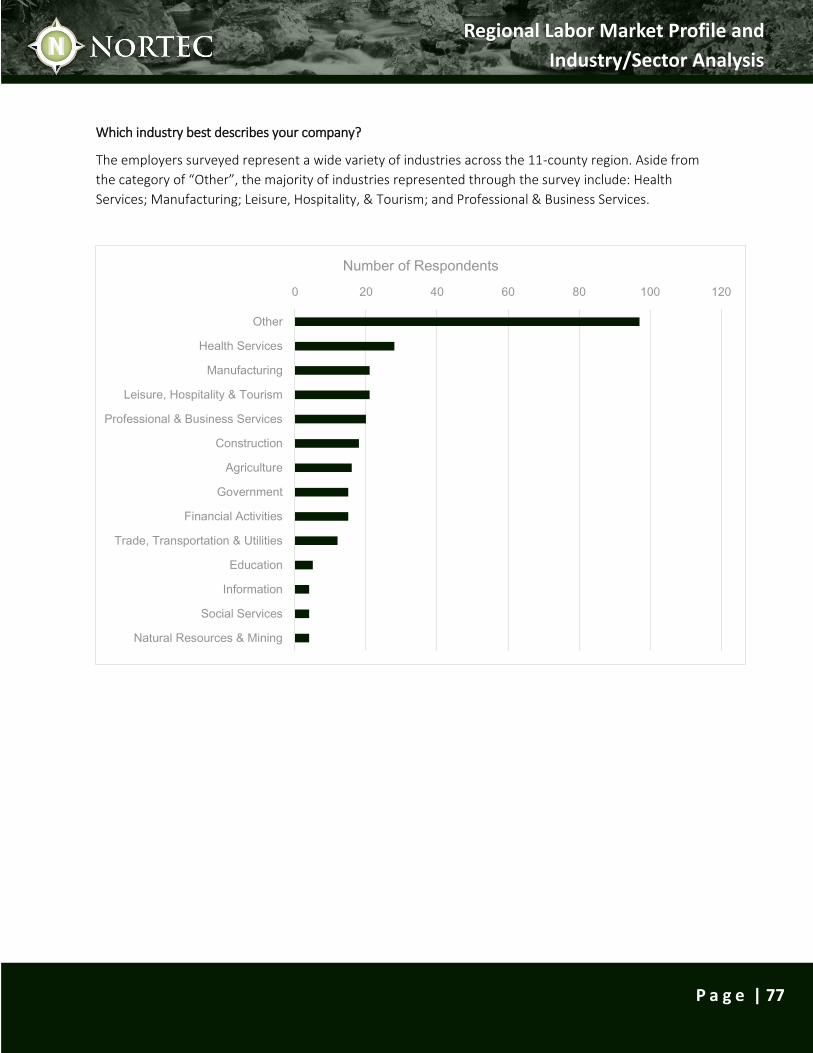
Regional Labor Market Profile and
Industry/Sector Analysis
P a g e | 77
Which industry best describes your company?
The employers surveyed represent a wide variety of industries across the 11-county region. Aside from
the category of “Other”, the majority of industries represented through the survey include: Health
Services; Manufacturing; Leisure, Hospitality, & Tourism; and Professional & Business Services.
0 20 40 60 80 100 120
Other
Health Services
Manufacturing
Leisure, Hospitality & Tourism
Professional & Business Services
Construction
Agriculture
Government
Financial Activities
Trade, Transportation & Utilities
Education
Information
Social Services
Natural Resources & Mining
Number of Respondents
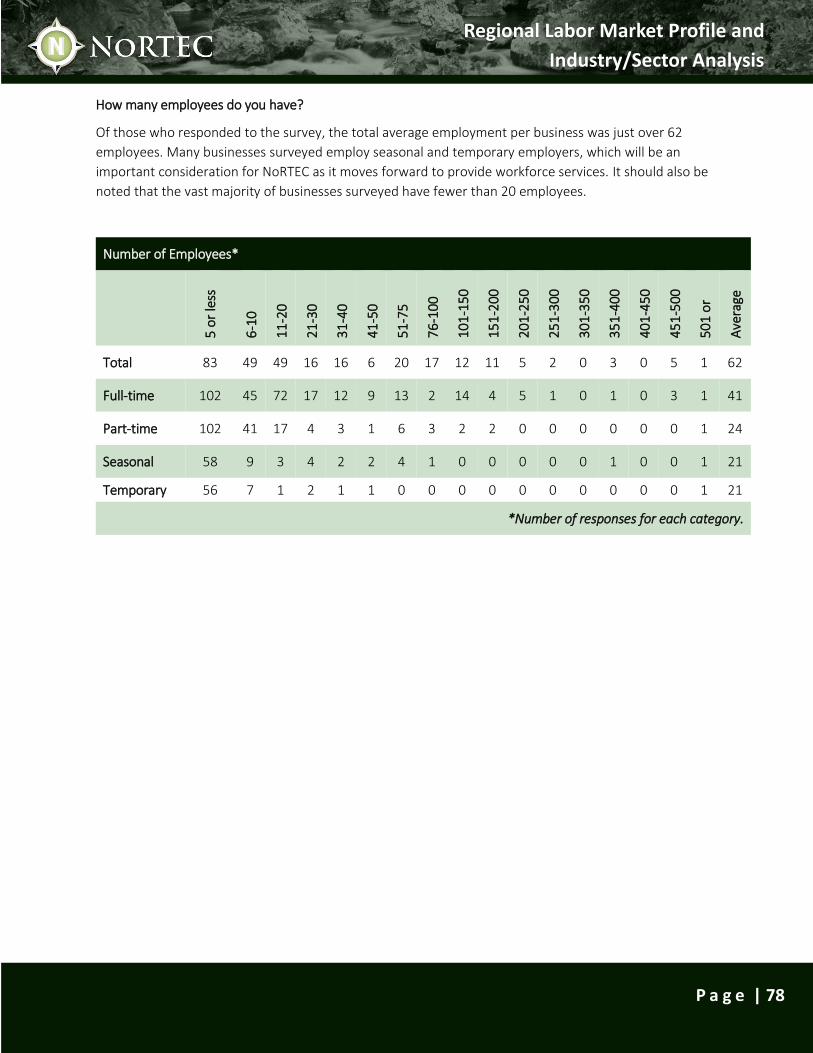
Regional Labor Market Profile and
Industry/Sector Analysis
P a g e | 78
How many employees do you have?
Of those who responded to the survey, the total average employment per business was just over 62
employees. Many businesses surveyed employ seasonal and temporary employers, which will be an
important consideration for NoRTEC as it moves forward to provide workforce services. It should also be
noted that the vast majority of businesses surveyed have fewer than 20 employees.
Number of Employees*
5 o
r le
ss
6-1
0
11
-20
21
-30
31
-40
41
-50
51
-75
76
-10
0
10
1-1
50
15
1-2
00
20
1-2
50
25
1-3
00
30
1-3
50
35
1-4
00
40
1-4
50
45
1-5
00
50
1 o
r m
ore
A
vera
ge
Total 83 49 49 16 16 6 20 17 12 11 5 2 0 3 0 5 1 62
Full-time 102 45 72 17 12 9 13 2 14 4 5 1 0 1 0 3 1 41
Part-time 102 41 17 4 3 1 6 3 2 2 0 0 0 0 0 0 1 24
Seasonal 58 9 3 4 2 2 4 1 0 0 0 0 0 1 0 0 1 21
Temporary 56 7 1 2 1 1 0 0 0 0 0 0 0 0 0 0 1 21
*Number of responses for each category.
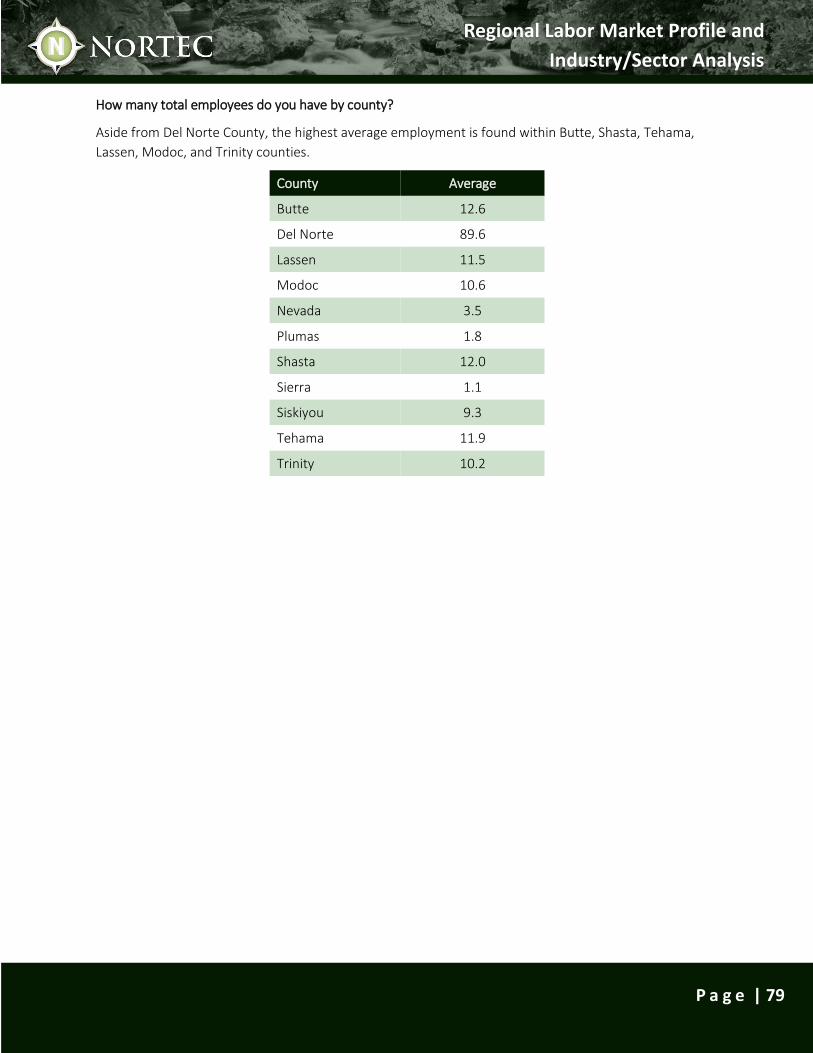
Regional Labor Market Profile and
Industry/Sector Analysis
P a g e | 79
How many total employees do you have by county?
Aside from Del Norte County, the highest average employment is found within Butte, Shasta, Tehama,
Lassen, Modoc, and Trinity counties.
County Average
Butte 12.6
Del Norte 89.6
Lassen 11.5
Modoc 10.6
Nevada 3.5
Plumas 1.8
Shasta 12.0
Sierra 1.1
Siskiyou 9.3
Tehama 11.9
Trinity 10.2
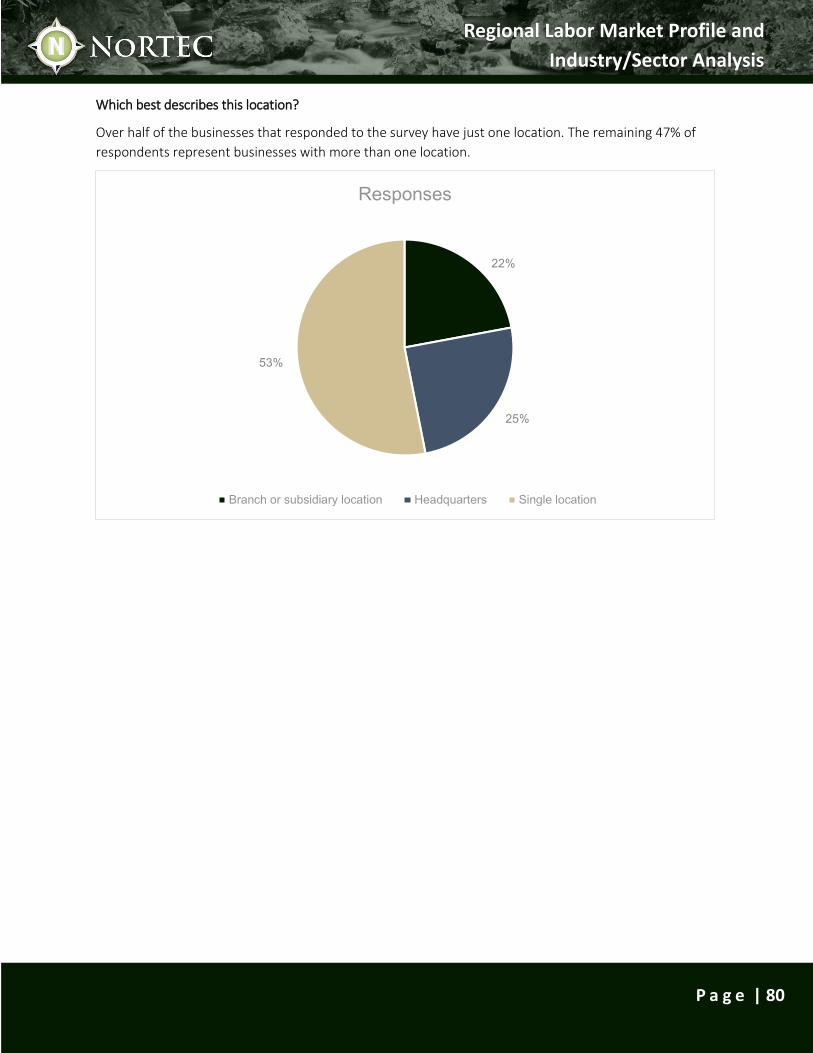
Regional Labor Market Profile and
Industry/Sector Analysis
P a g e | 80
Which best describes this location?
Over half of the businesses that responded to the survey have just one location. The remaining 47% of
respondents represent businesses with more than one location.
22%
25%
53%
Responses
Branch or subsidiary location Headquarters Single location
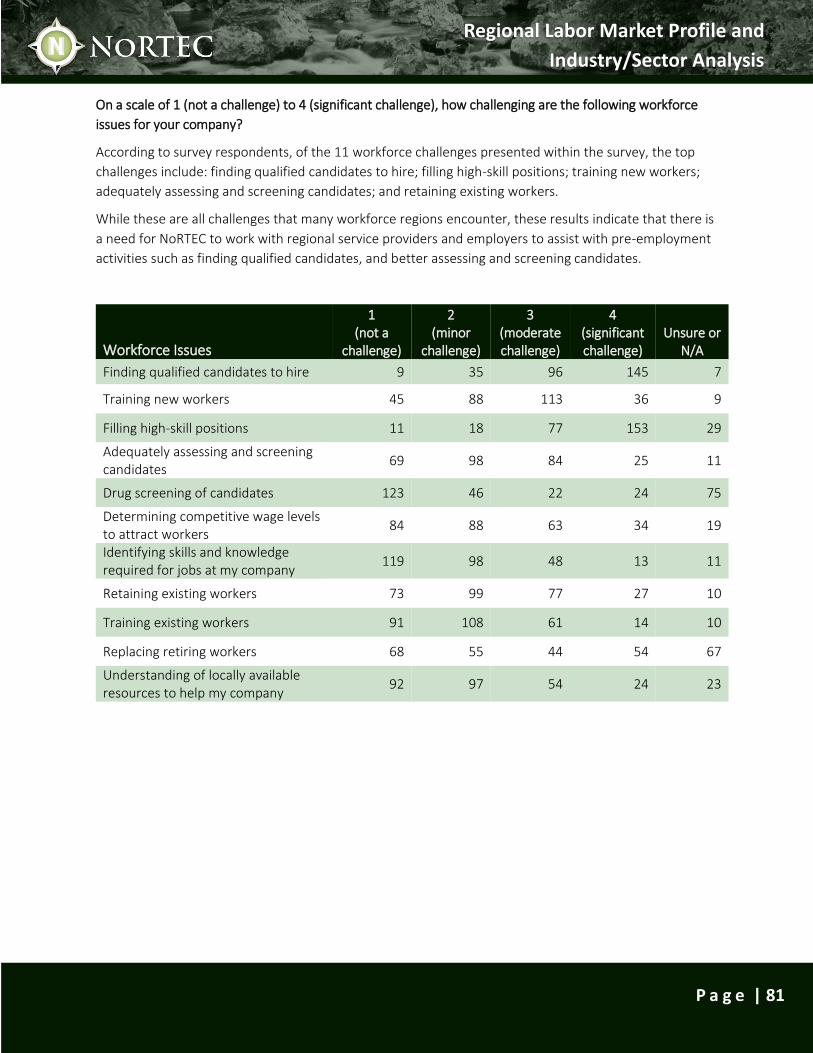
Regional Labor Market Profile and
Industry/Sector Analysis
P a g e | 81
On a scale of 1 (not a challenge) to 4 (significant challenge), how challenging are the following workforce
issues for your company?
According to survey respondents, of the 11 workforce challenges presented within the survey, the top
challenges include: finding qualified candidates to hire; filling high-skill positions; training new workers;
adequately assessing and screening candidates; and retaining existing workers.
While these are all challenges that many workforce regions encounter, these results indicate that there is
a need for NoRTEC to work with regional service providers and employers to assist with pre-employment
activities such as finding qualified candidates, and better assessing and screening candidates.
Workforce Issues
1 (not a
challenge)
2 (minor
challenge)
3 (moderate challenge)
4 (significant challenge)
Unsure or N/A
Finding qualified candidates to hire 9 35 96 145 7
Training new workers 45 88 113 36 9
Filling high-skill positions 11 18 77 153 29
Adequately assessing and screening candidates
69 98 84 25 11
Drug screening of candidates 123 46 22 24 75
Determining competitive wage levels to attract workers
84 88 63 34 19
Identifying skills and knowledge required for jobs at my company
119 98 48 13 11
Retaining existing workers 73 99 77 27 10
Training existing workers 91 108 61 14 10
Replacing retiring workers 68 55 44 54 67
Understanding of locally available resources to help my company
92 97 54 24 23
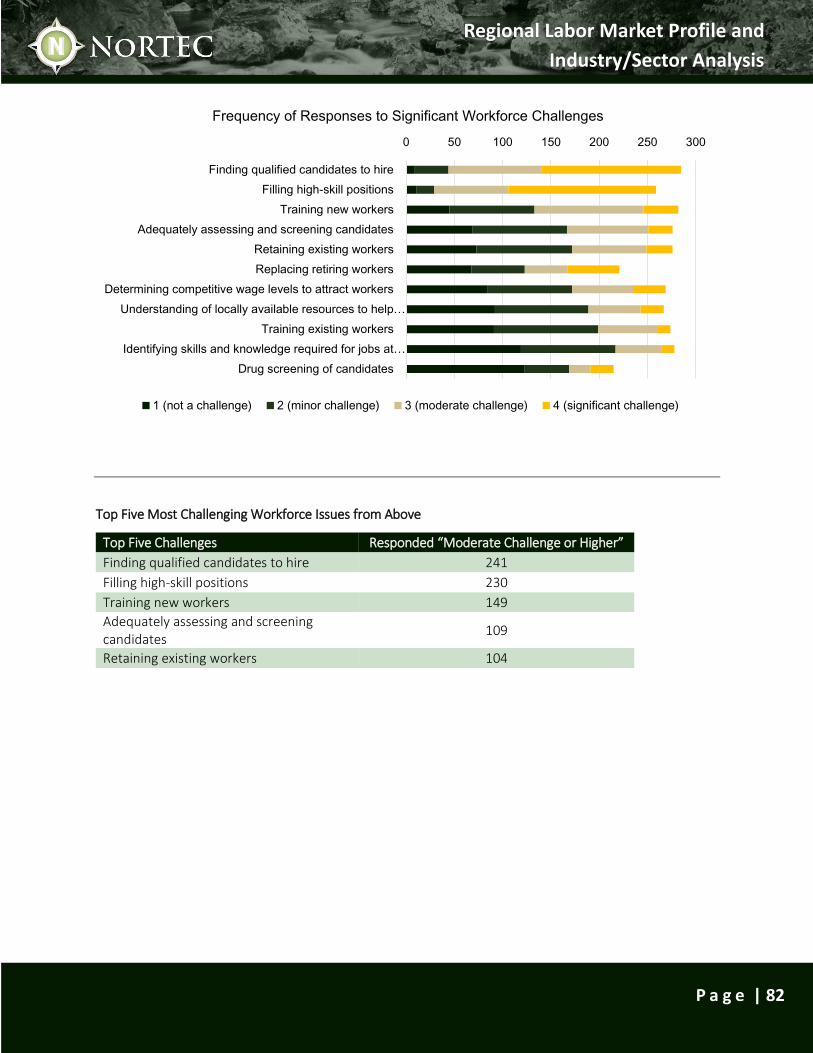
Regional Labor Market Profile and
Industry/Sector Analysis
P a g e | 82
Top Five Most Challenging Workforce Issues from Above
Top Five Challenges Responded “Moderate Challenge or Higher”
Finding qualified candidates to hire 241
Filling high-skill positions 230
Training new workers 149
Adequately assessing and screening candidates
109
Retaining existing workers 104
0 50 100 150 200 250 300
Finding qualified candidates to hire
Filling high-skill positions
Training new workers
Adequately assessing and screening candidates
Retaining existing workers
Replacing retiring workers
Determining competitive wage levels to attract workers
Understanding of locally available resources to help…
Training existing workers
Identifying skills and knowledge required for jobs at…
Drug screening of candidates
Frequency of Responses to Significant Workforce Challenges
1 (not a challenge) 2 (minor challenge) 3 (moderate challenge) 4 (significant challenge)
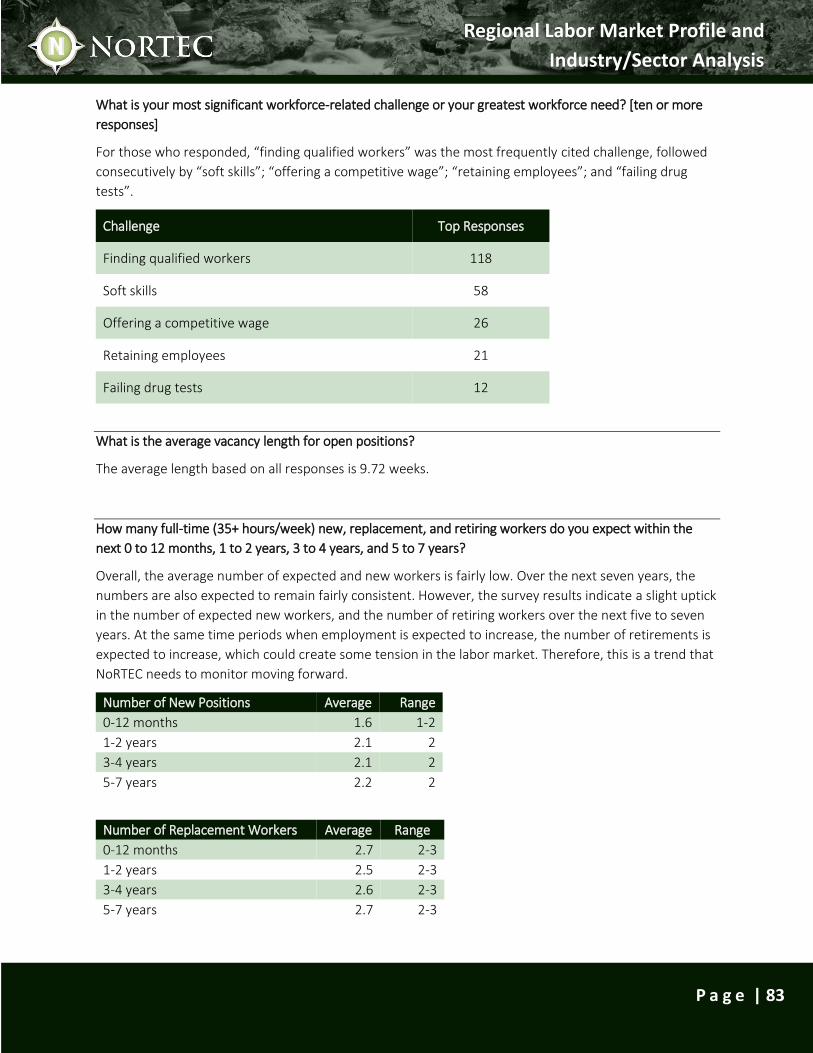
Regional Labor Market Profile and
Industry/Sector Analysis
P a g e | 83
What is your most significant workforce-related challenge or your greatest workforce need? [ten or more
responses]
For those who responded, “finding qualified workers” was the most frequently cited challenge, followed
consecutively by “soft skills”; “offering a competitive wage”; “retaining employees”; and “failing drug
tests”.
Challenge Top Responses
Finding qualified workers 118
Soft skills 58
Offering a competitive wage 26
Retaining employees 21
Failing drug tests 12
What is the average vacancy length for open positions?
The average length based on all responses is 9.72 weeks.
How many full-time (35+ hours/week) new, replacement, and retiring workers do you expect within the
next 0 to 12 months, 1 to 2 years, 3 to 4 years, and 5 to 7 years?
Overall, the average number of expected and new workers is fairly low. Over the next seven years, the
numbers are also expected to remain fairly consistent. However, the survey results indicate a slight uptick
in the number of expected new workers, and the number of retiring workers over the next five to seven
years. At the same time periods when employment is expected to increase, the number of retirements is
expected to increase, which could create some tension in the labor market. Therefore, this is a trend that
NoRTEC needs to monitor moving forward.
Number of New Positions Average Range
0-12 months 1.6 1-2
1-2 years 2.1 2
3-4 years 2.1 2
5-7 years 2.2 2
Number of Replacement Workers Average Range
0-12 months 2.7 2-3
1-2 years 2.5 2-3
3-4 years 2.6 2-3
5-7 years 2.7 2-3
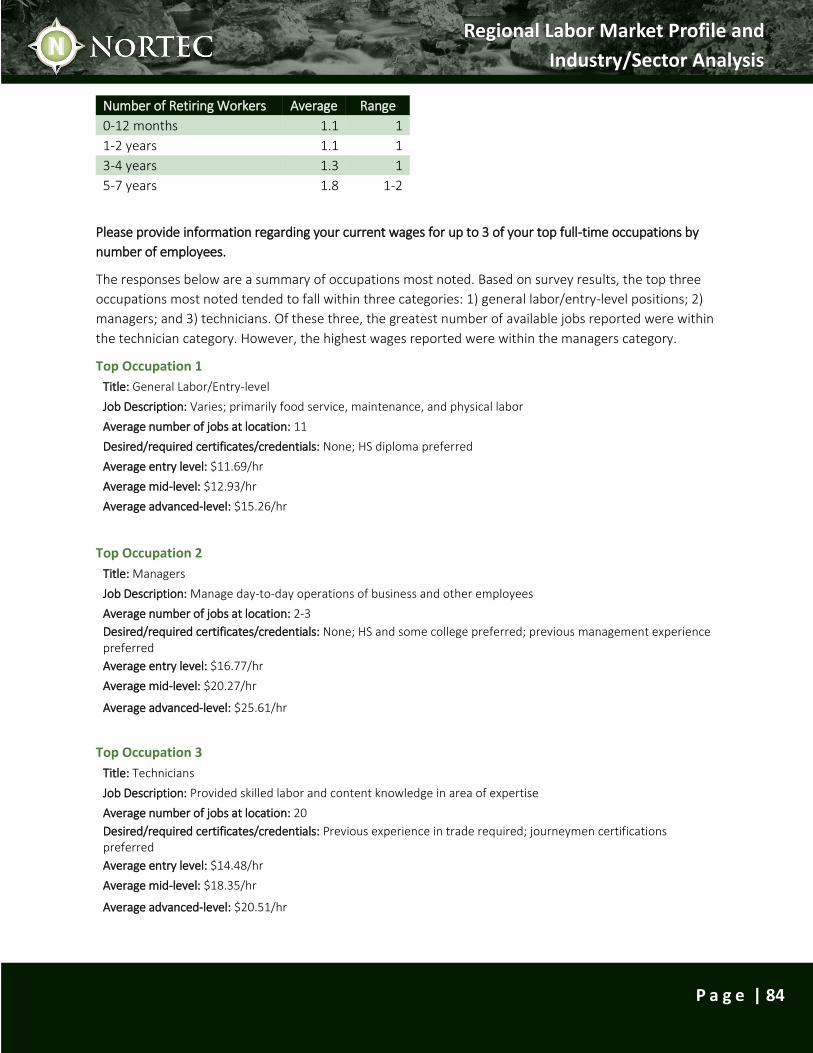
Regional Labor Market Profile and
Industry/Sector Analysis
P a g e | 84
Number of Retiring Workers Average Range
0-12 months 1.1 1
1-2 years 1.1 1
3-4 years 1.3 1
5-7 years 1.8 1-2
Please provide information regarding your current wages for up to 3 of your top full-time occupations by
number of employees.
The responses below are a summary of occupations most noted. Based on survey results, the top three
occupations most noted tended to fall within three categories: 1) general labor/entry-level positions; 2)
managers; and 3) technicians. Of these three, the greatest number of available jobs reported were within
the technician category. However, the highest wages reported were within the managers category.
Top Occupation 1
Title: General Labor/Entry-level
Job Description: Varies; primarily food service, maintenance, and physical labor
Average number of jobs at location: 11
Desired/required certificates/credentials: None; HS diploma preferred
Average entry level: $11.69/hr
Average mid-level: $12.93/hr
Average advanced-level: $15.26/hr
Top Occupation 2
Title: Managers Job Description: Manage day-to-day operations of business and other employees
Average number of jobs at location: 2-3
Desired/required certificates/credentials: None; HS and some college preferred; previous management experience preferred
Average entry level: $16.77/hr
Average mid-level: $20.27/hr
Average advanced-level: $25.61/hr
Top Occupation 3
Title: Technicians
Job Description: Provided skilled labor and content knowledge in area of expertise
Average number of jobs at location: 20
Desired/required certificates/credentials: Previous experience in trade required; journeymen certifications preferred
Average entry level: $14.48/hr
Average mid-level: $18.35/hr
Average advanced-level: $20.51/hr
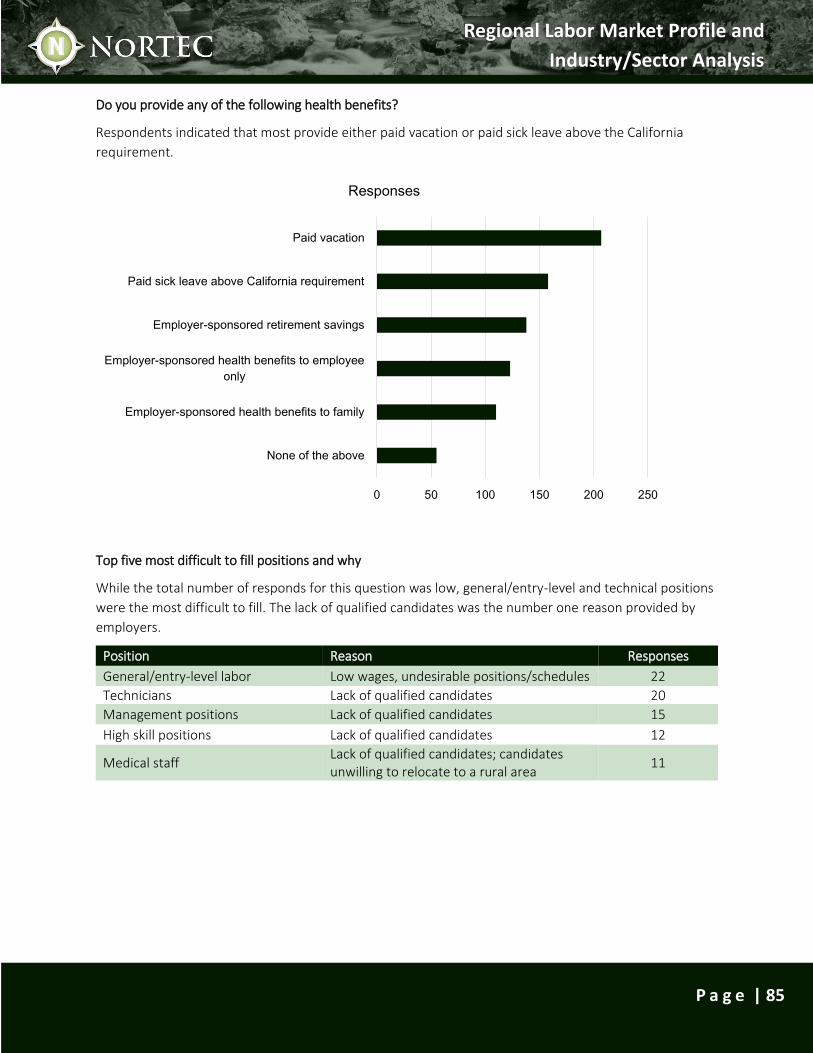
Regional Labor Market Profile and
Industry/Sector Analysis
P a g e | 85
Do you provide any of the following health benefits?
Respondents indicated that most provide either paid vacation or paid sick leave above the California
requirement.
Top five most difficult to fill positions and why
While the total number of responds for this question was low, general/entry-level and technical positions
were the most difficult to fill. The lack of qualified candidates was the number one reason provided by
employers.
Position Reason Responses
General/entry-level labor Low wages, undesirable positions/schedules 22
Technicians Lack of qualified candidates 20
Management positions Lack of qualified candidates 15
High skill positions Lack of qualified candidates 12
Medical staff Lack of qualified candidates; candidates unwilling to relocate to a rural area
11
0 50 100 150 200 250
None of the above
Employer-sponsored health benefits to family
Employer-sponsored health benefits to employee
only
Employer-sponsored retirement savings
Paid sick leave above California requirement
Paid vacation
Responses
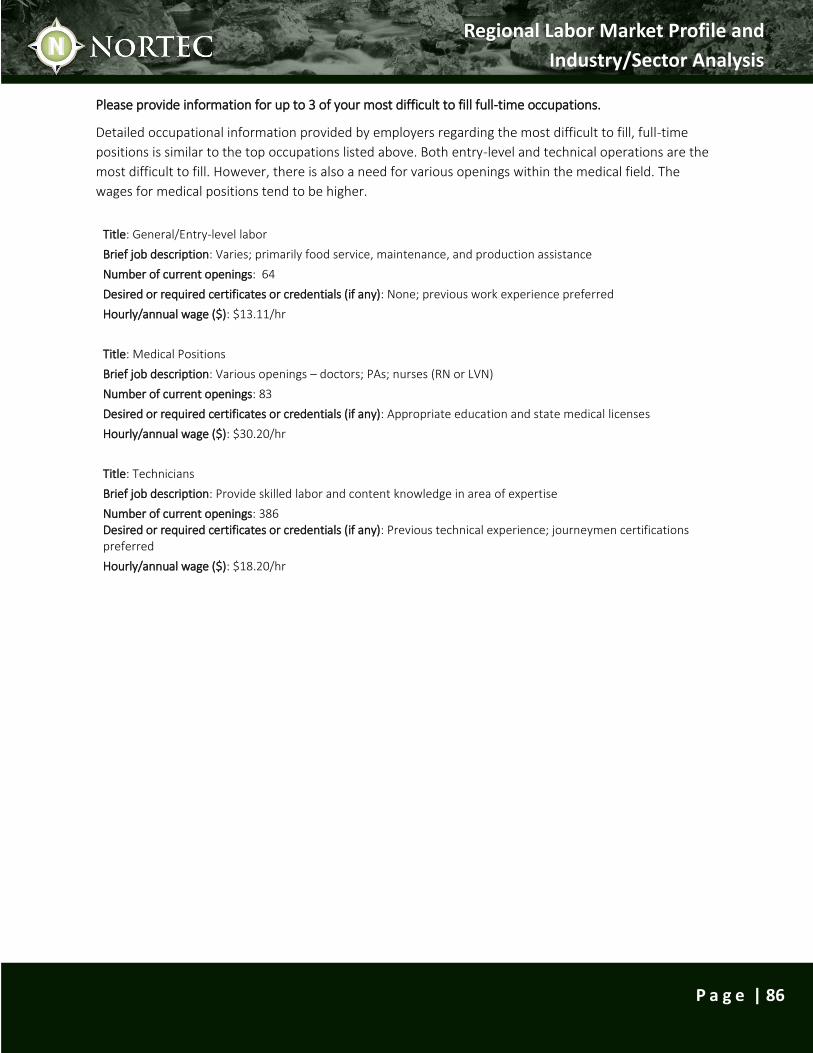
Regional Labor Market Profile and
Industry/Sector Analysis
P a g e | 86
Please provide information for up to 3 of your most difficult to fill full-time occupations.
Detailed occupational information provided by employers regarding the most difficult to fill, full-time
positions is similar to the top occupations listed above. Both entry-level and technical operations are the
most difficult to fill. However, there is also a need for various openings within the medical field. The
wages for medical positions tend to be higher.
Title: General/Entry-level labor
Brief job description: Varies; primarily food service, maintenance, and production assistance
Number of current openings: 64
Desired or required certificates or credentials (if any): None; previous work experience preferred
Hourly/annual wage ($): $13.11/hr
Title: Medical Positions
Brief job description: Various openings – doctors; PAs; nurses (RN or LVN)
Number of current openings: 83
Desired or required certificates or credentials (if any): Appropriate education and state medical licenses
Hourly/annual wage ($): $30.20/hr
Title: Technicians
Brief job description: Provide skilled labor and content knowledge in area of expertise
Number of current openings: 386 Desired or required certificates or credentials (if any): Previous technical experience; journeymen certifications preferred
Hourly/annual wage ($): $18.20/hr
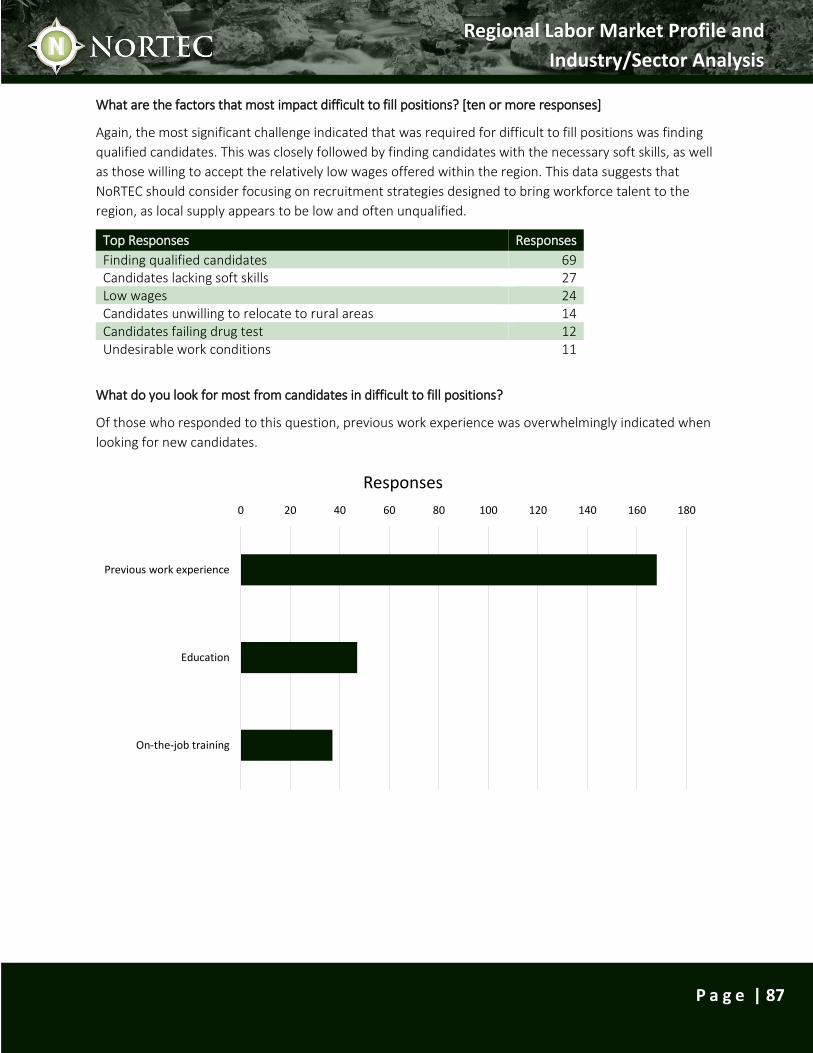
Regional Labor Market Profile and
Industry/Sector Analysis
P a g e | 87
What are the factors that most impact difficult to fill positions? [ten or more responses]
Again, the most significant challenge indicated that was required for difficult to fill positions was finding
qualified candidates. This was closely followed by finding candidates with the necessary soft skills, as well
as those willing to accept the relatively low wages offered within the region. This data suggests that
NoRTEC should consider focusing on recruitment strategies designed to bring workforce talent to the
region, as local supply appears to be low and often unqualified.
Top Responses Responses
Finding qualified candidates 69 Candidates lacking soft skills 27 Low wages 24 Candidates unwilling to relocate to rural areas 14 Candidates failing drug test 12 Undesirable work conditions 11
What do you look for most from candidates in difficult to fill positions?
Of those who responded to this question, previous work experience was overwhelmingly indicated when
looking for new candidates.
0 20 40 60 80 100 120 140 160 180
Previous work experience
Education
On-the-job training
Responses
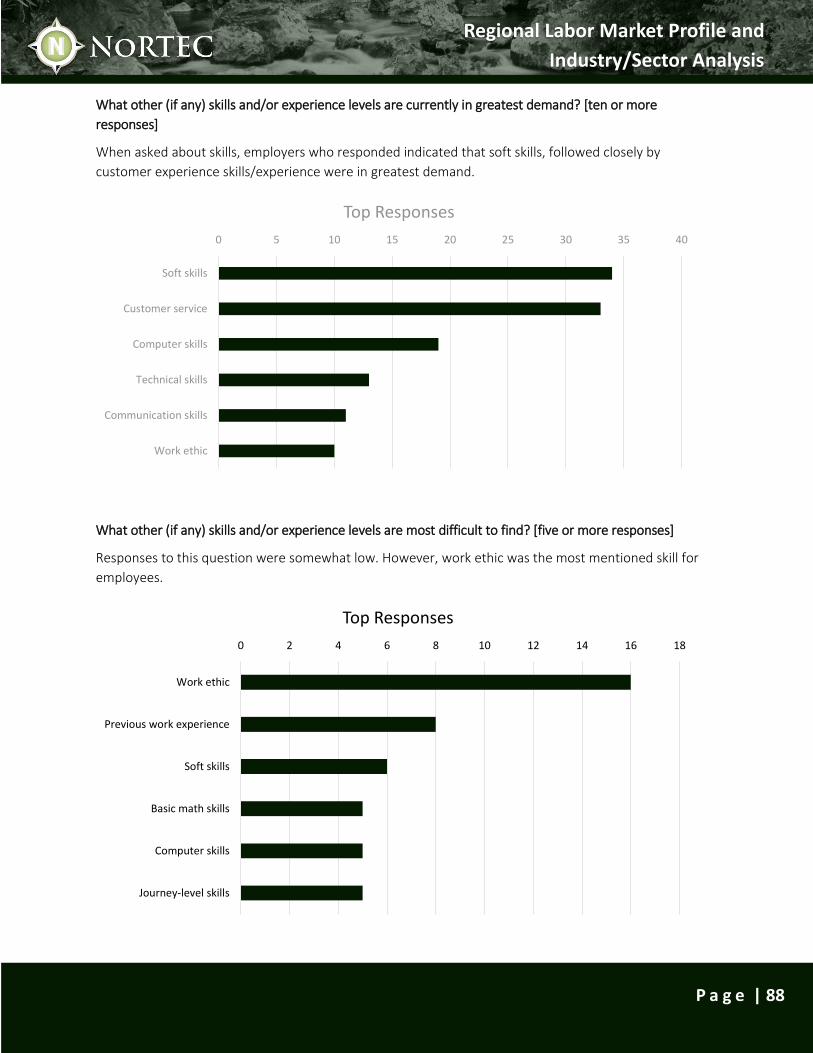
Regional Labor Market Profile and
Industry/Sector Analysis
P a g e | 88
What other (if any) skills and/or experience levels are currently in greatest demand? [ten or more
responses]
When asked about skills, employers who responded indicated that soft skills, followed closely by
customer experience skills/experience were in greatest demand.
What other (if any) skills and/or experience levels are most difficult to find? [five or more responses]
Responses to this question were somewhat low. However, work ethic was the most mentioned skill for
employees.
0 5 10 15 20 25 30 35 40
Soft skills
Customer service
Computer skills
Technical skills
Communication skills
Work ethic
Top Responses
0 2 4 6 8 10 12 14 16 18
Work ethic
Previous work experience
Soft skills
Basic math skills
Computer skills
Journey-level skills
Top Responses
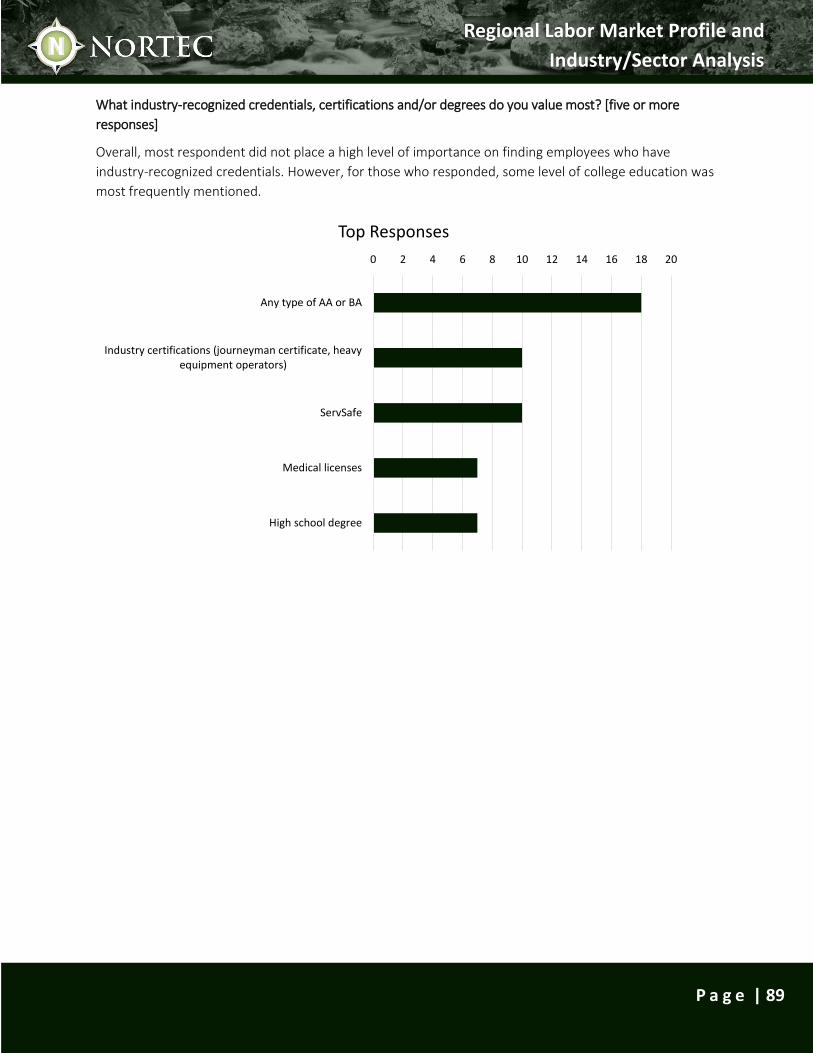
Regional Labor Market Profile and
Industry/Sector Analysis
P a g e | 89
What industry-recognized credentials, certifications and/or degrees do you value most? [five or more
responses]
Overall, most respondent did not place a high level of importance on finding employees who have
industry-recognized credentials. However, for those who responded, some level of college education was
most frequently mentioned.
0 2 4 6 8 10 12 14 16 18 20
Any type of AA or BA
Industry certifications (journeyman certificate, heavyequipment operators)
ServSafe
Medical licenses
High school degree
Top Responses
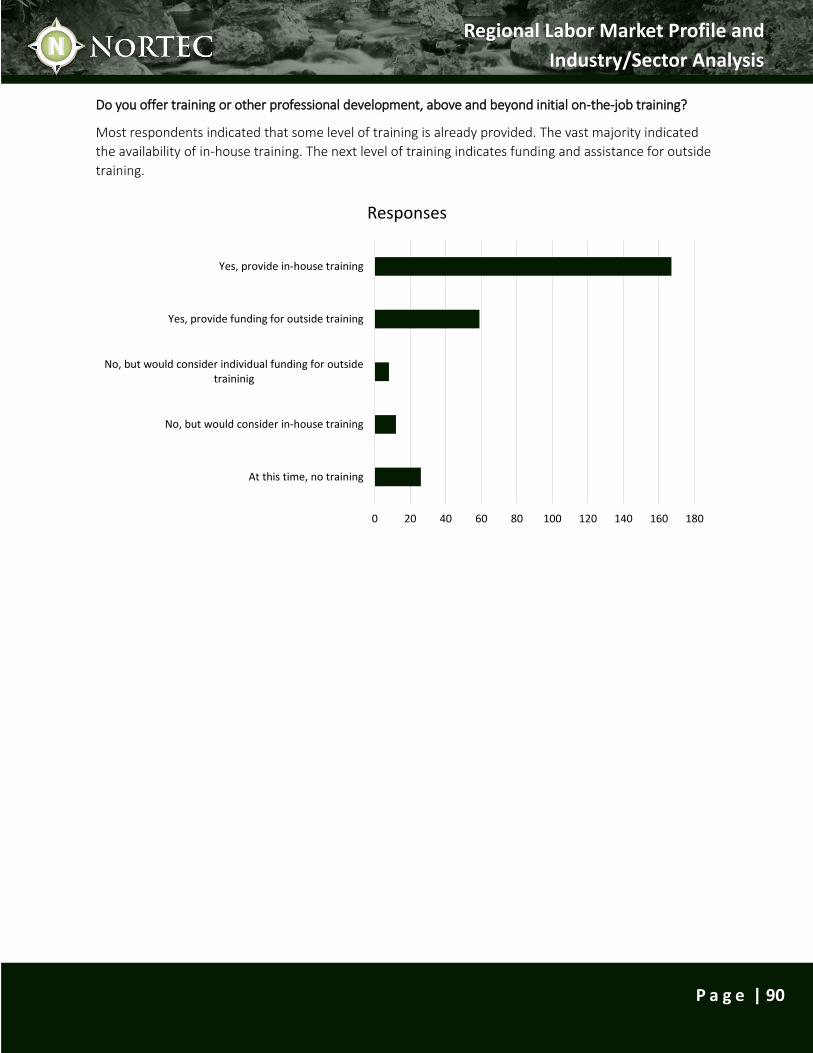
Regional Labor Market Profile and
Industry/Sector Analysis
P a g e | 90
Do you offer training or other professional development, above and beyond initial on-the-job training?
Most respondents indicated that some level of training is already provided. The vast majority indicated
the availability of in-house training. The next level of training indicates funding and assistance for outside
training.
0 20 40 60 80 100 120 140 160 180
At this time, no training
No, but would consider in-house training
No, but would consider individual funding for outsidetraininig
Yes, provide funding for outside training
Yes, provide in-house training
Responses
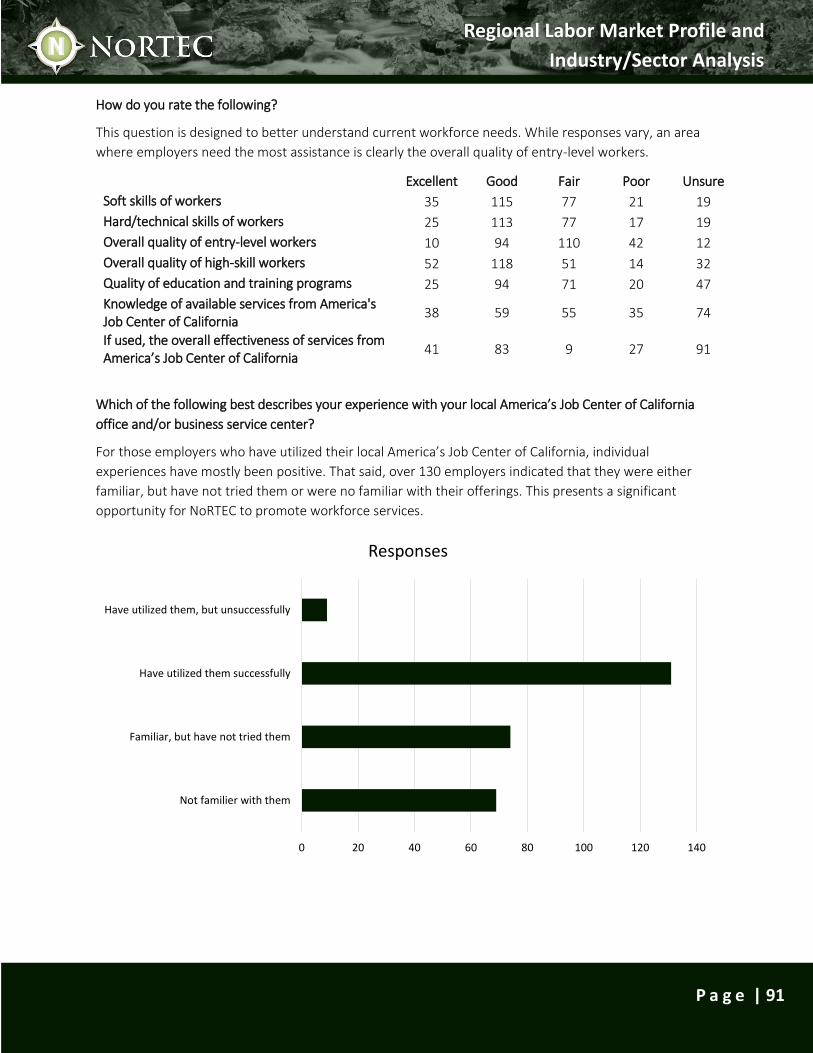
Regional Labor Market Profile and
Industry/Sector Analysis
P a g e | 91
How do you rate the following?
This question is designed to better understand current workforce needs. While responses vary, an area
where employers need the most assistance is clearly the overall quality of entry-level workers.
Excellent Good Fair Poor Unsure
Soft skills of workers 35 115 77 21 19
Hard/technical skills of workers 25 113 77 17 19
Overall quality of entry-level workers 10 94 110 42 12
Overall quality of high-skill workers 52 118 51 14 32
Quality of education and training programs 25 94 71 20 47
Knowledge of available services from America's Job Center of California
38 59 55 35 74
If used, the overall effectiveness of services from America’s Job Center of California
41 83 9 27 91
Which of the following best describes your experience with your local America’s Job Center of California
office and/or business service center?
For those employers who have utilized their local America’s Job Center of California, individual
experiences have mostly been positive. That said, over 130 employers indicated that they were either
familiar, but have not tried them or were no familiar with their offerings. This presents a significant
opportunity for NoRTEC to promote workforce services.
0 20 40 60 80 100 120 140
Not familier with them
Familiar, but have not tried them
Have utilized them successfully
Have utilized them, but unsuccessfully
Responses
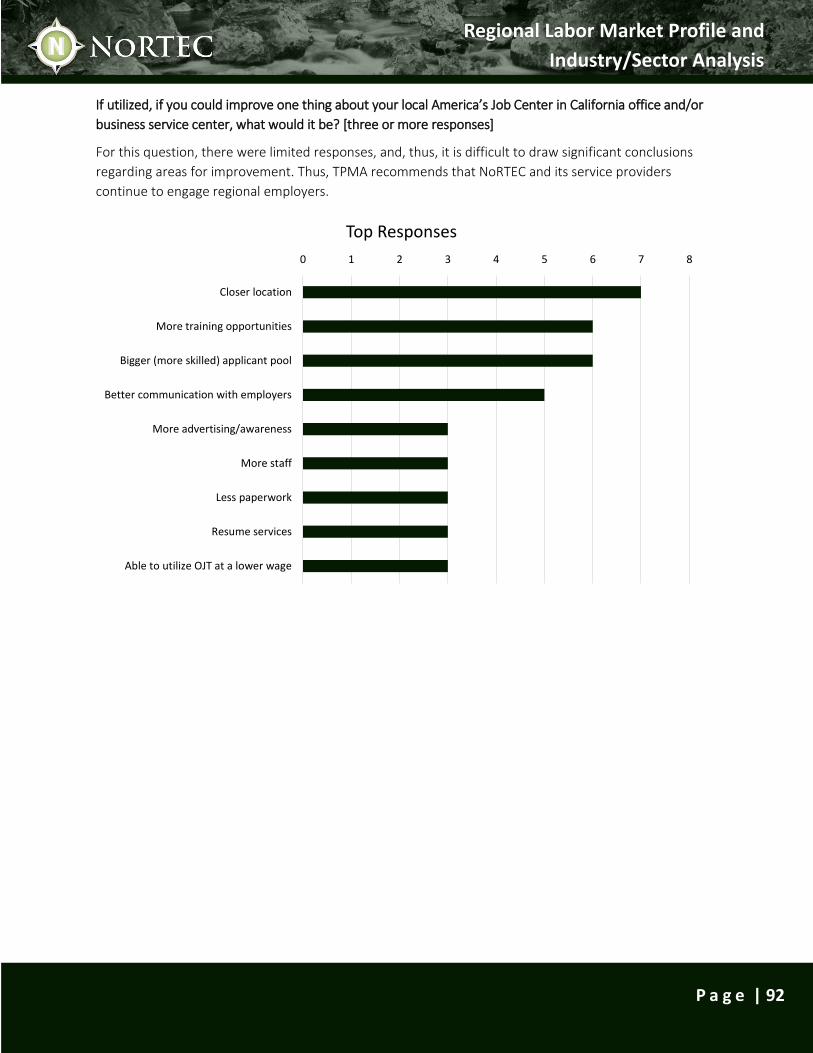
Regional Labor Market Profile and
Industry/Sector Analysis
P a g e | 92
If utilized, if you could improve one thing about your local America’s Job Center in California office and/or
business service center, what would it be? [three or more responses]
For this question, there were limited responses, and, thus, it is difficult to draw significant conclusions
regarding areas for improvement. Thus, TPMA recommends that NoRTEC and its service providers
continue to engage regional employers.
0 1 2 3 4 5 6 7 8
Closer location
More training opportunities
Bigger (more skilled) applicant pool
Better communication with employers
More advertising/awareness
More staff
Less paperwork
Resume services
Able to utilize OJT at a lower wage
Top Responses
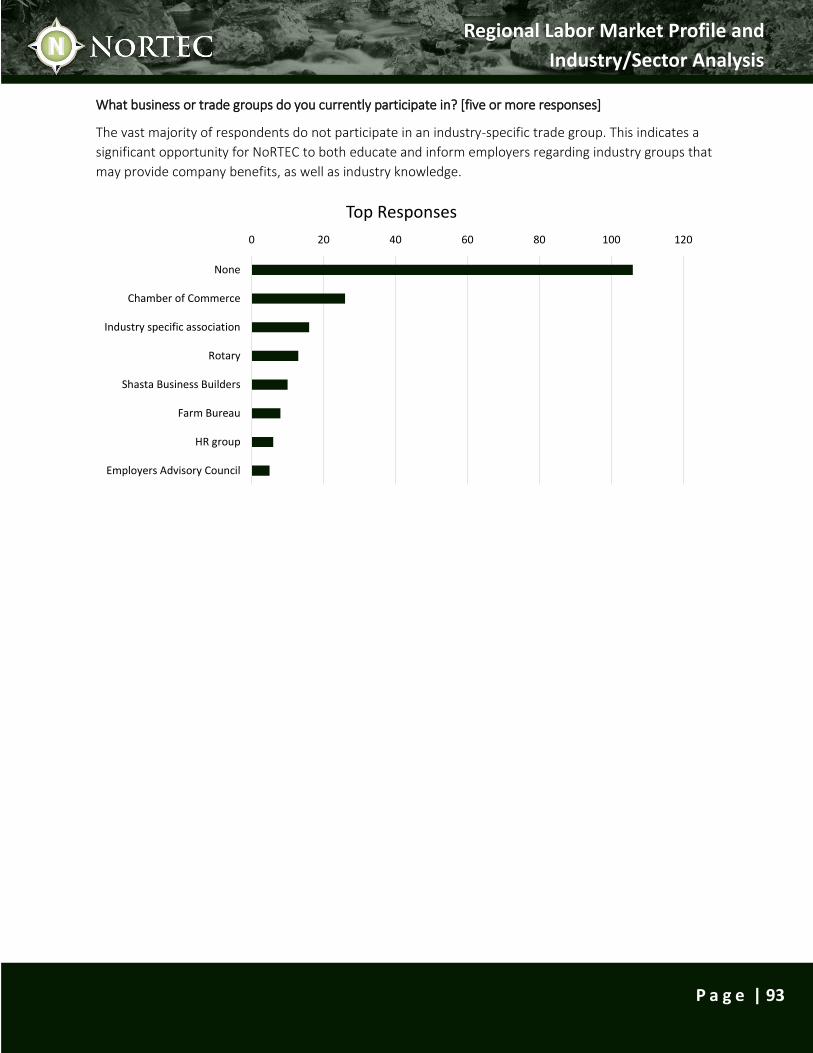
Regional Labor Market Profile and
Industry/Sector Analysis
P a g e | 93
What business or trade groups do you currently participate in? [five or more responses]
The vast majority of respondents do not participate in an industry-specific trade group. This indicates a
significant opportunity for NoRTEC to both educate and inform employers regarding industry groups that
may provide company benefits, as well as industry knowledge.
0 20 40 60 80 100 120
None
Chamber of Commerce
Industry specific association
Rotary
Shasta Business Builders
Farm Bureau
HR group
Employers Advisory Council
Top Responses
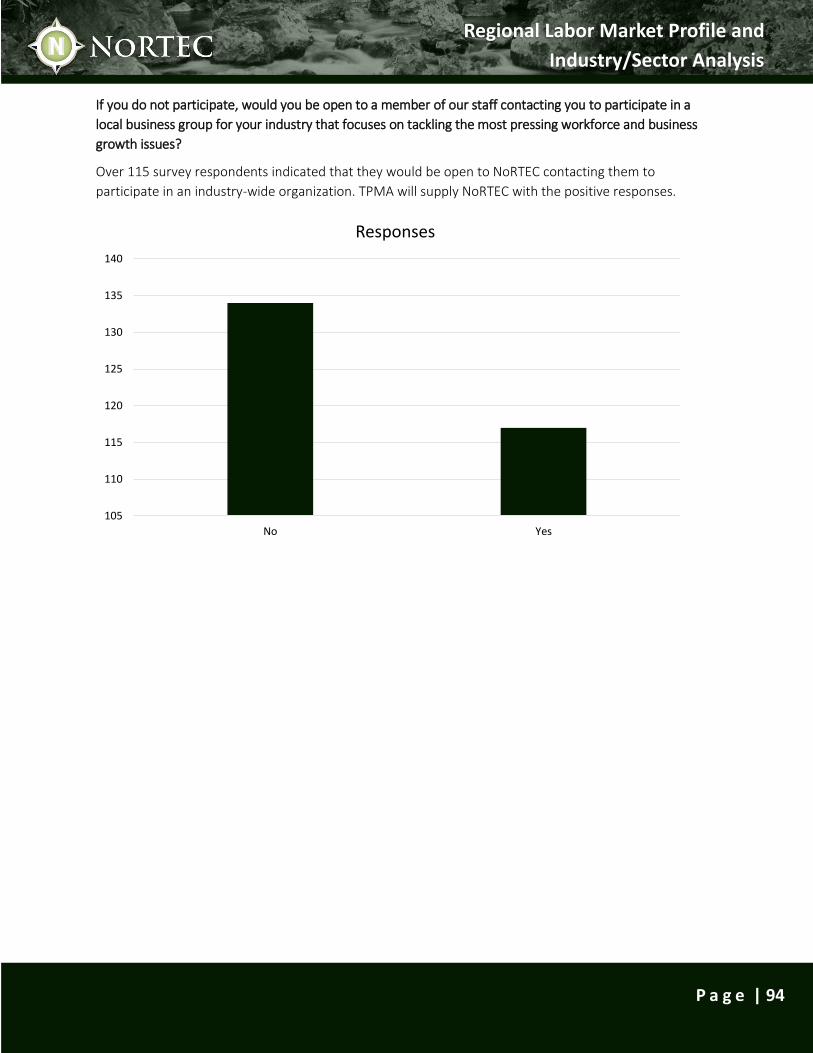
Regional Labor Market Profile and
Industry/Sector Analysis
P a g e | 94
If you do not participate, would you be open to a member of our staff contacting you to participate in a
local business group for your industry that focuses on tackling the most pressing workforce and business
growth issues?
Over 115 survey respondents indicated that they would be open to NoRTEC contacting them to
participate in an industry-wide organization. TPMA will supply NoRTEC with the positive responses.
105
110
115
120
125
130
135
140
No Yes
Responses

Regional Labor Market Profile and
Industry/Sector Analysis
P a g e | 95
Appendix D: Job Boards – North State Grow Manufacturing
Roundtable & Expo
October, 2014
Each company participating at the Expo displayed a board with the positions they typically hire, the level
of education required for each position, and which positions are hard to fill (highlighted in yellow). The
following is a list of the positions presented at the Expo.
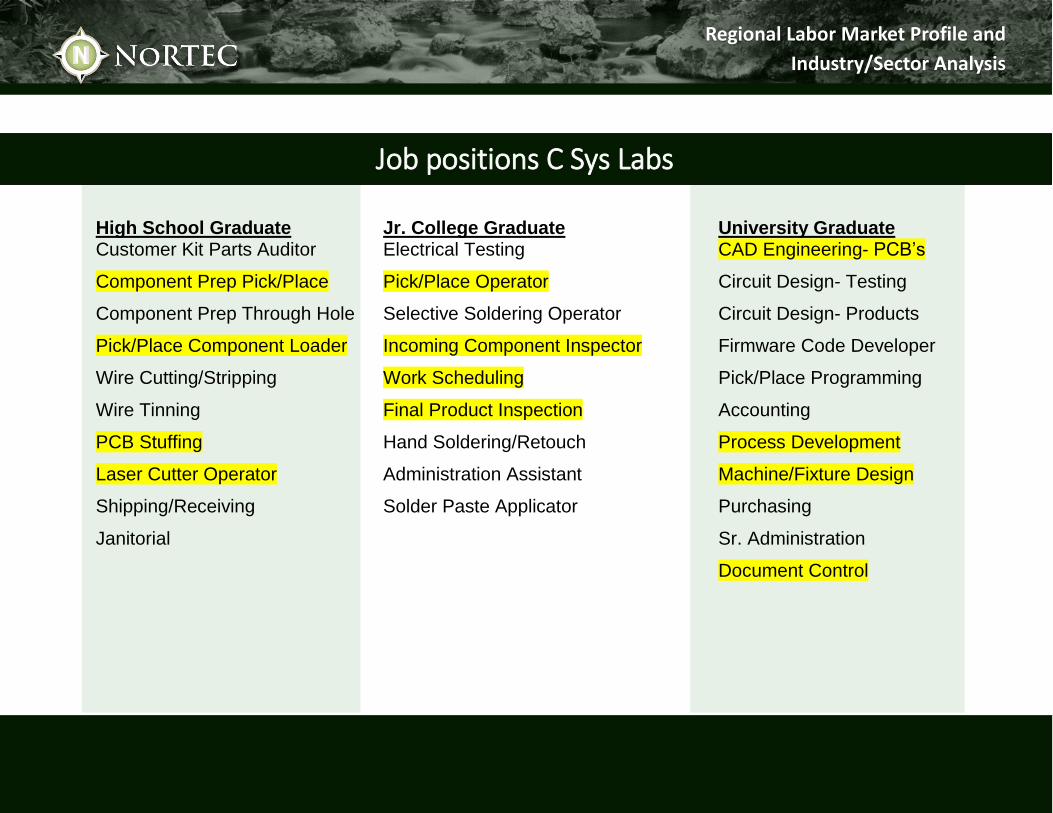
Regional Labor Market Profile and
Industry/Sector Analysis
High School Graduate Jr. College Graduate University Graduate Customer Kit Parts Auditor Electrical Testing CAD Engineering- PCB’s
Component Prep Pick/Place Pick/Place Operator Circuit Design- Testing
Component Prep Through Hole Selective Soldering Operator Circuit Design- Products
Pick/Place Component Loader Incoming Component Inspector Firmware Code Developer
Wire Cutting/Stripping Work Scheduling Pick/Place Programming
Wire Tinning Final Product Inspection Accounting
PCB Stuffing Hand Soldering/Retouch Process Development
Laser Cutter Operator Administration Assistant Machine/Fixture Design
Shipping/Receiving Solder Paste Applicator Purchasing
Janitorial Sr. Administration
Document Control
Job positions C Sys Labs
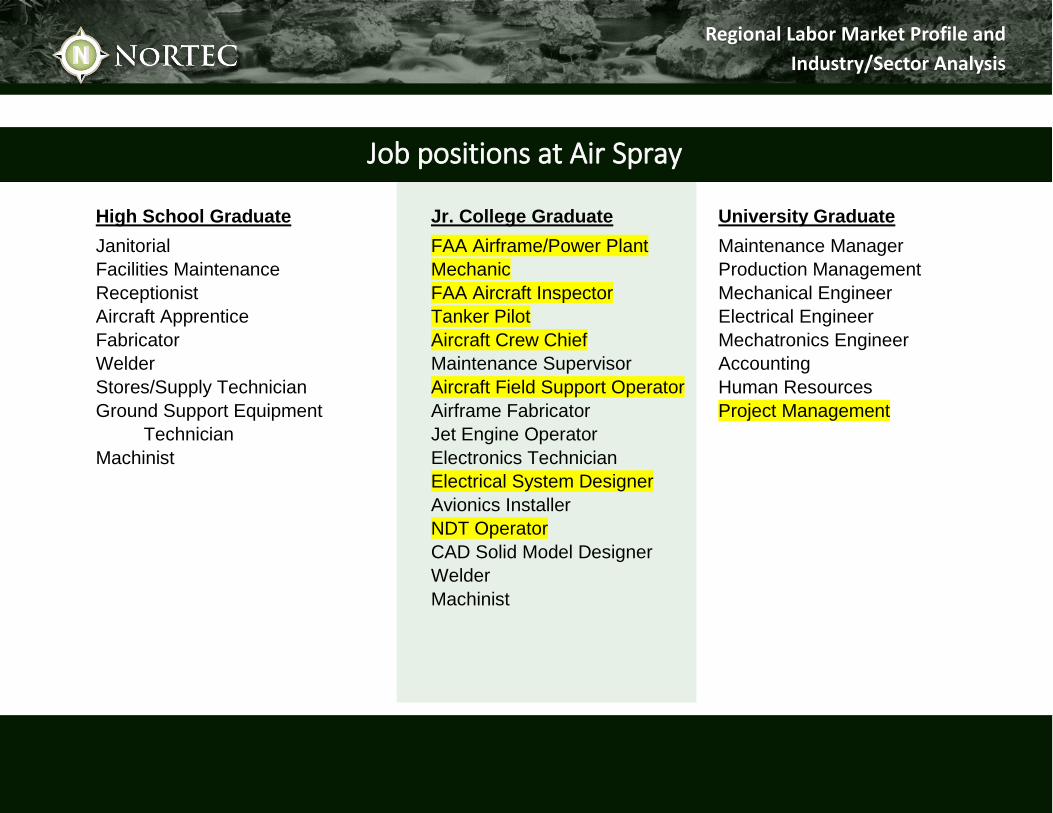
Regional Labor Market Profile and
Industry/Sector Analysis
High School Graduate Jr. College Graduate University Graduate
Janitorial FAA Airframe/Power Plant Maintenance Manager
Facilities Maintenance Mechanic Production Management
Receptionist FAA Aircraft Inspector Mechanical Engineer
Aircraft Apprentice Tanker Pilot Electrical Engineer
Fabricator Aircraft Crew Chief Mechatronics Engineer
Welder Maintenance Supervisor Accounting
Stores/Supply Technician Aircraft Field Support Operator Human Resources
Ground Support Equipment Airframe Fabricator Project Management
Technician Jet Engine Operator
Machinist Electronics Technician
Electrical System Designer
Avionics Installer
NDT Operator
CAD Solid Model Designer
Welder
Machinist
Job positions at Air Spray

Regional Labor Market Profile and
Industry/Sector Analysis
High School Graduate Jr. College Graduate University Graduate
Press Brake Operator Laser Operator Laser Programmer
Warehouse Hand Certified Welder Plasma Programmer
General Floorhand Plasma Operator Project Management
Press Brake Programmer Project Coordinator
Inside Sales
Project Quoting
Job positions at All Metals Supply
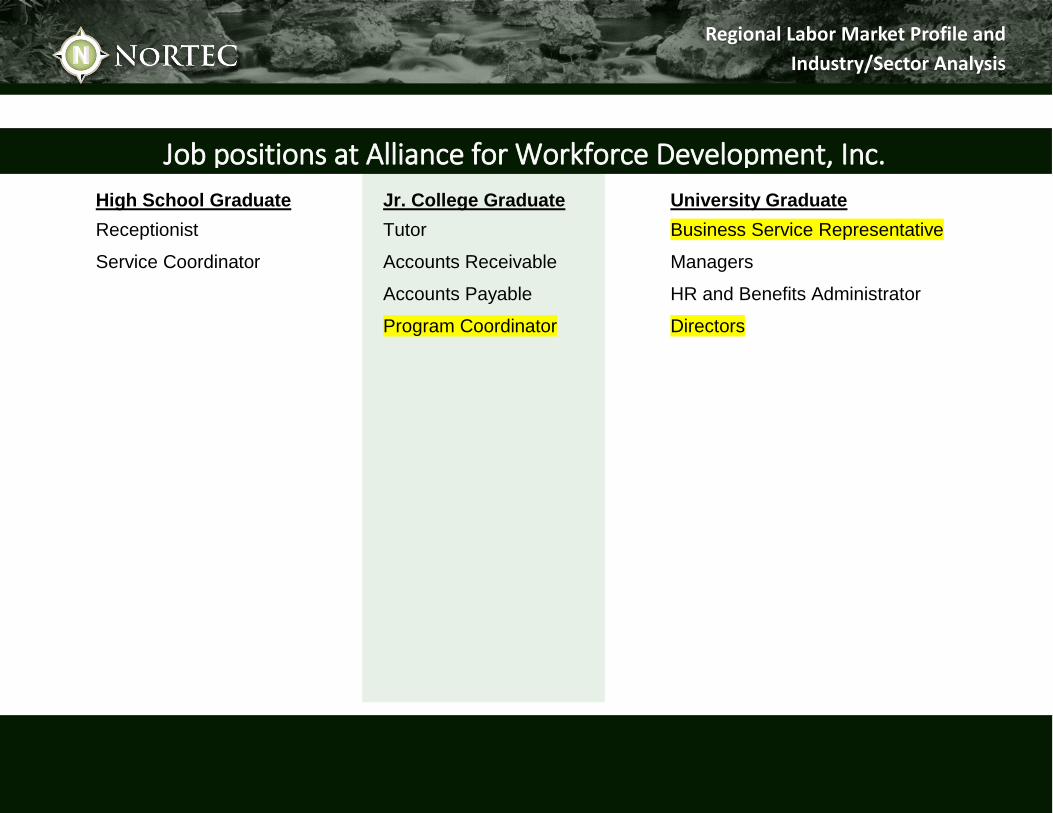
Regional Labor Market Profile and
Industry/Sector Analysis
High School Graduate Jr. College Graduate University Graduate
Receptionist Tutor Business Service Representative
Service Coordinator Accounts Receivable Managers
Accounts Payable HR and Benefits Administrator
Program Coordinator Directors
Job positions at Alliance for Workforce Development, Inc.

Regional Labor Market Profile and
Industry/Sector Analysis
High School Graduate Jr. College Graduate University Graduate
Receptionist Quality Control Mechanical Engineer
Shipping/Receiving Supervisor Marketing
Inventory Engineering Technician Accounts Manager
Parts Puller Solid Model CAD Technician Purchasing
Janitorial CNC Mill Operator Project Management
Small Parts Assembly Sales/Customer Support Production Management
Maintenance Administration Assistant Business Development
Graphic Design
Job positions at Dynaplug
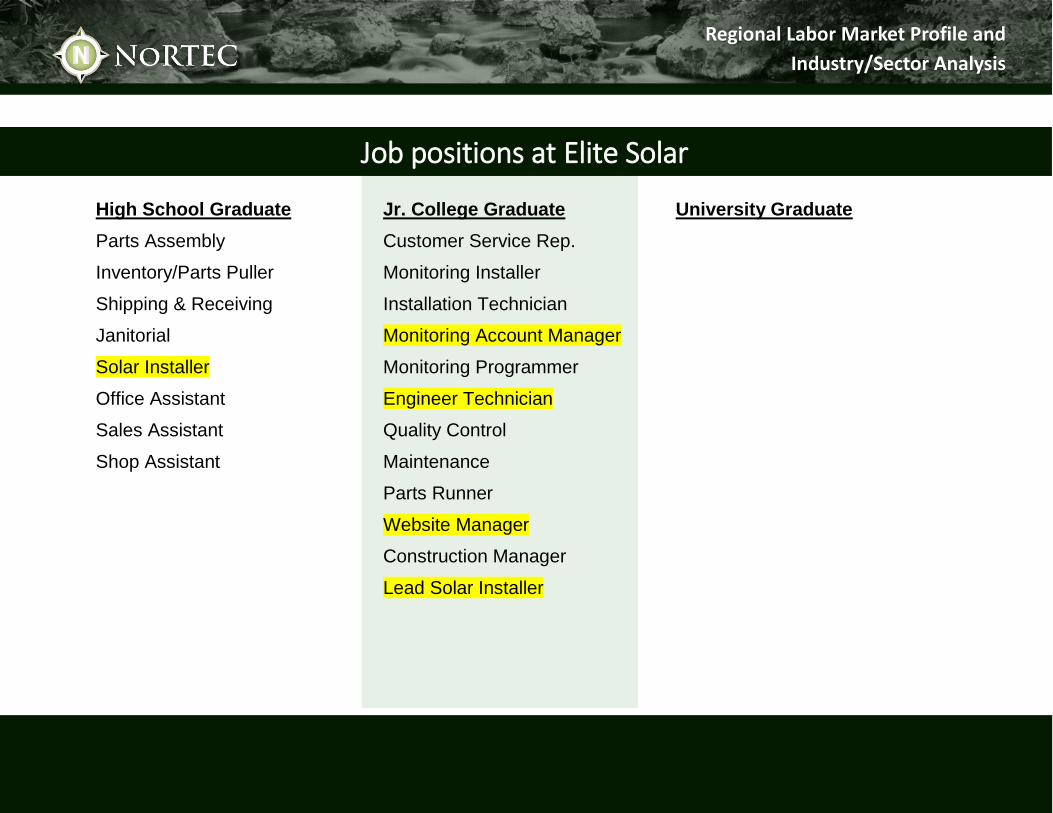
Regional Labor Market Profile and
Industry/Sector Analysis
High School Graduate Jr. College Graduate University Graduate
Parts Assembly Customer Service Rep.
Inventory/Parts Puller Monitoring Installer
Shipping & Receiving Installation Technician
Janitorial Monitoring Account Manager
Solar Installer Monitoring Programmer
Office Assistant Engineer Technician
Sales Assistant Quality Control
Shop Assistant Maintenance
Parts Runner
Website Manager
Construction Manager
Lead Solar Installer
Job positions at Elite Solar
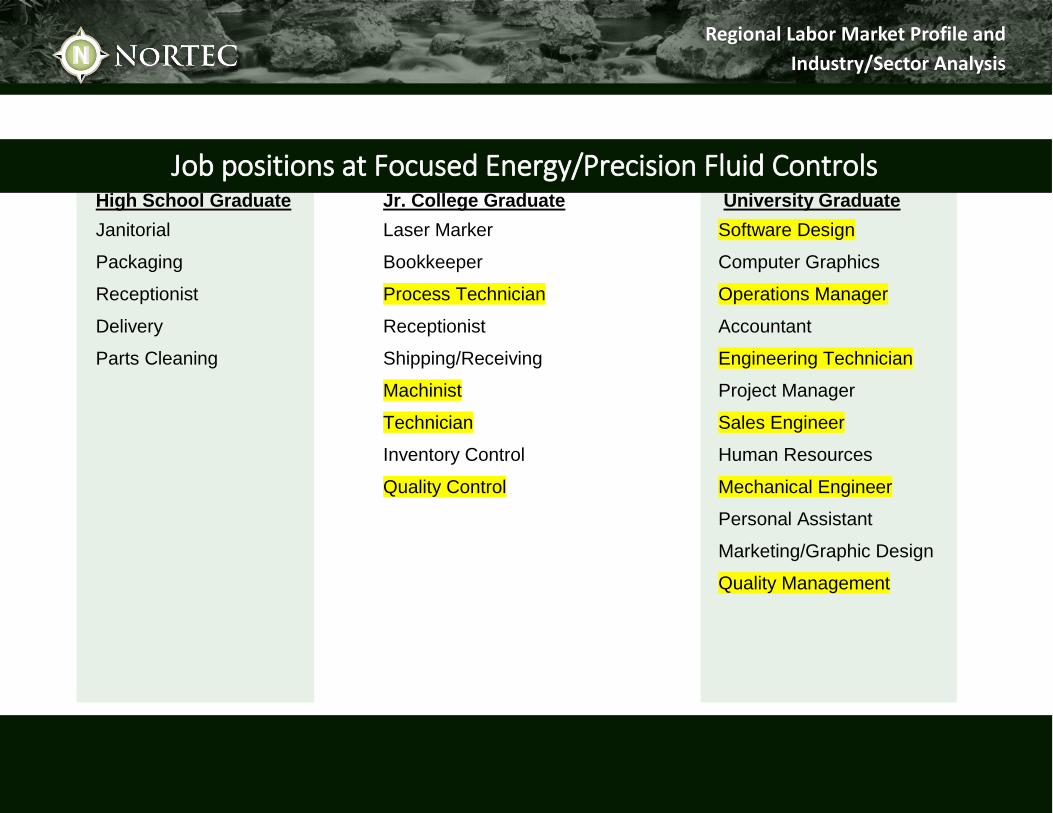
Regional Labor Market Profile and
Industry/Sector Analysis
High School Graduate Jr. College Graduate University Graduate
Janitorial Laser Marker Software Design
Packaging Bookkeeper Computer Graphics
Receptionist Process Technician Operations Manager
Delivery Receptionist Accountant
Parts Cleaning Shipping/Receiving Engineering Technician
Machinist Project Manager
Technician Sales Engineer
Inventory Control Human Resources
Quality Control Mechanical Engineer
Personal Assistant
Marketing/Graphic Design
Quality Management
Job positions at Focused Energy/Precision Fluid Controls
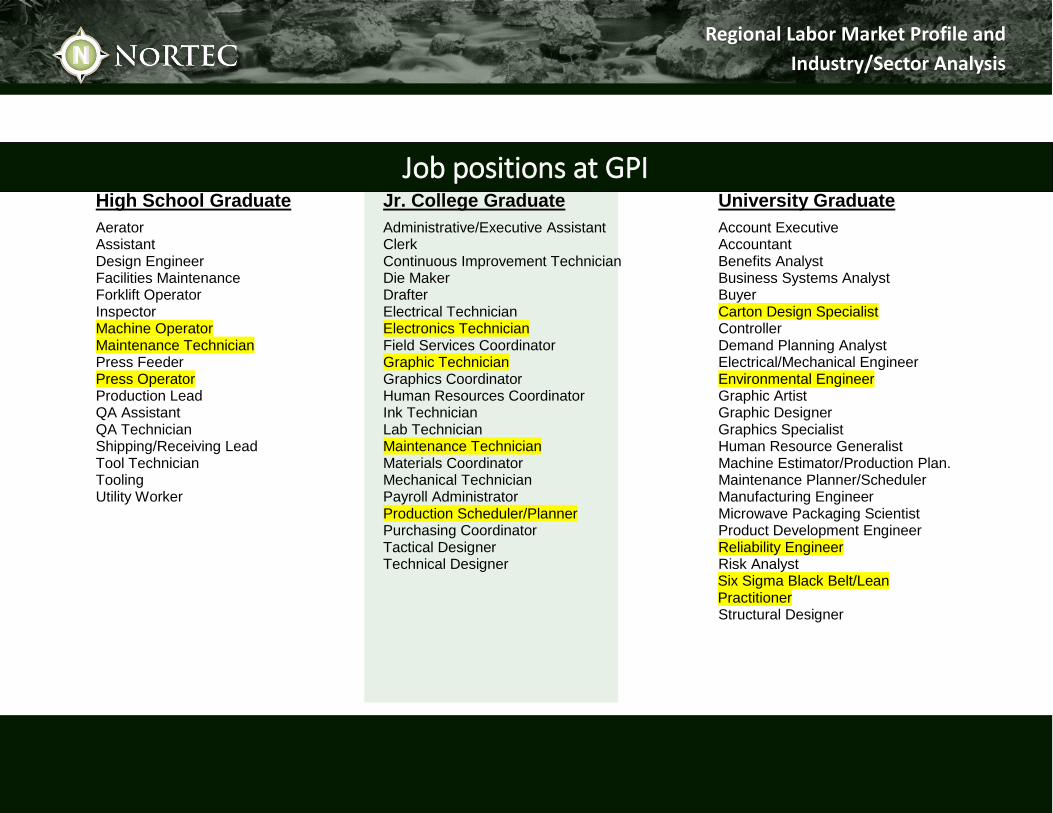
Regional Labor Market Profile and
Industry/Sector Analysis
High School Graduate Jr. College Graduate University Graduate
Aerator Administrative/Executive Assistant Account Executive Assistant Clerk Accountant Design Engineer Continuous Improvement Technician Benefits Analyst Facilities Maintenance Die Maker Business Systems Analyst Forklift Operator Drafter Buyer Inspector Electrical Technician Carton Design Specialist Machine Operator Electronics Technician Controller Maintenance Technician Field Services Coordinator Demand Planning Analyst Press Feeder Graphic Technician Electrical/Mechanical Engineer Press Operator Graphics Coordinator Environmental Engineer Production Lead Human Resources Coordinator Graphic Artist QA Assistant Ink Technician Graphic Designer QA Technician Lab Technician Graphics Specialist Shipping/Receiving Lead Maintenance Technician Human Resource Generalist Tool Technician Materials Coordinator Machine Estimator/Production Plan. Tooling Mechanical Technician Maintenance Planner/Scheduler Utility Worker Payroll Administrator Manufacturing Engineer
Production Scheduler/Planner Microwave Packaging Scientist Purchasing Coordinator Product Development Engineer Tactical Designer Reliability Engineer Technical Designer Risk Analyst
Six Sigma Black Belt/Lean Practitioner
Structural Designer
Job positions at GPI
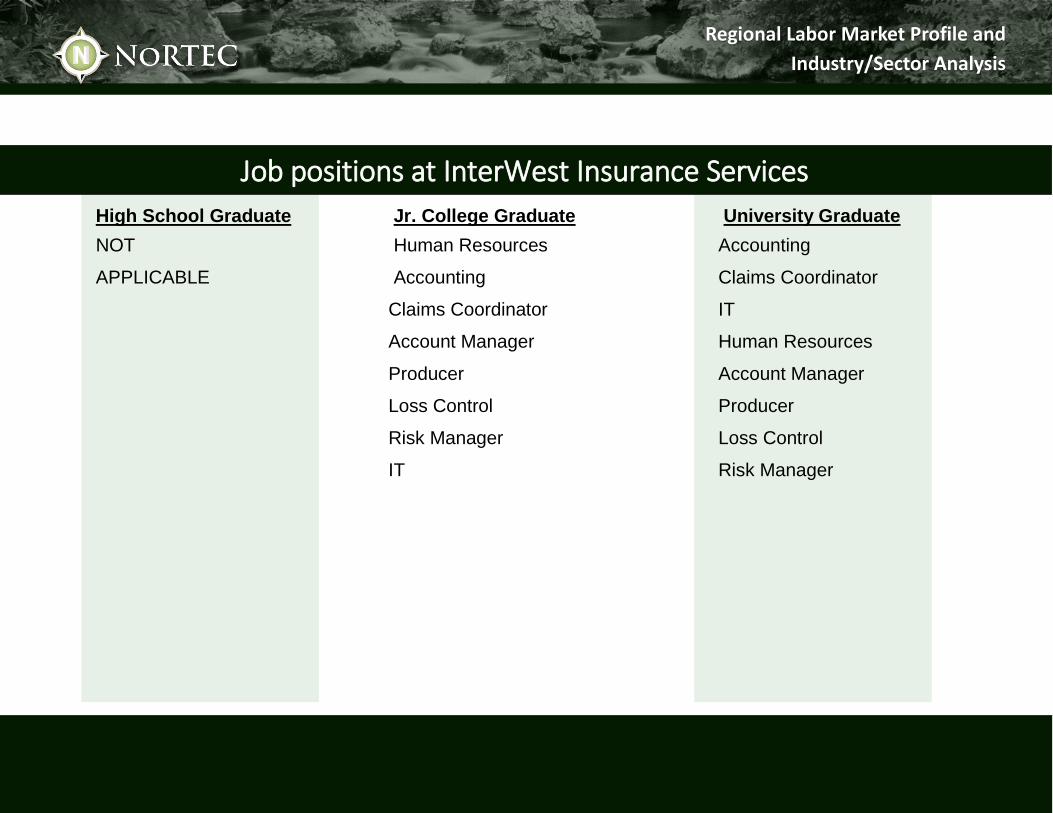
Regional Labor Market Profile and
Industry/Sector Analysis
High School Graduate Jr. College Graduate University Graduate
NOT Human Resources Accounting
APPLICABLE Accounting Claims Coordinator
Claims Coordinator IT
Account Manager Human Resources
Producer Account Manager
Loss Control Producer
Risk Manager Loss Control
IT Risk Manager
Job positions at InterWest Insurance Services
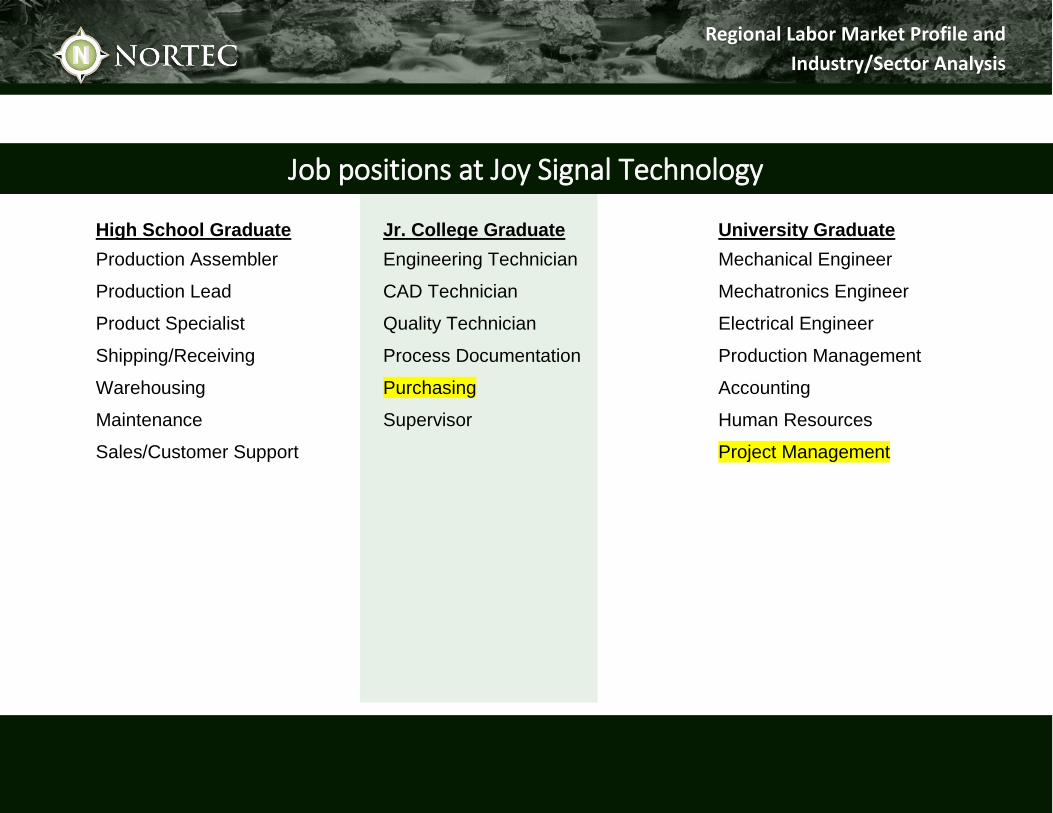
Regional Labor Market Profile and
Industry/Sector Analysis
High School Graduate Jr. College Graduate University Graduate
Production Assembler Engineering Technician Mechanical Engineer
Production Lead CAD Technician Mechatronics Engineer
Product Specialist Quality Technician Electrical Engineer
Shipping/Receiving Process Documentation Production Management
Warehousing Purchasing Accounting
Maintenance Supervisor Human Resources
Sales/Customer Support Project Management
Job positions at Joy Signal Technology
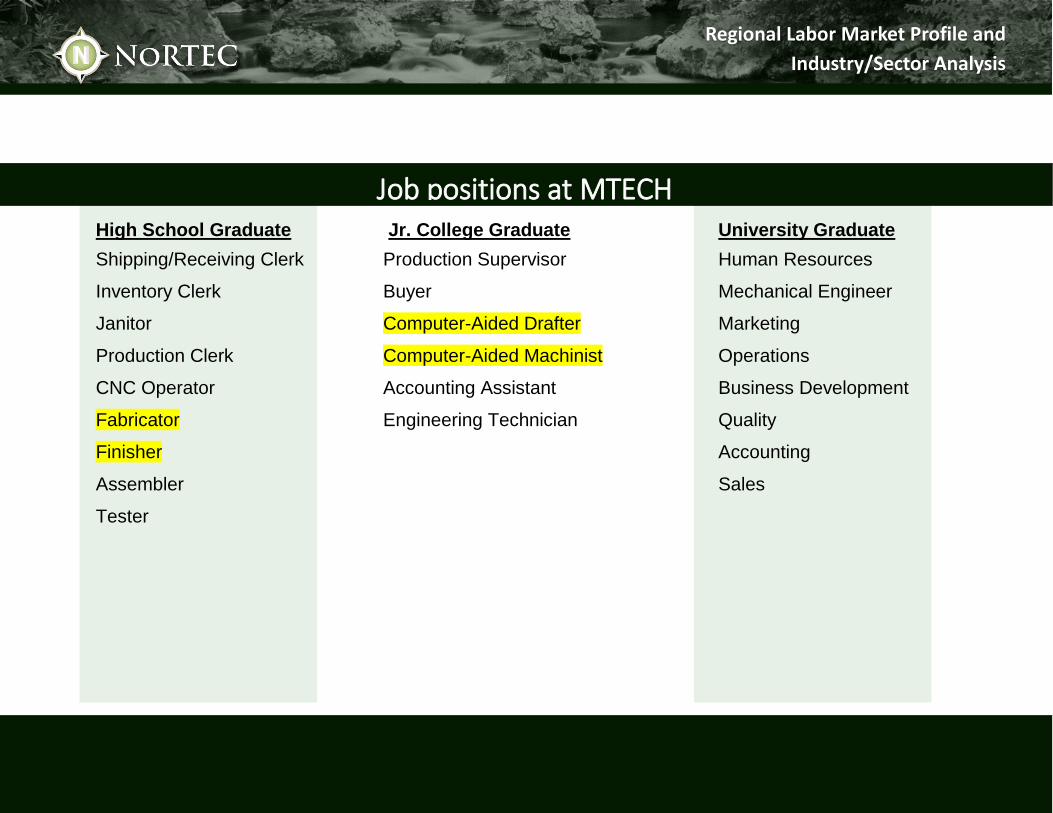
Regional Labor Market Profile and
Industry/Sector Analysis
High School Graduate Jr. College Graduate University Graduate
Shipping/Receiving Clerk Production Supervisor Human Resources
Inventory Clerk Buyer Mechanical Engineer
Janitor Computer-Aided Drafter Marketing
Production Clerk Computer-Aided Machinist Operations
CNC Operator Accounting Assistant Business Development
Fabricator Engineering Technician Quality
Finisher Accounting
Assembler Sales
Tester
Job positions at MTECH
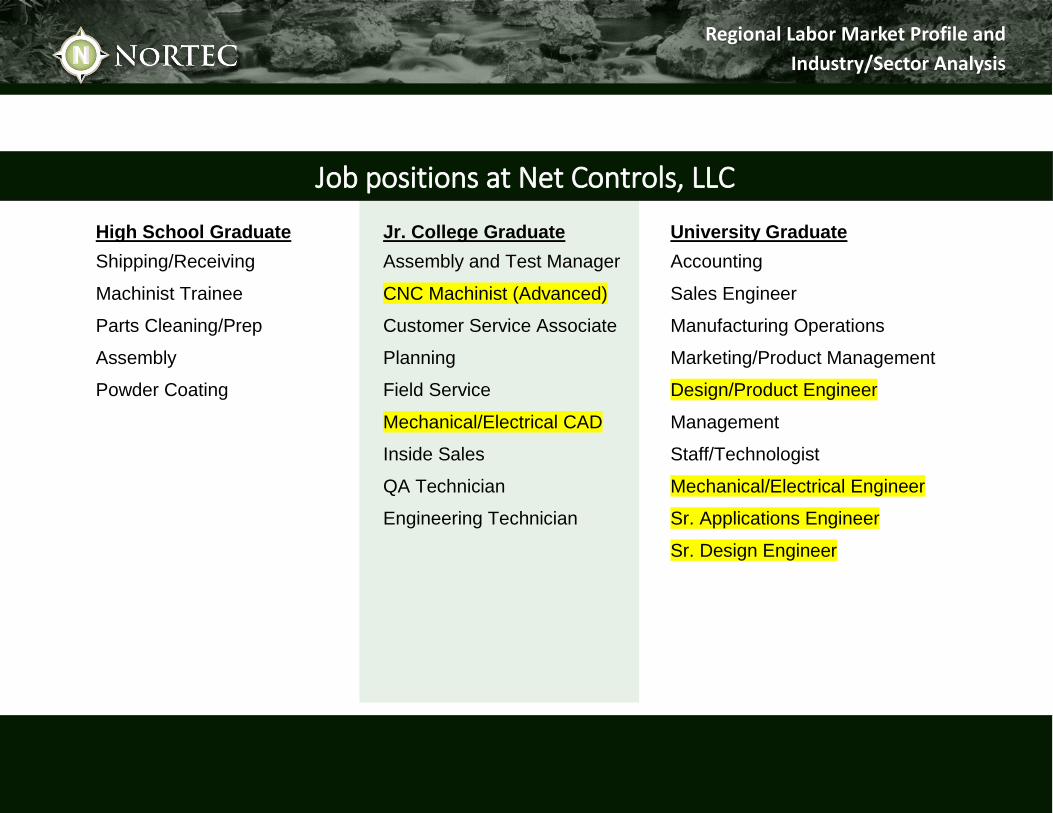
Regional Labor Market Profile and
Industry/Sector Analysis
High School Graduate Jr. College Graduate University Graduate
Shipping/Receiving Assembly and Test Manager Accounting
Machinist Trainee CNC Machinist (Advanced) Sales Engineer
Parts Cleaning/Prep Customer Service Associate Manufacturing Operations
Assembly Planning Marketing/Product Management
Powder Coating Field Service Design/Product Engineer
Mechanical/Electrical CAD Management
Inside Sales Staff/Technologist
QA Technician Mechanical/Electrical Engineer
Engineering Technician Sr. Applications Engineer
Sr. Design Engineer
Job positions at Net Controls, LLC

Regional Labor Market Profile and
Industry/Sector Analysis
High School Graduate Jr. College Graduate University Graduate
Receptionist Manual Welding Accounting
Mobility Equipment Installer Automotive Painter Purchasing
Interior Installer In-house Fabrication Marketing
Sales Support Engineering
Administrative Assistant Production Management
Supervisor
Job positions at Nor-Cal Vans, Inc.
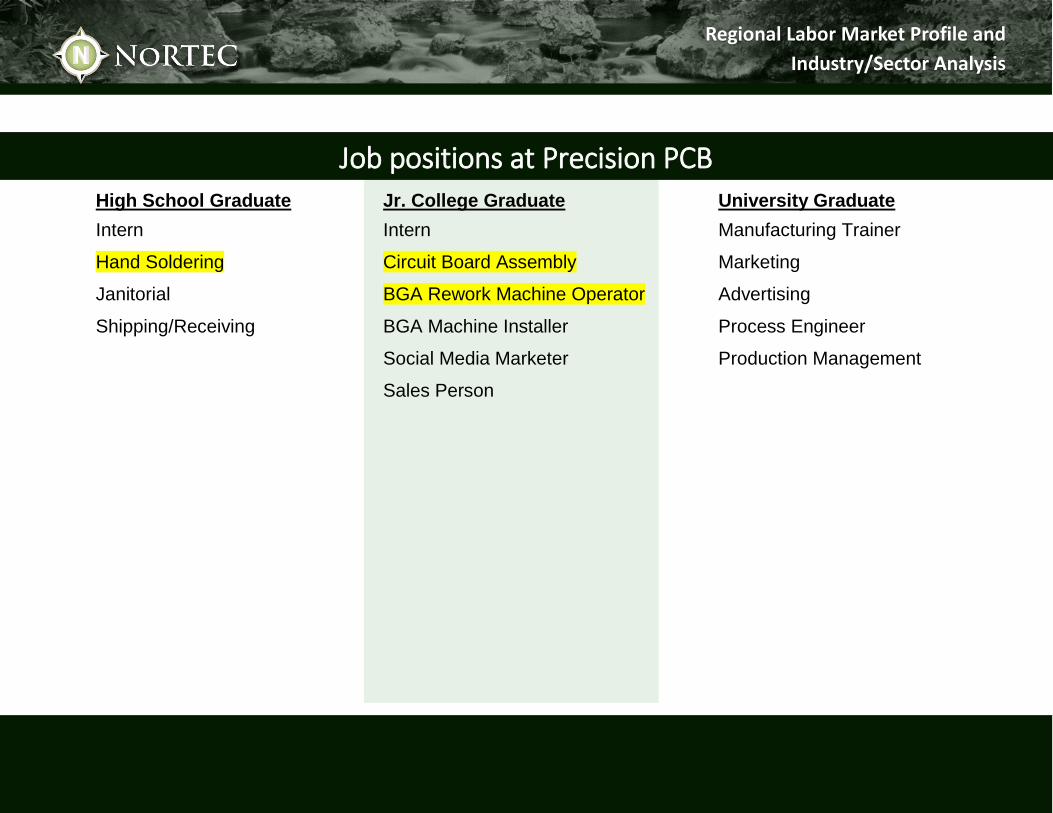
Regional Labor Market Profile and
Industry/Sector Analysis
High School Graduate Jr. College Graduate University Graduate
Intern Intern Manufacturing Trainer
Hand Soldering Circuit Board Assembly Marketing
Janitorial BGA Rework Machine Operator Advertising
Shipping/Receiving BGA Machine Installer Process Engineer
Social Media Marketer Production Management
Sales Person
Job positions at Precision PCB
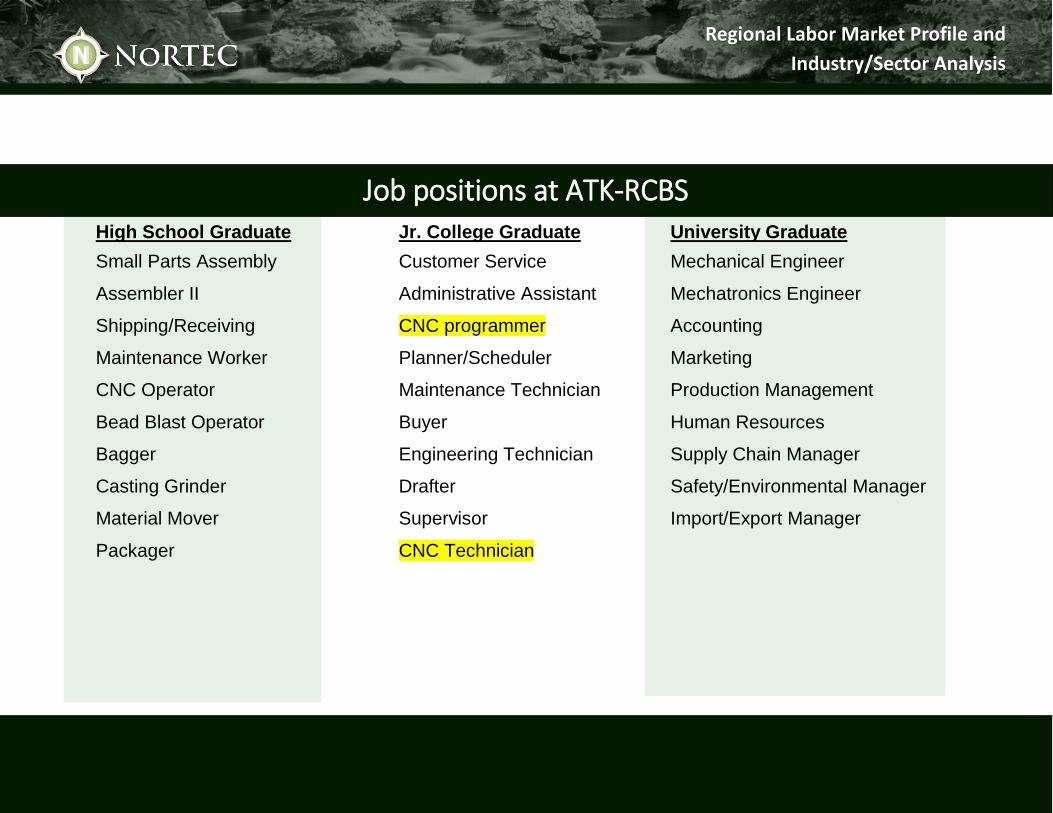
Regional Labor Market Profile and
Industry/Sector Analysis
High School Graduate Jr. College Graduate University Graduate
Small Parts Assembly Customer Service Mechanical Engineer
Assembler II Administrative Assistant Mechatronics Engineer
Shipping/Receiving CNC programmer Accounting
Maintenance Worker Planner/Scheduler Marketing
CNC Operator Maintenance Technician Production Management
Bead Blast Operator Buyer Human Resources
Bagger Engineering Technician Supply Chain Manager
Casting Grinder Drafter Safety/Environmental Manager
Material Mover Supervisor Import/Export Manager
Packager CNC Technician
Job positions at ATK-RCBS
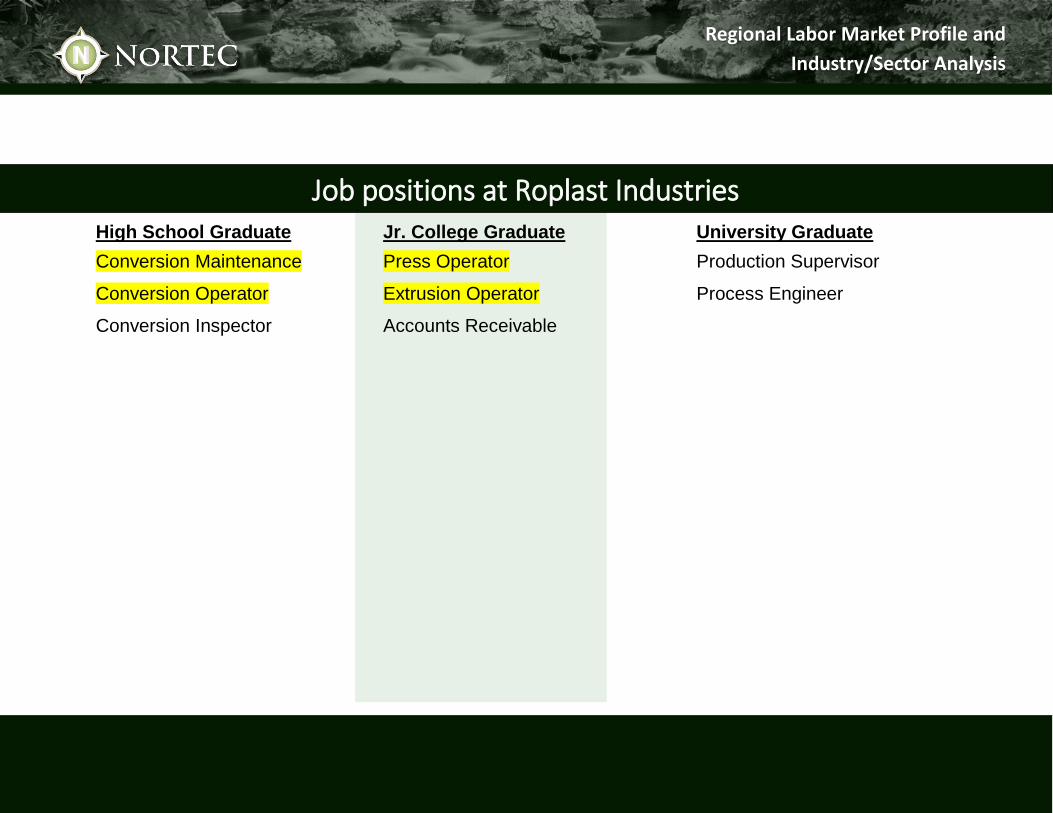
Regional Labor Market Profile and
Industry/Sector Analysis
High School Graduate Jr. College Graduate University Graduate
Conversion Maintenance Press Operator Production Supervisor
Conversion Operator Extrusion Operator Process Engineer
Conversion Inspector Accounts Receivable
Job positions at Roplast Industries
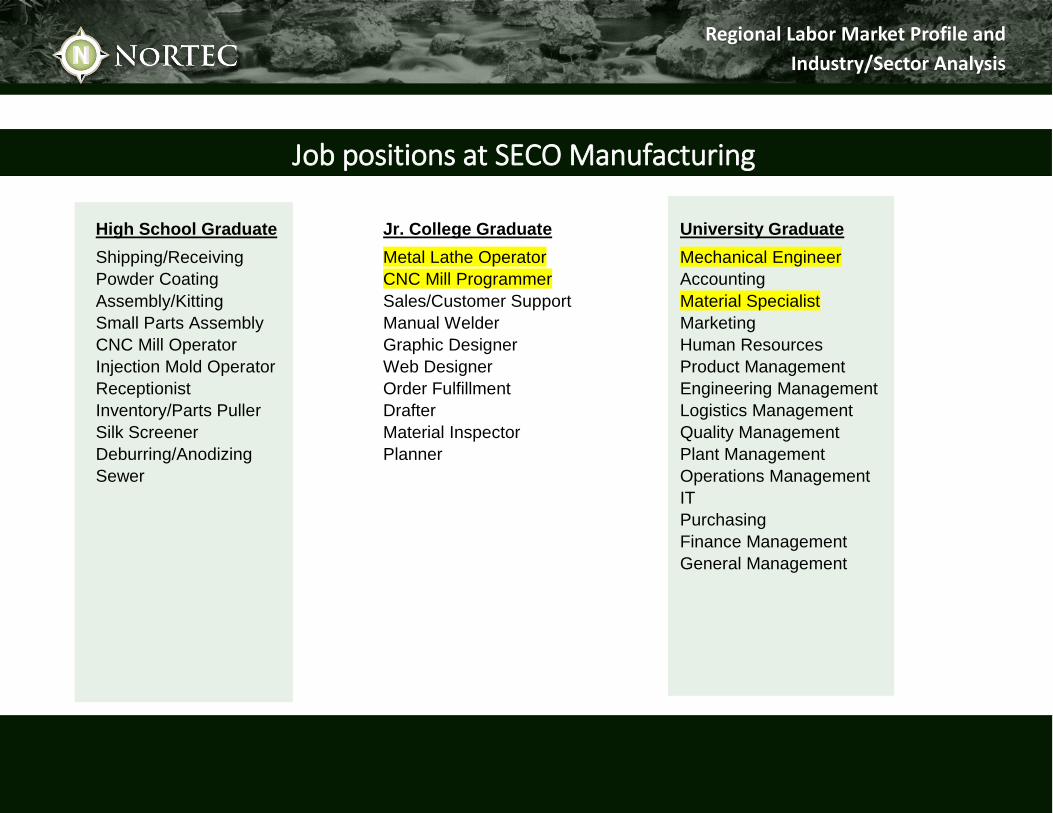
Regional Labor Market Profile and
Industry/Sector Analysis
High School Graduate Jr. College Graduate University Graduate
Shipping/Receiving Metal Lathe Operator Mechanical Engineer
Powder Coating CNC Mill Programmer Accounting
Assembly/Kitting Sales/Customer Support Material Specialist
Small Parts Assembly Manual Welder Marketing
CNC Mill Operator Graphic Designer Human Resources
Injection Mold Operator Web Designer Product Management
Receptionist Order Fulfillment Engineering Management
Inventory/Parts Puller Drafter Logistics Management
Silk Screener Material Inspector Quality Management
Deburring/Anodizing Planner Plant Management
Sewer Operations Management
IT
Purchasing
Finance Management
General Management
Job positions at SECO Manufacturing

Regional Labor Market Profile and
Industry/Sector Analysis
High School Graduate Jr. College Graduate University Graduate
Truck Driver Electrician Computer Engineer
Laborer Dealer Sales Representative Web Developer
Millwright Division Forester
Mechanic District Forester
Windows Territory Manager
Windows Service Scheduler
Window & Door Service Person
Saw Filer
Job positions at Sierra Pacific Industries
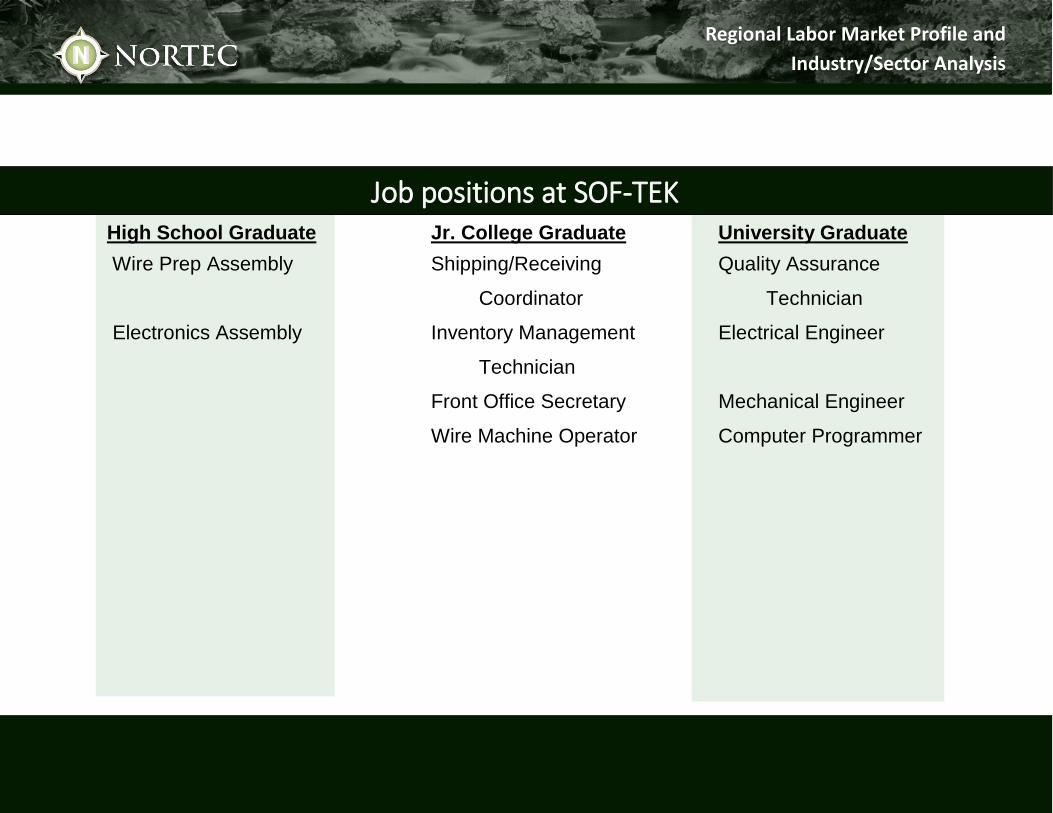
Regional Labor Market Profile and
Industry/Sector Analysis
High School Graduate Jr. College Graduate University Graduate
Wire Prep Assembly Shipping/Receiving Quality Assurance
Coordinator Technician
Electronics Assembly Inventory Management Electrical Engineer
Technician
Front Office Secretary Mechanical Engineer
Wire Machine Operator Computer Programmer
Job positions at SOF-TEK
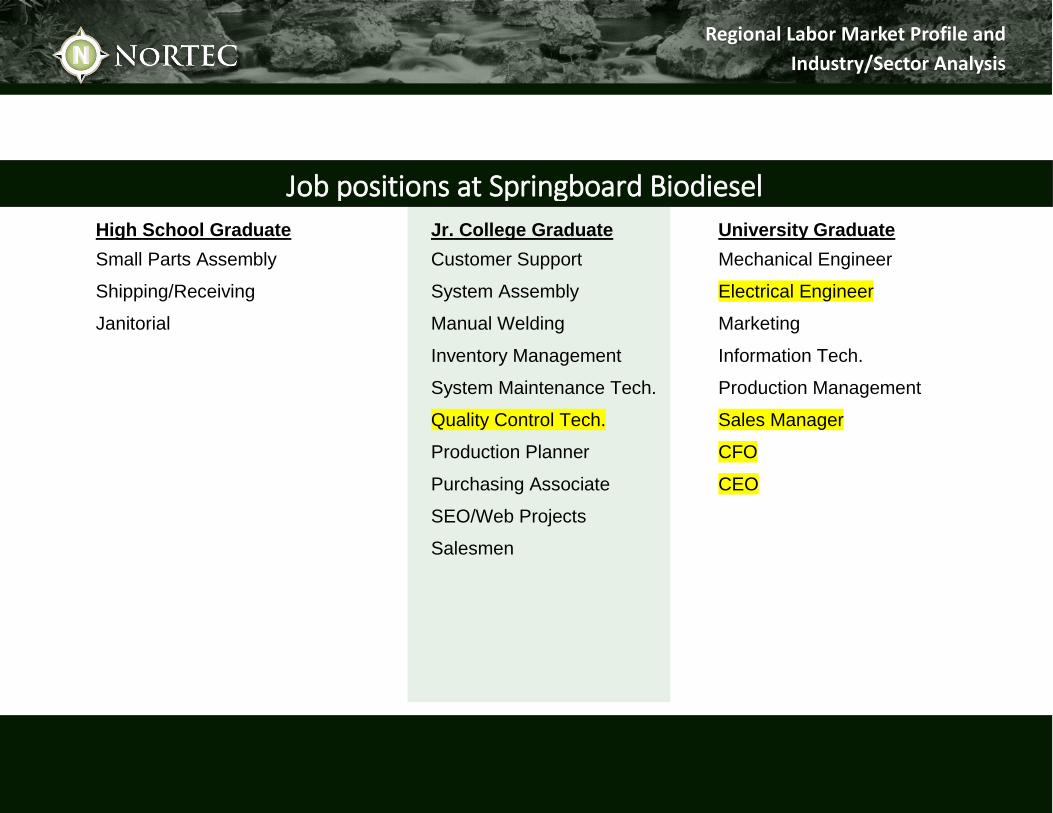
Regional Labor Market Profile and
Industry/Sector Analysis
High School Graduate Jr. College Graduate University Graduate
Small Parts Assembly Customer Support Mechanical Engineer
Shipping/Receiving System Assembly Electrical Engineer
Janitorial Manual Welding Marketing
Inventory Management Information Tech.
System Maintenance Tech. Production Management
Quality Control Tech. Sales Manager
Production Planner CFO
Purchasing Associate CEO
SEO/Web Projects
Salesmen
Job positions at Springboard Biodiesel
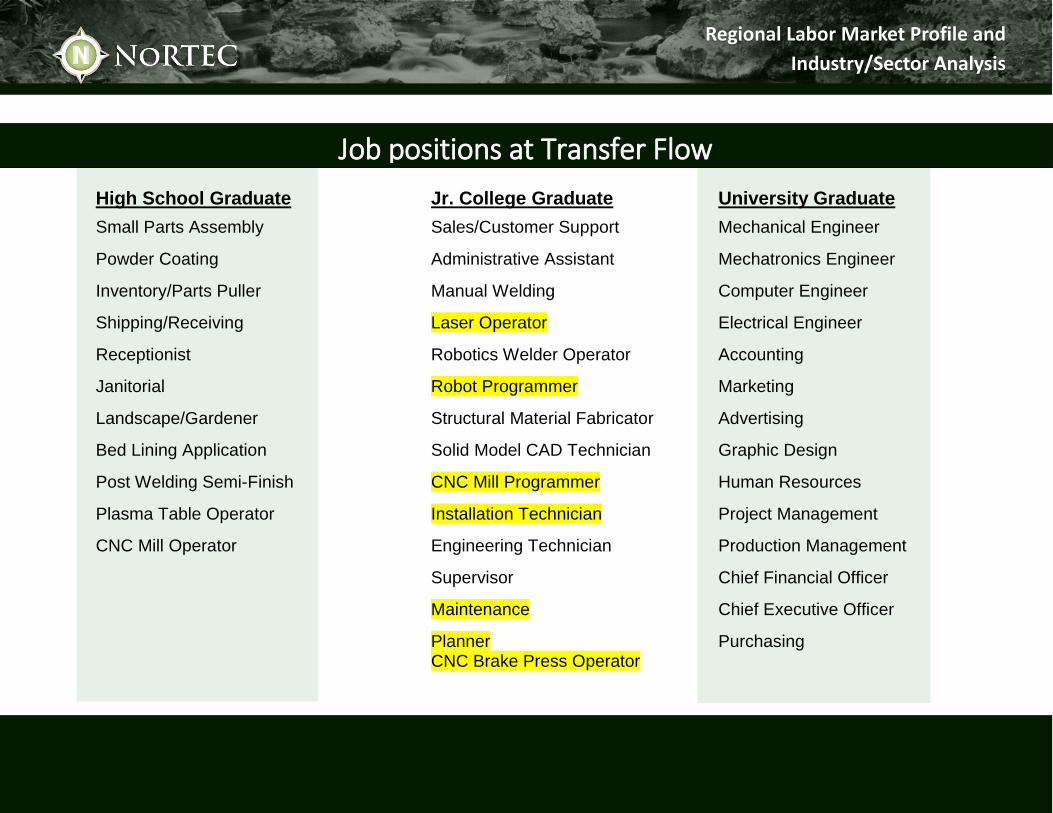
Regional Labor Market Profile and
Industry/Sector Analysis
High School Graduate Jr. College Graduate University Graduate
Small Parts Assembly Sales/Customer Support Mechanical Engineer
Powder Coating Administrative Assistant Mechatronics Engineer
Inventory/Parts Puller Manual Welding Computer Engineer
Shipping/Receiving Laser Operator Electrical Engineer
Receptionist Robotics Welder Operator Accounting
Janitorial Robot Programmer Marketing
Landscape/Gardener Structural Material Fabricator Advertising
Bed Lining Application Solid Model CAD Technician Graphic Design
Post Welding Semi-Finish CNC Mill Programmer Human Resources
Plasma Table Operator Installation Technician Project Management
CNC Mill Operator Engineering Technician Production Management
Supervisor Chief Financial Officer
Maintenance Chief Executive Officer
Planner Purchasing CNC Brake Press Operator
Job positions at Transfer Flow
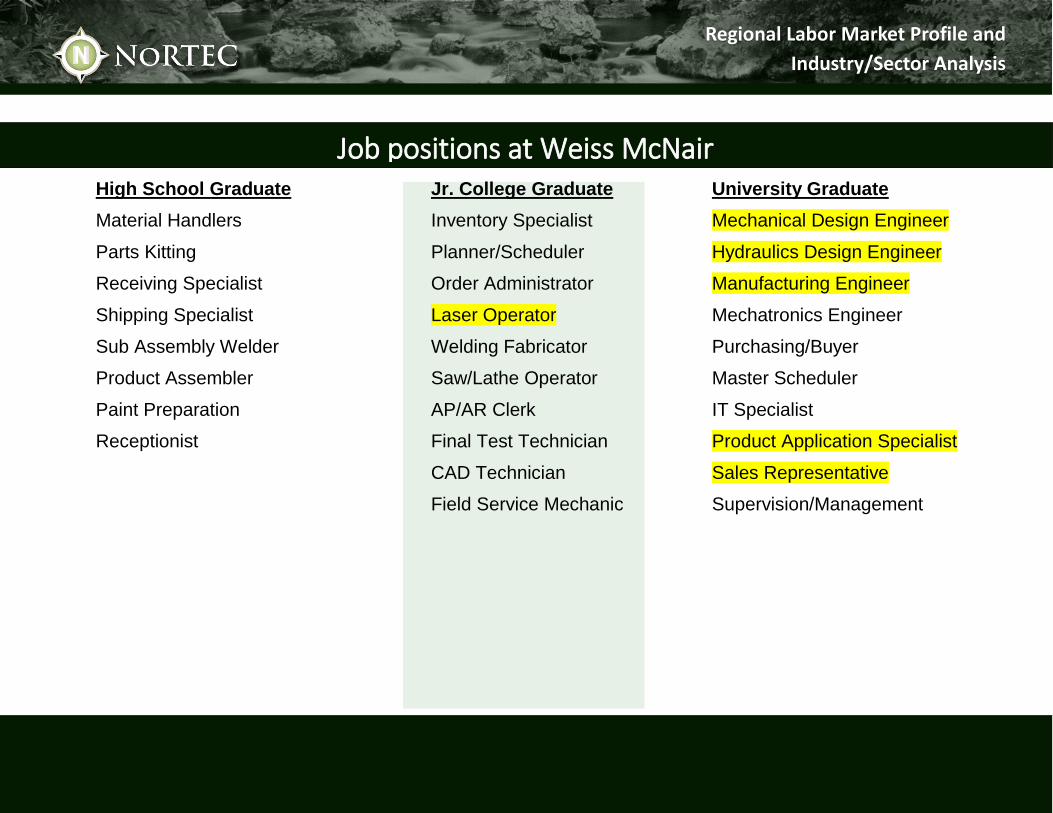
Regional Labor Market Profile and
Industry/Sector Analysis
High School Graduate Jr. College Graduate University Graduate
Material Handlers Inventory Specialist Mechanical Design Engineer
Parts Kitting Planner/Scheduler Hydraulics Design Engineer
Receiving Specialist Order Administrator Manufacturing Engineer
Shipping Specialist Laser Operator Mechatronics Engineer
Sub Assembly Welder Welding Fabricator Purchasing/Buyer
Product Assembler Saw/Lathe Operator Master Scheduler
Paint Preparation AP/AR Clerk IT Specialist
Receptionist Final Test Technician Product Application Specialist
CAD Technician Sales Representative
Field Service Mechanic Supervision/Management
Job positions at Weiss McNair
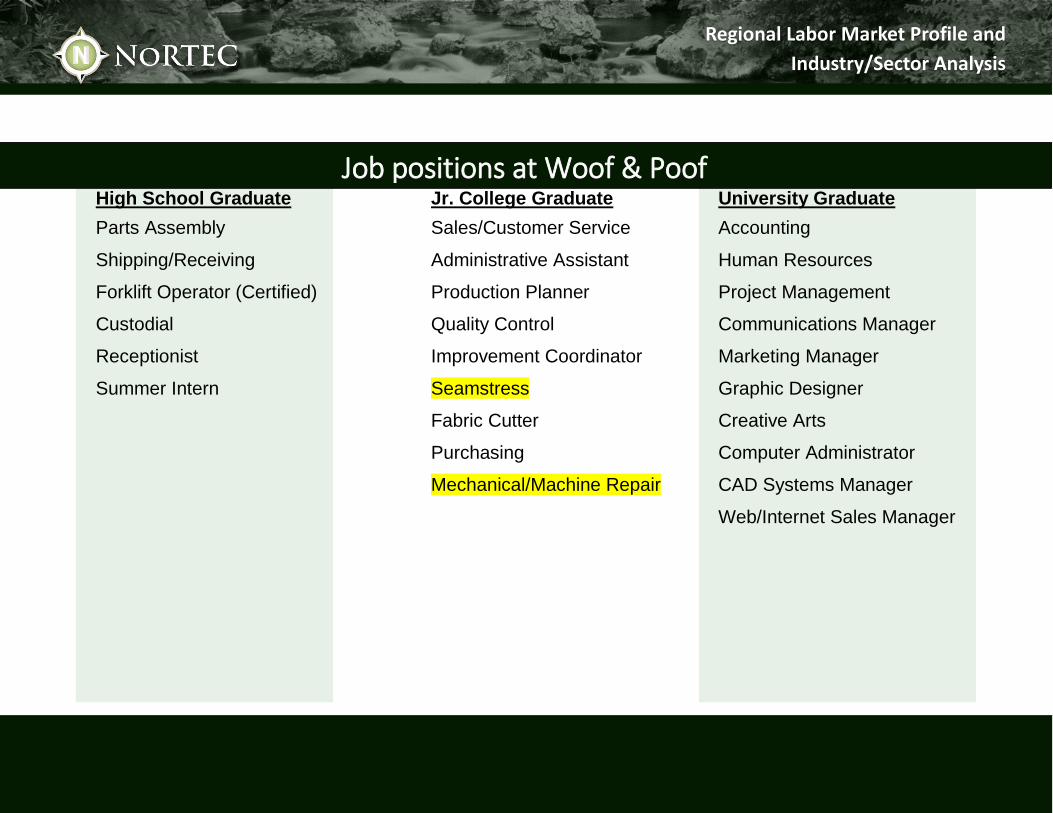
Regional Labor Market Profile and
Industry/Sector Analysis
High School Graduate Jr. College Graduate University Graduate
Parts Assembly Sales/Customer Service Accounting
Shipping/Receiving Administrative Assistant Human Resources
Forklift Operator (Certified) Production Planner Project Management
Custodial Quality Control Communications Manager
Receptionist Improvement Coordinator Marketing Manager
Summer Intern Seamstress Graphic Designer
Fabric Cutter Creative Arts
Purchasing Computer Administrator
Mechanical/Machine Repair CAD Systems Manager
Web/Internet Sales Manager
Job positions at Woof & Poof