Embed Size (px)
Citation preview
Tuesday , 12 May 2015
1 Refer to last page for important disclosures.
R e g i o n a l M o r n i n g N o t e s
PLEASE CLICK ON THE PAGE NUMBER TO MOVE TO THE RELEVANT PAGE.
REGIONAL Sector Plantation Page 2Apr 15: Substantial jump in palm oil inventory to 2.19m tonnes, above market expectations on strong palm oil imports and strong FFB yield recovery.
CHINA Sector Automobile Page 4April PV sales slow, dragged by sedans. Downgrade DFM from BUY to HOLD. Top pick is GWM.
Update Dongfeng Motor (489 HK/HOLD/HK$13.32/Target: HK$14.00) Page 6Ytd sales miss expectations. Downgrade to HOLD with target price cut from HK$15.00 to HK$14.00.
INDONESIA Sector
Retail Page 9MPPA and LPPF will benefit from their expansion into eastern Indonesia. Local retailers will continue to lead the market. Ban on alcoholic beverages will affect AMRT.
MALAYSIA Sector Plantation Page 111Q15 results preview: Expect weak results on low production and CPO prices.
Update Genting Malaysia (GENM MK/BUY/RM4.30/Target: RM4.76) Page 13Proposed stake sale of GENHK is mildly positive.
SINGAPORE Sector Aviation Support Service Page 16SATS likely to outperform, and we estimate a 25% rise in final dividend. Maintain UNDERWEIGHT.
Results First Resources (FR SP/BUY/S$1.81/Target: S$2.40) Page 181Q15: Net profit of US$28.9m (-48.9% qoq, -33.9% yoy) due to lower ASP and lower sales volume. Results are within expectation as 1Q is seasonally weaker.
THAILAND Results Banpu (BANPU TB/BUY/Bt29.00/Target: Bt33.00) Page 211Q15: Results come with no surprises.
Indorama Ventures (IVL TB/SELL/Bt22.90/Target: Bt19.70) Page 241Q15: Strong results but valuation not cheap.
Major Cineplex (MAJOR TB/HOLD/Bt34.00/Target: Bt38.50) Page 271Q15: Earnings up 42% yoy, but down 4% qoq.
Thai Oil (TOP TB/SELL/Bt56.25/Target: Bt43.00) Page 301Q15: Results in line with expectations.
Update Sino-Thai Engineering & Construction (STEC TB/BUY/Bt20.30/Target: Bt25.00) Page 33Expect weak 1Q15 results.
KEY INDICES Prev Close 1D % 1W % 1M % YTD % DJIA 18105.2 (0.5) 0.2 0.3 1.6 S&P 500 2105.3 (0.5) (0.4) 0.2 2.3 FTSE 100 7029.9 (0.2) 0.6 (0.8) 7.1 AS30 5627.6 (0.1) (3.2) (5.2) 4.4 CSI 300 4690.5 2.9 (2.0) 8.0 32.7 FSSTI 3470.8 0.5 (0.3) (0.0) 3.1 HSCEI 14183.0 0.9 (1.9) 1.4 18.3 HSI 27718.2 0.5 (1.4) 1.6 17.4 JCI 5172.5 (0.2) 0.6 (5.8) (1.0) KLCI 1805.5 (0.1) (0.7) (2.1) 2.5 KOSPI 2097.4 0.6 (1.4) 0.5 9.5 Nikkei 225 19620.9 1.2 (2.2) (1.4) 12.4 SET 1501.3 (0.6) (1.4) (3.0) 0.2 TWSE 9663.7 (0.3) (1.8) 0.5 3.8 BDI 578 0.7 (1.5) (0.3) (26.1) CPO (RM/mt) 2146 (0.6) 3.1 (1.6) (6.6) Nymex Crude (US$/bbl)
59 0.1 (1.9) 14.8 11.3
Source: Bloomberg
TOP PICKS Ticker CP (lcy) TP (lcy) Pot. +/-
( )BUY Beijing Capital 694 HK 8.10 12.30 51.9 ICBC 1398 HK 6.58 7.80 18.5 Bank BJB BJBR IJ 870.00 1,300.00 49.4 Maybank MAY MK 9.32 10.30 10.5 DBS DBS SP 21.13 25.08 18.7 Pacific Radiance PACRA SP 0.65 0.99 52.3 Krung Thai Bank KTB TB 20.00 27.00 35.0 Sino Thai Engr STEC TB 20.30 30.25 49.0
SELL UMWH Holdings UMWH MK 10.80 10.00 (7.4)
KEY ASSUMPTIONS GDP (% yoy) 2013 2014 2015F US 1.9 2.4 3.2 Euro Zone -0.4 0.9 1.4 Japan 1.5 1.5 2.0 Singapore 3.9 3.2 3.3 Malaysia 4.7 5.9 5.2 Thailand 2.9 1.5 3.9 Indonesia 5.8 5.2 5.8 Hong Kong 2.9 3.5 3.7 China 7.7 7.2 7.0 2014 2015F 2016F Brent (US$/bbl) 99.45 65 70 CPO (US$/mt) 722 765 788 BDI 1,101 1,300 1,400 Source: Bloomberg, UOB ETR, UOB Kay Hian
CORPORATE EVENTS
Venue Begin Close
SKP Resources Luncheon Kuala Lumpur 12 May 12 May
SKP Resources Roadshow Singapore 14 May 14 May
JCY International Luncheon Kuala Lumpur 14 May 14 May
E for L Aim Roadshow Kuala Lumpur 25 May 26 May Singapore 27 May 27 May
SIN Telcos, SIN Banks & INDO Telcos Taipei 28 May 28 May Analyst Presentation
China Auto Sector Hong Kong 22 May 22 May Analyst Presentation Singapore 26 May 26 May Kuala Lumpur 27 May 28 May
Indosat Roadshow Kuala Lumpur 27 May 27 May Singapore 28 May 28 May Taipei 29 May 29 May
Tuesday , 12 May 2015
2 Refer to last page for important disclosures.
R e g i o n a l M o r n i n g N o t e s
SECTOR UPDATE
Plantation – Regional Jump In Inventory
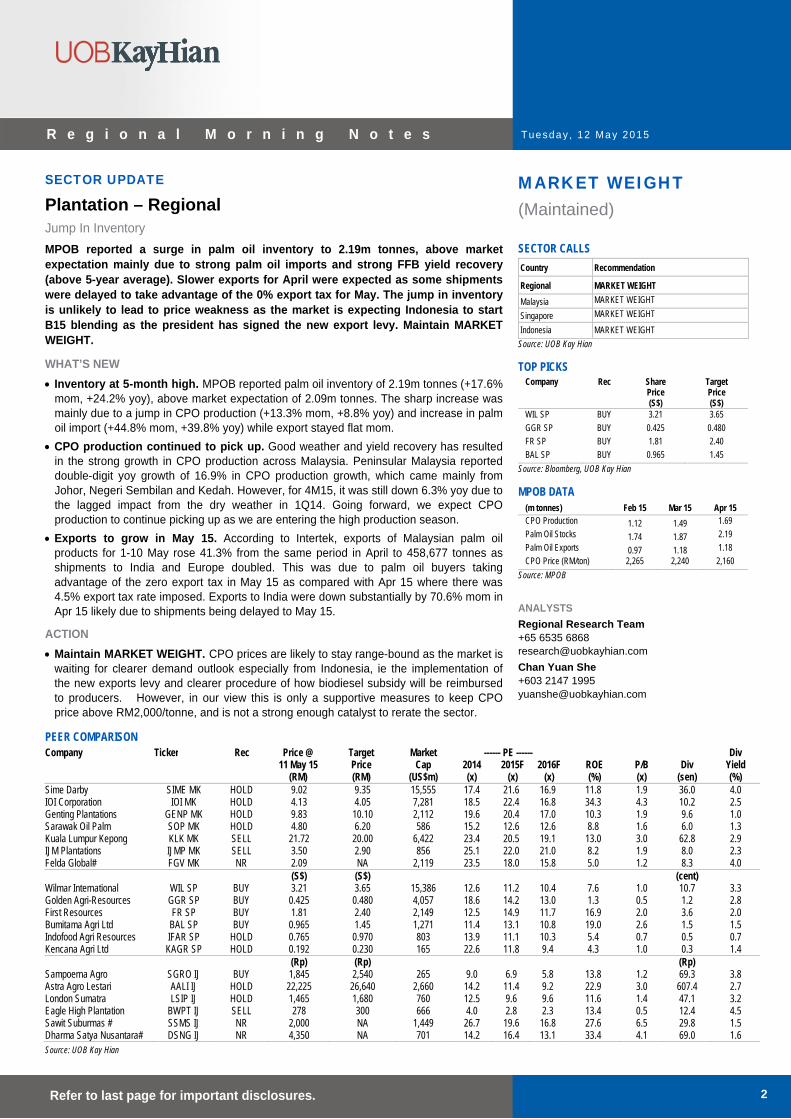
MPOB reported a surge in palm oil inventory to 2.19m tonnes, above market expectation mainly due to strong palm oil imports and strong FFB yield recovery (above 5-year average). Slower exports for April were expected as some shipments were delayed to take advantage of the 0% export tax for May. The jump in inventory is unlikely to lead to price weakness as the market is expecting Indonesia to start B15 blending as the president has signed the new export levy. Maintain MARKET WEIGHT.
WHAT’S NEW
Inventory at 5-month high. MPOB reported palm oil inventory of 2.19m tonnes (+17.6% mom, +24.2% yoy), above market expectation of 2.09m tonnes. The sharp increase was mainly due to a jump in CPO production (+13.3% mom, +8.8% yoy) and increase in palm oil import (+44.8% mom, +39.8% yoy) while export stayed flat mom.
CPO production continued to pick up. Good weather and yield recovery has resulted in the strong growth in CPO production across Malaysia. Peninsular Malaysia reported double-digit yoy growth of 16.9% in CPO production growth, which came mainly from Johor, Negeri Sembilan and Kedah. However, for 4M15, it was still down 6.3% yoy due to the lagged impact from the dry weather in 1Q14. Going forward, we expect CPO production to continue picking up as we are entering the high production season.
Exports to grow in May 15. According to Intertek, exports of Malaysian palm oil products for 1-10 May rose 41.3% from the same period in April to 458,677 tonnes as shipments to India and Europe doubled. This was due to palm oil buyers taking advantage of the zero export tax in May 15 as compared with Apr 15 where there was 4.5% export tax rate imposed. Exports to India were down substantially by 70.6% mom in Apr 15 likely due to shipments being delayed to May 15.
ACTION
Maintain MARKET WEIGHT. CPO prices are likely to stay range-bound as the market is waiting for clearer demand outlook especially from Indonesia, ie the implementation of the new exports levy and clearer procedure of how biodiesel subsidy will be reimbursed to producers. However, in our view this is only a supportive measures to keep CPO price above RM2,000/tonne, and is not a strong enough catalyst to rerate the sector.
MARKET WEIGHT (Maintained) SECTOR CALLS
Country Recommendation
Regional MARKET WEIGHT
Malaysia MARKET WEIGHT
Singapore MARKET WEIGHT
Indonesia MARKET WEIGHT
Source: UOB Kay Hian TOP PICKS
Company Rec Share Price (S$)
Target Price (S$)
WIL SP BUY 3.21 3.65
GGR SP BUY 0.425 0.480
FR SP BUY 1.81 2.40
BAL SP BUY 0.965 1.45
Source: Bloomberg, UOB Kay Hian
MPOB DATA (m tonnes) Feb 15 Mar 15 Apr 15 CPO Production 1.12 1.49 1.69
Palm Oil Stocks 1.74 1.87 2.19
Palm Oil Exports 0.97 1.18 1.18
CPO Price (RM/ton) 2,265 2,240 2,160
Source: MPOB
ANALYSTS
Regional Research Team +65 6535 6868 [email protected]
Chan Yuan She +603 2147 1995 [email protected]
PEER COMPARISON Company Ticker Rec Price @ Target Market ------ PE ------ Div 11 May 15 Price Cap 2014 2015F 2016F ROE P/B Div Yield (RM) (RM) (US$m) (x) (x) (x) (%) (x) (sen) (%) Sime Darby SIME MK HOLD 9.02 9.35 15,555 17.4 21.6 16.9 11.8 1.9 36.0 4.0 IOI Corporation IOI MK HOLD 4.13 4.05 7,281 18.5 22.4 16.8 34.3 4.3 10.2 2.5 Genting Plantations GENP MK HOLD 9.83 10.10 2,112 19.6 20.4 17.0 10.3 1.9 9.6 1.0 Sarawak Oil Palm SOP MK HOLD 4.80 6.20 586 15.2 12.6 12.6 8.8 1.6 6.0 1.3 Kuala Lumpur Kepong KLK MK SELL 21.72 20.00 6,422 23.4 20.5 19.1 13.0 3.0 62.8 2.9 IJM Plantations IJMP MK SELL 3.50 2.90 856 25.1 22.0 21.0 8.2 1.9 8.0 2.3 Felda Global# FGV MK NR 2.09 NA 2,119 23.5 18.0 15.8 5.0 1.2 8.3 4.0 (S$) (S$) (cent) Wilmar International WIL SP BUY 3.21 3.65 15,386 12.6 11.2 10.4 7.6 1.0 10.7 3.3 Golden Agri-Resources GGR SP BUY 0.425 0.480 4,057 18.6 14.2 13.0 1.3 0.5 1.2 2.8 First Resources FR SP BUY 1.81 2.40 2,149 12.5 14.9 11.7 16.9 2.0 3.6 2.0 Bumitama Agri Ltd BAL SP BUY 0.965 1.45 1,271 11.4 13.1 10.8 19.0 2.6 1.5 1.5 Indofood Agri Resources IFAR SP HOLD 0.765 0.970 803 13.9 11.1 10.3 5.4 0.7 0.5 0.7 Kencana Agri Ltd KAGR SP HOLD 0.192 0.230 165 22.6 11.8 9.4 4.3 1.0 0.3 1.4 (Rp) (Rp) (Rp) Sampoerna Agro SGRO IJ BUY 1,845 2,540 265 9.0 6.9 5.8 13.8 1.2 69.3 3.8 Astra Agro Lestari AALI IJ HOLD 22,225 26,640 2,660 14.2 11.4 9.2 22.9 3.0 607.4 2.7 London Sumatra LSIP IJ HOLD 1,465 1,680 760 12.5 9.6 9.6 11.6 1.4 47.1 3.2 Eagle High Plantation BWPT IJ SELL 278 300 666 4.0 2.8 2.3 13.4 0.5 12.4 4.5 Sawit Suburmas # SSMS IJ NR 2,000 NA 1,449 26.7 19.6 16.8 27.6 6.5 29.8 1.5 Dharma Satya Nusantara# DSNG IJ NR 4,350 NA 701 14.2 16.4 13.1 33.4 4.1 69.0 1.6 Source: UOB Kay Hian
Tuesday , 12 May 2015
3 Refer to last page for important disclosures.
R e g i o n a l M o r n i n g N o t e s
In the current market conditions, we prefer companies with exposure to Indonesia refinery and biodiesel as it allows them to take advantage of the new measures and also companies with higher production growth which can mitigate the weak CPO prices.
ESSENTIALS
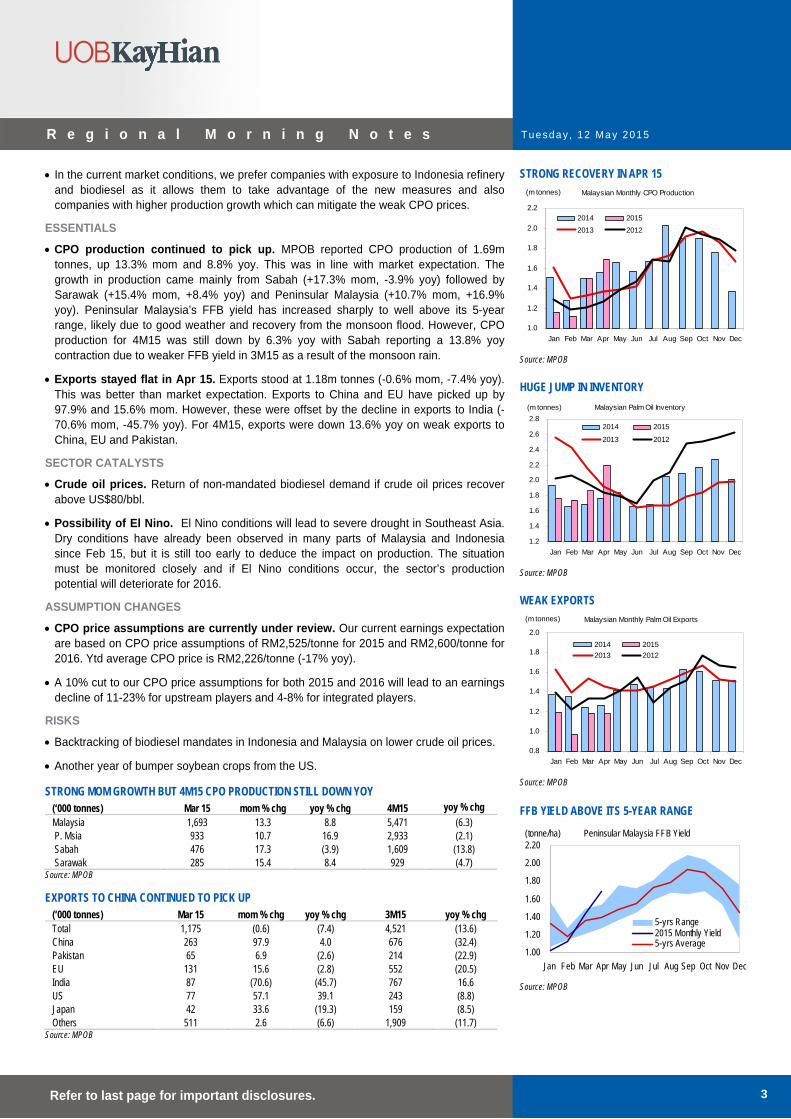
CPO production continued to pick up. MPOB reported CPO production of 1.69m tonnes, up 13.3% mom and 8.8% yoy. This was in line with market expectation. The growth in production came mainly from Sabah (+17.3% mom, -3.9% yoy) followed by Sarawak (+15.4% mom, +8.4% yoy) and Peninsular Malaysia (+10.7% mom, +16.9% yoy). Peninsular Malaysia’s FFB yield has increased sharply to well above its 5-year range, likely due to good weather and recovery from the monsoon flood. However, CPO production for 4M15 was still down by 6.3% yoy with Sabah reporting a 13.8% yoy contraction due to weaker FFB yield in 3M15 as a result of the monsoon rain.
Exports stayed flat in Apr 15. Exports stood at 1.18m tonnes (-0.6% mom, -7.4% yoy). This was better than market expectation. Exports to China and EU have picked up by 97.9% and 15.6% mom. However, these were offset by the decline in exports to India (-70.6% mom, -45.7% yoy). For 4M15, exports were down 13.6% yoy on weak exports to China, EU and Pakistan.
SECTOR CATALYSTS
Crude oil prices. Return of non-mandated biodiesel demand if crude oil prices recover above US$80/bbl.
Possibility of El Nino. El Nino conditions will lead to severe drought in Southeast Asia. Dry conditions have already been observed in many parts of Malaysia and Indonesia since Feb 15, but it is still too early to deduce the impact on production. The situation must be monitored closely and if El Nino conditions occur, the sector’s production potential will deteriorate for 2016.
ASSUMPTION CHANGES
CPO price assumptions are currently under review. Our current earnings expectation are based on CPO price assumptions of RM2,525/tonne for 2015 and RM2,600/tonne for 2016. Ytd average CPO price is RM2,226/tonne (-17% yoy).
A 10% cut to our CPO price assumptions for both 2015 and 2016 will lead to an earnings decline of 11-23% for upstream players and 4-8% for integrated players.
RISKS
Backtracking of biodiesel mandates in Indonesia and Malaysia on lower crude oil prices.
Another year of bumper soybean crops from the US.
STRONG MOM GROWTH BUT 4M15 CPO PRODUCTION STILL DOWN YOY (‘000 tonnes) Mar 15 mom % chg yoy % chg 4M15 yoy % chg
Malaysia 1,693 13.3 8.8 5,471 (6.3) P. Msia 933 10.7 16.9 2,933 (2.1) Sabah 476 17.3 (3.9) 1,609 (13.8) Sarawak 285 15.4 8.4 929 (4.7)
Source: MPOB
EXPORTS TO CHINA CONTINUED TO PICK UP (‘000 tonnes) Mar 15 mom % chg yoy % chg 3M15 yoy % chg Total 1,175 (0.6) (7.4) 4,521 (13.6) China 263 97.9 4.0 676 (32.4) Pakistan 65 6.9 (2.6) 214 (22.9) EU 131 15.6 (2.8) 552 (20.5) India 87 (70.6) (45.7) 767 16.6 US 77 57.1 39.1 243 (8.8) Japan 42 33.6 (19.3) 159 (8.5) Others 511 2.6 (6.6) 1,909 (11.7)
Source: MPOB
STRONG RECOVERY IN APR 15
1.0
1.2
1.4
1.6
1.8
2.0
2.2
Jan Feb Mar Apr May Jun Jul Aug Sep Oct Nov Dec
2014 2015
2013 2012
(m tonnes) Malaysian Monthly CPO Production
Source: MPOB
HUGE JUMP IN INVENTORY
1.2
1.4
1.6
1.8
2.0
2.2
2.4
2.6
2.8
Jan Feb Mar Apr May Jun Jul Aug Sep Oct Nov Dec
2014 2015
2013 2012
(m tonnes) Malaysian Palm Oil Inventory
Source: MPOB
WEAK EXPORTS
0.8
1.0
1.2
1.4
1.6
1.8
2.0
Jan Feb Mar Apr May Jun Jul Aug Sep Oct Nov Dec
2014 2015
2013 2012
(m tonnes) Malaysian Monthly Palm Oil Exports
Source: MPOB FFB YIELD ABOVE ITS 5-YEAR RANGE
Peninsular Malaysia FFB Yield
1.00
1.20
1.40
1.60
1.80
2.00
2.20
Jan Feb Mar Apr May Jun Jul Aug Sep Oct Nov Dec
(tonne/ha)
5-yrs Range2015 Monthly Yield5-yrs Average
Source: MPOB
Tuesday , 12 May 2015
4 Refer to last page for important disclosures.
R e g i o n a l M o r n i n g N o t e s
SECTOR UPDATE
Automobile - China Sales Growth All Coming From SUVs and MPVs
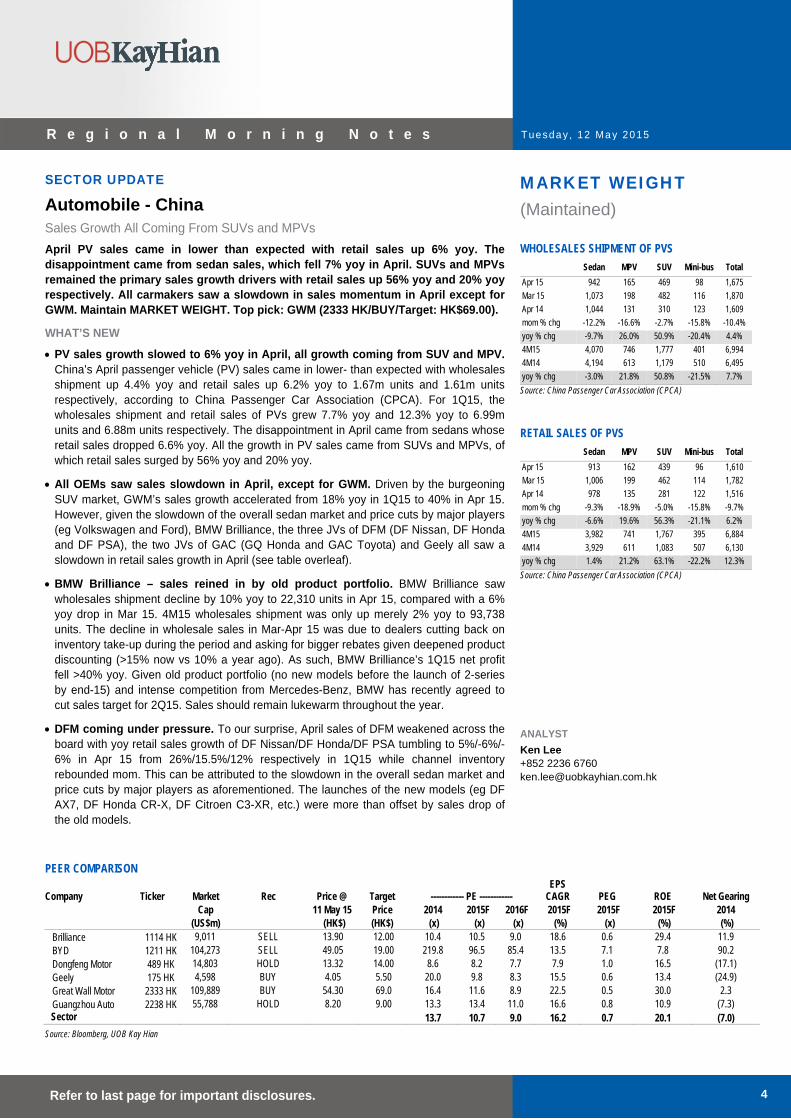
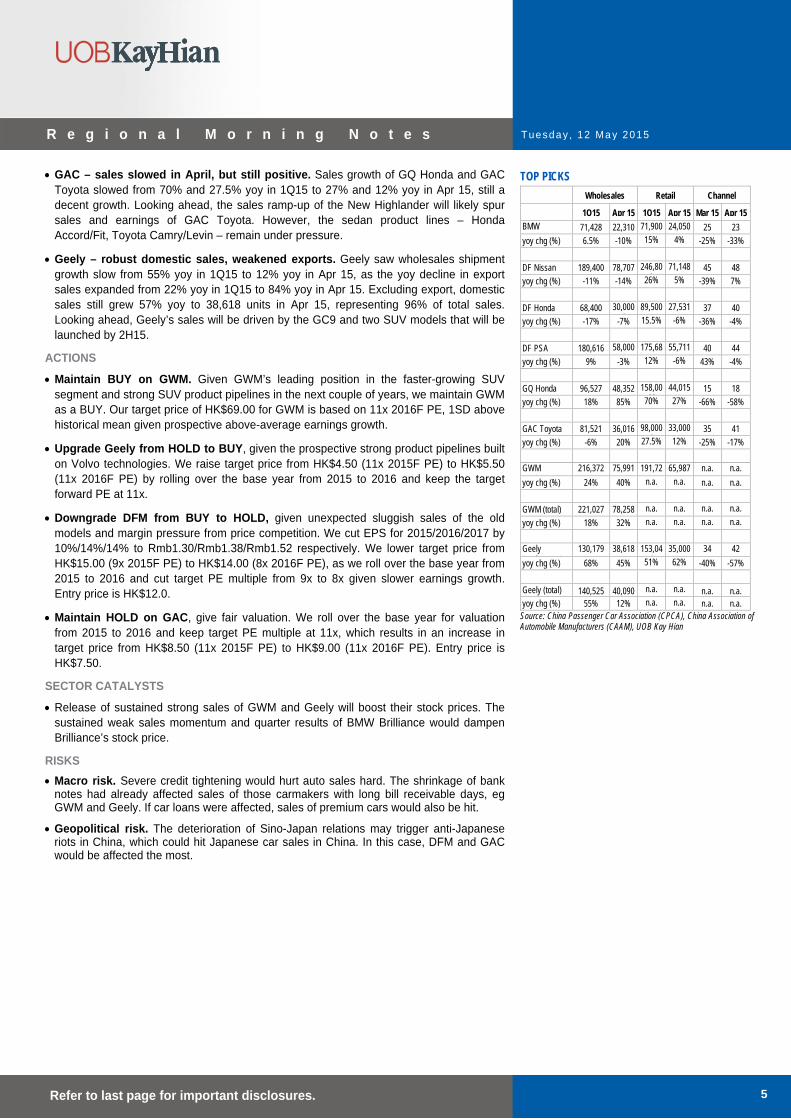
April PV sales came in lower than expected with retail sales up 6% yoy. The disappointment came from sedan sales, which fell 7% yoy in April. SUVs and MPVs remained the primary sales growth drivers with retail sales up 56% yoy and 20% yoy respectively. All carmakers saw a slowdown in sales momentum in April except for GWM. Maintain MARKET WEIGHT. Top pick: GWM (2333 HK/BUY/Target: HK$69.00).
WHAT’S NEW
PV sales growth slowed to 6% yoy in April, all growth coming from SUV and MPV. China’s April passenger vehicle (PV) sales came in lower- than expected with wholesales shipment up 4.4% yoy and retail sales up 6.2% yoy to 1.67m units and 1.61m units respectively, according to China Passenger Car Association (CPCA). For 1Q15, the wholesales shipment and retail sales of PVs grew 7.7% yoy and 12.3% yoy to 6.99m units and 6.88m units respectively. The disappointment in April came from sedans whose retail sales dropped 6.6% yoy. All the growth in PV sales came from SUVs and MPVs, of which retail sales surged by 56% yoy and 20% yoy.
All OEMs saw sales slowdown in April, except for GWM. Driven by the burgeoning SUV market, GWM’s sales growth accelerated from 18% yoy in 1Q15 to 40% in Apr 15. However, given the slowdown of the overall sedan market and price cuts by major players (eg Volkswagen and Ford), BMW Brilliance, the three JVs of DFM (DF Nissan, DF Honda and DF PSA), the two JVs of GAC (GQ Honda and GAC Toyota) and Geely all saw a slowdown in retail sales growth in April (see table overleaf).
BMW Brilliance – sales reined in by old product portfolio. BMW Brilliance saw wholesales shipment decline by 10% yoy to 22,310 units in Apr 15, compared with a 6% yoy drop in Mar 15. 4M15 wholesales shipment was only up merely 2% yoy to 93,738 units. The decline in wholesale sales in Mar-Apr 15 was due to dealers cutting back on inventory take-up during the period and asking for bigger rebates given deepened product discounting (>15% now vs 10% a year ago). As such, BMW Brilliance’s 1Q15 net profit fell >40% yoy. Given old product portfolio (no new models before the launch of 2-series by end-15) and intense competition from Mercedes-Benz, BMW has recently agreed to cut sales target for 2Q15. Sales should remain lukewarm throughout the year.
DFM coming under pressure. To our surprise, April sales of DFM weakened across the board with yoy retail sales growth of DF Nissan/DF Honda/DF PSA tumbling to 5%/-6%/-6% in Apr 15 from 26%/15.5%/12% respectively in 1Q15 while channel inventory rebounded mom. This can be attributed to the slowdown in the overall sedan market and price cuts by major players as aforementioned. The launches of the new models (eg DF AX7, DF Honda CR-X, DF Citroen C3-XR, etc.) were more than offset by sales drop of the old models.
MARKET WEIGHT (Maintained) WHOLESALES SHIPMENT OF PVS
Sedan MPV SUV Mini-bus Total
Apr 15 942 165 469 98 1,675
Mar 15 1,073 198 482 116 1,870
Apr 14 1,044 131 310 123 1,609
mom % chg -12.2% -16.6% -2.7% -15.8% -10.4%
yoy % chg -9.7% 26.0% 50.9% -20.4% 4.4%
4M15 4,070 746 1,777 401 6,994
4M14 4,194 613 1,179 510 6,495
yoy % chg -3.0% 21.8% 50.8% -21.5% 7.7%
Source: China Passenger Car Association (CPCA)
RETAIL SALES OF PVS
Sedan MPV SUV Mini-bus Total
Apr 15 913 162 439 96 1,610
Mar 15 1,006 199 462 114 1,782
Apr 14 978 135 281 122 1,516
mom % chg -9.3% -18.9% -5.0% -15.8% -9.7%
yoy % chg -6.6% 19.6% 56.3% -21.1% 6.2%
4M15 3,982 741 1,767 395 6,884
4M14 3,929 611 1,083 507 6,130
yoy % chg 1.4% 21.2% 63.1% -22.2% 12.3%
Source: China Passenger Car Association (CPCA)
ANALYST
Ken Lee +852 2236 6760 [email protected]
PEER COMPARISON
Company Ticker Market Rec Price @ Target ------------ PE ------------ EPS
CAGR PEG ROE Net Gearing Cap 11 May 15 Price 2014 2015F 2016F 2015F 2015F 2015F 2014 (US$m) (HK$) (HK$) (x) (x) (x) (%) (x) (%) (%)
Brilliance 1114 HK 9,011 SELL 13.90 12.00 10.4 10.5 9.0 18.6 0.6 29.4 11.9 BYD 1211 HK 104,273 SELL 49.05 19.00 219.8 96.5 85.4 13.5 7.1 7.8 90.2 Dongfeng Motor 489 HK 14,803 HOLD 13.32 14.00 8.6 8.2 7.7 7.9 1.0 16.5 (17.1) Geely 175 HK 4,598 BUY 4.05 5.50 20.0 9.8 8.3 15.5 0.6 13.4 (24.9) Great Wall Motor 2333 HK 109,889 BUY 54.30 69.0 16.4 11.6 8.9 22.5 0.5 30.0 2.3 Guangzhou Auto 2238 HK 55,788 HOLD 8.20 9.00 13.3 13.4 11.0 16.6 0.8 10.9 (7.3) Sector 13.7 10.7 9.0 16.2 0.7 20.1 (7.0)
Source: Bloomberg, UOB Kay Hian
Tuesday , 12 May 2015
5 Refer to last page for important disclosures.
R e g i o n a l M o r n i n g N o t e s
GAC – sales slowed in April, but still positive. Sales growth of GQ Honda and GAC Toyota slowed from 70% and 27.5% yoy in 1Q15 to 27% and 12% yoy in Apr 15, still a decent growth. Looking ahead, the sales ramp-up of the New Highlander will likely spur sales and earnings of GAC Toyota. However, the sedan product lines – Honda Accord/Fit, Toyota Camry/Levin – remain under pressure.
Geely – robust domestic sales, weakened exports. Geely saw wholesales shipment growth slow from 55% yoy in 1Q15 to 12% yoy in Apr 15, as the yoy decline in export sales expanded from 22% yoy in 1Q15 to 84% yoy in Apr 15. Excluding export, domestic sales still grew 57% yoy to 38,618 units in Apr 15, representing 96% of total sales. Looking ahead, Geely’s sales will be driven by the GC9 and two SUV models that will be launched by 2H15.
ACTIONS
Maintain BUY on GWM. Given GWM’s leading position in the faster-growing SUV segment and strong SUV product pipelines in the next couple of years, we maintain GWM as a BUY. Our target price of HK$69.00 for GWM is based on 11x 2016F PE, 1SD above historical mean given prospective above-average earnings growth.
Upgrade Geely from HOLD to BUY, given the prospective strong product pipelines built on Volvo technologies. We raise target price from HK$4.50 (11x 2015F PE) to HK$5.50 (11x 2016F PE) by rolling over the base year from 2015 to 2016 and keep the target forward PE at 11x.
Downgrade DFM from BUY to HOLD, given unexpected sluggish sales of the old models and margin pressure from price competition. We cut EPS for 2015/2016/2017 by 10%/14%/14% to Rmb1.30/Rmb1.38/Rmb1.52 respectively. We lower target price from HK$15.00 (9x 2015F PE) to HK$14.00 (8x 2016F PE), as we roll over the base year from 2015 to 2016 and cut target PE multiple from 9x to 8x given slower earnings growth. Entry price is HK$12.0.
Maintain HOLD on GAC, give fair valuation. We roll over the base year for valuation from 2015 to 2016 and keep target PE multiple at 11x, which results in an increase in target price from HK$8.50 (11x 2015F PE) to HK$9.00 (11x 2016F PE). Entry price is HK$7.50.
SECTOR CATALYSTS
Release of sustained strong sales of GWM and Geely will boost their stock prices. The sustained weak sales momentum and quarter results of BMW Brilliance would dampen Brilliance’s stock price.
RISKS
Macro risk. Severe credit tightening would hurt auto sales hard. The shrinkage of bank notes had already affected sales of those carmakers with long bill receivable days, eg GWM and Geely. If car loans were affected, sales of premium cars would also be hit.
Geopolitical risk. The deterioration of Sino-Japan relations may trigger anti-Japanese riots in China, which could hit Japanese car sales in China. In this case, DFM and GAC would be affected the most.
TOP PICKS
Wholesales Retail Channel
1Q15 Apr 15 1Q15 Apr 15 Mar 15 Apr 15
BMW B illi
71,428 22,310 71,900 24,050 25 23
yoy chg (%) 6.5% -10% 15% 4% -25% -33%
DF Nissan 189,400 78,707 246,802
71,148 45 48
yoy chg (%) -11% -14% 26% 5% -39% 7%
DF Honda 68,400 30,000*
89,500 27,531 37 40
yoy chg (%) -17% -7% 15.5% -6% -36% -4%
DF PSA 180,616 58,000*
175,685
55,711 40 44
yoy chg (%) 9% -3% 12% -6% 43% -4%
GQ Honda 96,527 48,352 158,000*
44,015 15 18
yoy chg (%) 18% 85% 70% 27% -66% -58%
GAC Toyota 81,521 36,016 98,000*
33,000 35 41
yoy chg (%) -6% 20% 27.5% 12% -25% -17%
GWM ( l t)
216,372 75,991 191,722
65,987 n.a. n.a.
yoy chg (%) 24% 40% n.a. n.a. n.a. n.a.
GWM (total) 221,027 78,258 n.a. n.a. n.a. n.a.
yoy chg (%) 18% 32% n.a. n.a. n.a. n.a.
Geely ( l t)
130,179 38,618 153,046
35,000 34 42
yoy chg (%) 68% 45% 51% 62% -40% -57%
Geely (total) 140,525 40,090 n.a. n.a. n.a. n.a. yoy chg (%) 55% 12% n.a. n.a. n.a. n.a.
Source: China Passenger Car Association (CPCA), China Association of Automobile Manufacturers (CAAM), UOB Kay Hian
Tuesday , 12 May 2015
6 Refer to last page for important disclosures.
R e g i o n a l M o r n i n g N o t e s
COMPANY UPDATE HOLD
(Downgraded)
Share Price HK$13.32
Target Price HK$14.00
Upside +5.1%
(Previous TP HK$15.00)
COMPANY DESCRIPTION Dongfeng Motor, via its JVs, produces and sells automobiles under the brands of Nissan, Honda, Peugeot, Citroen, Mitsubishi and Fiat in China.
STOCK DATA GICS sector Automobile
Bloomberg ticker: 489 HK
Shares issued (m): 8,616Market cap (HK$m): 114,765Market cap (US$m): 14,713
3-mth avg daily t'over (US$m): 31.4
Price Performance (%) 52-week high/low HK$15.20/HK$10.00
1mth 3mth 6mth 1yr YTD
(3.5) 15.6 20.2 30.1 21.3 Major Shareholders %
Dongfeng Motor Corp 66.86
FY15 NAV/Share (Rmb) 11.4
FY15 Net Cash/Share (Rmb) 4.6
PRICE CHART
90
100
110
120
130
140
150
160
9
10
11
12
13
14
15
16
(%)(lcy)DONGFENG MOTOR GRP CO LTD-H
DONGFENG MOTOR GRP CO LTD-H/HSI INDEX
0
20
40
60
May 14 Jul 14 Sep 14 Nov 14 Jan 15 Mar 15 May 15
Volume (m)
Source: Bloomberg
ANALYST
Ken Lee +852 2236 6760 [email protected]
Dongfeng Motor (489 HK)
New Model Launches Overwhelmed By Weak Old Models
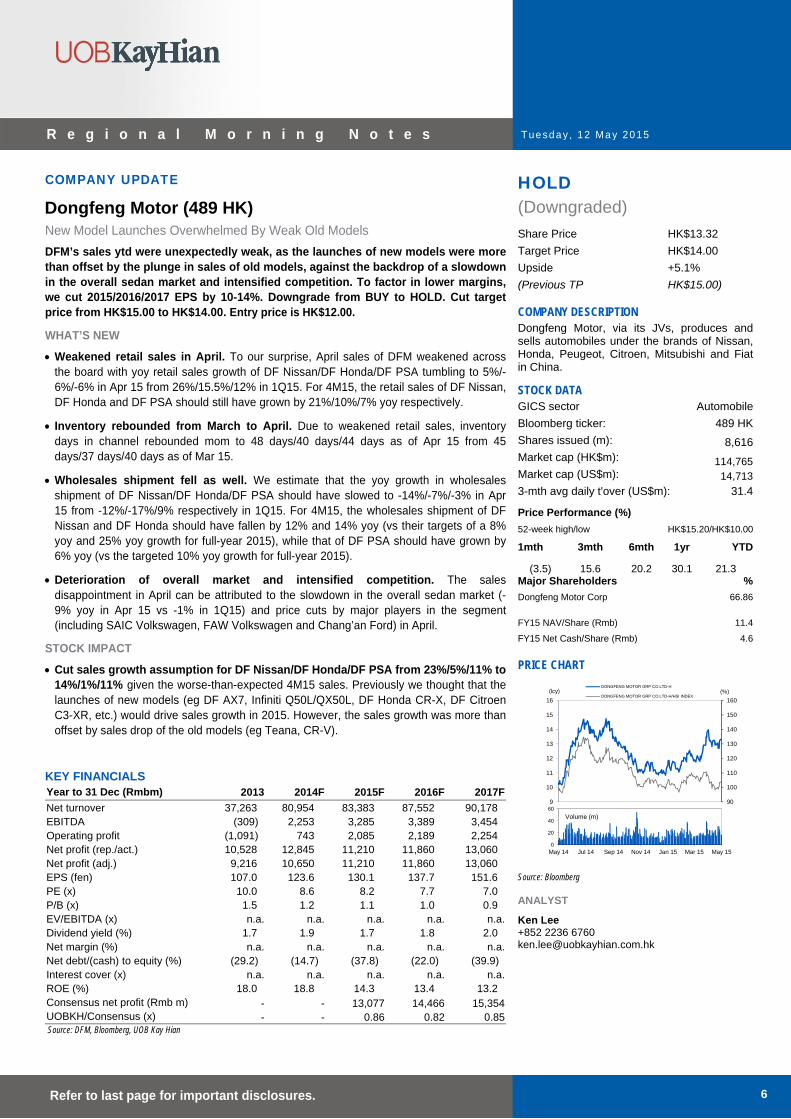
DFM’s sales ytd were unexpectedly weak, as the launches of new models were more than offset by the plunge in sales of old models, against the backdrop of a slowdown in the overall sedan market and intensified competition. To factor in lower margins, we cut 2015/2016/2017 EPS by 10-14%. Downgrade from BUY to HOLD. Cut target price from HK$15.00 to HK$14.00. Entry price is HK$12.00.
WHAT’S NEW
Weakened retail sales in April. To our surprise, April sales of DFM weakened across the board with yoy retail sales growth of DF Nissan/DF Honda/DF PSA tumbling to 5%/-6%/-6% in Apr 15 from 26%/15.5%/12% in 1Q15. For 4M15, the retail sales of DF Nissan, DF Honda and DF PSA should still have grown by 21%/10%/7% yoy respectively.
Inventory rebounded from March to April. Due to weakened retail sales, inventory days in channel rebounded mom to 48 days/40 days/44 days as of Apr 15 from 45 days/37 days/40 days as of Mar 15.
Wholesales shipment fell as well. We estimate that the yoy growth in wholesales shipment of DF Nissan/DF Honda/DF PSA should have slowed to -14%/-7%/-3% in Apr 15 from -12%/-17%/9% respectively in 1Q15. For 4M15, the wholesales shipment of DF Nissan and DF Honda should have fallen by 12% and 14% yoy (vs their targets of a 8% yoy and 25% yoy growth for full-year 2015), while that of DF PSA should have grown by 6% yoy (vs the targeted 10% yoy growth for full-year 2015).
Deterioration of overall market and intensified competition. The sales disappointment in April can be attributed to the slowdown in the overall sedan market (-9% yoy in Apr 15 vs -1% in 1Q15) and price cuts by major players in the segment (including SAIC Volkswagen, FAW Volkswagen and Chang’an Ford) in April.
STOCK IMPACT
Cut sales growth assumption for DF Nissan/DF Honda/DF PSA from 23%/5%/11% to 14%/1%/11% given the worse-than-expected 4M15 sales. Previously we thought that the launches of new models (eg DF AX7, Infiniti Q50L/QX50L, DF Honda CR-X, DF Citroen C3-XR, etc.) would drive sales growth in 2015. However, the sales growth was more than offset by sales drop of the old models (eg Teana, CR-V).
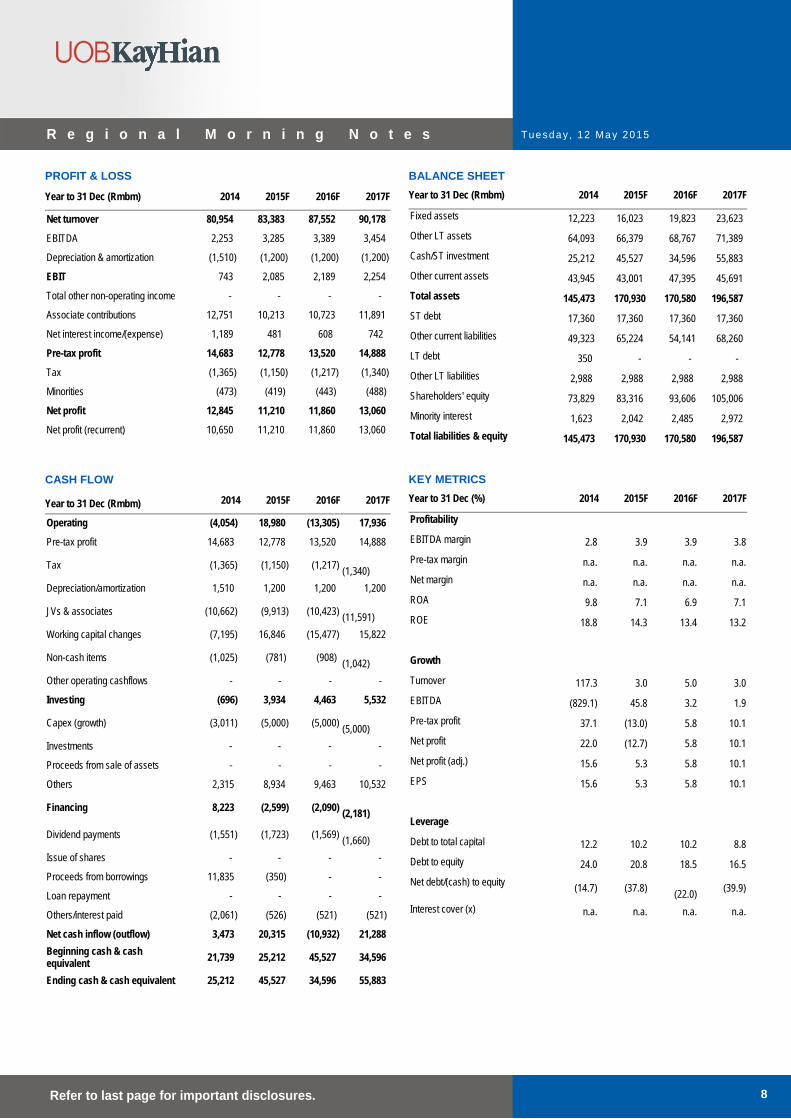
KEY FINANCIALS Year to 31 Dec (Rmbm) 2013 2014F 2015F 2016F 2017F
Net turnover 37,263 80,954 83,383 87,552 90,178 EBITDA (309) 2,253 3,285 3,389 3,454 Operating profit (1,091) 743 2,085 2,189 2,254 Net profit (rep./act.) 10,528 12,845 11,210 11,860 13,060 Net profit (adj.) 9,216 10,650 11,210 11,860 13,060 EPS (fen) 107.0 123.6 130.1 137.7 151.6 PE (x) 10.0 8.6 8.2 7.7 7.0 P/B (x) 1.5 1.2 1.1 1.0 0.9 EV/EBITDA (x) n.a. n.a. n.a. n.a. n.a. Dividend yield (%) 1.7 1.9 1.7 1.8 2.0 Net margin (%) n.a. n.a. n.a. n.a. n.a. Net debt/(cash) to equity (%) (29.2) (14.7) (37.8) (22.0) (39.9) Interest cover (x) n.a. n.a. n.a. n.a. n.a. ROE (%) 18.0 18.8 14.3 13.4 13.2 Consensus net profit (Rmb m) - - 13,077 14,466 15,354UOBKH/Consensus (x) - - 0.86 0.82 0.85Source: DFM, Bloomberg, UOB Kay Hian
Tuesday , 12 May 2015
7 Refer to last page for important disclosures.
R e g i o n a l M o r n i n g N o t e s
Lower margin. Given the slowdown in the sedan market and intensified competition, we believe DFM will need to provide more price discount to stimulate sales. We cut the net margin assumption on the JVs for 2015/2016/2017 from 4.8%/4.8%/4.8% to 4.2%/3.9%/3.9% respectively.
EARNINGS REVISION/RISK
Cut 2015-16 EPS by 10-14%. Given the aforementioned lower sales and margin assumption, we cut our core EPS forecasts for 2015/2016/2017 by 10%/14%/14% to Rmb1.30/Rmb1.38/Rmb1.52 respectively. Our forecasts imply a core EPS growth of 5%/6%/10% in 2015/2016/2017 respectively, which are 14-18% below consensus, given our lower margin assumptions.
PSA as a swing factor. DFM acquired a 14% stake in PSA for €800m in 2014 and since 2Q14, DFM has booked in PSA as an associate. PSA made a €706m net loss in 2014. However, DFM booked Rmb2.09b in shared profit from associates in 2014, by virtue of the Rmb2,055m in revaluation gain from its investment in PSA, given the PSA stock price rally. From 2015, PSA’s profit/loss will start to impact DFM’s bottom-line. While the street expects a turnaround from PSA, we assume zero profit contribution from PSA. If PSA registers a loss again in the next few years, this would hurt DFM’s bottom-line. We estimate that a €100m in net profit (loss) for PSA would translate into a Rmb125m in shared profit for DFM, or 1% of 2015 bottom-line.
Geopolitics is a major risk. Risk to our earnings estimates will be mainly geopolitics, eg Japanese car sales in China could be hurt by large-scale anti-Japanese riots as seen in Sep 12. However, as long as the escalating Sino-Japan tension as a result of the Diaoyu Islands (Senkaku Islands in Japanese) dispute or other issues do not trigger such riots in China, sales of Japanese cars in the country should not be affected.
VALUATION/RECOMMENDATION
Downgrade from BUY to HOLD. Based on our latest EPS estimates, the stock now trades at 8.2x 2015F PE and 7.7x 2016F PE, compared with historical mean of 9x. Given the prospective slower-than-historical average earnings growth (merely 5-6% in 2015-16 vs >10% historically), we cut the target PE multiple from 9x to 8x (a discount to historical mean). Besides, we roll over the base year for valuation from 2015 to 2016. That results in a cut in target price from HK$15.00 to HK$14.00. Given limited upside, we downgrade DFM from BUY to HOLD.
Tuesday , 12 May 2015
8 Refer to last page for important disclosures.
R e g i o n a l M o r n i n g N o t e s
PROFIT & LOSS
Year to 31 Dec (Rmbm) 2014 2015F 2016F 2017F
Net turnover 80,954 83,383 87,552 90,178
EBITDA 2,253 3,285 3,389 3,454
Depreciation & amortization (1,510) (1,200) (1,200) (1,200)
EBIT 743 2,085 2,189 2,254
Total other non-operating income - - - -
Associate contributions 12,751 10,213 10,723 11,891
Net interest income/(expense) 1,189 481 608 742
Pre-tax profit 14,683 12,778 13,520 14,888
Tax (1,365) (1,150) (1,217) (1,340)
Minorities (473) (419) (443) (488)
Net profit 12,845 11,210 11,860 13,060
Net profit (recurrent) 10,650 11,210 11,860 13,060
BALANCE SHEET Year to 31 Dec (Rmbm) 2014 2015F 2016F 2017F
Fixed assets 12,223 16,023 19,823 23,623
Other LT assets 64,093 66,379 68,767 71,389
Cash/ST investment 25,212 45,527 34,596 55,883
Other current assets 43,945 43,001 47,395 45,691
Total assets 145,473 170,930 170,580 196,587
ST debt 17,360 17,360 17,360 17,360
Other current liabilities 49,323 65,224 54,141 68,260
LT debt 350 - - -
Other LT liabilities 2,988 2,988 2,988 2,988
Shareholders' equity 73,829 83,316 93,606 105,006
Minority interest 1,623 2,042 2,485 2,972
Total liabilities & equity 145,473 170,930 170,580 196,587
CASH FLOW
Year to 31 Dec (Rmbm) 2014 2015F 2016F 2017F
Operating (4,054) 18,980 (13,305) 17,936
Pre-tax profit 14,683 12,778 13,520 14,888
Tax (1,365) (1,150) (1,217) (1,340)
Depreciation/amortization 1,510 1,200 1,200 1,200
JVs & associates (10,662) (9,913) (10,423) (11,591)
Working capital changes (7,195) 16,846 (15,477) 15,822
Non-cash items (1,025) (781) (908) (1,042)
Other operating cashflows - - - -
Investing (696) 3,934 4,463 5,532
Capex (growth) (3,011) (5,000) (5,000) (5,000)
Investments - - - -
Proceeds from sale of assets - - - -
Others 2,315 8,934 9,463 10,532
Financing 8,223 (2,599) (2,090) (2,181)
Dividend payments (1,551) (1,723) (1,569) (1,660)
Issue of shares - - - -
Proceeds from borrowings 11,835 (350) - -
Loan repayment - - - -
Others/interest paid (2,061) (526) (521) (521)
Net cash inflow (outflow) 3,473 20,315 (10,932) 21,288
Beginning cash & cash equivalent 21,739 25,212 45,527 34,596
Ending cash & cash equivalent 25,212 45,527 34,596 55,883
KEY METRICS Year to 31 Dec (%) 2014 2015F 2016F 2017F
Profitability
EBITDA margin 2.8 3.9 3.9 3.8
Pre-tax margin n.a. n.a. n.a. n.a.
Net margin n.a. n.a. n.a. n.a.
ROA 9.8 7.1 6.9 7.1
ROE 18.8 14.3 13.4 13.2
Growth
Turnover 117.3 3.0 5.0 3.0
EBITDA (829.1) 45.8 3.2 1.9
Pre-tax profit 37.1 (13.0) 5.8 10.1
Net profit 22.0 (12.7) 5.8 10.1
Net profit (adj.) 15.6 5.3 5.8 10.1
EPS 15.6 5.3 5.8 10.1
Leverage
Debt to total capital 12.2 10.2 10.2 8.8
Debt to equity 24.0 20.8 18.5 16.5
Net debt/(cash) to equity (14.7) (37.8) (22.0)
(39.9)
Interest cover (x) n.a. n.a. n.a. n.a.
Tuesday , 12 May 2015
9 Refer to last page for important disclosures.
R e g i o n a l M o r n i n g N o t e s
SECTOR UPDATE
Retail - Indonesia Aprindo: What Will Work In The Retail Sector In 2015
The Indonesia Retailers Association views the key drivers for success in 2015 as: a) retailers who expand into eastern Indonesia will enjoy high SSS growth, b) local products are key, c) caps on store count, zoning and franchise are not yet applied on a wide scale, and d) discounting is still very important. The potential beneficiaries are LPPF and MPPA while ANRT could lose out due to the ban on alcohol sales in minimarts. Maintain MARKET WEIGHT on the sector.
WHAT’S NEW
Slowdown in SSS growth and retail sales. In 2014, Aprindo said Indonesia retailers generated Rp168t in sales and believe sales would grow only 6% yoy to Rp178t in 2015. The slow growth is due to weak purchasing power which has hit retailers, who are expected to report an average same-store sales (SSS) growth of about 5%.
Strong SSS growth in eastern Indonesia. Aprindo said Matahari Department Stores could generate SSS growth of above 10% in 2014 because of its expansion into eastern Indonesia. There is virtually no competition while there is actually untapped purchasing power there. MPPA and LPPF have done very well in the cities such as Kupang and Jayapura. According to LPPF, its 10% SSS growth was because of the middle class in Indonesia. (Note 1Q15 SSS growth of LPPF slowed to 5.4% while RALS’s SSS declined 3.3% yoy)
To succeed: Localised product and knowledge. According to Aprindo, retailers will need local products and knowledge to succeed in Indonesia. Merchandises in Jakarta are different than those in Makassar and retailers must work with local suppliers to tap into the local markets. Taste is different from region to region and fresh vegetables and fruits have to be sourced locally as there is no nationwide cold storage distribution. Aprindo explains that local knowledge is the reason behind the success of regional retailers such as Yogya and Macan Yaohan.
Short-term pressure on SSS growth at minimarts as the alcohol ban takes effect. Aprindo views SSS growth of minimarkets and convenience stores could slow as the nationwide ban on selling alcoholic beverages in minimarkets takes effect. Drinks make up 11-12% of all minimarkets’ sales and of the 11-12% sales, 35-40% come from alcoholic beverages (beer, spirit, wine etc). Selling alcoholic beverages in supermarkets and hypermarkets is still allowed.
Potential beneficiaries: LPPF and MPPA; potential losers: AMRT, ACES. The key takeaway from our meeting is that LPPF and MPPA could benefit from their expansion into eastern Indonesia, while AMRT could see slower SSS growth due to the nationwide ban on alcoholic beverage sales in minimarkets ACES could be affected if the 80% local content rule is enforced upon retailers, and it is currently seeking for an exemption.
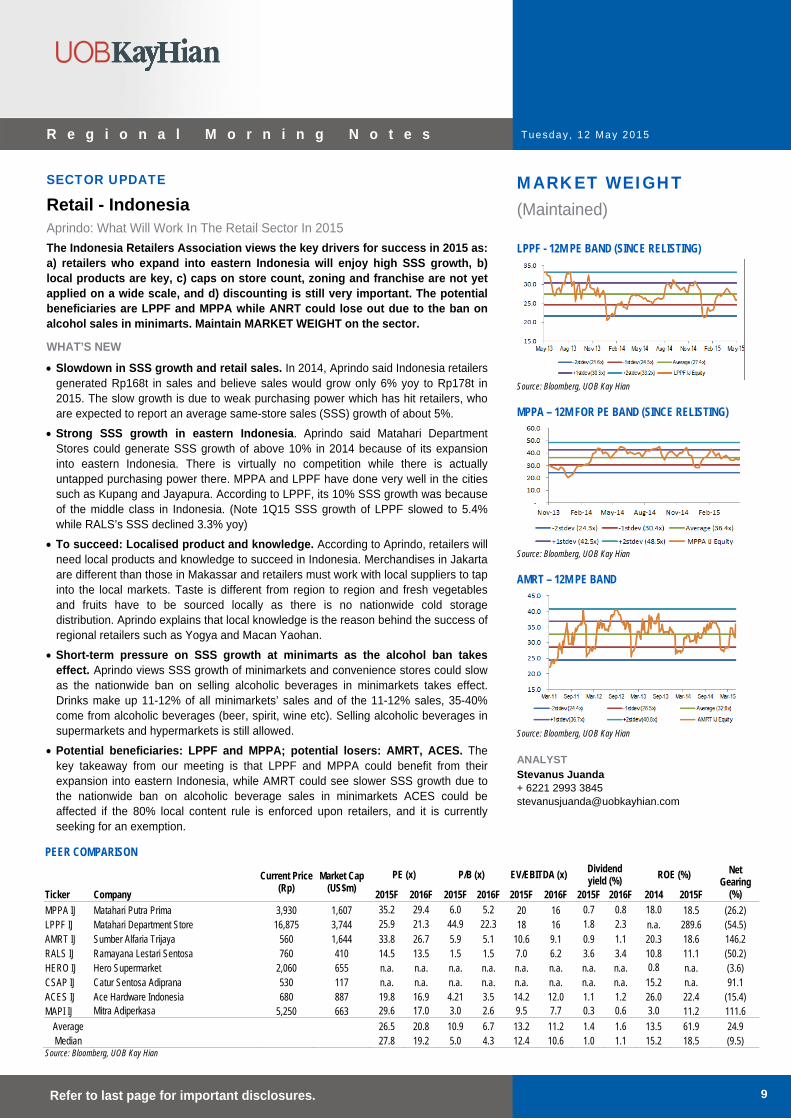
MARKET WEIGHT (Maintained) LPPF - 12M PE BAND (SINCE RELISTING)
Source: Bloomberg, UOB Kay Hian
MPPA – 12M FOR PE BAND (SINCE RELISTING)
Source: Bloomberg, UOB Kay Hian
AMRT – 12M PE BAND
Source: Bloomberg, UOB Kay Hian ANALYST
Stevanus Juanda + 6221 2993 3845 [email protected]
PEER COMPARISON
Current Price (Rp)
Market Cap (US$m)
PE (x) P/B (x) EV/EBITDA (x) Dividend yield (%)
ROE (%) Net Gearing
(%) Ticker Company 2015F 2016F 2015F 2016F 2015F 2016F 2015F 2016F 2014 2015F
MPPA IJ Matahari Putra Prima 3,930 1,607 35.2 29.4 6.0 5.2 20 16 0.7 0.8 18.0 18.5 (26.2) LPPF IJ Matahari Department Store 16,875 3,744 25.9 21.3 44.9 22.3 18 16 1.8 2.3 n.a. 289.6 (54.5) AMRT IJ Sumber Alfaria Trijaya 560 1,644 33.8 26.7 5.9 5.1 10.6 9.1 0.9 1.1 20.3 18.6 146.2 RALS IJ Ramayana Lestari Sentosa 760 410 14.5 13.5 1.5 1.5 7.0 6.2 3.6 3.4 10.8 11.1 (50.2) HERO IJ Hero Supermarket 2,060 655 n.a. n.a. n.a. n.a. n.a. n.a. n.a. n.a. 0.8 n.a. (3.6) CSAP IJ Catur Sentosa Adiprana 530 117 n.a. n.a. n.a. n.a. n.a. n.a. n.a. n.a. 15.2 n.a. 91.1 ACES IJ Ace Hardware Indonesia 680 887 19.8 16.9 4.21 3.5 14.2 12.0 1.1 1.2 26.0 22.4 (15.4) MAPI IJ Mitra Adiperkasa 5,250 663 29.6 17.0 3.0 2.6 9.5 7.7 0.3 0.6 3.0 11.2 111.6
Average 26.5 20.8 10.9 6.7 13.2 11.2 1.4 1.6 13.5 61.9 24.9 Median 27.8 19.2 5.0 4.3 12.4 10.6 1.0 1.1 15.2 18.5 (9.5)
Source: Bloomberg, UOB Kay Hian
Tuesday , 12 May 2015
10 Refer to last page for important disclosures.
R e g i o n a l M o r n i n g N o t e s
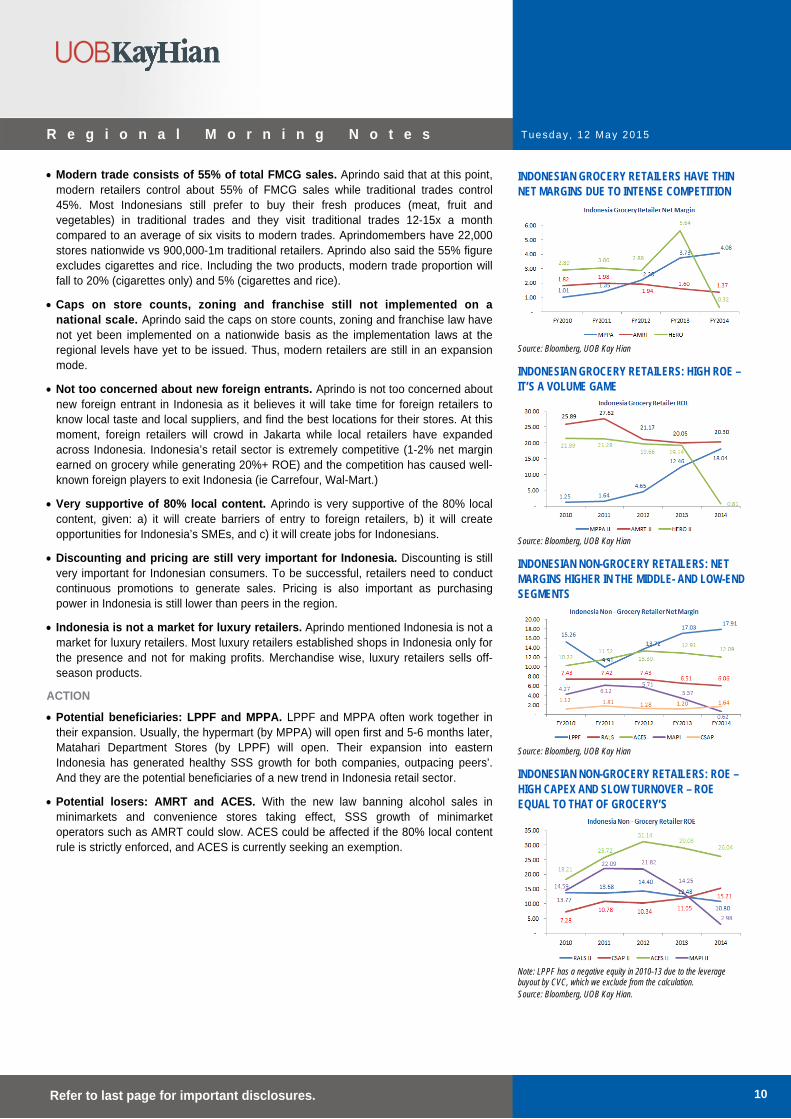
Modern trade consists of 55% of total FMCG sales. Aprindo said that at this point, modern retailers control about 55% of FMCG sales while traditional trades control 45%. Most Indonesians still prefer to buy their fresh produces (meat, fruit and vegetables) in traditional trades and they visit traditional trades 12-15x a month compared to an average of six visits to modern trades. Aprindomembers have 22,000 stores nationwide vs 900,000-1m traditional retailers. Aprindo also said the 55% figure excludes cigarettes and rice. Including the two products, modern trade proportion will fall to 20% (cigarettes only) and 5% (cigarettes and rice).
Caps on store counts, zoning and franchise still not implemented on a national scale. Aprindo said the caps on store counts, zoning and franchise law have not yet been implemented on a nationwide basis as the implementation laws at the regional levels have yet to be issued. Thus, modern retailers are still in an expansion mode.
Not too concerned about new foreign entrants. Aprindo is not too concerned about new foreign entrant in Indonesia as it believes it will take time for foreign retailers to know local taste and local suppliers, and find the best locations for their stores. At this moment, foreign retailers will crowd in Jakarta while local retailers have expanded across Indonesia. Indonesia’s retail sector is extremely competitive (1-2% net margin earned on grocery while generating 20%+ ROE) and the competition has caused well-known foreign players to exit Indonesia (ie Carrefour, Wal-Mart.)
Very supportive of 80% local content. Aprindo is very supportive of the 80% local content, given: a) it will create barriers of entry to foreign retailers, b) it will create opportunities for Indonesia’s SMEs, and c) it will create jobs for Indonesians.
Discounting and pricing are still very important for Indonesia. Discounting is still very important for Indonesian consumers. To be successful, retailers need to conduct continuous promotions to generate sales. Pricing is also important as purchasing power in Indonesia is still lower than peers in the region.
Indonesia is not a market for luxury retailers. Aprindo mentioned Indonesia is not a market for luxury retailers. Most luxury retailers established shops in Indonesia only for the presence and not for making profits. Merchandise wise, luxury retailers sells off-season products.
ACTION
Potential beneficiaries: LPPF and MPPA. LPPF and MPPA often work together in their expansion. Usually, the hypermart (by MPPA) will open first and 5-6 months later, Matahari Department Stores (by LPPF) will open. Their expansion into eastern Indonesia has generated healthy SSS growth for both companies, outpacing peers’. And they are the potential beneficiaries of a new trend in Indonesia retail sector.
Potential losers: AMRT and ACES. With the new law banning alcohol sales in minimarkets and convenience stores taking effect, SSS growth of minimarket operators such as AMRT could slow. ACES could be affected if the 80% local content rule is strictly enforced, and ACES is currently seeking an exemption.
INDONESIAN GROCERY RETAILERS HAVE THIN NET MARGINS DUE TO INTENSE COMPETITION
Source: Bloomberg, UOB Kay Hian
INDONESIAN GROCERY RETAILERS: HIGH ROE – IT’S A VOLUME GAME
Source: Bloomberg, UOB Kay Hian
INDONESIAN NON-GROCERY RETAILERS: NET MARGINS HIGHER IN THE MIDDLE- AND LOW-END SEGMENTS
Source: Bloomberg, UOB Kay Hian
INDONESIAN NON-GROCERY RETAILERS: ROE – HIGH CAPEX AND SLOW TURNOVER – ROE EQUAL TO THAT OF GROCERY’S
Note: LPPF has a negative equity in 2010-13 due to the leverage buyout by CVC, which we exclude from the calculation. Source: Bloomberg, UOB Kay Hian.
Tuesday , 12 May 2015
11 Refer to last page for important disclosures.
R e g i o n a l M o r n i n g N o t e s
SECTOR UPDATE
Plantation – Malaysia 1Q15 Results Preview: Another Weak Quarter
1Q is always the weakest quarter due to seasonally weak production. 1Q15 is likely to be weaker than usual as production was affected by the lagged impact from the drought in 1Q14 and the disruption of harvesting activities and transportation due to heavy rain and monsoon floods. With this, coupled with low CPO prices, companies are likely to report weak yoy and qoq results. Refiners are also affected by thin or negative margins due to insufficient CPO supply. Maintain MARKET WEIGHT.
WHAT’S NEW
Seasonally weak quarter... 1Q is always the weakest quarter for plantation companies as it is the low production season. However, we expect much weaker performance from companies in 1Q15 with weaker qoq and yoy results due to the low production recorded and low CPO prices during the quarter. Pure planters are expected to report weaker performance as compared with integrated players, as pure planters tend to be hit the most with low production and low prices.
…with low production… Besides the seasonal factor, companies’ FFB production levels were also hit by the impact from the monsoon flood in Dec 14 and lagged impact from the prolonged dry weather in 1Q14. This resulted in a decline in production by as much as 32% qoq and 20% yoy in 1Q15.
…and low CPO prices. Malaysia reported a 15.2% yoy decline in CPO ASP in 1Q15. This would add more pressure to plantation companies. Although CPO ASP has recovered by 4% qoq, it will be offset by the sharp qoq decline in production.
Cost pressure further drag to net profit. Due to the dry weather in 1Q14, most plantation companies have delayed their fertiliser application. However, the manuring process was back to norm in 1Q15. This would result in higher yoy growth in cost of production. Besides that, as compared with the previous year, fertiliser prices have increased by about 5%. These would impact the companies’ performance in 1Q15.
ACTION
Maintain MARKET WEIGHT. CPO prices are likely to stay range-bound in the absence of strong re-rating catalysts. If demand stays weak, there will be downside risk to our CPO price assumptions.
ASSUMPTION CHANGES
CPO price assumptions are currently under review. Our current earnings expectation are based on CPO price assumptions of RM2,525/tonne for 2015 and RM2,600/tonne for 2016. Ytd average CPO price is RM2,226/tonne (-17% yoy).
A 10% cut to our CPO price assumptions for both 2015 and 2016, will lead to an earnings decline of 11-23% for upstream players and 4-8% for integrated players.
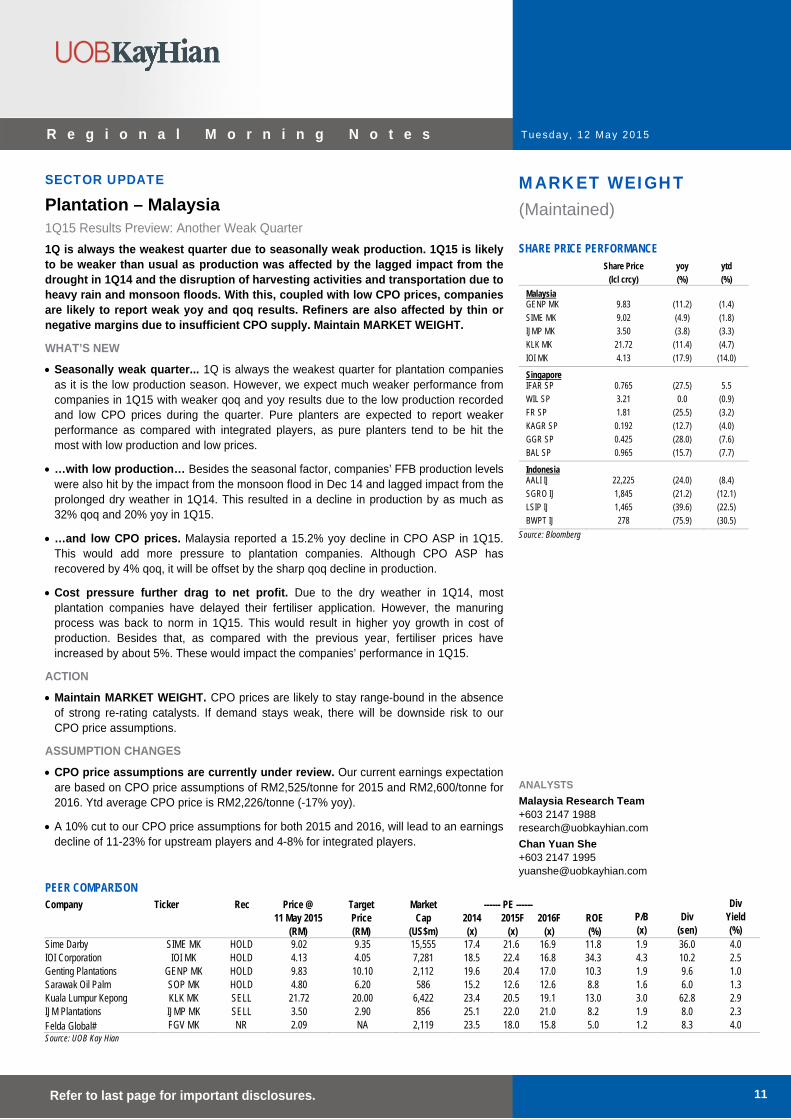
MARKET WEIGHT (Maintained) SHARE PRICE PERFORMANCE
Share Price yoy ytd
(lcl crcy) (%) (%)
Malaysia GENP MK 9.83 (11.2) (1.4)
SIME MK 9.02 (4.9) (1.8)
IJMP MK 3.50 (3.8) (3.3)
KLK MK 21.72 (11.4) (4.7)
IOI MK 4.13 (17.9) (14.0)
Singapore IFAR SP 0.765 (27.5) 5.5
WIL SP 3.21 0.0 (0.9)
FR SP 1.81 (25.5) (3.2)
KAGR SP 0.192 (12.7) (4.0)
GGR SP 0.425 (28.0) (7.6)
BAL SP 0.965 (15.7) (7.7)
Indonesia AALI IJ 22,225 (24.0) (8.4)
SGRO IJ 1,845 (21.2) (12.1)
LSIP IJ 1,465 (39.6) (22.5)
BWPT IJ 278 (75.9) (30.5)
Source: Bloomberg
ANALYSTS
Malaysia Research Team +603 2147 1988 [email protected]
Chan Yuan She +603 2147 1995 [email protected]
PEER COMPARISON Company Ticker Rec Price @ Target Market ------ PE ------ Div 11 May 2015 Price Cap 2014 2015F 2016F ROE P/B Div Yield (RM) (RM) (US$m) (x) (x) (x) (%) (x) (sen) (%) Sime Darby SIME MK HOLD 9.02 9.35 15,555 17.4 21.6 16.9 11.8 1.9 36.0 4.0 IOI Corporation IOI MK HOLD 4.13 4.05 7,281 18.5 22.4 16.8 34.3 4.3 10.2 2.5 Genting Plantations GENP MK HOLD 9.83 10.10 2,112 19.6 20.4 17.0 10.3 1.9 9.6 1.0 Sarawak Oil Palm SOP MK HOLD 4.80 6.20 586 15.2 12.6 12.6 8.8 1.6 6.0 1.3 Kuala Lumpur Kepong KLK MK SELL 21.72 20.00 6,422 23.4 20.5 19.1 13.0 3.0 62.8 2.9 IJM Plantations IJMP MK SELL 3.50 2.90 856 25.1 22.0 21.0 8.2 1.9 8.0 2.3 Felda Global# FGV MK NR 2.09 NA 2,119 23.5 18.0 15.8 5.0 1.2 8.3 4.0 Source: UOB Kay Hian
Tuesday , 12 May 2015
12 Refer to last page for important disclosures.
R e g i o n a l M o r n i n g N o t e s
ESSENTIALS
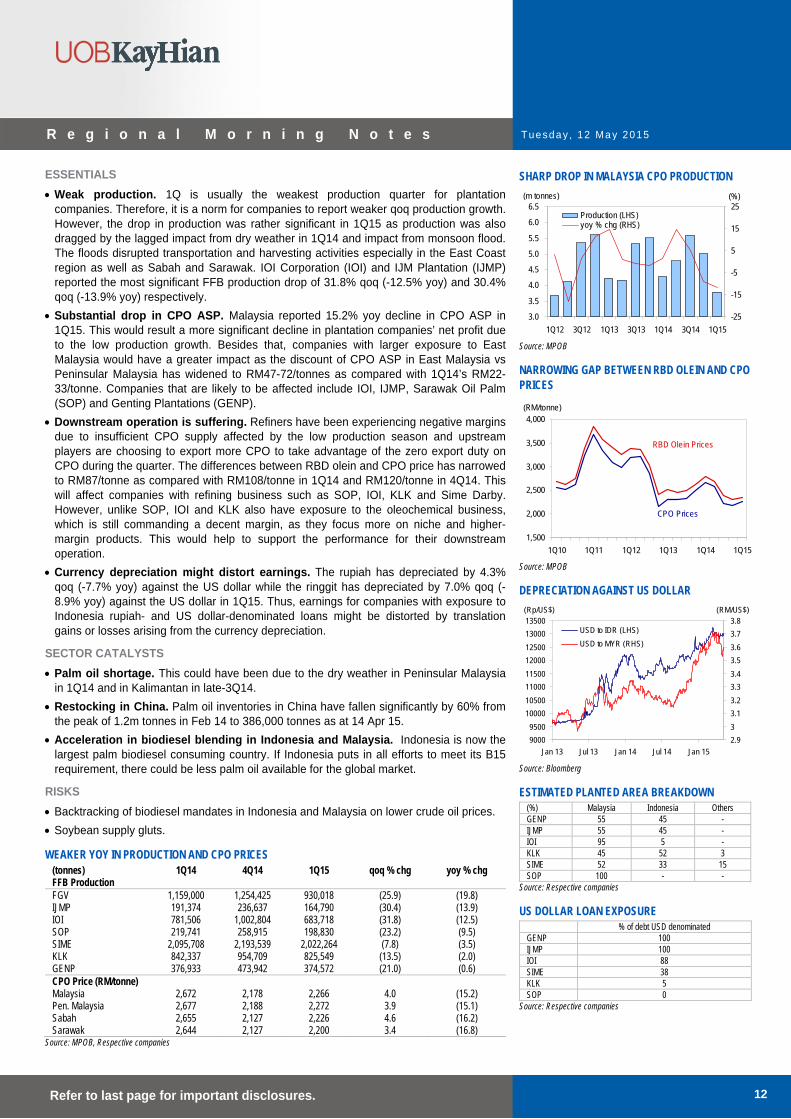
Weak production. 1Q is usually the weakest production quarter for plantation companies. Therefore, it is a norm for companies to report weaker qoq production growth. However, the drop in production was rather significant in 1Q15 as production was also dragged by the lagged impact from dry weather in 1Q14 and impact from monsoon flood. The floods disrupted transportation and harvesting activities especially in the East Coast region as well as Sabah and Sarawak. IOI Corporation (IOI) and IJM Plantation (IJMP) reported the most significant FFB production drop of 31.8% qoq (-12.5% yoy) and 30.4% qoq (-13.9% yoy) respectively.
Substantial drop in CPO ASP. Malaysia reported 15.2% yoy decline in CPO ASP in 1Q15. This would result a more significant decline in plantation companies’ net profit due to the low production growth. Besides that, companies with larger exposure to East Malaysia would have a greater impact as the discount of CPO ASP in East Malaysia vs Peninsular Malaysia has widened to RM47-72/tonnes as compared with 1Q14’s RM22-33/tonne. Companies that are likely to be affected include IOI, IJMP, Sarawak Oil Palm (SOP) and Genting Plantations (GENP).
Downstream operation is suffering. Refiners have been experiencing negative margins due to insufficient CPO supply affected by the low production season and upstream players are choosing to export more CPO to take advantage of the zero export duty on CPO during the quarter. The differences between RBD olein and CPO price has narrowed to RM87/tonne as compared with RM108/tonne in 1Q14 and RM120/tonne in 4Q14. This will affect companies with refining business such as SOP, IOI, KLK and Sime Darby. However, unlike SOP, IOI and KLK also have exposure to the oleochemical business, which is still commanding a decent margin, as they focus more on niche and higher-margin products. This would help to support the performance for their downstream operation.
Currency depreciation might distort earnings. The rupiah has depreciated by 4.3% qoq (-7.7% yoy) against the US dollar while the ringgit has depreciated by 7.0% qoq (-8.9% yoy) against the US dollar in 1Q15. Thus, earnings for companies with exposure to Indonesia rupiah- and US dollar-denominated loans might be distorted by translation gains or losses arising from the currency depreciation.
SECTOR CATALYSTS
Palm oil shortage. This could have been due to the dry weather in Peninsular Malaysia in 1Q14 and in Kalimantan in late-3Q14.
Restocking in China. Palm oil inventories in China have fallen significantly by 60% from the peak of 1.2m tonnes in Feb 14 to 386,000 tonnes as at 14 Apr 15.
Acceleration in biodiesel blending in Indonesia and Malaysia. Indonesia is now the largest palm biodiesel consuming country. If Indonesia puts in all efforts to meet its B15 requirement, there could be less palm oil available for the global market.
RISKS
Backtracking of biodiesel mandates in Indonesia and Malaysia on lower crude oil prices.
Soybean supply gluts.
WEAKER YOY IN PRODUCTION AND CPO PRICES (tonnes) 1Q14 4Q14 1Q15 qoq % chg yoy % chg FFB Production FGV 1,159,000 1,254,425 930,018 (25.9) (19.8) IJMP 191,374 236,637 164,790 (30.4) (13.9) IOI 781,506 1,002,804 683,718 (31.8) (12.5) SOP 219,741 258,915 198,830 (23.2) (9.5) SIME 2,095,708 2,193,539 2,022,264 (7.8) (3.5) KLK 842,337 954,709 825,549 (13.5) (2.0) GENP 376,933 473,942 374,572 (21.0) (0.6) CPO Price (RM/tonne) Malaysia 2,672 2,178 2,266 4.0 (15.2) Pen. Malaysia 2,677 2,188 2,272 3.9 (15.1) Sabah 2,655 2,127 2,226 4.6 (16.2) Sarawak 2,644 2,127 2,200 3.4 (16.8)
Source: MPOB, Respective companies
SHARP DROP IN MALAYSIA CPO PRODUCTION
3.0
3.5
4.0
4.5
5.0
5.5
6.0
6.5
1Q12 3Q12 1Q13 3Q13 1Q14 3Q14 1Q15
(m tonnes)
-25
-15
-5
5
15
25(%)
Production (LHS)yoy % chg (RHS)
Source: MPOB
NARROWING GAP BETWEEN RBD OLEIN AND CPO PRICES
1,500
2,000
2,500
3,000
3,500
4,000
1Q10 1Q11 1Q12 1Q13 1Q14 1Q15
(RM/tonne)
RBD Olein Prices
CPO Prices
Source: MPOB
DEPRECIATION AGAINST US DOLLAR
9000
9500
10000
10500
11000
11500
12000
12500
13000
13500
Jan 13 Jul 13 Jan 14 Jul 14 Jan 15
(Rp/US$)
2.9
3
3.1
3.2
3.3
3.4
3.5
3.6
3.7
3.8(RM/US$)
USD to IDR (LHS)
USD to MYR (RHS)
Source: Bloomberg
ESTIMATED PLANTED AREA BREAKDOWN (%) Malaysia Indonesia Others GENP 55 45 - IJMP 55 45 - IOI 95 5 - KLK 45 52 3 SIME 52 33 15 SOP 100 - -
Source: Respective companies
US DOLLAR LOAN EXPOSURE % of debt USD denominated GENP 100 IJMP 100 IOI 88 SIME 38 KLK 5 SOP 0
Source: Respective companies
Tuesday , 12 May 2015
13 Refer to last page for important disclosures.
R e g i o n a l M o r n i n g N o t e s
COMPANY UPDATE BUY
(Maintained)
Share Price RM4.30
Target Price RM4.76
Upside +10.7%
(Previous TP RM4.47)
COMPANY DESCRIPTION Casino, resort and theme park operator
STOCK DATA GICS sector Consumer Discretionary
Bloomberg ticker: GENM MK
Shares issued (m): 5,670.4
Market cap (RMm): 24,382.9
Market cap (US$m): 6,769.8
3-mth avg daily t'over (US$m): 4.1
Price Performance (%) 52-week high/low RM4.67/RM3.79
1mth 3mth 6mth 1yr YTD
(2.7) 4.9 3.1 2.6 5.7
Major Shareholders %
Genting Bhd 47.2
FY15 NAV/Share (RM) 2.93
FY15 Net Cash/Share (RM) 0.24
PRICE CHART
80
90
100
110
120
3.50
4.00
4.50
5.00
(%)(lcy)GENTING MALAYSIA BHD
GENTING MALAYSIA BHD/FBMKLCI INDEX
0
5
10
15
May 14 Jul 14 Sep 14 Nov 14 Jan 15 Mar 15 May 15
Volume (m)
Source: Bloomberg
ANALYST
Vincent Khoo, CFA +603 2147 1998 [email protected]
Genting Malaysia (GENM MK)
Proposed Stake Sale In GENHK
GENM is seeking shareholders’ approval to sell its 17.8% stake in GENHK. We see this as a mild positive on the back of estimated gains of RM1.25b-1.51b, or 21-27 sen/share, based on exit prices of US$0.33-0.38 each. GENHK shares are unlikely to reach our SOTP valuation of US$0.60/share and the sale could improve GENM’s capital management. Maintain BUY and raise our target price to RM4.76 (from RM4.47).
WHAT’S NEW
Genting Malaysia (GENM) is seeking shareholders’ approval to sell its 17.8% stake in Genting Hong Kong (GENHK) for at least US$0.33 each (see details on table overleaf).
We believe the sale process will be transparent, and will appropriately address issues, such as the deal being a potential related-party transaction The Genting Group’s controlling shareholder (Lim family), which owns 60% of GENHK, will likely make a bid for GENM’s stake.
Mildly-positive corporate exercise for GENM. We hope cash-rich GENM will be able to partially utilise the sales proceeds to modestly boost its capital-management efforts, particularly in this year when GENM celebrates the Genting Group’s 50th anniversary. GENM could pocket gains of RM1.25b-1.51b (or 21-27 sen/share) based on exit prices of US$0.33-US$0.38 each. In its announcement, GENM said the proceeds may be partially utilised to fund current expansion plans in Malaysia and/or working capital. Note that while our SOTP valuation for GENHK appears high at US$0.60/share, we expect GENHK to continue trading at significant discount to our valuation for reasons which are explained in the ensuing paragraph.
However, one may argue that the minimum sale price is a tad low, considering that the stock’s 1-year trading range is US0.34-0.41 (closing US$0.37 yesterday), and that the last time it closed below US$0.33 was in 2012.
KEY FINANCIALS Year to 31 Dec (RMm) 2013 2014 2015F 2016F 2017F
Net turnover 8,327 8,229 8,657 9,589 10,082EBITDA 2,409 2,248 2,403 2,764 3,021Operating profit 1,857 1,640 1,778 1,974 2,183Net profit (rep./act.) 1,584 1,140 1,393 1,475 1,661Net profit (adj.) 1,678 1,236 1,393 1,475 1,661EPS (sen) 28.4 20.9 23.5 24.9 28.1PE (x) 15.2 20.6 18.3 17.3 15.3P/B (x) 1.6 1.6 1.5 1.4 1.3EV/EBITDA (x) 9.6 10.3 9.6 8.3 7.6Dividend yield (%) 2.2 1.6 1.8 1.9 2.2Net margin (%) 19.0 13.9 16.1 15.4 16.5Net debt/(cash) to equity (%) (13.1) (6.8) (7.5) (12.3) (18.2)Interest cover (x) n.a. 115.9 65.1 359.1 n.a.ROE (%) 11.1 7.2 8.3 8.2 8.7Consensus net profit - - 1,431 1,613 1,801UOBKH/Consensus (x) - - 0.97 0.91 0.92Source: GENM, Bloomberg, UOB Kay Hian
Tuesday , 12 May 2015
14 Refer to last page for important disclosures.
R e g i o n a l M o r n i n g N o t e s
STOCK IMPACT
Arguments in favour of the GENHK stake are: a) monetises this long drawn investment that is not equity accounted and provides only low dividend yield, and b) in the near term, GENHK is unlikely to embark on significant capital management as potential proceeds of monetising its equity stake in the thriving US-listed Norwegian Cruise Line (NCL) would most likely be channelled to fund its ambitious expansion plans at its Asian cruise division, Star Cruises, which is facing rising competition from larger US-based cruise operators. Meanwhile, in the Philippines, our channel checks indicate that associate Travellers’s market share could have been eroded further, with competitor Solaire gaining ground and newcomer City of Dreams Manila making modest inroad.
Meanwhile, we believe GENM is on track to post a modest core profit recovery in 2015, delivering a 7% EBITDA growth, mainly reflecting the earnings recovery at its US division (lesser exceptional cost). The Malaysian casino operations, which form the bulk of the group’s EBITDA, is expected to post mid-single-digit growth in 1Q15 and 2015. We expect Genting Highlands to ramp up its marketing activities and events in conjunction with its 50th Anniversary celebrations, which could modestly lift its EBITDA.
EARNINGS REVISION/RISK
We tweak our 2015 net profit forecast slightly downwards after various adjustments.
VALUATION/RECOMMENDATION
• Maintain BUY and raise our SOTP-based target price to RM4.76 (from RM4.47), partly due to the elimination of the holding company discount (with the impending stake sale of GENHK), and implying 10.7x 2015F EV/EBITDA.
SHARE PRICE CATALYST
Better-than-expected special dividends in this year’s 50th anniversary celebrations.
Strong reception to the upcoming (in 2016) 20th Century Fox theme park which could create positive patronage spillover to its gaming operations.
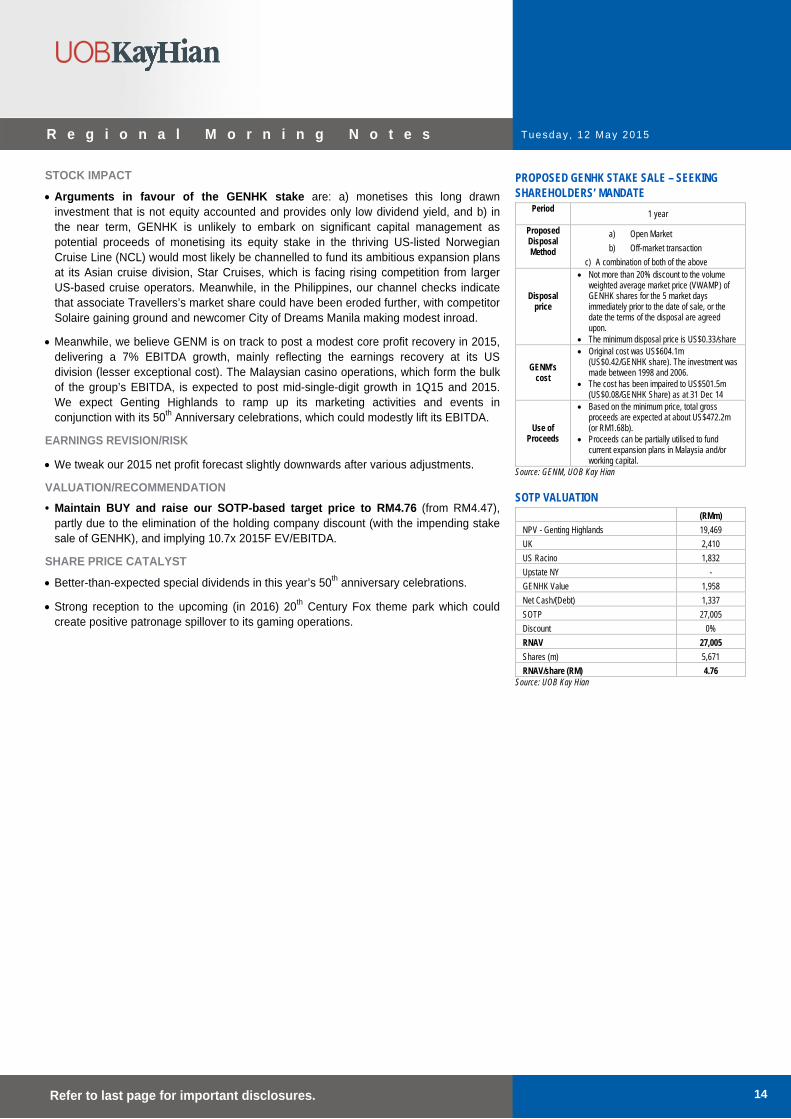
PROPOSED GENHK STAKE SALE – SEEKING SHAREHOLDERS’ MANDATE
Period 1 year
Proposed Disposal Method
a) Open Market
b) Off-market transaction
c) A combination of both of the above
Disposal price
Not more than 20% discount to the volume weighted average market price (VWAMP) of GENHK shares for the 5 market days immediately prior to the date of sale, or the date the terms of the disposal are agreed upon.
The minimum disposal price is US$0.33/share
GENM’s cost
Original cost was US$604.1m (US$0.42/GENHK share). The investment was made between 1998 and 2006.
The cost has been impaired to US$501.5m (US$0.08/GENHK Share) as at 31 Dec 14
Use of Proceeds
Based on the minimum price, total gross proceeds are expected at about US$472.2m (or RM1.68b).
Proceeds can be partially utilised to fund current expansion plans in Malaysia and/or working capital.
Source: GENM, UOB Kay Hian
SOTP VALUATION
(RMm)
NPV - Genting Highlands 19,469
UK 2,410
US Racino 1,832
Upstate NY -
GENHK Value 1,958
Net Cash/(Debt) 1,337
SOTP 27,005
Discount 0%
RNAV 27,005
Shares (m) 5,671
RNAV/share (RM) 4.76 Source: UOB Kay Hian

Tuesday , 12 May 2015
15 Refer to last page for important disclosures.
R e g i o n a l M o r n i n g N o t e s
PROFIT & LOSS Year to 31 Dec (RMm) 2014 2015F 2016F 2017F
Net turnover 8,229 8,657 9,589 10,082
EBITDA 2,248 2,403 2,764 3,021
Deprec. & amort. 608 625 791 838
EBIT 1,640 1,778 1,974 2,183
Associate contributions 0 0 0 0
Net interest income/(expense) (19) (37) (8) 31
Pre-tax profit 1,525 1,741 1,966 2,214
Tax (384) (348) (492) (554)
Minorities 0 0 0 0
Net profit 1,140 1,393 1,475 1,661
Net profit (adj.) 1,236 1,393 1,475 1,661
BALANCE SHEET Year to 31 Dec (RMm) 2014 2015F 2016F 2017F
Fixed assets 7,426 8,109 8,276 8,245
Other LT assets 8,390 8,390 8,390 8,390
Cash/ST investment 2,770 3,096 4,098 5,403
Other current assets 2,210 2,252 2,315 2,361
Total assets 20,797 21,848 23,079 24,399
ST debt 251 251 251 251
Other current liabilities 2,001 2,021 2,126 2,192
LT debt 1,411 1,411 1,411 1,411
Other LT liabilities 860 860 860 860
Shareholders' equity 16,304 17,336 18,461 19,715
Minority interest (31) (31) (31) (31)
Total liabilities & equity 20,797 21,848 23,079 24,399
CASH FLOW Year to 31 Dec (RMm) 2014 2015F 2016F 2017F
Operating 1,541 2,056 2,343 2,521
Pre-tax profit 1,525 1,741 1,966 2,214
Tax (455) (348) (492) (554)
Deprec. & amort. 608 625 791 838
Associates 0 0 0 0
Working capital changes (61) 39 78 22
Other operating cashflows (76) 0 0 0
Investing (2,055) (1,500) (1,000) (800)
Capex (growth) (1,888) (1,500) (1,000) (800)
Investments 0 0 0 0
Proceeds from sale of assets 0 0 0 0
Others (167) 0 0 0
Financing (532) (371) (369) (415)
Dividend payments (391) (371) (369) (415)
Issue of shares 0 0 0 0
Proceeds from borrowings 0 0 0 0
Loan repayment (124) 0 0 0
Others/interest paid (17) 0 0 0
Net cash inflow (outflow) (1,046) 185 975 1,305
Beginning cash & cash equivalent 3,720 2,770 2,955 3,930
Changes due to forex impact 96 0 0 0
Ending cash & cash equivalent 2,770 2,955 3,930 5,235
KEY METRICS Year to 31 Dec (%) 2014 2015F 2016F 2017F
Profitability EBITDA margin 27.3 27.8 28.8 30.0
Pre-tax margin 18.5 20.1 20.5 22.0
Net margin 13.9 16.1 15.4 16.5
ROA 5.6 6.5 6.5 7.0
ROE 7.2 8.3 8.2 8.7
Growth
Turnover (1.2) 5.2 10.8 5.1
EBITDA (6.7) 6.9 15.0 9.3
Pre-tax profit (13.7) 14.2 12.9 12.6
Net profit (28.0) 22.2 5.9 12.6
Net profit (adj.) (26.3) 12.7 5.9 12.6
EPS (26.3) 12.7 5.9 12.6
Leverage
Debt to total capital 9.3 8.8 8.3 7.8
Debt to equity 10.2 9.6 9.0 8.4
Net debt/(cash) to equity (6.8) (7.5) (12.3) (18.2)
Interest cover (x) 115.9 65.1 359.1 n.a.
Tuesday , 12 May 2015
16 Refer to last page for important disclosures.
R e g i o n a l M o r n i n g N o t e s
SECTOR UPDATE
Aviation Support Services - Singapore SATS Likely To Outperform And We Estimate A 25% Rise In Final Dividend
SIAEC, STE and SATS will release their quarterly earnings on 12, 13 and 14 May respectively. We expect SIAEC to report a 19% yoy decline in 4QFY15 net profit and SATS to report flat 4QFY15 net profit. STE’s earnings could be marginally better in 1QFY16, but the stock has already outperformed, rising 8% ytd. SATS is now our top pick in the sector, but our target price is under review. Maintain UNDERWEIGHT.
WHAT’S NEW
We preview the quarterly earnings of SIAEC, STE and SATS.
SIA ENGINEERING 4QFY15 EARNINGS ESTIMATES Year to 31 Mar (S$m) 4QFY15 yoy % chg FY15 yoy% chg Remarks (4Q) Revenue 294.1 (5.5) 1,138.7 (3.4) Lower airframe revenue Operating Profit 27.6 (19.3) 88.5 (23.4) Higher subcontract costs Op Profit Margin (%) 9.4 -1.6ppt 7.8 -2.ppt Associates/JVs 28.7 4.4 113.7 (30.1) Wild card, but assuming a
recovery Profit Before Tax 59.1 (8.5) 217.9 (25.9) Net Profit 53.0 (18.7) 194.9 (26.6)
Source: UOB Kay Hian
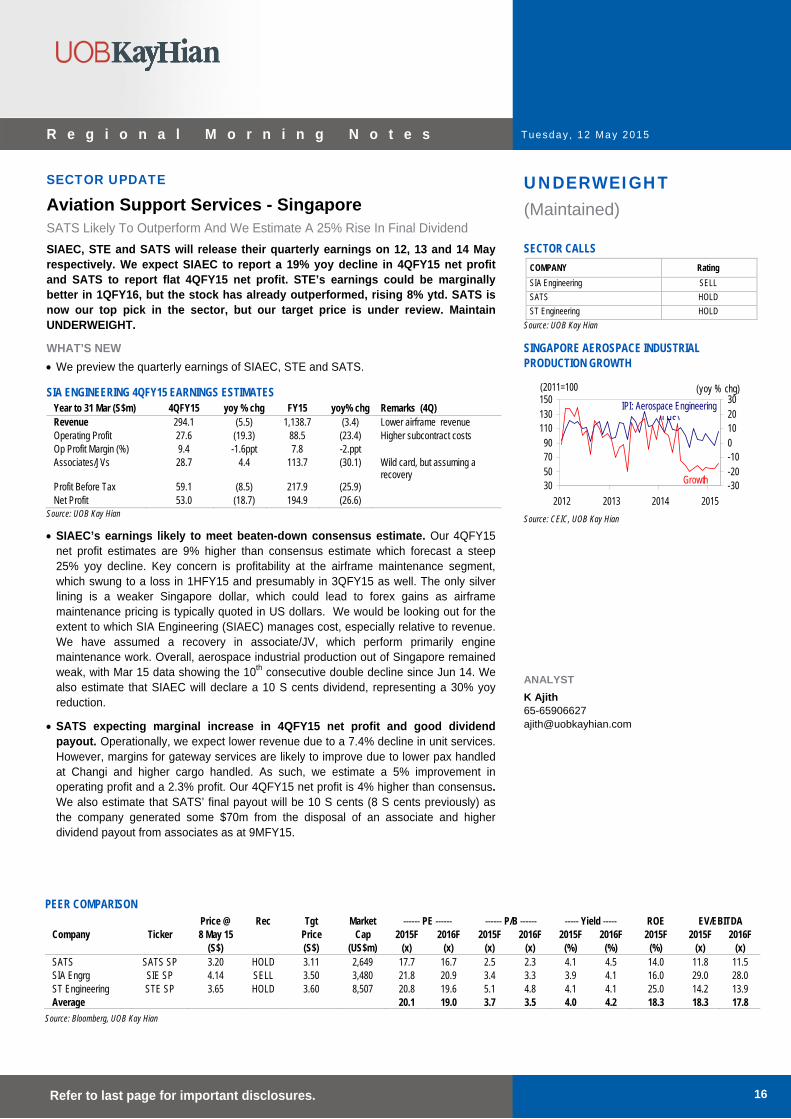
SIAEC’s earnings likely to meet beaten-down consensus estimate. Our 4QFY15 net profit estimates are 9% higher than consensus estimate which forecast a steep 25% yoy decline. Key concern is profitability at the airframe maintenance segment, which swung to a loss in 1HFY15 and presumably in 3QFY15 as well. The only silver lining is a weaker Singapore dollar, which could lead to forex gains as airframe maintenance pricing is typically quoted in US dollars. We would be looking out for the extent to which SIA Engineering (SIAEC) manages cost, especially relative to revenue. We have assumed a recovery in associate/JV, which perform primarily engine maintenance work. Overall, aerospace industrial production out of Singapore remained weak, with Mar 15 data showing the 10th consecutive double decline since Jun 14. We also estimate that SIAEC will declare a 10 S cents dividend, representing a 30% yoy reduction.
SATS expecting marginal increase in 4QFY15 net profit and good dividend payout. Operationally, we expect lower revenue due to a 7.4% decline in unit services. However, margins for gateway services are likely to improve due to lower pax handled at Changi and higher cargo handled. As such, we estimate a 5% improvement in operating profit and a 2.3% profit. Our 4QFY15 net profit is 4% higher than consensus. We also estimate that SATS’ final payout will be 10 S cents (8 S cents previously) as the company generated some $70m from the disposal of an associate and higher dividend payout from associates as at 9MFY15.
UNDERWEIGHT (Maintained) SECTOR CALLS
COMPANY Rating
SIA Engineering SELL
SATS HOLD
ST Engineering HOLD
Source: UOB Kay Hian
SINGAPORE AEROSPACE INDUSTRIAL PRODUCTION GROWTH
30507090
110130150
2012 2013 2014 2015
-30-20-100102030
(2011=100 (yoy % chg)
IPI: Aerospace Engineering (LHS)
Growth
Source: CEIC, UOB Kay Hian ANALYST
K Ajith 65-65906627 [email protected]
PEER COMPARISON Price @ Rec Tgt Market ------ PE ------ ------ P/B ------ ----- Yield ----- ROE EV/EBITDA Company Ticker 8 May 15 Price Cap 2015F 2016F 2015F 2016F 2015F 2016F 2015F 2015F 2016F (S$) (S$) (US$m) (x) (x) (x) (x) (%) (%) (%) (x) (x) SATS SATS SP 3.20 HOLD 3.11 2,649 17.7 16.7 2.5 2.3 4.1 4.5 14.0 11.8 11.5 SIA Engrg SIE SP 4.14 SELL 3.50 3,480 21.8 20.9 3.4 3.3 3.9 4.1 16.0 29.0 28.0 ST Engineering STE SP 3.65 HOLD 3.60 8,507 20.8 19.6 5.1 4.8 4.1 4.1 25.0 14.2 13.9 Average 20.1 19.0 3.7 3.5 4.0 4.2 18.3 18.3 17.8
Source: Bloomberg, UOB Kay Hian
Tuesday , 12 May 2015
17 Refer to last page for important disclosures.
R e g i o n a l M o r n i n g N o t e s
SATS 4QFY15 EARNINGS ESTIMATES Year to 31 Mar (S$m) 4QFY15 yoy % FY15F yoy % Remarks(4QFY15) Revenue 426.7 (1.8) 1,754.8 (1.8)
Gateway services 164.6 (1.5) 688.6 1.5 7.4% reduction in unit services Food Solutions 260.8 (2.1) 1,061.4 (3.8) 1.6% rise in unit meals,
Op Expenditure 383.0 (2.5) 1,577.8 (2.3) Op Profit 43.7 4.8 177.0 3.5 Non operating income 9.6 3.1 33.6 (4.5) Higher contribution fm PT CASS PBT 53.3 4.5 220.2 2.2 Net Profit 43.6 2.3 187.7 4.0
Source: UOB Kay Hian
ST Engineering has guided for “comparable” revenue and PBT for 2015, but market appears to be optimistic of 1Q15’s numbers. We believe this is due to a low base in 1Q14, when ST Engineering (STE) recognised some S$16.8m in loss provisions, offsetting most of the gains from job credit scheme. For 1Q15, we reckon that loss provisions will be lower and there could even be writebacks. Quantum of job credits will also be lower. If there are no provisions in the aerospace or land systems divisions, there is potentially further upside, especially if orderbook continues to rise.
ACTION
Maintain SELL on SIAEC. We do not see any light at the end of the tunnel for SIAEC’s woes. Thus far, line maintenance is its primary earnings driver. Its new contract with SIA is also for a lower quantum (S$2.9b over 8 years, compared with S$2.2b over 5 years).
SATS is now our top pick. We like SATS for its stable cash flow and diversified operations. SATS is also progressively reviewing its portfolio, disposing of assets and forming JVs to generate better efficiency. These measures are likely to be accretive over the long run. At current levels, SATS offers a trailing dividend yield of approximately 4.7%, which compares favourably with other high-yielding dividend yield stocks, with an added attraction of SATS having minimal debt.
RISKS
Steep decline in airline capacity.
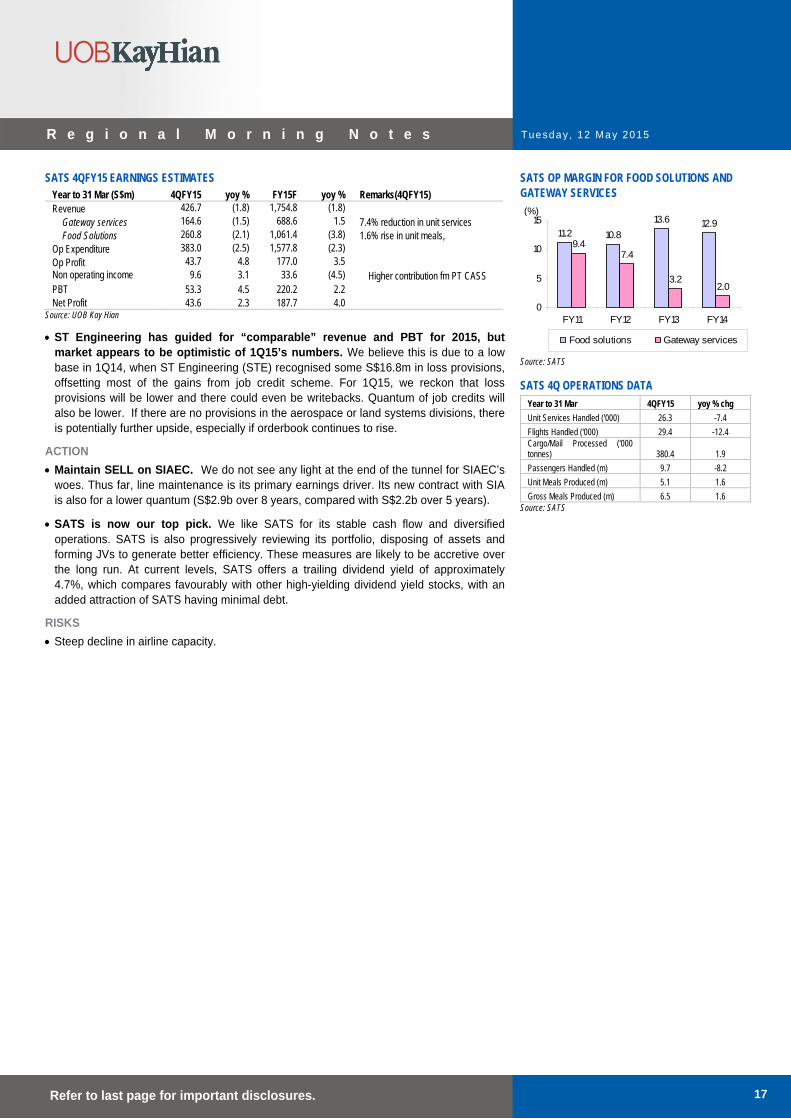
SATS OP MARGIN FOR FOOD SOLUTIONS AND GATEWAY SERVICES
11.2 10.812.9
9.47.4
3.22.0
13.6
0
5
10
15
FY11 FY12 FY13 FY14
Food solutions Gateway services
(%)
Source: SATS
SATS 4Q OPERATIONS DATA
Year to 31 Mar 4QFY15 yoy % chg
Unit Services Handled ('000) 26.3 -7.4
Flights Handled ('000) 29.4 -12.4 Cargo/Mail Processed ('000 tonnes) 380.4 1.9
Passengers Handled (m) 9.7 -8.2
Unit Meals Produced (m) 5.1 1.6
Gross Meals Produced (m) 6.5 1.6 Source: SATS
Tuesday , 12 May 2015
18 Refer to last page for important disclosures.
R e g i o n a l M o r n i n g N o t e s
COMPANY RESULTS BUY
(Maintained)
Share Price S$1.81
Target Price S$2.40
Upside +32.6%
(Previous TP S$2.80)
COMPANY DESCRIPTION Oil palm plantation with planted areas more than 100,000 hectares in Indonesia and 250,000 mt/year of refining capacity in Indonesia.
STOCK DATA GICS sector Consumer Staples
Bloomberg ticker: FR SP
Shares issued (m): 1,584.1
Market cap (S$m): 2,867.2
Market cap (US$m): 2,148.8
3-mth avg daily t'over (US$m): 2.6
Price Performance (%) 52-week high/low S$2.58/S$1.76
1mth 3mth 6mth 1yr YTD
(2.9) (6.7) (9.3) (25.5) (3.2)
Major Shareholders %
Eight Capital 63.2
FY15 NAV/Share (US$) 0.76
FY15 Net Debt/Share (US$) 0.20
PRICE CHART
60
70
80
90
100
110
1.40
1.60
1.80
2.00
2.20
2.40
2.60
2.80
(%)(lcy) FIRST RESOURCES LTD FIRST RESOURCES LTD/FSSTI INDEX
0
5
10
15
May 14 Jul 14 Sep 14 Nov 14 Jan 15 Mar 15 May 15
Volume (m)
Source: Bloomberg
ANALYSTS
Singapore Research Team+65 6535 6868 [email protected] Chan Yuan She +603 2147 1995 [email protected]
First Resources (FR SP)
1Q15: Seasonally Weak Quarter
FR’s 1Q15 net profit accounts for about 15% of our and consensus forecasts for 2015. 1Q is always the weaker quarter for plantation companies. The decline in net profit was mainly due to lower ASP and lower sales volume as inventory built up (vs inventory drawdown in 1Q14). However, production grew strongly yoy and downstream margin expanded in 1Q15. Maintain BUY with a lower target price of S$2.40 as we lower our earnings forecast to factor in lower CPO price assumptions.
1Q15 RESULTS
Year to 31 Dec (US$m) 1Q14 4Q14 1Q15 qoq yoy % chg % chg Revenue 177.9 176.7 96.3 (45.5) (45.9) - Plantation and Palm Oil Mills 135.7 130.8 107.8 (17.6) (20.6) - Refinery and Processing 100.2 100.5 23.3 (76.8) (76.8) EBITDA 68.6 94.1 52.5 (44.2) (23.6) - Plantation and Palm Oil Mills 64.4 77.7 52.9 (32.0) (17.9) - Refinery and Processing 2.9 5.2 1.5 (71.7) (48.9) EBIT 61.2 86.4 44.7 (48.2) (26.9) PBT 58.8 85.3 38.9 (54.4) (33.9) Net Profit 45.0 59.2 27.7 (53.2) (38.5) Core Net Profit 43.7 56.5 28.9 (48.9) (33.9)
Source: First Resources, UOB Kay Hian
RESULTS
First Resources (FR) reported a net profit of US$28.9m (-48.9% qoq, -33.9% yoy) for 1Q15. Its net profit accounts about 15% of consensus and our 2015 full-year forecast. 1Q is always the weakest quarter for plantation companies.
The decline in net profit was mainly due to lower sales volume in both upstream and downstream operations despite better yoy CPO production growth and improvement in downstream margin.
Its plantation division reported a 17.9% yoy decline in EBITDA (-32.0% yoy) mainly due to the lower selling prices and lower sales volume. CPO ASP was down 15.0% yoy (-2.4% qoq). CPO sales volume was down by 16.6% qoq (+10.5% yoy) despite the 10.5% yoy improvement in CPO production (-14.6% qoq). This was due to lower purchases of palm oil products from third-parties and inventory build-up of 20,000 tonnes as compared with inventory drawdown of 20,000 tonnes in 1Q14.
KEY FINANCIALS Year to 31 Dec (US$m) 2013 2014 2015F 2016F 2017F
Net turnover 626 616 720 876 960EBITDA 339 299 243 306 338Operating profit 311 268 206 260 285Net profit (rep./act.) 239 173 144 183 202Net profit (adj.) 217 172 144 183 202EPS (US$ cent) 13.7 10.8 9.1 11.6 12.7PE (x) 9.9 12.5 14.9 11.7 10.7P/B (x) 2.2 2.0 1.8 1.5 1.4EV/EBITDA (x) 7.5 8.5 10.4 8.3 7.5Dividend yield (%) 3.3 2.4 2.0 2.6 2.8Net margin (%) 38.2 28.2 20.0 20.9 21.0Net debt/(cash) to equity (%) 21.9 21.8 26.4 21.9 16.1Interest cover (x) 18.5 19.9 16.2 17.6 20.0ROE (%) 22.8 16.9 12.7 14.1 13.5Consensus net profit - - 183 220 252UOBKH/Consensus (x) - - 0.79 0.83 0.80Source: First Resources, Bloomberg, UOB Kay Hian n.m. : not meaningful; negative P/E, EV/EBITDA reflected as "n.m."
Tuesday , 12 May 2015
19 Refer to last page for important disclosures.
R e g i o n a l M o r n i n g N o t e s
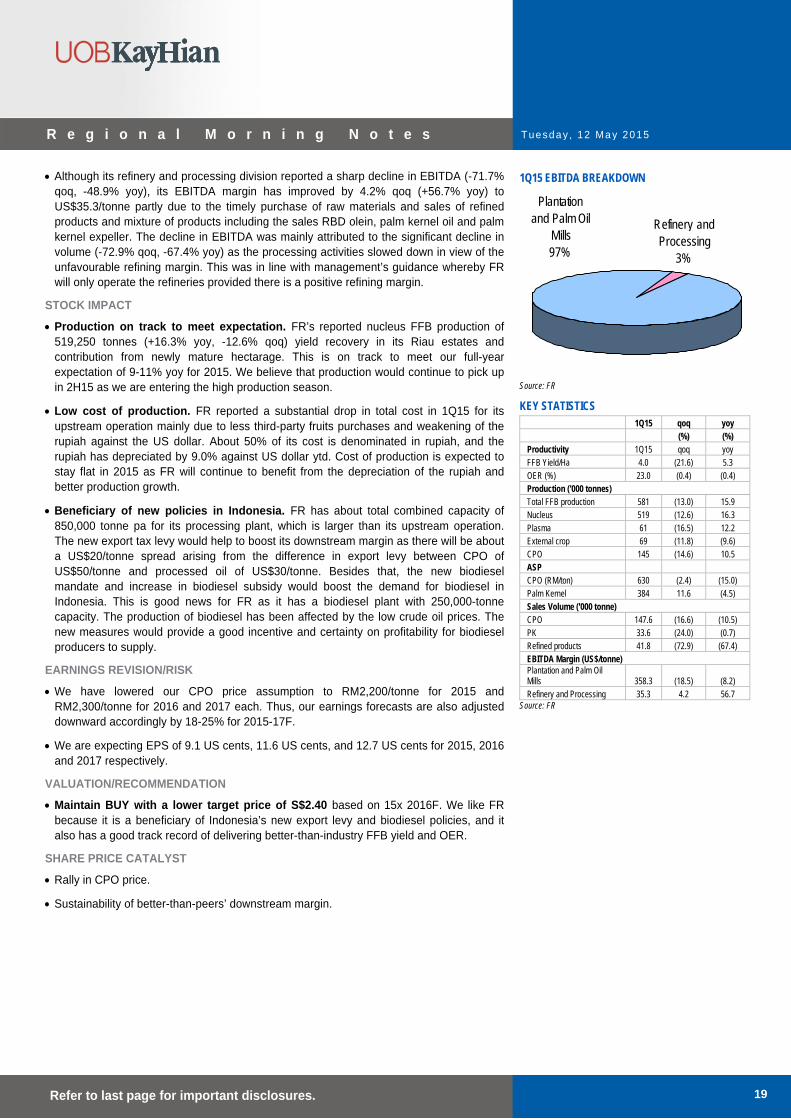
Although its refinery and processing division reported a sharp decline in EBITDA (-71.7% qoq, -48.9% yoy), its EBITDA margin has improved by 4.2% qoq (+56.7% yoy) to US$35.3/tonne partly due to the timely purchase of raw materials and sales of refined products and mixture of products including the sales RBD olein, palm kernel oil and palm kernel expeller. The decline in EBITDA was mainly attributed to the significant decline in volume (-72.9% qoq, -67.4% yoy) as the processing activities slowed down in view of the unfavourable refining margin. This was in line with management’s guidance whereby FR will only operate the refineries provided there is a positive refining margin.
STOCK IMPACT
Production on track to meet expectation. FR’s reported nucleus FFB production of 519,250 tonnes (+16.3% yoy, -12.6% qoq) yield recovery in its Riau estates and contribution from newly mature hectarage. This is on track to meet our full-year expectation of 9-11% yoy for 2015. We believe that production would continue to pick up in 2H15 as we are entering the high production season.
Low cost of production. FR reported a substantial drop in total cost in 1Q15 for its upstream operation mainly due to less third-party fruits purchases and weakening of the rupiah against the US dollar. About 50% of its cost is denominated in rupiah, and the rupiah has depreciated by 9.0% against US dollar ytd. Cost of production is expected to stay flat in 2015 as FR will continue to benefit from the depreciation of the rupiah and better production growth.
Beneficiary of new policies in Indonesia. FR has about total combined capacity of 850,000 tonne pa for its processing plant, which is larger than its upstream operation. The new export tax levy would help to boost its downstream margin as there will be about a US$20/tonne spread arising from the difference in export levy between CPO of US$50/tonne and processed oil of US$30/tonne. Besides that, the new biodiesel mandate and increase in biodiesel subsidy would boost the demand for biodiesel in Indonesia. This is good news for FR as it has a biodiesel plant with 250,000-tonne capacity. The production of biodiesel has been affected by the low crude oil prices. The new measures would provide a good incentive and certainty on profitability for biodiesel producers to supply.
EARNINGS REVISION/RISK
We have lowered our CPO price assumption to RM2,200/tonne for 2015 and RM2,300/tonne for 2016 and 2017 each. Thus, our earnings forecasts are also adjusted downward accordingly by 18-25% for 2015-17F.
We are expecting EPS of 9.1 US cents, 11.6 US cents, and 12.7 US cents for 2015, 2016 and 2017 respectively.
VALUATION/RECOMMENDATION
Maintain BUY with a lower target price of S$2.40 based on 15x 2016F. We like FR because it is a beneficiary of Indonesia’s new export levy and biodiesel policies, and it also has a good track record of delivering better-than-industry FFB yield and OER.
SHARE PRICE CATALYST
Rally in CPO price.
Sustainability of better-than-peers’ downstream margin.
1Q15 EBITDA BREAKDOWN
Refinery and Processing
3%
Plantation and Palm Oil
Mills97%
Source: FR
KEY STATISTICS 1Q15 qoq yoy (%) (%) Productivity 1Q15 qoq yoy FFB Yield/Ha 4.0 (21.6) 5.3 OER (%) 23.0 (0.4) (0.4) Production ('000 tonnes) Total FFB production 581 (13.0) 15.9 Nucleus 519 (12.6) 16.3 Plasma 61 (16.5) 12.2 External crop 69 (11.8) (9.6) CPO 145 (14.6) 10.5 ASP CPO (RM/ton) 630 (2.4) (15.0) Palm Kernel 384 11.6 (4.5) Sales Volume ('000 tonne) CPO 147.6 (16.6) (10.5) PK 33.6 (24.0) (0.7) Refined products 41.8 (72.9) (67.4) EBITDA Margin (US$/tonne) Plantation and Palm Oil Mills 358.3 (18.5) (8.2) Refinery and Processing 35.3 4.2 56.7
Source: FR
Tuesday , 12 May 2015
20 Refer to last page for important disclosures.
R e g i o n a l M o r n i n g N o t e s
PROFIT & LOSS Year to 31 Dec (US$m) 2014 2015F 2016F 2017F
Net turnover 616 720 876 960
EBITDA 299 243 306 338
Deprec. & amort. 31 37 45 53
EBIT 268 206 260 285
Total other non-operating income (3) 0 0 0
Net interest income/(expense) (15) (15) (17) (17)
Pre-tax profit 252 191 243 268
Tax (71) (41) (52) (58)
Minorities (7) (6) (8) (8)
Net profit 173 144 183 202
Net profit (adj.) 172 144 183 202
BALANCE SHEET Year to 31 Dec (US$m) 2014 2015F 2016F 2017F
Fixed assets 338 426 517 600
Other LT assets 1,185 1,295 1,354 1,421
Cash/ST investment 351 288 328 401
Other current assets 124 182 212 228
Total assets 1,998 2,191 2,411 2,650
ST debt 11 12 13 14
Other current liabilities 77 83 89 92
LT debt 572 595 619 644
Other LT liabilities 222 235 246 259
Shareholders' equity 1,063 1,207 1,390 1,591
Minority interest 53 59 54 51
Total liabilities & equity 1,998 2,191 2,411 2,650
CASH FLOW Year to 31 Dec (US$m) 2014 2015F 2016F 2017F
Operating 223 120 195 234
Pre-tax profit 252 191 243 268
Tax (77) (41) (52) (58)
Deprec. & amort. 31 37 45 53
Working capital changes 15 (52) (24) (13)
Other operating cashflows 2 (15) (17) (17)
Investing (215) (130) (150) (150)
Capex (growth) (71) (130) (150) (150)
Investments 0 0 0 0
Proceeds from sale of assets 0 0 0 0
Others (143) 0 0 0
Financing 43 7 (5) (11)
Dividend payments (58) (43) (55) (61)
Issue of shares 0 0 0 0
Proceeds from borrowings 122 100 100 100
Loan repayment 0 (50) (50) (50)
Others/interest paid (22) 0 0 0
Net cash inflow (outflow) 51 (4) 40 73
Beginning cash & cash equivalent 299 291 288 328
Changes due to forex impact 1 0 0 0
Ending cash & cash equivalent 351 288 328 401
KEY METRICS Year to 31 Dec (%) 2014 2015F 2016F 2017F
Profitability EBITDA margin 48.5 33.7 34.9 35.3
Pre-tax margin 40.9 26.6 27.7 27.9
Net margin 28.2 20.0 20.9 21.0
ROA 9.2 6.9 8.0 8.0
ROE 16.9 12.7 14.1 13.5
Growth Turnover (1.8) 17.0 21.7 9.5
EBITDA (11.9) (18.7) 25.8 10.7
Pre-tax profit (19.7) (24.1) 27.0 10.2
Net profit (27.5) (16.8) 27.0 10.2
Net profit (adj.) (20.9) (15.9) 27.0 10.2
EPS (20.9) (15.9) 27.0 10.2
Leverage Debt to total capital 34.3 32.4 30.4 28.6
Debt to equity 54.8 50.3 45.5 41.3
Net debt/(cash) to equity 21.8 26.4 21.9 16.1
Interest cover (x) 19.9 16.2 17.6 20.0
Tuesday , 12 May 2015
21 Refer to last page for important disclosures.
R e g i o n a l M o r n i n g N o t e s
COMPANY RESULTS BUY
(Maintained)
Share Price Bt29.00
Target Price Bt33.00
Upside +13.8%
COMPANY DESCRIPTION A regional coal producer with mines in four countries, namely Indonesia (ITMG), Australia (Centennial), Mongolia (Hunnu), and China, commanding total reserves of 911mt.The Banpu group also has power generation capacity (equity basis) of around 0.7GW.
STOCK DATA GICS sector Energy
Bloomberg ticker: BANPU TB
Shares issued (m): 2,581.9
Market cap (Btm): 74,874.5
Market cap (US$m): 2,235.7
3-mth avg daily t'over (US$m): 11.3
Price Performance (%) 52-week high/low Bt34.50/Bt23.70
1mth 3mth 6mth 1yr YTD
(5.7) 13.7 5.5 0.0 16.5
Major Shareholders %
Vongkusolkij family 17.0
NVDR 16.0
State Street Bank Europe Ltd. 6.7
FY15 NAV/Share (Bt) 38.00
FY15 Net Debt/Share (Bt) 29.73
PRICE CHART
50
60
70
80
90
100
110
120
130
140
15
20
25
30
35
40
(%)(lcy) BANPU PUBLIC CO LTD BANPU PUBLIC CO LTD/SET INDEX
0
20
40
60
80
May 14 Jul 14 Sep 14 Nov 14 Jan 15 Mar 15 May 15
Volume (m)
Source: Bloomberg
ANALYSTS
Tanaporn Visaruthaphong +662 659 8305 [email protected] Chaiwat Arsirawichai +662 659 8301 [email protected]
Banpu (BANPU TB)
1Q15: Results Come With No Surprises
Much of the weak results in 1Q15 should have been priced into BANPU’s share price. We believe 1Q15 earnings should be the lowest quarterly earnings for this year. Investors should look at BANPU as a power play because 77% of its 2015 earnings will come from its power business given the gradual start-up of the Hong Sa plant in mid-15. Maintain BUY. Target price: Bt33.00.
1Q15 RESULTS Year to 31 Dec 1Q14 4Q14 1Q15 yoy qoq (Btm) (Btm) (Btm) % change % change Remarks Revenue 27,140 24,329 22,509 -17.1% -7.5% ASP and Volume dropped
as raining season COGS 17,710 16,832 14,517 -18.0% -13.8% Income tax 1,186 -281 864 -27.2% n.a. Recurring-Profit 1,008 781 741 -26.5% -5.2% FX gain/(loss) -132 385 -316 139.3% n.a. Loss from Bt appreciation Hedging gain/(loss) 1,139 -1,102 -355 n.a. -67.8% Net income 1,805 66 69 -96.2% 4.9% EPS (Bt) 0.66 0.02 0.03 -96.2% 27.4% Gross margin (%) 34.7% 30.8% 35.5% EBITDA margin (%) 14.7% 28.6% 21.9% Net profit margin (%) 6.7% 0.3% 0.3%
Source: Banpu PCL, UOB Kay Hian
RESULTS
BANPU reported a net profit of US$2.1m (Bt69m) in 1Q15 vs US$53.3m in 1Q14 and US$2.1m in 4Q14. Results were in line with our estimate but far below consensus expectation of US$2.92m (Bt95m) by 26%.
The poor bottom line was due to the unrealised forex loss of US$9.7m (Bt316m), mainly from the Baht appreciation. The company was also affected by derivatives losses worth US$10.8m (Bt355m). Excluding forex and hedging gains/losses, core profit stood at Bt741m in 1Q15 vs Bt781m in 4Q14 and Bt1.01b in 1Q14.
KEY FINANCIALS Year to 31 Dec (Btm) 2013 2014 2015F 2016F 2017F
Net turnover 102,944 102,122 93,961 96,330 96,330EBITDA 14,767 15,377 16,600 17,194 17,532Operating profit 7,820 8,211 8,602 8,871 8,871Net profit (rep./act.) 3,151 2,680 3,867 5,617 5,565Net profit (adj.) 3,151 2,680 3,867 5,617 5,565EPS (Bt) 1.2 1.0 1.4 2.1 2.0PE (x) 25.0 29.4 20.4 14.0 14.2P/B (x) 1.0 1.0 0.8 0.7 0.7EV/EBITDA (x) 10.5 10.1 9.4 9.1 8.9Dividend yield (%) 3.4 3.4 3.4 3.4 3.4Net margin (%) 3.1 2.6 4.1 5.8 5.8Net debt/(cash) to equity (%) 112.6 118.5 78.2 78.7 79.6Interest cover (x) 4.2 3.9 4.2 4.3 4.4ROE (%) 3.7 3.3 4.2 5.9 5.7Consensus net profit - - 3,813 5,345 6,628UOBKH/Consensus (x) - - 1.01 1.05 0.84Source: Banpu PCL, Bloomberg, UOB Kay Hian n.m. : not meaningful; negative P/E, EV/EBITDA reflected as "n.m."
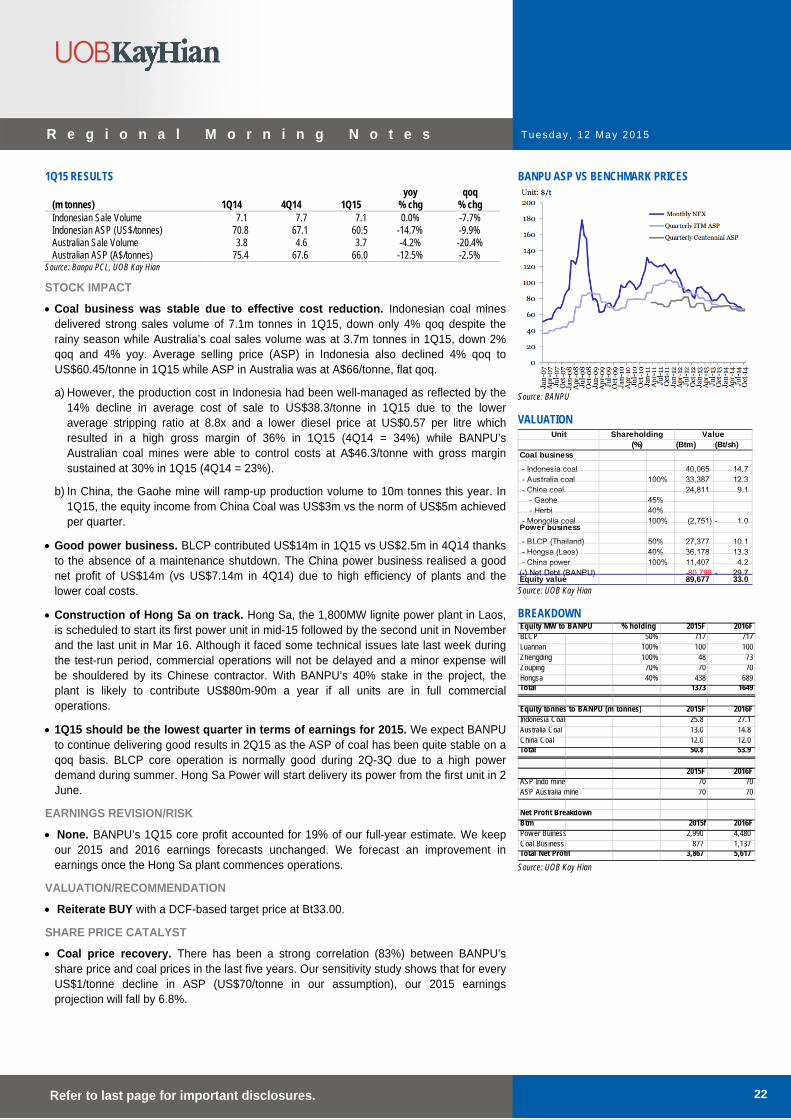
Tuesday , 12 May 2015
22 Refer to last page for important disclosures.
R e g i o n a l M o r n i n g N o t e s
1Q15 RESULTS yoy qoq (m tonnes) 1Q14 4Q14 1Q15 % chg % chg Indonesian Sale Volume 7.1 7.7 7.1 0.0% -7.7% Indonesian ASP (US$/tonnes) 70.8 67.1 60.5 -14.7% -9.9% Australian Sale Volume 3.8 4.6 3.7 -4.2% -20.4% Australian ASP (A$/tonnes) 75.4 67.6 66.0 -12.5% -2.5%
Source: Banpu PCL, UOB Kay Hian
STOCK IMPACT
Coal business was stable due to effective cost reduction. Indonesian coal mines delivered strong sales volume of 7.1m tonnes in 1Q15, down only 4% qoq despite the rainy season while Australia’s coal sales volume was at 3.7m tonnes in 1Q15, down 2% qoq and 4% yoy. Average selling price (ASP) in Indonesia also declined 4% qoq to US$60.45/tonne in 1Q15 while ASP in Australia was at A$66/tonne, flat qoq.
a) However, the production cost in Indonesia had been well-managed as reflected by the 14% decline in average cost of sale to US$38.3/tonne in 1Q15 due to the lower average stripping ratio at 8.8x and a lower diesel price at US$0.57 per litre which resulted in a high gross margin of 36% in 1Q15 (4Q14 = 34%) while BANPU’s Australian coal mines were able to control costs at A$46.3/tonne with gross margin sustained at 30% in 1Q15 (4Q14 = 23%).
b) In China, the Gaohe mine will ramp-up production volume to 10m tonnes this year. In 1Q15, the equity income from China Coal was US$3m vs the norm of US$5m achieved per quarter.
Good power business. BLCP contributed US$14m in 1Q15 vs US$2.5m in 4Q14 thanks to the absence of a maintenance shutdown. The China power business realised a good net profit of US$14m (vs US$7.14m in 4Q14) due to high efficiency of plants and the lower coal costs.
Construction of Hong Sa on track. Hong Sa, the 1,800MW lignite power plant in Laos, is scheduled to start its first power unit in mid-15 followed by the second unit in November and the last unit in Mar 16. Although it faced some technical issues late last week during the test-run period, commercial operations will not be delayed and a minor expense will be shouldered by its Chinese contractor. With BANPU’s 40% stake in the project, the plant is likely to contribute US$80m-90m a year if all units are in full commercial operations.
1Q15 should be the lowest quarter in terms of earnings for 2015. We expect BANPU to continue delivering good results in 2Q15 as the ASP of coal has been quite stable on a qoq basis. BLCP core operation is normally good during 2Q-3Q due to a high power demand during summer. Hong Sa Power will start delivery its power from the first unit in 2 June.
EARNINGS REVISION/RISK
None. BANPU’s 1Q15 core profit accounted for 19% of our full-year estimate. We keep our 2015 and 2016 earnings forecasts unchanged. We forecast an improvement in earnings once the Hong Sa plant commences operations.
VALUATION/RECOMMENDATION
Reiterate BUY with a DCF-based target price at Bt33.00.
SHARE PRICE CATALYST
Coal price recovery. There has been a strong correlation (83%) between BANPU’s share price and coal prices in the last five years. Our sensitivity study shows that for every US$1/tonne decline in ASP (US$70/tonne in our assumption), our 2015 earnings projection will fall by 6.8%.
BANPU ASP VS BENCHMARK PRICES
Source: BANPU
VALUATION Unit
(Btm) (Bt/sh)Coal business
- Indonesia coal 40,065 14.7 - Australia coal 100% 33,387 12.3 - China coal 24,811 9.1 - Gaohe 45% - Herbi 40% - Mongolia coal 100% (2,751) 1.0- Power business
- BLCP (Thailand) 50% 27,377 10.1 - Hongsa (Laos) 40% 36,178 13.3 - China power 100% 11,407 4.2 (-) Net Debt (BANPU) -80,798 29.7- Equity value 89,677 33.0
(%)Shareholding Value
Source: UOB Kay Hian
BREAKDOWN Equity MW to BANPU % holding 2015F 2016FBLCP 50% 717 717Luannan 100% 100 100Zhengding 100% 48 73Zouping 70% 70 70Hongsa 40% 438 689Total 1373 1649
Equity tonnes to BANPU (m tonnes) 2015F 2016FIndonesia Coal 25.8 27.1 Australia Coal 13.0 14.8 China Coal 12.0 12.0 Total 50.8 53.9
2015F 2016FASP Indo mine 70 70ASP Australia mine 70 70
Net Profit BreakdownBtm 2015f 2016FPow er Buiness 2,990 4,480 Coal Business 877 1,137 Total Net Profit 3,867 5,617
Source: UOB Kay Hian
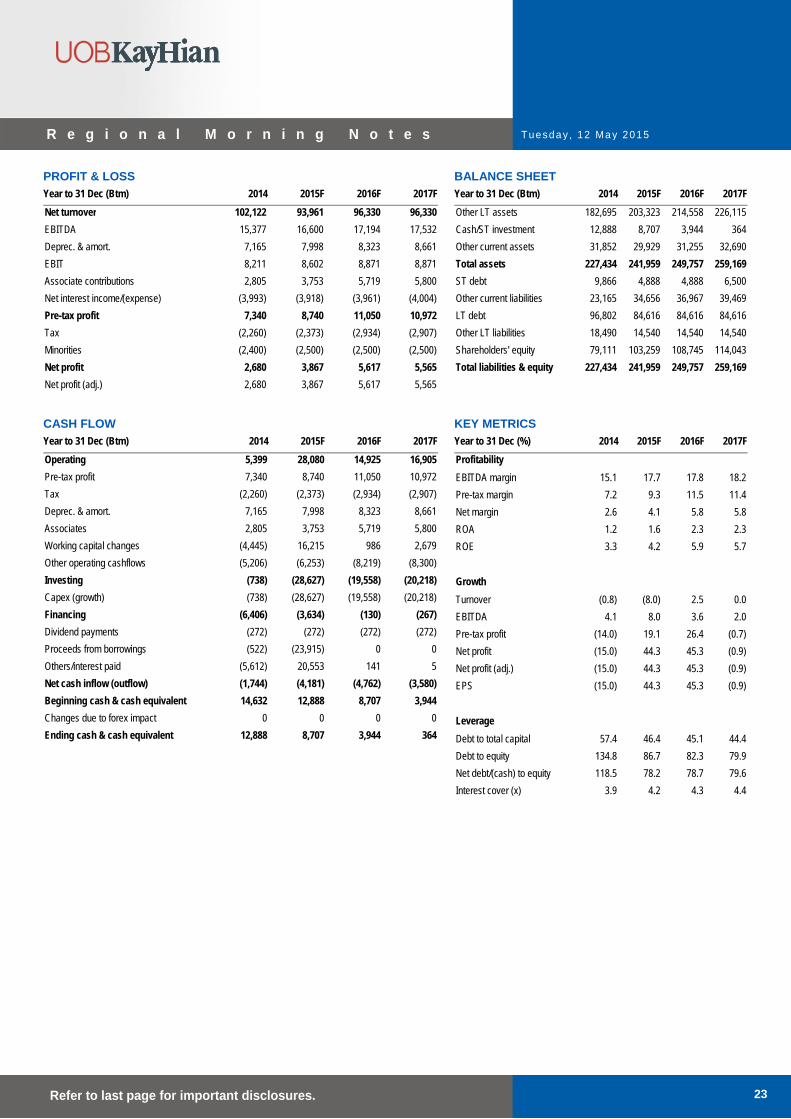
Tuesday , 12 May 2015
23 Refer to last page for important disclosures.
R e g i o n a l M o r n i n g N o t e s
PROFIT & LOSS Year to 31 Dec (Btm) 2014 2015F 2016F 2017F
Net turnover 102,122 93,961 96,330 96,330
EBITDA 15,377 16,600 17,194 17,532
Deprec. & amort. 7,165 7,998 8,323 8,661
EBIT 8,211 8,602 8,871 8,871
Associate contributions 2,805 3,753 5,719 5,800
Net interest income/(expense) (3,993) (3,918) (3,961) (4,004)
Pre-tax profit 7,340 8,740 11,050 10,972
Tax (2,260) (2,373) (2,934) (2,907)
Minorities (2,400) (2,500) (2,500) (2,500)
Net profit 2,680 3,867 5,617 5,565
Net profit (adj.) 2,680 3,867 5,617 5,565
BALANCE SHEET Year to 31 Dec (Btm) 2014 2015F 2016F 2017F
Other LT assets 182,695 203,323 214,558 226,115
Cash/ST investment 12,888 8,707 3,944 364
Other current assets 31,852 29,929 31,255 32,690
Total assets 227,434 241,959 249,757 259,169
ST debt 9,866 4,888 4,888 6,500
Other current liabilities 23,165 34,656 36,967 39,469
LT debt 96,802 84,616 84,616 84,616
Other LT liabilities 18,490 14,540 14,540 14,540
Shareholders' equity 79,111 103,259 108,745 114,043
Total liabilities & equity 227,434 241,959 249,757 259,169
CASH FLOW Year to 31 Dec (Btm) 2014 2015F 2016F 2017F
Operating 5,399 28,080 14,925 16,905
Pre-tax profit 7,340 8,740 11,050 10,972
Tax (2,260) (2,373) (2,934) (2,907)
Deprec. & amort. 7,165 7,998 8,323 8,661
Associates 2,805 3,753 5,719 5,800
Working capital changes (4,445) 16,215 986 2,679
Other operating cashflows (5,206) (6,253) (8,219) (8,300)
Investing (738) (28,627) (19,558) (20,218)
Capex (growth) (738) (28,627) (19,558) (20,218)
Financing (6,406) (3,634) (130) (267)
Dividend payments (272) (272) (272) (272)
Proceeds from borrowings (522) (23,915) 0 0
Others/interest paid (5,612) 20,553 141 5
Net cash inflow (outflow) (1,744) (4,181) (4,762) (3,580)
Beginning cash & cash equivalent 14,632 12,888 8,707 3,944
Changes due to forex impact 0 0 0 0
Ending cash & cash equivalent 12,888 8,707 3,944 364
KEY METRICS Year to 31 Dec (%) 2014 2015F 2016F 2017F
Profitability EBITDA margin 15.1 17.7 17.8 18.2
Pre-tax margin 7.2 9.3 11.5 11.4
Net margin 2.6 4.1 5.8 5.8
ROA 1.2 1.6 2.3 2.3
ROE 3.3 4.2 5.9 5.7
Growth Turnover (0.8) (8.0) 2.5 0.0
EBITDA 4.1 8.0 3.6 2.0
Pre-tax profit (14.0) 19.1 26.4 (0.7)
Net profit (15.0) 44.3 45.3 (0.9)
Net profit (adj.) (15.0) 44.3 45.3 (0.9)
EPS (15.0) 44.3 45.3 (0.9)
Leverage Debt to total capital 57.4 46.4 45.1 44.4
Debt to equity 134.8 86.7 82.3 79.9
Net debt/(cash) to equity 118.5 78.2 78.7 79.6
Interest cover (x) 3.9 4.2 4.3 4.4
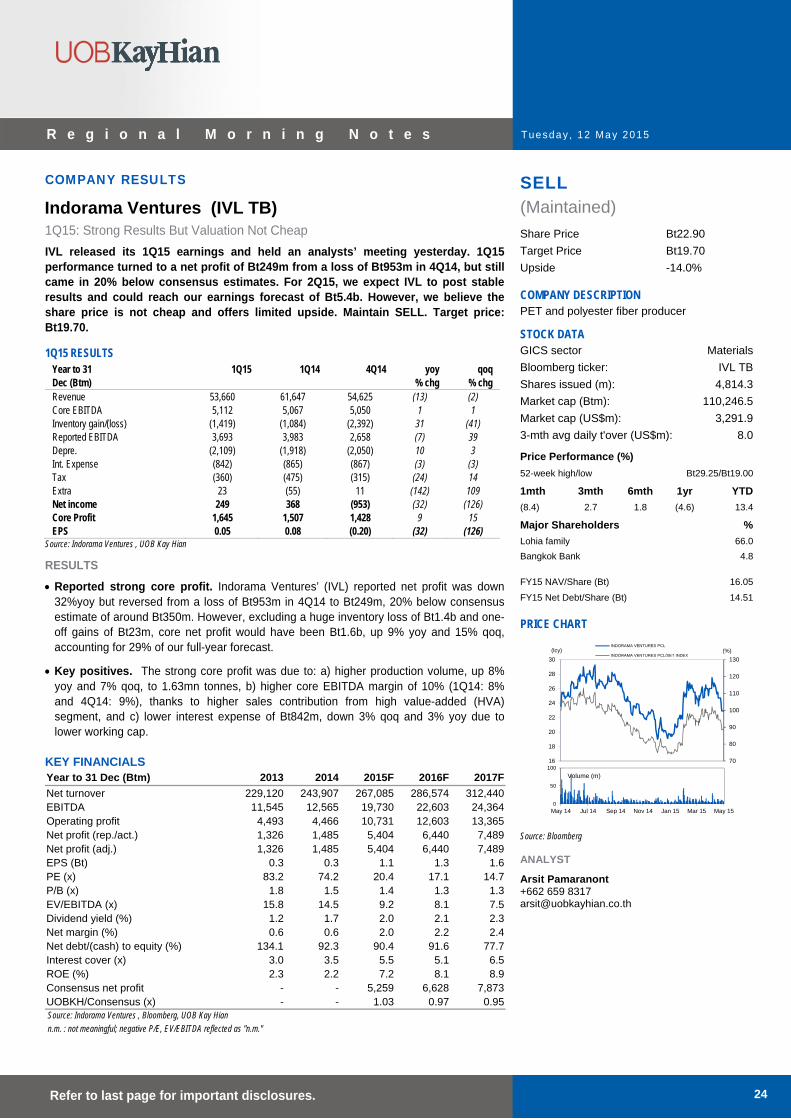
Tuesday , 12 May 2015
24 Refer to last page for important disclosures.
R e g i o n a l M o r n i n g N o t e s
COMPANY RESULTS SELL
(Maintained)
Share Price Bt22.90
Target Price Bt19.70
Upside -14.0%
COMPANY DESCRIPTION PET and polyester fiber producer
STOCK DATA GICS sector Materials
Bloomberg ticker: IVL TB
Shares issued (m): 4,814.3
Market cap (Btm): 110,246.5
Market cap (US$m): 3,291.9
3-mth avg daily t'over (US$m): 8.0
Price Performance (%) 52-week high/low Bt29.25/Bt19.00
1mth 3mth 6mth 1yr YTD
(8.4) 2.7 1.8 (4.6) 13.4
Major Shareholders %
Lohia family 66.0
Bangkok Bank 4.8
FY15 NAV/Share (Bt) 16.05
FY15 Net Debt/Share (Bt) 14.51
PRICE CHART
70
80
90
100
110
120
130
16
18
20
22
24
26
28
30
(%)(lcy)INDORAMA VENTURES PCL
INDORAMA VENTURES PCL/SET INDEX
0
50
100
May 14 Jul 14 Sep 14 Nov 14 Jan 15 Mar 15 May 15
Volume (m)
Source: Bloomberg
ANALYST
Arsit Pamaranont +662 659 8317 [email protected]
Indorama Ventures (IVL TB)
1Q15: Strong Results But Valuation Not Cheap
IVL released its 1Q15 earnings and held an analysts’ meeting yesterday. 1Q15 performance turned to a net profit of Bt249m from a loss of Bt953m in 4Q14, but still came in 20% below consensus estimates. For 2Q15, we expect IVL to post stable results and could reach our earnings forecast of Bt5.4b. However, we believe the share price is not cheap and offers limited upside. Maintain SELL. Target price: Bt19.70.
1Q15 RESULTS Year to 31 1Q15 1Q14 4Q14 yoy qoq Dec (Btm) % chg % chg Revenue 53,660 61,647 54,625 (13) (2) Core EBITDA 5,112 5,067 5,050 1 1 Inventory gain/(loss) (1,419) (1,084) (2,392) 31 (41) Reported EBITDA 3,693 3,983 2,658 (7) 39 Depre. (2,109) (1,918) (2,050) 10 3 Int. Expense (842) (865) (867) (3) (3) Tax (360) (475) (315) (24) 14 Extra 23 (55) 11 (142) 109 Net income 249 368 (953) (32) (126) Core Profit 1,645 1,507 1,428 9 15 EPS 0.05 0.08 (0.20) (32) (126)
Source: Indorama Ventures , UOB Kay Hian
RESULTS
Reported strong core profit. Indorama Ventures’ (IVL) reported net profit was down 32%yoy but reversed from a loss of Bt953m in 4Q14 to Bt249m, 20% below consensus estimate of around Bt350m. However, excluding a huge inventory loss of Bt1.4b and one-off gains of Bt23m, core net profit would have been Bt1.6b, up 9% yoy and 15% qoq, accounting for 29% of our full-year forecast.
Key positives. The strong core profit was due to: a) higher production volume, up 8% yoy and 7% qoq, to 1.63mn tonnes, b) higher core EBITDA margin of 10% (1Q14: 8% and 4Q14: 9%), thanks to higher sales contribution from high value-added (HVA) segment, and c) lower interest expense of Bt842m, down 3% qoq and 3% yoy due to lower working cap.
KEY FINANCIALS Year to 31 Dec (Btm) 2013 2014 2015F 2016F 2017F
Net turnover 229,120 243,907 267,085 286,574 312,440EBITDA 11,545 12,565 19,730 22,603 24,364Operating profit 4,493 4,466 10,731 12,603 13,365Net profit (rep./act.) 1,326 1,485 5,404 6,440 7,489Net profit (adj.) 1,326 1,485 5,404 6,440 7,489EPS (Bt) 0.3 0.3 1.1 1.3 1.6PE (x) 83.2 74.2 20.4 17.1 14.7P/B (x) 1.8 1.5 1.4 1.3 1.3EV/EBITDA (x) 15.8 14.5 9.2 8.1 7.5Dividend yield (%) 1.2 1.7 2.0 2.1 2.3Net margin (%) 0.6 0.6 2.0 2.2 2.4Net debt/(cash) to equity (%) 134.1 92.3 90.4 91.6 77.7Interest cover (x) 3.0 3.5 5.5 5.1 6.5ROE (%) 2.3 2.2 7.2 8.1 8.9Consensus net profit - - 5,259 6,628 7,873UOBKH/Consensus (x) - - 1.03 0.97 0.95Source: Indorama Ventures , Bloomberg, UOB Kay Hian n.m. : not meaningful; negative P/E, EV/EBITDA reflected as "n.m."
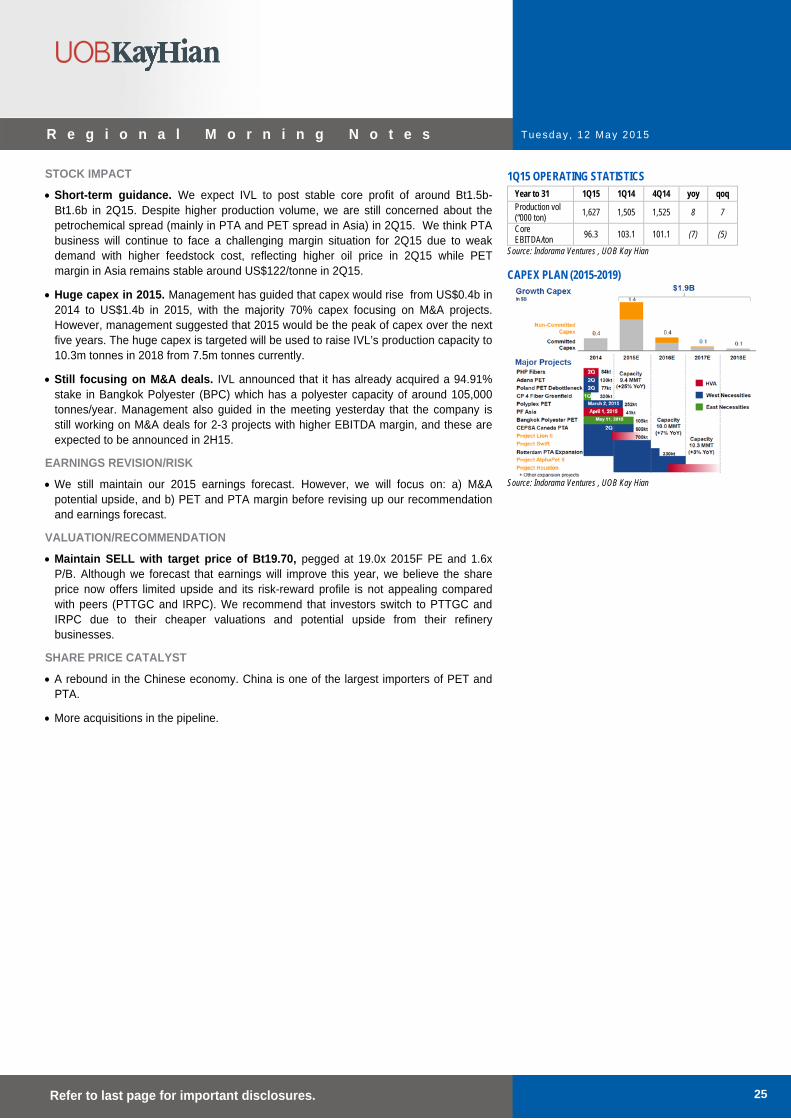
Tuesday , 12 May 2015
25 Refer to last page for important disclosures.
R e g i o n a l M o r n i n g N o t e s
STOCK IMPACT
Short-term guidance. We expect IVL to post stable core profit of around Bt1.5b- Bt1.6b in 2Q15. Despite higher production volume, we are still concerned about the petrochemical spread (mainly in PTA and PET spread in Asia) in 2Q15. We think PTA business will continue to face a challenging margin situation for 2Q15 due to weak demand with higher feedstock cost, reflecting higher oil price in 2Q15 while PET margin in Asia remains stable around US$122/tonne in 2Q15.
Huge capex in 2015. Management has guided that capex would rise from US$0.4b in 2014 to US$1.4b in 2015, with the majority 70% capex focusing on M&A projects. However, management suggested that 2015 would be the peak of capex over the next five years. The huge capex is targeted will be used to raise IVL’s production capacity to 10.3m tonnes in 2018 from 7.5m tonnes currently.
Still focusing on M&A deals. IVL announced that it has already acquired a 94.91% stake in Bangkok Polyester (BPC) which has a polyester capacity of around 105,000 tonnes/year. Management also guided in the meeting yesterday that the company is still working on M&A deals for 2-3 projects with higher EBITDA margin, and these are expected to be announced in 2H15.
EARNINGS REVISION/RISK
We still maintain our 2015 earnings forecast. However, we will focus on: a) M&A potential upside, and b) PET and PTA margin before revising up our recommendation and earnings forecast.
VALUATION/RECOMMENDATION
Maintain SELL with target price of Bt19.70, pegged at 19.0x 2015F PE and 1.6x P/B. Although we forecast that earnings will improve this year, we believe the share price now offers limited upside and its risk-reward profile is not appealing compared with peers (PTTGC and IRPC). We recommend that investors switch to PTTGC and IRPC due to their cheaper valuations and potential upside from their refinery businesses.
SHARE PRICE CATALYST
A rebound in the Chinese economy. China is one of the largest importers of PET and PTA.
More acquisitions in the pipeline.
1Q15 OPERATING STATISTICS Year to 31 1Q15 1Q14 4Q14 yoy qoq Production vol (“000 ton) 1,627 1,505 1,525 8 7
Core EBITDA/ton 96.3 103.1 101.1 (7) (5)
Source: Indorama Ventures , UOB Kay Hian
CAPEX PLAN (2015-2019)
Source: Indorama Ventures , UOB Kay Hian

Tuesday , 12 May 2015
26 Refer to last page for important disclosures.
R e g i o n a l M o r n i n g N o t e s
PROFIT & LOSS Year to 31 Dec (Btm) 2014 2015F 2016F 2017F
Net turnover 243,907 267,085 286,574 312,440
EBITDA 12,565 19,730 22,603 24,364
Deprec. & amort. 8,099 8,999 9,999 10,999
EBIT 4,466 10,731 12,603 13,365
Total other non-operating income 2,020 1,250 1,275 1,350
Associate contributions (1,356) (250) (102) (50)
Net interest income/(expense) (3,555) (3,583) (4,405) (3,752)
Pre-tax profit 1,575 8,148 9,371 10,913
Tax (1,614) (2,444) (2,811) (3,274)
Minorities (285) (300) (120) (150)
Net profit 1,485 5,404 6,440 7,489
Net profit (adj.) 1,485 5,404 6,440 7,489
BALANCE SHEET Year to 31 Dec (Btm) 2014 2015F 2016F 2017F
Fixed assets 98,901 107,901 107,902 106,902
Other LT assets 24,407 30,480 29,900 31,000
Cash/ST investment 5,420 6,334 3,273 10,748
Other current assets 66,761 66,881 72,529 73,851
Total assets 195,488 211,596 213,603 222,502
ST debt 13,007 17,931 18,931 18,081
Other current liabilities 35,058 43,530 37,650 40,100
LT debt 60,257 58,257 59,257 60,257
Other LT liabilities 11,611 12,350 13,444 14,200
Shareholders' equity 73,481 77,264 81,772 87,014
Minority interest 2,074 2,264 2,550 2,850
Total liabilities & equity 195,488 211,596 213,603 222,502
CASH FLOW Year to 31 Dec (Btm) 2014 2015F 2016F 2017F
Operating 16,476 23,749 8,041 20,672
Pre-tax profit 1,575 8,148 9,371 10,913
Tax (1,614) (2,444) (2,811) (3,274)
Deprec. & amort. 8,099 8,999 9,999 10,999
Working capital changes 5,880 9,155 (8,683) 1,884
Non-cash items (285) (300) (120) (150)
Other operating cashflows 2,821 191 285 300
Investing (14,669) (24,138) (11,170) (11,100)
Capex (growth) (10,787) (18,000) (10,000) (10,000)
Investments (3,882) (6,138) (1,170) (1,100)
Others n.a. n.a. n.a. n.a.
Financing (502) 1,303 68 (2,097)
Dividend payments (1,629) (1,621) (1,932) (2,247)
Issue of shares 2 0 0 0
Proceeds from borrowings 1,125 2,924 2,000 150
Others/interest paid n.a. n.a. n.a. n.a.
Net cash inflow (outflow) 1,305 914 (3,061) 7,475
Beginning cash & cash equivalent
4,114 5,420 6,334 3,273
Ending cash & cash equivalent 5,420 6,334 3,273 10,748
KEY METRICS Year to 31 Dec (%) 2014 2015F 2016F 2017F
Profitability EBITDA margin 5.2 7.4 7.9 7.8
Pre-tax margin 0.6 3.1 3.3 3.5
Net margin 0.6 2.0 2.2 2.4
ROA 0.8 2.7 3.0 3.4
ROE 2.2 7.2 8.1 8.9
Growth Turnover 6.5 9.5 7.3 9.0
EBITDA 8.8 57.0 14.6 7.8
Pre-tax profit 40.6 417.3 15.0 16.5
Net profit 12.0 263.8 19.2 16.3
Net profit (adj.) 12.0 263.8 19.2 16.3
EPS 12.0 263.8 19.2 16.3
Leverage Debt to total capital 49.2 48.9 48.1 46.6
Debt to equity 99.7 98.6 95.6 90.0
Net debt/(cash) to equity 92.3 90.4 91.6 77.7
Interest cover (x) 3.5 5.5 5.1 6.5
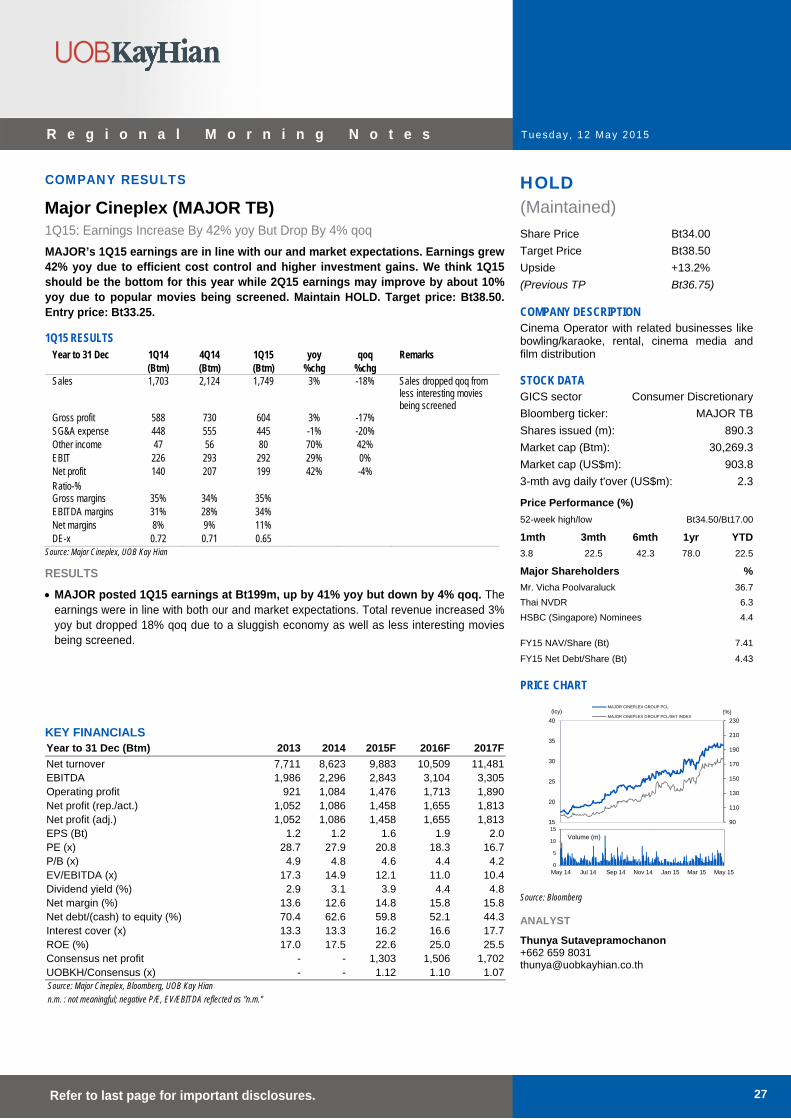
Tuesday , 12 May 2015
27 Refer to last page for important disclosures.
R e g i o n a l M o r n i n g N o t e s
COMPANY RESULTS HOLD
(Maintained)
Share Price Bt34.00
Target Price Bt38.50
Upside +13.2%
(Previous TP Bt36.75)
COMPANY DESCRIPTION Cinema Operator with related businesses like bowling/karaoke, rental, cinema media and film distribution
STOCK DATA GICS sector Consumer Discretionary
Bloomberg ticker: MAJOR TB
Shares issued (m): 890.3
Market cap (Btm): 30,269.3
Market cap (US$m): 903.8
3-mth avg daily t'over (US$m): 2.3
Price Performance (%) 52-week high/low Bt34.50/Bt17.00
1mth 3mth 6mth 1yr YTD
3.8 22.5 42.3 78.0 22.5
Major Shareholders %
Mr. Vicha Poolvaraluck 36.7
Thai NVDR 6.3
HSBC (Singapore) Nominees 4.4
FY15 NAV/Share (Bt) 7.41
FY15 Net Debt/Share (Bt) 4.43
PRICE CHART
90
110
130
150
170
190
210
230
15
20
25
30
35
40
(%)(lcy)MAJOR CINEPLEX GROUP PCL
MAJOR CINEPLEX GROUP PCL/SET INDEX
0
5
10
15
May 14 Jul 14 Sep 14 Nov 14 Jan 15 Mar 15 May 15
Volume (m)
Source: Bloomberg
ANALYST
Thunya Sutavepramochanon+662 659 8031 [email protected]
Major Cineplex (MAJOR TB)
1Q15: Earnings Increase By 42% yoy But Drop By 4% qoq
MAJOR’s 1Q15 earnings are in line with our and market expectations. Earnings grew 42% yoy due to efficient cost control and higher investment gains. We think 1Q15 should be the bottom for this year while 2Q15 earnings may improve by about 10% yoy due to popular movies being screened. Maintain HOLD. Target price: Bt38.50. Entry price: Bt33.25.
1Q15 RESULTS Year to 31 Dec 1Q14 4Q14 1Q15 yoy qoq Remarks (Btm) (Btm) (Btm) %chg %chg Sales 1,703 2,124 1,749 3% -18% Sales dropped qoq from
less interesting movies being screened
Gross profit 588 730 604 3% -17% SG&A expense 448 555 445 -1% -20% Other income 47 56 80 70% 42% EBIT 226 293 292 29% 0% Net profit 140 207 199 42% -4% Ratio-% Gross margins 35% 34% 35% EBITDA margins 31% 28% 34% Net margins 8% 9% 11% DE-x 0.72 0.71 0.65
Source: Major Cineplex, UOB Kay Hian
RESULTS
MAJOR posted 1Q15 earnings at Bt199m, up by 41% yoy but down by 4% qoq. The earnings were in line with both our and market expectations. Total revenue increased 3% yoy but dropped 18% qoq due to a sluggish economy as well as less interesting movies being screened.
KEY FINANCIALS Year to 31 Dec (Btm) 2013 2014 2015F 2016F 2017F
Net turnover 7,711 8,623 9,883 10,509 11,481EBITDA 1,986 2,296 2,843 3,104 3,305Operating profit 921 1,084 1,476 1,713 1,890Net profit (rep./act.) 1,052 1,086 1,458 1,655 1,813Net profit (adj.) 1,052 1,086 1,458 1,655 1,813EPS (Bt) 1.2 1.2 1.6 1.9 2.0PE (x) 28.7 27.9 20.8 18.3 16.7P/B (x) 4.9 4.8 4.6 4.4 4.2EV/EBITDA (x) 17.3 14.9 12.1 11.0 10.4Dividend yield (%) 2.9 3.1 3.9 4.4 4.8Net margin (%) 13.6 12.6 14.8 15.8 15.8Net debt/(cash) to equity (%) 70.4 62.6 59.8 52.1 44.3Interest cover (x) 13.3 13.3 16.2 16.6 17.7ROE (%) 17.0 17.5 22.6 25.0 25.5Consensus net profit - - 1,303 1,506 1,702UOBKH/Consensus (x) - - 1.12 1.10 1.07Source: Major Cineplex, Bloomberg, UOB Kay Hian n.m. : not meaningful; negative P/E, EV/EBITDA reflected as "n.m."
Tuesday , 12 May 2015
28 Refer to last page for important disclosures.
R e g i o n a l M o r n i n g N o t e s
STOCK IMPACT
Revenue breakdown in 1Q15 is as follows: admission revenue at 49%, concession revenue at 15%, advertising income at 15%, bowling group at 6%, rental and service at 8% and film distribution at 8%. Note that advertising revenue in 1Q15 grew impressively at 21%yoy driven by sponsorship income from its Cambodia branch and the Emquartier branch worth Bt20m. Furthermore, average ticket price significantly improved from Bt146 per ticket in 1Q14 to Bt160 per ticket in 1Q15 because the company reduced promotion campaigns on ticket sales. However, the company is still maintaining its policy of increasing average ticket prices by 3-5% per year. Gross margin in 1Q15 was 35%, unchanged from 1Q14. Net margin improved from 8% in 1Q14 to 11% in 1Q15 thanks to higher investment gain and efficient cost control.
1Q15 earnings should be the bottom of this year. We think that earnings momentum should improve from 2Q15 onwards thanks to several factors such as: a) the company plans to open 26 new screens in 2Q15 and 71 screens in 2H15, b) advertising revenue in 2Q15 should be strong as there will be several new naming sponsors due to the opening of a new branch at Emquartier, and c) there are several blockbuster movies from Hollywood being screened, such as Fast and Furious 7, Avengers: Age of Ultron and Tomorrow land, Ant-Man and Mission: Impossible 5. In addition, management revealed that revenue in Apr 15 grew about 60% yoy and revenue in May improved more than 30% yoy thanks to the success of Fast and Furious 7. The movie has been screening since 1 Apr 15 and has earned about Bt480m so far. Naresuan has earned Bt135m while Avengers: Age of Ultron has earned about Bt220m so far. We anticipated that 2Q15 earnings should be nearly Bt500m, increasing by about 10% yoy.
Continue to expand business in neighbouring countries. Apart from opening a new branch with 7 screens in Cambodia last year, MAJOR plans to open another branch with 5-6 screens in Laos in Jun 15. The company targets to reach 100 screens overseas within 5 years.
EARNINGS REVISION/RISK
We revised our earnings projection this year by 5% as 2Q15 earnings should come in stronger than our previous expectation.
EARNIINGS REVISION TABLE 2013 2014 ---------2015F---------
old new Net profit (Btm) 1,052 1,086 1,394 1,458 %changed 5% %YoY 30% 3% 34%
Source: UOB Kay Hian
VALUATION/RECOMMENDATION
We maintain HOLD for MAJOR with a new target price at Bt38.50, pegged at 23.5x2015F PE or +1.0 SD to its 5-year mean at 18.4x. MAJOR should provide dividend yield of about 4% for 2015. Entry price is Bt33.25.
SHARE PRICE CATALYST
Economic recovery which should stimulate consumer spending.
Branch expansion.
BLOCKBUSTER HIGHLIGHT 2Q15 Blockbuster Highlights
Fast & Furious 7 Avengers: Age of Ultron
Tomorrow land Jurassic World
Mad Max: Fury Road Spy
Chappie Run All Night San Andreas
Paul Blart: Mall Cop 2 Thai movies
King Nreasuan 6 Cha Luiew
She's happy 2H15 Blockbuster Highlights
Jurassic World Terminator: Genisys
Minions Ant-Man
Mission: Impossible 5 The Fastastic Four Bond 24: Spectre
Star Wars: Episode VII The Hunger Games: Mockingjay, Part 2
Hitman: Agent 47 Pixels
Maze Runner Victor Frankenstein
Ted 2 Crimson Peak
The Good Dinosaur Pan
Attack on Titan Source: MAJOR
Tuesday , 12 May 2015
29 Refer to last page for important disclosures.
R e g i o n a l M o r n i n g N o t e s
PROFIT & LOSS Year to 31 Dec (Btm) 2014 2015F 2016F 2017F
Net turnover 8,623 9,883 10,509 11,481
EBITDA 2,296 2,843 3,104 3,305
Deprec. & amort. 1,211 1,367 1,391 1,415
EBIT 1,084 1,476 1,713 1,890
Total other non-operating income 232 297 306 315
Associate contributions 199 211 221 232
Net interest income/(expense) (173) (176) (187) (187)
Pre-tax profit 1,342 1,808 2,053 2,250
Tax (271) (364) (413) (453)
Minorities 15 14 15 16
Net profit 1,086 1,458 1,655 1,813
Net profit (adj.) 1,086 1,458 1,655 1,813
BALANCE SHEET Year to 31 Dec (Btm) 2014 2015F 2016F 2017F
Fixed assets 6,730 6,834 6,954 7,074
Other LT assets 4,820 4,722 4,722 4,722
Cash/ST investment 577 472 504 884
Other current assets 1,804 2,198 2,091 2,171
Total assets 13,932 14,226 14,271 14,851
ST debt 2,351 1,416 1,116 616
Other current liabilities 2,192 2,342 2,347 2,555
LT debt 2,188 3,000 3,000 3,500
Other LT liabilities 816 808 808 808
Shareholders' equity 6,331 6,598 6,929 7,291
Minority interest 56 63 71 80
Total liabilities & equity 13,932 14,226 14,271 14,851
CASH FLOW Year to 31 Dec (Btm) 2014 2015F 2016F 2017F
Operating 1,866 2,383 2,656 2,830
Pre-tax profit 1,342 1,808 2,053 2,250
Tax (271) (364) (413) (453)
Deprec. & amort. 1,211 1,367 1,391 1,415
Associates 0 0 0 0
Working capital changes (417) (252) (188) (195)
Other operating cashflows 0 (176) (187) (187)
Investing (717) (1,200) (1,000) (1,000)
Capex (growth) (613) (1,200) (1,000) (1,000)
Investments n.a. n.a. n.a. n.a.
Others (104) 0 0 0
Financing (1,067) (1,288) (1,624) (1,451)
Dividend payments (888) (1,166) (1,324) (1,451)
Issue of shares 38 0 0 0
Proceeds from borrowings 45 (122) (300) 0
Loan repayment n.a. n.a. n.a. n.a.
Others/interest paid (262) 0 0 0
Net cash inflow (outflow) 82 (105) 32 380
Beginning cash & cash equivalent 496 577 472 504
Ending cash & cash equivalent 577 472 504 884
KEY METRICS Year to 31 Dec (%) 2014 2015F 2016F 2017F
Profitability EBITDA margin 26.6 28.8 29.5 28.8
Pre-tax margin 15.6 18.3 19.5 19.6
Net margin 12.6 14.8 15.8 15.8
ROA 7.9 10.4 11.7 12.5
ROE 17.5 22.6 25.0 25.5
Growth Turnover 11.8 14.6 6.3 9.3
EBITDA 15.6 23.8 9.2 6.5
Pre-tax profit 3.2 34.7 13.6 9.6
Net profit 3.3 34.2 13.5 9.6
Net profit (adj.) 3.3 34.2 13.5 9.6
EPS 3.0 34.2 13.5 9.6
Leverage Debt to total capital 41.5 39.9 37.0 35.8
Debt to equity 71.7 66.9 59.4 56.5
Net debt/(cash) to equity 62.6 59.8 52.1 44.3
Interest cover (x) 13.3 16.2 16.6 17.7
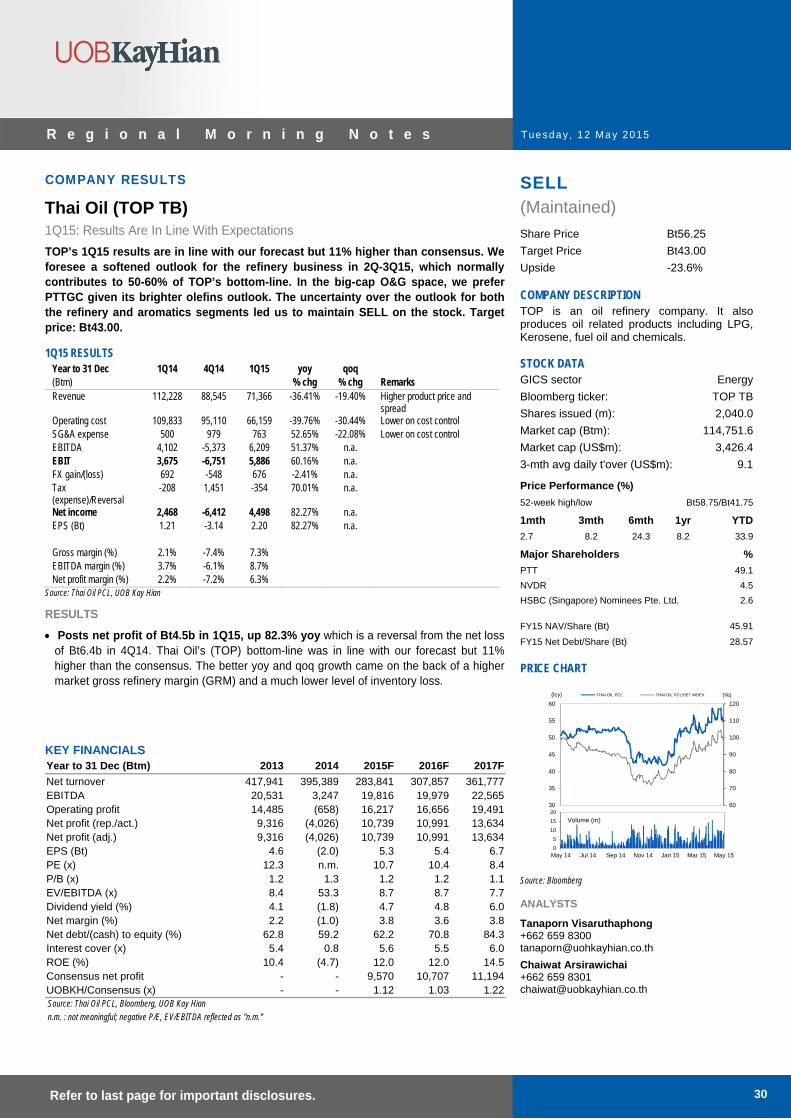
Tuesday , 12 May 2015
30 Refer to last page for important disclosures.
R e g i o n a l M o r n i n g N o t e s
COMPANY RESULTS SELL
(Maintained)
Share Price Bt56.25
Target Price Bt43.00
Upside -23.6%
COMPANY DESCRIPTION TOP is an oil refinery company. It also produces oil related products including LPG, Kerosene, fuel oil and chemicals.
STOCK DATA GICS sector Energy
Bloomberg ticker: TOP TB
Shares issued (m): 2,040.0
Market cap (Btm): 114,751.6
Market cap (US$m): 3,426.4
3-mth avg daily t'over (US$m): 9.1
Price Performance (%) 52-week high/low Bt58.75/Bt41.75
1mth 3mth 6mth 1yr YTD
2.7 8.2 24.3 8.2 33.9
Major Shareholders %
PTT 49.1
NVDR 4.5
HSBC (Singapore) Nominees Pte. Ltd. 2.6
FY15 NAV/Share (Bt) 45.91
FY15 Net Debt/Share (Bt) 28.57
PRICE CHART
60
70
80
90
100
110
120
30
35
40
45
50
55
60
(%)(lcy) THAI OIL PCL THAI OIL PCL/SET INDEX
0
5
10
15
20
May 14 Jul 14 Sep 14 Nov 14 Jan 15 Mar 15 May 15
Volume (m)
Source: Bloomberg
ANALYSTS
Tanaporn Visaruthaphong +662 659 8300 [email protected] Chaiwat Arsirawichai +662 659 8301 [email protected]
Thai Oil (TOP TB)
1Q15: Results Are In Line With Expectations
TOP’s 1Q15 results are in line with our forecast but 11% higher than consensus. We foresee a softened outlook for the refinery business in 2Q-3Q15, which normally contributes to 50-60% of TOP’s bottom-line. In the big-cap O&G space, we prefer PTTGC given its brighter olefins outlook. The uncertainty over the outlook for both the refinery and aromatics segments led us to maintain SELL on the stock. Target price: Bt43.00.
1Q15 RESULTS Year to 31 Dec 1Q14 4Q14 1Q15 yoy qoq (Btm) % chg % chg Remarks Revenue 112,228 88,545 71,366 -36.41% -19.40% Higher product price and
spread Operating cost 109,833 95,110 66,159 -39.76% -30.44% Lower on cost control SG&A expense 500 979 763 52.65% -22.08% Lower on cost control EBITDA 4,102 -5,373 6,209 51.37% n.a. EBIT 3,675 -6,751 5,886 60.16% n.a. FX gain/(loss) 692 -548 676 -2.41% n.a. Tax (expense)/Reversal
-208 1,451 -354 70.01% n.a.
Net income 2,468 -6,412 4,498 82.27% n.a. EPS (Bt) 1.21 -3.14 2.20 82.27% n.a. Gross margin (%) 2.1% -7.4% 7.3% EBITDA margin (%) 3.7% -6.1% 8.7% Net profit margin (%) 2.2% -7.2% 6.3%
Source: Thai Oil PCL, UOB Kay Hian
RESULTS
Posts net profit of Bt4.5b in 1Q15, up 82.3% yoy which is a reversal from the net loss of Bt6.4b in 4Q14. Thai Oil’s (TOP) bottom-line was in line with our forecast but 11% higher than the consensus. The better yoy and qoq growth came on the back of a higher market gross refinery margin (GRM) and a much lower level of inventory loss.
KEY FINANCIALS Year to 31 Dec (Btm) 2013 2014 2015F 2016F 2017F
Net turnover 417,941 395,389 283,841 307,857 361,777EBITDA 20,531 3,247 19,816 19,979 22,565Operating profit 14,485 (658) 16,217 16,656 19,491Net profit (rep./act.) 9,316 (4,026) 10,739 10,991 13,634Net profit (adj.) 9,316 (4,026) 10,739 10,991 13,634EPS (Bt) 4.6 (2.0) 5.3 5.4 6.7PE (x) 12.3 n.m. 10.7 10.4 8.4P/B (x) 1.2 1.3 1.2 1.2 1.1EV/EBITDA (x) 8.4 53.3 8.7 8.7 7.7Dividend yield (%) 4.1 (1.8) 4.7 4.8 6.0Net margin (%) 2.2 (1.0) 3.8 3.6 3.8Net debt/(cash) to equity (%) 62.8 59.2 62.2 70.8 84.3Interest cover (x) 5.4 0.8 5.6 5.5 6.0ROE (%) 10.4 (4.7) 12.0 12.0 14.5Consensus net profit - - 9,570 10,707 11,194UOBKH/Consensus (x) - - 1.12 1.03 1.22Source: Thai Oil PCL, Bloomberg, UOB Kay Hian n.m. : not meaningful; negative P/E, EV/EBITDA reflected as "n.m."
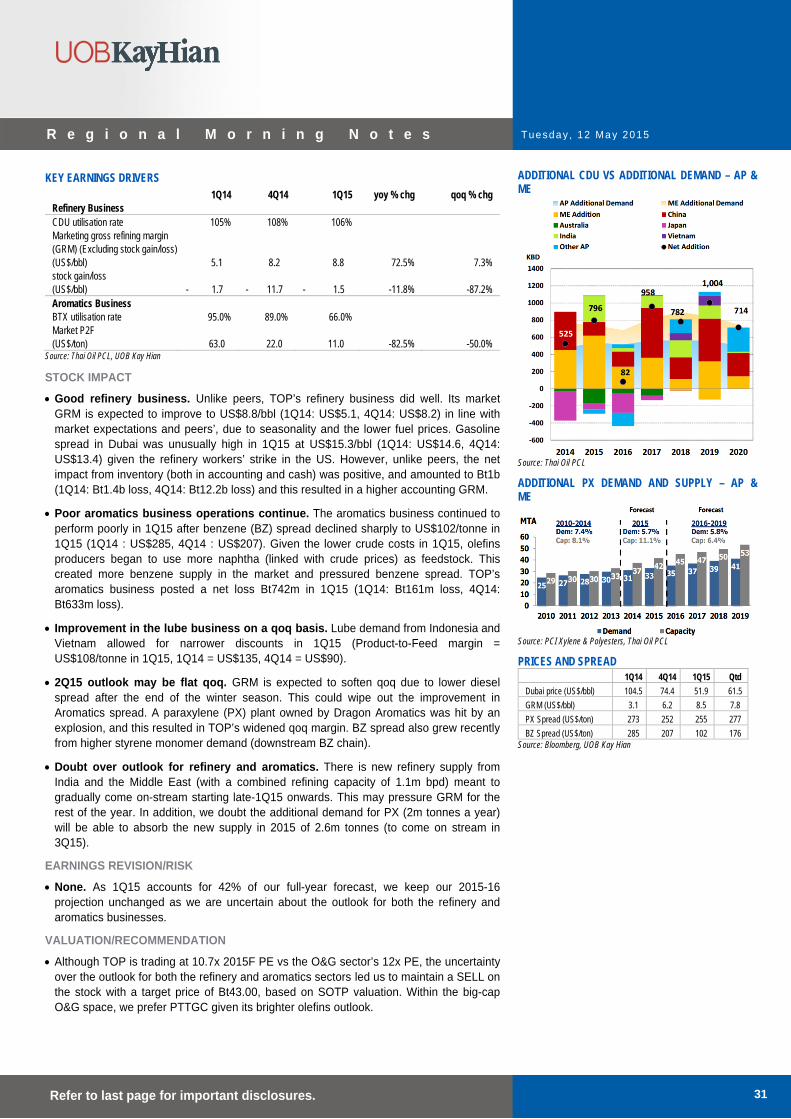
Tuesday , 12 May 2015
31 Refer to last page for important disclosures.
R e g i o n a l M o r n i n g N o t e s
KEY EARNINGS DRIVERS 1Q14 4Q14 1Q15 yoy % chg qoq % chg Refinery Business CDU utilisation rate 105% 108% 106% Marketing gross refining margin (GRM) (Excluding stock gain/loss) (US$/bbl) 5.1 8.2 8.8 72.5% 7.3% stock gain/loss (US$/bbl) - 1.7 - 11.7 - 1.5 -11.8% -87.2% Aromatics Business BTX utilisation rate 95.0% 89.0% 66.0% Market P2F (US$/ton) 63.0 22.0 11.0 -82.5% -50.0%
Source: Thai Oil PCL, UOB Kay Hian
STOCK IMPACT
Good refinery business. Unlike peers, TOP’s refinery business did well. Its market GRM is expected to improve to US$8.8/bbl (1Q14: US$5.1, 4Q14: US$8.2) in line with market expectations and peers’, due to seasonality and the lower fuel prices. Gasoline spread in Dubai was unusually high in 1Q15 at US$15.3/bbl (1Q14: US$14.6, 4Q14: US$13.4) given the refinery workers’ strike in the US. However, unlike peers, the net impact from inventory (both in accounting and cash) was positive, and amounted to Bt1b (1Q14: Bt1.4b loss, 4Q14: Bt12.2b loss) and this resulted in a higher accounting GRM.
Poor aromatics business operations continue. The aromatics business continued to perform poorly in 1Q15 after benzene (BZ) spread declined sharply to US$102/tonne in 1Q15 (1Q14 : US$285, 4Q14 : US$207). Given the lower crude costs in 1Q15, olefins producers began to use more naphtha (linked with crude prices) as feedstock. This created more benzene supply in the market and pressured benzene spread. TOP’s aromatics business posted a net loss Bt742m in 1Q15 (1Q14: Bt161m loss, 4Q14: Bt633m loss).
Improvement in the lube business on a qoq basis. Lube demand from Indonesia and Vietnam allowed for narrower discounts in 1Q15 (Product-to-Feed margin = US$108/tonne in 1Q15, 1Q14 = US$135, 4Q14 = US$90).
2Q15 outlook may be flat qoq. GRM is expected to soften qoq due to lower diesel spread after the end of the winter season. This could wipe out the improvement in Aromatics spread. A paraxylene (PX) plant owned by Dragon Aromatics was hit by an explosion, and this resulted in TOP’s widened qoq margin. BZ spread also grew recently from higher styrene monomer demand (downstream BZ chain).
Doubt over outlook for refinery and aromatics. There is new refinery supply from India and the Middle East (with a combined refining capacity of 1.1m bpd) meant to gradually come on-stream starting late-1Q15 onwards. This may pressure GRM for the rest of the year. In addition, we doubt the additional demand for PX (2m tonnes a year) will be able to absorb the new supply in 2015 of 2.6m tonnes (to come on stream in 3Q15).
EARNINGS REVISION/RISK
None. As 1Q15 accounts for 42% of our full-year forecast, we keep our 2015-16 projection unchanged as we are uncertain about the outlook for both the refinery and aromatics businesses.
VALUATION/RECOMMENDATION
Although TOP is trading at 10.7x 2015F PE vs the O&G sector’s 12x PE, the uncertainty over the outlook for both the refinery and aromatics sectors led us to maintain a SELL on the stock with a target price of Bt43.00, based on SOTP valuation. Within the big-cap O&G space, we prefer PTTGC given its brighter olefins outlook.
ADDITIONAL CDU VS ADDITIONAL DEMAND – AP & ME
Source: Thai Oil PCL
ADDITIONAL PX DEMAND AND SUPPLY – AP & ME
Source: PCI Xylene & Polyesters, Thai Oil PCL
PRICES AND SPREAD 1Q14 4Q14 1Q15 Qtd
Dubai price (US$/bbl) 104.5 74.4 51.9 61.5
GRM (US$/bbl) 3.1 6.2 8.5 7.8
PX Spread (US$/ton) 273 252 255 277
BZ Spread (US$/ton) 285 207 102 176 Source: Bloomberg, UOB Kay Hian
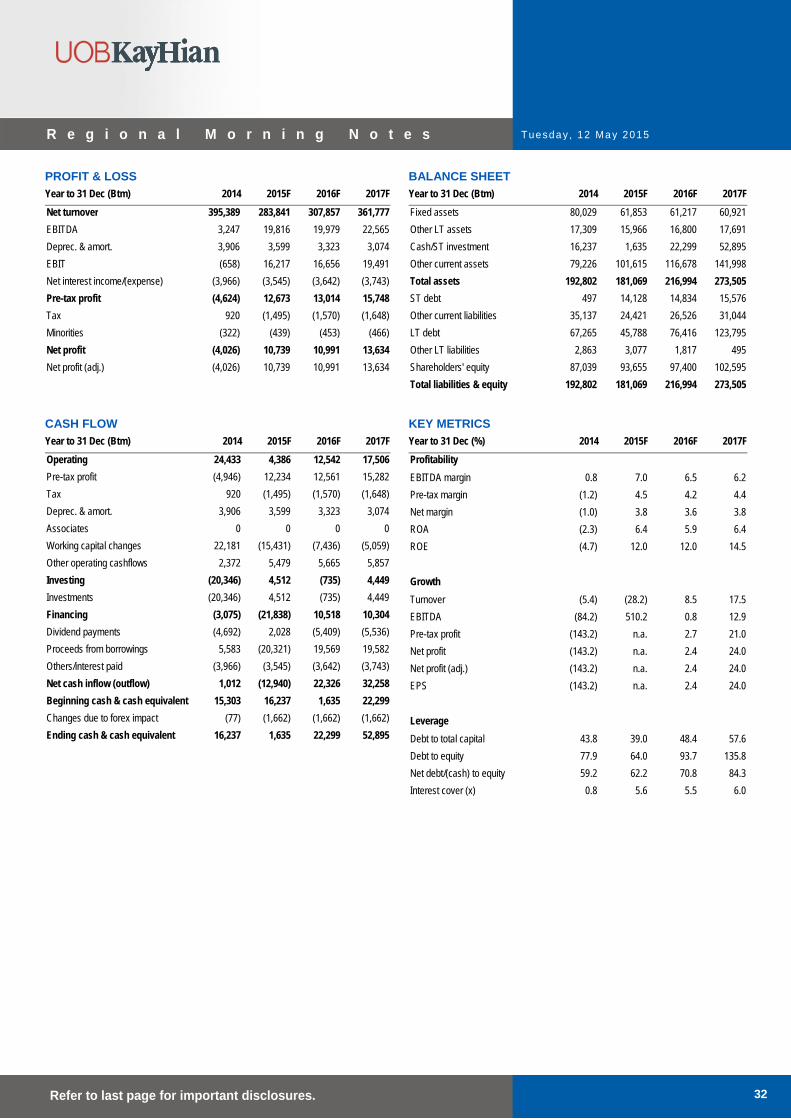
Tuesday , 12 May 2015
32 Refer to last page for important disclosures.
R e g i o n a l M o r n i n g N o t e s
PROFIT & LOSS Year to 31 Dec (Btm) 2014 2015F 2016F 2017F
Net turnover 395,389 283,841 307,857 361,777
EBITDA 3,247 19,816 19,979 22,565
Deprec. & amort. 3,906 3,599 3,323 3,074
EBIT (658) 16,217 16,656 19,491
Net interest income/(expense) (3,966) (3,545) (3,642) (3,743)
Pre-tax profit (4,624) 12,673 13,014 15,748
Tax 920 (1,495) (1,570) (1,648)
Minorities (322) (439) (453) (466)
Net profit (4,026) 10,739 10,991 13,634
Net profit (adj.) (4,026) 10,739 10,991 13,634
BALANCE SHEET Year to 31 Dec (Btm) 2014 2015F 2016F 2017F
Fixed assets 80,029 61,853 61,217 60,921
Other LT assets 17,309 15,966 16,800 17,691
Cash/ST investment 16,237 1,635 22,299 52,895
Other current assets 79,226 101,615 116,678 141,998
Total assets 192,802 181,069 216,994 273,505
ST debt 497 14,128 14,834 15,576
Other current liabilities 35,137 24,421 26,526 31,044
LT debt 67,265 45,788 76,416 123,795
Other LT liabilities 2,863 3,077 1,817 495
Shareholders' equity 87,039 93,655 97,400 102,595
Total liabilities & equity 192,802 181,069 216,994 273,505
CASH FLOW Year to 31 Dec (Btm) 2014 2015F 2016F 2017F
Operating 24,433 4,386 12,542 17,506
Pre-tax profit (4,946) 12,234 12,561 15,282
Tax 920 (1,495) (1,570) (1,648)
Deprec. & amort. 3,906 3,599 3,323 3,074
Associates 0 0 0 0
Working capital changes 22,181 (15,431) (7,436) (5,059)
Other operating cashflows 2,372 5,479 5,665 5,857
Investing (20,346) 4,512 (735) 4,449
Investments (20,346) 4,512 (735) 4,449
Financing (3,075) (21,838) 10,518 10,304
Dividend payments (4,692) 2,028 (5,409) (5,536)
Proceeds from borrowings 5,583 (20,321) 19,569 19,582
Others/interest paid (3,966) (3,545) (3,642) (3,743)
Net cash inflow (outflow) 1,012 (12,940) 22,326 32,258
Beginning cash & cash equivalent 15,303 16,237 1,635 22,299
Changes due to forex impact (77) (1,662) (1,662) (1,662)
Ending cash & cash equivalent 16,237 1,635 22,299 52,895
KEY METRICS Year to 31 Dec (%) 2014 2015F 2016F 2017F
Profitability EBITDA margin 0.8 7.0 6.5 6.2
Pre-tax margin (1.2) 4.5 4.2 4.4
Net margin (1.0) 3.8 3.6 3.8
ROA (2.3) 6.4 5.9 6.4
ROE (4.7) 12.0 12.0 14.5
Growth Turnover (5.4) (28.2) 8.5 17.5
EBITDA (84.2) 510.2 0.8 12.9
Pre-tax profit (143.2) n.a. 2.7 21.0
Net profit (143.2) n.a. 2.4 24.0
Net profit (adj.) (143.2) n.a. 2.4 24.0
EPS (143.2) n.a. 2.4 24.0
Leverage Debt to total capital 43.8 39.0 48.4 57.6
Debt to equity 77.9 64.0 93.7 135.8
Net debt/(cash) to equity 59.2 62.2 70.8 84.3
Interest cover (x) 0.8 5.6 5.5 6.0
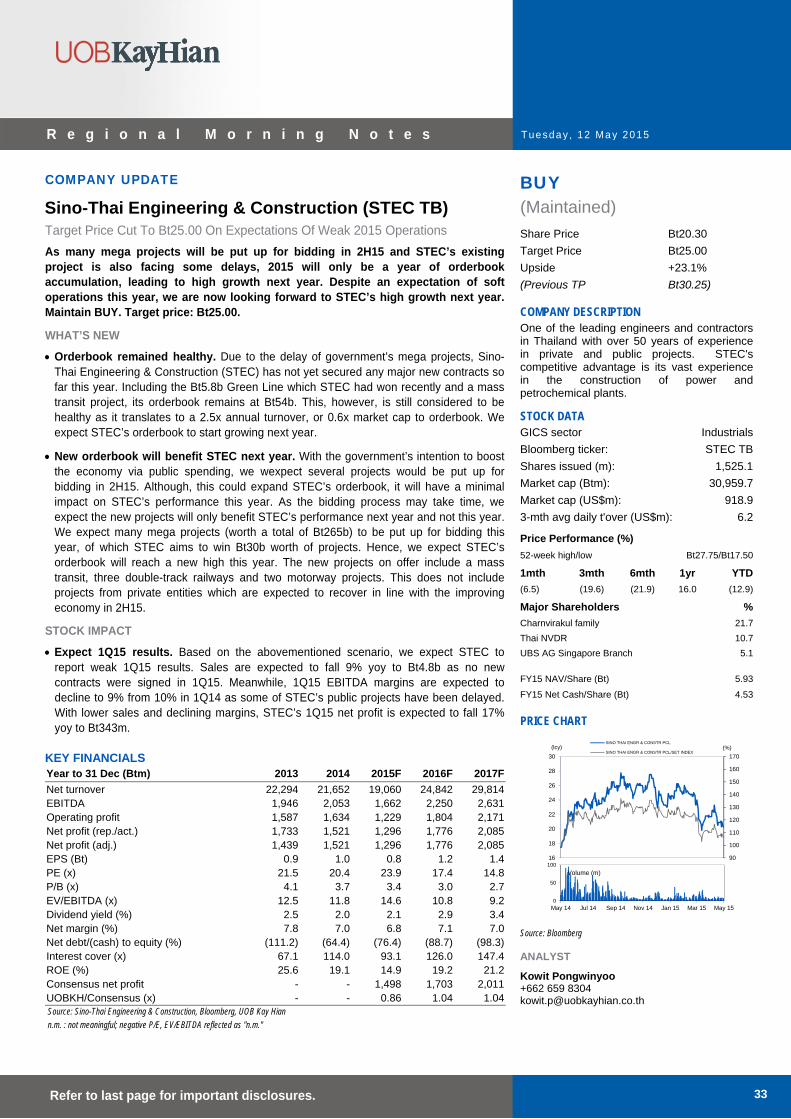
Tuesday , 12 May 2015
33 Refer to last page for important disclosures.
R e g i o n a l M o r n i n g N o t e s
COMPANY UPDATE BUY
(Maintained)
Share Price Bt20.30
Target Price Bt25.00
Upside +23.1%
(Previous TP Bt30.25)
COMPANY DESCRIPTION One of the leading engineers and contractors in Thailand with over 50 years of experience in private and public projects. STEC's competitive advantage is its vast experience in the construction of power and petrochemical plants.
STOCK DATA GICS sector Industrials
Bloomberg ticker: STEC TB
Shares issued (m): 1,525.1
Market cap (Btm): 30,959.7
Market cap (US$m): 918.9
3-mth avg daily t'over (US$m): 6.2
Price Performance (%) 52-week high/low Bt27.75/Bt17.50
1mth 3mth 6mth 1yr YTD
(6.5) (19.6) (21.9) 16.0 (12.9)
Major Shareholders %
Charnvirakul family 21.7
Thai NVDR 10.7
UBS AG Singapore Branch 5.1
FY15 NAV/Share (Bt) 5.93
FY15 Net Cash/Share (Bt) 4.53
PRICE CHART
90
100
110
120
130
140
150
160
170
16
18
20
22
24
26
28
30
(%)(lcy)SINO THAI ENGR & CONSTR PCL
SINO THAI ENGR & CONSTR PCL/SET INDEX
0
50
100
May 14 Jul 14 Sep 14 Nov 14 Jan 15 Mar 15 May 15
Volume (m)
Source: Bloomberg
ANALYST
Kowit Pongwinyoo +662 659 8304 [email protected]
Sino-Thai Engineering & Construction (STEC TB)
Target Price Cut To Bt25.00 On Expectations Of Weak 2015 Operations
As many mega projects will be put up for bidding in 2H15 and STEC’s existing project is also facing some delays, 2015 will only be a year of orderbook accumulation, leading to high growth next year. Despite an expectation of soft operations this year, we are now looking forward to STEC’s high growth next year. Maintain BUY. Target price: Bt25.00.
WHAT’S NEW
Orderbook remained healthy. Due to the delay of government’s mega projects, Sino-Thai Engineering & Construction (STEC) has not yet secured any major new contracts so far this year. Including the Bt5.8b Green Line which STEC had won recently and a mass transit project, its orderbook remains at Bt54b. This, however, is still considered to be healthy as it translates to a 2.5x annual turnover, or 0.6x market cap to orderbook. We expect STEC’s orderbook to start growing next year.
New orderbook will benefit STEC next year. With the government’s intention to boost the economy via public spending, we wexpect several projects would be put up for bidding in 2H15. Although, this could expand STEC’s orderbook, it will have a minimal impact on STEC’s performance this year. As the bidding process may take time, we expect the new projects will only benefit STEC’s performance next year and not this year. We expect many mega projects (worth a total of Bt265b) to be put up for bidding this year, of which STEC aims to win Bt30b worth of projects. Hence, we expect STEC’s orderbook will reach a new high this year. The new projects on offer include a mass transit, three double-track railways and two motorway projects. This does not include projects from private entities which are expected to recover in line with the improving economy in 2H15.
STOCK IMPACT
Expect 1Q15 results. Based on the abovementioned scenario, we expect STEC to report weak 1Q15 results. Sales are expected to fall 9% yoy to Bt4.8b as no new contracts were signed in 1Q15. Meanwhile, 1Q15 EBITDA margins are expected to decline to 9% from 10% in 1Q14 as some of STEC’s public projects have been delayed. With lower sales and declining margins, STEC’s 1Q15 net profit is expected to fall 17% yoy to Bt343m.
KEY FINANCIALS Year to 31 Dec (Btm) 2013 2014 2015F 2016F 2017F
Net turnover 22,294 21,652 19,060 24,842 29,814EBITDA 1,946 2,053 1,662 2,250 2,631Operating profit 1,587 1,634 1,229 1,804 2,171Net profit (rep./act.) 1,733 1,521 1,296 1,776 2,085Net profit (adj.) 1,439 1,521 1,296 1,776 2,085EPS (Bt) 0.9 1.0 0.8 1.2 1.4PE (x) 21.5 20.4 23.9 17.4 14.8P/B (x) 4.1 3.7 3.4 3.0 2.7EV/EBITDA (x) 12.5 11.8 14.6 10.8 9.2Dividend yield (%) 2.5 2.0 2.1 2.9 3.4Net margin (%) 7.8 7.0 6.8 7.1 7.0Net debt/(cash) to equity (%) (111.2) (64.4) (76.4) (88.7) (98.3)Interest cover (x) 67.1 114.0 93.1 126.0 147.4ROE (%) 25.6 19.1 14.9 19.2 21.2Consensus net profit - - 1,498 1,703 2,011UOBKH/Consensus (x) - - 0.86 1.04 1.04Source: Sino-Thai Engineering & Construction, Bloomberg, UOB Kay Hian n.m. : not meaningful; negative P/E, EV/EBITDA reflected as "n.m."
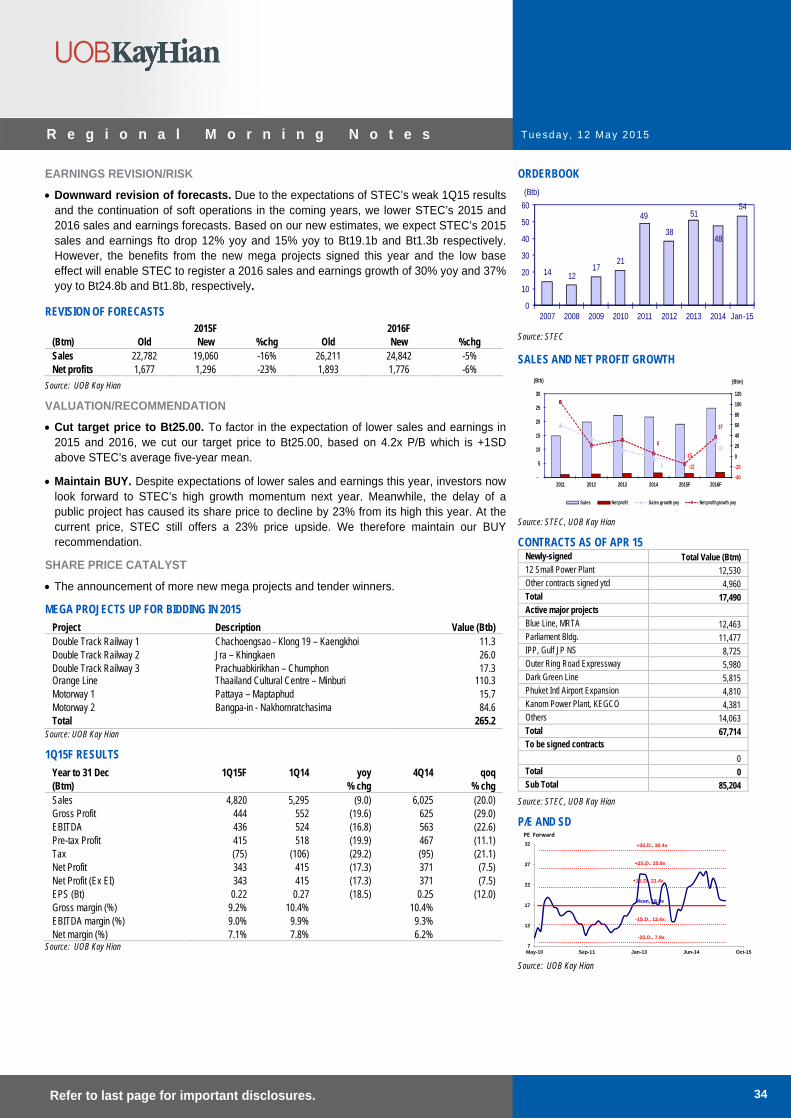
Tuesday , 12 May 2015
34 Refer to last page for important disclosures.
R e g i o n a l M o r n i n g N o t e s
EARNINGS REVISION/RISK
Downward revision of forecasts. Due to the expectations of STEC’s weak 1Q15 results and the continuation of soft operations in the coming years, we lower STEC’s 2015 and 2016 sales and earnings forecasts. Based on our new estimates, we expect STEC’s 2015 sales and earnings fto drop 12% yoy and 15% yoy to Bt19.1b and Bt1.3b respectively. However, the benefits from the new mega projects signed this year and the low base effect will enable STEC to register a 2016 sales and earnings growth of 30% yoy and 37% yoy to Bt24.8b and Bt1.8b, respectively.
REVISION OF FORECASTS 2015F 2016F (Btm) Old New %chg Old New %chg Sales 22,782 19,060 -16% 26,211 24,842 -5% Net profits 1,677 1,296 -23% 1,893 1,776 -6%
Source: UOB Kay Hian
VALUATION/RECOMMENDATION
Cut target price to Bt25.00. To factor in the expectation of lower sales and earnings in 2015 and 2016, we cut our target price to Bt25.00, based on 4.2x P/B which is +1SD above STEC’s average five-year mean.
Maintain BUY. Despite expectations of lower sales and earnings this year, investors now look forward to STEC’s high growth momentum next year. Meanwhile, the delay of a public project has caused its share price to decline by 23% from its high this year. At the current price, STEC still offers a 23% price upside. We therefore maintain our BUY recommendation.
SHARE PRICE CATALYST
The announcement of more new mega projects and tender winners.
MEGA PROJECTS UP FOR BIDDING IN 2015
Project Description Value (Btb) Double Track Railway 1 Chachoengsao - Klong 19 – Kaengkhoi 11.3 Double Track Railway 2 Jra – Khingkaen 26.0 Double Track Railway 3 Prachuabkirikhan – Chumphon 17.3 Orange Line Thaailand Cultural Centre – Minburi 110.3 Motorway 1 Pattaya – Maptaphud 15.7 Motorway 2 Bangpa-in - Nakhornratchasima 84.6 Total 265.2
Source: UOB Kay Hian
1Q15F RESULTS
Year to 31 Dec 1Q15F 1Q14 yoy 4Q14 qoq (Btm) % chg % chg Sales 4,820 5,295 (9.0) 6,025 (20.0) Gross Profit 444 552 (19.6) 625 (29.0) EBITDA 436 524 (16.8) 563 (22.6) Pre-tax Profit 415 518 (19.9) 467 (11.1) Tax (75) (106) (29.2) (95) (21.1) Net Profit 343 415 (17.3) 371 (7.5) Net Profit (Ex EI) 343 415 (17.3) 371 (7.5) EPS (Bt) 0.22 0.27 (18.5) 0.25 (12.0) Gross margin (%) 9.2% 10.4% 10.4% EBITDA margin (%) 9.0% 9.9% 9.3% Net margin (%) 7.1% 7.8% 6.2%
Source: UOB Kay Hian
ORDERBOOK
14 1217
21
49
38
51
48
54
0
10
20
30
40
50
60
2007 2008 2009 2010 2011 2012 2013 2014 Jan-15
(Btb)
Source: STEC
SALES AND NET PROFIT GROWTH
-3 -12
30 6
-15
37
-40
-20
0
20
40
60
80
100
120
-
5
10
15
20
25
30
2011 2012 2013 2014 2015F 2016F
(Btm)(Btb)
Sales Net profit Sales growth yoy Net profit growth yoy
Source: STEC, UOB Kay Hian
CONTRACTS AS OF APR 15 Newly-signed Total Value (Btm) 12 Small Power Plant 12,530 Other contracts signed ytd 4,960 Total 17,490 Active major projects
Blue Line, MRTA 12,463 Parliament Bldg. 11,477 IPP, Gulf JP NS 8,725 Outer Ring Road Expressway 5,980 Dark Green Line 5,815 Phuket Intl Airport Expansion 4,810 Kanom Power Plant, KEGCO 4,381 Others 14,063 Total 67,714 To be signed contracts
0 Total 0 Sub Total 85,204
Source: STEC, UOB Kay Hian
P/E AND SD
Mean, 16.9x
+2S.D., 25.9x
+1S.D., 21.4x
-1S.D., 12.4x
-2S.D., 7.9x
+3S.D., 30.4x
7
12
17
22
27
32
May-10 Sep-11 Jan-13 Jun-14 Oct-15
PE Forward
Source: UOB Kay Hian

Tuesday , 12 May 2015
35 Refer to last page for important disclosures.
R e g i o n a l M o r n i n g N o t e s
PROFIT & LOSS Year to 31 Dec (Btm) 2014 2015F 2016F 2017F
Net turnover 21,652 19,060 24,842 29,814
EBITDA 2,053 1,662 2,250 2,631
Deprec. & amort. 419 432 446 460
EBIT 1,634 1,229 1,804 2,171
Total other non-operating income 292 374 393 412
Associate contributions 11 8 8 9
Net interest income/(expense) (18) (18) (18) (18)
Pre-tax profit 1,919 1,594 2,188 2,575
Tax (389) (292) (406) (483)
Minorities (9) (6) (6) (6)
Net profit 1,521 1,296 1,776 2,085
Net profit (adj.) 1,521 1,296 1,776 2,085
BALANCE SHEET Year to 31 Dec (Btm) 2014 2015F 2016F 2017F
Fixed assets 3,166 3,260 3,357 3,457
Other LT assets 3,276 4,309 4,531 4,765
Cash/ST investment 5,566 7,134 9,250 11,406
Other current assets 12,996 11,796 14,583 16,988
Total assets 25,004 26,499 31,722 36,617
ST debt 90 82 83 83
Other current liabilities 15,837 16,579 20,641 24,303
LT debt 101 146 147 148
Other LT liabilities 427 456 487 522
Shareholders' equity 8,351 9,039 10,167 11,364
Minority interest 198 198 198 198
Total liabilities & equity 25,004 26,499 31,722 36,617
CASH FLOW Year to 31 Dec (Btm) 2014 2015F 2016F 2017F
Operating (850) 3,341 3,156 3,451
Pre-tax profit 1,908 1,586 2,179 2,566
Tax (389) (292) (406) (483)
Deprec. & amort. 419 432 446 460
Associates 11 8 8 9
Working capital changes (2,779) 1,621 943 915
Non-cash items (11) (8) (8) (9)
Other operating cashflows (9) (6) (6) (6)
Investing (1,464) (1,230) (425) (443)
Capex (growth) (1,464) (1,230) (425) (443)
Others n.a. n.a. n.a. n.a.
Financing (783) (543) (615) (852)
Dividend payments (763) (608) (648) (888)
Issue of shares 0 0 0 0
Proceeds from borrowings 0 66 33 36
Loan repayment (20) 0 0 0
Others/interest paid 0 0 0 0
Net cash inflow (outflow) (3,097) 1,568 2,116 2,156
Beginning cash & cash equivalent 8,663 5,566 7,134 9,250
Ending cash & cash equivalent 5,566 7,134 9,250 11,406
KEY METRICS Year to 31 Dec (%) 2014 2015F 2016F 2017F
Profitability EBITDA margin 9.5 8.7 9.1 8.8
Pre-tax margin 8.9 8.4 8.8 8.6
Net margin 7.0 6.8 7.1 7.0
ROA 6.1 5.0 6.3 6.8
ROE 19.1 14.9 19.2 21.2
Growth Turnover (2.9) (12.0) 30.3 20.0
EBITDA 5.5 (19.1) 35.4 16.9
Pre-tax profit 1.2 (17.0) 37.3 17.7
Net profit (12.2) (14.8) 37.0 17.4
Net profit (adj.) 5.7 (14.8) 37.0 17.4
EPS 5.7 (14.8) 37.0 17.4
Leverage Debt to total capital 2.2 2.4 2.2 2.0
Debt to equity 2.3 2.5 2.3 2.0
Net debt/(cash) to equity (64.4) (76.4) (88.7) (98.3)
Interest cover (x) 114.0 93.1 126.0 147.4
Tuesday , 12 May 2015
36 Refer to last page for important disclosures.
R e g i o n a l M o r n i n g N o t e s
Disclosures/Disclaimers This report is prepared and/or distributed by UOB Kay Hian Pte Ltd (“UOBKH”), which is a holder of a capital markets services licence and an exempt financial adviser in Singapore. This report is provided for information only and is not an offer or a solicitation to deal in securities or to enter into any legal relations, nor an advice or a recommendation with respect to such securities. This report is prepared for general circulation. It does not have regard to the specific investment objectives, financial situation and the particular needs of any recipient hereof. Advice should be sought from a financial adviser regarding the suitability of the investment product, taking into account the specific investment objectives, financial situation or particular needs of any person in receipt of the recommendation, before the person makes a commitment to purchase the investment product. This report is confidential. This report may not be published, circulated, reproduced or distributed in whole or in part by any recipient of this report to any other person without the prior written consent of UOBKH. This report is not intended for distribution, publication to or use by any person in any jurisdiction outside Singapore or any other jurisdiction as UOBKH may determine in its absolute discretion, where the distribution, publication or use of this report would be contrary to applicable law or would subject UOBKH and its connected persons (as defined in the Financial Advisers Act, Chapter 110 of Singapore) to any registration, licensing or other requirements within such jurisdiction. The information or views in the report (“Information”) has been obtained or derived from sources believed by UOBKH to be reliable. However, UOBKH makes no representation as to the accuracy or completeness of such sources or the Information and UOBKH accepts no liability whatsoever for any loss or damage arising from the use of or reliance on the Information. UOBKH and its connected persons may have issued other reports expressing views different from the Information and all views expressed in all reports of UOBKH and its connected persons are subject to change without notice. UOBKH reserves the right to act upon or use the Information at any time, including before its publication herein. Except as otherwise indicated below, (1) UOBKH, its connected persons and its officers, employees and representatives may, to the extent permitted by law, transact with, perform or provide broking, underwriting, corporate finance-related or other services for or solicit business from, the subject corporation(s) referred to in this report; (2) UOBKH, its connected persons and its officers, employees and representatives may also, to the extent permitted by law, transact with, perform or provide broking or other services for or solicit business from, other persons in respect of dealings in the securities referred to in this report or other investments related thereto; (3) the officers, employees and representatives of UOBKH may also serve on the board of directors or in trustee positions with the subject corporation(s) referred to in this report. (All of the foregoing is hereafter referred to as the “Subject Business”); and (4) UOBKH may otherwise have an interest (including a proprietary interest) in the subject corporation(s) referred to in this report. As of the date of this report, no analyst responsible for any of the content in this report has any proprietary position or material interest in the securities of the corporation(s) which are referred to in the content they respectively author or are otherwise responsible for. Each research analyst of UOBKH who produced this report hereby certifies that (1) the views expressed in this report in any event accurately reflect his/her personal views about all of the subject corporation(s) and securities in this report; (2) the report was produced independently by him/her; (3) he/she does not carry out, whether for himself/herself or on behalf of UOBKH or any other person, any of the Subject Business involving any of the subject corporation(s) or securities referred to in this report; and (4) he/she has not received and will not receive any compensation that is directly or indirectly related or linked to the recommendations or views expressed in this report or to any sales, trading, dealing or corporate finance advisory services or transaction in respect of the securities in this report. However, the compensation received by each such research analyst is based upon various factors, including UOBKH’s total revenues, a portion of which are generated from UOBKH’s business of dealing in securities. IMPORTANT DISCLOSURES FOR INCLUDED RESEARCH ANALYSES OR REPORTS OF FOREIGN RESEARCH HOUSES Where the report is distributed in Singapore and contains research analyses or reports from a foreign research house, please note: (i) recipients of the analyses or reports are to contact UOBKH (and not the relevant foreign research house) in Singapore in respect of any matters arising from, or in connection with, the analysis or report; and (ii) to the extent that the analyses or reports are delivered to and intended to be received by any person in Singapore who is not an accredited investor, expert investor or institutional investor, UOBKH accepts legal responsibility for the contents of the analyses or reports IMPORTANT DISCLOSURES FOR U.S. PERSONS This research report was prepared by UOBKH, a company authorized, as noted above, to engage in securities activities in Singapore. UOBKH is not a registered broker-dealer in the United States and, therefore, is not subject to U.S. rules regarding the preparation of research reports and the independence of research analysts. This research report is provided for distribution by UOBKH (whether directly or through its US registered broker dealer affiliate named below) to “major U.S. institutional investors” in reliance on the exemption from registration provided by Rule 15a-6 of the U.S. Securities Exchange Act of 1934, as amended (the “Exchange Act”). All US persons that
Tuesday , 12 May 2015
37 Refer to last page for important disclosures.
R e g i o n a l M o r n i n g N o t e s
receive this document by way of distribution from or which they regard as being from UOBKH by their acceptance thereof represent and agree that they are a major institutional investor and understand the risks involved in executing transactions in securities. Any U.S. recipient of this research report wishing to effect any transaction to buy or sell securities or related financial instruments based on the information provided in this research report should do so only through UOB Kay Hian (U.S.) Inc (“UOBKHUS”), a registered broker-dealer in the United States. Under no circumstances should any recipient of this research report effect any transaction to buy or sell securities or related financial instruments through UOBKH. UOBKHUS accepts responsibility for the contents of this research report, subject to the terms set out below, to the extent that it is delivered to and intended to be received by a U.S. person other than a major U.S. institutional investor. The analyst whose name appears in this research report is not registered or qualified as a research analyst with the Financial Industry Regulatory Authority (“FINRA”) and may not be an associated person of UOBKHUS and, therefore, may not be subject to applicable restrictions under FINRA Rules on communications with a subject company, public appearances and trading securities held by a research analyst account. Analyst Certification/Regulation AC As noted above, each research analyst of UOBKH who produced this report hereby certifies that (1) the views expressed in this report accurately reflect his/her personal views about all of the subject corporation(s) and securities in this report; (2) the report was produced independently by him/her; (3) he/she does not carry out, whether for himself/herself or on behalf of UOBKH or any other person, any of the Subject Business involving any of the subject corporation(s) or securities referred to in this report; and (4) he/she has not received and will not receive any compensation that is directly or indirectly related or linked to the recommendations or views expressed in this report or to any sales, trading, dealing or corporate finance advisory services or transaction in respect of the securities in this report. However, the compensation received by each such research analyst is based upon various factors, including UOBKH’s total revenues, a portion of which are generated from UOBKH’s business of dealing in securities. Copyright 2015, UOB Kay Hian Pte Ltd. All rights reserved. http://research.uobkayhian.com RCB Regn. No. 197000447W