Embed Size (px)
Citation preview
REGIONAL MULTINATIONALS AND THE KOREAN COSMETICS INDUSTRY
CHANG HOON OH* AND ALAN M. RUGMAN**
*Chang Hoon Oh Ph.D. Student in Business Economics Department
Kelley School of Business, Indiana University 1309 E. Tenth Street
Bloomington, IN 47405 U.S.A. Tel: 812-855-9219 Fax: 812-855-3354
Email: [email protected]
**Alan M. Rugman L. Leslie Waters Chair in International Business Kelley School of Business, Indiana University
1309 E. Tenth Street Bloomington, IN 47401-1701 U.S.A.
Tel: 812-855-5415 Fax: 812-855-9006
Email: [email protected]
February 27, 2006 Revised 4/17/06 Revised 5/9/06
Acknowledgement The authors wish to thank the editor and anonymous referees for their detailed comments and suggestions, which have greatly improved the paper.
1
Regional Multinationals and the Korean Cosmetics Industry
ABSTRACT
This paper analyzes the market penetration and expansion strategy of cosmetics and toiletries
multinational enterprises (MNEs) in South Korea from the perspective of regional strategy as
developed recently by Rugman. We find that MNEs have different market entry and expansion
strategies in the home region and in the foreign region. Home region MNEs (Japanese MNEs in
this case), in general, utilize their firm-specific advantages (FSAs) better than foreign region
MNEs (European and MNEs from the Americas in this case). Due to differences in transaction
costs, home region MNEs exploit downstream FSAs while foreign region MNEs develop
upstream FSAs. Market similarity also leads to a greater incentive to operate in the home region
rather than in foreign regions. The home region effect significantly increases the likelihood of
entry into foreign markets as the host country’s “diamond” significantly affects the market entry
strategies of MNEs.
Keywords: regional strategy, market penetration, cosmetics industry, double diamond, South
Korea.
2
INTRODUCTION
Today it is recognized that firms expand internationally mainly into nearby countries in their
home region. Rugman (2000, 2005) and Rugman and Verbeke (2004) show that the great
majority of world trade, foreign direct investment (FDI) and sales by large firms take place
within the three broad triad blocks of Asia, NAFTA and the EU, rather than between them.
Using data on the intra-regional sales of the largest 500 firms and case studies of many of these
firms it has been demonstrated that most multinational enterprises (MNEs) have not realized a
global strategy but rather a home region-based strategy.
In Rugman (2005), a home region firm is defined as one with over 50% of its sales in its
home region (for example, Wal-Mart has 94% of its sales in North America). A global firm is
defined as one with at least 20% of its sales in each of the broad triad regions, and less than 50%
in its home region (an example is LVMH). A bi-regional firm has at least 20% of its sales in two
regions of the triad but less than 50% in its home region (examples are the Belgian retailer
Delhaize le Lion and the Dutch firm Royal Ahold). In this paper we focus on the 100 largest
cosmetics firms: in these there are only Japanese and Korean firms present in Asia. The foreign
firms in the Korean cosmetics industry include those from Japan, United States, EU, Canada, and
Brazil.1
The basic theory of international management states that MNEs seek an optimal balance
of economic integration and national responsiveness (Bartlett & Ghoshal, 1998; Rugman &
Hodgetts, 2001). In doing so MNEs have an incentive to enter home region countries. In the
home region MNEs benefit from lower transaction costs than in foreign regions of the triad. This
1 In this article home region countries mean foreign countries in the same region of the triad. In Asia, with mainly
Japanese MNEs, South Korea is one such home region country.
3
occurs due to institutional factors such as: geographic adjacency; cultural similarity; market
knowledge; and regional government regulations (as in NAFTA and the EU), etc. This type of
analysis is broadly consistent with related theories such as: the eclectic theory (Dunning, 1988);
evolutionary theory (Nelson & Winter, 1982); the organizational capability perspective (Kogut &
Zander, 1993); and internalization theory (Buckley & Casson, 1976; Rugman, 1980).
Previous market entry studies can be categorized into three broad perspectives:
internalization theory, evolutionary theory, and the eclectic theory. Internalization theory is a
transaction cost theory of the MNE (Rugman, 1981) whereby firms best utilize FSAs and
country specific advantages (CSAs) (Buckley & Casson, 1976, 1998). 2 Evolutionary theory
focuses on organizational capability and learning. This view advocates a gradual involvement in
the foreign market (Johansson & Vahlne, 1977; Lambkin, 1988; Kogut & Zander, 1993;
Madhok, 1997; Pan & Tse, 2000). The eclectic theory integrates international business theories
and highlights ownership specific, location specific, and internalization advantages (Dunning,
1988; Agarwal & Ramaswami, 1992; Kim & Hwang, 1992; Woodcock, Beamish & Makino,
1994). The recent linkage-leverage-learning global framework by Mathews (2006) in a previous
article in this journal is somewhat superseded by the regional strategy theory of Rugman and
Verbeke (2004). In addition, Rugman and Verbeke (2001, 2003) and Verbeke (2003) have
shown that the resource based view (RBV) is fully consistent with the transaction cost economics
(TCE) theory of the MNE; indeed it is a sub case of internalization theory.
The fundamental questions of MNEs’ entry strategies need to be re-examined in the
context of the new regional MNE theory. What are the differences in entry strategies between
home region MNEs and host region MNEs in a host market? How do non-location bound FSAs
2 Rugman and Verbeke (2003) point out that the transaction cost theory and the resource-based view are same.
4
and local responsiveness affect market entry decisions of MNEs? We answer these questions, in
particular, by presenting the case of the South Korean cosmetics market. Some earlier work also
implicitly discusses the regional strategy of market entrance and expansion. For instance,
Aharoni (1966) concludes that firms analyze only a limited number of foreign markets initially,
and gradually expand their outlook to other foreign markets. Davidson (1983) suggests that
similarities in supply, demand, and uncertainty encourage foreign entry. The basic principle
behind this approach holds that increased efficiency in international marketing can be gained by
clustering markets into similar geographic groups.
This study contributes across two dimensions. First, we investigate the market entry
mode strategies of MNEs from a regional strategy perspective. Both in market entry and also in
subsequent expansion the MNEs’ home region strategy should be distinguished from that of
foreign region MNEs. Secondly, we empirically examine the CSAs in terms of the “diamond”
(Porter, 1990), and we find that the home region effect, as well as the FSAs and local
responsiveness to CSAs, significantly increases the likelihood of entry of cosmetics MNEs into
the South Korean market. Market entry research is a classical topic in international strategic
management (Melin, 1992; Peng, 2001). Peng (2001) actually suggests that research on the
actual channels (modes) of entry is necessary to integrate the RBV with TCE theory. Bearing this
in mind, here we analyze actual entry modes (levels of control) and the effects of marketing
channels in the home and host country on the entry strategy of MNEs in the South Korean
cosmetics market.
Examining the South Korean cosmetics market is important and relevant because it is
growing rapidly and is a base for cosmetics MNEs’ competition. The cosmetics industry is an
interesting theoretical research topic in itself as cosmetics products have the characteristics of
5
both chemical products and consumer care products, so cosmetics firms have both upstream and
downstream FSAs.
The article is organized as follows. In the next section, we will review key background
information about the world cosmetics industry and the cosmetics market in South Korea.
Sources and description of our data are also introduced. After presenting several research
hypotheses concerning the regional characteristics of cosmetics MNEs and regional strategy, we
report our findings. We conclude with a discussion of the contribution and possible extensions of
this study.
The Cosmetics Industry
The Global Cosmetics Industry
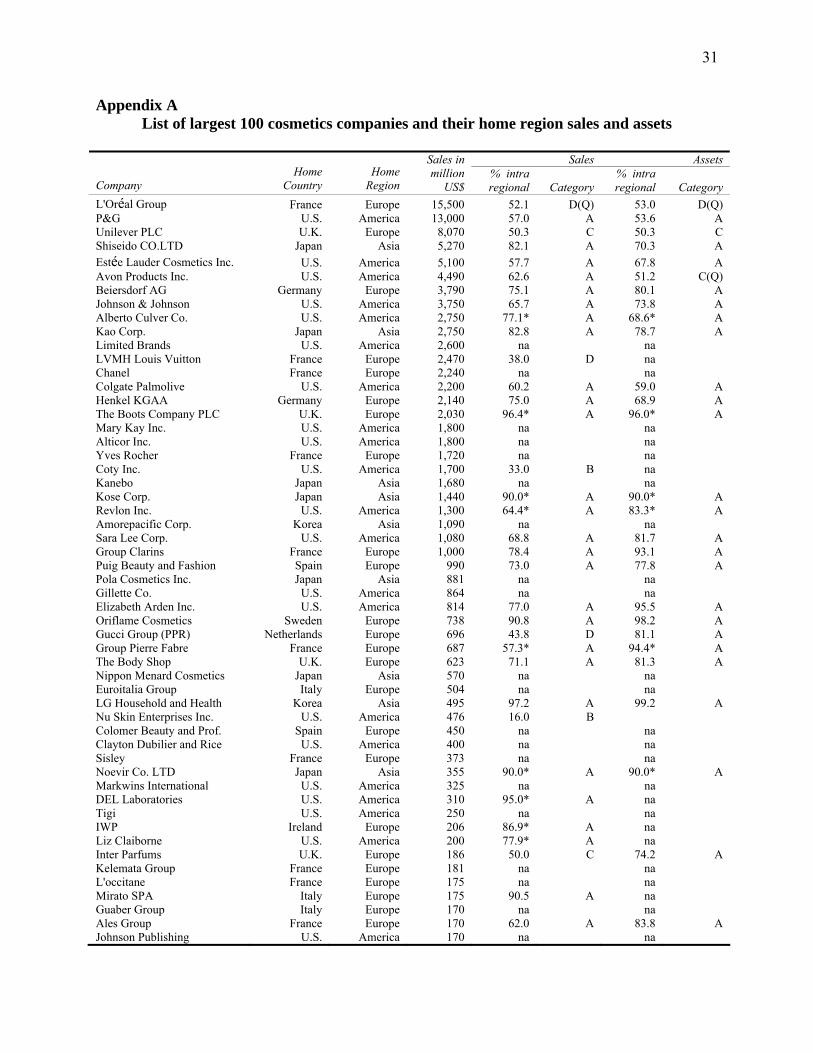
In this paper, we focus on the internationalization strategy of the world’s largest 100 cosmetics
companies. The list of the world’s largest 100 cosmetics companies and its sales comes from
Woman’s Wear Daily (WWD) magazine and is reported in Appendix A. WWD annually reports
on the largest 100 cosmetics companies based on sales. The cosmetics industry is regionally
based, with firms based in North America and in West European countries each accounting for
approximately 43% of it. Firms based in Japan and South Korea also have substantial market
share at 14%.3 Firms in the largest five countries (the United States, the U.K., France, Germany
and Japan) make up 93% of sales in our sample.
3 We compare the sales from WWD and firms’ annual reports if both are available. The values are almost identical
in either source excluding a few possible rounding errors.
6
Using Rugman’s (2005) classification of regional multinationals based on intra- and
inter-regional sales, only 16% of cosmetics MNEs actively participate in at least one foreign
triad market. The sales evidence is confirmed when we use data on the geographic dispersion of
assets. All cosmetics MNEs, except Unilever, invest more than 50% of assets in their home
region, and the average of their intra-region assets is 84%. In particular, small MNEs invest an
average of 92.6% assets in the home region, and all of them are therefore categorized as home
region oriented MNEs based on their geographic dispersion of assets.4
The retail distribution channels of cosmetics products vary by product and consumer
characteristics, such as department stores, discounters, grocery, pharmacy, direct sales, etc. We
categorized the distribution channels into four types based on retailer types: direct sales;
specialty stores; mass merchandisers; and the other channels.5 These categories also reflect local
responsiveness. Direct sales channels depend on an individual’s abilities as well as market and
consumer information, while mass merchandisers do not require this as much. Specialty stores
are positioned somewhere between direct sales and mass merchandisers with the salesperson’s
ability more important in the specialty stores channel than in the mass merchandise channel.
Sales by distribution channels vary with the consumer characteristics of each country. The
average percentages of world sales by retail channels are 10%, 13%, 53%, and 24% for direct
4 The average sales of Rugman’s 380 companies was $29.2 billion, while the average sales of our total sample is
$5.8 billion. We divide the largest 100 cosmetics companies into large MNEs and small MNEs based on their sales
in 2003. Sales of large MNEs are at least $1 billion in 2003, while those of small MNEs are less than $1 billion. In
this way 34 companies are categorized as large MNEs among cosmetics companies, while 66 companies are
categorized as small MNEs. 5 Specialty stores offer merchandise in one line with great variety at a price comparable to those of a department
store (Coughlan, Anderson, Stern & El-Ansary, 2001). Sephora is a good example of a cosmetics specialty store.
Mass merchandisers include department stores, grocery stores, discount stores, and hypermarkets. The other
channels include drug stores, outdoor markets, etc.
7
sales, specialty stores, mass merchandisers, and the other channels respectively in 2002.
(Euromonitor, 2003).
The Cosmetics Market in South Korea
The average growth rate of the cosmetics market in South Korea is about 11% for 1998 – 2003,
which is higher than the average growth rate of the global market, 2%. The market share of
imported cosmetics products is about 30% of the total cosmetics market in South Korea.6
According to the Korean Cosmetics Association’s 2004 report, total cosmetics imports have
decreased 3% per year since 2001 on average. In contrast, cosmetics imports from Japan have
increased 13% per year on average.
Among the largest 95 cosmetics companies (excluding five Korean cosmetics firms), 48
firms have officially entered the South Korean market.7 We categorize the penetration and
internationalization strategy into: no entry; exporting; licensing; joint venture (JV); and wholly
owned subsidiary (WOS). These entry modes are widely tested in the literature (Agarwal &
Ramaswami, 1992; Kim & Hwang, 1992; Buckley & Casson, 1998; Pan & Tse, 2000). Half of
the one hundred largest cosmetics companies have entered the South Korean market, with 88%
of the Japanese firms, 54% of the European firms and 38% of the U.S. firms there.
In 2002, the percentages of cosmetics sales by marketing channels in South Korea are:-
direct sales (23%); specialty stores (34%); mass merchandisers (38%); and the other channels 6 The market share of foreign branded products (including imported and locally produced foreign products) would
be higher than 30%. A few large cosmetics MNEs have production units in South Korea through JV and WOS. For
example, P&G, Revlon Inc., and Johnson and Johnson manufacture cosmetics products in South Korea.
7 Foreign firms’ activity data in the South Korean market come mainly from the Jang-up newspaper, a special
weekly newspaper for the cosmetics industry and professionals.
8
(5%). The proportions of direct sales and specialty stores channels in the South Korean market
are higher than the world average, while those of mass merchandisers and the other channels are
lower than the world average. In other words, cosmetics retailing in Korea is more difficult for
foreign MNEs than in other countries, because MNEs have to internalize high tacit and complex
activities. MNEs need, in general, higher local responsiveness and stronger ownership structure
of subsidiaries when they retail through salesperson oriented channels than when they sell
through mass merchandisers.
RESEARCH HYPOTHESES
The conventional framework of RBV needs to be augmented, as operating in the home triad
region may be associated with new needs for the development of regional bound FSAs, imposed
by regional integration (Rugman & Verbeke, 2004). Previous evidence shows that MNEs use not
global strategy but regional strategy, and it suggests that a regional bound FSA is easier to
exploit than an FSA in foreign regions.8 What kinds of benefits do home region MNEs have?
The benefits would be firm and industry specific, but in general home region MNEs achieve
more benefits (or fewer risks/uncertainty) than foreign region MNEs. The benefits can be
summarized as low transaction costs and market similarity.
Transaction Costs
In the home region of the triad, MNEs can benefit from geographic closeness (minimizing
transaction costs): economies of scale in sourcing, production, logistics, etc. Upstream FSAs
8 See also Rugman and Girod (2003), Rugman and Collinson (2004), and Rugman and Collinson (2005).
9
occur mainly from economies of scale, with MNEs producing regional products rather than
global products. Home region MNEs can endeavor to exploit location specific advantages
(LSAs). Substantial research of the host market consumer is a prerequisite for successful
introduction of new products (Vernon, 1971), but the costs of market entry and marketing
operations can be reduced if marketing strategies and operations can be standardized for a set of
similar markets (Davidson, 1983). Often, decentralization benefits will be smaller than
centralization benefits during the early period of business in the home region country (based on
transaction cost analysis) because of lower brand recognition and the small size of market share.
H1: Large MNEs prefer a high control mode (such as a subsidiary) to a low control mode
(such as an alliance).
H2: Low transaction costs of home region MNEs make upstream investment unattractive
when they enter into the host market.
On the other hand, since foreign MNEs have higher transaction costs than home region
MNEs, they need to develop location bound FSAs. To overcome insufficient development of
regional bound FSAs, foreign MNEs need to have non-regional bound FSAs, such as size, brand
recognition, technological ability, organizational capability, multinational experience, etc.
Therefore the economic integration and local responsiveness framework (Bartlett & Ghoshal,
1998) and/or the FSA and CSA framework (Rugman, 1981; Rugman & Verbeke, 1992) are
useful in analyzing regional strategy. Recently Peng, Lee, and Wang (2005) apply a similar
framework to analyze the scope of firms based on the institutional perspective. They propose a
matrix that captures the importance of product relatedness and institutional relatedness. Since the
firm’s diversification strategy is a function of economic benefit and transaction costs, their
10
framework is consistent with the FSA and CSA framework of international business which
underlies our analysis in this paper.
Agarwal and Ramaswami (1992) suggest that low control modes are considered superior
for many transactions since they allow a firm to benefit from the scale economies of the market
place, while not encountering the bureaucratic advantages that accompany integration. However,
if the market is unable to provide competing alternatives and/or managers are unable to predict
future contingencies, a low control mode will require a higher cost.
H3: High transaction costs lead foreign MNEs to exploit their upstream firm specific
advantages from the beginning.
Johansson and Wiedersheim-Paul (1975) and Johansson and Vahlne (1977) present
evidence, using four Swedish engineering firms, that firms gradually increase their control of
subsidiaries. They find that no firms start production in a country without having first sold in the
country via an agency or a sales subsidiary, and they claim that this is not exclusively a Swedish
phenomenon. Peng, Au, and Wang (2001) apply the stages theory of internationalization to the
governance structure of MNEs. They find that the demographic characteristics and governance
patterns of boards of Thailand based MNEs are statistically different from those of Thailand
based non-MNEs. Resources are needed for absorbing the high costs of marketing, for enforcing
patents and contracts, and for achieving economies of scale. Non-location bound FSAs are the
resource of the RBV. In the context of FDI, the non-location bound FSAs typically lead to scale
or scope economies and can be transferred abroad at low marginal costs (Rugman & Verbeke,
2001). Firm size is an important non-location bound FSAs. Empirical evidence indicates that the
impact of firm size on level of control is positive (Buckley & Casson, 1976; Caves & Mehra,
1986; Terpstra & Yu, 1988; Agarwal & Ramaswami, 1992).
11
H4: MNEs gradually increase their level of control of subsidiaries only when they have
developed non-location bound FSAs (size).
Market Similarity
Rugman and Verbeke (2004) point out that the relative lack of market success in host triad
regions can be interpreted, at least partly, as a reflection of the limited customer value attributed
to home region FSAs, whether transferred through exports, licensing, or FDI. The international
trade literature finds that common cultural characteristics increase interdependency between
trade pairs, and Rugman and Hodgetts (2001) also show highly regionally concentrated
international trade flows. Vernon (1971) suggests that demand for a product tends to be greatest
in countries with markets similar to that for which the product was originally developed, ceteris
paribus. Davidson (1983) finds that market similarity plays an important role in the market
selection decision. In general, countries within the triad share somewhat related cultures and a
common preference in goods. Moreover, multinational experience has been shown to influence
entry decision. (Caves & Mehra, 1986; Anderson & Gatignon, 1986; Terpstra & Yu, 1988;
Agarwal & Ramaswami, 1992; Woodcock, et al., 1994) Whether MNEs have a multinational
experience or not, home region MNEs can enjoy the benefit of home market similarity (regional
experience).
H5: MNEs from the home region have more location (downstream) FSAs in the local
market, and they penetrate the market earlier than MNEs from foreign regions.
H6: Within the same region, firms which have non-location bound FSAs (large MNEs)
enter the local market earlier than firms that do not have FSAs (small MNEs).
12
Market similarity should be examined not only at the regional level but also at the
country, firm and product levels. Kogut and Zander (1993) demonstrate that firms choose a high
control mode in cases of high knowledge tacitness, high complexity, and problematic
teachability. High-control entry modes are preferable for preserving and extending understanding
of complex and poorly understood activities. Products with such characteristics find it hard to
enter the local market, as they lack FSAs and CSAs. Economic theory would predict that
products will be purchased through the channel whose characteristics tend to minimize the
transactions costs incurred due to the product features and the purchasers’ endowments
(Lancaster, 1966).
Retailing represents such product characteristics and consumer characteristics, as it
consists of the activities involved in selling goods and services to ultimate consumers for
personal consumption (Coughlan, Anderson, Stern, & El-Ansary, 2001). A higher degree of
control is more efficient for technically sophisticated products and process, which tend to have a
higher proprietary content than unsophisticated products (Anderson & Gatignon, 1986).
Complex products and proprietary brand equity require the extensive participation of local
salespersons. On the other hand, simple and standardized products do not require a high degree
of control, and they typically use a common channel such as specialty stores and super stores.
Local responsiveness is maximized when foreign MNEs have a good non-location bound FSA,
which is matched with the host country’s local responsiveness.
In addition, retailing incorporates institutional and organizational characteristics. The
internal and external structure of firm has been developed to maximize performance in the
market. MNEs enter new (foreign) markets where they efficiently utilize their organizational
capability. The organizational capabilities are components of what we call the non-location
13
bound FSA. The adaptation of strategies, structures and processes to institutional idiosyncrasies
has been recognized as a major challenge for managers (Meyer & Peng, 2005). Institutional
relatedness, therefore, is a facilitator of local responsiveness. Stronger institutional relatedness
between home and host market will increase local responsiveness. In the double diamond
framework, Rugman and D’Cruz (1991) argue that strategic decisions made by managers of such
MNEs are influenced to a large extent by the requirement for market access to, and
competitiveness in, at least one of the triad blocks.
H7: MNEs which have good non-location bound FSAs and good local responsiveness are
likely to access a foreign market.
RESULTS
Transaction Costs
All of the hypotheses are highly supported by the evidence from the Korean cosmetics industry.
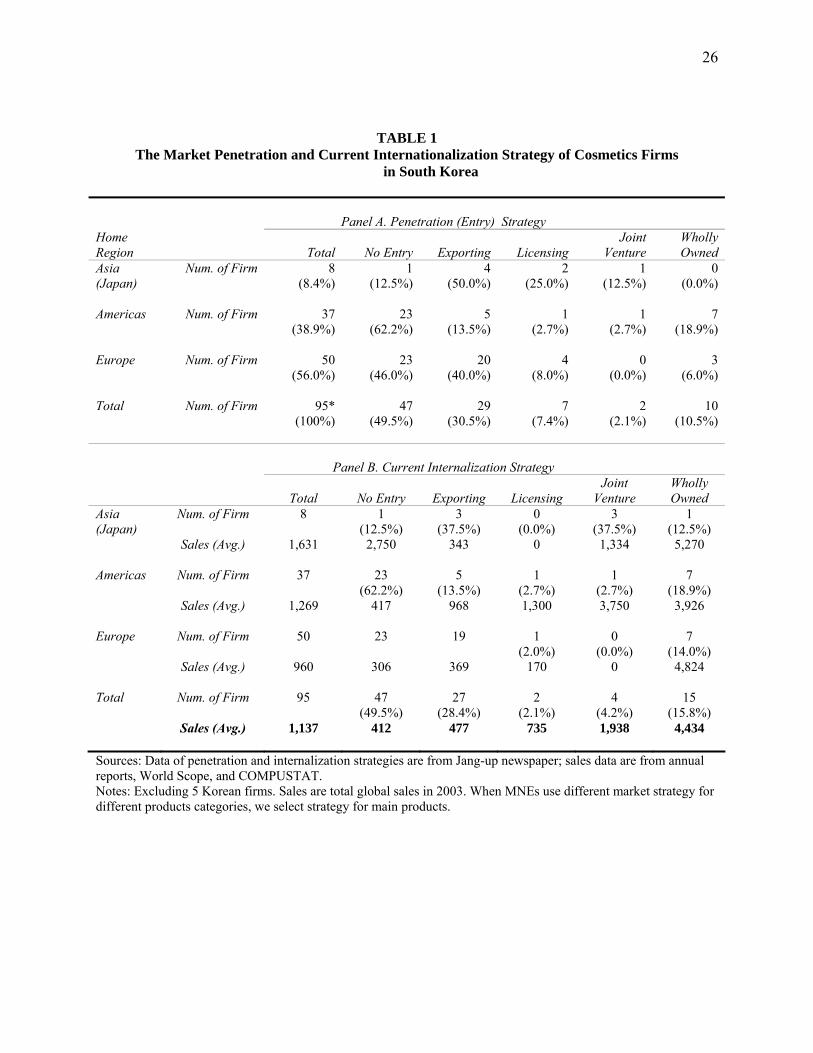
The market penetration strategies and the current level of internalization of cosmetics MNEs in
the South Korean market are summarized in Table 1. Approximately 50% of the largest one
hundred cosmetics MNEs have officially entered the South Korean market since 1964. Home
based MNEs (Japanese firms) show a higher entrance rate than foreign triad based MNEs. The
entry mode literature points out that market similarity makes MNEs choose a high investment
mode, but the results should be modified from the perspective of regional strategy and upstream
and downstream FSAs. As discussed in the previous section, because of low transaction costs,
home region MNEs prefer a low level of control to balance upstream FSAs and downstream
14
FSAs. By concentrating their upstream FSAs, such as production and sourcing, they can
maximize their economies of scale in the home country.
The evidence in panel A of Table 1 suggests that foreign region MNEs invest more when
they first enter the South Korean market, in comparison to home region MNEs. Large MNEs
prefer a high investment mode (such as a subsidiary) to a low investment mode (such as an
alliance); see panel B of Table 1. Average sales increase with the level of control; there are three
reasons. First, small MNEs have stricter budget constraints than large MNEs. Second, large
MNEs usually have more absorptive capacity than small MNEs. Finally, large MNEs need to
control their non-financial equity such as brand, R&D, and sales know-how etc, and this requires
a higher control mode for them than small MNEs. The evidence supports H1: large MNEs prefer
a high control mode to a low control mode.
Table 1 also show that Japanese cosmetics MNEs do not use WOS but generally use
exporting and licensing modes when they enter the South Korean cosmetics market; this supports
H2. The evidence of Japanese MNEs is consistent with the study of Makino and Beamish (1998).
They find that Japanese MNEs prefer JV to WOS as an entry strategy in eight Asian countries.
However, WOS is an attractive entry strategy to foreign region MNEs as well as exporting and
licensing; this supports H3.
Table 1 is approximately here
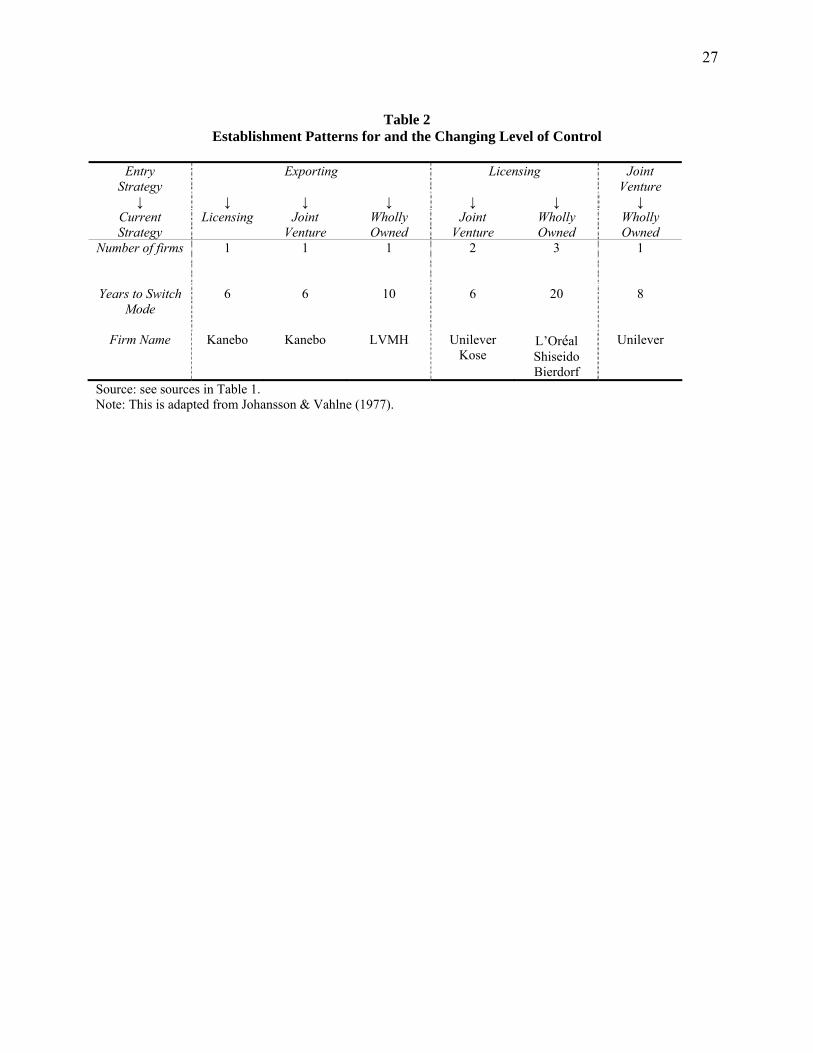
After entering the host market, MNEs may change their control of subsidiaries. The
development of FSAs requires a different ownership structure of subsidiaries. In our sample,
seven firms have changed the level of control in the South Korean market, while 41 firms have
15
maintained their initial penetration strategy. Two firms (Unilever and Kanebo) have changed
their control level twice; see Table 2.
Except for Louis Vuitton Moёt Hennessy (LVMH), which is the only retail global MNE
in the largest 500 companies (see Rugman & Verbeke, 2004), all six firms changed their level of
control gradually, and this finding is consistent with Johansson and Vahlne (1977). LVMH
changed its internalization strategy from trade to a WOS in the South Korean market after
acquiring Guerlain and Kenzo. LVMH’s sudden change in the ownership structure of its
subsidiary occurred because of the change of headquarters’ structure, not because of the change
of host market conditions. The sudden increase in FSAs of LVMH affected the ownership
structure of its subsidiary. All seven firms sell more than $1 billion over the world: their average
sales, $5.5 billion in 2003, are much higher than the sample average, $1.1 billion. This evidence
suggests that the capability of changing organization form needs non-location bound FSAs and
supports H4: MNEs gradually increase their level of control of subsidiaries only when they have
developed non-location bound FSAs (especially in size).
Table 2 is approximately here
Market Similarity
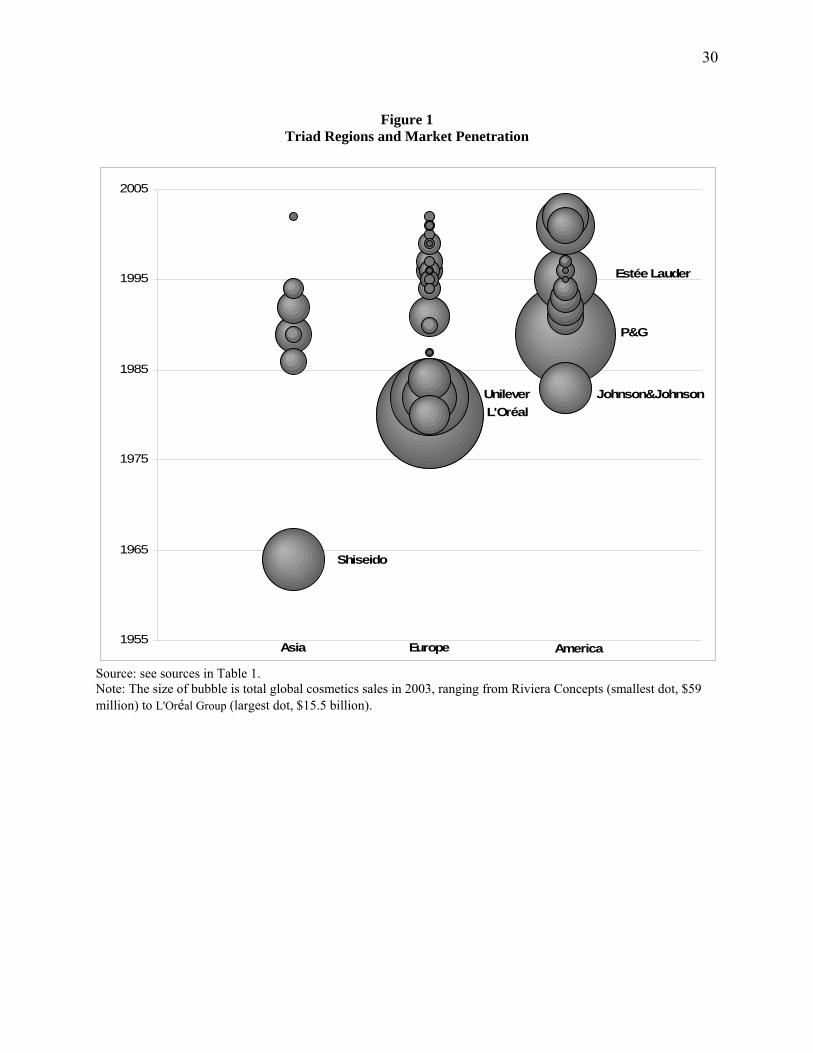
The evidence of the South Korean cosmetics industry also supports all hypotheses on market
similarity. The international strategy of MNEs can be distinguished between home region
strategy and foreign region strategy. In Figure 1, we classify cosmetics MNEs, which have
entered South Korea, according to their nationality. In general, home region MNEs entered
earlier than foreign region MNEs, and large MNEs entered earlier than small MNEs. This
16
supports H5 and H6. From the perspective of internalization (transaction cost) theory as well as
evolutionary theory and the eclectic theory, it is obvious that market similarity of the host
country provides greater incentives to home region MNEs than to foreign region MNEs. The
evidence is consistent with the findings of entry mode literature as shown in the previous section.
Figure 1 is approximately here
As discussed earlier, market similarity comes not only from the regional level but also
from the country, firm, and product level. Retailing also reflects the characteristics of local
responsiveness. Large MNEs usually produce and retail multiple products with multiple
channels, but they cannot fully replicate the channels which they use in the home country, in a
host country. The host market has a different diamond from the home market, and market
similarity should be examined by a double diamond framework (Rugman & D’Cruz, 1991;
Rugman & Verbeke, 1993). The channel selection in the host market is affected by non-location
bound FSAs (channel experience in home country) and local responsiveness (channel
configuration of host country).
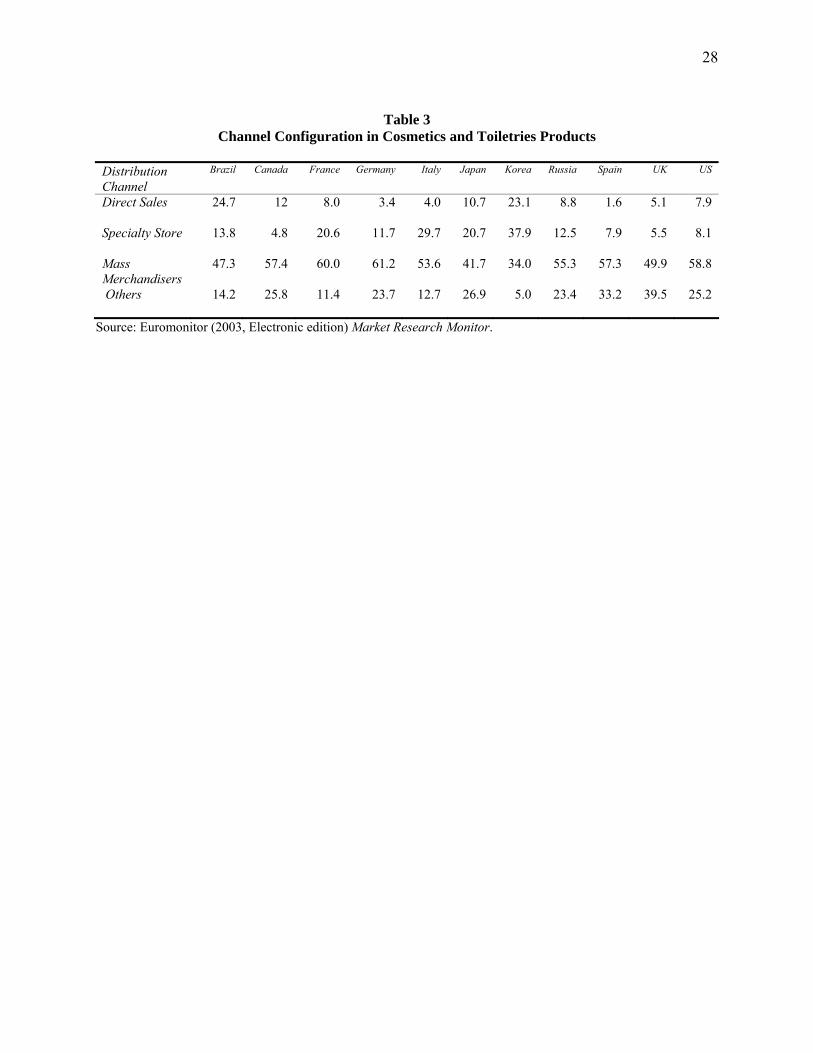
Table 3 presents distribution channel configurations for 11 countries. It shows that
channel configurations are different across countries. For example, specialty store channels in
France, South Korea and Japan are higher than other countries. Strong institutional relatedness
exists between the three countries. This gives a better opportunity to firms from France and
Japan than to other foreign MNEs in the South Korean cosmetics market. MNEs from France
and Japan show greater local responsiveness in the South Korean market, and they will enter
with a specialty store channel. On the other hand, the U.S., the U.K., German and Canadian
MNEs have a home diamond advantage in the mass merchandisers and the other channels, but
17
this FSA would not be very effective in the South Korean market, where the mass merchandisers
and the other channels account for small proportion compared to others. The U.S., the U.K.,
German, and Canadian MNEs need to exploit a new host diamond or need to supplement other
FSAs.
Table 3 is approximately here
We use a logit regression model to test the relationship between the double diamond
(local responsiveness) and market penetration. The logit regression model is widely used in entry
mode literature and channel selection literature; see, among others, Kim and Hwang (1992),
Agarwal and Ramaswami (1992), Li (1995), and Chen and Hennart (2002). We use 89 cosmetics
MNEs from 10 countries, and each company has four observations according to channel
configuration. Logit regression equation is formalizes as follows,
( ) ijijjiij esTriadDummilHostChannelHomeChannesalesfI ε+= ,,, of Log)Pr( ,
where )1Pr( =ijI is the probability that MNE i enters the South Korean market through
marketing channel j.
The Binomial dependent variable is 1 when the MNE i entered into the South Korean
market before 2003 though marketing channel j; otherwise it is 0. Log of sales is employed for
firm specific advantage. The home country channel and host (South Korea) country portion
represents home country diamond (non-location bound FSAs) and host country diamond (local
responsiveness). Triad dummies, for the Asia region and Europe region, are included to help
observe the regional specific advantages discussed in this paper (see also Appendix B for a
correlation matrix).
18
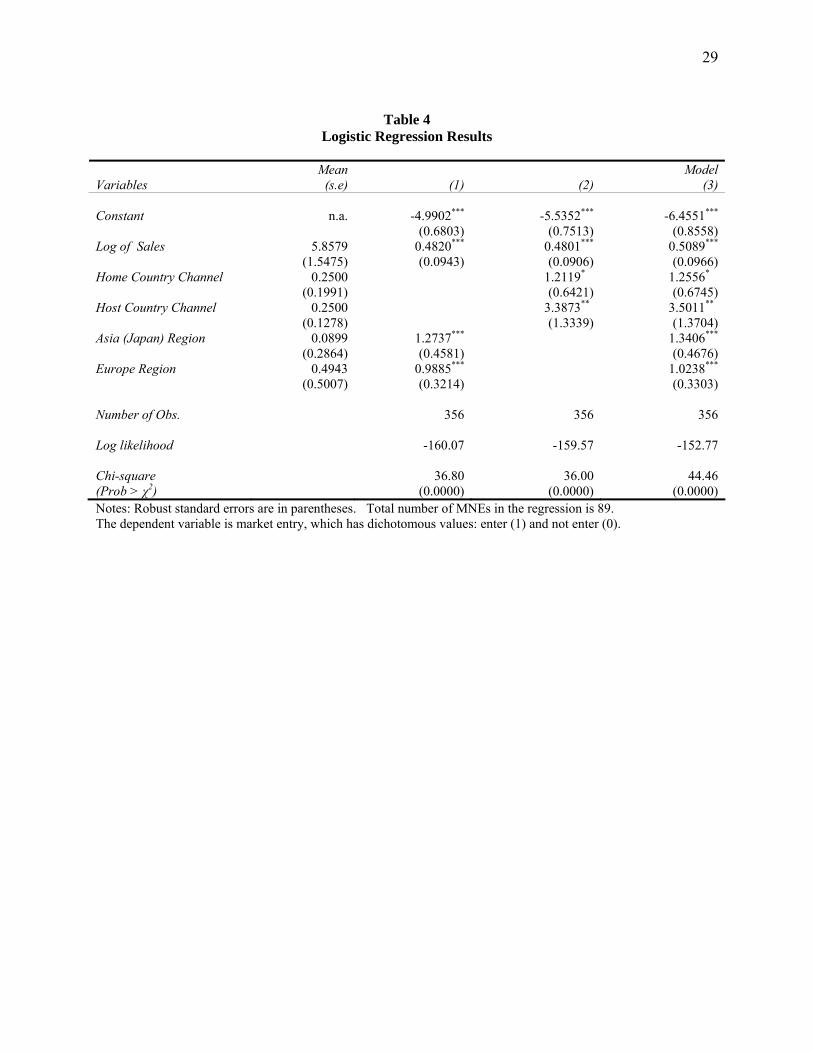
The results show positive and significant relationships: see Table 4. A positive sign
means that the variable increases the likelihood of a subsidiary entering with the specific channel
mode. The first model contains the effects of firm size (log of sales) and regional specific
advantage (region dummies). The second model includes the effects of non-location bound FSAs
and local responsiveness with firm size. The third model puts all the variables together. The
model is stable.
All three models are statistically significant, but log likelihood values and chi-square
values confirm that the third model is a better specification than the others. The results clearly
demonstrate the strategic importance of FSAs and local responsiveness (home country and host
country diamond) as well as regional bound advantages. The coefficient value of the host
country channel, 3.5011, is higher than the value of the home country channel, 1.2556. A small
gain of local responsiveness (host country diamond) increases the likelihood of entrance more
than the small gain of non-location bound FSAs (home country diamond) can do. An MNE
should carefully analyze the host market diamond, and it improves the MNE’s ability to adapt to
the host market.
In summary, the evidence supports H7: non-location bound FSAs and local
responsiveness have positive relationships with the market entry decision of MNEs. It is
important to note that firm size and regional dummies are significant, and the coefficient of the
Asia region dummy is, in particular, larger than the Europe region dummy and the America
region dummy. This suggests that Asian (Japanese) firms are more likely to enter the South
Korean market even though their FSAs and CSAs are the same as other foreign region MNEs.
These results also support H5 and H6.
19
Table 4 is approximately here
CONCLUSIONS
This evidence from the largest cosmetics companies in South Korea, in general, supports the
recent work on the regional nature of MNEs (Rugman & Verbeke, 2004; Rugman, 2005). In this
study, we find that the international strategy of MNEs distinguishes between a home region
strategy and a foreign region strategy. Home region MNEs’ market penetration and
internalization strategies are different than those of foreign region MNEs. The present analysis
also supports conventional theoretical and empirical evidence that entry and expansion of MNEs
are decided by a firm’s resources requirements, but the conventional framework of the resource-
based perspective needs to be augmented by the development of regional bound FSAs.
In this study we find that home region MNEs tend to exploit downstream FSAs, due,
presumably, to the differences in transaction costs, while foreign region MNEs tend to develop
upstream FSAs. MNEs gradually increase their level of control of subsidiaries and non-location
bound FSAs affect the ownership structure of subsidiaries. Market similarity also gives a greater
incentive to operate in their home region rather than in their foreign regions.
This study also provides an important empirical test of the “double diamond” framework
(Rugman & D’Cruz, 1991; Rugman & Verbeke, 1993). Not only does the home country
diamond but also the host country diamond affect the decision of market entry into the host
country market. As in the double diamond theory, the host country diamond is as important as
the home country for cosmetics MNEs. Firm specific advantage, proxied by firm size,
significantly increases the likelihood of entering the host market. Home region (Japanese) firms
20
are more likely to enter the South Korean market than are foreign region MNEs (from the United
States and European countries).
Two extensions come out of this study. First, although the hypotheses proposed are
largely supported for the cosmetics industry in the South Korean market, there remain data
limitations. Further research should generalize the results by extending the analysis to other
industries including several host country markets. Second, in this article we focus on FSAs and
CSAs to find the difference between home region MNEs and foreign region MNEs. Based on the
perspective of evolutionary theory and eclectic theory, it would be a useful extension to further
examine the relationship between the learning process and internalization advantages and to find
any further differences in the strategies of home region MNEs and foreign region MNEs.
In conclusion, this study provides additional evidence in support of the regional MNE
theory. Its findings agree with other single industry studies (e.g., on the retail sector, the
automotive sector, etc.). We also analyze this industry in an important Asian country, which is a
small, open economy in contrast to a “core” triad economy such as the E.U., the United States, or
Japan. More studies that investigate different industries and countries of various sizes are needed
to generalize the findings of this article on the regional importance of MNE market penetration
strategy. In particular, a future comparative study of MNEs in a large, open economy and in a
small, open economy will increase understanding of the institutional and macroeconomic factors
affecting the regional dimension of MNEs.
21
REFERENCES
Agarwal, S. & Ramaswami, S. 1992. Choice of foreign market entry mode: impact of ownership, location and
internalization factors. Journal of International Business Studies, 23: 1-27.
Aharoni, Y. 1966. The foreign investment decision process. Division of Research, Boston: Harvard Business
School.
Anderson, E. & Gatignon, H.A. 1986. Modes of foreign entry: A transaction cost analysis and propositions.
Journal of International Business Studies, 17(3): 1-26.
Bartlett, C. & Ghoshal, S. 1998. Managing across borders: The transnational solution. 2nd ed. Boston, MA:
Harvard Business School Press.
Buckley, P. & Casson, M. 1976. The future of the multinational enterprise. London: Macmillan and Co.
Buckley, P. J. & Casson, M. C. 1998. Analyzing foreign market entry strategies: Extending the internalization
approach. Journal of International Business Studies, 29(3):539-562.
Caves, R. E. & Mehra, S. K. 1986. Entry of foreign multinationals into U.S. manufacturing industries. In M.
E. Porter (ed.). Competition in Global Industries: 449-481, Boston: Harvard University Press.
Chen, S. S., & Hennart, J. 2002. Japanese investors choice of joint venture versus wholly-owned subsidiaries in
the US: the role of market barriers and firm capabilities. Journal of International Business Studies, 33(1):
1-18.
Coughlan, A.T., Anderson, E., Stern, L.W., & El-Ansary, A.I. 2001. Marketing channels. 6th ed. Upper Saddle
River, NJ: PrenticeHall.
Davidson, W. H. 1983. Market similarity and market selection: implications for international marketing strategy.
Journal of Business Research, 11: 439-456.
Dunning, J. H. 1988. The eclectic paradigm of international production: A restatement and some possible
extensions. Journal of International Business Studies, 19(1): 9-31
Euromonitor, 2003. Cosmetics and Toiletries: World Market Overview. Presentation material at In-cosmetics Trends
Presentations May 2003.
Gatignon, H. A. & Anderson, E. 1988. The multinational corporation’s degree of control over foreign
subsidiaries: An empirical test of a transaction cost explanation. Journal of Law, Economics and
Organization, 4(2): 305-336.
22
Johansson, J. & Vahlne, J. 1977. The internationalization process of the firm: A model of knowledge
development and increasing foreign market commitments. Journal of International Business Studies,
8(1): 23-32.
Johansson, J. & Wiedersheim-Paul, F. 1975. The internationalization of the firm-four Swedish cases. Journal
of Management Studies, 12(3): 305-322.
Kim, W. C. & Hwang, P. 1992. Global strategy and multinational’s entry mode choice. Journal of
International Business Studies, 23: 305-322.
Kogut, B. & Zander, U. 1993. Knowledge of the firm and the evolutionary theory of the multinational
corporation. Journal of International Business Studies, 24(4): 625-645.
Lambkin, M. 1988. Order of entry and performance in new markets. Strategic Management Journal, 9:
127-140.
Lancaster, K. 1966. A new approach to consumer theory. Journal of Political Economy, 74 (2): 132-157.
Li, J. 1995. Foreign entry and survival: effects of strategic choices on performance in international markets.
Strategic Management Journal, 16: 333-351.
Madhok, A. 1997. Cost, value and foreign market entry mode: The transaction and the firm. Strategic
Management Journal, 18: 36-61.
Makino, S. & Beamish, P. 1998. Local ownership restrictions, entry mode choice, and FDI performance: Japanese
overseas subsidiaries in Asia. Asia Pacific Journal of Management, 15(2): 119-136.
Mathews, J.A. 2006. Dragon multinationals; new players in 21st century globalization. Asia Pacific Journal of
Management, 23(1):5-27.
Melin, L. 1992. Internationalization as a strategy process. Strategic Management Journal, 13(8):99-118.
Meyer, K.E. & Peng, M.W. 2005. Probing theoretically into central and eastern Europe: transactions, resources,
and institutions. Journal of International Business Studies, 36(6):600-621.
Nelson, R.R. & Winter, S.G. 1982. An evolutionary theory of economic change. Cambridge, MA: Harvard
University Press.
Pan, Y. & Tse, D. K. 2000. The hierarchical model of market entry modes. Journal of International Business
Studies, 31(4): 535-554.
Peng, M.W. 2001. The resource-based view and international business. Journal of Management, 27(6):803-829.
23
Peng, M. W., Au, K. Y., & Wang, D. Y. L. 2001. Interlocking directorates as corporate governance in third world
multinationals: theory and evidence from Thailand. Asia Pacific Journal of Management, 18(2): 161-181.
Peng, M.W., Lee, S.H., & Wang, D.L. 2005. What determines the scope of the firm over time? A focus on
institutional relatedness. Academy of Management Review, 30(3):622-633.
Porter, M.E. 1990. The competitive advantage of nations. New York: Free Press, Macmillan.
Rugman, A. M. 1980. Internalization as a general theory of foreign direct investment. Weltwirtschaftliches Archiv ,
114 (2): 365-379.
Rugman, A.M. 1981. Inside the multinationals: The economics of internal markets. New York: Columbia
University Press.
Rugman, A. M. 1986. New theories of the multinational enterprise: An assessment of internalization theory.
Bulletin of Economic Research, 38(2): 101-118.
Rugman, A. M. 2000. The end of globalization, London: Random House /New York: Amacom–McGraw-Hill.
Rugman, A. M. 2005. The regional multinationals: MNEs and “global” strategic management. Cambridge:
Cambridge University Press.
Rugman, A. M. & D’Cruz, J. 1991. Fast forward: Improving Canada’s international competitiveness. Toronto:
Kodak Canada Inc.
Rugman, A. M. & Hodgetts, R. 2001. The end of global strategy. European Management Journal, 19(4):
333-343.
Rugman, A. M. & Collinson, S. 2004. The regional nature of the world’s automotive sector. European
Management Journal, 22(5): 471-482.
Rugman, A. M. & Collinson, S. 2005. Multinational enterprises in the new Europe: are they really global?,
Organizational Dynamic, 34(3): 258-272.
Rugman, A. M. & Girod, S. 2003. Retail multinationals and globalization: The evidence is regional. European
Management Journal, 21(1): 24-37.
Rugman, A. M. & Verbeke, A. 1992. A Note on the Transnational Solution and the Transaction Cost Theory
of Multinational Strategic Management. Journal of International Business Studies, 23(4): 761-71.
Rugman, A. M. & Verbeke, A. 1993. Foreign subsidiaries and multinational strategic management: An
24
extension and correction of Porter’s single diamond framework. Management International Review, 33(2):
71-84.
Rugman, A. M. & Verbeke, A. 2001. Subsidiary-specific advantages in multinational enterprises. Strategic
Management Journal, 22(3): 237-250.
Rugman, A. M. & Verbeke, A. 2003. Extending the theory of the multinational enterprise-internalization and
strategic management perspectives. Journal of International Business Studies, 34(2): 125-137.
Rugman, A. M. & Verbeke, A. 2004. A perspective on regional and global strategies of multinational
Enterprises. Journal of International Business Studies, 35(1): 3-18.
Terpstra, V. & Yu, C. 1988. Determinants of foreign investment of U.S. advertising agencies. Journal of
International Business Studies, 19(1): 33-46.
Verbeke, A., 2003. The evolutionary view of the MNE and the future of internalization theory. Journal
of International Business Studies, 34(6):498-504.
Vernon, R. 1971. Sovereignty at bay. New York: Basic Books.
Woodcock, C. P, Beamish, P. W., & Makino, S. 1994. Ownership-based entry mode strategies and
international performance. Journal of International Business Studies, 25(2): 253-273.
25
Biographical Notes Chang Hoon Oh is a Ph.D. candidate at the Kelley School of Business, Indiana University, 1309 E. Tenth Street, Bloomington, IN 47405, USA. His research interests center on the market penetration strategies, learning and financial performance of multinationals. Before joining the Ph.D. program, he was an assistant manager of marketing in a large electronic multinational enterprise. (Tel.: +1 812 855 9219; fax:+1 812 855 3354; e-mail: [email protected]). Alan M. Rugman is the L. Leslie Waters Chair of International Business at the Kelley School of Business, Indiana University, 1309 E. Tenth Street, Bloomington, IN 47401-1701, USA, where he is professor of international business and professor of business economics and public policy and director of the IU CIBER. He is president of the Academy of International Business, 2004–2006. He has been Thames Water Fellow in strategic management at Templeton College, University of Oxford. (Tel.: +1 812 855 5415; fax:+1 812 855 9006; e-mail: [email protected]; url: http://www.kelley.indiana.edu/rugman).
26
TABLE 1 The Market Penetration and Current Internationalization Strategy of Cosmetics Firms
in South Korea
Panel A. Penetration (Entry) Strategy Home Region Total No Entry Exporting Licensing
Joint Venture
Wholly Owned
Asia Num. of Firm 8 1 4 2 1 0 (Japan) (8.4%) (12.5%) (50.0%) (25.0%) (12.5%) (0.0%) Americas Num. of Firm 37 23 5 1 1 7 (38.9%) (62.2%) (13.5%) (2.7%) (2.7%) (18.9%) Europe Num. of Firm 50 23 20 4 0 3 (56.0%) (46.0%) (40.0%) (8.0%) (0.0%) (6.0%) Total Num. of Firm 95* 47 29 7 2 10 (100%) (49.5%) (30.5%) (7.4%) (2.1%) (10.5%)
Panel B. Current Internalization Strategy
Total No Entry Exporting Licensing Joint
Venture Wholly Owned
Asia Num. of Firm 8 1 3 0 3 1 (Japan) (12.5%) (37.5%) (0.0%) (37.5%) (12.5%) Sales (Avg.) 1,631 2,750 343 0 1,334 5,270 Americas Num. of Firm 37 23 5 1 1 7 (62.2%) (13.5%) (2.7%) (2.7%) (18.9%) Sales (Avg.) 1,269 417 968 1,300 3,750 3,926 Europe Num. of Firm 50 23 19 1 0 7 (2.0%) (0.0%) (14.0%) Sales (Avg.) 960 306 369 170 0 4,824 Total Num. of Firm 95 47 27 2 4 15 (49.5%) (28.4%) (2.1%) (4.2%) (15.8%) Sales (Avg.) 1,137 412 477 735 1,938 4,434
Sources: Data of penetration and internalization strategies are from Jang-up newspaper; sales data are from annual reports, World Scope, and COMPUSTAT. Notes: Excluding 5 Korean firms. Sales are total global sales in 2003. When MNEs use different market strategy for different products categories, we select strategy for main products.
27
Table 2
Establishment Patterns for and the Changing Level of Control
Entry Strategy
Exporting Licensing Joint Venture
↓ ↓ ↓ ↓ ↓ ↓ ↓ Current Strategy
Licensing Joint Venture
Wholly Owned
Joint Venture
Wholly Owned
Wholly Owned
Number of firms
1 1 1
2 3 1
Years to Switch Mode
6 6 10 6 20 8
Firm Name Kanebo Kanebo LVMH Unilever Kose
L’Oréal Shiseido Bierdorf
Unilever
Source: see sources in Table 1. Note: This is adapted from Johansson & Vahlne (1977).
28
Table 3
Channel Configuration in Cosmetics and Toiletries Products Distribution Channel
Brazil Canada France Germany Italy Japan Korea Russia Spain UK US
Direct Sales
24.7 12 8.0 3.4 4.0 10.7 23.1 8.8 1.6 5.1 7.9
Specialty Store
13.8 4.8 20.6 11.7 29.7 20.7 37.9 12.5 7.9 5.5 8.1
Mass Merchandisers
47.3 57.4 60.0 61.2 53.6 41.7 34.0 55.3 57.3 49.9 58.8
Others
14.2 25.8 11.4 23.7 12.7 26.9 5.0 23.4 33.2 39.5 25.2
Source: Euromonitor (2003, Electronic edition) Market Research Monitor.
29
Table 4
Logistic Regression Results
Model Variables
Mean (s.e) (1) (2) (3)
Constant
n.a. -4.9902*** (0.6803)
-5.5352*** (0.7513)
-6.4551*** (0.8558)
Log of Sales
5.8579 (1.5475)
0.4820*** (0.0943)
0.4801*** (0.0906)
0.5089*** (0.0966)
Home Country Channel
0.2500 (0.1991)
1.2119*** (0.6421)
1.2556*** (0.6745)
Host Country Channel
0.2500 (0.1278)
3.3873*** (1.3339)
3.5011*** (1.3704)
Asia (Japan) Region
0.0899 (0.2864)
1.2737*** (0.4581)
1.3406*** (0.4676)
Europe Region
0.4943 (0.5007)
0.9885*** (0.3214)
1.0238*** (0.3303)
Number of Obs.
356 356 356
Log likelihood
-160.07 -159.57 -152.77
Chi-square (Prob > χ2)
36.80 (0.0000)
36.00 (0.0000)
44.46 (0.0000)
Notes: Robust standard errors are in parentheses. Total number of MNEs in the regression is 89. The dependent variable is market entry, which has dichotomous values: enter (1) and not enter (0).
30
Figure 1
Triad Regions and Market Penetration
1955
1965
1975
1985
1995
2005
Shiseido
L'Oréal
P&G
Johnson&Johnson
Asia AmericaEurope
Unilever
Estée Lauder
Source: see sources in Table 1. Note: The size of bubble is total global cosmetics sales in 2003, ranging from Riviera Concepts (smallest dot, $59 million) to L'Oréal Group (largest dot, $15.5 billion).
31
Appendix A List of largest 100 cosmetics companies and their home region sales and assets
Sales Assets
Company Home
Country Home
Region
Sales in million
US$ % intra regional Category
% intra regional Category
L'Oréal Group France Europe 15,500 52.1 D(Q) 53.0 D(Q) P&G U.S. America 13,000 57.0 A 53.6 A Unilever PLC U.K. Europe 8,070 50.3 C 50.3 C Shiseido CO.LTD Japan Asia 5,270 82.1 A 70.3 A Estée Lauder Cosmetics Inc. U.S. America 5,100 57.7 A 67.8 A Avon Products Inc. U.S. America 4,490 62.6 A 51.2 C(Q) Beiersdorf AG Germany Europe 3,790 75.1 A 80.1 A Johnson & Johnson U.S. America 3,750 65.7 A 73.8 A Alberto Culver Co. U.S. America 2,750 77.1* A 68.6* A Kao Corp. Japan Asia 2,750 82.8 A 78.7 A Limited Brands U.S. America 2,600 na na LVMH Louis Vuitton France Europe 2,470 38.0 D na Chanel France Europe 2,240 na na Colgate Palmolive U.S. America 2,200 60.2 A 59.0 A Henkel KGAA Germany Europe 2,140 75.0 A 68.9 A The Boots Company PLC U.K. Europe 2,030 96.4* A 96.0* A Mary Kay Inc. U.S. America 1,800 na na Alticor Inc. U.S. America 1,800 na na Yves Rocher France Europe 1,720 na na Coty Inc. U.S. America 1,700 33.0 B na Kanebo Japan Asia 1,680 na na Kose Corp. Japan Asia 1,440 90.0* A 90.0* A Revlon Inc. U.S. America 1,300 64.4* A 83.3* A Amorepacific Corp. Korea Asia 1,090 na na Sara Lee Corp. U.S. America 1,080 68.8 A 81.7 A Group Clarins France Europe 1,000 78.4 A 93.1 A Puig Beauty and Fashion Spain Europe 990 73.0 A 77.8 A Pola Cosmetics Inc. Japan Asia 881 na na Gillette Co. U.S. America 864 na na Elizabeth Arden Inc. U.S. America 814 77.0 A 95.5 A Oriflame Cosmetics Sweden Europe 738 90.8 A 98.2 A Gucci Group (PPR) Netherlands Europe 696 43.8 D 81.1 A Group Pierre Fabre France Europe 687 57.3* A 94.4* A The Body Shop U.K. Europe 623 71.1 A 81.3 A Nippon Menard Cosmetics Japan Asia 570 na na Euroitalia Group Italy Europe 504 na na LG Household and Health Korea Asia 495 97.2 A 99.2 A Nu Skin Enterprises Inc. U.S. America 476 16.0 B Colomer Beauty and Prof. Spain Europe 450 na na Clayton Dubilier and Rice U.S. America 400 na na Sisley France Europe 373 na na Noevir Co. LTD Japan Asia 355 90.0* A 90.0* A Markwins International U.S. America 325 na na DEL Laboratories U.S. America 310 95.0* A na Tigi U.S. America 250 na na IWP Ireland Europe 206 86.9* A na Liz Claiborne U.S. America 200 77.9* A na Inter Parfums U.K. Europe 186 50.0 C 74.2 A Kelemata Group France Europe 181 na na L'occitane France Europe 175 na na Mirato SPA Italy Europe 175 90.5 A na Guaber Group Italy Europe 170 na na Ales Group France Europe 170 62.0 A 83.8 A Johnson Publishing U.S. America 170 na na
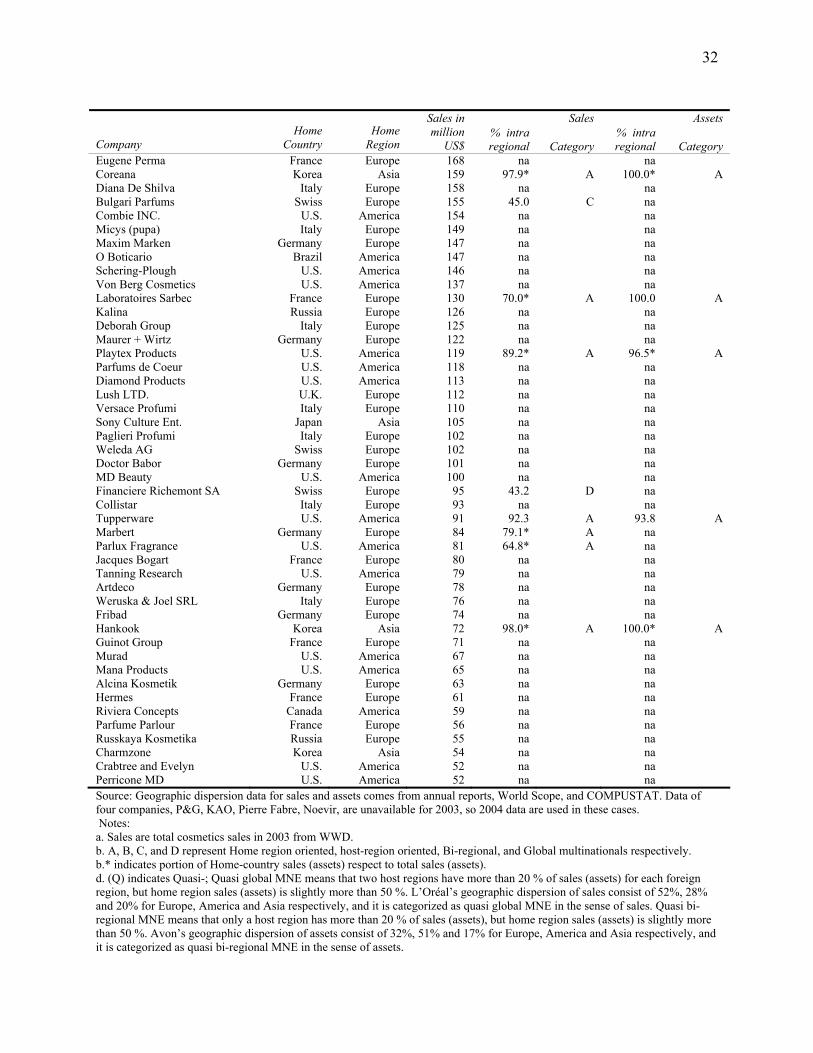
32
Sales Assets
Company Home
Country Home
Region
Sales in million
US$ % intra regional Category
% intra regional Category
Eugene Perma France Europe 168 na na Coreana Korea Asia 159 97.9* A 100.0* A Diana De Shilva Italy Europe 158 na na Bulgari Parfums Swiss Europe 155 45.0 C na Combie INC. U.S. America 154 na na Micys (pupa) Italy Europe 149 na na Maxim Marken Germany Europe 147 na na O Boticario Brazil America 147 na na Schering-Plough U.S. America 146 na na Von Berg Cosmetics U.S. America 137 na na Laboratoires Sarbec France Europe 130 70.0* A 100.0 A Kalina Russia Europe 126 na na Deborah Group Italy Europe 125 na na Maurer + Wirtz Germany Europe 122 na na Playtex Products U.S. America 119 89.2* A 96.5* A Parfums de Coeur U.S. America 118 na na Diamond Products U.S. America 113 na na Lush LTD. U.K. Europe 112 na na Versace Profumi Italy Europe 110 na na Sony Culture Ent. Japan Asia 105 na na Paglieri Profumi Italy Europe 102 na na Weleda AG Swiss Europe 102 na na Doctor Babor Germany Europe 101 na na MD Beauty U.S. America 100 na na Financiere Richemont SA Swiss Europe 95 43.2 D na Collistar Italy Europe 93 na na Tupperware U.S. America 91 92.3 A 93.8 A Marbert Germany Europe 84 79.1* A na Parlux Fragrance U.S. America 81 64.8* A na Jacques Bogart France Europe 80 na na Tanning Research U.S. America 79 na na Artdeco Germany Europe 78 na na Weruska & Joel SRL Italy Europe 76 na na Fribad Germany Europe 74 na na Hankook Korea Asia 72 98.0* A 100.0* A Guinot Group France Europe 71 na na Murad U.S. America 67 na na Mana Products U.S. America 65 na na Alcina Kosmetik Germany Europe 63 na na Hermes France Europe 61 na na Riviera Concepts Canada America 59 na na Parfume Parlour France Europe 56 na na Russkaya Kosmetika Russia Europe 55 na na Charmzone Korea Asia 54 na na Crabtree and Evelyn U.S. America 52 na na Perricone MD U.S. America 52 na na Source: Geographic dispersion data for sales and assets comes from annual reports, World Scope, and COMPUSTAT. Data of four companies, P&G, KAO, Pierre Fabre, Noevir, are unavailable for 2003, so 2004 data are used in these cases. Notes: a. Sales are total cosmetics sales in 2003 from WWD. b. A, B, C, and D represent Home region oriented, host-region oriented, Bi-regional, and Global multinationals respectively. b.* indicates portion of Home-country sales (assets) respect to total sales (assets). d. (Q) indicates Quasi-; Quasi global MNE means that two host regions have more than 20 % of sales (assets) for each foreign region, but home region sales (assets) is slightly more than 50 %. L’Oréal’s geographic dispersion of sales consist of 52%, 28% and 20% for Europe, America and Asia respectively, and it is categorized as quasi global MNE in the sense of sales. Quasi bi-regional MNE means that only a host region has more than 20 % of sales (assets), but home region sales (assets) is slightly more than 50 %. Avon’s geographic dispersion of assets consist of 32%, 51% and 17% for Europe, America and Asia respectively, and it is categorized as quasi bi-regional MNE in the sense of assets.
33
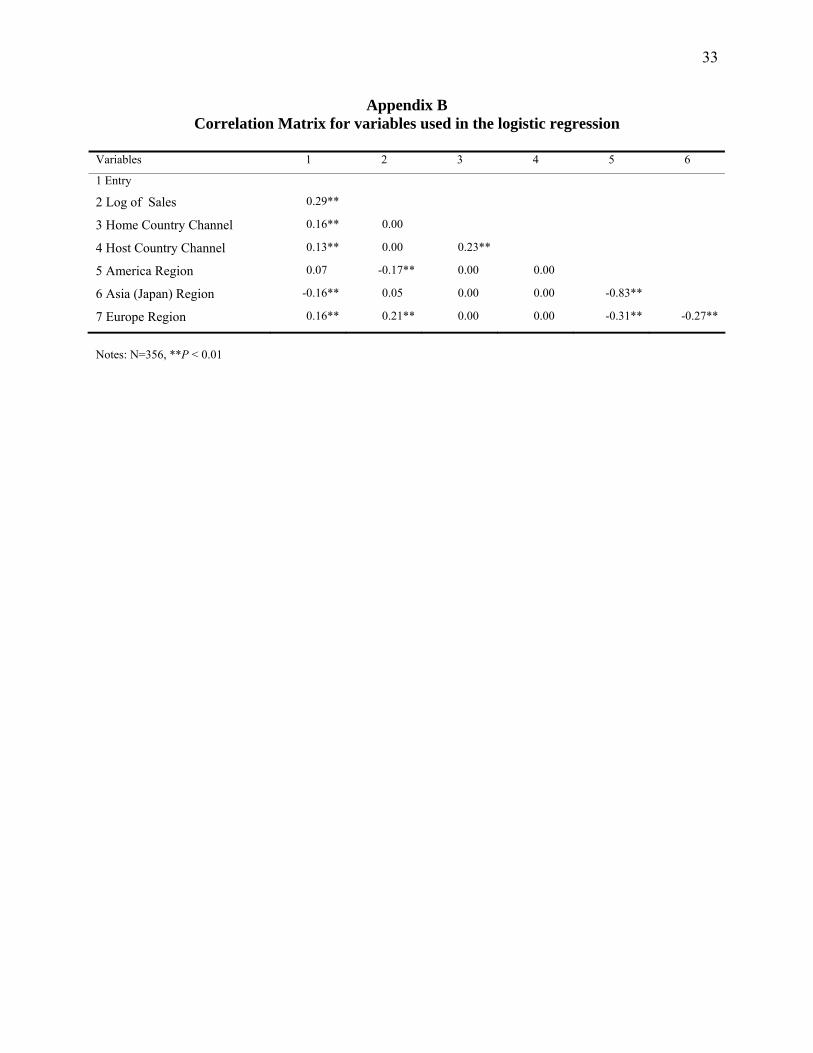
Appendix B Correlation Matrix for variables used in the logistic regression
Variables 1 2 3 4 5 6
1 Entry
2 Log of Sales 0.29**
3 Home Country Channel 0.16** 0.00**
4 Host Country Channel 0.13** 0.00** 0.23**
5 America Region 0.07** -0.17** 0.00** 0.00**
6 Asia (Japan) Region -0.16** 0.05** 0.00** 0.00** -0.83**
7 Europe Region 0.16** 0.21** 0.00** 0.00** -0.31** -0.27**
Notes: N=356, **P < 0.01