Embed Size (px)
Citation preview
Geoscience Frontiers 8 (2017) 841e850
HOSTED BY Contents lists available at ScienceDirect
China University of Geosciences (Beijing)
Geoscience Frontiers
journal homepage: www.elsevier .com/locate/gsf
Research paper
Regional representation of glaciers in Chandra Basin region, westernHimalaya, India
Pratima Pandey a,*, S. Nawaz Ali b, AL. Ramanathan c, P.K. Champati ray a,G. Venkataraman d
aGeosciences and Geohazards Department, Indian Institute of Remote Sensing, Dehradun, IndiabBirbal Sahni Institute of Paleosciences, Lucknow, Indiac School of Environmental Science, Jawaharlal Nehru University, New Delhi, IndiadCentre of Studies in Resource Engineering, Indian Institute of Technology, Powai, Mumbai, India
a r t i c l e i n f o
Article history:Received 29 February 2016Received in revised form12 May 2016Accepted 2 June 2016Available online 1 July 2016
Keywords:HimalayaGlacierRegional representationTopographyRemote sensing
* Corresponding author. Tel.: þ91 9892704091.E-mail address: [email protected] (P. Pandey)Peer-review under responsibility of China University
http://dx.doi.org/10.1016/j.gsf.2016.06.0061674-9871/� 2016, China University of Geosciences (BND license (http://creativecommons.org/licenses/by-n
a b s t r a c t
Hamtah and Chhota Shigri are two nearby, well monitored glaciers of western Himalaya, lying in thesame climatic zone and driven by the same climatic conditions. In this study, topographical character-istics of both the glacier have been explored to understand the role of topography in controlling theglacier response. Further, their topographical characteristics and possible response towards climaticvariations have been compared with each other and also with that of the other glaciers in the basin tofind out the suitability of these two glaciers to be considered as representative of the region. Multi sensorand multi temporal remote sensing data have been used to carry out to fulfill the objectives. It is foundthat being in the same climatic zone, the mean accumulation area ratio of Chhota Shigri is 54% andHamtah is 11% between 1980 and 2014. In comparison to Hamtah, Chhota Shigri glacier has a smallupslope area, low compactness ratio indicating the ability of the glacier to receive direct precipitationand solar radiation. The analysis revealed that the Chhota Shigri glacier has a closer resemblance with theother glaciers in the region than Hamtah glacier. Also, the topographical settings of Chhota Shigri glacierare suitable for recording and reflecting year-to-year climatic variations.
� 2016, China University of Geosciences (Beijing) and Peking University. Production and hosting byElsevier B.V. This is an open access article under the CC BY-NC-ND license (http://creativecommons.org/
licenses/by-nc-nd/4.0/).
1. Introduction
Glaciers respond directly to climate and therefore serve as thebest early indicator of climate change. The study of glaciers canprovide reconstructions of the past climate, the understanding ofpresent climate and an assumption of future climate. Himalaya, theyoungest and highest mountain chain in the world is home to alarge number of glaciers, some of which are largest in the worldoutside the polar regions. There are around 10,000 glaciers in theIndian Himalaya (Sangewar and Shukla, 2009), located at high andinaccessible regions. Monitoring and measurement of these gla-ciers are important in climatological, hydrological and societal as-pects. However, pertaining to the complexities of terrain, harshenvironment and logistic difficulties, it is not humanly possible to
.of Geosciences (Beijing).
eijing) and Peking University. Produc-nd/4.0/).
visit and directly monitor all the glaciers of Himalaya. In spite of theconstraints there are a few glaciers in Indian Himalaya which havebeen taken up for direct field measurements by various Indianresearch institutes, universities and government organizations(DST, 2012). The field measurement of Chhota Shigri (By JawaharlalNehru University, India), Hamtah (by Geological Survey of India),Dokriani and Chorabari (both by Wadia Institute of HimalayanGeology, India) are continuously being carried out since past fewyears. The Chhota Shigri and Hamtah are two nearby glaciers(within w15 km of each other) which fall under the same climaticzone. The melt water of both glaciers feed to the Chandra River,Chandra Basin, western Himalaya. The study of mass balance ofChhota Shigri glacier has reported that the glacier has been expe-riencing mass loss with a rate of �0.30 � 0.36 mwe y�1 over aperiod of 1969e2012 (Azam et al., 2014b), with a slight gain in themass during 1988 and 1999 (Vincent et al., 2013). Whereas, Hamtahglacier has a strong negative mass balance and is losing mass since2001 with a rate of �1.45 mwe y�1 (Geological Survey of India,2011; GSI henceforth). These results indicate variance in the
ction and hosting by Elsevier B.V. This is an open access article under the CC BY-NC-

Figure 1. Location map of Chhota Shigri and Hamtah glaciers. The upper image il-lustrates the dominated climatological zones of Western Himalaya, shown on SRTMDEM. The lower image shows Chhota Shigri and Hamtah glaciers on Landsat 8 image ofOctober 2014.
P. Pandey et al. / Geoscience Frontiers 8 (2017) 841e850842
response of Chhota Shigri and Hamtah glaciers towards the sameclimatic fluctuations. Further, there are about 201 glaciers in theChandra Basin (Sangewar and Shukla, 2009) and it is beyond thecapacity of any institute or organization to monitor each glacierindividually in the field. The objective of the present study is to findout which glacier between Hamtah and Chhota Shigri is more likelyto record climatic signals and can effectively reflect year-to-yearclimatic variations and can better represent the region. Therefore,the long term records available from the representative glaciers canbe utilized as input to various climatological and hydrologicalmodels to predict the future response of glaciers. However, with thedisparity in the responses of the two glaciers, the question arises asto which glacier reflects the climate fluctuations and can be takenas the representative of the whole region for modeling studies. Inview of this, the present study aims at addressing two fundamentalaspects:
(1) What are the key factors responsible for the variations in theresponses of Chhota Shigri and Hamtah glaciers and whichglacier between the two can be taken as representative for theregion; and
(2) Which glacier between these two is able to record climaticsignals and can reflect year-to-year climatic fluctuations forinferring climatic variability.
If climate is the driving force behind the glacier change, theglacier topographical parameters are the controlling factors whichmodulate the changes. Glacial topography has a strong influence onglacier dynamics and also explains the variability in the recessionalrates of glaciers of the same basin (Davies et al., 2011). In addition,the hypsometry of a glacier that determines the ratio of solid andliquid precipitationwithin a basin is an important factor (Lutz et al.,2014). Hypsometry (area-altitude relationship) of a glacier plays acritical role in the response of the terminus to change in equilib-rium line altitude (ELA; Furbish and Andrews, 1984). Moreover, ithas been demonstrated that the termini of glaciers with differenthypsometry behave differently under similar climatic forcing,highlighting the fundamental importance of geometry as a controlon the behavior of glaciers (Jiskoot et al., 2009), an aspect thatdeserves consideration in assessment of glacier variation in thecontext of current climate change (De Angelis, 2014). A similarstudy on the concept of benchmark glaciers and their representa-tiveness is reported by Fountain et al. (2009). This study attempts tofind out the climatic response of the two glaciers by studying theiraccumulation area ratio (AAR) and to understand the variability inthe response by analyzing their topographic, morphometric andhypsometric settings. Glacier mass balance is the un-delayed andunfiltered response of the glacier to climate change and AAR can betaken as the proxy for mass balance (Paterson, 1994). Therefore, byestimating the variation in the value of AAR we can infer thevariability in the climatic parameters such as temperature andprecipitation. The topographical parameters, indices and AAR inthis study have been derived from multi-spectral, multi-temporalremote sensing data.
2. Study area
Chhota Shigri and Hamtah glaciers are the two “nearby” IndianHimalayan glaciers which have been continuously monitored formass balance, glacier melt runoff, glacier meteorological and debriscover studies and are acknowledged by World Glacier MonitoringService (2012) (WGMS, 2012) for contribution of data. These gla-ciers are located in the Chandra Basin on the northern slopes of Pir-Panjal range of Himalaya, in the Lahaul-Spiti valley of HimachalPradesh (GSI, 2007; Ramanathan, 2011) and drain into the Chandra
River. The Chhota Shigri glacier is w15 km east of Hamtah glacierand both are roughly oriented from south to north (Fig. 1).
Chhota Shigri glacier (32.2�N, 77.5�E) is a compound valley typeglacier covering an area of w15 km2 and has a length of w9 kmextending between 4050 and 6363 masl (Vincent et al., 2013). Themean width of the glacier is w1.1 km (Sangewar and Shukla, 2009)and the maximumwidth is w1.8 km near equilibrium line altitude(Kumar and Dobhal, 1997). The snout of the glacier is steep, at anangle of 35� (Kumar and Dobhal, 1997) and heavily covered withdebris. The thickness of the debris cover decreases from snoutupstream to the glacier (Vincent et al., 2013). Towards the east ofthe glacier, a well defined lateral moraine with an average height ofw35 m is present. This lateral moraine descends from an elevationof 4460 masl and extends downstream to the Chandra River. Theperi-glacier features in the west side of the glacier are deformedand show no clear morphological features; however, the moraineson the right flank of the glacier valley (east side) are well preservedand are laterally continuous till the Chandra River. The ChhotaShigri glacier is a well-documented glacier and more informationcan be obtained from Dobhal et al. (1995), Kumar and Dobhal(1997), Wagnon et al. (2007), Ramanathan (2011), Vincent et al.(2013), Azam et al. (2014a).
Hamtah glacier (32.24�N, 77.37�E) is a relatively simple valleytype glacier having a single lobe, extending from south to northbetween 5000 and 4020 masl covering an area of about w3 km2
and isw6 km long (GSI, 2007). According to the inventory report bySangewar and Shukla (2009) the mean width of the glacier is

Table 1Details of data used in the study.
Sensor Acquisition date Resolution(m)
Scene ID
Landsat MSS 16 September 1980 60 M3158037/38_03719800916Landsat TM 9 October 1989 30 p147r37_5t19891009LISS III 27 September 1999 23.5 097136000101LISS III 11 September 2000 23.5 1009548L000LISS III 13September 2001 23.5 109548L0001LISS III 16 September 2005 23.5 097130400101LISS III 18September 2006 23.5 097130400201LISS III 30 September 2007 23.5 097130400301AWiFS 14 September 2008 56 36AWFBST00B2345FAWiFS 30 August 2010 56 22AWFBST00B2345FLandsat
OLI/TIRS28 September 2014 30 LC8147037/382014271LGN00
DEMs: ASTER GDEM and SRTM.
P. Pandey et al. / Geoscience Frontiers 8 (2017) 841e850 843
0.5 km. The glacier has a single accumulation zone with prominentlateral moraines on both sides of the glacier and is bound by steepridges. The glacier is heavily covered with debris from snout up tothe upper zone of the glacier.
3. Climatic settings of the region
The Himalayan region is influenced by two major weather sys-tems viz. the Indian Summer Monsoon (ISM) and the mid-latitudewesterlies (Finkel et al., 2003; Yang et al., 2008) and hence expe-rience contrasting precipitation regimes (Bolch et al., 2012). Theinfluence of these two weather systems varies both temporally andspatially. The ISM predominantly influences most of the southernand eastern part of Himalaya and causes pronounced summerprecipitation. The summer precipitation gradient is orographicallycontrolled, hence the north and northwestern regions of theHimalaya receives scanty monsoon precipitation compared to itssouthern counterpart. Similarly, the influence of mid-latitudewesterlies has its dominant role in the northwestern parts of theHimalaya and Karakoram, and decreases from northwest tosoutheastern parts of Himalayan arc (Benn and Owen, 1998). Thiscomplex climate diversity results in a contrasting pattern of glacierchange throughout the range. The site selected in the present studyis important as it falls in the monsoonearid transition zone and isalternatively influenced by Indian Summer Monsoon during sum-mer and mid latitude westerlies during winter (Bookhagen andBurbank, 2010). Unfortunately, climate data of this region arevery sparse and there is no meteorological observatory near thestudy area due to the difficulty involved in maintaining andmonitoring the station. Study by Shekhar et al. (2010) employingobserved data from several stations of west and northwesternHimalaya between 1988 and 2007 showed that the winter tem-perature of the Pir-Panjal range has increased whereas the snowfallhas decreased. Beside, an automatic weather station (AWS)installed on the Chhota Shigri glacier and a precipitation gauge atthe base camp of the glacier, maintained by the glaciological teamof Jawaharlal Nehru University, India, are the only sourcewhich canprovide some factual insights on the glacier climatic paradigm forthe surrounding region. The temperature, wind and incoming andoutgoing solar radiation are some of the meteorological parametersobtained by AWS on the glacier. The details of the meteorologicaldata from AWS on the Chhota Shigri glacier can be obtained fromAzam et al. (2014b). The nearest Indian Meteorological Department(IMD) observatory is in Bhuntar which is at a distance of 50 kmfrom Chhota Shigri glacier and also has different climatology thanChandra-Bhaga basin as it falls in the windward side of the ISM,whereas the Chandra Basin lies in the leeward side of it. However,Azam et al. (2014b) have attempted to extrapolate the climaticparameters from Bhuntar to Chhota Shigri to understand theclimatological settings of the glacier. The study carried out by Azamet al. (2014) is the only study availablewith some limitations, whichprovides an idea about the climatic settings of Chhota Shigri glacier.Azam et al. (2014b) have reported a high humid, warm and calmsummer monsoon from June to September and cold and windywinter from December to March. Further, they have found that theglacier (Chhota Shigri) to be a winter accumulation type receivingw80% of its annual precipitation from mid latitude westerliesduring winter andw20% from ISM during summer. Apart from fewsparse data, there is a scarcity of climatological data in the IndianHimalaya.
4. Datasets and methods
The objectives of the study have been accomplished by utilizingremote sensing data from various sources and sensors. The mean
area and mean AAR of glaciers of the basin have been taken fromthe inventory report by Sangewar and Shukla (2009). To show theyearly variation in AAR of Hamtah and Chhota Shigri glaciers, sat-ellite data from Landsat Multi-spectral Scanner (MSS), LandsatThematic Mapper (TM), Landsat Operational Land Imager (OLI),Panchromatic and Thermal Infrared Sensor (TIRS), Line ImagingSelf-Scanner Sensor (LISS-III) and Advanced Wide Field Sensor(AWiFS) sensors of Indian Remote Sensing Satellite (IRS) have beenused between 1980 and 2014 (Table 1). Cloud free images at the endof ablation season have been employed for this purpose. The yearsfor which cloud free and recent snowfall data were not available,have not been included in the study. Preprocessing of the rawsatellite data has been done before analysis. Preprocessing of im-ages involve geometric correction and digital numbers (DN) toreflectance calculations. First, DN images have been converted toradiance images and then radiance images to reflectance images.Various parameters like mean solar exoatmospheric spectral irra-diances in sensor bands, maximum and minimum radiance in thesensor bands obtained from the satellite header information, solardeclination and the digital elevation information have been used asthe input. All the multispectral images and DEM have been co-registered with each other.
Glacier topographical parameters (slope, aspect and elevation),morphometry and radiation have been derived from freely avail-able ASTER GDEM version 2. Glacier hypsometry has been obtainedfrom LISS III image of 2000 and SRTM DEM of the same year. Toderive the percentage of debris cover on glacier surface, high res-olution panchromatic band (15 m resolution) of Landsat 8 has beenmerged with the reflectance images. The resolution merging hasbeen done in ERDAS Imagine using Brovery Transform method. Onthe merged images, the debris-covered part of the glacier has beendemarcated and percentage of debris cover has been calculated.
4.1. Accumulation area ratio (AAR)
AAR is the ratio between accumulation area and total glacierarea, calculated at the end of ablation season. Accumulation andablation zone and the total glacier area can be differentiated onreflectance images based on the difference in their spectral signa-tures. Total glacier area has been obtained by manual digitization.The accumulation area has been derived by delineating the accu-mulation zone on reflectance image based on visual interpretation.The DN images have been converted to reflectance image prior tothe computation of accumulation area and total glacier area. Theuncertainties associated with the calculation of area are due to theemployment of images from different sensors, with differentspatial resolutions, the co-registration error and the error ofmanual digitization. The uncertainties in the area estimation hasbeen computed following Congalton (1991), Zhang and Goodchild

P. Pandey et al. / Geoscience Frontiers 8 (2017) 841e850844
(2002), Hall et al. (2003), Silverio and Jaquet (2005), Granshaw andFountain (2006), Racoviteanu et al. (2008), Wang et al. (2009),Bolch et al. (2010), Bhambri et al. (2012). The uncertainty in snoutlocation, e, was estimated using Eq. (1):
e ¼ffiffiffiffiffiffiffiffiffiffiffiffiffiffiffiffia2 þ b2
pþ E (1)
where a and b represent the spatial resolution of the two imagesused, and E is the error of image registration. The uncertainties ofglacier area estimation were determined by the buffer methodsuggested by Granshaw and Fountain (2006) for each glacier. Thearea of buffer size around each glacier was set to twice the digiti-zation error (Granshaw and Fountain, 2006; Racoviteanu et al.,2008). The overall uncertainties associated with the area estima-tion found to be up to 4%.
Figure 2. The variation in the AAR of Chhota Shigri and Hamtah glaciers.
4.2. Hypsometry, morphometry and topographic settings of theglaciers
Glacier hypsometry, morphometry, topographic parameters andindices for both the glaciers have been computed by following themethods suggested by DeBeer and Sharp (2007), Jiskoot et al. (2009)andWay et al. (2014). Hypsometry (area-altitude relationship) is thedistribution of terrain area over its elevation range. Both ChhotaShigri and Hamtah glaciers have been divided into 100 m elevationbins and hypsometry has been calculated. To derive hypsometriccurve of the glaciers, the area has been calculated fromLISS III imagesof September 2000 and the elevations have been extracted fromSRTM DEM since the SRTM DEM is acquired in the same year (i.e.,2000). The SRTM has been used for hypsometric calculations tomaintain the homogeneity and accuracy of the study. The total areaand elevation of the glaciers have been normalized and normalizedhypsometric curve has been plotted for the comparison. A normal-ized hypsometric curve is the plot of normalized area vs. normalizedelevation and describes the distribution of topographic character ofterrain with variable elevation ranges. The normalized hypsometriccurve has been derived following Jiskoot et al. (2009) and fromhypsometric index the glacier hypsometric type has been identified.The average slope, average aspect, minimum,maximumandmedianelevations of the glaciers have been extracted from the ASTER GDEMin ArcGIS. The compactness ratio, the relative upslope area and theslope of the upslope area, which are the indices providing thecontribution of the avalanching from the surrounding to the massbalance of the glacier have been calculated by methods discussed inDeBeer and Sharp (2007) and Way et al. (2014). The compactnessratio is the measure of glacier morphometry and has been derivedfrom the formula (4� pi� area)/(perimeter)2 following DeBeer andSharp (2007) andWay et al. (2014). The compactness ratio indicatespotential mass inputs from surrounding avalanching zones. Thecompactness ratio has been derived by using total glacier area andthe perimeter of the glacier. Further, the contributions of avalanchingsites have been includedbyupslope area and the slope of theupslopearea. The upslope area is the contributing area above each glacier andrepresents the contribution of the surrounding upslope area in theglaciermass balance. The relative upslope area is defined as the ratiobetween the upslope areas to the glacier surface area. The relativeupslope area has been derived by following the method provided byDeBeer and Sharp (2007). The area from the upslope edge of theglacier to the lateral extremeof the glacierhasbeen considered as theupslope area. This has been divided by the glacier surface area toobtain the relative upslope area of the glacier. The mean slope of theupslope portion of the glacier has been deduced from the ArcGIS. Torepresent the potential intensity of solar radiation in the clear skycondition during ablation season, reaching to glacier surface, meansolar radiation has been derived using method suggested by DeBeer
and Sharp (2007). The mean solar radiation has been calculated atsolar noon, during the peak of ablation season i.e. 31st August usingArcGIS. The potential intensity of solar radiation reaching on theglacier surface during the ablation season has been derived to un-derstand the portions and locations of glacier surface liable to receivesolar inputs, which subsequently affect energy balance and hencemass balance.
5. Results
5.1. Accumulation area ratio
The accumulation area ratios of Chhota Shigri and Hamtah gla-ciers as estimated from satellite images from 1980 to 2014 werefound to be far different from each other. The mean AAR of ChhotaShigri glacier from 1980 to 2014 was 54% (�19%), whereas the meanAAR of Hamtah glacier was only 11% (�8%). The AARof Chhota Shigriglacier varied between 29% and 80% during the studied periodwhilefor Hamtah glacier the AAR ranged between 1.5% and 30%. Fig. 2depicts the year wise variation of AAR of Chhota Shigri and Ham-tah glaciers.
5.2. Glacier hypsometry
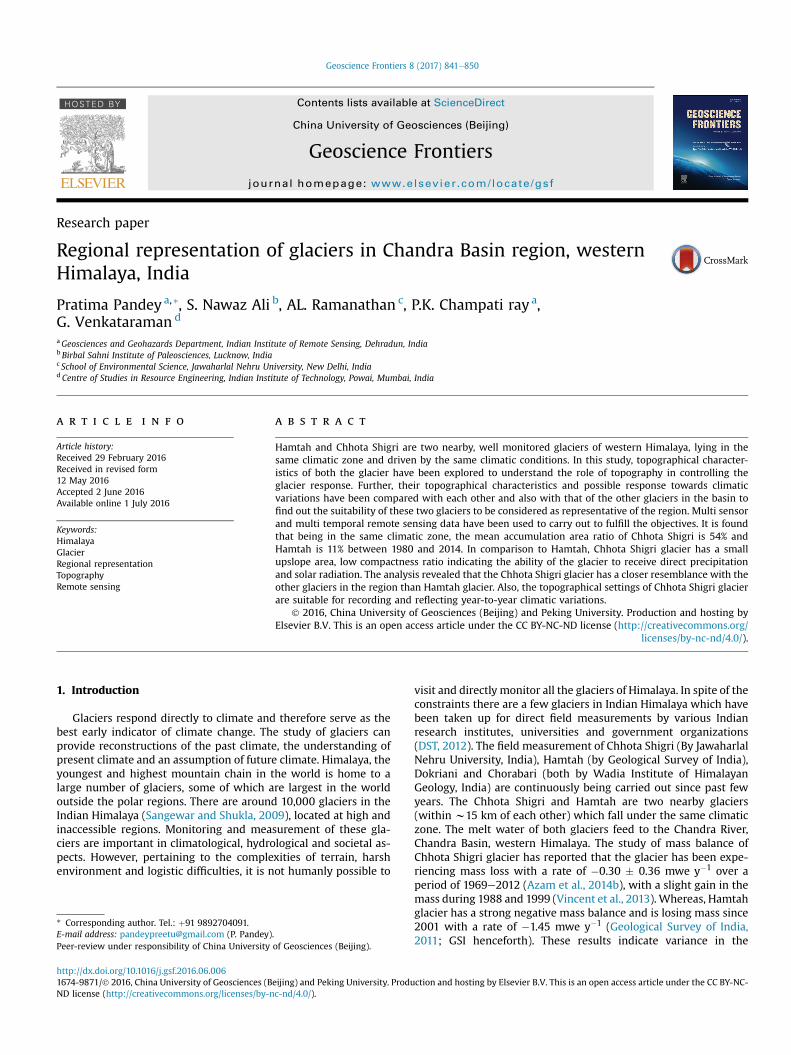
The hypsometric analysis of glaciers indicated distinct pattern ofarea-elevation distribution for Chhota Shigri and Hamtah glaciers(Fig. 3). Chhota Shigri glacier was found to be an equi-dimensionalto slightly bottom heavy glacier, for which therewas approximatelyequal distribution of area above and below the median elevation ofthe glacier. However, Hamtah glacier revealed to be a top-heavyglacier with more than half of the area above the median eleva-tion of the glacier. An elevated portion near the median point ofHamtah glacier was noticed which is peculiar. Previous research onthe hypsometric pattern of glaciers have suggested that the glaciersfor which maximum area lie above the median elevation are moreaffected by changes in snowline than the bottom heavy or equi-dimensional glaciers (Jiskoot et al., 2009). A slight rise of ELA willalter significantly the proportion of accumulation and ablation areaof the top heavy glacier, while the bottom heavy or the equi-dimensional glacier will be less affected (Brocklehurst andWhipple, 2004; Jiskoot et al., 2009). Based on these studies, thesame has been suggested to be applicable for Chhota Shigri andHamtah glaciers. From the hypsometric aspect it can be inferredthat Hamtah glacier was more sensitive to ELA change than ChhotaShigri glacier. The hypsometry of glacier also influences the dis-tribution and amount of snow/rain ratio on the glacier surface.More area above median elevation indicates that more portion ofthe glacier is apt to receive precipitation in the form of snowfall.However, a glacier with more area distributed below the median
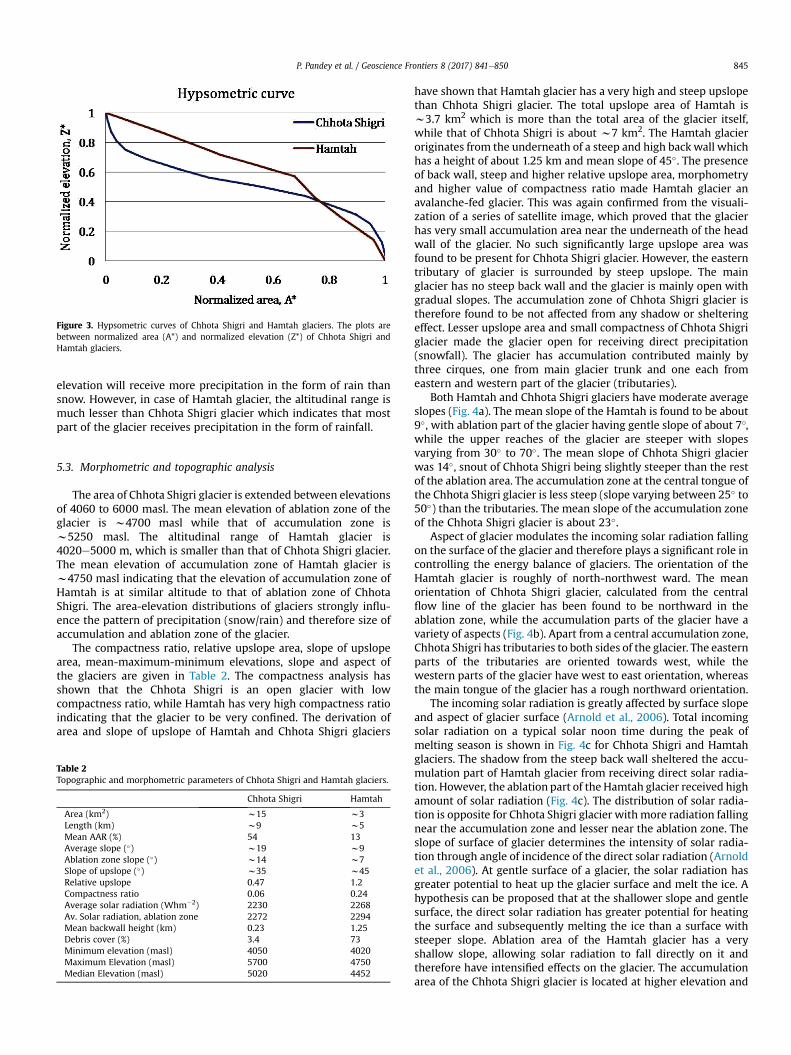
Figure 3. Hypsometric curves of Chhota Shigri and Hamtah glaciers. The plots arebetween normalized area (A*) and normalized elevation (Z*) of Chhota Shigri andHamtah glaciers.
P. Pandey et al. / Geoscience Frontiers 8 (2017) 841e850 845
elevation will receive more precipitation in the form of rain thansnow. However, in case of Hamtah glacier, the altitudinal range ismuch lesser than Chhota Shigri glacier which indicates that mostpart of the glacier receives precipitation in the form of rainfall.
5.3. Morphometric and topographic analysis
The area of Chhota Shigri glacier is extended between elevationsof 4060 to 6000 masl. The mean elevation of ablation zone of theglacier is w4700 masl while that of accumulation zone isw5250 masl. The altitudinal range of Hamtah glacier is4020e5000 m, which is smaller than that of Chhota Shigri glacier.The mean elevation of accumulation zone of Hamtah glacier isw4750 masl indicating that the elevation of accumulation zone ofHamtah is at similar altitude to that of ablation zone of ChhotaShigri. The area-elevation distributions of glaciers strongly influ-ence the pattern of precipitation (snow/rain) and therefore size ofaccumulation and ablation zone of the glacier.
The compactness ratio, relative upslope area, slope of upslopearea, mean-maximum-minimum elevations, slope and aspect ofthe glaciers are given in Table 2. The compactness analysis hasshown that the Chhota Shigri is an open glacier with lowcompactness ratio, while Hamtah has very high compactness ratioindicating that the glacier to be very confined. The derivation ofarea and slope of upslope of Hamtah and Chhota Shigri glaciers
Table 2Topographic and morphometric parameters of Chhota Shigri and Hamtah glaciers.
Chhota Shigri Hamtah
Area (km2) w15 w3Length (km) w9 w5Mean AAR (%) 54 13Average slope (�) w19 w9Ablation zone slope (�) w14 w7Slope of upslope (�) w35 w45Relative upslope 0.47 1.2Compactness ratio 0.06 0.24Average solar radiation (Whm�2) 2230 2268Av. Solar radiation, ablation zone 2272 2294Mean backwall height (km) 0.23 1.25Debris cover (%) 3.4 73Minimum elevation (masl) 4050 4020Maximum Elevation (masl) 5700 4750Median Elevation (masl) 5020 4452
have shown that Hamtah glacier has a very high and steep upslopethan Chhota Shigri glacier. The total upslope area of Hamtah isw3.7 km2 which is more than the total area of the glacier itself,while that of Chhota Shigri is about w7 km2. The Hamtah glacieroriginates from the underneath of a steep and high backwall whichhas a height of about 1.25 km and mean slope of 45�. The presenceof back wall, steep and higher relative upslope area, morphometryand higher value of compactness ratio made Hamtah glacier anavalanche-fed glacier. This was again confirmed from the visuali-zation of a series of satellite image, which proved that the glacierhas very small accumulation area near the underneath of the headwall of the glacier. No such significantly large upslope area wasfound to be present for Chhota Shigri glacier. However, the easterntributary of glacier is surrounded by steep upslope. The mainglacier has no steep back wall and the glacier is mainly open withgradual slopes. The accumulation zone of Chhota Shigri glacier istherefore found to be not affected from any shadow or shelteringeffect. Lesser upslope area and small compactness of Chhota Shigriglacier made the glacier open for receiving direct precipitation(snowfall). The glacier has accumulation contributed mainly bythree cirques, one from main glacier trunk and one each fromeastern and western part of the glacier (tributaries).
Both Hamtah and Chhota Shigri glaciers have moderate averageslopes (Fig. 4a). The mean slope of the Hamtah is found to be about9�, with ablation part of the glacier having gentle slope of about 7�,while the upper reaches of the glacier are steeper with slopesvarying from 30� to 70�. The mean slope of Chhota Shigri glacierwas 14�, snout of Chhota Shigri being slightly steeper than the restof the ablation area. The accumulation zone at the central tongue ofthe Chhota Shigri glacier is less steep (slope varying between 25� to50�) than the tributaries. The mean slope of the accumulation zoneof the Chhota Shigri glacier is about 23�.
Aspect of glacier modulates the incoming solar radiation fallingon the surface of the glacier and therefore plays a significant role incontrolling the energy balance of glaciers. The orientation of theHamtah glacier is roughly of north-northwest ward. The meanorientation of Chhota Shigri glacier, calculated from the centralflow line of the glacier has been found to be northward in theablation zone, while the accumulation parts of the glacier have avariety of aspects (Fig. 4b). Apart from a central accumulation zone,Chhota Shigri has tributaries to both sides of the glacier. The easternparts of the tributaries are oriented towards west, while thewestern parts of the glacier have west to east orientation, whereasthe main tongue of the glacier has a rough northward orientation.
The incoming solar radiation is greatly affected by surface slopeand aspect of glacier surface (Arnold et al., 2006). Total incomingsolar radiation on a typical solar noon time during the peak ofmelting season is shown in Fig. 4c for Chhota Shigri and Hamtahglaciers. The shadow from the steep back wall sheltered the accu-mulation part of Hamtah glacier from receiving direct solar radia-tion. However, the ablation part of the Hamtah glacier received highamount of solar radiation (Fig. 4c). The distribution of solar radia-tion is opposite for Chhota Shigri glacier withmore radiation fallingnear the accumulation zone and lesser near the ablation zone. Theslope of surface of glacier determines the intensity of solar radia-tion through angle of incidence of the direct solar radiation (Arnoldet al., 2006). At gentle surface of a glacier, the solar radiation hasgreater potential to heat up the glacier surface and melt the ice. Ahypothesis can be proposed that at the shallower slope and gentlesurface, the direct solar radiation has greater potential for heatingthe surface and subsequently melting the ice than a surface withsteeper slope. Ablation area of the Hamtah glacier has a veryshallow slope, allowing solar radiation to fall directly on it andtherefore have intensified effects on the glacier. The accumulationarea of the Chhota Shigri glacier is located at higher elevation and

Figure 4. The topographical parameters of the Chhota Shigri and Hamtah glaciers respectively. (a) Slope map of the Chhota Shigri and Hamtah glaciers; (b) aspect maps of theglaciers and; (c) solar radiation of the glaciers.
P. Pandey et al. / Geoscience Frontiers 8 (2017) 841e850846
favorable to receive considerable amount of direct solar radiation.However, the higher mean slope of accumulation area of ChhotaShigri might lessen the potential intensity of the direct solarradiation.
6. Representativeness of glaciers
There are certain criteria to select a glacier for carrying outvarious glaciological studies and also for representing the region atthe same time. The Himalayan mountainous weather is extremelyharsh and the terrains are inaccessible and different. Therefore, themost important criteria to carry out glaciological studies on aparticular glacier are location and accessibility of the glacier.However, there is always a trade-off between ideal and accessibleglacier.
In viewof the difficulties associated in fieldmonitoring of a largenumber of glaciers, selecting a representative glacier for the region
and carrying out detail field monitoring on the same glacier is needof the hour. However, selecting a representative glacier may not beeasy as each glacier has unique topographical settings. Therefore, inthis study we have attempted to find topographical similarity ofglaciers of Chandra Basin with the Hamtah and Chhota Shigri gla-ciers to find out which between the two glaciers can be taken asrepresentative for the region, and the result of which glacier can bebetter generalized.
The glacier selected for field measurements should be easilyapproachable with simpler geometry. Besides location, the othervery crucial criteria is the sensitivity of the glacier towards climaticfluctuations and also if the response of the glacier towards thesefluctuations is in similar manner to most of the glaciers in the re-gion (Kaser et al., 2003). For being able to record even small climaticfluctuations, the glacier should not have local effect of shading andavalanching (Hoffman et al., 2007). The glacier should be eitherclean (debris free) or should have very less amount of debris cover.

P. Pandey et al. / Geoscience Frontiers 8 (2017) 841e850 847
Further, a very essential criterion is the topographical settings ofthe glacier such as glacier area, length, slope, aspect, elevation,area-elevation distribution and altitude range. Therefore, therepresentative glacier should be sensible to climatic variations, ableto record year-to-year climate signals and represent the regiontopographically. Both Hamtah and Chhota Shigri are regularly beingmonitored for field based glaciological studies. The field data ofHamtah and Chhota Shigri glaciers have important use in valida-tion/input for space based studies and glacier modeling for theregion. However, it is needed to find out which glacier is appro-priate and suitable to be taken as representative. To find theanswer, detail study has been carried out and discussedsubsequently.
To find a representative glacier for the study area, we examinedthe AAR, percentage of debris cover, topographical characteristicsandmorphometric parameters of the glaciers of Chandra Basin. Thetopographical parameters and the debris cover have been derivedfrom satellite remote sensing data as discussed previously. Themean AAR and the area of the glaciers of Chandra Basin have beentaken from the glacier inventory of Sangewar and Shukla (2009).The yearly variation of AAR of Hamtah and Chhota Shigri glaciershas been computed by analyzing remote sensing data. The ChandraBasin is trending NeS, NWeSE to EeW and occupies an area ofw2381 km2 and supports 201 glaciers covering an area ofw703.64 km2, constituting 29.54% of the total basin area. To eval-uate the representativeness of Chhota Shigri and Hamtah glaciersfor the Chandra Basin, comparisons have been made between thetopographical characteristics of glaciers in the Chandra Basin andthose of Chhota Shigri and Hamtah glaciers.
The extraction of percentage of debris on the glaciers revealedthat debris cover in the glaciers of Chandra Basin varied from 0 to86%. The 86% of glacier area of Hamtah is covered with debriswhereas only 3% area of the Chhota Shigri glacier is covered withdebris. Most of the glaciers in the Chandra Basin were either cleanglacier and free from any debris cover or with a debris cover lessthan 20% of their total area. The scatter plot revealed that in terms
Figure 5. Scatter plots and histograms of (a) percentage of debris cover; (b) mean AAR; (c) mcircle marks Chhota Shigri glacier and yellow circle indicated Hamtah glacier.
of debris cover on the glacier surface, Chhota Shigri glacier is morerepresentative to the region than the Hamtah glacier (Fig. 5a). Outof 56 glaciers studied in this region, only 4 glaciers have debriscover more than 20% of their total area. Most of the glaciers in thisregion have debris cover less than 6% of their total area.
The mean elevation of the Chandra Basin is w4980 masl whichis more than 191 masl from the mean elevation of Chhota Shigriglacier and more thanw636 masl from Hamtah glacier. Most of theglaciers in the Chandra Basin are located at higher elevation andtheir altitude range is more comparable to Chhota Shigri glacierthan Hamtah glacier (Fig. 5c). Hamtah glacier is a low elevationglacier with less altitudinal range. The glacier elevation and thearea-altitude distribution modulate the rain/snow ratio of theprecipitation in the basin. As evident from Fig. 5c also, the meanelevation of the glaciers in the Chandra Basin has more resem-blancewith the Chhota Shigri than Hamtah glacier. Therefore, it canbe inferred that the mean precipitation in the Chandra Basinwill bemore identical to that of Chhota Shigri glacier than Hamtah glacier.Further, the average slope of the glaciers of Chandra Basin is foundto be 12� which is more akin to the average slope of Chhota Shigriglacier (14�) than the average slope of Hamtah glacier (7�). Thescatter plots suggest that in terms of slopes of the basin, ChhotaShigri glacier is more comparable to the other glaciers of the basinthan Hamtah glacier (Fig. 5d).
To evaluate whether year to year climatic variations of the re-gion are captured and reflected by Chhota Shigri and/or Hamtahglacier, the AAR of the rest of the glaciers of Chandra Basin havebeen compared with the AAR of Chhota Shigri and Hamtah glaciers(Fig. 5b). The mean AAR of the Chandra Basin is w44% which issimilar to the AAR of Chhota Shigri glacier at w50%. The mean AARof Hamtah is only w6% and in the scatter plot the glacier lies as anoutlier. It can be interpreted that behavior and response of most ofthe glaciers of the Chandra Basin can be well represented by theresponse of Chhota Shigri glacier.
Chhota Shigri glacier is a roughly northward glacier extendingfrom south to north, however, in the accumulation zone the glacier
ean elevation; (d) mean slope of the glaciers in the Chandra Basin vs. their area. The Red
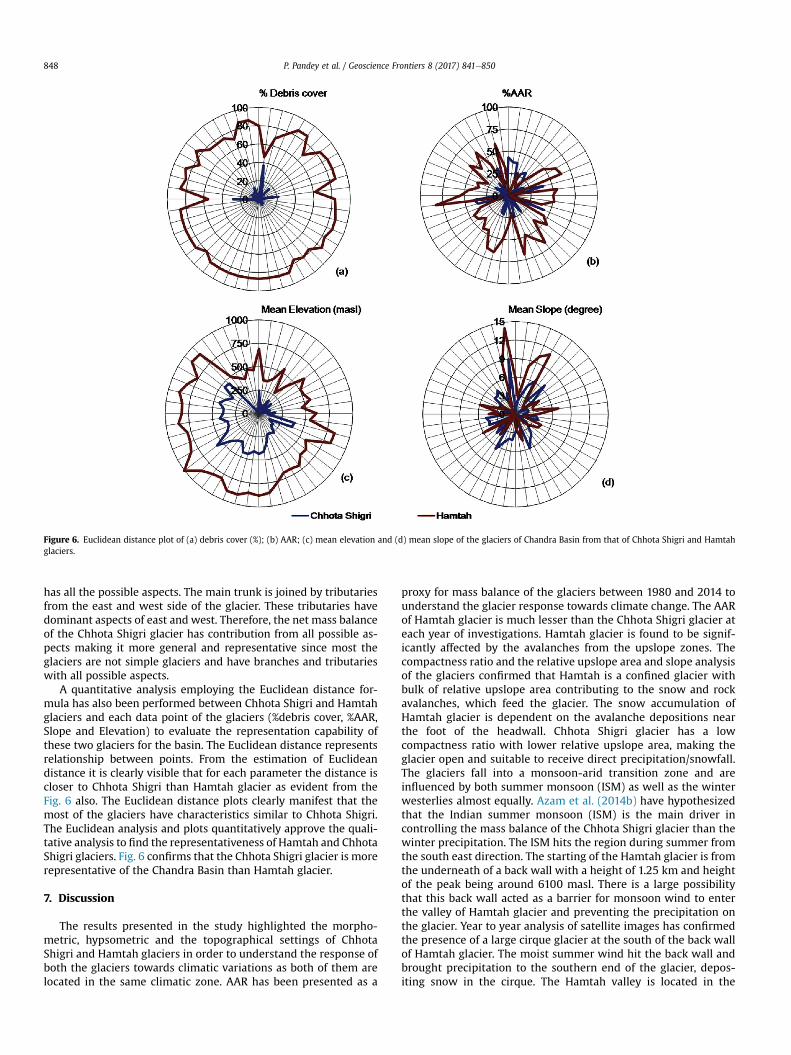
Figure 6. Euclidean distance plot of (a) debris cover (%); (b) AAR; (c) mean elevation and (d) mean slope of the glaciers of Chandra Basin from that of Chhota Shigri and Hamtahglaciers.
P. Pandey et al. / Geoscience Frontiers 8 (2017) 841e850848
has all the possible aspects. The main trunk is joined by tributariesfrom the east and west side of the glacier. These tributaries havedominant aspects of east and west. Therefore, the net mass balanceof the Chhota Shigri glacier has contribution from all possible as-pects making it more general and representative since most theglaciers are not simple glaciers and have branches and tributarieswith all possible aspects.
A quantitative analysis employing the Euclidean distance for-mula has also been performed between Chhota Shigri and Hamtahglaciers and each data point of the glaciers (%debris cover, %AAR,Slope and Elevation) to evaluate the representation capability ofthese two glaciers for the basin. The Euclidean distance representsrelationship between points. From the estimation of Euclideandistance it is clearly visible that for each parameter the distance iscloser to Chhota Shigri than Hamtah glacier as evident from theFig. 6 also. The Euclidean distance plots clearly manifest that themost of the glaciers have characteristics similar to Chhota Shigri.The Euclidean analysis and plots quantitatively approve the quali-tative analysis to find the representativeness of Hamtah and ChhotaShigri glaciers. Fig. 6 confirms that the Chhota Shigri glacier is morerepresentative of the Chandra Basin than Hamtah glacier.
7. Discussion
The results presented in the study highlighted the morpho-metric, hypsometric and the topographical settings of ChhotaShigri and Hamtah glaciers in order to understand the response ofboth the glaciers towards climatic variations as both of them arelocated in the same climatic zone. AAR has been presented as a
proxy for mass balance of the glaciers between 1980 and 2014 tounderstand the glacier response towards climate change. The AARof Hamtah glacier is much lesser than the Chhota Shigri glacier ateach year of investigations. Hamtah glacier is found to be signif-icantly affected by the avalanches from the upslope zones. Thecompactness ratio and the relative upslope area and slope analysisof the glaciers confirmed that Hamtah is a confined glacier withbulk of relative upslope area contributing to the snow and rockavalanches, which feed the glacier. The snow accumulation ofHamtah glacier is dependent on the avalanche depositions nearthe foot of the headwall. Chhota Shigri glacier has a lowcompactness ratio with lower relative upslope area, making theglacier open and suitable to receive direct precipitation/snowfall.The glaciers fall into a monsoon-arid transition zone and areinfluenced by both summer monsoon (ISM) as well as the winterwesterlies almost equally. Azam et al. (2014b) have hypothesizedthat the Indian summer monsoon (ISM) is the main driver incontrolling the mass balance of the Chhota Shigri glacier than thewinter precipitation. The ISM hits the region during summer fromthe south east direction. The starting of the Hamtah glacier is fromthe underneath of a back wall with a height of 1.25 km and heightof the peak being around 6100 masl. There is a large possibilitythat this back wall acted as a barrier for monsoon wind to enterthe valley of Hamtah glacier and preventing the precipitation onthe glacier. Year to year analysis of satellite images has confirmedthe presence of a large cirque glacier at the south of the back wallof Hamtah glacier. The moist summer wind hit the back wall andbrought precipitation to the southern end of the glacier, depos-iting snow in the cirque. The Hamtah valley is located in the

P. Pandey et al. / Geoscience Frontiers 8 (2017) 841e850 849
leeward side of the peak and therefore had lesser chance ofreceiving good precipitation from Indian summer monsoon. Thetopographical settings of Chhota Shigri glacier are favorable forreceiving precipitation from both mid latitude westerlies as wellas Indian summer monsoon.
Despite being under the influence of two climatic systems,Hamtah is probably less liable to be affected significantly by sum-mer monsoon and hence might possibly be invariant to any fluc-tuations pertaining to Indian summer monsoon. Chhota Shigriglacier has favorable topography to record the variations in bothwesterlies and summer monsoon.
The final criteria in consideration for selection of a representa-tive glacier are the elevations and altitudinal ranges of glaciers. Theuppermost boundary of Hamtah glacier is found to be at an altitudeof w4900 masl which is the average altitude of ELA for ChhotaShigri glacier. Pandey et al. (2012) have shown that the mean snowline altitude of the region at the end of ablation season, which canbe considered as ELA, isw5200 masl. The accumulation zone of theHamtah glacier is at much lower altitude than the mean ELA of theregion. The elevations of the glaciers also affect the rain to snowprecipitation ratio on the glacier. The area-altitude distribution ofHamtah glacier indicated that maximum precipitation on theHamtah glacier must be in the form of rain instead of snow. Pre-cipitation in the form of rain on the surface of glacier enhances themelting. Further, because of its low elevation, the surface of Hamtahglacier is not able to retain the snow cover. The hypsometry ofHamtah glacier is such that a small change in ELA would affect alarge proportion of the glacier, eventually causing change in glacierarea. However, Chhota Shigri glacier has a hypsometry such thatany small change in ELAwould not significantly influence the massbalance of the glacier and hence glacier size. This is reflected in theresponses of Chhota Shigri and Hamtah glaciers as the rate ofretreat of Hamtah glacier is significantly higher (16 m/year) thanthe rate of retreat of Chhota Shigri (7 m/year). Further, the variationin incoming solar radiation due to the slope of the glacier is one ofthe major controls for variation in energy balance and hence massbalance. On a particular surface of glacier with very low slope, theamount of solar radiation will be available more to the surface thana surface of with higher slopes. The large solar radiation receipt onthe ablation surface of Hamtah glacier will enhance themelting andaffect the energy balance of the glacier. The bulk of ablation part ofChhota Shigri glacier receives lesser solar radiation.
Debris on the surface of glacier influences the melting processesof the glacier and hence amount of ablation. The response of aheavily debris-covered glacier to a change in climate will be slowerthan that of a clean glacier. The debris cover modifies the massbalance of glacier by modulating ablation.
8. Conclusions
The present study provides new insight into the role of hyps-ometry, morphometry and topographical settings on the ablationpattern and inconsistencies in the responses of Chhota Shigri andHamtah glaciers. The study also assesses the representativeness ofChhota Shigri and Hamtah glaciers for the Chandra Basin region.The main conclusions drawn from the analyses are:
(1) The hypsometrical pattern of Hamtah glacier is such that asmall rise in ELAwould expose significant area of the glacier formelting and hence mass balance, while for Chhota Shigriglacier small changes in ELA would not have very crucial effecton the mass balance of the glacier.
(2) In comparison to Chhota Shigri, Hamtah has a large and steepupslope area with a 1.25 km, high head wall that preventsprecipitation in summer. Small values of AAR at the end of
ablation season indicate that winter snow is not much retainedand does not contribute to the mass of the glacier.
(3) The topographical settings of Chhota Shigri glacier, AAR anddebris cover are comparable to the most of the glaciers in theChandra Basin and receive direct snowfall, free from anyshadow effect, minimum avalanches and almost debris freemaking it fit for long term monitoring and a representative ofthe region.
(4) The available long term data from the Chhota Shigri glacier canbe the best used of extrapolation for thewhole basin as done byHuss (2014) for the European Alps.
(5) The AAR-specific mass balance relationship developed fromthe field data of Chhota Shigri can be used to construct themass balance of rest of the glaciers in the basin.
(6) The representativeness of Chhota Shigri glacier brings confi-dence in using various field data of the glacier in regional hy-drological and climatological modeling as well as in validationpurposes.
Acknowledgment
The authors would like to thank the anonymous reviewers fortheir valuable comments and suggestions to improve this paper.Also, authors would like to extend their thanks to Dr. Andrew G.Fountain, Portland State University, USA, for his encouragement topublish this work. Part of the research has been funded by CSIR-UGC, Government of India.
References
Arnold, N.S., Rees, W.G., Hodson, A.J., Kohler, J., 2006. Topographic controls on thesurface energy balance of a high Arctic valley glacier. Journal of GeophysicalResearch 111, F02011. http://dx.doi.org/10.1029/2005JF000426.
Azam, M.F., Wagnon, P., Vincent, C., Ramanathan, A.L., Linda, A., Singh, V.B., 2014a.Reconstruction of the annual mass balance of Chhota Shigri Glacier (WesternHimalaya, India) since 1969. Annals of Glaciology 55, 69e80. http://dx.doi.org/10.3189/2014AoG66A104.
Azam, M.F., Wagnon, P., Vincent, C., Ramanathan, A.L., Favier, V., Mandal, A.,Pottakkal, J.G., 2014b. Processes governing the mass balance of Chhota ShigriGlacier (western Himalaya, India) assessed by point-scale surface energy bal-ance measurements. The Cryosphere 8, 2195e2217. http://dx.doi.org/10.5194/tc-8-2195-2014b.
Benn, D.I., Owen, L.A., 1998. The role of the Indian summer monsoon and themidelatitude westerlies in Himalayan glaciation: review and speculative dis-cussion. Journal of the Geological Society, London 155, 353e363.
Bhambri, R., Bolch, T., Chaujar, R.K., 2012. Frontal recession of Gangotri Glacier,Garwhal Himalayas, from 1965 to 2006, measured through high-resolutionremote sensing data. Current Science 102, 489e494.
Bolch, T., Kulkarni, A.V., Kaab, A., Huggel, C., Paul, F., Cogley, G., Frey, H., Kargel, J.S.,Fujita, K., Scheel, M., Stoffel, M., Bajracharya, S., 2012. The state and fate ofHimalayan Glaciers. Science 336, 310e314.
Bolch, T., Menounos, B., Wheate, R.D., 2010. Landsat-Based inventory of glaciers inWestern Canada, 1985e2005. Remote Sensing of Environment 114, 127e137.
Brocklehurst, S.H., Whipple, K.X., 2004. Hypsometry of glaciated landscapes. EarthSurface Processes and Landforms 29, 907e926.
Bookhagen, B., Burbank, D.W., 2010. Toward a complete Himalayan hydrologicalbudget: spatiotemporal distribution of snowmelt and rainfall and their impacton river discharge. Journal of Geophysical Research 115, F03019. http://dx.doi.org/10.1029/2009JF001426.
Congalton, R.G., 1991. A review of assessing the accuracy of classifications ofremotely sensed data. Remote Sensing of Environment 37, 35e46.
Davies, B.J., Carrivick, J., Glasser, N.F., Hambre, M.J., Smellie, J.L., 2011. A new glacierinventory for 2009 reveals spatial and temporal variability in glacier responseto atmospheric warming in the Northern Antarctic Peninsula, 1988e2009. TheCryosphere Discussions 5, 3541e3595.
DeBeer, C.M., Sharp, M.J., 2007. Topographic influence on recent changes of verysmall glaciers in the Monashee Mountains, British Columbia, Canada. Journal ofGlaciology 55, 691e700.
Dobhal, D.P., Kumar, S., Mundepi, A.K., 1995. Morphology and glacier dynamicsstudies in monsoonearid transition zone: an example from Chhota ShigriGlacier, Himachal Himalaya, India. Current Science 68 (9), 936e944.
DST, 2012. Dynamics of Glaciers in the Indian Himalaya: Science Plan. Prepared byR.K. Midha. Published by the Science and Engineering Board, Department ofScience and Technology, New Delhi, Himalayan Glaciology Technical Report No.2., p. 125

P. Pandey et al. / Geoscience Frontiers 8 (2017) 841e850850
Finkel, R.C., Owen, L.A., Barnard, P.I., Cafee, M.W., 2003. Beryllium-10 dating ofMount Everest moraines indicating a strong monsoon influence and glacialsynchroneity throughout the Himalaya. Geology 31, 561e564.
Fountain, A.G., Hoffman, M.J., Granshaw, F., Riede, J., 2009. The ‘benchmark glacier’concept e does it work? Lessons from the North Cascade Range, USA. Annals ofGlaciology 50, 163e168.
Furbish, D.J., Andrew, J.T., 1984. The use of hypsometry to indicate long-term sta-bility and response of valley glaciers to changes in mass transfer. Journal ofGlaciology 30, 199e211.
Geological Survey of India eGSI, 2007. Detailed glaciological studies on HamtahGlacier, Lahaul and Spiti district. In: Himachal Pradesh: Rec. Geological Surveyof India, 139 pt. 8, pp. 136e139.
Geological Survey of India- GSI, 2011. Chapter 8, Annual Report 2010e2011,pp. 69e70, 643, 644, 645, 650, 651.
Granshaw, F.D., Fountain, A.G., 2006. Glacier change (1958e1998) in the NorthCascades National Park complex, Washington, USA. Journal of Glaciology 52,251e256.
Hall, D.K., Bayr, K.J., Schoner, W., Bindschadler, R.A., Chien, J.Y.L., 2003. Considerationof the errors inherent in mapping historical glacier positions in Austria from theground and space (1893e2001). Remote Sensing of Environment 86, 566e577.
Hoffman, M.J., Fountain, A.G., Achuff, J.M., 2007. 20th-century variations in area ofcirque glaciers and glacierets, Rocky mountain National Park, Rocky mountains,Colorado, USA. Annals of Glaciology 46, 349e354.
Huss, M., 2014. Extrapolating glacier mass balance to the mountain-range scale: theEuropean Alps 1900e2100. The Cryosphere 6, 713e727.
Jiskoot, H., Curran, C.J., Tessler, D.L., Shenton, L.R., 2009. Changes in ClemenceauIcefield and Chaba Group glaciers, Canada, related to hypsometry, tributarydetachment, length slope and areaeaspect relations. Annals of Glaciology 50,133e143.
Kaser, G., Fountain, A., Jansson, P., 2003. A Manual for Monitoring the Mass Balanceof Mountain Glaciers. IHP-VI, Technical Documents in Hydrology, No. 59,UNESCO, Paris, 2003.
Kumar, S., Dobhal, D.P., 1997. Climate effects and bed rock control on rapid fluctu-ations of Chhota Shigri, northwest Himalaya, India. Journal of Glaciology 43,467e472.
Lutz, A.F., Immerzeel, W.W., Shrestha, A.B., Bierkens, M.F.P., 2014. Consistent in-crease in high Asia’s runoff due to increasing glacier melt and precipitation.Nature Climate Change 4, 587e592. http://dx.doi.org/10.1038/nclimate2237,1158, 1160, 1170, 1183, 1185.
Pandey, P., Kulkarni, A.V., Venkataraman, G., 2012. Remote sensing study of snow-line altitude at the end of melting season, Chandra-Bhaga Basin, Himachal
Pradesh, 1980e2010. Geocarto International. http://dx.doi.org/10.1080/10106049.2012.705336.
Paterson, W.S.B., 1994. The Physics of Glaciers, 3d ed. Pergamon, p. 496.Racoviteanu, A.E., Arnaud, Y., Williams, M.W., Ordon, J., 2008. Decadal changes in
glacier parameters in the Cordillera Blanca, Peru, derived from remote sensing.Journal of Glaciology 54, 499e510.
Ramanathan, A.L., 2011. Status Report on Chhota Shigri Glacier (Himachal Pradesh).Department of Science and Technology, Ministry of Science and Technology,New Delhi. Himalayan Glaciology Technical Report No. 1, p. 88.
Sangewar, C.V., Shukla, S.P., 2009. Inventory of the Himalayan Glaciers (an updatedEdition). Geological Survey of India, Special Publication No. 34, p. 169,175.
Shekhar, M.S., Chand, H., Kumar, S., Srinivasan, K., Ganju, A., 2010. Climate changestudies in the western Himalaya. Annals of Glaciology 51, 105e112.
Silverio, W., Jaquet, J.M., 2005. Glacial cover mapping (1987e1996) of the CordilleraBlanca (Peru) using satellite imagery. Remote Sensing of Environment 95,342e350.
Vincent, C., Ramanathan, A.L., Wagnon, P., Dobhal, D.P., Linda, A., Berthier, E.,Sharma, P., Arnaud, Y., Azam, M.F., Jose, P.G., Gardelle, J., 2013. Balanced con-ditions or slight mass gain of glaciers in the Lahaul and Spiti region (northernIndia, Himalaya) during the nineties preceded recent mass loss. The Cryosphere7, 569e582. http://dx.doi.org/10.5194/tc-7-569-2013.
Wagnon, P., Linda, A., Arnaud, Y., Kumar, R., Sharma, P., Vincent, C., Pottakkal, P.G.,Berthier, E., Ramanathan, A.L., Hasnain, S.I., Chevallier, P., 2007. Four years ofmass balance on Chhota Shigri Glacier, Himachal Pradesh, India, a newbenchmark glacier in the western Himalaya. Journal of Glaciology 53, 603e611.
Wang, Y., Hou, S., Liu, Y., 2009. Glacier changes in the Karlik Shan, Eastern Tien Shan,during 1971/72e2001/02. Annals of Glaciology 50, 39e45.
WGMS, 2012. Fluctuations of glaciers 2005e2010, Volume X. In: Zemp, M., Frey, H.,Gärtner-Roer, I., Nussbaumer, S.U., Hoelzle, M., Paul, F., Haeberli, W. (Eds.),ICSU(WDS)/IUGG(IACS)/UNEP/UNESCO/WMO, World Glacier Monitoring Ser-vice, 336. Publication Based on Database Version, Zurich, Switzerland. http://dx.doi.org/10.5904/wgms-fog-2012-11.
Way, R.G., Bell, T., Barrand, N.E., 2014. An inventory and topographic analysis ofglaciers in the Torngat Mountains, northern Labrador, Canada. Journal ofGlaciology 60 (No. 223). http://dx.doi.org/10.3189/2014JoG13J195.
Yang, X., Zhu, B., Wang, X., Li, C., Zhou, Z., Chen, J., Yin, J., Lu, Y., 2008. Late Qua-ternary environmental changes and organic carbon density in the HunshandakeSandy Land, eastern inner Mongolia, China. Global and Planetary Change 61,70e78.
Zhang, J., Goodchild, M.F., 2002. Uncertainty in Geographical Information. Taylor &Francis, London.