Embed Size (px)
Citation preview

Regional Research Institute
Working Paper Series
Telecommunications Investment and Economic
Development: Evidence from a Panel of Sub-Saharan Africa
(SSA)
By: Chali Nondo, Assistant Professor, Albany State University; and
Mulugeta S. Kahsai, Post-Doctoral Research Fellow, West Virginia University;
Research Paper Number 2011-04
Website address: rri.wvu.edu
Presented at the Southern Regional Science Association, March 2011,
New Orleans, Louisiana
1
Telecommunications Investment and Economic Development:
Evidence from a Panel of Sub-Saharan Africa (SSA)
Chali Nondo*
Assistant Professor
College of Business
Albany State University
Mulugeta Kahsai
Post-Doctoral Research Fellow
Regional Research Institute
West Virginia University
Abstract
The objective of this paper is to study the role of government effectiveness, institutional and
political factors in aggregate output and telecommunications penetration in SSA countries. The
contribution of these factors in aggregate output and telecommunications evolution is examined
using a framework that accounts for the endogeneity and interactions between aggregate output
and telephone penetration rates. Results from the study indicate that government effectiveness is
an important determinant for aggregate output. Another supplemental finding is that the
incessant political upheavals in SSA countries have a detrimental effect on aggregate output.
From this, we endorse that SSA countries should design and implement efficient institutional
frameworks and mechanisms that will expand telecommunications network infrastructure in both
rural and urban areas and thus spur growth and development.
Key words: telecommunications, economic growth, simultaneous growth equilibrium model
JEL: C33, O47, O57, R11
2
1.0 Introduction
Because of the high returns that telecommunications technologies offer to the
development process, many Sub-Saharan African (SSA) countries have over the past two
decades implemented important regulatory and economic reforms that are aimed at improving
and expanding access to telecommunications. Internet broadband, mobile cellular phones and
main telephone lines are among the primary key telecommunication technologies that have been
identified. The potential poverty alleviation and economic development benefits of
telecommunications has also been publicized by the United Nations and other international
development agencies.1 Despite these efforts, access, usage, and penetration rates for
telecommunications technology remains low and uneven within SSA countries.
While increased accessibility to telecommunications infrastructure is not a panacea to the
myriad development challenges faced by SSA countries, it is clear that in this digital era,
economic growth and social welfare inextricably depends upon the exchange of information
through telecommunications. Recently, two schools of thought on the role of
telecommunications in the development process have emerged. The first school of thought
hypothesize that telecommunications can help to close the digital divide, and thus, developing
countries can use telecommunications infrastructure to leapfrog the development process2. On
the other hand, the second school of thought postulates that telecommunications exacerbates the
information gap between the rich and the poor, the literate and illiterate, to the extent that
1 Like other infrastructural investments, information and communication technologies (ICTs) have been identified as
important drivers for achieving many development goals, including the UN Millennium Development Goals. 2 The term leapfrog is commonly used in the telecommunications literature to mean that developing countries can
use telecommunications technologies to skip or bypass several stages of the development process and thus provide
developing countries the opportunity to meet development goals.
3
telecommunications investment do not benefit the poor. Viewed in this manner
telecommunications investment negatively affect development (Roche and Blaine, 1996).
In support of the first school of thought, significant progress has been made in the
empirical literature in illuminating the long lasting positive impacts of telecommunications on
economic growth and social development (see Roller and Waverman, 2001, Cronin, et. al., 1993;
Datta and Agarwal, 2004; Hardy, 1980). These past studies also document that widespread
access to telecommunications augments the delivery of goods and services through information
flows, which increases overall per capita income, generates employment and revenue.
Furthermore, telecommunication technologies have been hypothesized to reduce the search and
transaction costs for firms and significantly affect the ability of firms to produce and export
goods and services competitively (Norton, 1992; Jensen, 2007).
Although past studies provide important insights on the relationship between
telecommunications and economic growth, there is a dearth of literature that have investigated
the role played by institutional quality, political stability, and government effectiveness in
stimulating telecommunication penetration and growth in SSA countries. To date, resolving
growth and development problems in SSA countries has been an elusive and complex task, due
to a host of factors, including poor legal and administrative structures, political, institutional,
social, and other factors that promote growth and development.
A recent survey conducted by Ernst and Young (2009) provide support for this view by
revealing that a major concern of telecommunications operators in SSA countries is political
interference. Many researchers including Acemoglu (2005), Lin and Nugent (1995), Scully
(1988) and others provide additional evidence on the role played by government effectiveness,
4
political stability, institutional quality, and social institutions in stimulating the amount and
quality of investments, as well as the long-run growth.
Within this context, the economic-telecommunications relationship within SSA must be
analyzed in a broader perspective by incorporating political and institutional environments.
Dismissing the importance of these factors in the development process of SSA countries may
lead to offering imprecise policy recommendations. With a dataset of 35 SSA countries covering
the period 1996-2006, the objective of this paper is to study the role of government effectiveness,
institutional and political factors in economic growth and telecommunications penetration in
SSA countries.
We accomplish the above objective by testing the following two hypotheses: (1)
aggregate output in SSA countries is influenced by telecommunications penetration, government
effectiveness and political factors; (2) per capita income, political and institutional factors, and
geographic area explain the variations in telecommunications penetration rates in SSA countries.
We test the above hypotheses by specifying a model that takes into account the endogeneity and
interactions between aggregate output and telephone lines (sum of main telephone lines and
mobile phones).
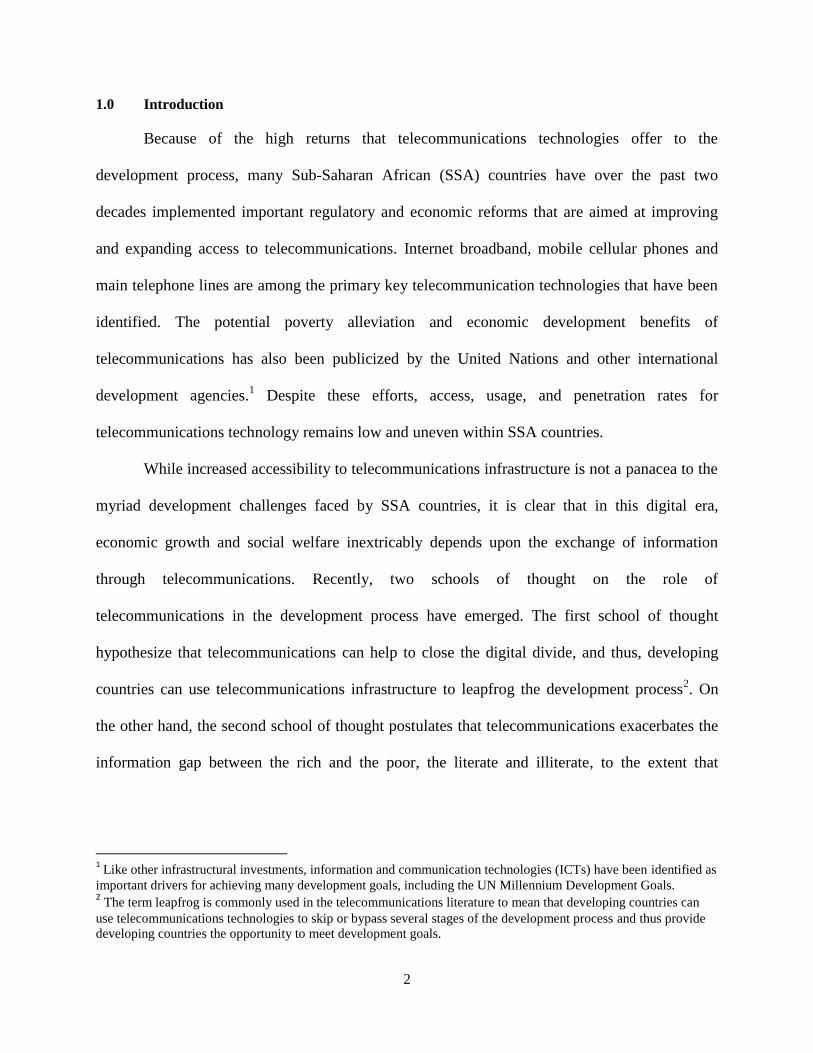
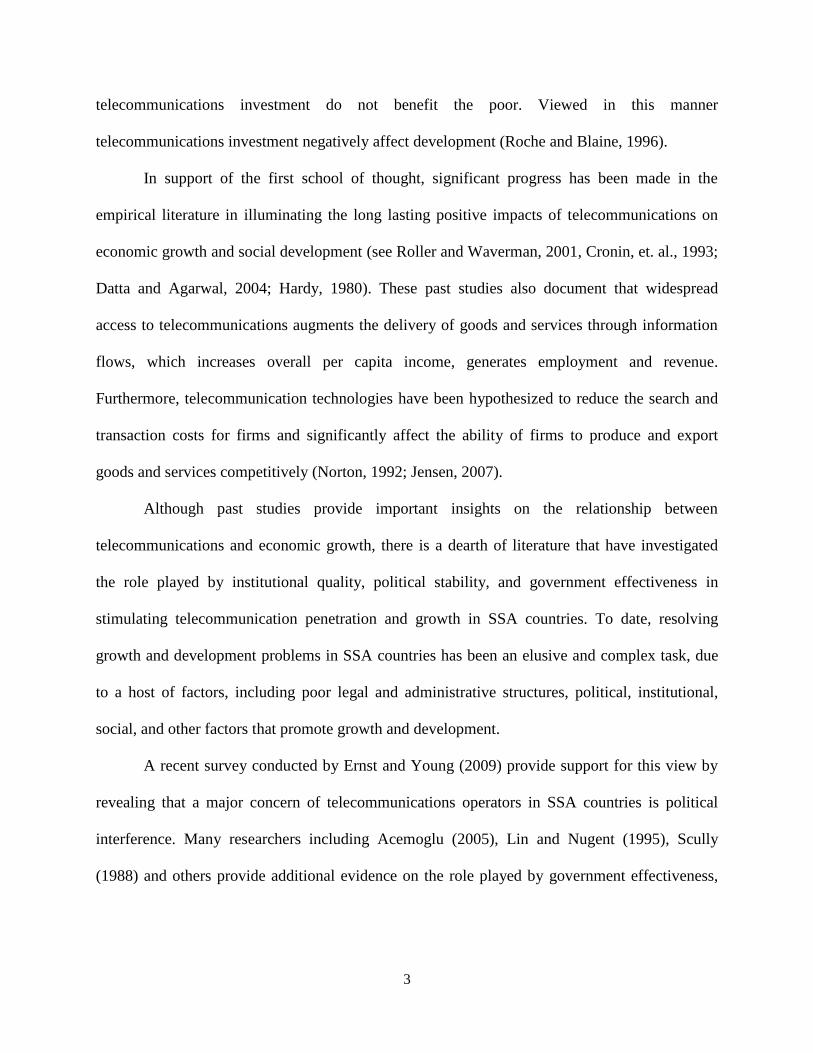
Data from the International Telecommunications Union (ITU, 2007) show that out
Africa’s 55 countries, over 75% of the 26 million fixed lines are concentrated in just 10
countries. By the end of 2006, SSA had an average of 3 fixed lines per 100 inhabitants, a number
which remains low compared to other continents. For example, during the same period North
America has an average of 34 fixed lines per 100 inhabitants. Overall, there has been a
substantial growth in telephone penetration (particularly the growth rate of mobile cellular
phones) over the past decade (see figures 1 and 2).
5
Source: International Telecommunications ICT Indicators Database
Figure 2:
Figure 1:
6
In the preceding section, we present the empirical model and types of data used, while in
section 3, presents results from the empirical model. The final section offers concluding remarks
and policy recommendations.
2.0 Empirical Model and Data
In order to analyze the impact of telecommunications on aggregate output, we use a
modeling approach that accounts for simultaneity between telecommunications and aggregate
output (GDP in constant values). As already argued, there exists a simultaneous relationship
between telecommunications and growth. Good telecommunications infrastructure increases the
flow of information, facilitates the transfer of knowledge, reduce transaction costs and market
imperfections. Viewed in this manner, telecommunications spurs growth; conversely, increased
growth will stimulate demand for telecommunications infrastructure.
Thus in order to understand the simultaneous interactions between GDP and
telecommunications, we specify a system of equations, which borrows from Waverman et al.
(2005). Departing from Waverman et al.’s (2005) work, the focus of this study is on 35 SSA
countries and we explicitly explore the role of political and institutional variables, and
government effectiveness in shaping the direction and evolution of GDP and telecommunications
penetration.
Based on the discussion above, our empirical analysis involves estimating the following
systems of equations (1) national aggregate output (GDP), which is a function of lagged values
of GDP, government effectiveness, political stability, telecommunications penetration, and other
exogenous variables; (2) demand for telecommunications, which relates price of
telecommunications services, per capita income, and other factors to demand; and (3) change in
7
telecommunication penetration rate as a function of initial telecommunications demand, GDP,
and other exogenous factors.
To assess empirically the effect of telecommunication penetration on aggregate output,
we specify a log-linear output equation in the form:
(1) ( ) ( ) ( ) ( ) + ( )
In the above equation, YRGDP equals real gross domestic product (GDP) and this measures the
value of goods and services produced in an economy. The output model is augmented by
including the lagged value of GDP ( ), which controls for the dynamic process in
which past values of GDP influence current GDP values. The expected sign on the coefficient for
lagged GDP is positive. Other explanatory variables included in the output equation are: gross
capital formation (YGCF), which measures the effect of investment in fixed capital by
businesses, households, and government on economic growth. According to classical economic
theory, gross capital formation has a positive effect on GDP; thus we hypothesize a positive sign
on YGCF. Labor force participation rate ( ) is included to capture the marginal productivity
of labor on output, and the coefficient for is hypothesized to be positive.
Referring to equation (1) is telecommunications infrastructure
penetration, measured as a sum of main telephones and mobile phones per 1,000 inhabitants. Our
model extends Waverman’s work by directly capturing the effect of government effectiveness
( ) and political instability ( ) on GDP. In a broader sense, government
effectiveness encompasses many characteristics, including the quality of the public service,
number of ministerial portfolios, quality of the civil service and its independence from political
pressures, and ability of the public sector to design and implement efficient and effective policies
8
that realize development goals (Kaufmann, et al., 2006). Arguably, these characteristics do not
often go together in many SSA countries. Other things being equal, improvement in government
effectiveness will positively influence GDP. Turning to the political instability variable, a lack of
civil and political liberties will negatively affect GDP, and thus the coefficient for is
expected to be negative.
The next equation we estimate in the system of equations is the demand for
telecommunications. Specifying the demand equation in double-log form, we have:
(2) ( ) ( ) ( ) ( ) ( ) ( )
The left hand variable is the demand for telecommunications ( ), which is the sum
of main telephone lines and mobile phones per 1,000 inhabitants.3 With all the coefficients being
elasticities, we have: is the income elasticity of demand for telecommunications, is the
price elasticity of telecommunication demand, is the elasticity of population to
telecommunication demand, is the price elasticity of demand, is the coefficient for the time
trend, and is the elasticity of the lagged value of the total demand for telecommunications,
and is the disturbance term.
Assuming that the demand for telecommunication is a normal good, we expect per capita
income ( ) to have a positive coefficient. The own price elasticity of demand ( )
is hypothesized to have a negative coefficient. We have also included year dummies to control
for technological progress across countries that occurred over the period of the analysis. Another
factor that will drive the demand for telecommunications is the overall expansion in population.
3 Although there is an observed asymmetry in the penetration rates for main telephone lines and mobile phones, with
the latter having higher penetration rates, we aggregate telephone lines per 1,000 people and mobile phones per
1,000 people to determine their aggregate impact on GDP.
9
We hypothesize a positive relationship between and demand for telecommunications
( )
The last equation in our system of equations is the growth of telecommunications
penetration, which is modeled as a function of GDP, country geographic area, institutional
quality, political instability, and telecommunications investment. The growth of
telecommunication penetration is specified as follows:
(3) ( ) ( )
Where is log of the percentage change in the number lines per 1,000 inhabitants
(fixed lines plus mobile phones) between the end of the previous period and the end of the
current period. Proximate sources of growth in telecommunication penetration in SSA countries
will not only depend on economic factors, but also on non-economic factors, such as
institutional, political factors, governance, and others. On the economic front, past studies
provide a strong case for the positive impact of gross domestic product ( ) and
telecommunications investment ( )4 on growth of telecommunication penetration
( ), respectively. Other things being equal, an increase in and will
stimulate growth of telecommunication penetration rates ( ).
With regard to the non-economic factors, the variable of interest is government
institutional quality ( ). North (1990) presents strong evidence on the correlation between
institutional quality and economic growth. Quality and effective government policies, including
the ability of the government to design and implement programs focused on growth, as well as
the promotion of competition will positively influence telecommunications penetration rates. To
control for market size, we include geographic area ( ). A larger geographic area implies
4 Investment in telecommunications is computed as a percentage of telecommunication revenues.
10
installing telecommunications equipment over a larger area, and thus increasing costs. Therefore,
we expect the coefficient for geographic area to be negative.
Our dataset contains 352 observations for 35 countries covering the period, 1996 to 2006.
Countries covered in the analysis and summary statistics for the variables used in the model are
presented in appendix 1 and 2, respectively. Data for our analysis come from various sources,
including PennWorld, International Telecommunications Union (ITU) and the World
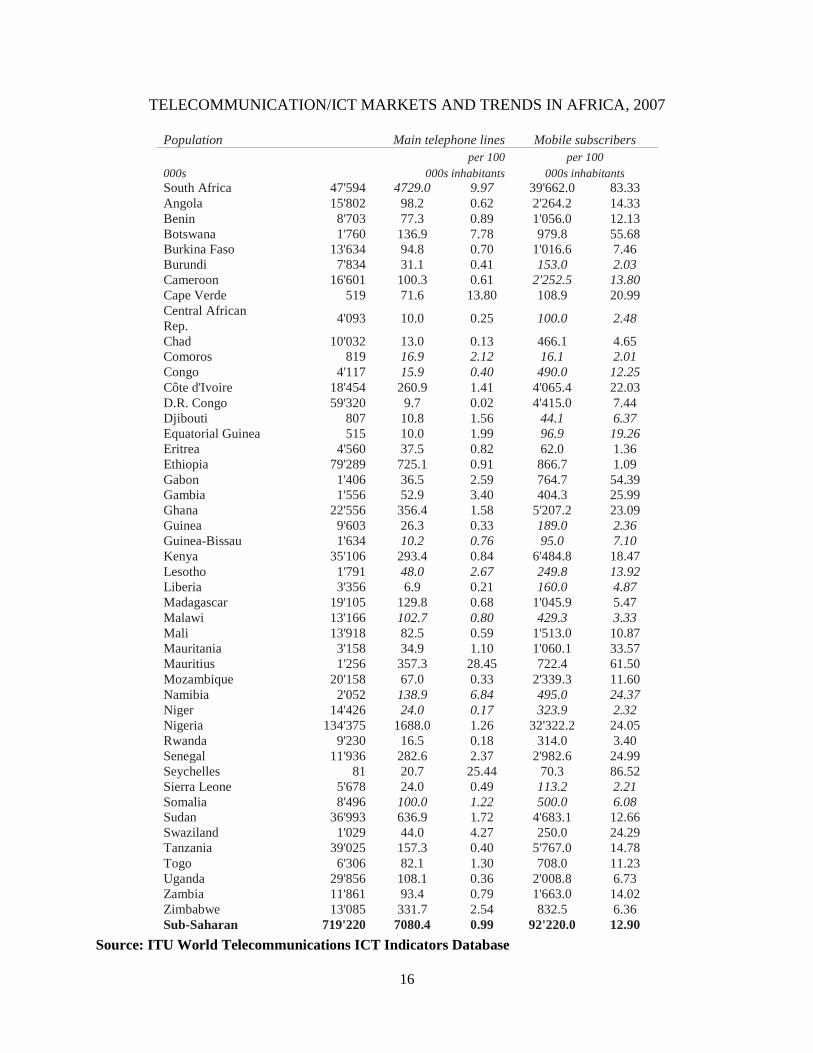
Development Indicators (WDI) database. Specific 2007 country penetration rates for fixed
telephone and mobile cellular phones are shown in Appendix 1.
3.0 Estimation and Results
We estimate a system of three equations, where the dependent variables are: nominal
GDP; telecommunications penetration per 1,000 inhabitants; and growth in telecommunication
penetration rates. We estimate the equations using the instrumental variable technique (3SLS),
which allows us to overcome potential biases induced by endogeneity problems between
telecommunications and gross domestic product.
Estimates for the aggregate output equation are shown table 2, columns 2 and 3. The
empirical model for aggregate output is statistically significant at the 1 percent level and has an
adjusted R-squared of 0.82. Except for one variable, all the coefficients for the explanatory
variables are statistically significant; however, two variables do not have the predicted signs. The
coefficient of telecommunications penetration ( ) is positive and statistically
significant. This confirms the hypothesis that telecommunication penetration positively
influences productivity across all sectors and that telecommunications is a prerequisite for
growth. Results on the relationship between lagged aggregate output (YRGDP) and current
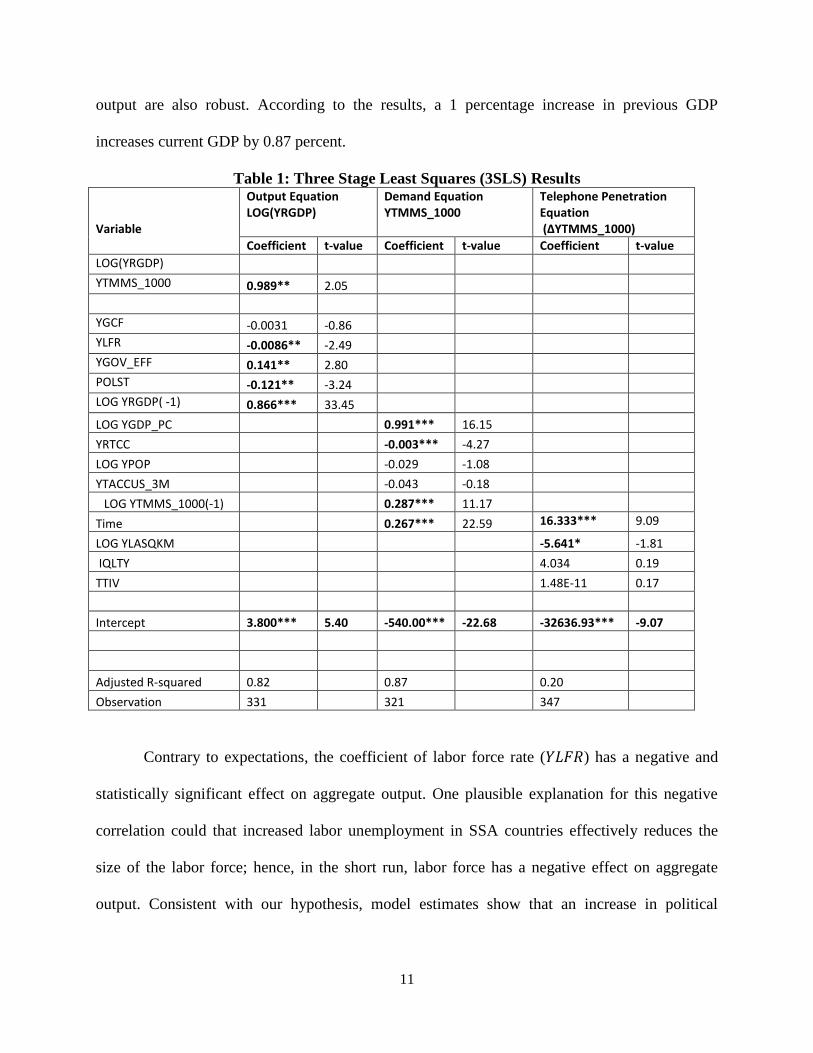
11
output are also robust. According to the results, a 1 percentage increase in previous GDP
increases current GDP by 0.87 percent.
Table 1: Three Stage Least Squares (3SLS) Results Variable
Output Equation LOG(YRGDP)
Demand Equation YTMMS_1000
Telephone Penetration Equation (ΔYTMMS_1000)
Coefficient t-value Coefficient t-value Coefficient t-value
LOG(YRGDP)
YTMMS_1000 0.989** 2.05
YGCF -0.0031 -0.86
YLFR -0.0086** -2.49
YGOV_EFF 0.141** 2.80
POLST -0.121** -3.24
LOG YRGDP( -1) 0.866*** 33.45
LOG YGDP_PC 0.991*** 16.15
YRTCC -0.003*** -4.27
LOG YPOP -0.029 -1.08
YTACCUS_3M -0.043 -0.18
LOG YTMMS_1000(-1) 0.287*** 11.17
Time 0.267*** 22.59 16.333*** 9.09
LOG YLASQKM -5.641* -1.81
IQLTY 4.034 0.19
TTIV 1.48E-11 0.17
Intercept 3.800*** 5.40 -540.00*** -22.68 -32636.93*** -9.07
Adjusted R-squared 0.82 0.87 0.20
Observation 331 321 347
Contrary to expectations, the coefficient of labor force rate ( ) has a negative and
statistically significant effect on aggregate output. One plausible explanation for this negative
correlation could that increased labor unemployment in SSA countries effectively reduces the
size of the labor force; hence, in the short run, labor force has a negative effect on aggregate
output. Consistent with our hypothesis, model estimates show that an increase in political
12
instability reduces aggregate output, while an increase in government effectiveness positively
influences aggregate output.
Results for the demand equation (all telephone lines per 1,000 inhabitants) are shown in
table 2, columns 3 and 4. Overall, the empirical model is statistically significant at the .1 percent
level. The adjusted R-squared indicates that 87 percent of the variations are explained by the
model. From table 2, it can also be seen that all coefficients, except one (log of population) have
the predicted signs and two coefficients are statistically insignificant. The estimates show that a 1
percentage increase in per capita income will increase demand for telephones by 0.9 percent.
Although the coefficient for price elasticity is statistically significant, its effect on final demand
for telephones is very small. According to model results, current telephone demand significantly
responds to lagged values (or previous levels) of telephone demand. Accordingly, a 1 percentage
increase in previous telephone demand increases current demand for telephones by 0.29 percent.
The last equation estimated is the growth in telephone penetration. The model is
statistically significant at the 1 percent level and its adjusted R square is 0.20. Despite the fact
that all the explanatory variables have the predicted signs, two of the key variables in the growth
of telecommunication penetration (institutional quality and telecommunications investment) are
statistically insignificant. The coefficient of country geographic area ( ) is negative
and significant at the 10 percent level. The interpretation of the negative coefficient on
is that growth of telecommunication penetration in SSA countries diminishes with
the geographic area of a country. The coefficient estimate for the time trend is also statistically
significant.
13
Conclusions and Recommendations
This paper presents an analysis of the simultaneous relationship between aggregate
output (GDP) and telecommunication penetrations on 35 SSA countries for the period 1996-
2006. Most importantly, the econometric results presented in this study shed light on some of the
strategies for stimulating aggregate output and telecommunication penetration. We find that an
increase in telecommunication penetration reinforces aggregate output (GDP) and that per capita
income reinforces demand for telecommunications. From this we conclude that the associated
network and spillover effects of telecommunications have important implications for stimulating
productivity across sectors. Our study also shows that government effectiveness is an important
determinant for aggregate output. Another supplemental finding is that the incessant political
upheavals in SSA countries have a detrimental effect on aggregate output.
Although the coefficients for institutional quality and telecommunication investment fail
to attain any statistical significance, we endorse that SSA countries should design and implement
efficient institutional frameworks and mechanisms that will expand telecommunications network
infrastructure in both rural and urban areas and thus spur growth and development. Finally,
because of the important role played by telecommunications in national economies, policy
measures of facilitating the expansion of telecommunications through private and public
investment should be pursued vigorously.
14
REFERENCES
Acemoglu, D., and J. A. Robison. (2005). Economic Origins of Dictatorship and Democracy.
New York: Cambridge University Press.
Cronin, F., E. Colleran, P. Herbert, and S. Lewitzky. (1993). “Telecommunications and
Economic Growth: The Contribution of Telecommunication Infrastructure Investment to
Aggregate and Sectoral Productivity.” Telecommunications Policy, 6: 529-535.
Datta, A. and S. Agarwal. (2004). “Telecommunications and Economic Growth: A Panel Data
approach”, Applied Economics, 15: 1649 -1654.
Ernst &Young. (2009). Survey on the Development Telecommunications Center.
Hardy, A. (1980). “The Role of the Telephone in Economic Development”, Telecommunications
Policy, 4: 278-286.
Jensen, R. (2007). “The Digital Provide: Information (Technology), Market Performance, and
Welfare in the South Indian Fisheries Sector.” Quarterly Journal of Economics, 3: 879-924.
Kaufmann, D., A. Kraay, and M. Mastruzzi. (2006). “Governance Matters: Aggregate and
Individual Governance Indicators for 1996-2005.” World Bank.
Lin, J., and J. Nugent. (1995). Institutions and Economic Development, in Handbook of
Economic Development, vol. 3A. Amsterdam: The Netherlands.
North, D. C. (1990). Institutions, Institutional Change and Economic Performance. Cambridge,
Cambridge University Press.
Norton, S.W. (1992). Transaction Costs, Telecommunications, and the Microeconomics of
Macroeconomic Growth. Economic Development and Cultural Change, 41(1): 175-196.
Roche, E.M. and M. J. Blaine. (1996). Information Technology, Development and Policy,
Avebury, U.K.: Aldershot.
Röller, L. and L. Waverman. (2001). “Telecommunications Infrastructure and Economic
Development: A Simultaneous Approach,” American Economic Review, 74: 909-923.
Saith, A. (2002). “ICT: Hope or Hype.” Paper presented at ICTs and Indian Development.
Bangalore.
Scully, G. W. (1988). “The Institutional Framework and Economic Development.” Journal of
Political Economy, 3: 652-62.
15
Sridhar, K. S. and V. Sridhar. (2004. “Telecommunications infrastructure and economic growth:
Evidence from developing countries.” National Institute of Public Finance and Policy,
Working Papers.
Waverman, L., M. Meschi, and M. A. Fuss, (2005). “The Impact of Telecoms on Economic
Growth in Developing Countries, in The Vodafone Policy Paper Series 3, Vodafone, 10-24.
World Bank, World Development Indicators Report:Infrastructure
16
TELECOMMUNICATION/ICT MARKETS AND TRENDS IN AFRICA, 2007
Population Main telephone lines Mobile subscribers
per 100 per 100
000s 000s inhabitants 000s inhabitants
South Africa 47'594 4729.0 9.97 39'662.0 83.33
Angola 15'802 98.2 0.62 2'264.2 14.33
Benin 8'703 77.3 0.89 1'056.0 12.13
Botswana 1'760 136.9 7.78 979.8 55.68
Burkina Faso 13'634 94.8 0.70 1'016.6 7.46
Burundi 7'834 31.1 0.41 153.0 2.03
Cameroon 16'601 100.3 0.61 2'252.5 13.80
Cape Verde 519 71.6 13.80 108.9 20.99
Central African
Rep. 4'093 10.0 0.25 100.0 2.48
Chad 10'032 13.0 0.13 466.1 4.65
Comoros 819 16.9 2.12 16.1 2.01
Congo 4'117 15.9 0.40 490.0 12.25
Côte d'Ivoire 18'454 260.9 1.41 4'065.4 22.03
D.R. Congo 59'320 9.7 0.02 4'415.0 7.44
Djibouti 807 10.8 1.56 44.1 6.37
Equatorial Guinea 515 10.0 1.99 96.9 19.26
Eritrea 4'560 37.5 0.82 62.0 1.36
Ethiopia 79'289 725.1 0.91 866.7 1.09
Gabon 1'406 36.5 2.59 764.7 54.39
Gambia 1'556 52.9 3.40 404.3 25.99
Ghana 22'556 356.4 1.58 5'207.2 23.09
Guinea 9'603 26.3 0.33 189.0 2.36
Guinea-Bissau 1'634 10.2 0.76 95.0 7.10
Kenya 35'106 293.4 0.84 6'484.8 18.47
Lesotho 1'791 48.0 2.67 249.8 13.92
Liberia 3'356 6.9 0.21 160.0 4.87
Madagascar 19'105 129.8 0.68 1'045.9 5.47
Malawi 13'166 102.7 0.80 429.3 3.33
Mali 13'918 82.5 0.59 1'513.0 10.87
Mauritania 3'158 34.9 1.10 1'060.1 33.57
Mauritius 1'256 357.3 28.45 722.4 61.50
Mozambique 20'158 67.0 0.33 2'339.3 11.60
Namibia 2'052 138.9 6.84 495.0 24.37
Niger 14'426 24.0 0.17 323.9 2.32
Nigeria 134'375 1688.0 1.26 32'322.2 24.05
Rwanda 9'230 16.5 0.18 314.0 3.40
Senegal 11'936 282.6 2.37 2'982.6 24.99
Seychelles 81 20.7 25.44 70.3 86.52
Sierra Leone 5'678 24.0 0.49 113.2 2.21
Somalia 8'496 100.0 1.22 500.0 6.08
Sudan 36'993 636.9 1.72 4'683.1 12.66
Swaziland 1'029 44.0 4.27 250.0 24.29
Tanzania 39'025 157.3 0.40 5'767.0 14.78
Togo 6'306 82.1 1.30 708.0 11.23
Uganda 29'856 108.1 0.36 2'008.8 6.73
Zambia 11'861 93.4 0.79 1'663.0 14.02
Zimbabwe 13'085 331.7 2.54 832.5 6.36
Sub-Saharan 719'220 7080.4 0.99 92'220.0 12.90
Source: ITU World Telecommunications ICT Indicators Database