Embed Size (px)
Citation preview

Regional Staff Committee | Remote Only Date: Thursday, November 18, 2021 from 9:30-11:00 am
1. Welcome and Introductions (9:30) – Jesse Hamashima, Pierce County, Co-Chair
2. Reports (9:35)a. Meeting Summary for October 21, 2021*b. PSRC Announcements and Updates
3. Discussion Item (9:40)a. Local Comprehensive Plan Economy Element Guide* – Noah Boggess,
PSRC
4. Discussion Item (10:10)a. US Census Data and Community Data Profiles* – Craig Helmann, PSRC
5. Discussion Item (10:40)a. Committee Networking and Around the Room Highlights – Jesse
Hamashima, Pierce County, Co-ChairMembers will break out into smaller groups for a brief meet and greet, andthen will return to the main Zoom room to share news from their localjurisdictions or items of interest to their peers.
6. Information Itema. Regional Equity Strategy* – Charles Patton, PSRC
7. Next meeting: TBA
8. Adjourn (11:00)
*Supporting materials attached.
Zoom Remote Connection Details • To join via a smart device or web browser, go to https://psrc-
org.zoom.us/j/85850584698?pwd=ODNXdHRVUnRVdkdqNk5kVnJCUkhDQT09and enter Meeting ID: 858 5058 4698 and Passcode: 184908.
• To join via phone, call 877 853 5257 and enter Meeting ID: 858 5058 4698 andPasscode: 184908.

• Sign language and communication material in alternate formats can be arranged given sufficient notice by calling (206) 464-7090 or TTY Relay 711.
| Arabic, 中文 | Chinese, Deutsch | German, Français | French, 한국어| العربیة •Korean, Русский | Russian, Español | Spanish, Tagalog, Tiếng việt | Vietnamese, visit https://www.psrc.org/contact-center/language-assistance.
Regional Staff Committee Packet pg 2

Regional Staff Committee Meeting Summary Date: October 21, 2021 Location: Remote Only Presentations from the meeting are available on the PSRC website: https://www.psrc.org/rsc-meetings. Audio recording of the meeting is available by request.
Introductions and Announcements Jesse Hamashima, Co-Chair, called the meeting to order at 9:30 am. Participants were asked to view the meeting attendance on the “chat” feature on Zoom, and phone-in participants were asked to identify themselves verbally. Reports Co-Chair Jesse Hamashima welcomed the committee members and explained that PSRC staff would provide short updates on upcoming policy and Executive Board meetings and review the status of ongoing projects in the work program. Ben Bakkenta, Director of Regional Planning at PSRC, welcomed the members and began his staff report with a reminder that the PSRC office will remain closed through the end of the year. He also encouraged members to attend the TOOLBOX Peer Networking online workshop, Equitable Engagement in Comprehensive Plans: Tools and Strategies for Local Jurisdictions on Friday, October 29 from 10 am to noon. Ben reminded the committee that Item 7 in the agenda packet detailed upcoming workshops hosted by Puget Sound Partnership on identifying actions for Puget Sound Recovery, with registration at https://psp.wa.gov/identifying-actions.php. He briefly updated the RSC on staff transitions, including that Maggie Moore has shifted into a Senior Planner role with the Growth Management Team. He also thanked Craig Kenworthy, the longtime RSC member representing Puget Sound Clean Air Agency, for his service on the committee, and wished him a happy retirement.
Discussion: Regional Transportation Plan Update Kelly McGourty, Director of Transportation Planning, briefed the RSC on the development of the Regional Transportation Plan, including the results of ongoing public outreach, board discussions on key policy focus areas and financial strategy assumptions. At the October meeting, staff presented the preliminary analysis results of the plan, a briefing on additional outreach since conducted, and next steps. You can view the presentation here.
Item 2a Regional Staff Committee Packet pg 3
For more information, contact Kelly McGourty, Director of Transportation Planning, at [email protected]. Discussion: Coordination with Tribes in Comprehensive Planning Erika Harris, Senior Planner, shared with the committee a new handout, co-created by PSRC with input from local Tribes, on how to coordinate with Tribes in comprehensive planning, as well as a webpage with resources on coordination with Tribes. You can view the presentation here. For more information, contact Erika Harris, Senior Planner, at [email protected]. Discussion: Comprehensive Plan Guidance Liz Underwood-Bultmann, Principal Planner, briefed the committee and asked for feedback on guidance and resources to support the 2024 comprehensive plan updates. VISION 2050 calls for PSRC to support efforts to update countywide planning policies, local comprehensive plans, and infrastructure and utility plans, including providing updated plan review and certification guidance. (RC-Action-1). You can view the presentation here. For more information, contact Liz Underwood-Bultmann, Principal Planner, at [email protected]. Discussion: Regional Equity Strategy Workshop PSRC has made progress on regional equity work, including various components of the Regional Equity Strategy. At the October meeting of the RSC, Charles Patton, Program Manager, briefed members on work to date related to the Strategy and asked for their feedback. You can view the presentation here. To learn more about key takeaways from the breakout sessions, please refer to Item 6a in this agenda packet (Information Item: Regional Equity Strategy Workshop). For more information, contact Charles Patton, Program Manager, at [email protected]. Adjourn The meeting adjourned at 11:30 am.
Members and Alternates Represented at the Table See attached attendance roster.
Item 2a Regional Staff Committee Packet pg 4
PSRC Staff and Other Guests Present Mikayla Svob, PSRC Kelly McGourty, PSRC Kay Barnes, City of Everett Kathryn Johnson, PSRC Galaxy Tab S5e Maggie Moore, PSRC Erin Hogan, PSRC Erika Harris, PSRC Kristin Mitchell, PSRC Paul Inghram, PSRC Charles Patton, PSRC Grant Gibson, PSRC Brian Lee, PSRC Mary Richards, PSRC Miles Stepleton, PSRC Gen Rubinelli Liz Underwood-Bultmann, PSRC Craig Helmann, PSRC Noah Boggess, PSRC Ben Kahn, PSRC Jason Thibedeau, PSRC Miller Gil Cerise, PSRC Kim Pearson, PSRC Nancy Buonanno Grennan, PSRC Josh Brown, PSRC Anne Avery, PSRC Pauline Mogilevsky, Kitsap Regional Coordinating Council Jennifer Barnes, PSRC Glenn
Item 2a Regional Staff Committee Packet pg 5
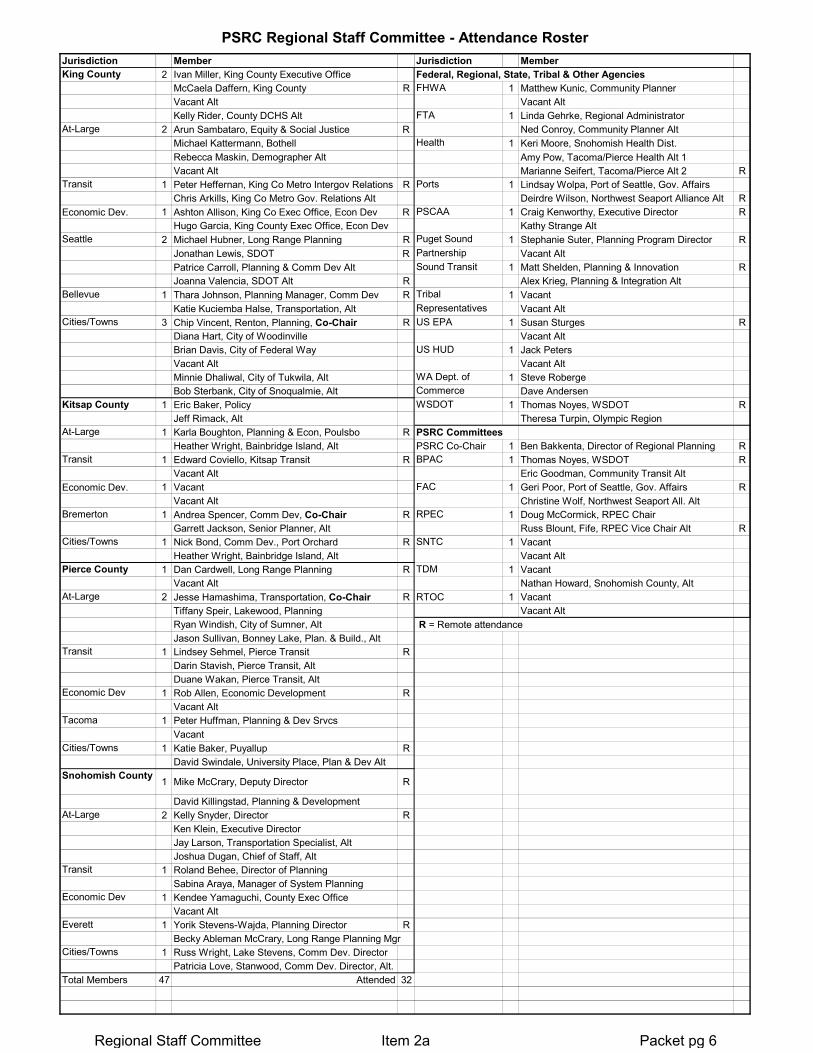
PSRC Regional Staff Committee - Attendance RosterJurisdiction Member Jurisdiction MemberKing County 2 Ivan Miller, King County Executive Office Federal, Regional, State, Tribal & Other Agencies
McCaela Daffern, King County R FHWA 1 Matthew Kunic, Community PlannerVacant Alt Vacant AltKelly Rider, County DCHS Alt FTA 1 Linda Gehrke, Regional Administrator
At-Large 2 Arun Sambataro, Equity & Social Justice R Ned Conroy, Community Planner AltMichael Kattermann, Bothell Health 1 Keri Moore, Snohomish Health Dist.Rebecca Maskin, Demographer Alt Amy Pow, Tacoma/Pierce Health Alt 1Vacant Alt Marianne Seifert, Tacoma/Pierce Alt 2 R
Transit 1 Peter Heffernan, King Co Metro Intergov Relations R Ports 1 Lindsay Wolpa, Port of Seattle, Gov. AffairsChris Arkills, King Co Metro Gov. Relations Alt Deirdre Wilson, Northwest Seaport Alliance Alt R
Economic Dev. 1 Ashton Allison, King Co Exec Office, Econ Dev R PSCAA 1 Craig Kenworthy, Executive Director RHugo Garcia, King County Exec Office, Econ Dev Kathy Strange Alt
Seattle 2 Michael Hubner, Long Range Planning R Puget Sound 1 Stephanie Suter, Planning Program Director RJonathan Lewis, SDOT R Partnership Vacant AltPatrice Carroll, Planning & Comm Dev Alt Sound Transit 1 Matt Shelden, Planning & Innovation RJoanna Valencia, SDOT Alt R Alex Krieg, Planning & Integration Alt
Bellevue 1 Thara Johnson, Planning Manager, Comm Dev R Tribal 1 VacantKatie Kuciemba Halse, Transportation, Alt Representatives Vacant Alt
Cities/Towns 3 Chip Vincent, Renton, Planning, Co-Chair R US EPA 1 Susan Sturges RDiana Hart, City of Woodinville Vacant AltBrian Davis, City of Federal Way US HUD 1 Jack PetersVacant Alt Vacant AltMinnie Dhaliwal, City of Tukwila, Alt WA Dept. of 1 Steve RobergeBob Sterbank, City of Snoqualmie, Alt Commerce Dave Andersen
Kitsap County 1 Eric Baker, Policy WSDOT 1 Thomas Noyes, WSDOT RJeff Rimack, Alt Theresa Turpin, Olympic Region
At-Large 1 Karla Boughton, Planning & Econ, Poulsbo R PSRC CommitteesHeather Wright, Bainbridge Island, Alt PSRC Co-Chair 1 Ben Bakkenta, Director of Regional Planning R
Transit 1 Edward Coviello, Kitsap Transit R BPAC 1 Thomas Noyes, WSDOT RVacant Alt Eric Goodman, Community Transit Alt
Economic Dev. 1 Vacant FAC 1 Geri Poor, Port of Seattle, Gov. Affairs RVacant Alt Christine Wolf, Northwest Seaport All. Alt
Bremerton 1 Andrea Spencer, Comm Dev, Co-Chair R RPEC 1 Doug McCormick, RPEC ChairGarrett Jackson, Senior Planner, Alt Russ Blount, Fife, RPEC Vice Chair Alt R
Cities/Towns 1 Nick Bond, Comm Dev., Port Orchard R SNTC 1 VacantHeather Wright, Bainbridge Island, Alt Vacant Alt
Pierce County 1 Dan Cardwell, Long Range Planning R TDM 1 VacantVacant Alt Nathan Howard, Snohomish County, Alt
At-Large 2 Jesse Hamashima, Transportation, Co-Chair R RTOC 1 VacantTiffany Speir, Lakewood, Planning Vacant AltRyan Windish, City of Sumner, Alt R = Remote attendanceJason Sullivan, Bonney Lake, Plan. & Build., Alt
Transit 1 Lindsey Sehmel, Pierce Transit RDarin Stavish, Pierce Transit, AltDuane Wakan, Pierce Transit, Alt
Economic Dev 1 Rob Allen, Economic Development RVacant Alt
Tacoma 1 Peter Huffman, Planning & Dev SrvcsVacant
Cities/Towns 1 Katie Baker, Puyallup RDavid Swindale, University Place, Plan & Dev Alt
Snohomish County 1 Mike McCrary, Deputy Director R
David Killingstad, Planning & DevelopmentAt-Large 2 Kelly Snyder, Director R
Ken Klein, Executive DirectorJay Larson, Transportation Specialist, AltJoshua Dugan, Chief of Staff, Alt
Transit 1 Roland Behee, Director of Planning Sabina Araya, Manager of System Planning
Economic Dev 1 Kendee Yamaguchi, County Exec OfficeVacant Alt
Everett 1 Yorik Stevens-Wajda, Planning Director RBecky Ableman McCrary, Long Range Planning Mgr
Cities/Towns 1 Russ Wright, Lake Stevens, Comm Dev. DirectorPatricia Love, Stanwood, Comm Dev. Director, Alt.
Total Members 47 Attended 32
Item 2aRegional Staff Committee Packet pg 6
DISCUSSION ITEM November 18, 2021
TO: Regional Staff Committee
FROM: Noah P. Boggess, Associate Planner
SUBJECT: Local Economic Development Planning
IN BRIEF
PSRC staff are preparing to assist jurisdictions in economic development planning for the upcoming 2024 comprehensive plan update process. Primary efforts include the development of an Economic Development Element Guide and technical assistance workshops in 2022. Staff will provide an overview of the guide to the Regional Staff Committee and gather feedback on the document and forthcoming technical assistance workshops.
DISCUSSION
In October 2020, PSRC’s General Assembly adopted VISION 2050 as the long-range growth management, environmental, economic and transportation strategy for the central Puget Sound region. VISION includes a regional action for PSRC to support local governments in their economic development planning efforts:
Ec-Action-2: Regional Support for Local Government Economic Development Planning: PSRC will support county and local jurisdictions through technical assistance and economic data with special emphasis on smaller jurisdictions, in their efforts to development economic development elements as part of their expected 2024 comprehensive plan updates to support the Regional Growth Strategy. PSRC will also provide guidance on local planning to address commercial displacement.
In addition, VISION includes a local action for cities and counties to develop economic development elements as part of their 2024 comprehensive plan updates:
Ec-Action-5: Economic Development Elements: Cities and counties will update (or adopt) their economic development element – tailored to meet the jurisdiction's unique needs and leveraging public investments – as specified in the Growth Management Act, when conducting the expected 2024 comprehensive plan update.
Item 3a Regional Staff Committee Packet pg 7

To provide technical assistance to local jurisdictions in developing their economic development elements, PSRC staff is developing an Economic Development Element Guide. The guide builds on economic development policies adopted in VISION 2050, and describes how to build a SWOT analysis, details common data metrics and how to access them, and briefs planners on the policy-making process. The Economic Development Element Guide is organized into goal sections that align with the review checklist that is part of the Plan Review Manual used by PSRC staff when certifying local plans. The element guide provides instruction on how to create effective, place-specific local policies that build and strengthen the local economy while working toward common regional goals. The policy goal areas included in the Plan Review Manual for Economic Development are:
• Identify and enhance industry clusters, including those recognized in the Regional Economic Strategy that provide goods and services for export
• Focus retention and recruitment efforts and activities to foster a positive business climate and diversify employment opportunities by specifically targeting:
o Businesses that provide living wage jobs o Locally, women-, and minority-owned businesses and start-up companies o Established and emerging industries, technologies, and services that
promote environmental sustainability, especially those addressing climate change and resilience
• Promote strategies and policies that expand access to opportunity and remove barriers for economically disconnected communities
• Address and prevent potential physical, economic, and cultural displacement of existing businesses that may result from redevelopment and market pressure
• Develop a range of employment opportunities to create a closer balance between jobs and housing
• Promote environmental and socially responsible business practices, especially those addressing climate change, resilience, and improved health outcomes
• Support, recognize, and empower the contributions of the region’s culturally and ethnically diverse communities, institutions, and Native Tribes
Additionally, staff will discuss the future of these efforts and highlight other economic development work at the agency. Next Steps Following the finalization of this guide, PSRC Economic Development staff will be working to create technical assistance workshops to assist local planners in building economic development elements. The Regional Staff Committee will be asked to provide feedback on the Element Guide and forthcoming technical assistance workshops.
Item 3a Regional Staff Committee Packet pg 8

Lead Staff Contact Noah P. Boggess, Associate Planner, at 206-464-6170, or at [email protected].
Item 3a Regional Staff Committee Packet pg 9
Economic Development Element Guide
VISION 2050 Planning Resources
DRAFT-11.8.2021
Item 3aRegional Staff Committee Packet pg 10
VISION 2050 Planning Resources | Economic Development Element Guide
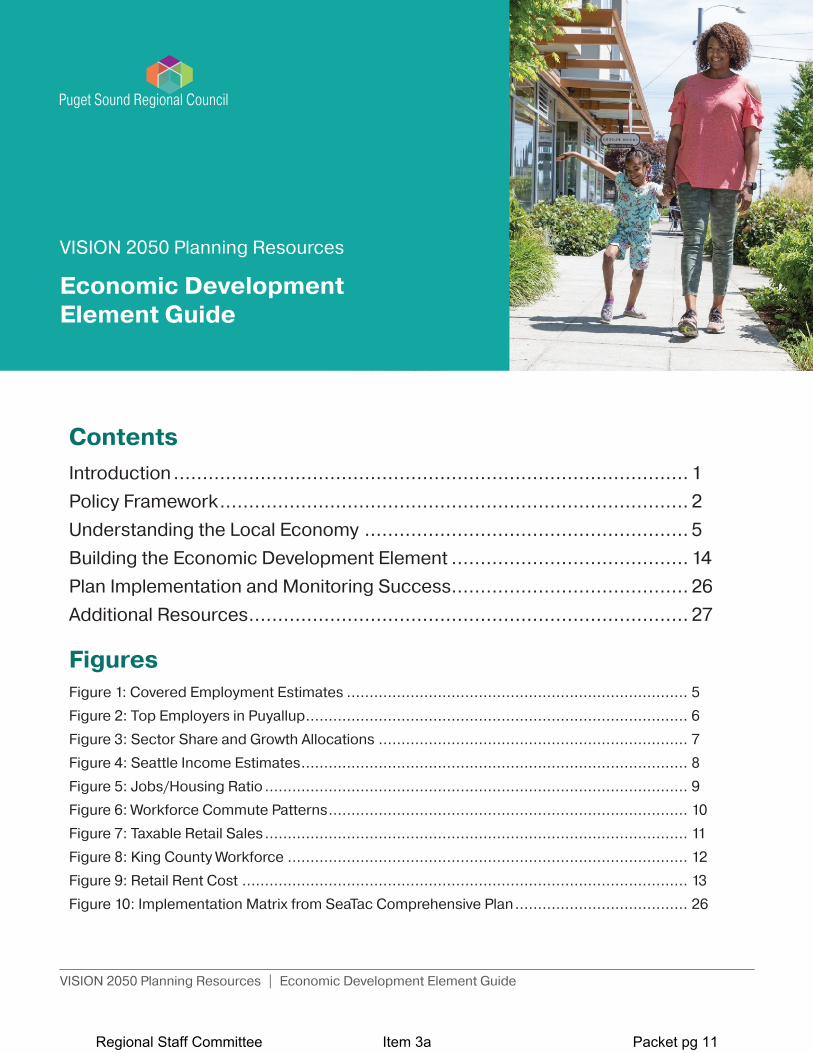
ContentsIntroduction ......................................................................................... 1Policy Framework ................................................................................. 2Understanding the Local Economy ........................................................ 5Building the Economic Development Element ......................................... 14Plan Implementation and Monitoring Success ......................................... 26Additional Resources ............................................................................ 27
FiguresFigure 1: Covered Employment Estimates ........................................................................... 5
Figure 2: Top Employers in Puyallup .................................................................................... 6
Figure 3: Sector Share and Growth Allocations .................................................................... 7
Figure 4: Seattle Income Estimates ..................................................................................... 8
Figure 5: Jobs/Housing Ratio ............................................................................................. 9
Figure 6: Workforce Commute Patterns ............................................................................... 10
Figure 7: Taxable Retail Sales ............................................................................................. 11
Figure 8: King County Workforce ........................................................................................ 12
Figure 9: Retail Rent Cost .................................................................................................. 13
Figure 10: Implementation Matrix from SeaTac Comprehensive Plan ...................................... 26
Economic Development Element Guide
VISION 2050 Planning Resources
Item 3aRegional Staff Committee Packet pg 11
VISION 2050 Planning Resources | Economic Development Element Guide 1
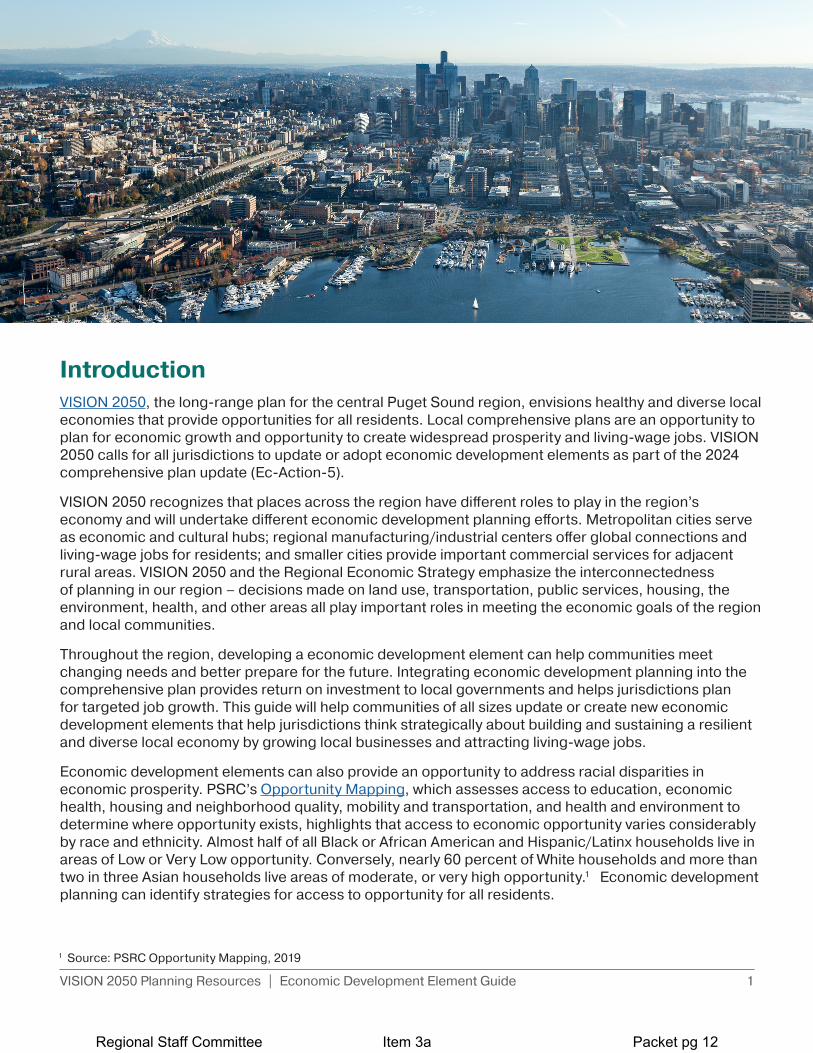
IntroductionVISION 2050, the long-range plan for the central Puget Sound region, envisions healthy and diverse local economies that provide opportunities for all residents. Local comprehensive plans are an opportunity to plan for economic growth and opportunity to create widespread prosperity and living-wage jobs. VISION 2050 calls for all jurisdictions to update or adopt economic development elements as part of the 2024 comprehensive plan update (Ec-Action-5).
VISION 2050 recognizes that places across the region have different roles to play in the region’s economy and will undertake different economic development planning efforts. Metropolitan cities serve as economic and cultural hubs; regional manufacturing/industrial centers offer global connections and living-wage jobs for residents; and smaller cities provide important commercial services for adjacent rural areas. VISION 2050 and the Regional Economic Strategy emphasize the interconnectedness of planning in our region – decisions made on land use, transportation, public services, housing, the environment, health, and other areas all play important roles in meeting the economic goals of the region and local communities.
Throughout the region, developing a economic development element can help communities meet changing needs and better prepare for the future. Integrating economic development planning into the comprehensive plan provides return on investment to local governments and helps jurisdictions plan for targeted job growth. This guide will help communities of all sizes update or create new economic development elements that help jurisdictions think strategically about building and sustaining a resilient and diverse local economy by growing local businesses and attracting living-wage jobs.
Economic development elements can also provide an opportunity to address racial disparities in economic prosperity. PSRC’s Opportunity Mapping, which assesses access to education, economic health, housing and neighborhood quality, mobility and transportation, and health and environment to determine where opportunity exists, highlights that access to economic opportunity varies considerably by race and ethnicity. Almost half of all Black or African American and Hispanic/Latinx households live in areas of Low or Very Low opportunity. Conversely, nearly 60 percent of White households and more than two in three Asian households live areas of moderate, or very high opportunity.1 Economic development planning can identify strategies for access to opportunity for all residents.
1 Source: PSRC Opportunity Mapping, 2019
Item 3aRegional Staff Committee Packet pg 12
VISION 2050 Planning Resources | Economic Development Element Guide 2
Using this GuideMany cities and counties have adopted an economic development element already, while some are just beginning this work. While this guide can help create a brand-new element, it also provides ways to strengthen or update existing policies to address key changes from VISION 2040. The guide also recognizes that communities have different types of opportunities, challenges, and resources, but synthesizes the steps for economic development planning into components that are accessible for communities of all capacities. Guidance is included to help jurisdictions understand their local economy, create a vision and goals, and structure policies that work toward those goals. Moreover, the guide explains the relationship between economic development and planning efforts that have already been completed in other components of comprehensive plans.
This document is organized into four sections:
► Policy Framework: describes state, regional, and local policy contexts for economic development planning
► Understanding the Local Economy: provides guidance on data to inform policy decisions
► Building the Economic Development Element: details best practices for preparing a SWOT (Strengths, Weaknesses, Opportunities, and Threats) analysis, carrying out public participation, and assessing goals, policies, and actions
► Plan Implementation and Monitoring Success: describes how to evaluate the success of policy and actions
Policy FrameworkGrowth Management ActEconomic development is one of fourteen statewide planning goals under the Growth Management Act (GMA). The GMA goal encourages local jurisdictions, through comprehensive plans and development regulations, to promote economic opportunity for all residents, especially for unemployed and disadvantaged people, promote the retention and expansion of existing businesses and recruitment of new businesses, and encourage growth in areas experiencing insufficient economic growth, all within the capacities of the state’s natural resources, public services, and public facilities.2 GMA emphasizes coordination and consistency – plans must be internally consistent, and other state goals and comprehensive plan elements are essential for supporting a strong local economy.
Cities and counties required to plan under GMA are encouraged to include an economic development element in their comprehensive plan.3 The element must establish “local goals, policies, objectives, and provisions for economic growth and vitality and a high quality of life.” WAC 365-196-435 provides further details about what should be included in economic development elements:
► A summary of the local economy such as population employment, payroll, sectors, businesses, sales and other information as appropriate
► A summary of the strengths and weaknesses of the local economy
► Identification of the policies and programs to foster local economic growth and development
2 RCW 36.70A.020(5)3 RCW 36.70A.070(7)
Item 3aRegional Staff Committee Packet pg 13

VISION 2050 Planning Resources | Economic Development Element Guide 3
VISION 2050VISION 2050’s multicounty planning policies address key economic issues like supporting local industries, workforce development, promoting equity and access to opportunity, improving the jobs-housing balance, and environmental sustainability. Ec-Action-5 calls for jurisdictions to update or create economic development elements as part of the 2024 local plan periodic update. PSRC’s Plan Review Manual and VISION 2050 Consistency Tool for Comprehensive Plans include an Economy section that provides a crosswalk between VISION 2050’s multicounty planning policies and policy objectives for local plans and policies. This guide also helps jurisdictions meet the policy objectives for consistency with VISION 2050 and implement Ec-Action-5.
Changes between VISION 2050 and VISION 2040 As many jurisdictions work to update existing economic development elements, it is important to note the changes from VISION 2040 to 2050. VISION 2050 The economic development element should address updated employment growth targets and include policies and strategies for a community to employ to plan for employment growth over time.
VISION 2050 carried forward many of the economic policies from VISION 2040; however, the following policy areas were expanded or added to VISION 2050 and should be reflected in updated or new economic development elements:
► Retention and recruitment of locally, women-, and minority-owned small businesses and start-ups and established and emerging industries, technologies, and services that promote environmental sustainability
► Strategies to expand access to opportunity
► Strategies to address and prevent commercial displacement
► Promotion of environmental and socially responsible business practices that address climate change and improve health outcomes
► Recognition of the contributions of the region’s culturally and ethnically diverse communities, institutions, and Native Tribes
VISION 2050 Economy GoalThe region has a prospering and sustainable regional economy by supporting businesses and job creation, investing in all people and their health, sustaining environmental quality, and creating great central places, diverse communities, and high quality of life.
Item 3aRegional Staff Committee Packet pg 14
VISION 2050 Planning Resources | Economic Development Element Guide 4
Regional Economic Strategy
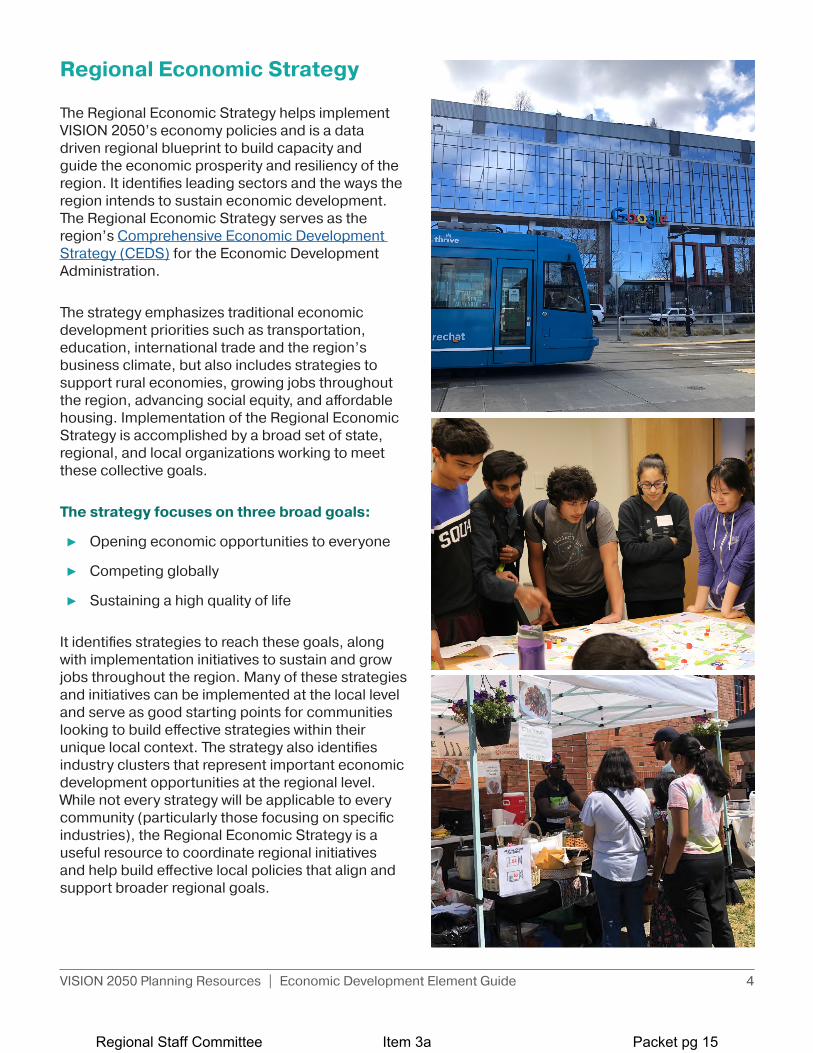
The Regional Economic Strategy helps implement VISION 2050’s economy policies and is a data driven regional blueprint to build capacity and guide the economic prosperity and resiliency of the region. It identifies leading sectors and the ways the region intends to sustain economic development. The Regional Economic Strategy serves as the region’s Comprehensive Economic Development Strategy (CEDS) for the Economic Development Administration.
The strategy emphasizes traditional economic development priorities such as transportation, education, international trade and the region’s business climate, but also includes strategies to support rural economies, growing jobs throughout the region, advancing social equity, and affordable housing. Implementation of the Regional Economic Strategy is accomplished by a broad set of state, regional, and local organizations working to meet these collective goals.
The strategy focuses on three broad goals:
► Opening economic opportunities to everyone
► Competing globally
► Sustaining a high quality of life
It identifies strategies to reach these goals, along with implementation initiatives to sustain and grow jobs throughout the region. Many of these strategies and initiatives can be implemented at the local level and serve as good starting points for communities looking to build effective strategies within their unique local context. The strategy also identifies industry clusters that represent important economic development opportunities at the regional level. While not every strategy will be applicable to every community (particularly those focusing on specific industries), the Regional Economic Strategy is a useful resource to coordinate regional initiatives and help build effective local policies that align and support broader regional goals.
Item 3aRegional Staff Committee Packet pg 15
VISION 2050 Planning Resources | Economic Development Element Guide 5
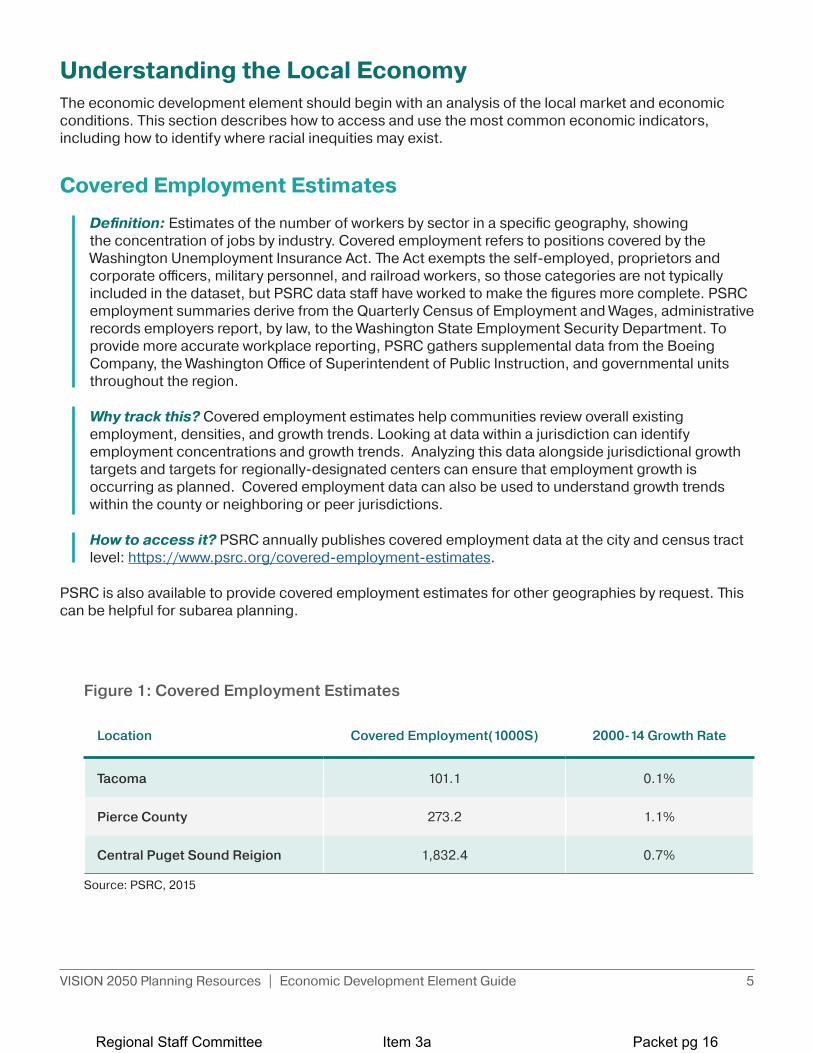
Understanding the Local EconomyThe economic development element should begin with an analysis of the local market and economic conditions. This section describes how to access and use the most common economic indicators, including how to identify where racial inequities may exist.
Covered Employment Estimates
Definition: Estimates of the number of workers by sector in a specific geography, showing the concentration of jobs by industry. Covered employment refers to positions covered by the Washington Unemployment Insurance Act. The Act exempts the self-employed, proprietors and corporate officers, military personnel, and railroad workers, so those categories are not typically included in the dataset, but PSRC data staff have worked to make the figures more complete. PSRC employment summaries derive from the Quarterly Census of Employment and Wages, administrative records employers report, by law, to the Washington State Employment Security Department. To provide more accurate workplace reporting, PSRC gathers supplemental data from the Boeing Company, the Washington Office of Superintendent of Public Instruction, and governmental units throughout the region.
Why track this? Covered employment estimates help communities review overall existing employment, densities, and growth trends. Looking at data within a jurisdiction can identify employment concentrations and growth trends. Analyzing this data alongside jurisdictional growth targets and targets for regionally-designated centers can ensure that employment growth is occurring as planned. Covered employment data can also be used to understand growth trends within the county or neighboring or peer jurisdictions.
How to access it? PSRC annually publishes covered employment data at the city and census tract level: https://www.psrc.org/covered-employment-estimates.
PSRC is also available to provide covered employment estimates for other geographies by request. This can be helpful for subarea planning.
Location Covered Employment(1000S) 2000-14 Growth Rate
Tacoma 101.1 0.1%
Pierce County 273.2 1.1%
Central Puget Sound Reigion 1,832.4 0.7%
Source: PSRC, 2015
Figure 1: Covered Employment Estimates
Item 3aRegional Staff Committee Packet pg 16

VISION 2050 Planning Resources | Economic Development Element Guide 6
Top Employers
Definition: The specific employers within a geographic area who employ the most people. This metric includes all employers in the public, private, and nonprofit sectors.
Why track this? An up-to-date list of key employers in a city or county can show which employment sectors contribute most to the workforce and can inform specific economic development efforts based on existing industry strengths.
How to access it? Employment figures can be collected from a jurisdiction’s business license records.
Employment Capacity
Definition: The number of jobs that a given area, such as a city, county, or subarea, can accommodate given existing infrastructure and availability of land.
Why track this? Understanding employment capacity is critical for economic growth and accommodating job growth targets. These growth targets are scaled for each community and play a critical role in effective economic development planning. If a gap exists between the job targets and capacity, identifying the gap helps identify planning needs to accommodate the growth target. These data can be useful sources of information on employment trends. In addition, the report captures vacant and potentially re-developable land capacity by differing types and locations. These data are important to better understanding how well each community is doing in accommodating future growth and future needs. Unlike growth targets, zoned development capacity is not time-bound, and jurisdictions should provide more than enough capacity to meet the target.
How to access it? Employment capacity is tracked through countywide Buildable Lands Reports required by the Growth Management Act.
Employer # of Employees Rank % of Total City Employement
Puyallup School District 3,118 1 13.9
Multicare/Good Samaritan Hospital 2,861 2 12.7
Fred Meyer Distribution Center 485 3 2.2
Comcast Cable 438 4 1.9
Costco Wholesale Stoew#660 347 5 1.5
WalMart #2403 332 6 1.5
CSK Automotive Distributors 307 7 1.4
Fred Meyer 296 8 1.3
City of Puyallup 294 9 1.3
Western Instititional review Board 218 10 1.0
Source: 2012, City Business Licenses
Figure 2: Top Employers in Puyallup
Item 3aRegional Staff Committee Packet pg 17

VISION 2050 Planning Resources | Economic Development Element Guide 7
Beyond Buildable Lands, cities and counties can also estimate employment capacity by considering additional jurisdiction or industry-specific job growth trends and assumptions.
Educational Attainment
Definition: The highest level of education an individual has completed, often split into specific age groups. A common metric is the percentage of individuals aged 25 and older with a college degree.
Why track this? Understanding the education levels of the local workforce helps coordinate career opportunities with adequate levels of education. This metric can help educational institutions better tailor programs to prepare the workforce for local industries.
Historically, educational attainment has varied across racial groups and this data can demonstrate educational gaps between white and BIPOC residents. Assessing this data across demographic groups to understand inequities in education can help inform policies to expand access to education and workforce development opportunities.
How to access it? The American Community Survey (ACS) and US Census provide this data. PSRC compiles ACS data for jurisdictions: https://www.psrc.org/american-community-survey-2015-2019-five-year-estimates
Sector Share Summary Growth Allocation: 2010-2036
UGA Commercial Industrial Total Percent
Bainbridge Island 1,984 823 2,808 6.1%
Bremerton 13,493 4,509 18,003 39%
Bremerton UGA 962 422 1,385 3%
Central Kitsap 1,030 171 1,200 2.6%
Kingston 437 163 600 1.3%
Port Orchard 2,571 560 3,132 6.8%
Port Orchard UGA 1,712 134 1,846 4%
Poulsbo 3,607 548 4,155 9%
Poulsbo UGA 44 2 46 0.1%
Silverdale 6,679 2,427 9,106 19,7%
Total Urban 32,521 9,760 42,281 91.6%
Rural 2,817 1,060 3,877 8.4%
Total Urban and Rural 35,338 10,820 46,158 100%
Source: Kitsap County and BERK and Associates
Figure 3: Sector Share and Growth Allocations
Item 3aRegional Staff Committee Packet pg 18
VISION 2050 Planning Resources | Economic Development Element Guide 8
Income and Poverty
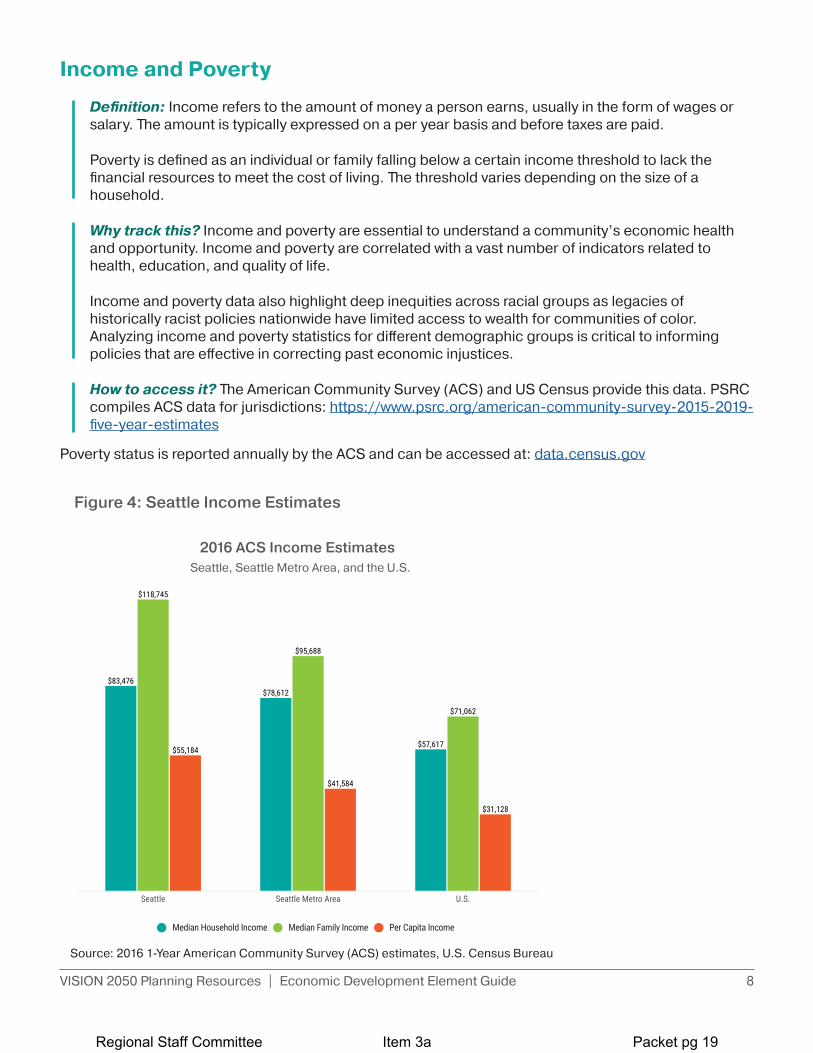
Definition: Income refers to the amount of money a person earns, usually in the form of wages or salary. The amount is typically expressed on a per year basis and before taxes are paid.
Poverty is defined as an individual or family falling below a certain income threshold to lack the financial resources to meet the cost of living. The threshold varies depending on the size of a household.
Why track this? Income and poverty are essential to understand a community’s economic health and opportunity. Income and poverty are correlated with a vast number of indicators related to health, education, and quality of life.
Income and poverty data also highlight deep inequities across racial groups as legacies of historically racist policies nationwide have limited access to wealth for communities of color. Analyzing income and poverty statistics for different demographic groups is critical to informing policies that are effective in correcting past economic injustices.
How to access it? The American Community Survey (ACS) and US Census provide this data. PSRC compiles ACS data for jurisdictions: https://www.psrc.org/american-community-survey-2015-2019-five-year-estimates
Poverty status is reported annually by the ACS and can be accessed at: data.census.gov
Seattle Seattle Metro Area U.S.
$83,476
$118,745
$55,184
$78,612
$95,688
$41,584
$57,617
$71,062
$31,128
Median Household Income Median Family Income Per Capita Income
Figure 4: Seattle Income Estimates
2016 ACS Income EstimatesSeattle, Seattle Metro Area, and the U.S.
Source: 2016 1-Year American Community Survey (ACS) estimates, U.S. Census Bureau
Item 3aRegional Staff Committee Packet pg 19
VISION 2050 Planning Resources | Economic Development Element Guide 9
Opportunity Mapping
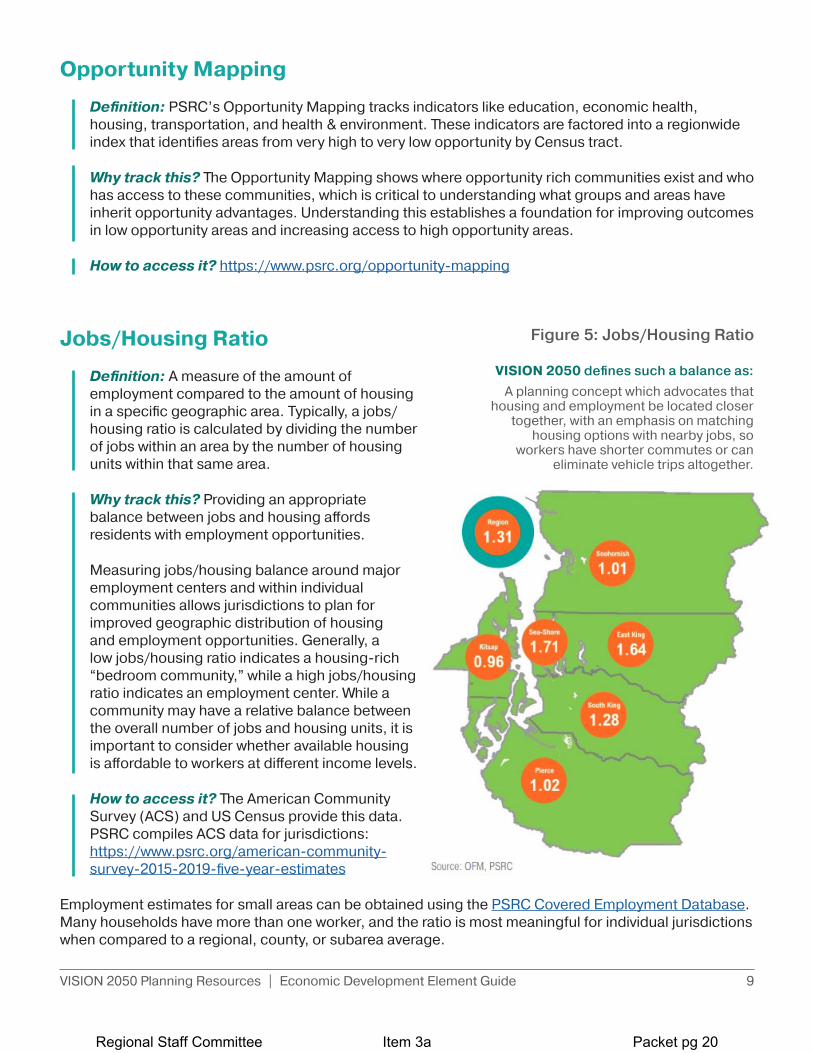
Definition: PSRC’s Opportunity Mapping tracks indicators like education, economic health, housing, transportation, and health & environment. These indicators are factored into a regionwide index that identifies areas from very high to very low opportunity by Census tract.
Why track this? The Opportunity Mapping shows where opportunity rich communities exist and who has access to these communities, which is critical to understanding what groups and areas have inherit opportunity advantages. Understanding this establishes a foundation for improving outcomes in low opportunity areas and increasing access to high opportunity areas.
How to access it? https://www.psrc.org/opportunity-mapping
Jobs/Housing Ratio
Definition: A measure of the amount of employment compared to the amount of housing in a specific geographic area. Typically, a jobs/housing ratio is calculated by dividing the number of jobs within an area by the number of housing units within that same area.
Why track this? Providing an appropriate balance between jobs and housing affords residents with employment opportunities.
Measuring jobs/housing balance around major employment centers and within individual communities allows jurisdictions to plan for improved geographic distribution of housing and employment opportunities. Generally, a low jobs/housing ratio indicates a housing-rich “bedroom community,” while a high jobs/housing ratio indicates an employment center. While a community may have a relative balance between the overall number of jobs and housing units, it is important to consider whether available housing is affordable to workers at different income levels.
How to access it? The American Community Survey (ACS) and US Census provide this data. PSRC compiles ACS data for jurisdictions: https://www.psrc.org/american-community-survey-2015-2019-five-year-estimates
Employment estimates for small areas can be obtained using the PSRC Covered Employment Database. Many households have more than one worker, and the ratio is most meaningful for individual jurisdictions when compared to a regional, county, or subarea average.
VISION 2050 defines such a balance as:A planning concept which advocates that
housing and employment be located closer together, with an emphasis on matching
housing options with nearby jobs, so workers have shorter commutes or can
eliminate vehicle trips altogether.
Figure 5: Jobs/Housing Ratio
Item 3aRegional Staff Committee Packet pg 20
VISION 2050 Planning Resources | Economic Development Element Guide 10
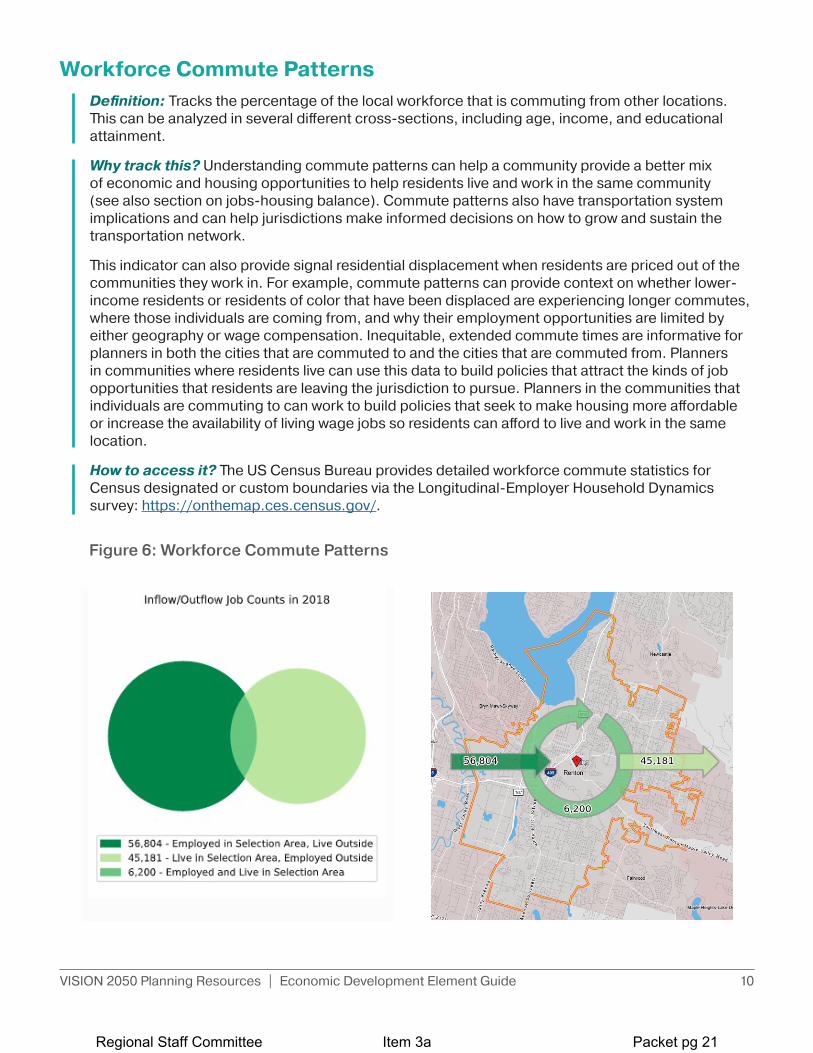
Workforce Commute PatternsDefinition: Tracks the percentage of the local workforce that is commuting from other locations. This can be analyzed in several different cross-sections, including age, income, and educational attainment.
Why track this? Understanding commute patterns can help a community provide a better mix of economic and housing opportunities to help residents live and work in the same community (see also section on jobs-housing balance). Commute patterns also have transportation system implications and can help jurisdictions make informed decisions on how to grow and sustain the transportation network.
This indicator can also provide signal residential displacement when residents are priced out of the communities they work in. For example, commute patterns can provide context on whether lower-income residents or residents of color that have been displaced are experiencing longer commutes, where those individuals are coming from, and why their employment opportunities are limited by either geography or wage compensation. Inequitable, extended commute times are informative for planners in both the cities that are commuted to and the cities that are commuted from. Planners in communities where residents live can use this data to build policies that attract the kinds of job opportunities that residents are leaving the jurisdiction to pursue. Planners in the communities that individuals are commuting to can work to build policies that seek to make housing more affordable or increase the availability of living wage jobs so residents can afford to live and work in the same location.
How to access it? The US Census Bureau provides detailed workforce commute statistics for Census designated or custom boundaries via the Longitudinal-Employer Household Dynamics survey: https://onthemap.ces.census.gov/.
Figure 6: Workforce Commute Patterns
Item 3aRegional Staff Committee Packet pg 21
VISION 2050 Planning Resources | Economic Development Element Guide 11
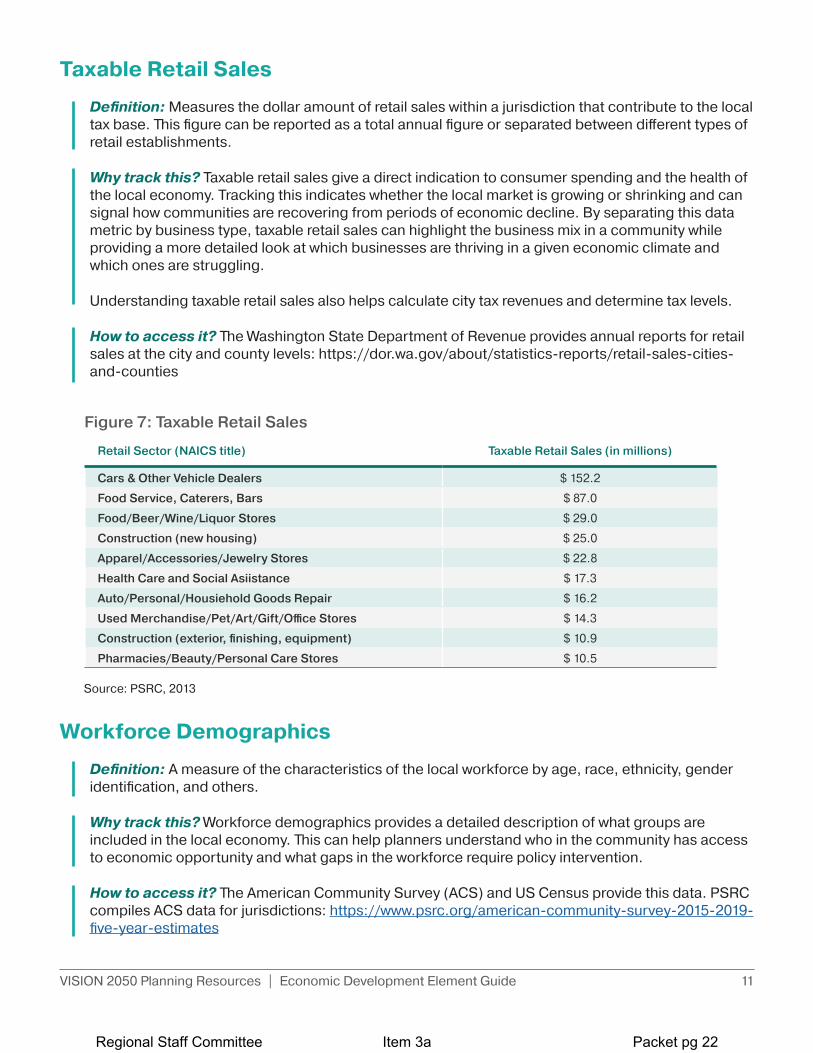
Taxable Retail Sales
Definition: Measures the dollar amount of retail sales within a jurisdiction that contribute to the local tax base. This figure can be reported as a total annual figure or separated between different types of retail establishments.
Why track this? Taxable retail sales give a direct indication to consumer spending and the health of the local economy. Tracking this indicates whether the local market is growing or shrinking and can signal how communities are recovering from periods of economic decline. By separating this data metric by business type, taxable retail sales can highlight the business mix in a community while providing a more detailed look at which businesses are thriving in a given economic climate and which ones are struggling.
Understanding taxable retail sales also helps calculate city tax revenues and determine tax levels.
How to access it? The Washington State Department of Revenue provides annual reports for retail sales at the city and county levels: https://dor.wa.gov/about/statistics-reports/retail-sales-cities-and-counties
Workforce Demographics
Definition: A measure of the characteristics of the local workforce by age, race, ethnicity, gender identification, and others.
Why track this? Workforce demographics provides a detailed description of what groups are included in the local economy. This can help planners understand who in the community has access to economic opportunity and what gaps in the workforce require policy intervention.
How to access it? The American Community Survey (ACS) and US Census provide this data. PSRC compiles ACS data for jurisdictions: https://www.psrc.org/american-community-survey-2015-2019-five-year-estimates
Retail Sector (NAICS title) Taxable Retail Sales (in millions)
Cars & Other Vehicle Dealers $ 152.2
Food Service, Caterers, Bars $ 87.0
Food/Beer/Wine/Liquor Stores $ 29.0
Construction (new housing) $ 25.0
Apparel/Accessories/Jewelry Stores $ 22.8
Health Care and Social Asiistance $ 17.3
Auto/Personal/Housiehold Goods Repair $ 16.2
Used Merchandise/Pet/Art/Gift/Office Stores $ 14.3
Construction (exterior, finishing, equipment) $ 10.9
Pharmacies/Beauty/Personal Care Stores $ 10.5
Source: PSRC, 2013
Figure 7: Taxable Retail Sales
Item 3aRegional Staff Committee Packet pg 22
VISION 2050 Planning Resources | Economic Development Element Guide 12
Commercial Affordability
Definition: Measures the cost of leasing commercial space for business owners, most commonly reported in average price per square foot.
Why track this? Commercial affordability indicates trends in real estate prices to determine if specific areas are becoming unaffordable for small businesses. For businesses that do not own their properties, rent costs are significant expenses that can become unpredictable in fluctuating markets, making it a challenge for small business owners to forecast their long-term expenses and prepare for upswings in commercial rent asking prices. A lack of affordable commercial space is one of the key drivers of small business closure and/or displacement.
How to access it? The most popular and granular source of data for the commercial rent market is CoStar, a private data and analytics firm that specializes in commercial real estate. CoStar data requires a paid subscription.
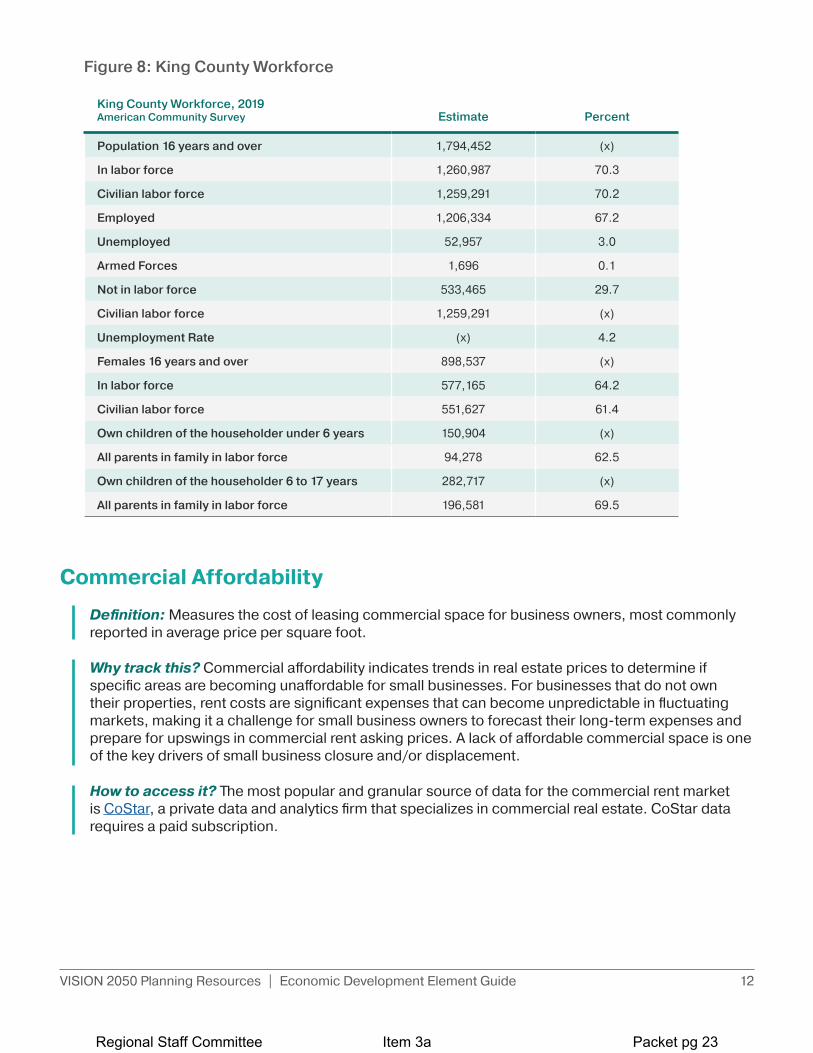
King County Workforce, 2019American Community Survey Estimate Percent
Population 16 years and over 1,794,452 (x)
In labor force 1,260,987 70.3
Civilian labor force 1,259,291 70.2
Employed 1,206,334 67.2
Unemployed 52,957 3.0
Armed Forces 1,696 0.1
Not in labor force 533,465 29.7
Civilian labor force 1,259,291 (x)
Unemployment Rate (x) 4.2
Females 16 years and over 898,537 (x)
In labor force 577,165 64.2
Civilian labor force 551,627 61.4
Own children of the householder under 6 years 150,904 (x)
All parents in family in labor force 94,278 62.5
Own children of the householder 6 to 17 years 282,717 (x)
All parents in family in labor force 196,581 69.5
Figure 8: King County Workforce
Item 3aRegional Staff Committee Packet pg 23
VISION 2050 Planning Resources | Economic Development Element Guide 13
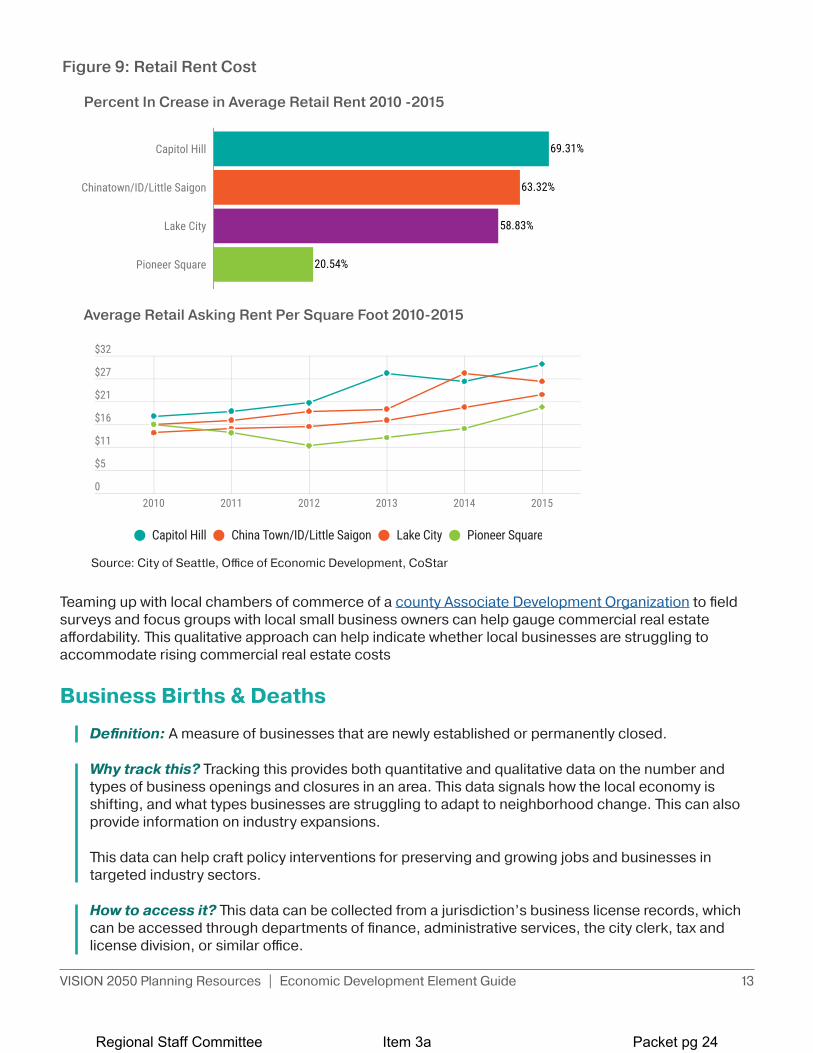
Teaming up with local chambers of commerce of a county Associate Development Organization to field surveys and focus groups with local small business owners can help gauge commercial real estate affordability. This qualitative approach can help indicate whether local businesses are struggling to accommodate rising commercial real estate costs
Business Births & Deaths
Definition: A measure of businesses that are newly established or permanently closed.
Why track this? Tracking this provides both quantitative and qualitative data on the number and types of business openings and closures in an area. This data signals how the local economy is shifting, and what types businesses are struggling to adapt to neighborhood change. This can also provide information on industry expansions.
This data can help craft policy interventions for preserving and growing jobs and businesses in targeted industry sectors.
How to access it? This data can be collected from a jurisdiction’s business license records, which can be accessed through departments of finance, administrative services, the city clerk, tax and license division, or similar office.
Capitol Hill
Chinatown/ID/Little Saigon
Lake City
Pioneer Square
69.31%
63.32%
58.83%
20.54%
0
$5
$11
$16
$21
$27
$32
2010 2011 2012 2013 2014 2015
Capitol Hill China Town/ID/Little Saigon Lake City Pioneer Square
Figure 9: Retail Rent Cost
Percent In Crease in Average Retail Rent 2010 -2015
Average Retail Asking Rent Per Square Foot 2010-2015
Source: City of Seattle, Office of Economic Development, CoStar
Item 3aRegional Staff Committee Packet pg 24

VISION 2050 Planning Resources | Economic Development Element Guide 14
Building the Economic Development ElementOnce a community understands their local economy, the jurisdiction should work with community members and other stakeholders to identify a vision, goals, and policies for the economic development element. To do this, planners can further assess the local context with a SWOT analysis.
In addition to data included in the Economic Development element, the SWOT analysis can consider data, conditions, and goals from other plan elements on housing, transportation, arts and culture, recreation, and other community assets or areas of concern. These can help build a fuller picture of opportunities to support the community and grow the local economy.
SWOT Analysis
A SWOT Analysis assesses:
► Strengths: competitive advantages a municipality holds. Examples: existing employment centers, workforce characteristics, higher education institutions, place-based assets, and transportation infrastructure.
► Weaknesses: disadvantages in the local economic climate. Examples: workforce inequities, environmental issues, lack of infrastructure, place-based disadvantages, and challenging regulatory frameworks.
► Opportunities: chances for improvement or progress. Examples: growing industries, public investment, and expanding education centers.
► Threats: potential occasions of negative impact. Examples: changing industries, broader economic downturns, and loss of major employers.
The SWOT analysis expands on data collection efforts and provides a foundation for setting goals and structuring policies. Strengths and opportunities identified during the SWOT analysis provide an opportunity for policies to sustain and expand success. Weaknesses and threats signal where policy intervention may be required to ensure economic goals are achieved. The findings from the SWOT analysis should serve as the general structure upon which to build out strategies to improve the local economy.
VISION 2050 supports the value of different types of places in the region and appropriately scaled economic development. For example, the types of job growth opportunities will vary for communities that provide services a larger rural area, have a regional shopping center, are planning new transit investments, or support resource economies like agriculture or forestry. In analyzing opportunities, cities and counties should consider how strategies can help them achieve their adopted growth targets. This analysis may consider other communities in the region with similar economic and demographic profiles or case studies from outside the region.
Item 3aRegional Staff Committee Packet pg 25

VISION 2050 Planning Resources | Economic Development Element Guide 15
Public Participation Working with the public to complete a SWOT analysis and co-create new or updated economic policies will strengthen a jurisdiction’s comprehensive plan. Effective engagement from a wide-range of stakeholders ensures elements reflect the full scope of issues, perspectives, and opportunities in planning.
Key stakeholders to engage in economic development planning may include:
► Industry representatives and associations
► Port districts
► Labor and workforce representatives
► Educational institutions
► Nonprofits and community-based organizations
► Small business owners
► Chambers of commerce and countywide Associate Development Organizations
► Residents and local workers
Stakeholder outreach can take many forms, depending on the information requested. Stakeholder interviews, focus groups, and surveys of local business owners and employees are effective ways to understand issues and help shape policies. When preparing materials and attending meetings of community groups, planners should consider audience needs. Translating materials into different languages and hiring translator services can ensure non-English speaking residents and business owners are included in the process. Working with community-based organizations, chambers of commerce, and other local leaders is a critical first step in meeting community members where they are, especially those in harder to reach non-English speaking communities. It is especially important to engage stakeholders from underserved communities and people of color to address racial disparities and help prevent displacement of people and businesses.
Effective Community Outreach: Arlington-Marysville Subarea Plan
In December of 2018, the cities of Arlington and Marysville completed a subarea plan for the Arlington-Marysville Manufacturing/Industrial Center (AMMIC) subarea. The plan created a vision for the center and established goals and policies to guide public and private investments. Overarching themes of the plan are to support business retention and growth, strengthen existing assets, expand transportation choice, and improve environmental conditions.
The AMMIC recognized the importance of public participation to creating an effective plan and had several opportunities for equitable public outreach. By providing a variety of opportunities for the public to provide feedback across several different platforms, planners made it easy and convenient for the public to be engaged in the planning process.
Outreach strategies included:
► Project Website with information on status updates, meeting information, and published documents.
► Stakeholder Interviews with eight key individuals and property or business owners.
► Online Community Survey to gather input from individuals who could not attend public meetings.
► Vision Public Workshop to kick off the project and gather input on a vision for the AMMIC.
► Advisory Committee Meetings to review technical information and refine components of the plan.
► Draft Plan Public Workshop to gain input on the full draft plan.
The final plan for the AMMIC subarea was adopted by both cities in January 2019. The AMMIC plan can be found at: https://www.marysvillewa.gov/DocumentCenter/View/5587/AMMIC-SAP-Marysville-with-ECR-2018-1227-2
Item 3aRegional Staff Committee Packet pg 26

VISION 2050 Planning Resources | Economic Development Element Guide 16
Creating goals, policies, and strategies for economic developmentThe Growth Management Act, VISION 2050, and countywide planning policies set forth regional goals for equitable economic prosperity. The SWOT analysis may uncover additional local priorities and opportunities for economic development. These documents provide a basis for establishing economic development element goals, policies, and strategies.
The state-required updates to local comprehensive plans due in 2024 represent the fourth round of GMA comprehensive plans. For those jurisdictions that have already adopted Economic Development elements, the update represents an opportunity to review the effectiveness of existing policies and tools to achieve community goals. Data indicators and analysis should help jurisdictions evaluate the success of current goals, policies, and implementation tools. Data showing successful outcomes can support retention and expansion of existing policies and programs. Data showing weak performance suggest the need to revise or replace existing tools in a jurisdiction. Jurisdictions with existing elements should take the opportunity to evaluate outcomes, factors, and potential implications of existing goals and policies.
Effective goals and policies should be specific, realistic, responsive to key issues and opportunities identified in the planning process and align with regional and countywide efforts. The goal-setting process should identify a long-term vision for economic growth. Policies and strategies should be more specific and could reference implementation actions, critical industries, partners, and specific subareas within a jurisdiction.
VISION 2050 Policy Objectives This section outlines VISION 2050’s policy objectives for local plans4, why it is important for local plans to address these policy areas, and how a jurisdiction should use data and SWOT analysis findings to customize economy policies and strategies that further regional and local economic development goals.
Identify and enhance industry clusters, including those recognized in the Regional Economic Strategy that provide goods and services for export
The Regional Economic Strategy identifies key industry that focus on exporting goods and services to other regions and consist of companies, suppliers, service providers, institutions, government agencies, and other related industry stakeholders that share common markets, technological developments, and workforces. Regional and local planning should continue to support these established industry clusters to sustain a strong economy and diversified workforce. Cities should also review any county-specific economic development plans to understand additional local clusters to consider in their local work.
Regional Industry Clusters
► Aerospace
► Information & Communication Technology
► Maritime
► Military & Defense
► Life Sciences & Global Health
► Tourism
► Transportation & Logistics
► Business Services
► MPP-EC-3
► MPP-EC-4
► MPP-EC-5
► MPP-EC-6
► MPP-EC-21
► MPP-EC-22
Regional Context. This objective contributes to the following Multicounty Planning Policies established in VISION 2050:
4 The policy objectives are consistent with PSRC’s Plan Review Manual and VISION 2050 Consistency Tool for Comprehensive Plans. Underlined font indicates an objective that is new to the VISION 2050 update.
Item 3aRegional Staff Committee Packet pg 27
VISION 2050 Planning Resources | Economic Development Element Guide 17
Data metrics for understanding the industry clusters at the local level
► Covered Employment Estimates
► Top Employers
Developing local policies and programs
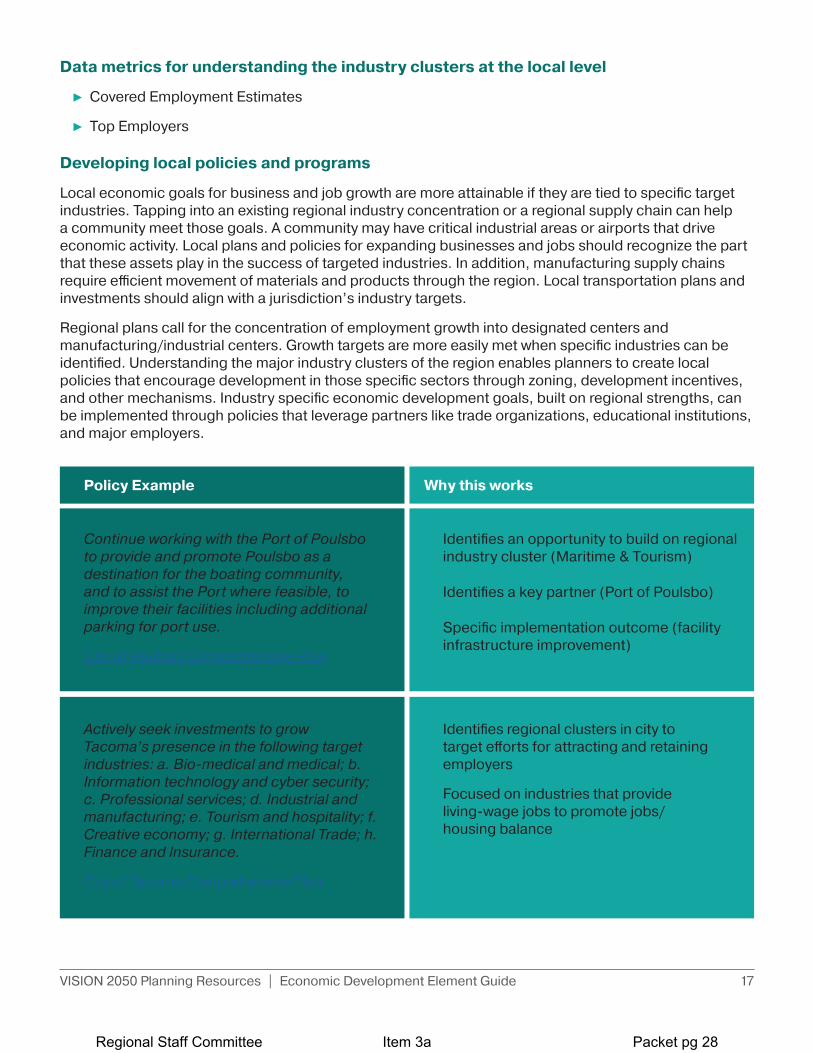
Local economic goals for business and job growth are more attainable if they are tied to specific target industries. Tapping into an existing regional industry concentration or a regional supply chain can help a community meet those goals. A community may have critical industrial areas or airports that drive economic activity. Local plans and policies for expanding businesses and jobs should recognize the part that these assets play in the success of targeted industries. In addition, manufacturing supply chains require efficient movement of materials and products through the region. Local transportation plans and investments should align with a jurisdiction’s industry targets.
Regional plans call for the concentration of employment growth into designated centers and manufacturing/industrial centers. Growth targets are more easily met when specific industries can be identified. Understanding the major industry clusters of the region enables planners to create local policies that encourage development in those specific sectors through zoning, development incentives, and other mechanisms. Industry specific economic development goals, built on regional strengths, can be implemented through policies that leverage partners like trade organizations, educational institutions, and major employers.
Actively seek investments to grow Tacoma’s presence in the following target industries: a. Bio-medical and medical; b. Information technology and cyber security; c. Professional services; d. Industrial and manufacturing; e. Tourism and hospitality; f. Creative economy; g. International Trade; h. Finance and Insurance.
City of Tacoma Comprehensive Plan
► Identifies regional clusters in city to target efforts for attracting and retaining employers
► Focused on industries that provide living-wage jobs to promote jobs/housing balance
Why this works
Continue working with the Port of Poulsbo to provide and promote Poulsbo as a destination for the boating community, and to assist the Port where feasible, to improve their facilities including additional parking for port use.
City of Poulsbo Comprehensive Plan
► Identifies an opportunity to build on regional industry cluster (Maritime & Tourism)
► Identifies a key partner (Port of Poulsbo)
► Specific implementation outcome (facility infrastructure improvement)
Policy Example
Item 3aRegional Staff Committee Packet pg 28
VISION 2050 Planning Resources | Economic Development Element Guide 18
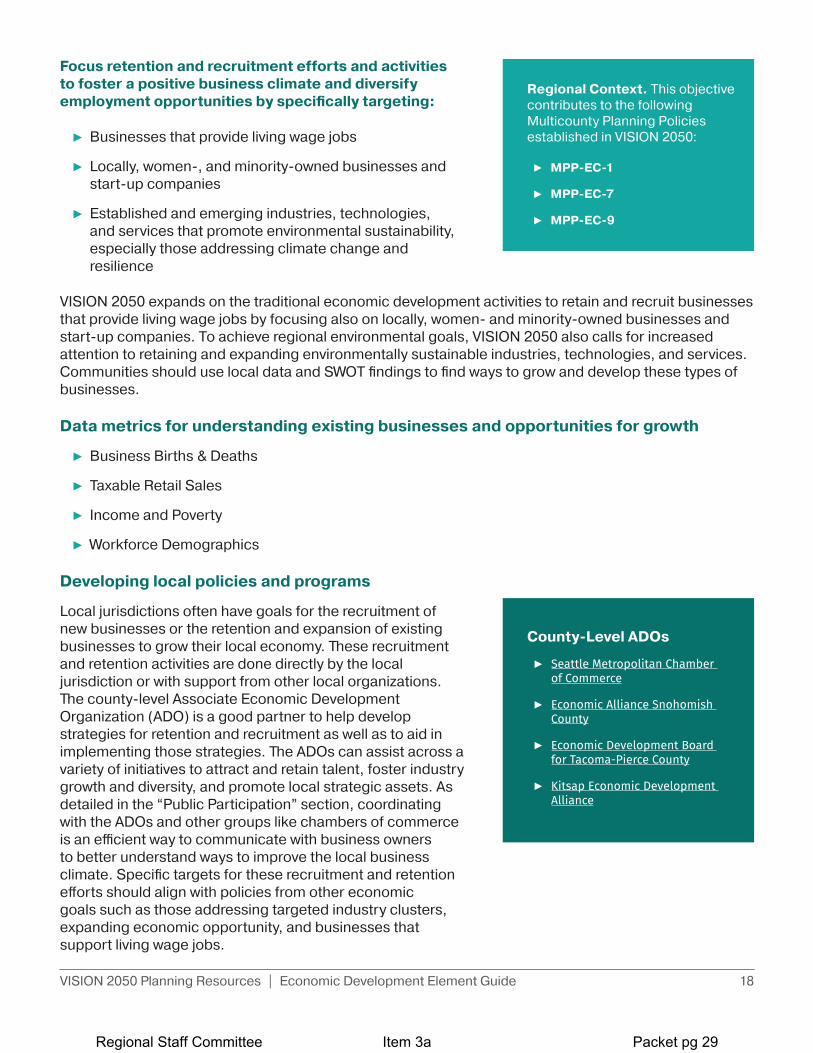
Focus retention and recruitment efforts and activities to foster a positive business climate and diversify employment opportunities by specifically targeting:
► Businesses that provide living wage jobs
► Locally, women-, and minority-owned businesses and start-up companies
► Established and emerging industries, technologies, and services that promote environmental sustainability, especially those addressing climate change and resilience
VISION 2050 expands on the traditional economic development activities to retain and recruit businesses that provide living wage jobs by focusing also on locally, women- and minority-owned businesses and start-up companies. To achieve regional environmental goals, VISION 2050 also calls for increased attention to retaining and expanding environmentally sustainable industries, technologies, and services. Communities should use local data and SWOT findings to find ways to grow and develop these types of businesses.
Data metrics for understanding existing businesses and opportunities for growth
► Business Births & Deaths
► Taxable Retail Sales
► Income and Poverty
► Workforce Demographics
Developing local policies and programs
Local jurisdictions often have goals for the recruitment of new businesses or the retention and expansion of existing businesses to grow their local economy. These recruitment and retention activities are done directly by the local jurisdiction or with support from other local organizations. The county-level Associate Economic Development Organization (ADO) is a good partner to help develop strategies for retention and recruitment as well as to aid in implementing those strategies. The ADOs can assist across a variety of initiatives to attract and retain talent, foster industry growth and diversity, and promote local strategic assets. As detailed in the “Public Participation” section, coordinating with the ADOs and other groups like chambers of commerce is an efficient way to communicate with business owners to better understand ways to improve the local business climate. Specific targets for these recruitment and retention efforts should align with policies from other economic goals such as those addressing targeted industry clusters, expanding economic opportunity, and businesses that support living wage jobs.
► MPP-EC-1
► MPP-EC-7
► MPP-EC-9
Regional Context. This objective contributes to the following Multicounty Planning Policies established in VISION 2050:
County-Level ADOs
► Seattle Metropolitan Chamber of Commerce
► Economic Alliance Snohomish County
► Economic Development Board for Tacoma-Pierce County
► Kitsap Economic Development Alliance
Item 3aRegional Staff Committee Packet pg 29
VISION 2050 Planning Resources | Economic Development Element Guide 19
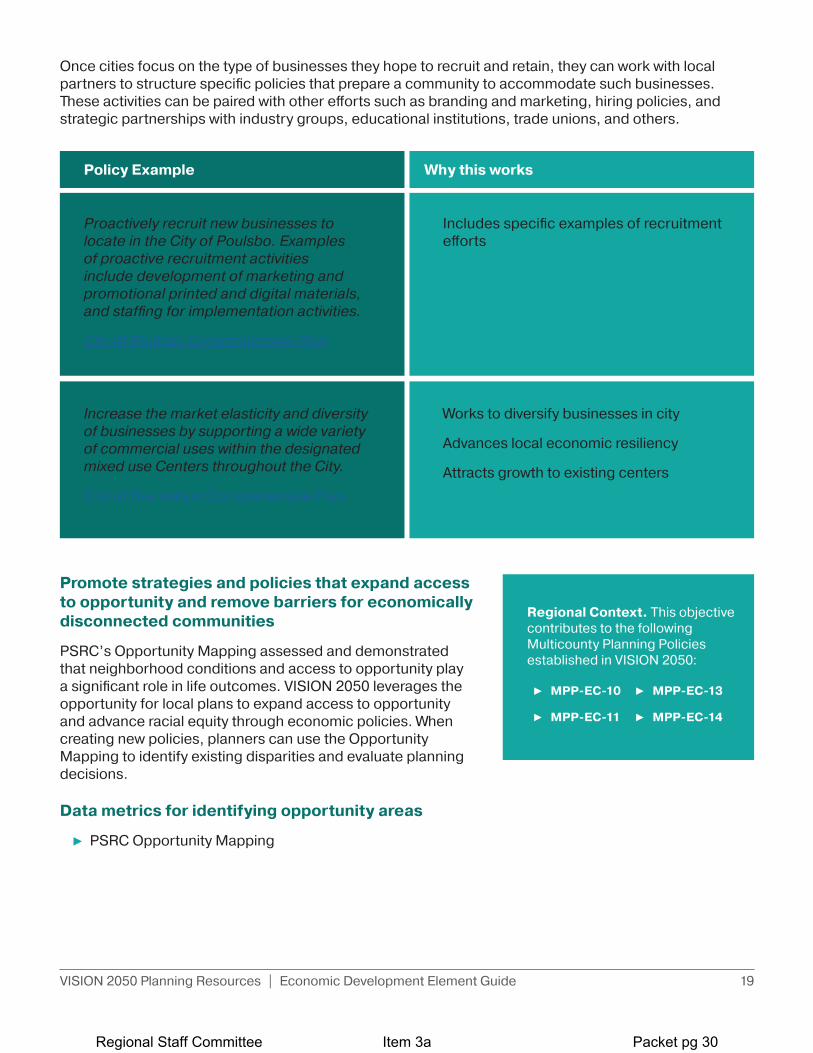
Once cities focus on the type of businesses they hope to recruit and retain, they can work with local partners to structure specific policies that prepare a community to accommodate such businesses. These activities can be paired with other efforts such as branding and marketing, hiring policies, and strategic partnerships with industry groups, educational institutions, trade unions, and others.
Promote strategies and policies that expand access to opportunity and remove barriers for economically disconnected communities
PSRC’s Opportunity Mapping assessed and demonstrated that neighborhood conditions and access to opportunity play a significant role in life outcomes. VISION 2050 leverages the opportunity for local plans to expand access to opportunity and advance racial equity through economic policies. When creating new policies, planners can use the Opportunity Mapping to identify existing disparities and evaluate planning decisions.
Data metrics for identifying opportunity areas
► PSRC Opportunity Mapping
Increase the market elasticity and diversity of businesses by supporting a wide variety of commercial uses within the designated mixed use Centers throughout the City.
City of Bremerton Comprehensive Plan
► Works to diversify businesses in city
► Advances local economic resiliency
► Attracts growth to existing centers
Why this works
Proactively recruit new businesses to locate in the City of Poulsbo. Examples of proactive recruitment activities include development of marketing and promotional printed and digital materials, and staffing for implementation activities.
City of Poulsbo Comprehensive Plan
► Includes specific examples of recruitment efforts
Policy Example
► MPP-EC-10
► MPP-EC-11
► MPP-EC-13
► MPP-EC-14
Regional Context. This objective contributes to the following Multicounty Planning Policies established in VISION 2050:
Item 3aRegional Staff Committee Packet pg 30
VISION 2050 Planning Resources | Economic Development Element Guide 20
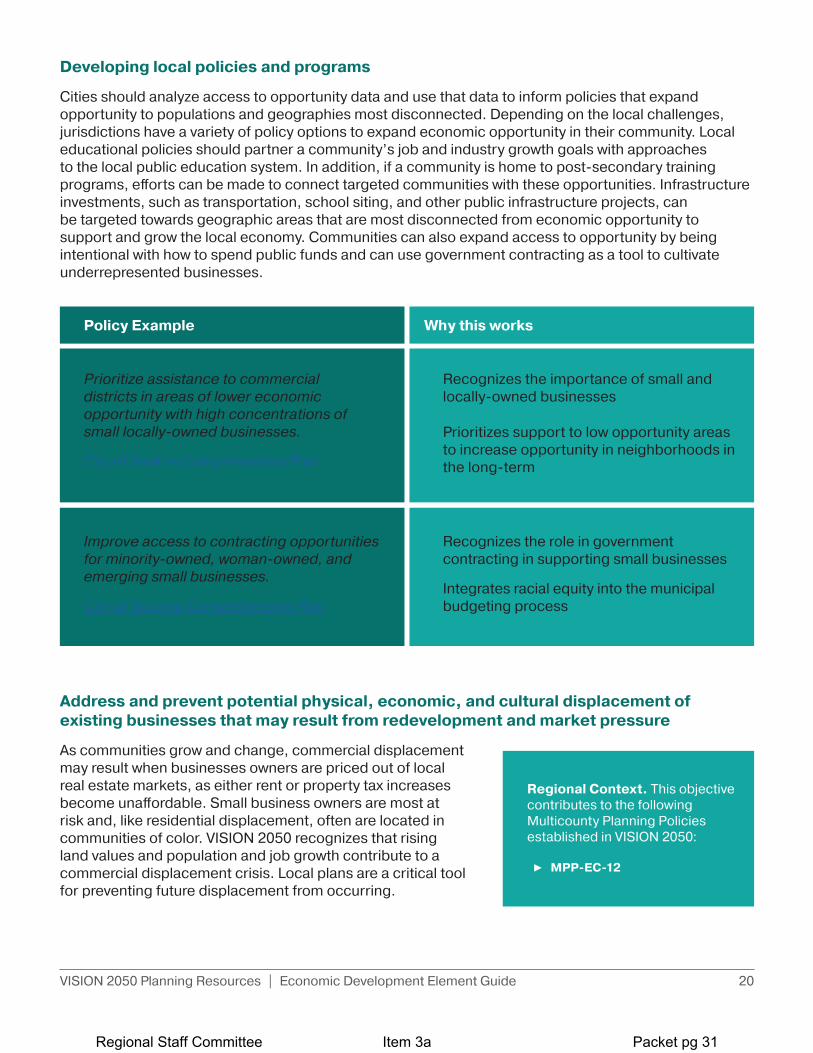
Developing local policies and programs
Cities should analyze access to opportunity data and use that data to inform policies that expand opportunity to populations and geographies most disconnected. Depending on the local challenges, jurisdictions have a variety of policy options to expand economic opportunity in their community. Local educational policies should partner a community’s job and industry growth goals with approaches to the local public education system. In addition, if a community is home to post-secondary training programs, efforts can be made to connect targeted communities with these opportunities. Infrastructure investments, such as transportation, school siting, and other public infrastructure projects, can be targeted towards geographic areas that are most disconnected from economic opportunity to support and grow the local economy. Communities can also expand access to opportunity by being intentional with how to spend public funds and can use government contracting as a tool to cultivate underrepresented businesses.
Address and prevent potential physical, economic, and cultural displacement of existing businesses that may result from redevelopment and market pressure
As communities grow and change, commercial displacement may result when businesses owners are priced out of local real estate markets, as either rent or property tax increases become unaffordable. Small business owners are most at risk and, like residential displacement, often are located in communities of color. VISION 2050 recognizes that rising land values and population and job growth contribute to a commercial displacement crisis. Local plans are a critical tool for preventing future displacement from occurring.
Improve access to contracting opportunities for minority-owned, woman-owned, and emerging small businesses.
City of Tacoma Comprehensive Plan
► Recognizes the role in government contracting in supporting small businesses
► Integrates racial equity into the municipal budgeting process
Why this works
Prioritize assistance to commercial districts in areas of lower economic opportunity with high concentrations of small locally-owned businesses.
City of Seattle Comprehensive Plan
► Recognizes the importance of small and locally-owned businesses
► Prioritizes support to low opportunity areas to increase opportunity in neighborhoods in the long-term
Policy Example
► MPP-EC-12
Regional Context. This objective contributes to the following Multicounty Planning Policies established in VISION 2050:
Item 3aRegional Staff Committee Packet pg 31

VISION 2050 Planning Resources | Economic Development Element Guide 21
Data metrics for determining commercial displacement risk and activity
► Commercial Affordability
► Business Births & Deaths
► Surveys & Focus Groups with existing and former business owners and residents
Developing local policies and programs
Local jurisdictions should conduct outreach to their local businesses to understand the risks of displacement and build policies and programs tailored to their business districts. A community’s particular challenges can be addressed through tools such as zoning, technical assistance, and funding. Through zoning codes, planners can create size-restricted districts that preserve commercial space for ground floor commercial tenants and discourage larger commercial chains from pushing out smaller businesses. Jurisdictions can also subsidize expenses such as streetscape and façade improvements through loans and matching grant programs, as well as provide relocation assistance to businesses looking to reestablish themselves in more affordable locations. Such policies and initiatives should be paired with outreach and technical assistance efforts from city staff. Examples include trainings for starts ups and entrepreneurs on sustainable business practices and assistance navigating city services and other tools related to preventing commercial displacement.
Seek new tools to support the creation of spaces attractive and affordable to businesses threatened with displacement so that small locally-owned businesses are able to remain in their neighborhoods.
City of Renton Comprehensive Plan
► Recognizes the need for new and innovative tools to support small businesses
► Targeted specifically at at-risk businesses
Why this works
Promote the local use of special small business financing and management assistance programs. Help identify facilities which may be used for small business start-ups, including older structures which may be suitably reused for business purposes.
City of Gig Harbor Comprehensive Plan
► Specific actions to alleviate financial burdens for small businesses
► Specific programs that can be tracked over time to monitor business activity and outcomes
Policy Example
Item 3aRegional Staff Committee Packet pg 32
VISION 2050 Planning Resources | Economic Development Element Guide 22
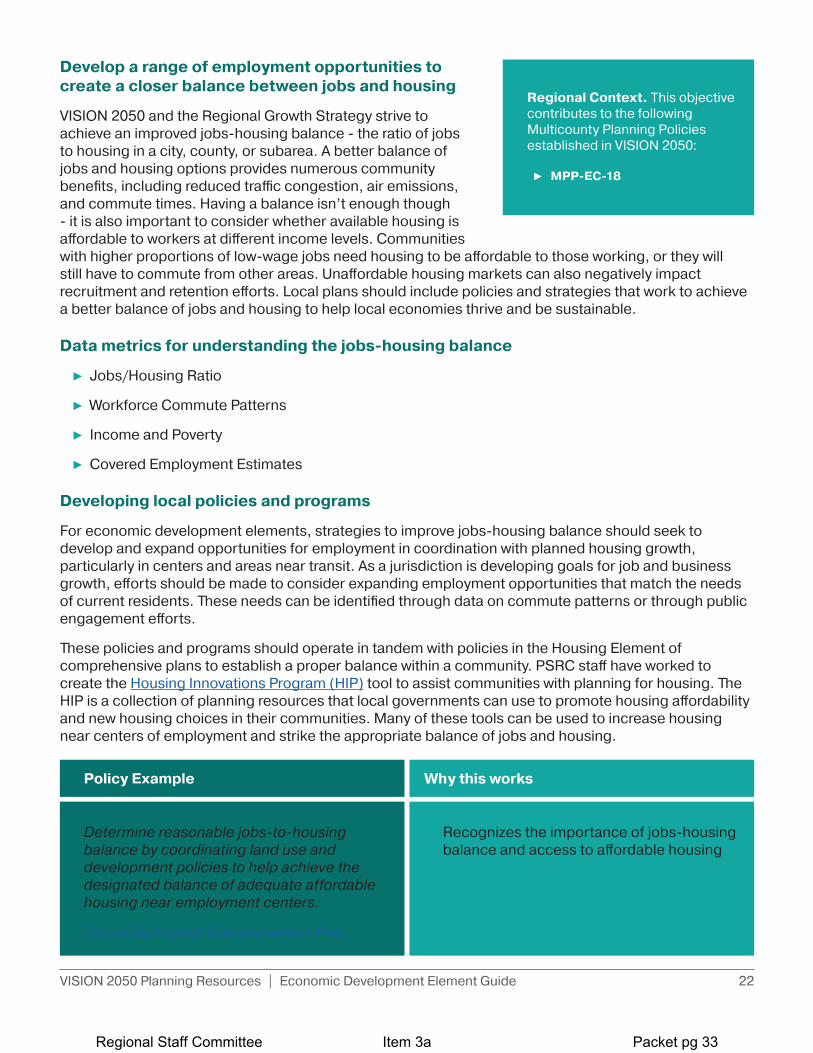
Develop a range of employment opportunities to create a closer balance between jobs and housing
VISION 2050 and the Regional Growth Strategy strive to achieve an improved jobs-housing balance - the ratio of jobs to housing in a city, county, or subarea. A better balance of jobs and housing options provides numerous community benefits, including reduced traffic congestion, air emissions, and commute times. Having a balance isn’t enough though - it is also important to consider whether available housing is affordable to workers at different income levels. Communities with higher proportions of low-wage jobs need housing to be affordable to those working, or they will still have to commute from other areas. Unaffordable housing markets can also negatively impact recruitment and retention efforts. Local plans should include policies and strategies that work to achieve a better balance of jobs and housing to help local economies thrive and be sustainable.
Data metrics for understanding the jobs-housing balance
► Jobs/Housing Ratio
► Workforce Commute Patterns
► Income and Poverty
► Covered Employment Estimates
Developing local policies and programs
For economic development elements, strategies to improve jobs-housing balance should seek to develop and expand opportunities for employment in coordination with planned housing growth, particularly in centers and areas near transit. As a jurisdiction is developing goals for job and business growth, efforts should be made to consider expanding employment opportunities that match the needs of current residents. These needs can be identified through data on commute patterns or through public engagement efforts.
These policies and programs should operate in tandem with policies in the Housing Element of comprehensive plans to establish a proper balance within a community. PSRC staff have worked to create the Housing Innovations Program (HIP) tool to assist communities with planning for housing. The HIP is a collection of planning resources that local governments can use to promote housing affordability and new housing choices in their communities. Many of these tools can be used to increase housing near centers of employment and strike the appropriate balance of jobs and housing.
► MPP-EC-18
Regional Context. This objective contributes to the following Multicounty Planning Policies established in VISION 2050:
Why this works
Determine reasonable jobs-to-housing balance by coordinating land use and development policies to help achieve the designated balance of adequate affordable housing near employment centers.
City of Gig Harbor Comprehensive Plan
► Recognizes the importance of jobs-housing balance and access to affordable housing
Policy Example
Item 3aRegional Staff Committee Packet pg 33

VISION 2050 Planning Resources | Economic Development Element Guide 23
Promote environmental and socially responsible business practices, especially those addressing climate change, resilience, and improved health outcomes
VISION 2050 and the Regional Economic Strategy both acknowledge that the region’s natural environment is a unique asset to attract talent and strengthen the economy, and it provides the foundation to the region’s quality of life and economic prosperity. VISION 2050 also recognizes the impacts of climate change on the economy. Promoting a healthy, resilient environment and communities, through curtailing greenhouse gas emissions and enhancing the area’s natural resources, is key to continued economic success. Local plans should include economic policies that advance environmental goals and protect current and future businesses from climate change impacts.
Data metrics for assessing environmental and socially responsible business practices
► Business Births (tracking specific industries)
► Opportunity Index
Developing local policies and programs
Cities play an important role in protecting and improving the health of the region’s environment and residents. Economic development planning should prioritize environmental and social responsibility in all efforts and seek opportunities to build sustainability into the local economy. This work can be done in tandem with broader efforts for business recruitment and retention. Planners should prioritize businesses that promote environmental and social responsibility when working with partners to attract new businesses and industries to communities and encourage workforce development efforts that prepare employees for careers in these fields. The state and region are working to support the development of established and emerging industries focused on resilience and climate change, which could provide opportunities for local economic growth.
► MPP-EC-8
► MPP-EC-16
► MPP-EC-23
Regional Context. This objective contributes to the following Multicounty Planning Policies established in VISION 2050:
Encourage growth that balances employment and housing opportunities within designated urban centers by promoting investment in mixed-use centers with compact urban development, specifically advocating for redevelopment and quality infill design that maximizes allowable density.
City of Renton Comprehensive Plan
► Promotes jobs-housing balance in urban centers
► Identifies specific strategies for improving balance (mixed-use, compact infill development)
► Recognizes importance of being near transit
Item 3aRegional Staff Committee Packet pg 34
VISION 2050 Planning Resources | Economic Development Element Guide 24
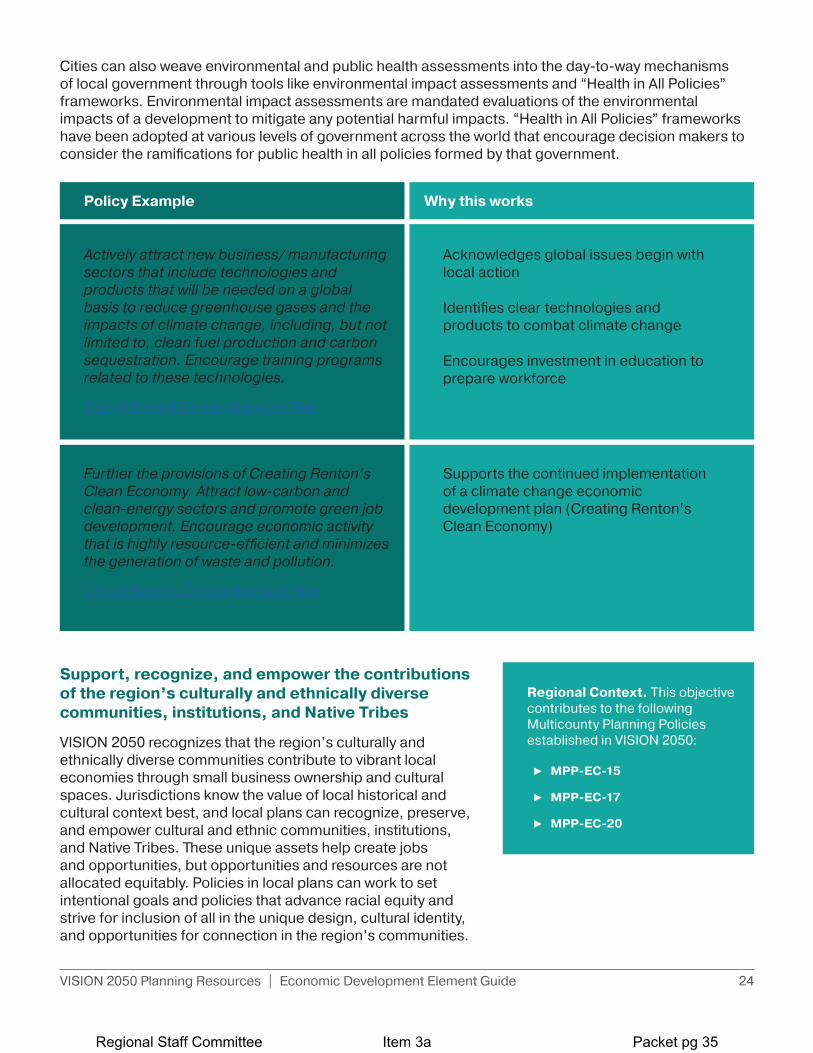
Cities can also weave environmental and public health assessments into the day-to-way mechanisms of local government through tools like environmental impact assessments and “Health in All Policies” frameworks. Environmental impact assessments are mandated evaluations of the environmental impacts of a development to mitigate any potential harmful impacts. “Health in All Policies” frameworks have been adopted at various levels of government across the world that encourage decision makers to consider the ramifications for public health in all policies formed by that government.
Further the provisions of Creating Renton’s Clean Economy. Attract low-carbon and clean-energy sectors and promote green job development. Encourage economic activity that is highly resource-efficient and minimizes the generation of waste and pollution.
City of Renton Comprehensive Plan
► Supports the continued implementation of a climate change economic development plan (Creating Renton’s Clean Economy)
Why this works
Actively attract new business/ manufacturing sectors that include technologies and products that will be needed on a global basis to reduce greenhouse gases and the impacts of climate change, including, but not limited to, clean fuel production and carbon sequestration. Encourage training programs related to these technologies.
City of Everett Comprehensive Plan
► Acknowledges global issues begin with local action
► Identifies clear technologies and products to combat climate change
► Encourages investment in education to prepare workforce
Policy Example
Support, recognize, and empower the contributions of the region’s culturally and ethnically diverse communities, institutions, and Native Tribes
VISION 2050 recognizes that the region’s culturally and ethnically diverse communities contribute to vibrant local economies through small business ownership and cultural spaces. Jurisdictions know the value of local historical and cultural context best, and local plans can recognize, preserve, and empower cultural and ethnic communities, institutions, and Native Tribes. These unique assets help create jobs and opportunities, but opportunities and resources are not allocated equitably. Policies in local plans can work to set intentional goals and policies that advance racial equity and strive for inclusion of all in the unique design, cultural identity, and opportunities for connection in the region’s communities.
► MPP-EC-15
► MPP-EC-17
► MPP-EC-20
Regional Context. This objective contributes to the following Multicounty Planning Policies established in VISION 2050:
Item 3aRegional Staff Committee Packet pg 35

VISION 2050 Planning Resources | Economic Development Element Guide 25
Why this works
Enhance arts and culture activities in order to attract creative-class workers, living wage employers, and tourists to Seattle, as well as to enrich our overall culture of innovation.
City of Seattle Comprehensive Plan
► Draws a connection between cultural activities and economic development
► Recognizes the value of the cultural economy on workforce recruitment
► Action-oriented by focusing investments into a specific area
Policy Example
Data metrics for understanding cultural assets and contributions
► Business Births & Deaths
► Local Interviews & Focus Groups
Developing local policies and programs
While establishing goals for the local economy, jurisdictions should identify the ethnic communities and institutions in their area. The economic success of these groups can be improved through efforts to highlight the achievements and innovation of these groups and b supporting cultural events led by these groups. More directly, a jurisdiction can provide funding opportunities for arts and cultural institutions, programming, and education. Jurisdictions can work to create pathways for under-resourced communities to start businesses, access commercial real estate, and sustain economic assets. Planners should seek out opportunities early and often to engage these groups through equitable outreach to ensure policies are community led and supported.
As appropriate, work with other jurisdictions and agencies such as state and federal agencies, tribes, the Port of Bremerton, the cities, the Kitsap Economic Development Alliance (KEDA), Port Orchard Chamber of Commerce, and the Kitsap County Public Utilities Districts, in marketing and developing the City of Port Orchard.
City of Port Orchard Comprehensive Plan
► Recognized the importance of partnerships in economic development
► Names several institutions to work together towards a common goal
► Acknowledges the important role tribes play in economic development
Item 3aRegional Staff Committee Packet pg 36
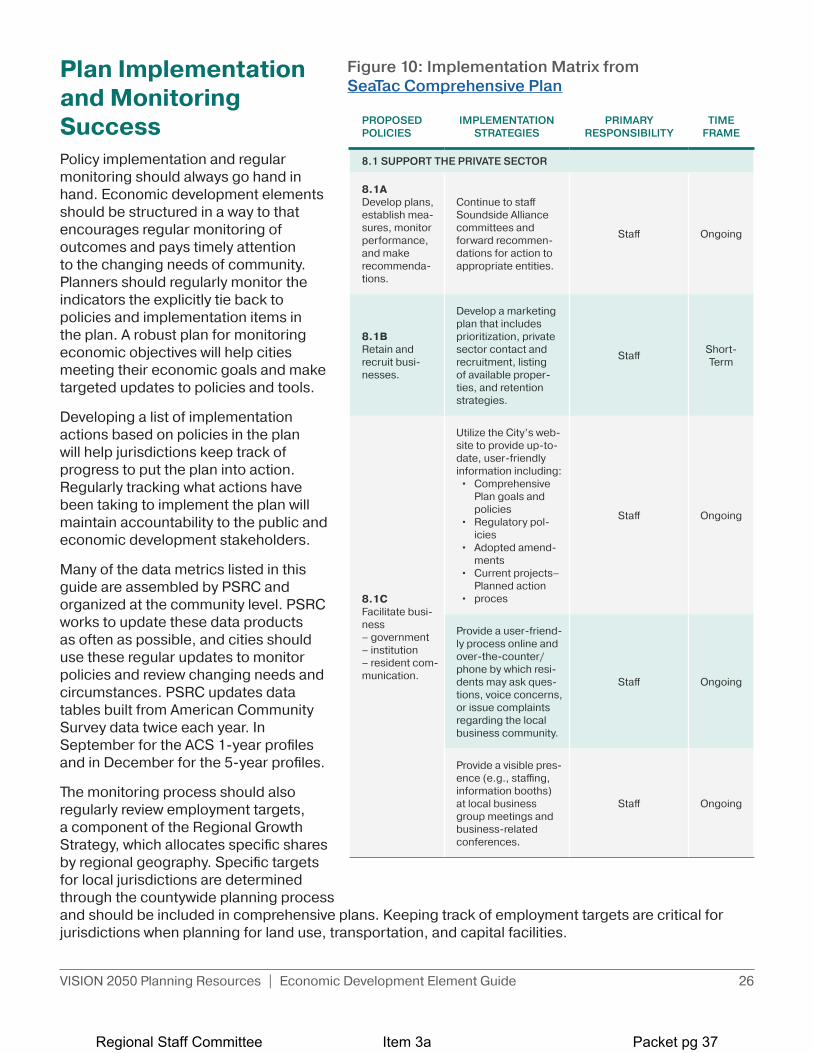
VISION 2050 Planning Resources | Economic Development Element Guide 26
Plan Implementation and Monitoring SuccessPolicy implementation and regular monitoring should always go hand in hand. Economic development elements should be structured in a way to that encourages regular monitoring of outcomes and pays timely attention to the changing needs of community. Planners should regularly monitor the indicators the explicitly tie back to policies and implementation items in the plan. A robust plan for monitoring economic objectives will help cities meeting their economic goals and make targeted updates to policies and tools.
Developing a list of implementation actions based on policies in the plan will help jurisdictions keep track of progress to put the plan into action. Regularly tracking what actions have been taking to implement the plan will maintain accountability to the public and economic development stakeholders.
Many of the data metrics listed in this guide are assembled by PSRC and organized at the community level. PSRC works to update these data products as often as possible, and cities should use these regular updates to monitor policies and review changing needs and circumstances. PSRC updates data tables built from American Community Survey data twice each year. In September for the ACS 1-year profiles and in December for the 5-year profiles.
The monitoring process should also regularly review employment targets, a component of the Regional Growth Strategy, which allocates specific shares by regional geography. Specific targets for local jurisdictions are determined through the countywide planning process and should be included in comprehensive plans. Keeping track of employment targets are critical for jurisdictions when planning for land use, transportation, and capital facilities.
PROPOSED POLICIES
IMPLEMENTATION STRATEGIES
PRIMARY RESPONSIBILITY
TIME FRAME
8.1 SUPPORT THE PRIVATE SECTOR
8.1ADevelop plans, establish mea-sures, monitor performance, and make recommenda-tions.
Continue to staff Soundside Alliance committees and forward recommen-dations for action to appropriate entities.
Staff Ongoing
8.1BRetain and recruit busi-nesses.
Develop a marketing plan that includes prioritization, private sector contact and recruitment, listing of available proper-ties, and retention strategies.
Staff Short-Term
8.1CFacilitate busi-ness– government – institution – resident com-munication.
Utilize the City’s web-site to provide up-to-date, user-friendly information including:
• Comprehensive Plan goals and policies
• Regulatory pol-icies
• Adopted amend-ments
• Current projects–Planned action
• proces
Staff Ongoing
Provide a user-friend-ly process online and over-the-counter/ phone by which resi-dents may ask ques-tions, voice concerns, or issue complaints regarding the local business community.
Staff Ongoing
Provide a visible pres-ence (e.g., staffing, information booths) at local business group meetings and business-related conferences.
Staff Ongoing
Figure 10: Implementation Matrix from SeaTac Comprehensive Plan
Item 3aRegional Staff Committee Packet pg 37
VISION 2050 Planning Resources | Economic Development Element Guide 27
Additional ResourcesThis guide acknowledges that economic development planning should be tailored for local circumstances, and there are many different opportunities available for communities to structure specific policies and strategies that are appropriate and effective. As such, PSRC recommends the following resources for additional considerations to provide sample tools and policies for local economic development planning.
► MRSC: Planning for Economic Development
► University of North Carolina: Homegrown Tools for Economic Development
► Met Council: Integrating Economic Development Strategies into Everyday Planning
► WA Department of Commerce: Local Economic Development Partnerships
► PolicyLink: All-In Cities Policy Toolkit
► Institute for Local Government: Economic Development Tools
► Purdue University: Economic Development Policy Tools for Local Government Land Use Planning
Visit www.psrc.org for more information and resources.
Item 3aRegional Staff Committee Packet pg 38

DISCUSSION ITEM November 18, 2021
TO: Regional Staff Committee
FROM: Craig Helmann, Director of Data
SUBJECT: US Census Data and Community Data Profiles
IN BRIEF
At the November 18th Regional Staff Committee meeting, PSRC staff will provide background information on Census 2020 Data products and will seek input on a data visualization tool to help local jurisdictions access Census related data products.
DISCUSSION
PSRC staff are actively working on various tools to help local jurisdictions access relevant Census Data products for use in long range planning. In November, staff will demonstrate a web-based app developed at PSRC to connect member jurisdictions with a variety of Census related data products. Staff are hoping for feedback from the committee on the usefulness of the Community Data Profiles application to inform further design changes to the tool. Staff will also engage in a conversation with the committee on Census 2020 related products and their relevant release schedule.
Next Steps Following the November meeting, staff will incorporate input into the design on the Community Data Profiles app before an alpha release of the tool in early 2022.
Lead Staff Contact Craig Helmann, Director of Data, at 206-389-2889, or at [email protected].
Item 4a Regional Staff Committee Packet pg 39
November 18, 2021 INFORMATION ITEM
TO: Regional Staff Committee
FROM: Charles Patton, Program Manager
SUBJECT: Regional Equity Strategy Workshop
IN BRIEF
On October 21, 2021 the Regional Staff Committee was briefed on work to date related to the Regional Equity Strategy and asked for their feedback. A summary of the breakout sessions is provided below.
DISCUSSION
Equity is a key policy area in VISION 2050, the region’s long-range plan for growth. A new action in the VISION 2050 plan (RC-Action-3) directs PSRC to develop a regional equity strategy, which is intended to make equity central to PSRC's work and to support the 2024 local comprehensive plan updates.
PSRC created a work plan that includes specific tasks the agency will complete to help PSRC more effectively incorporate equity into agency work and provide resources to help jurisdictions elevate equity in the 2024 local comprehensive plan updates. PSRC briefed the Regional Staff Committee on elements of the work plan that will support the elevation of equity in 2024 local comprehensive plan updates. The Committee then broke into six smaller groups to provide feedback that will assist further implementation of the Regional Equity Strategy. A summary of comments is provided below.
Where is your agency at regarding equity work? What resources have you already created?
• Equity commissions and cabinets that bring equity lens for advancingprograms/procedures/plans
• Dashboards and maps to track disparities and comprehensive plan processefforts
• Offices, staff, and staff teams designated to address equity issues• Racial equity toolkit and strategies to address inequities• Equity trainings• Identified communities of focus rooted in health equity analysis
Item 6a Regional Staff Committee Packet pg 40

Which PSRC equity resources are important for you?
• Inclusive Engagement Guidance • Equity Dashboard • Equity Impact Tool • Opportunity Mapping • Data Visualization Tool
What other planning resources would be useful for your work?
• Aggregate different equity resources that jurisdictions are creating into one place for members to view
• EAC members serving on RSC • How to consistently incorporate equity in project prioritization • Regional definition for equitable target areas that guide funding decisions
Describe your timeline. Where would these resources fit into that timeline?
• Most aren’t sure of their timeline yet. However, some are starting in fall of 2022 and resources such as the Data Dashboard and Inclusive Engagement Guidance would be helpful to have early in the process.
Next Steps PSRC will continue developing the Regional Equity Strategy, including taking feedback from this meeting as well as others to develop the Strategy in a manner that meets the needs of member jurisdictions. Lead Staff For more information, please contact Charles Patton, Program Manager, at 206-971-3285 or [email protected].
Item 6a Regional Staff Committee Packet pg 41


![[MS-RGDI]: Remote GDI+ (RGDI) Binary Stream Format...1 / 57 [MS-RGDI] — v20131205 Remote GDI+ Binary Stream Format Copyright © 2013 Microsoft Corporation. Release: Thursday, December](https://img.pdfslide.net/doc/110x75/5f48d3c162c3da5adb64bea1/ms-rgdi-remote-gdi-rgdi-binary-stream-format-1-57-ms-rgdi-a-v20131205.jpg)