Embed Size (px)
Citation preview
R E G I O N A L S T R A T E G Y
REGIONAL STRATEGY 2011-2016
Africa Region

Africa’s future and the World Bank’s support to it
The Africa Strategy, 2011-20162

R E G I O N A L S T R A T E G Y
I. Africa’s growth momentum and development challengesII. The Africa Strategy, 2011-2016
– Vision– Process– Themes
• Competitiveness and Employment• Vulnerability and Resilience• Governance and Public Sector Capacity
III. Implementing the StrategyIV. Organizing for Results
– Country Differentiation– Decentralization– Selectivity and Trade-Offs– Risks and Mitigation Measures– Results Monitoring
3
R E G I O N A L S T R A T E G Y
I. AFRICA’S GROWTH MOMENTUM
AND DEVELOPMENT CHALLENGES

Growth Performance
•Thanks to continued, prudent economic policies, rapid rebound from the crisis
Equatorial Guinea
Angola
Chad
Sudan
Nigeria
Cameroon
Congo Rep
Gabon
Liberia
Mozambique
Sierra Leone
Rwanda
Sao Tome and Princ.
Ethiopia
Tanzania
Cape Verde
Mali
Burkina Faso
Botswana
Ghana
Gambia, The
Mauritius
Namibia
Senegal
Niger
Benin
Zambia
Madagascar
Kenya
Malawi
South Africa
Guinea
Lesotho
Swaziland
Seychelles
Burundi
Congo, Dem. Rep.
Comoros
CAR
Togo
Cote d’Ivoire
Eritrea
Guinea-Bissau
Zimbabwe
0.0-5.0 5.0 10.0 15.0 20.0 25.0
Perc
enta
ge o
f to
tal A
fric
an p
opula
tion
30%
40%
30%
Oil countries
Growth 4% or higher
Growth less than 4%
Average GDP growth rate 1998-2008
5

Progress Towards the MDGs in Sub-Saharan Africa
Primary school enrollment ratesPopulation living under $1.25/day
Child mortality rates Maternal mortality ratio
6
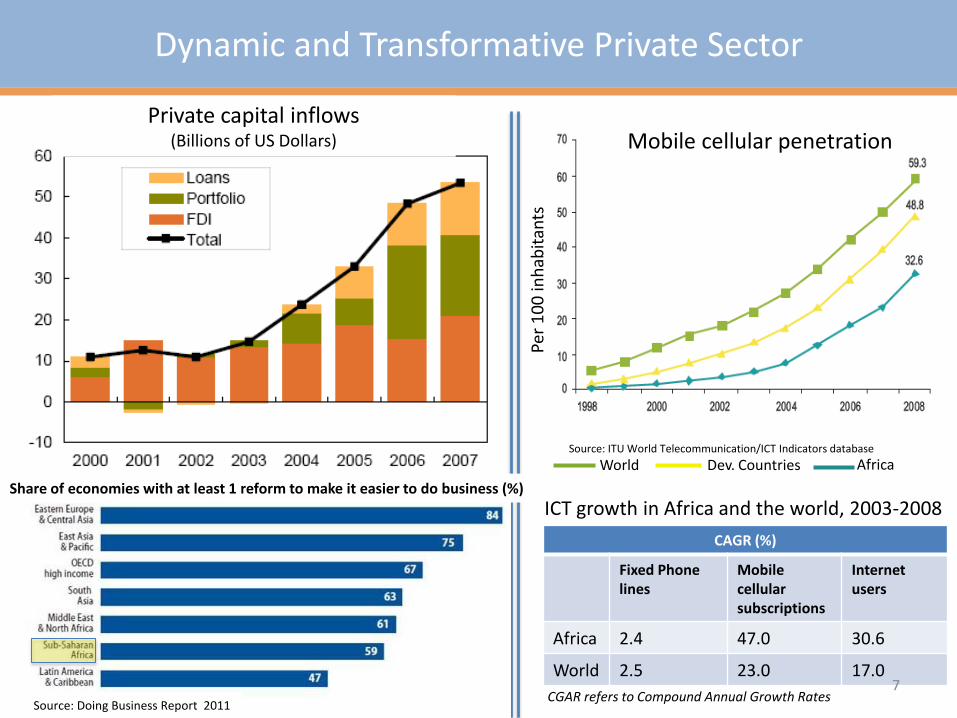
Dynamic and Transformative Private Sector
World Dev. Countries Africa
Per
10
0 in
hab
itan
ts
Source: ITU World Telecommunication/ICT Indicators database
Private capital inflows(Billions of US Dollars) Mobile cellular penetration
ICT growth in Africa and the world, 2003-2008
CAGR (%)
Fixed Phone lines
Mobile cellular subscriptions
Internet users
Africa 2.4 47.0 30.6
World 2.5 23.0 17.07
CGAR refers to Compound Annual Growth Rates
Share of economies with at least 1 reform to make it easier to do business (%)
Source: Doing Business Report 2011
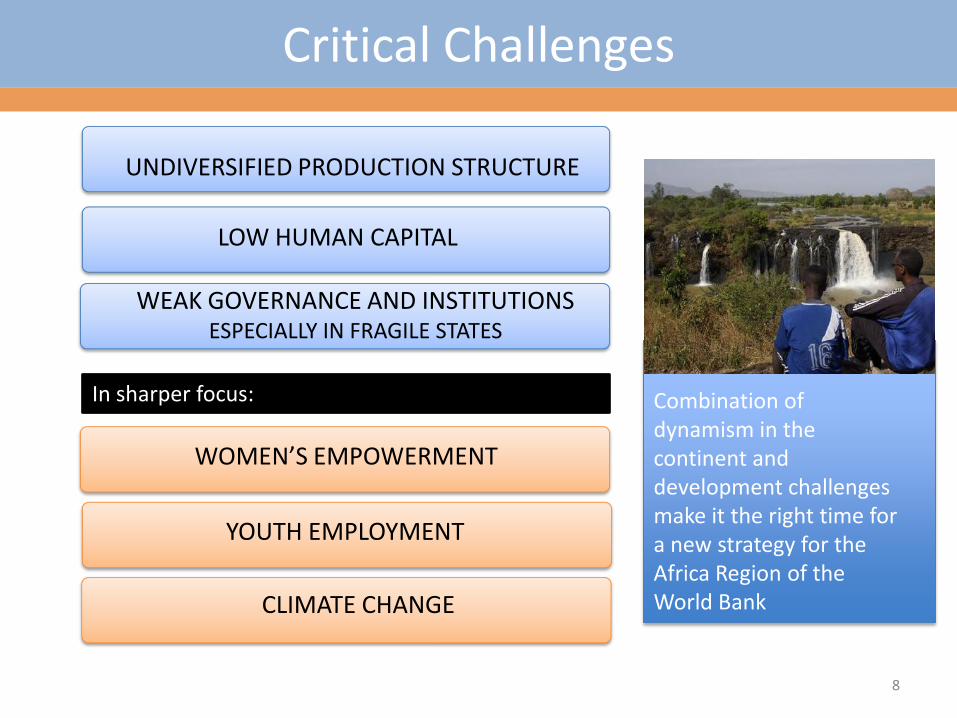
UNDIVERSIFIED PRODUCTION STRUCTURE
LOW HUMAN CAPITAL
WEAK GOVERNANCE AND INSTITUTIONS ESPECIALLY IN FRAGILE STATES
Critical Challenges
CLIMATE CHANGE
YOUTH EMPLOYMENT
WOMEN’S EMPOWERMENT
In sharper focus: Combination of dynamism in the continent and development challenges make it the right time for a new strategy for the Africa Region of the World Bank
8
R E G I O N A L S T R A T E G Y
II. THE AFRICA STRATEGY, 2011-16
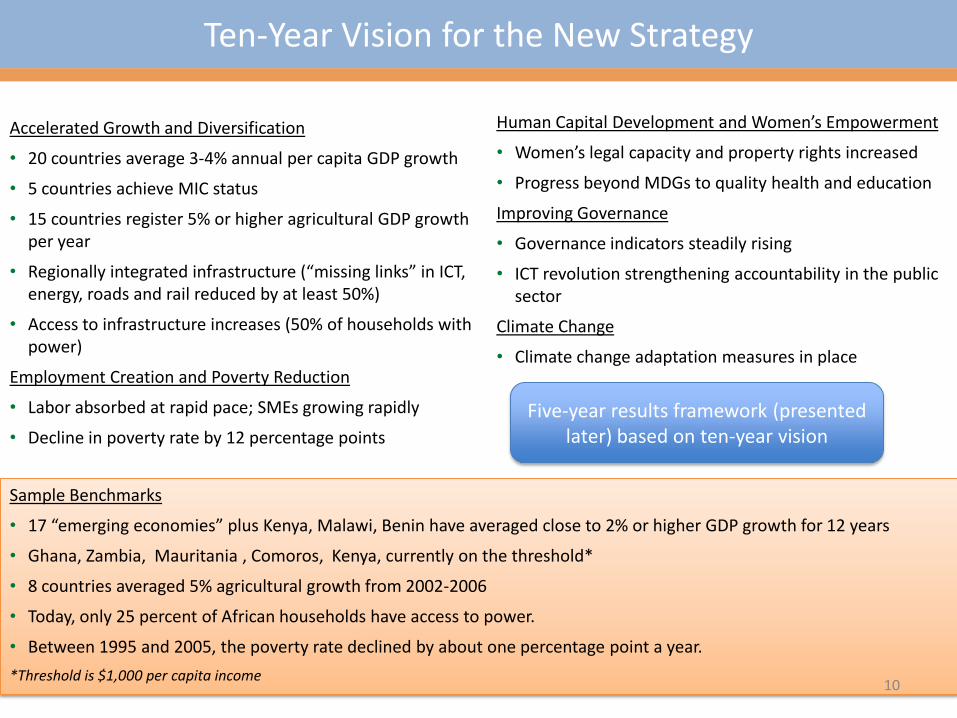
Ten-Year Vision for the New Strategy
Accelerated Growth and Diversification
• 20 countries average 3-4% annual per capita GDP growth
• 5 countries achieve MIC status
• 15 countries register 5% or higher agricultural GDP growth per year
• Regionally integrated infrastructure (“missing links” in ICT, energy, roads and rail reduced by at least 50%)
• Access to infrastructure increases (50% of households with power)
Employment Creation and Poverty Reduction
• Labor absorbed at rapid pace; SMEs growing rapidly
• Decline in poverty rate by 12 percentage points
Sample Benchmarks
• 17 “emerging economies” plus Kenya, Malawi, Benin have averaged close to 2% or higher GDP growth for 12 years
• Ghana, Zambia, Mauritania , Comoros, Kenya, currently on the threshold*
• 8 countries averaged 5% agricultural growth from 2002-2006
• Today, only 25 percent of African households have access to power.
• Between 1995 and 2005, the poverty rate declined by about one percentage point a year.
*Threshold is $1,000 per capita income
Human Capital Development and Women’s Empowerment
• Women’s legal capacity and property rights increased
• Progress beyond MDGs to quality health and education
Improving Governance
• Governance indicators steadily rising
• ICT revolution strengthening accountability in the public sector
Climate Change
• Climate change adaptation measures in place
Five-year results framework (presented later) based on ten-year vision
10

Input from over 1,500 people from 36 countries
Strategy Represents African Views
http://www.youtube.com/watch?v=B9PwMzzb1xM&feature=player_embedded
“Africa has a very bright future... We have abundant resources which when well harnessed, with suitable governance in place, can turn the continent into one of the wealthiest.”
Eliud Akanga Kenya
11
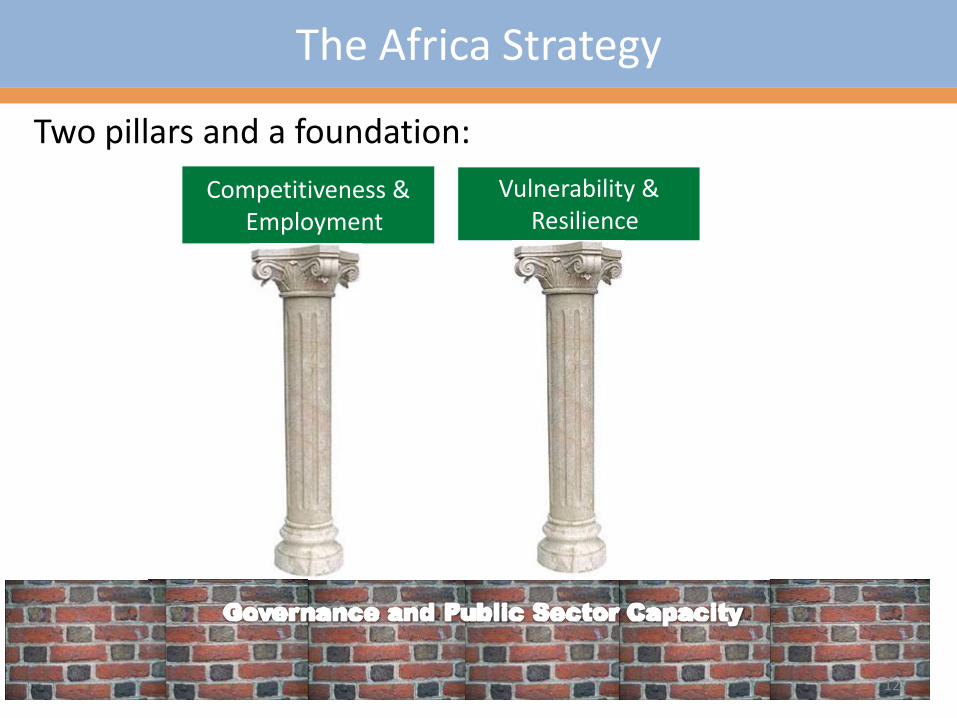
Competitiveness & Employment
Vulnerability & Resilience
Two pillars and a foundation:
The Africa Strategy
12

Competitiveness & Employment
Vulnerability & Resilience
Two pillars and a foundation:
The Africa Strategy
PCD: Target the poor and vulnerable,Manage risk and prepare for crisis
PCD: Create opportunity for growth
13
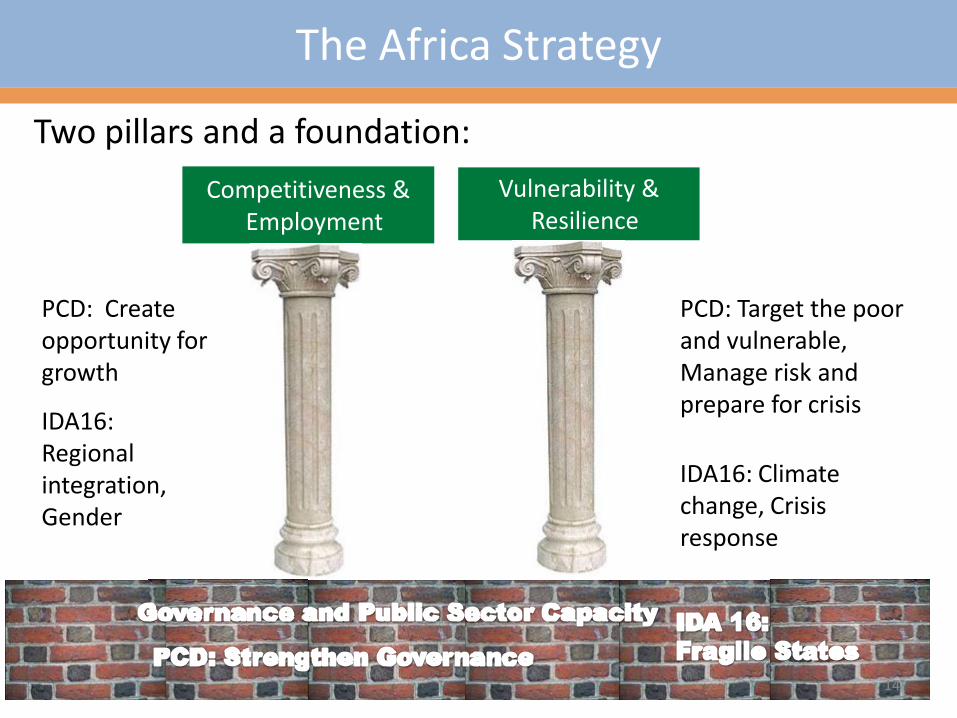
Competitiveness & Employment
Vulnerability & Resilience
Two pillars and a foundation:
The Africa Strategy
PCD: Target the poor and vulnerable,Manage risk and prepare for crisis
PCD: Create opportunity for growth
IDA16: Regional integration, Gender
IDA16: Climate change, Crisis response
14
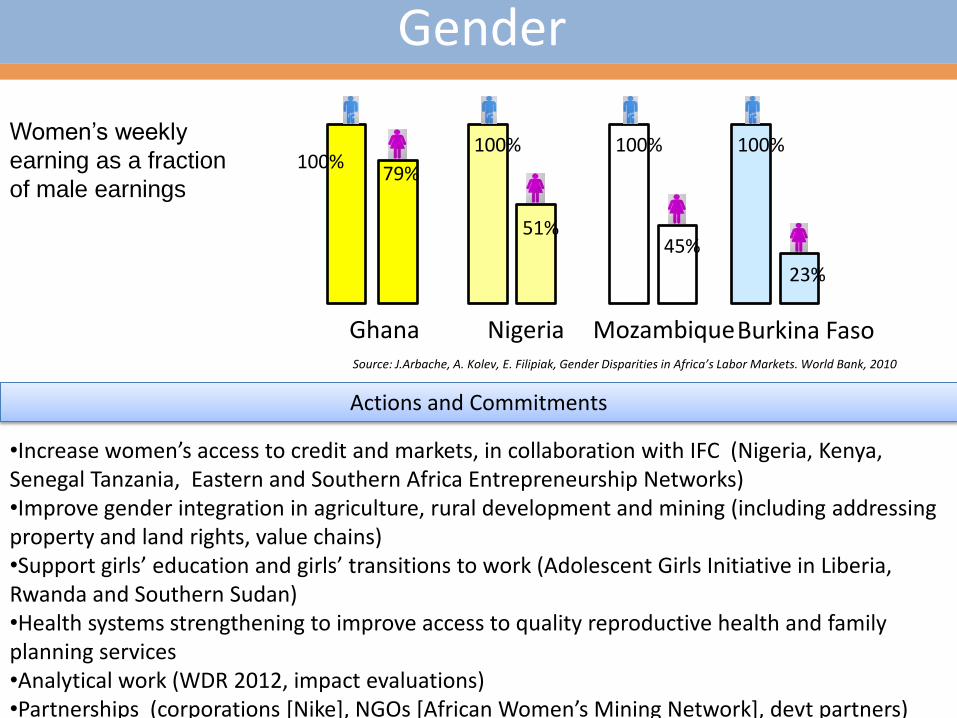
Gender
•Increase women’s access to credit and markets, in collaboration with IFC (Nigeria, Kenya, Senegal Tanzania, Eastern and Southern Africa Entrepreneurship Networks)•Improve gender integration in agriculture, rural development and mining (including addressing property and land rights, value chains)•Support girls’ education and girls’ transitions to work (Adolescent Girls Initiative in Liberia, Rwanda and Southern Sudan)•Health systems strengthening to improve access to quality reproductive health and family planning services •Analytical work (WDR 2012, impact evaluations)•Partnerships (corporations *Nike+, NGOs *African Women’s Mining Network+, devt partners)
Actions and Commitments
Ghana Nigeria MozambiqueBurkina Faso
100% 100% 100%
51%45%
23%
79%100%
Women’s weekly
earning as a fraction
of male earnings
Source: J.Arbache, A. Kolev, E. Filipiak, Gender Disparities in Africa’s Labor Markets. World Bank, 2010

Vulnerability and Resilience
00.5
11.5
22.5
33.5
44.5
Ghana Liberia Sierra Leone
Togo DR Congo Guinea Gabon Mali Niger Nigeria
pe
rce
nta
ge p
oin
t ch
ange
fro
m b
ase
line
Source: Wodon et al. (2008). "Potential Impact of Higher Food Prices on Poverty: Estimates from a Dozen West and Central African Countries", Policy Research Working Paper 4745.
Poverty increase from baseline (in percentage points) due to a 25% increase in food prices
Food prices (2000=100)
16

Macroeconomic Shocks
Health Shocks
Natural Disasters
Conflict and Political Violence
Vulnerability and Resilience
•Sound macroeconomic policies•Safety nets
•Health insurance•Health Systems
•Early warning systems•Disaster-resistant infrastructure•Rapid response transfer schemes
•Institutions for equitable distribution
17

Source: Costs to Developing Countries of Adapting to Climate Change, World Bank, 2009. http://blogs.worldbank.org/dmblog/node/651
Climate Change
Number of floods increasing
Source: WDR 2010
18

Climate Change
Challenges
• Current climate variability estimated to cause an annual loss of 1-2 % of GDP; by 2020 between 75 to 250 million people in Africa will be affected by water stress
• Today, 560 million Africans do not have access to modern energy, with access rates as low as 5-6% in some countries. Africa contributes less than 4% of total CO2 emissions
Opportunities
• Irrigation (less than 8% of irrigable land is under irrigation)
• Water resource management (river basins, hydro power)
• Hydro can provide up to 50% of Africa’s energy needs, up from 24% today.
• Climate-resistant infrastructure (e.g. roads in Ethiopia)
• Soil carbon sequestration could yield US $1.47 billion annually for Africa.
• Avoiding deforestation (REDD)
• Other carbon finance
Note: COP17 in South Africa in 2012 is Africa’s moment in the climate change sphere 19

In depth analysis of mining and transport programs
Improved effectiveness ofwork on decentralization,justice, anticorruption
Policy dialogue on forestry governance
Political economy study on telcoms/mining
Catalytic reforms in Customs Directorate
Complementary leadershipand coaching work
Finding entry points for governance at provincial level
Investment in PE and diagnostic work has supported dialogue in difficult situations
• More transparent supervision of 7 projects using E-ISR
• Political economy study to design governance filter
Investing in governance diagnostics as GAC issues gain prominence
First Annual Report on Corruption successfully launched by the Inspector General of Uganda (Ombudsman)
Growing program of work on PSM and Governance at state level
Solid diagnostic work –PEMFARs/PE studies supported by DPOs and PILs
Upcoming work on urban water and health
Political economy work to identify strategic entry points
Growing program of support to rebuilding state capabilities and enhance accountability
Strategic focus on mining and public expenditure
Developing feedback mechanisms for WB-funded projects
Support to CoST and EI Transparency initiatives
Supply Side Interventions
Burkina Cameroon DRC Ghana
Sierra Leone Nigeria Uganda Zambia
20

R E G I O N A L S T R A T E G Y
III. IMPLEMENTING THE STRATEGY

Knowledge
Finance
Partnerships
Implementing the Strategy
Leveraging:•Domestic res.•IDA, IBRD, IFC,MIGA•PCGs, enclaves, etc.
•Link analysis to policy•Political economy•Evidence to nourish public debate
-Governments-AfDB, AU, RECs- Civil society- Private sector- Development partners
22

*Source: Africa’s infrastructure: A time for transformation, World Bank 2010
Regional solutions
Beyond Infrastructure:•Agricultural research•Health•Trade integration
Public Health Laboratory Network in East Africa
High-impact projects:•West Africa Power Pool• Inga 3 hydro-project •North-South Corridor
23

R E G I O N A L S T R A T E G Y
IV. ORGANIZING FOR RESULTS

Middle-Income Countries
Fast-growing low-income countries
Country Differentiation
25
Slow-growing low-income countries
Fragile states (WDR 2011)

Selectivity and Trade Offs
Partnerships
Programmatic approach
Management
• Convener role (Rwanda Investors’ Forum)• Following others’ lead (PIDA, EFA-FTI)• Leveraging finance (Mozambique, Liberia, Sierra Leone)
• Investing in country systems, rather than ring-fenced projects (e.g. health)• Adopting programmatic operations over project fragmentation (e.g. value chain approaches in agriculture, tourism, Ethiopia Protecting Basic Services)• Fewer but transformative knowledge products (Africa Infrastructure Country Diagnostic)
• Fragile states hub v. technical staff in FCS• “Regional discipline” through portfolio reviews, QBRs, COSO, ROCs, projects
and AAA choice• Integrated Planning System• Alignment of incentives
26

Global economic volatility and decline
- Strengthening institutions for resilience (Pillar 2)
- Increased diversification of African economies (Pillar 1)
Political violence, conflict and fragility
- Demand-side accountability measures (Foundation)
- Decentralization and participation (Foundation)
- Political consensus-building (Knowledge)
- Partnerships (Main instrument of implementation)
Inadequate resources to deliver on the strategy
- Partnerships to leverage other development partners, private sector and
African countries’ own resources
Risks and Mitigation Measures
Global economic volatility and decline
Political violence, conflict and fragility
Inadequate resources to deliver on the strategy
27

Responding to Increased Client Demand for Lending
IBRD IDA IBRD/IDA
FY06 $40.0 $4,746.6 $4,786.6
FY07 $37.5 $5,759.4 $5,796.9
FY08 $30.0 $5,656.5 $5,686.5
FY09 $361.5 $7,841.4 $8,202.9
FY10 $4,258.1 $7,178.8 $11,436.9
$4,258.1
$7,178.8
$11,436.9
$0.0
$2,000.0
$4,000.0
$6,000.0
$8,000.0
$10,000.0
$12,000.0
$14,000.0
IDA/IBRD Lending Volume by Fiscal Year (US$M)
Providing Timely Analytical Work to our Clients
146
104 108
9687
72
9080
94102
0
30
60
90
120
150
180
FY06 FY07 FY08 FY09 FY10
AAA Deliveries by Fiscal Year
# Of ESW Delivered by Fiscal year # Of TA Delivered by Fiscal Year

• 5 Year Monitoring Framework allows adjustments at Strategy Mid-Term
• Annual Progress Reports, Dissemination through social media, blogs and AfricaWiki
• Drawing from CAS results
• Complemented by annual “IDA at Work” Results Stories
Five-Year Results Monitoring
• Poverty headcount (PPP, % of population under US$ 1.25) from 50.9% in 2005 to under 40% in 2015• Under 5 mortality rate (# per 1000 people) from 129 in 2009 to under 93 in 2015• Maternal mortality ratio (# per 100,000 live births) from 645 in 2008 to below 500 in 2015• Annual 4% growth (%) in agricultural value added [5 year moving average] from 2010 to 2015
Three Tier Monitoring Framework: aligned with IDA16 Monitoring, Corporate Scorecard
Examples of Regional Key Development Outcomes, the Strategy intends to influence
Integrated Reporting Framework: Painting the Full Picture of Results
Strengthen countries’ statistical capacity to monitor progress29

30
Thank You