Embed Size (px)
Citation preview

Regional Water Demand and Conservation Projections
Final Report September 2014
WESTERN
POLICY
RESEARCH

-- This page left b lank intent ional ly --

Table of Contents Regional Water Demand and Conservation Projections Final Report
i
TABLE OF CONTENTS
LIST OF FIGURES ...................................................................................................................................................................... III
LIST OF TABLES ........................................................................................................................................................................ III
LIST OF ACRONYMS ................................................................................................................................................................. IV
EXECUTIVE SUMMARY.............................................................................................................................................................. V
1. INTRODUCTION ................................................................................................................................................................... 1-1
1.1 Goals and Objectives .................................................................................................................................................. 1-1
1.2 Approach and Methodology ........................................................................................................................................ 1-1
1.3 Collaboration between BAWSCA, Member Agencies and Santa Clara Valley Water District ..................................... 1-2
1.4 Relationship to Other Planning Efforts ........................................................................................................................ 1-2
1.5 Content of Final Report ............................................................................................................................................... 1-3
2. DATA COLLECTION AND VERIFICATION PROCESS ........................................................................................................ 2-1
2.1 Data Collection Process Overview .............................................................................................................................. 2-1
2.1.1 Preliminary Survey .......................................................................................................................................... 2-1
2.1.2 Data Collection and Verification File ............................................................................................................... 2-1
2.2 Types of Data Collected .............................................................................................................................................. 2-2
3. DEMAND PROJECTIONS .................................................................................................................................................... 3-1
3.1 Demand Methodology Overview ................................................................................................................................. 3-1
3.1.1 Econometric Analysis Methodology ................................................................................................................ 3-2
3.1.2 DSS Model Methodology ................................................................................................................................ 3-4
3.1.3 Agency Input and Review ............................................................................................................................... 3-5
3.2 Future Population and Employment ............................................................................................................................ 3-5
3.3 Baseline Water Demand Projections .......................................................................................................................... 3-6
4. WATER CONSERVATION SAVINGS PROJECTIONS ........................................................................................................ 4-1
4.1 Conservation Analysis Goals and Objectives ............................................................................................................. 4-1
4.1.1 Conservation Analysis Methodology ............................................................................................................... 4-1
4.1.2 Perspectives on Benefits and Costs ............................................................................................................... 4-8
4.2 Comparison of Individual Conservation Measures ...................................................................................................... 4-9
4.3 Conservation Savings Results .................................................................................................................................. 4-10
4.4 Agency Input and Review ......................................................................................................................................... 4-12
5. PROJECTED WATER DEMAND AND CONSERVATION SAVINGS RESULTS ................................................................. 5-1
5.1 Introduction ................................................................................................................................................................. 5-1
5.2 BAWSCA Regional Demand Projections .................................................................................................................... 5-1
5.3 Population and Employment Projections Summary .................................................................................................... 5-3
5.4 Individual Agency Water Demands ............................................................................................................................. 5-4
5.5 Projected Consumption by Customer Class ............................................................................................................... 5-8
5.6 Next Steps .................................................................................................................................................................. 5-9
APPENDIX A. CONSERVATION SCREENING GRAPHICS ....................................................................................................... A
APPENDIX B. LIST OF MEASURES SELECTED AND NOT SELECTED FOR COST EFFECTIVENESS ANALYSIS ............. C

Table of Contents Regional Water Demand and Conservation Projections Final Report
ii
APPENDIX C. ECONOMETRIC MODEL DESCRIPTION ........................................................................................................... E
APPENDIX D. CONSERVATION TARGETS AND GOALS ......................................................................................................... K
State Mandated Water Conservation ............................................................................................................................. K
Water Reduction Targets Methodology.......................................................................................................................... K
APPENDIX E. KEY ASSUMPTIONS FOR THE DSS MODEL ..................................................................................................... L
Present Value Analysis and the Utility and Community Perspective ............................................................................. M
Present Value Parameters ............................................................................................................................................ N
Assumptions about Measure Costs .............................................................................................................................. N
Assumptions about Measure Savings ........................................................................................................................... N
Assumptions about Avoided Costs ............................................................................................................................... N
APPENDIX F. DETAILED STARTING VALUES FOR WATER USE EFFICIENCY MEASURES EVALUATED ......................... O
REFERENCES .......................................................................................................................................................................... DD

Table of Contents Regional Water Demand and Conservation Projections Final Report
iii
LIST OF FIGURES
Figure 1. Demand Forecasting Methodology ....................................................................................................................... 3-2
Figure 2. BAWSCA Econometric Model Flow Diagram ....................................................................................................... 3-3
Figure 3. BAWSCA DSS Model Flow Diagram .................................................................................................................... 3-4
Figure 4. Historical and Projected Population and Employment .......................................................................................... 3-6
Figure 5. BAWSCA Region Wide Baseline Demands to 2040 ............................................................................................ 3-7
Figure 6. BAWSCA 10 Step Process to Completing Conservation Analysis ....................................................................... 4-2
Figure 7. BAWSCA Region Wide Baseline Demands with Active Conservation Savings to 2040 .................................... 4-10
Figure 8. BAWSCA Region Wide Demand Projections to 2040 .......................................................................................... 5-2
Figure 9. Projected Consumption By Customer Category ................................................................................................... 5-8
Figure 10. Summary of Online Survey Ranking of Water Use Efficiency Measures ............................................................. A
Figure 11. Summary of BAWSCA Member Input on Lead Implementation Agency .............................................................. B
Figure 12. BAWSCA Region-Wide Trends in the Single-Family Real Price of Water ........................................................... G
Figure 13. BAWSCA Region-Wide Econometric Model Fit and Forecast .............................................................................. H
LIST OF TABLES
Table 1. Data Collected for Member Agencies .................................................................................................................... 2-3
Table 2. Water Use Efficiency Measure Descriptions ......................................................................................................... 4-3
Table 3. BAWSCA Planned Conservation Measure Implementation ................................................................................ 4-11
Table 4. Regional Demand Projections ............................................................................................................................... 5-1
Table 5. BAWSCA Member Agency Population Projections ............................................................................................... 5-3
Table 6. BAWSCA Region Wide Historical and Projected Population and Employment ..................................................... 5-4
Table 7. Demand Projections before Passive Conservation Savings (MGD) ...................................................................... 5-5
Table 8. Demand Projections with Passive Conservation Savings (MGD) .......................................................................... 5-6
Table 9. Demand Projections with Passive and Active Conservation Savings (MGD) ........................................................ 5-7
Table 10 Projected Consumption by Customer Category (MGD)* ...................................................................................... 5-8
Table 11. Selected 25 Measures to be Included in the DSS Model for Cost Effectiveness Analysis ................................... C
Table 12. Measures Considered that were NOT be Included in the DSS Model .................................................................. D
Table 13. Independent Variables Evaluated for the Econometric Analysis ............................................................................ E
Table 14. BAWSCA Region-Wide Model Results .................................................................................................................... I
Table 15. List of Key Assumptions ......................................................................................................................................... L

Executive Summary Regional Water Demand and Conservation Projections Final Report
iv
LIST OF ACRONYMS
AB Assembly Bill
ABAG Association of Bay Area Governments
AF acre-foot/acre-feet
AMI Automatic Metering Infrastructure
BAWSCA Bay Area Water Supply and Conservation Agency
BC Brown and Caldwell
BLS U.S. Buearu of Labor Statistics
BMP best management practice
C&S Study Cost & Savings Study
CII commercial, industrial, institutional
CUWCC California Urban Water Conservation Council
DMM demand management measure
DOF Department of Finance
DP dwelling property
DSS Demand Side Management Least Cost Planning Decision Support System
DWR California Department of Water Resources
EBMUD East Bay Municipal Utilities District
EDD Economic Development Department
ETo reference evapotranspiration
FY Fiscal Year
GPCD Gallons Per Capita per Day
GPF gallon per flush
GPM gallon per minute
HE high-efficiency
HET high-efficiency toilet
HEU high-efficiency urinal
HEW high-efficiency washer
ILI Infrastructure Leakage Index
MG million gallons
MGD million gallons per day
MOU Memorandum of Understanding Regarding Urban Water Conservation
MWM Maddaus Water Management
MWD Municipal Water District
NOAA National Oceanic and Atmospheric Administration
PUB public
PV present value
PWSS Public Water System Statistics
RMF residential multi-family
RSF residential single family
SB Senate Bill
SCVWD Santa Clara Valley Water District
SFPUC San Francisco Public Utilities Commission
Sq Ft square feet
Strategy Long Term Reliable Water Supply Strategy
Tech Memo Technical Memorandum
TPF transformed peaking factor
ULF ultra low flow
URS URS Corporation
UWMP Urban Water Management Plan
WBIC Weather Based Irrigation Controller
WCDB Water Conservatin Data Base
WCIP Water Conservation and Recycling Implementation Plan
WSIP Water System Improvement Program
WUE Water Use Efficiency

v
R E G I O N A L W A T E R D E M A N D A N D C O N S E R V A T I O N P R O J E C T I O N S F I N A L R E P O R T
E X E C U T I V E S U M M A R Y
In March 2013, the Bay Area Water Supply and Conservation Agency (BAWSCA) initiated the Regional Demand and Conservation Projections Project (Project) to support the development of its Long-Term Reliable Water Supply Strategy (Strategy). The goal of the Project was to develop transparent, defensible, and uniform demand and conservation projections for each BAWSCA member agency using a common methodology to support regional planning efforts as well as individual agency efforts. Pursuant to this goal, the specific objectives of the Project were as follows:
(1) Quantify the total average-year water demand for each BAWSCA member agency through the year 2040;
(2) Quantify the passive and active conservation water savings potential for each individual BAWSCA member agency through 2040;
(3) Identify conservation programs for further consideration for regional implementation by BAWSCA; and
(4) Provide each BAWSCA member agency with a user-friendly model that can be used to support ongoing demand and conservation planning efforts.
Background
BAWSCA is currently developing the Strategy to identify potential cost effective projects, programs and/or additional studies to increase the water supply reliability of the BAWSCA member agencies. In September 2012 the BAWSCA Board unanimously approved the Strategy Phase IIA Report recommendations, including the recommendation to update the water demand and conservation projections for the BAWSCA member agencies using a common methodology. The Project was initiated to implement this recommendation and provides a critical input to the Final Phase of the Strategy. In addition, the updated demand estimates may be used by individual BAWSCA member agencies in their 2015 Urban Water Management Plans (UWMP) and 20x2020 Plans mandated as a result of Senate Bill X7-7 (SBX7-7) (Steinberg/Pavley).
Demand and Conservation Projections Development Process
The Project was completed as a collaborative effort between the BAWSCA staff and the BAWSCA member agencies. The Santa Clara Valley Water District (SCVWD) also provided input on technical items associated with the conservation analysis, given its role as the wholesale water agency to eight member agencies in Santa Clara County. Over the course of the Project, input was solicited from the aforementioned groups through multiple forums, including workshops, one-on-one meetings, and web-based meetings.
Service Area Profiles
The initial phase of the Project was the updating of each member agency’s population and employment projections using Association of Bay Area Governments (ABAG) 2013 data and other data sources. The total BAWSCA service area population and employment projections are presented in Table ES-1. In addition, historical demographic, economic, weather, and conservation data for each member agency was also collected for use in both the demand and conservation analysis.

Executive Summary Regional Water Demand and Conservation Projections Final Report
vi
Table ES-1. Total BAWSCA Service Area Population and Employment Projections
2012 (Actual)
2015 2020 2025 2030 2035 2040
Population 1,724,772 1,780,800 1,874,100 1,951,500 2,032,300 2,120,300 2,217,800 Employment (Jobs) 1,069,156 1,116,300 1,212,300 1,270,400 1,332,700 1,389,900 1,443,800
Demand Projections
Next, each BAWSCA member agency’s baseline water demand (i.e., average year demand before additional active conservation savings was incorporated) was forecasted through 2040 using a combination of two different models – an econometric (or statistical) model developed particularly for each agency and the Demand Side Management Least Cost Planning Decision Support System (DSS Model). The demand analysis process included three distinct parts summarized below and described in detail in Section 3.
Historical View: Analysis of historical data between 1995 and 2012 (or a shorter period if an agency’s historical data was incomplete) was done to assess the impacts of factors such as water rates, economic conditions, and weather on water demands.
Short Term Future: The short-term future demand (2013 through 2020) was forecasted using each agency’s econometric model, assuming normal weather, while incorporating economic recovery predictions as well as water rate forecasts and population growth.
Long Term Future: Long-term water demand (2021-2040) by customer category was forecasted based upon forecasted increases in population and employment.
The econometric model was used to project short-term future demands based upon historical water use patterns and the projected future rebound in water demand associated with forecasts for economic recovery. An econometric model was constructed for each BAWSCA member agency using up to 18 years of monthly production data (where available, data from 1995 through 2012 were used). Each BAWSCA member agency’s model utilizes agency-specific data to analyze the impacts of a number of variables including employment, retail water rates, population, and weather on water demands.
The DSS Model was used to project both long-range water demands and conservation savings. To forecast water demands, the DSS Model relies on demographic and employment projections, combined with the effects of natural fixture replacement due to the implementation of plumbing codes to forecast future demands. Based upon this analysis, total average year water demands in the BAWSCA service area, before considering future conservation savings from passive (plumbing and building code) active conservation programs, are projected to reach 259 million gallons per day (MGD) in 2020 and 304 MGD in 2040.
Water Conservation Savings Projections
The final phase of the Project involved the estimation of both passive and active conservation savings through 2040. First, the analysis estimated water savings resulting from the installation of water-efficient fixtures required by current plumbing code and building code standards, termed passive conservation. Then, the water conservation savings analysis (1) defined how much conservation could reasonably contribute to additional water supply reliability for each BAWSCA member agency and (2) incorporated projected conservation savings from active conservation programs into the demand projections for each agency.

Executive Summary Regional Water Demand and Conservation Projections Final Report
vii
Passive Conservation Savings
Passive conservation refers to water savings resulting from actions and activities that do not depend on direct financial assistance or educational programs from water agencies. These savings result primarily from (1) the natural replacement of existing plumbing fixtures with water-efficient models required under current plumbing code standards and (2) the installation of water-efficient fixtures and equipment in new buildings and retrofits as required under CalGreen Building Code Standards. The DSS Model evaluated water savings associated with these codes and standards to project passive conservation savings. By 2040, passive conservation savings were projected to yield an additional 7 percent reduction in demands beyond what has been achieved to date, resulting in a baseline demand of 254 MGD in 2020 and 284 MGD in 2040.
Active Conservation Savings
Water savings from a variety of water use efficiency measures were analyzed to facilitate the development of individual agency’s active conservation savings estimates through 2040. A total of 25 conservation measures were selected for evaluation based on input from the BAWSCA member agencies. These measures were incorporated into each agency’s DSS Model for cost-benefit analysis and eventual selection of a conservation program to meet the agency’s conservation savings goals. Each BAWSCA member agency was provided a copy of its DSS Model to review the conservation program options, tailor the programs to meet its needs, and select the program that fit its individual water savings goals and budgets.
The active conservation savings analysis projected that by 2040 the combined effect of each agency’s planned conservation savings activities would yield an additional 16 MGD in active conservation savings beyond what has already been achieved for the BAWSCA service area, resulting in a total water demand of 246 MGD in 2020 and 269 MGD in 2040.
Through this analysis, several conservation programs with high water savings potential and/or member agency interest were identified. These programs will be further evaluated by BAWSCA for potential future implementation. These programs include:
Water Sense Fixtures Giveaway
Weather-Based Irrigation Controller (WBIC) Giveaway and/or Incentives
Small Irrigation Hardware Incentives
Gray Water Retrofits Rebates for SFR Customers
High-Efficiency Clothes Washer Commercial, Industrial, and Institutional (CII) Rebates
High-Efficiency Urinal CII Rebates
Focused School Retrofit Program
Rotating Sprinkler Nozzle Incentive Program
Regional Results
Based upon the analyses conducted as part of this effort, water demands are projected to increase 19 percent by 2040 after accounting for the effects of the existing plumbing code and future active conservation savings. These results are shown in Table ES-2. By comparison, the population and employment projections noted in Table ES-1 above show growth rates of 27 percent and 31 percent respectively between 2014 and 2040. Historical and projected BAWSCA gross per capita demands are presented in Figure ES-1.

Executive Summary Regional Water Demand and Conservation Projections Final Report
viii
Table ES-2. Total BAWSCA Demand Projections (MGD)
Demand Forecast 2012
(Actual) 2015 2020 2025 2030 2035 2040
Total Water Demand with No Plumbing Code Savings
NA 234 259 270 281 292 304
Total Water Demand With Plumbing Code Savings
NA 233 254 261 267 275 284
Total Water Demand With Active Conservation Measure Savings
222 228 246 250 255 260 269
Figure ES-1. Total BAWSCA Gross Per Capita Demands (Gallons per Capita per Day)
Conclusions and Next Steps
The demand projections developed through the Project will be used the final phase of the Strategy. BAWSCA will work with the member agencies to determine each agency’s planned water supply portfolio for meeting its projected demands to identify any new water supply needs. Identification of water supply needs will be used in the evaluation of potential new supply options to meet the water demands of the BAWSCA member agencies through 2040.
The majority of the BAWSCA member agencies are required to prepare UWMPs, which are due to DWR by July 2016. Member agencies may elect to utilize the demand and conservation savings projections developed through this Project as inputs to their respective UWMPs. Member agencies may also update the individual DSS Models for the UWMPs, if necessary, to incorporate new information for their respective service areas. These demand projections have not been formally adopted by individual agencies. It is anticipated that agencies will be adopting updated demand projections as part of the UWMP process.

Executive Summary Regional Water Demand and Conservation Projections Final Report
ix
In addition, BAWSCA will work with the member agencies to further evaluate the conservation programs that were identified through the Project as having high water savings potential and agency interest for regional implementation. BAWSCA recognizes that actual implementation of water conservation to achieve the identified water savings goals must be managed in an adaptive fashion, making both small and large program changes as needed over time.

1-1
D E V E L O P M E N T O F R E G I O N A L W A T E R D E M A N D A N D C O N S E R V A T I O N P R O J E C T I O N S F I N A L R E P O R T
1 . I N T R O D U C T I O N
This Regional Water Demand and Conservation Projections Project (Project) Final Report summarizes the water demand and conservation savings projections for each individual BAWSCA member agency and for the BAWSCA region as a whole.
1.1 Goals and Objectives
The goal of the Project was to develop transparent, defensible, and uniform demand and conservation projections for each BAWSCA member agency, using a common methodology that can be used to support regional planning efforts as well as individual agency work. Pursuant to this goal, the specific objectives of the Project were as follows:
(1) Quantify the total average-year water demand for each BAWSCA member agency to the year 2040; (2) Quantify the passive and active conservation water savings potential for each individual BAWSCA member
agency through 2040; (3) Identify conservation programs for further consideration for regional implementation by BAWSCA; and (4) Provide each BAWSCA member agency with a user-friendly model that can be used to support ongoing
demand and conservation planning efforts.
1.2 Approach and Methodology
To accomplish the above goal and objectives, each BAWSCA member agency’s water demands and conservation savings was forecasted throughout 2040 using a combination of two different models – an econometric model and the Demand Side Management Least Cost Planning Decision Support System (DSS Model). The purpose of using two tools is to leverage the strengths of each tool to obtain the best forecast through the year 2040. The econometric modeling was initially done outside of the DSS Model and was then incorporated as a feature in each member agency’s individual DSS Model.
Econometric modeling is a statistical approach used to determine the impact of factors such as economic conditions, weather, rates, and conservation on water demands. The Econometric Model is used to project, based upon historical patterns, the future rebound in water demand associated with economic recovery, while also taking into account other factors such as water rate increases and weather. The Econometric Model was used to forecast each agency’s baseline demand through 2020.
The DSS Model prepares long-range, detailed water demand and conservation savings projections to enable a more accurate assessment of the impact of water efficiency programs on demand. The DSS Model can use either a statistical approach to forecast demands (e.g., an econometric model), or it can use forecasted increases in population and employment to evaluate future demands. Furthermore, the DSS Model evaluates conservation measures using benefit cost analysis with the present value of the cost of water saved and benefit-to-cost ratio as economic indicators. The analysis is performed from various perspectives including the utility and community. The DSS Model was also used to forecast demands for the BAWSCA member agencies in prior planning efforts in 2004 and 2009.

1. Introduction Regional Water Demand and Conservation Projections Final Report
1-2
1.3 Collaboration between BAWSCA, Member Agencies and Santa
Clara Valley Water District
The Project was completed as a collaborative effort between the BAWSCA staff and the BAWSCA member agencies. Over the course of the Project, input was solicited from the aforementioned groups through multiple forums, including workshops, one-on-one meetings, and web-based meetings.
In addition, a conservation working group, which consisted of representatives from the Project team, BAWSCA, Santa Clara Valley Water District (SCVWD), and BAWSCA member agencies, collaborated on technical features associated with the conservation measure analysis and design. All BAWSCA member agencies were invited to participate in this group. SCVWD was invited to participate given its role as the wholesale water agency to eight member agencies and its role in implementing water conservation programs in Santa Clara County.
Each BAWSCA member agency held a critical role in the development of its individual demand and conservation projections. BAWSCA member agency roles in the Project included the submission of technical information for use in individual agency DSS Models and the review and sign-off on interim work products. More details on the involvement of the member agencies in the completion of each Project task can be found in the following sections.
1.4 Relationship to Other Planning Efforts
BAWSCA is currently developing the Long-Term Reliable Water Supply Strategy (Strategy) to identify potential cost effective projects, programs and/or additional studies to increase the water supply reliability of the BAWSCA member agencies. In September 2012 the BAWSCA Board unanimously approved the Strategy Phase IIA Report’s recommendations, including the recommendation to update the water demand and conservation projections for the BAWSCA member agencies using a common methodology. The Project results will provide critical input to the final phase of the Strategy.
In addition to providing a critical input for the Strategy, the updated demand estimates may be used by individual BAWSCA member agencies in the development of their 2015 Urban Water Management Plans (UWMPs) and 20x2020 Plans which are mandated as a result of Senate Bill X-7 (SBX 7-7) (Steinberg/Pavley).
Prior efforts have developed regional demand and conservation projections for the BAWSCA region using the DSS Model, including:
San Francisco Public Utilities Commission (SFPUC) Wholesale Customer Water Demand Projections – URS Corporation (URS) and MWM, 2004;
SFPUC Wholesale Customer Water Conservation Potential – URS and MWM, 2004;
Projected Water Usage for BAWSCA Agencies – BC / MWM, 2006; and BAWSCA Water Conservation Implementation Plan – MWM and BC, 2009.
These prior efforts proved to be a robust means to support environmental documents (e.g., the Water System Improvement Program - Program Environmental Impact Report) and conservation planning (e.g., the BAWSCA Regional Water Conservation Program and development of the BAWSCA Water Conservation Database [WCDB]).

1. Introduction Regional Water Demand and Conservation Projections Final Report
1-3
1.5 Content of Final Report
The following sections provide a summary of the content of this Report:
Section 2 –Data Collection and Verification Process
Section 3 –Demand Projections
Section 4 –Water Conservation Projections
Section 5 –Projected Regional Water Demand and Conservation Savings Results
2: Data Collection and Verification Regional Water Demand and Conservation Projections Final Report
2-1
D E V E L O P M E N T O F R E G I O N A L W A T E R D E M A N D A N D C O N S E R V A T I O N P R O J E C T I O N S F I N A L R E P O R T
2 . D A T A C O L L E C T I O N A N D V E R I F I C A T I O N P R O C E S S
The purpose of Section 2 is to document the data collection and verification process for the Project. This section describes (1) the types of data that were collected for the Project and (2) the steps taken to obtain and verify the data. The documentation and verification step was critical to the modeling process to ensure that the best available information was used to develop each member agency’s water demand and conservation savings projections.
2.1 Data Collection Process Overview
The data collection was conducted through two key methods, each of which is briefly described below. The preliminary survey was a primarily qualitative review of data from the agencies, whereas the Data Collection and Verification File (Data File) was a quantitative, data intensive spreadsheet.
2.1.1 Preliminary Survey
In April 2013, each of the BAWSCA member agencies was asked to complete a 23 question survey via Survey Monkey (an internet based electronic survey platform). The survey collected the following information:
Key agency contact(s) information for the Project
Agency’s desired objectives or results for the Project
Source of most recent water demand projections
Description of water use trends within the agency’s service area
Perspective on future water demand trends
Availability of water and sewer rate history by customer class
Billing system components and capabilities
California Urban Water Conservation Council (CUWCC) member status
Conservation target driving agency’s conservation program goals
Indications of saturation with respect to particular conservation measures
Interest in regional and individual conservation measures
Specific changes or idea of interest for conservation measures
Additional comments or questions on the project on planning process
Each member agency participated in the survey, which served as an efficient method of gathering agency feedback. The survey provided initial service-area background information, perspective on future water demand trends, agency feedback on the desired project outcomes, and initial interest in different types of conservation measures. The survey responses were also used to identify data items to include in the Data File. Two figures representing the results of this survey can be found in Appendix A. A list of the measures selected for the cost-effectiveness analysis based on this survey can be found in Appendix B.
2.1.2 Data Collection and Verification File
The Data File was developed in Microsoft Excel to collect, organize, and verify the necessary input data for the two tools in the DSS Model. The data required for the demand and conservation projections was organized into the Data Files (one per agency). This task was streamlined by populating the Data File using a variety of existing data sources

2: Data Collection and Verification Regional Water Demand and Conservation Projections Final Report
2-2
(Table 1) prior to distributing the files to the individual agencies. Each member agency was then asked to verify that the information in the Data File was accurate. A key source for existing data was the BAWSCA WCDB, which was specifically designed to capture much of the required data. Other significant data sources included BAWSCA Annual Surveys, 2010 UWMPs, Department of Water Resources Public Water System Statistics (DWR PWSS) Reports and the 2013 Association of Bay Area Governments (ABAG) Projections (population and employment forecasts).
The Data File was completed and verified by the member agencies through the following steps:
(1) Distribution of Files to Individual Agencies: The files were distributed to the individual agencies in July 2013 via the WCDB.
(2) Instructional Webinars: Webinars with the member agencies were held in July 2013 and October 2013 to disseminate information related to the data collection process to the member agencies. Each of the webinars was offered on two separate dates to maximize participation by the agencies. During the webinars, the Project team reviewed the Data File contents with the member agencies and provided instructions for completing the files.
(3) Data File Completion by Agencies: Each member agency reviewed and completed its individual Data File, which required:
o Verification of the data that was pre-populated in the file by the Project team o Data entry of missing information into the Data File as needed
(4) Data File Submission by Agencies: Agencies submitted the files via the WCDB between August and October 2013 after completing Step 3.
(5) Data File Review and Refinement: The Project team reviewed the individual data files in the order submitted. If further data and refinement were required, the Project team contacted the individual member agency to obtain the necessary information.
2.2 Types of Data Collected
Data needs of the two tools in the DSS Model drove the data collection effort. The data collected can be broadly categorized into five main categories, each of which is discussed below. The individual data elements within each category are documented in Table 1.
Service Area Data
Data including water rates and total employment (jobs) were collected to evaluate the historical growth and future growth in the service area. The service area data was used for both of the demand forecasting tools in the DSS Model and for the conservation analysis.
Service Area Demographics
Service area demographic data such as the number of dwelling units were collected from the 2010 U.S. Census data. Population sources include the 2010 UWMPs, the 2013 ABAG Projections (population and employment forecasts), WCDB, prior DSS Models, and agency provided projections. The service area demographics were used both for the econometric analysis of historical demand and also for future demand forecasting.
Economy
Data from the Bureau of Labor Statistics on historical unemployment were collected for the individual service areas (at the city level) to attempt to capture the change in work force during the period from 1995 to 2012. The economic data was used for the econometric analysis of historical water demand.

2: Data Collection and Verification Regional Water Demand and Conservation Projections Final Report
2-3
Weather
Data from the local National Oceanic and Atmospheric Administration (NOAA) weather stations closest to each individual agency was collected. Data types included temperature maximum, temperature minimum, and precipitation for the years 1995 to 2012. The weather data was used for the econometric analysis of historical water demand.
Conservation
Select conservation data from the WCDB back to 2004 was also incorporated into the econometric models. The WCDB was designed as a recommendation of the 2009 BAWSCA Water Conservation Implementation Plan (WCIP) to capture much of the required data for any future demand and conservation projections update. For the Project, the conservation data was used for the historical demand analysis, for a review of future conservation program levels of saturation, and as a benchmark of reasonable levels of implementation for future conservation programs.
Table 1. Data Collected for Member Agencies
Model Input Parameter Time Period Units Source(s)
Service Area Data
Water Production by Supply Source
1995-2012 or longer if provided
Volume Previous DSS Models
Conservation Database BAWSCA Annual Survey
2010 UWMPs DWR PWSS Reports
Consumption and Accounts
1995-2012 or longer if provided
Volume
Avoided Operational Costs
Varies $ / Volume Agency provided
Maximum Day Demand Varies Date & Volume Agency provided Capital Improvement Plans
Varies Planned Date and Volume Agency provided
Top 100 CII Users 2012 CII Type and Volume Agency provided Single Family Water Rates
1995-2012 $/Volume WCDB
Agency Provided Commercial Water Rates
1995-2012 $/Volume WCDB
Agency Provided Single Family Sewer Rates
1995-2012 $/Volume WCDB
Agency Provided Commercial Account Closures
2001-2012 Number of Closures Agency Provided
Single Family Lot Sizes 1985-2012 Sq. Ft. Agency Provided
Water System Audits 2005 to 2012 if available
NA
Agency Provided American Water Works Association (AWWA) or International Water Association
(IWA)Methodology Abnormal Years Varies Years Agency Provided Agency Info Current NA Agency Provided Contact Info Current Name, number, email Agency Provided
Planning Documents Varies NA 2010 UWMP
Agency Provided Customer Classes Varies NA Agency Provided B25033 Population in Housing Units
2010 Dwelling units 2010 US Census

2: Data Collection and Verification Regional Water Demand and Conservation Projections Final Report
2-4
Water Supply Projections
2015-2035 Volume WCDB
Service Area Demographics Historical Service Area Population
1995-2012 People Agency Provided
Projected Population 2013-2040 People
ABAG 2013 2010 UWMP
Conservation Database Prior DSS Models Agency Provided
DP-1 General Profile and Housing Characteristics
2010 Various units 2010 US Census
DP04 Selected Housing Characteristics
2010 Various units 2010 US Census
Economy
Historical Service Area Employment
1995-2012 Jobs
ABAG 2013 2010 UWMP
WCDB Prior DSS Models Agency Provided
Projected Jobs 2013-2040 Jobs ABAG 2013 DSS Models
Agency Provided
Unemployment Rates 1995-2012 % California Economic Development
Department/ US Bureau DP03 Selected Economic Characteristics
2010 Median income $ 2010 US Census
College and University Growth
2015-2022 Student, dwelling units,
facilities Agency Provided Master Plans
Weather
Historical Weather Data 1995-2012 Various units ABAG 2013
Prior DSS Models Agency Provided
Conservation
Historical Conservation 2004-2012 Various units WCDB
Prior DSS Models Agency Provided
Conservation Targets 2015, 2020 or
other GPCD CUWCC or agency provided

3: Demand Projection Analysis Regional Water Demand and Conservation Projections Final Report
3-1
D E V E L O P M E N T O F R E G I O N A L W A T E R D E M A N D A N D C O N S E R V A T I O N P R O J E C T I O N S F I N A L R E P O R T
3 . D E M A N D P R O J E C T I O N S
The purpose of Section 3 is to document the demand projections developed for the Project. This section describes (1) the demand projection analysis methodology and (2) the demand analysis results that consist of BAWSCA member agency baseline demand projections through 2040 (demand before incorporating planned water savings from future active conservation efforts).
3.1 Demand Methodology Overview
The demand projection for each BAWSCA member agency used a combination of two different tools – an Econometric Model and the DSS Model. The purpose of using two tools was to leverage the strengths of each tool to obtain the best forecast through the year 2040. The Econometric Model for each member agency was initially run outside the DSS Model. The resulting values were then incorporated into each member agency’s individual DSS Model.
The demand analysis for each agency included three distinct parts, as presented in Figure 1:
(1) Historical View: Analysis of historical data between 1995 and 2012 (or a shorter window if an agency could not provide complete data going back to 1995). The purpose of this analysis was to identify the impacts of factors such as water rates, economic conditions, and weather on water demands. Data analyzed included historical system production, water rates, weather (rainfall and temperature), employment, population, unemployment rate, and other data as approved and verified by each BAWSCA member agency.
(2) Short Term Future: Forecast of demands between 2013 through 2020 assuming normal weather, incorporating economic recovery predictions as well as water rate forecasts and population growth. Normal weather is defined as average temperature and rainfall between 1995 and 2006, corresponding roughly to the baseline that water suppliers will choose for testing compliance with SB X7-7)1. The analysis incorporated the federal government’s and local projections2 that the US economy will return to its long-term growth path by 2020, reaching a national unemployment rate of 5.2%, or roughly the average of the US unemployment rate between 1993 and 2000. The unemployment rate differs considerably across member agencies at any given point in time. However, movements in this metric for any given agency over time parallels movement in the national unemployment rate quite well. To account for the unique conditions that exist within each member agency, it was assumed that each member agency will reach an unemployment rate that reflects the average of its unemployment rate during the 1993-2000 period (for example, this average was 1.3% for Hillsborough and 8.8% for East Palo Alto). Projections of expected water rate increases and population growth that feed into these short-term forecasts come from the same source as are used for generating the long-term forecasts. These data sources are discussed later.
1 Senate Bill X7-7 (SB X7-7) or “The Water Conservation Act of 2009” was enacted to ensure California continues to have reliable water supplies, requiring urban water agencies to collectively reduce statewide per capita water use by 20% before December 31, 2020. 2 Congressional Budget Office: Testimony - The Budget and Economic Outlook: Fiscal Years 2013 to 2023 Douglas W. Elmendorf, Director Before the Committee on the Budget, United States Senate, February 12, 2013. Bay Area Council Economic Institute, Recession and Recovery: An Economic Reset, April 2010.

3: Demand Projection Analysis Regional Water Demand and Conservation Projections Final Report
3-2
(3) Long Term Future: Each agency’s long term water demand (2021-2040) was forecasted by customer category based upon forecasted increases in population and employment.
Figure 1. Demand Forecasting Methodology
3.1.1 Econometric Analysis Methodology
An Econometric Model estimates the impact of economic conditions on water demand. The model is then used to estimate, based upon historical patterns, the future rebound in demand associated with economic recovery, while also taking into account other factors such as rate increases and weather. Since the Econometric Model is calibrated using historical data, its reliability depends on historical relationships between water demand and its influencing factors remaining unchanged between the calibration and forecasting periods. Further into the future, changes in demographics, living patterns, housing stock, and industrial structure can alter these historical relationships. The DSS Model can accommodate data and assumptions reflecting how future service area and water use characteristics may differ from the past in each BAWSCA member service area. To accommodate all of these considerations, the Econometric Model was used to forecast baseline demand through 2020, and the DSS Model from 2021 through 2040.
The Econometric Model was used to project demand from 2013 to 2020. This tool was incorporated into the demand analysis to estimate the relationship between water demand and factors that may be impacting it, such as price, economic conditions, and weather.

3: Demand Projection Analysis Regional Water Demand and Conservation Projections Final Report
3-3
An Econometric Model of water demand was constructed for each BAWSCA member agency using up to 18 years of monthly production data (where available, data from 1995 through 2012 were used). Each BAWSCA member agency’s Econometric Model utilizes agency-specific data to depict economic conditions, retail water rates, population, and the impact of conservation programs implemented through the last year of the model calibration period. Weather data were assigned to each agency from the closest of one of eight NOAA stations located throughout the Bay Area. These data were submitted and verified by each BAWSCA member agency through the data collection process described in Section 2. The econometric model took each piece of agency-specific data and multiplied it by a coefficient, and the coefficients were adjusted until the modeled demand from 1995-2012 was fit to the observed agency demand during that time period. The value of the coefficients in the calibrated model estimate how significant each piece of agency data is to the calculation of water demands. Then these same relationships between the data (represented by the coefficients) are carried forward to generate future short-term future water demands. The Econometric Model and resulting regional coefficients are further described in Appendix C.
The calibrated Econometric Models were then used to generate water demand forecasts out to the year 2020. The estimated model coefficient associated with each variable included in the models, such as precipitation, temperature, water rates, and the unemployment rate, were also incorporated into individual agency DSS Models. The coefficients resulting from the econometric analysis were included in the DSS Model, so agencies could use them to project demands within the DSS Models, by selecting the “regression model” method of projecting demands.
The demands generated with the Econometric Models were reviewed and calibrated with the DSS Model to capture and reflect previous knowledge of the service area from both the 2004 and 2008 forecasting projects. The DSS Model was then used to generate water demands from 2021-2040. This process generated one complete model for each agency with data between 2013 and 2040. A flow diagram of the econometric modeling process is presented in Figure 2 below.
Figure 2. BAWSCA Econometric Model Flow Diagram
For each BAWSCA member agency, the econometric analysis estimated the relative impact of various factors on water demand. A more detailed description of the Econometric Modeling framework can be found in Appendix C.

3: Demand Projection Analysis Regional Water Demand and Conservation Projections Final Report
3-4
3.1.2 DSS Model Methodology
For the long-term projections (2021 through 2040), the DSS Model was used to forecast water demand for each BAWSCA member agency. The DSS Model also includes a conservation component that quantifies savings from passive conservation (e.g. plumbing codes) and active conservation programs. The DSS Model’s conservation component covers the entire forecast period, 2013-2040. Quantification of savings potential from active conservation programs is presented in Section 4.
The DSS Model prepares long-range, water demand and conservation water savings projections. The DSS Model is an end-use model that breaks down total water production (i.e., water demand in the service area) into specific water end uses such as (e.g., toilets, faucets, or irrigation). This “bottom-up” approach allows for detailed criteria to be considered when estimating future demands, such as the effects of natural fixture replacement, plumbing codes, and conservation efforts. The purpose of using end use data is to enable a more accurate assessment of the impact of water efficiency programs on demand and to provide a rigorous and defensible modeling approach necessary for projects subject to regulatory or environmental review.
Section 3 of this report presents the DSS Model’s demand estimates taking into account savings only from passive conservation. Passive conservation refers to water savings resulting from customer actions and activities that do not depend on direct assistance from water agency conservation programs. This includes water savings resulting from 1) the natural replacement of existing plumbing fixtures with water-efficient models required under current plumbing code standards and 2) the installation of water-efficient fixtures in new buildings and retrofits as required under CalGreen Building Code Standards. Quantification of water savings from active conservation programs is presented in Section 4.
Figure 3. BAWSCA DSS Model Flow Diagram

3: Demand Projection Analysis Regional Water Demand and Conservation Projections Final Report
3-5
As shown in Figure 3, the first step for forecasting water demands using the DSS Model was to gather customer category billing data from each BAWSCA member agency. The next step was to check the model by comparing water use data with available demographic data to characterize water usage for each customer category (single family, multifamily, commercial, industrial, and institutional) in terms of number of users per account and per capita water use. During the model calibration process data were further analyzed to approximate the indoor/outdoor split by customer category. The indoor/outdoor water usage was also further divided into typical end uses for each customer category. Published data on average per-capita indoor water use and average per-capita end use were combined with the number of water users to verify that the volume of water allocated to specific end uses in each customer category is consistent with social norms from end use studies on water use behavior (e.g., for flushes per person per day).
3.1.3 Agency Input and Review
As part of the Project’s collaborative approach, instructional webinar conference calls and a Demands Workshop were held to facilitate BAWSCA member agency understanding of and involvement in the development of the demand projections:
Instructional Webinars: Webinars with the member agencies were held in October 2013 and November 2013 to disseminate information related to demand forecasting and econometric modeling methodology. Webinars were offered on two separate dates to maximize participation by the agencies. During the webinars, the Project team reviewed the methodology using a real example with preliminary results from one of the BAWSCA agencies.
Demands Workshop: On March 11, 2014 a workshop was held for BAWSCA agencies to (1) review the demand modeling approach and results and to (2) answer agency questions.
Agencies had the opportunity to review the demand modeling results and to provide questions and comments at the Demands Workshop and via agency coordination with the Project team. In addition, individual meetings were held between MWM modeling staff, BAWSCA staff and BAWSCA member agency representatives to review the draft demand projections in March 2014.
3.2 Future Population and Employment
Each agency’s future population and employment projections were incorporated into each DSS Model to project future demand. Population and employment projections through 2040 were confirmed by each BAWSCA member agency through the data collection process described in Section 2. These growth projections were used to develop a projected demand for the years 2021 to the year 2040. Population projections were obtained from one of the following sources: Plan Bay Area - ABAG Projections 2013, individual agency 2010 UWMPs, California Department of Finance, the United States Census Bureau, or agency planning documents. Figure 4 presents the BAWSCA service area population and employment projections.

3: Demand Projection Analysis Regional Water Demand and Conservation Projections Final Report
3-6
Figure 4. Historical and Projected Population and Employment
3.3 Baseline Water Demand Projections
The Econometric Model and DSS Model were used to generate baseline water demand projections (demands before active conservation savings) for each BAWSCA member agency. As previously described, the Econometric Model generated water demand projections for the years 2013 to 2020 and the DSS Model generated water demand projections for the years 2021 to 2040. Figure 5 presents the BAWSCA service area baseline demand projections through 2040.

3: Demand Projection Analysis Regional Water Demand and Conservation Projections Final Report
3-7
Figure 5. BAWSCA Region Wide Baseline Demands to 2040
Demand projections with plumbing code savings for each BAWSCA member agency through 2040 can be found in Section 5. More details on the estimated impacts on historical water demands of the factors identified in the econometric analysis can be found in Appendix C.

4: Water Conservation Savings Regional Water Demand and Conservation Projections Final Report
4-1
D E V E L O P M E N T O F R E G I O N A L W A T E R D E M A N D A N D C O N S E R V A T I O N P R O J E C T I O N S F I N A L R E P O R T
4 . W A T E R C O N S E R V A T I O N S A V I N G S P R O J E C T I O N S
The purpose of this section is to document the conservation savings projections for each BAWSCA member agency and for the BAWSCA region as a whole. This section describes the conservation analysis methodology and results.
4.1 Conservation Analysis Goals and Objectives
The Project included two goals related to water conservation: (1) to define how much conservation can reasonably contribute to more supply reliability for all BAWSCA member agencies and (2) to incorporate projected conservation savings into the demand projections for each agency. Pursuant to this goal, the specific objectives of the conservation analysis for the Project were:
Assist BAWSCA member agencies in evaluating the potential water savings and cost-effectiveness associated with implementing a variety of existing and potential new water conservation measures;
Determine the projected water savings from 2015 through 2040 associated with implementing a selected suite of new conservation measures;
Determine which entity (e.g., BAWSCA, the member agencies, or SCVWD) should implement each conservation measure or program, and when the program should be implemented in order to achieve the specified water savings goals.
To develop demand forecasts for each agency that account for conservation from both passive (future code and standards) and active conservation programs, the individual agency DSS Models were designed to (1) account for passive conservation savings projected through 2040 and (2) analyze potential savings from a variety of water use efficiency measures to facilitate the development of individual agency conservation savings estimates through 2040.
Each BAWSCA member agency’s individual conservation water savings goal was provided by the agency during the data collection process described in Section 2. The basis for the individual agency goals varied from board adopted policies to SB X7-7 targets to CUWCC compliance. An explanation of BAWSCA member agency conservation target setting process and goals can be found in Appendix D.
4.1.1 Conservation Analysis Methodology
The conservation savings projections were developed through a 10-step process presented in Figure 6 and described below.
4: Water Conservation Savings Regional Water Demand and Conservation Projections Final Report
4-2
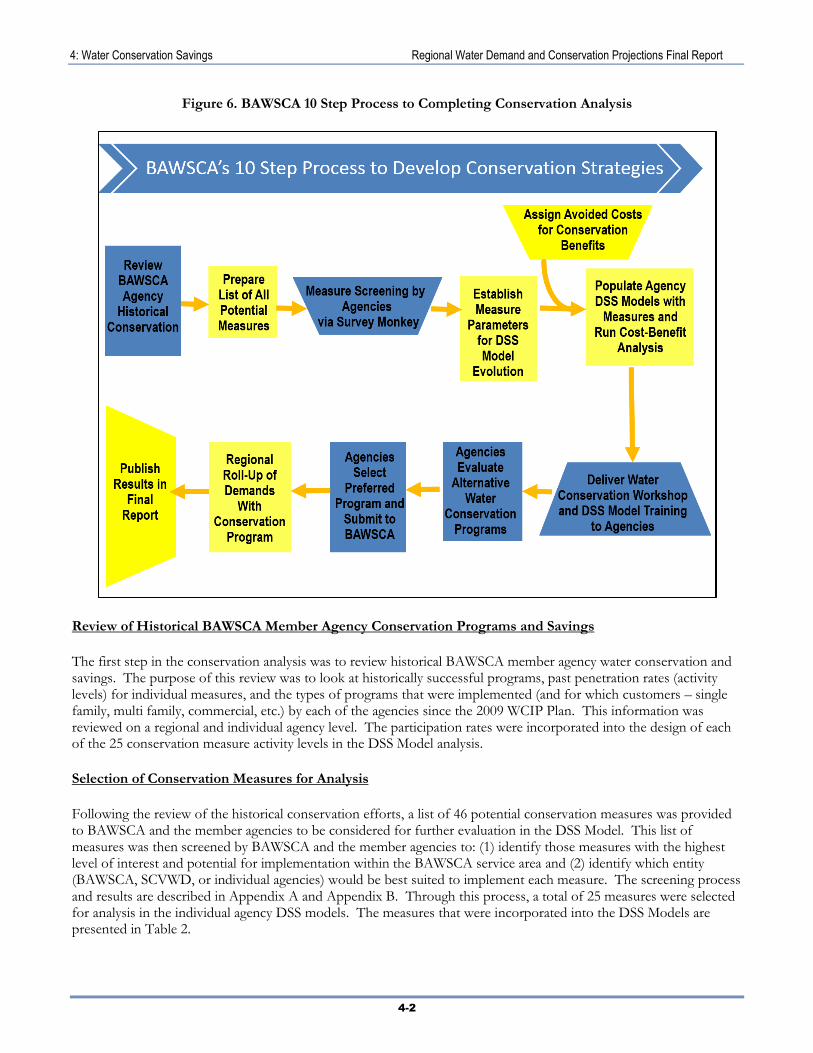
Figure 6. BAWSCA 10 Step Process to Completing Conservation Analysis
Review of Historical BAWSCA Member Agency Conservation Programs and Savings
The first step in the conservation analysis was to review historical BAWSCA member agency water conservation and savings. The purpose of this review was to look at historically successful programs, past penetration rates (activity levels) for individual measures, and the types of programs that were implemented (and for which customers – single family, multi family, commercial, etc.) by each of the agencies since the 2009 WCIP Plan. This information was reviewed on a regional and individual agency level. The participation rates were incorporated into the design of each of the 25 conservation measure activity levels in the DSS Model analysis.
Selection of Conservation Measures for Analysis
Following the review of the historical conservation efforts, a list of 46 potential conservation measures was provided to BAWSCA and the member agencies to be considered for further evaluation in the DSS Model. This list of measures was then screened by BAWSCA and the member agencies to: (1) identify those measures with the highest level of interest and potential for implementation within the BAWSCA service area and (2) identify which entity (BAWSCA, SCVWD, or individual agencies) would be best suited to implement each measure. The screening process and results are described in Appendix A and Appendix B. Through this process, a total of 25 measures were selected for analysis in the individual agency DSS models. The measures that were incorporated into the DSS Models are presented in Table 2.

4: Water Conservation Savings Regional Water Demand and Conservation Projections Final Report
4-3
Table 2. Water Use Efficiency Measure Descriptions
Measure Name Description
Water Loss Control Program
Maintain a thorough annual accounting of water production, sales by customer class and quantity of water produced but not sold (non-revenue water). In conjunction with system accounting, include audits that identify and quantify known legitimate uses of non-revenue water in order to determine remaining potential for reducing water losses. Goal is to lower the Infrastructure Leakage Index (ILI) and non-revenue water every year by a pre-determined amount based on cost-effectiveness. These programs typically pay for themselves based on savings in operational costs (and saved rate revenue can be directed more to system repairs/replacement and other costs). Specific goals and methods to be developed by Utility. May include accelerated main and service line replacement. Enhanced real loss reduction may include more ambitious main replacement and active leak detection. Capture water from water main flushing and hydrant flow testing for reuse.
Metering with Advanced Metering Infrastructure (AMI) benefits to Conservation
Retrofit system with AMI meters and associated network capable of providing continuous consumption data to Utility offices. Improved identification of system and customer leaks is major conservation benefit. Some of costs of these systems are offset by operational efficiencies and reduced staffing, as regular meter reading and those for opening and closing accounts are accomplished without need for physical or drive-by meter reading. Also enables enhanced billing options and ability to monitor unauthorized usage (such as use/tampering with closed accounts or irrigation if time of day or days per week are regulated). Customer service is improved as staff can quickly access continuous usage records to address customer inquiries. Optional features include online customer access to their usage, which has been shown to improve accountability and reduce water use. A ten year change-out would be a reasonable objective. Require that new customers install such AMI meters as described above and possibly purchase means of viewing daily consumption inside their home/business either through the Internet (if available) or separate device. The AMI system would, on demand, indicate to the customer and Utility where and how their water is used, facilitating water use reduction and prompt leak identification. This would require Utility to install an AMI system. Require that larger or irrigation customers install such AMI meters as described above and possibly purchase means of viewing daily consumption by landscape/property managers, or business either through the Internet (if available) or separate device. The AMI system would, on demand, indicate to the customer and Utility where and how their water is used, facilitating water use reduction and prompt leak identification. This would require Utility to install an AMI system.
Mobile Home Park and New and Existing Residential Multi-Family (RMF) Submetering
Require or provide a partial cost rebate to meter all remaining mobile home parks that are currently master metered but not separately metered. Pattern after SCVWD program. Provide a rebate (per unit) to assist RMF building owners installing submeters on each existing individual apartment or condominium unit. Provide a rebate (per unit) to assist MF building owners installing submeters on each new individual apartment unit. Require the submetering of individual units in new multi-family, condos, townhouses, and mobile-home parks.

4: Water Conservation Savings Regional Water Demand and Conservation Projections Final Report
4-4
Measure Name Description
Conservation Pricing (incremental behavioral change – most savings counted as device changes)
Consider revising Utility's tiered rates or seasonal pricing for other customer classes. Some utilities utilize percentages of average winter usage as the basis for individualized summer tiers. MF Residential tiers could be based on number of housing units served by meters. This measure would require a rate study and advanced billing system capabilities.
Consider developing a separate billing category for individually metered apartments and multi‐family residences.
Agency Public Information & Program Administration (added to BAWSCA)
Continue with a regional campaign. May modify to be a general “Use Only What You Need” message like Denver Water's program or a “Beat the Peak” message media campaign like Cary, North Carolina or Tucson Arizona: http://cms3.tucsonaz.gov/water/beatthepeak. Also considered a program with focused action like: “Take Control of your Controller” Campaign for a focused social media based campaign as a media campaign. Consider determining appropriate usage and media campaign message with marketing study/focus groups. Utility would sponsor bilingual training for managers and workers in landscape maintenance methods that will save irrigation water. Model after Green Gardener Program. Santa Barbara County Water Agency example: http://www.greengardener.org. With some of these programs, names of businesses that have obtained training are included in Utility publications and/or Web sites (as an incentive to participate).
Home Water Use Reports Home Water Use Reports would provide insights for single family home customers on their water use compared to similar households and promote customer programs.
School Education School assembly program, classroom presentations, and other options for school education. Measure based on the Resource Action Program WaterWise School Program.
Single Family and MF Water Surveys
Indoor water surveys for existing single family residential customers. Target those with high water use and provide a customized report to owner. May include give-away of efficient shower heads, aerators, and toilet devices. Usually combined with outdoor surveys (See Irrigation Measures). Indoor water surveys for existing MF residential customers (2 units or more). Target those with high water use and provided a customized report to owner. Usually combined with outdoor surveys (see Irrigation Measures) and sometimes with single family surveys. Customer leaks can go uncorrected at properties where owners are least able to pay costs of repair. These programs may require that customer leaks be repaired, but either subsidize part of the repair and/or pay the cost with revolving funds that are paid back with water bills over time. May also include an option to replace inefficient plumbing fixtures at low-income residences. Provide incentive to install pressure regulating valve on existing properties with pressure exceeding 80 psi.
Water Sense Fixtures Giveaway Utility would buy showerheads and faucet aerators in bulk and give them away at Utility office or community events. Need to coordinate this program with the School Education measure on retrofit kit giveaways to the same customer categories.
High Efficiency (HE) Clothes Washer SF MF Rebate
Provide a rebate for efficient washing machines to single family homes and apartment complexes that have common laundry rooms. It is assumed that the rebates would remain consistent with relevant state and federal regulations (Department of Energy, Energy Star) and only offer the best available technology. This program would be similar the BAWSCA's current program.
Ultra-High-Efficiency Toilet (UHET) SF/MF Rebates
Provide a rebate or voucher for the installation of an UHET. (Toilets flushing 1.28 gpf or less and include dual flush technology). Rebate amounts would reflect the incremental purchase cost.

4: Water Conservation Savings Regional Water Demand and Conservation Projections Final Report
4-5
Measure Name Description
“Lawn Be Gone” SF Landscape Conversion/Turf Removal
Provide a per square foot incentive for to remove turf and replace with low water use plants or permeable hardscape. Rebate based on dollars per square foot removed, and capped at an upper limit for single family residence.
Weather Based Irrigation Controllers (WBICs) Giveaway Program (and Classes) SF
Provide a per station rebate (i.e., $25 per station) for the purchase of a weather based irrigation controller. These controllers have on-site weather sensors or rely on a signal from a central weather station that modifies irrigation times at least weekly. Requires local irrigation contractors who are competent with these products, so may require sponsoring a training program in association with this measure.
Small Irrigation Hardware Incentives (Drip Irrigation and Rain Sensors)
Provide a rebate or free rain sensor shut-off device for existing irrigation controllers. These cancel scheduled sprinkling when sufficient rain has been received. This measure is most effective in areas with intermittent rain in peak watering seasons. Require installation of rain sensor shut-off devices when installing new irrigation systems. Offer drip conversion kits (RainBird 1800 Retro). Potentially model after Western MWD's pilot.
Gray Water Retrofits SF Rebate Provide a rebate to assist a certain percentage of single family homeowners per year to install gray water systems.
Water Conserving Landscape & Codes (not including WBICs and turf removal) SF MF CII
Develop and enforce Water Efficient Landscape Design Standards. Standards specify that development projects subject to design review be landscaped according to climate appropriate principals, with appropriate turf ratios, plant selection, efficient irrigation systems and smart irrigation controllers. There are many examples that have demonstrated significant water savings. The ordinance could require certification of landscape professionals.
Customized Top Users Survey & Incentive Program & CII Rebates for Inefficient Equipment
Top water customers from each category would be offered a professional water survey that would evaluate ways for the business to save water and money. The surveys would be for large accounts (such as, accounts that use more than 5,000 gallons of water per day) such as hotels, restaurants, stores and schools. Emphasis will be on supporting the top users for each customer category. After the free water use survey has been completed at site, the Utility will analyze the recommendations on the findings report that is provided and determine if site qualifies for a financial incentive. Financial incentives will be provided after analyzing the cost benefit ratio of each proposed project. Incentives are tailored to each individual site as each site has varying water savings potentials. Incentives will be granted at the sole discretion of the Utility while funding lasts. Program to provide rebates for a standard list of water efficient equipment. Included would be x-ray machines, icemakers, air-cooled ice machines, steamers, washers, spray valves, efficient dishwashers, replace once through cooling, and add conductivity controller on cooling towers. Pattern after Southern Nevada Water Authority, East Bay Municipal Utilities District (EBMUD) or Seattle Water Department programs.
HE Clothes Washer CII Rebate Provide a rebate for the installation of a high efficiency commercial washer (HEW). Rebate amounts would reflect the incremental purchase cost. Program will be shorter lived as it is intended to be a market transformation measure and eventually would be stopped as efficient units reach saturation.
HET CII Rebates Provide a rebate or voucher for the installation of a high efficiency toilet (HET). Toilets flushing 1.28 gpf or less and include dual flush technology. Rebate amounts would reflect the incremental purchase cost.

4: Water Conservation Savings Regional Water Demand and Conservation Projections Final Report
4-6
Measure Name Description
HE Urinal CII Rebates Provide a rebate or voucher for the installation of a high efficiency urinals. WaterSense standard is 0.5 gpf or less, though models flushing as low as 0.125 gpf (1 pint) are available and function well, so could be specified. Rebate amounts would reflect the incremental purchase cost about $300.
Focused School Retrofit Program
School retrofit program wherein school receives a grant to replace fixtures and upgrade irrigation systems. Consider patterning after other programs. One example is EBMUD's program.
Outdoor Water Audit – Large Landscape
Outdoor water audits offered for existing large landscape customers. Normally those with high water use are targeted and provided a customized report on how to save water. All large multi-family residential, CII, and public irrigators of large landscapes would be eligible for free landscape water audits upon request. Tied to the WaterFluence Budget Program.
Landscape Water Budgets/Monitoring- Large Landscape Dedicated Meters & Mixed Use Conversion
Website that provides feedback on irrigation water use (budget vs. actual). Current WaterFluence Program. May include the cost for dedicated meter conversion.
“Lawn Be Gone” MF CII Large Landscape Landscape Conversion/Turf Removal
Provide a per square foot incentive for to remove turf and replace with low water use plants or hardscape. Rebate is based on price per square foot removed, and capped at an upper limit for multi-family or commercial residence.
WBICs Incentive Program (more money) MF CII Large Landscape
Provide a per station rebate (i.e. $25 per station) for the purchase of a weather based irrigation controller. These controllers have on-site weather sensors or rely on a signal from a central weather station that modifies irrigation times at least weekly. Requires local irrigation contractors who are competent with these products, so may require sponsoring a training program in association with this measure.
Rotating Sprinkler Nozzle Incentive Program SF MF CII Large Landscape
Provide rebates to replace standard spray sprinkler nozzles with rotating nozzles that have lower application rates. Nozzles cost about $6 and rebates have been on the order of $4 with a minimum purchase of about 20 nozzles. Current SCVWD program.

4: Water Conservation Savings Regional Water Demand and Conservation Projections Final Report
4-7
Conservation Measure Design
Following the selection of the 25 conservation measures for the DSS Model, design parameters for each measure were developed for inclusion in the model. The design parameters were developed through a collaborative effort in which information was compiled and reviewed by a Conservation Subcommittee which consisted of participants from Project Team, BAWSCA, SCVWD, and individual agencies.
The design parameters for each conservation measure included the following:
Voluntary, incentive or required of customers (ordinance)
Applicable and specific customer classes
Applicable and specific end uses
Market penetration annually and by the end of the measure (and if only new accounts were affected)
Water use reductions for targeted end uses
Program implementation length
Measure life (how long the measure affects water savings – some permanently)
Hot water savings
Utility costs and customer costs by customer category
Annual utility administration and marketing costs per measure
Number of fixtures or units per account
The following assumptions were used in designing the model parameters for each conservation measure:
Historical BAWSCA data were used in cases when the measure was already in existence.
SCVWD data were used to design BAWSCA-led measures in cases where SCVWD is a currently running a comparable measure.
Design of individual “agency measures” and their parameter values came from a Conservation Subcommittee of BAWSCA member agencies.
Other industry data and knowledge was incorporated when local data was not available.
New measures were designed with an implementation schedule reflecting dates sometime in the future when BAWSCA member agencies or BAWSCA might begin such programs.
Measure Analysis and Conservation Program Selection
The 25 conservation measures were incorporated into each agency’s DSS Model for cost-benefit analysis (described below) and selection of a conservation program to meet the agency’s goals. Included in each agency’s DSS Model was a list of measures in each of three alternative conservation programs (Programs A, B, and C), which were designed to illustrate a range of various measure combinations and resulting water savings. Four key items were taken into consideration during measure selection for Programs A, B and C:
Existing agency water use efficiency measures;
Programs run by BAWSCA (with consideration for SCVWD programs);
Measures focused on Programmatic BMP defined by the CUWCCs Memorandum of Understanding if the individual agency had reported on a measure ; and
New and innovative measures.
These programs are not intended to be rigid frameworks but rather to demonstrate the range in savings that could be generated if selected measures were run together. For many of the BAWSCA member agencies, the three Program scenarios are organized as follows:

4: Water Conservation Savings Regional Water Demand and Conservation Projections Final Report
4-8
Program A: “Existing Program” option includes the measures that the agency currently offers.
Program B: “Enhanced Program” includes all measures in Program A plus those additional measures that are both cost-effective and save significant amounts of water. Key benchmarks for the proposed strategies include: 1) cost-effectiveness, 2) compliance with CUWCC’s BMPs, 3) ability to help achieve water use reduction targets by 2020 (SBX7-7) if applicable for the individual agency, and 4) feedback from BAWSCA member agency customers.
Program C: “All Measures Analyzed” presents a scenario where all 25 measures are implemented. Though it is unlikely that a member agency would elect to implement all the measures, this program offers the opportunity to explore what the water savings (and costs) would potentially be should such an extensive conservation program be pursued.
Each BAWSCA member agency’s DSS Model presented estimated average per capita per day savings with the plumbing codes only, and each of the alternative programs (Program A, B, and C). Plumbing code includes current state and federal standards (including CalGreen, Senate Bill 407 and Assembly Bill 715) for items such as toilets, showerheads, faucets, pre-rinse spray valves. SB 407 and AB 715 require the replacement of non-water conserving plumbing fixtures with water-conserving fixtures.
Each BAWSCA member agency was provided a copy of its DSS Model to review the conservation program options, tailor the programs to meet its needs, and select the program that fit its individual water savings goals and budgets. The reasons that each member agency selected a particular suite of measures varied and included:
Measure cost-effectiveness to agency
Applicability to service area
Amount of water savings generated
Cost to agency
Ease of implementation for agency and staffing required
Whether the measure was being run by BAWSCA or SCVWD
Local preferences
4.1.2 Perspectives on Benefits and Costs
The determination of the economic feasibility of water use efficiency programs involves comparing the costs of the programs to the benefits provided. This cost effectiveness analysis was performed by using the DSS Model. The DSS Model calculates savings at the end-use level; for example, the model determines the amount of water a toilet rebate program saves in daily toilet use for each single family account. Additional detail on the DSS Model and assumptions can be found in Appendix E and the DSS Model User Manual.
Appendix F presents generic starting value measure assumptions used as means for each agency to tailor its DSS Model to evaluate the potential water use efficiency measures. BAWSCA member agencies had the option to select or unselect any measure for implementation. Assumptions were made for the following variables incorporated into the DSS Model. Each member agency then updated the measures in its individual DSS Model as appropriate to reflect its own customer base and program needs.
Targeted Water User Group End Use: Water user group (e.g., single-family residential) and end use (e.g., indoor or outdoor water use).
Utility Unit Cost: Cost of rebates, incentives, and contractors hired by BAWSCA and BAWSCA member agencies to implement measures.
Retail Customer Unit Cost: Cost for implementing measures that is paid by retail customers (i.e., remainder of a measure’s cost that is not covered by a rebate or incentive).
Utility Administration and Marketing Cost: The cost to the utility for staff time, general expenses and overhead needed to implement and administer the measure, including consultant contract administration,

4: Water Conservation Savings Regional Water Demand and Conservation Projections Final Report
4-9
marketing, and participant tracking. The unit costs vary greatly according to the type of customer and implementation method. For example, a measure might cost a different amount for a single-family account than a multi-family account. Rebate program costs are different than costs to develop and enforce an ordinance requirement or a direct installation program. Typically, water utilities incur increased costs with achieving higher market saturation, such as more surveys per year. The model calculates the annual costs based on the number of participants each year. The general formula for calculating annual utility costs is:
Annual Utility Cost = Annual market penetration rate x total accounts in category x unit cost per account x (1+administration and marketing markup percentage)
Annual Customer Cost = Annual number of participants x unit customer cost
Annual Community Cost = Annual utility cost + annual customer cost
4.2 Comparison of Individual Conservation Measures
The cost-effectiveness of each individual water use efficiency measure without the interaction or overlap from other measures that might address the same end use(s) can be found in each BAWSCA member agency’s DSS Model. Cost-effectiveness is calculated by evaluating how much water the measures would save by the year 2040, how much they would cost, and the cost of water saved per unit volume if the measures were implemented on a stand-alone basis without interaction or overlap from other measures that might address the same end use(s). Savings from measures which address the same end use(s) are not directly additive. The model uses impact factors to avoid double counting in estimating the water savings from programs of measures. For example, if two measures are planned to address the same end use and both save 10% of the prior water use, then the net effect is not the simple sum (20%). Rather it is the cumulative impact of the first measure reducing the use to 90% of what it was without the first measure in place and then reducing the use another 10% to result in the use being 81% of what it was originally. In this example the net savings is 19%, not 20%. Using impact factors, the model computes the reduction as follows: 0.9 x 0.9 = 0.81 or 19% water savings.
Cost categories are defined below:
Utility Costs: Those costs that a BAWSCA member agency would incur to operate the conservation program measure, including administrative costs.
Utility Benefits: The avoided cost of producing water at an identified rate specified in a BAWSCA member agency’s DSS Model; equivalent to their average cost of water for the period from 2013 to 2040. Note that the actual avoided cost of water could be much higher; equivalent to the highest cost of alternative water supplies.
Relevant definitions to the conservation measure analysis are as follows:
Present Value (PV) of Utility Costs and Benefits ($) = the present value of the 27-year time stream of annual costs or benefits (2013 to 2040), discounted to the base year.
Utility Benefit to Cost Ratio = PV of Utility Benefits divided by PV of Utility Costs.
Cost of Water Saved per Unit Volume ($/AF) = PV of Water Utility Costs over 27 years divided by the 27-Year Volume of Water Savings. This value is compared to the utility’s avoided cost of water as one indicator of the cost effectiveness of water use efficiency efforts. It should be noted that the value somewhat undervalues the cost of water saved because program costs are discounted to present value and the annual water savings are not.

4: Water Conservation Savings Regional Water Demand and Conservation Projections Final Report
4-10
4.3 Conservation Savings Results
The following demand scenarios were analyzed: (1) BAWSCA-regional water demand projections with no plumbing code savings; and (2) BAWSCA regional water demand projections with plumbing code savings; and (3) BAWSCA regional water demand projections with the plumbing code savings and BAWSCA member agency-selected active conservation measure savings.
Figure 7 presents the combined BAWSCA region-wide water demand projections for each of the three scenarios. Total water demand is defined as total water consumption plus unaccounted-for water. Water consumption is defined as water delivered to individual customers for use.
Figure 7. BAWSCA Region Wide Baseline Demands with Active Conservation Savings to 2040
One of the objectives of the Project was to identify conservation measures for further consideration for BAWSCA regional implementation. Table 3 presents the number of BAWSCA member agencies that selected each measure as part of their planned conservation programs.
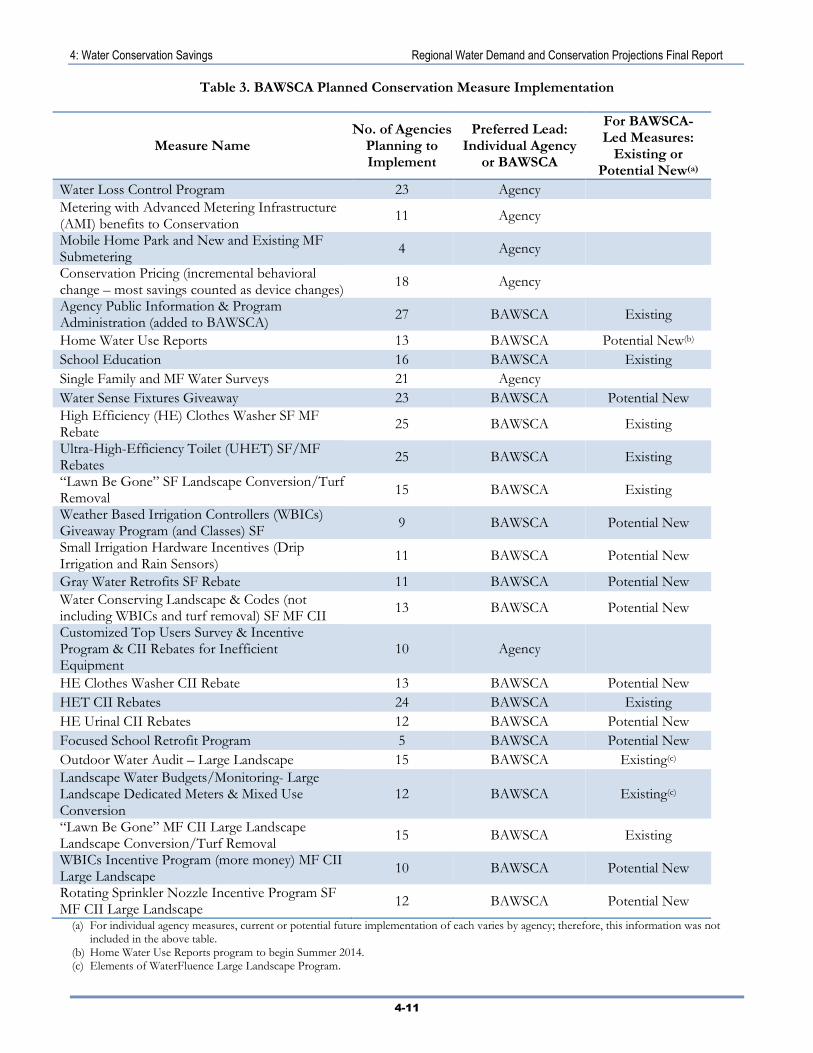
4: Water Conservation Savings Regional Water Demand and Conservation Projections Final Report
4-11
Table 3. BAWSCA Planned Conservation Measure Implementation
Measure Name No. of Agencies
Planning to Implement
Preferred Lead: Individual Agency
or BAWSCA
For BAWSCA-Led Measures:
Existing or Potential New(a)
Water Loss Control Program 23 Agency
Metering with Advanced Metering Infrastructure (AMI) benefits to Conservation
11 Agency
Mobile Home Park and New and Existing MF Submetering
4 Agency
Conservation Pricing (incremental behavioral change – most savings counted as device changes)
18 Agency
Agency Public Information & Program Administration (added to BAWSCA)
27 BAWSCA Existing
Home Water Use Reports 13 BAWSCA Potential New(b)
School Education 16 BAWSCA Existing
Single Family and MF Water Surveys 21 Agency
Water Sense Fixtures Giveaway 23 BAWSCA Potential New
High Efficiency (HE) Clothes Washer SF MF Rebate
25 BAWSCA Existing
Ultra-High-Efficiency Toilet (UHET) SF/MF Rebates
25 BAWSCA Existing
“Lawn Be Gone” SF Landscape Conversion/Turf Removal
15 BAWSCA Existing
Weather Based Irrigation Controllers (WBICs) Giveaway Program (and Classes) SF
9 BAWSCA Potential New
Small Irrigation Hardware Incentives (Drip Irrigation and Rain Sensors)
11 BAWSCA Potential New
Gray Water Retrofits SF Rebate 11 BAWSCA Potential New
Water Conserving Landscape & Codes (not including WBICs and turf removal) SF MF CII
13 BAWSCA Potential New
Customized Top Users Survey & Incentive Program & CII Rebates for Inefficient Equipment
10 Agency
HE Clothes Washer CII Rebate 13 BAWSCA Potential New
HET CII Rebates 24 BAWSCA Existing
HE Urinal CII Rebates 12 BAWSCA Potential New
Focused School Retrofit Program 5 BAWSCA Potential New
Outdoor Water Audit – Large Landscape 15 BAWSCA Existing(c)
Landscape Water Budgets/Monitoring- Large Landscape Dedicated Meters & Mixed Use Conversion
12 BAWSCA Existing(c)
“Lawn Be Gone” MF CII Large Landscape Landscape Conversion/Turf Removal
15 BAWSCA Existing
WBICs Incentive Program (more money) MF CII Large Landscape
10 BAWSCA Potential New
Rotating Sprinkler Nozzle Incentive Program SF MF CII Large Landscape
12 BAWSCA Potential New
(a) For individual agency measures, current or potential future implementation of each varies by agency; therefore, this information was not included in the above table.
(b) Home Water Use Reports program to begin Summer 2014. (c) Elements of WaterFluence Large Landscape Program.
4: Water Conservation Savings Regional Water Demand and Conservation Projections Final Report
4-12
4.4 Agency Input and Review
As part of this Project’s collaborative approach, an initial webinar was held to facilitate the selection of conservation measures for analysis in the DSS Model, followed by two surveys conducted in April 2013 and December 2013 to solicit feedback on which conservation measures BAWSCA member agencies wanted to consider as part of the DSS Model’s conservation analysis.
A Conservation Workshop was held on May 19, 2014 to facilitate BAWSCA member agency understanding of and involvement in the conservation program analysis in the DSS Model. During this five hour workshop, each BAWSCA member agency was provided a copy of its model and received instruction on how to make adjustment to the conservation measures and program options.
Following the Conservation Workshop, BAWSCA member agencies were provided an opportunity to review the preliminary conservation analysis results and to incorporate additional conservation program information into the model. Some agencies elected to modify their model with BAWSCA representatives. Following agency review, each agency submitted a revised model with its selected conservation program to the Project team for final review. The conservation savings associated with the selected program were then used to develop each agency’s demand projections with active conservation savings.
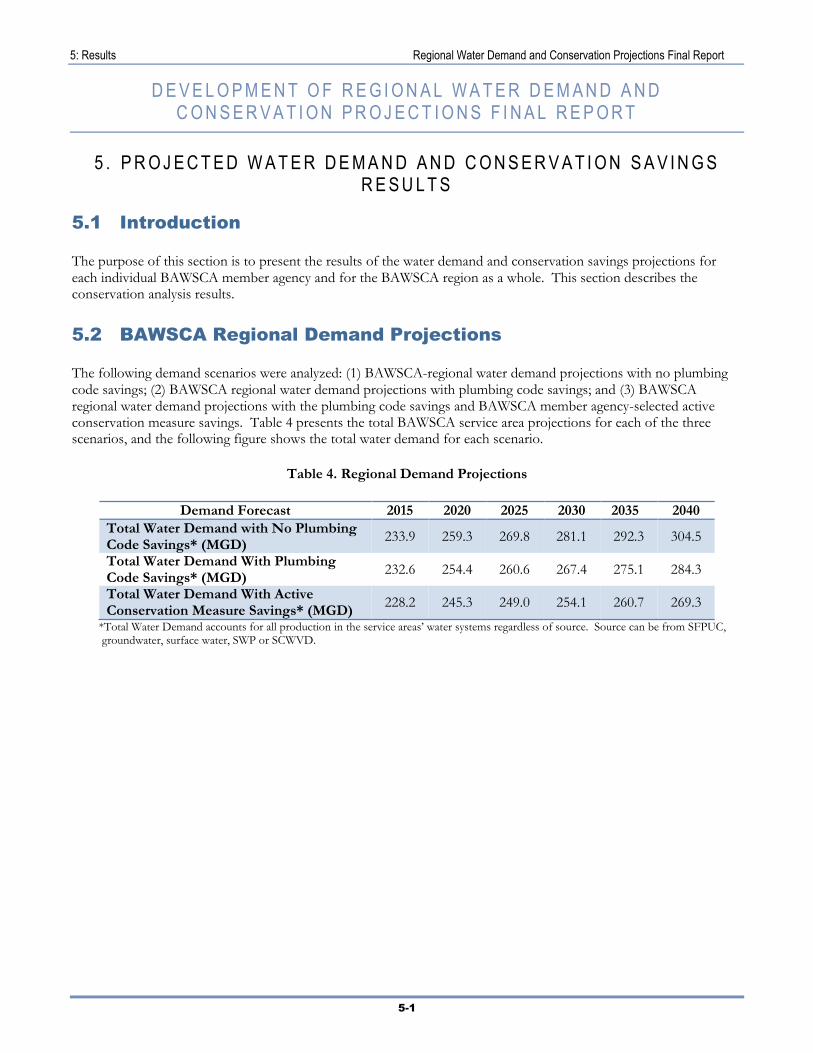
5: Results Regional Water Demand and Conservation Projections Final Report
5-1
D E V E L O P M E N T O F R E G I O N A L W A T E R D E M A N D A N D C O N S E R V A T I O N P R O J E C T I O N S F I N A L R E P O R T
5 . P R O J E C T E D W A T E R D E M A N D A N D C O N S E R V A T I O N S A V I N G S R E S U L T S
5.1 Introduction
The purpose of this section is to present the results of the water demand and conservation savings projections for each individual BAWSCA member agency and for the BAWSCA region as a whole. This section describes the conservation analysis results.
5.2 BAWSCA Regional Demand Projections
The following demand scenarios were analyzed: (1) BAWSCA-regional water demand projections with no plumbing code savings; (2) BAWSCA regional water demand projections with plumbing code savings; and (3) BAWSCA regional water demand projections with the plumbing code savings and BAWSCA member agency-selected active conservation measure savings. Table 4 presents the total BAWSCA service area projections for each of the three scenarios, and the following figure shows the total water demand for each scenario.
Table 4. Regional Demand Projections
Demand Forecast 2015 2020 2025 2030 2035 2040
Total Water Demand with No Plumbing Code Savings* (MGD)
233.9 259.3 269.8 281.1 292.3 304.5
Total Water Demand With Plumbing Code Savings* (MGD)
232.6 254.4 260.6 267.4 275.1 284.3
Total Water Demand With Active Conservation Measure Savings* (MGD)
228.2 245.3 249.0 254.1 260.7 269.3
*Total Water Demand accounts for all production in the service areas’ water systems regardless of source. Source can be from SFPUC, groundwater, surface water, SWP or SCWVD.

5: Results Regional Water Demand and Conservation Projections Final Report
5-2
Figure 8. BAWSCA Region Wide Demand Projections to 2040

5: Results Regional Water Demand and Conservation Projections Final Report
5-3
5.3 Population and Employment Projections Summary
Table 5 presents the population projections that were utilized for each agency and BASCWA’s region-wide population and employment projections. Table 6 presents the BAWSCA region-wide historical and projected population and employment
Table 5. BAWSCA Member Agency Population Projections
Service Areas Projection Source 2015 2020 2025 2030 2035 2040
Alameda County Water District
2013 ACWD forecast "Reliability Design"
IRP Report" 338,713 350,725 361,570 372,297 385,289 415,637
Brisbane/GVMID ABAG 2013 Subregional
4,394 4,509 4,632 4,761 4,906 5,056
Burlingame, City of 2010 UWMP 32,993 34,051 35,009 36,051 37,104 39,530
CWS - Bear Gulch District
2010 UWMP 57,733 59,305 60,965 62,719 64,573 66,535
CWS-Mid Peninsula District
2010 UWMP 130,382 134,004 137,824 141,853 146,101 150,580
CWS - South San Francisco District
2010 UWMP 60,581 62,384 64,277 66,265 68,353 70,548
Coastside County Water District
ABAG 2013 Subregional
16,668 16,848 16,873 16,886 18,363 19,840
Daly City, City of ABAG 2013 Subregional
109,313 112,374 115,671 119,147 123,020 127,028
East Palo Alto, City of
ABAG 2013 Subregional
24,877 26,434 28,048 28,847 29,746 31,151
Estero MID/Foster City
2010 UWMP 37,088 37,924 38,492 38,869 39,223 39,580
Hayward, City of ABAG 2013 Subregional
150,919 157,655 164,617 171,979 179,916 188,170
Hillsborough, Town of
2010 UWMP 10,869 10,913 10,956 11,000 11,000 11,000
Menlo Park, City of ABAG 2013 Subregional (modified)*
16,224 16,620 17,052 17,510 18,035 18,569
Mid-Peninsula Water District
ABAG 2013 Subregional
26,924 27,560 28,259 28,793 29,438 30,203
Millbrae, City of ABAG 2013 Subregional
22,848 24,192 25,571 27,076 28,657 30,294
Milpitas, City of ABAG 2013 Subregional
73,086 79,614 86,328 93,608 101,167 109,124
Mountain View, City of
Draft GP Subsequent EIR
76,837 79,388 81,938 84,489 87,040 89,591
North Coast County Water District
2010 UWMP 39,800 40,600 41,400 42,000 42,400 42,800
Palo Alto, City of City of Palo Alto
Planning Department 67,135 72,786 72,786 75,883 79,446 83,162
Purissima Hills Water District
BAWSCA WCDB 6,135 6,150 6,165 6,180 6,195 6,220
Redwood City, City of
2010 UWMP 87,696 89,756 91,815 93,875 95,935 97,995
San Bruno, City of 2010 UWMP 45,600 48,600 51,200 53,400 55,800 56,860

5: Results Regional Water Demand and Conservation Projections Final Report
5-4
Service Areas Projection Source 2015 2020 2025 2030 2035 2040
San Jose, City of San Jose 2040 General
Plan 26,569 39,884 53,200 66,515 79,830 93,145
Santa Clara, City of 2010 UWMP 125,397 131,732 136,660 141,587 146,917 152,247
Stanford University Stanford Institutional Research & Decision Support Department
29,653 30,534 31,461 32,439 33,471 34,561
Sunnyvale, City of ABAG 2013 Subregional
148,355 165,476 174,664 184,309 194,330 194,330
Westborough Water District
2010 UWMP 14,050 14,060 14,040 14,020 14,020 14,020
TOTAL 1,780,839 1,874,077 1,951,474 2,032,356 2,120,273 2,217,775
* Service area population further reviewed and refined at Menlo Park request. Population minor update was made with support of Project Team analysis of census data with input from ABAG which was then reviewed and approved by Menlo Park staff.
Table 6. BAWSCA Region Wide Historical and Projected Population and Employment
Year Population Employment (Jobs)
1995* 1,529,829 1,044,179
2000* 1,620,307 1,129,881
2005* 1,655,948 1,064,347
2010* 1,695,292 1,033,325
2015 1,780,839 1,116,305
2020 1,874,077 1,212,341
2025 1,951,474 1,270,387
2030 2,032,356 1,332,664
2035 2,120,273 1,389,873
2040 2,217,775 1,443,835
* Historical population and employment based on BAWSCA records as reported by individual member agencies.
5.4 Individual Agency Water Demands
Tables 7, 8, and 9 present the BAWSCA individual member agency water demand projections through 2040. The tables present the following scenarios:
Demands before incorporating future passive conservation savings;
Demands including projected passive conservation savings, and
Demands including projected passive and active conservation savings.

5: Results Regional Water Demand and Conservation Projections Final Report
5-5
Table 7. Demand Projections before Passive Conservation Savings (MGD)
Service Areas 2015 2020 2025 2030 2035 2040
Alameda County Water District 46.3 49.8 51.9 53.8 55.3 58.4
Brisbane/GVMID 0.6 0.8 1.0 1.0 1.0 1.0
Burlingame, City of 4.8 5.1 5.3 5.4 5.6 5.9
CWS - Bear Gulch District 12.8 14.5 14.8 15.2 15.6 16.1
CWS - Mid Peninsula District 14.3 15.0 15.4 15.8 16.3 16.8
CWS - South San Francisco District 7.5 8.1 8.4 8.6 8.9 9.1
Coastside County Water District 1.9 1.9 1.9 1.9 2.1 2.2
Daly City, City of 6.5 6.7 6.9 7.1 7.4 7.6
East Palo Alto, City of 1.9 2.1 2.2 2.3 2.4 2.5
Estero MID/Foster City 4.1 4.3 4.4 4.4 4.5 4.6
Hayward, City of 17.6 22.1 23.8 25.2 26.6 28.0
Hillsborough, Town of 3.1 3.3 3.3 3.3 3.3 3.3
Menlo Park, City of 3.2 3.5 3.5 3.5 3.5 3.6
Mid-Peninsula Water District 3.1 3.4 3.5 3.6 3.7 3.7
Millbrae, City of 2.4 2.7 2.8 3.0 3.1 3.3
Milpitas, City of 10.4 11.6 11.5 12.1 12.8 13.5
Mountain View, City of 10.7 11.3 11.8 12.7 13.3 13.8
North Coast County Water District 3.1 3.2 3.3 3.3 3.3 3.4
Palo Alto, City of 12.6 14.6 14.6 15.4 16.2 17.0
Purissima Hills Water District 1.9 1.9 1.9 1.9 1.9 1.9
Redwood City, City of 10.7 12.0 12.2 12.5 12.8 13.1
San Bruno, City of 3.7 4.2 4.6 5.1 5.6 6.1
San Jose, City of 5.9 8.6 10.1 11.3 12.3 13.4
Santa Clara, City of 21.7 22.9 23.5 24.2 25.0 25.8
Stanford University 3.4 3.5 3.7 4.0 4.3 4.6
Sunnyvale, City of 18.9 21.6 22.6 23.6 24.7 25.0
Westborough Water District 0.8 0.9 0.9 0.9 0.9 0.9
TOTAL* 233.9 259.3 269.8 281.1 292.3 304.5 * Total projections account for the total projected water demand in a service area water system regardless of source. Source include: purchases from SF Regional Water System, groundwater, surface water, recycled water, desalination, SWP, or SCVWD.

5: Results Regional Water Demand and Conservation Projections Final Report
5-6
Table 8. Demand Projections with Passive Conservation Savings (MGD)
Service Areas 2015 2020 2025 2030 2035 2040
Alameda County Water District 46.1 49.0 50.2 51.2 52.1 54.4
Brisbane/GVMID 0.6 0.8 1.0 1.0 1.0 1.0
Burlingame, City of 4.8 4.9 5.0 5.1 5.2 5.4
CWS - Bear Gulch District 12.8 14.3 14.5 14.8 15.1 15.4
CWS - Mid Peninsula District 14.2 14.7 14.8 14.9 15.1 15.4
CWS - South San Francisco District 7.5 8.0 8.1 8.2 8.3 8.5
Coastside County Water District 1.8 1.9 1.9 1.9 1.9 2.0
Daly City, City of 6.4 6.5 6.5 6.5 6.5 6.6
East Palo Alto, City of 1.9 2.1 2.1 2.1 2.2 2.2
Estero MID/Foster City 4.1 4.2 4.2 4.2 4.2 4.2
Hayward, City of 17.6 21.8 23.3 24.4 25.6 26.8
Hillsborough, Town of 3.1 3.2 3.2 3.2 3.2 3.2
Menlo Park, City of 3.2 3.5 3.4 3.4 3.4 3.4
Mid-Peninsula Water District 3.1 3.3 3.3 3.3 3.4 3.4
Millbrae, City of 2.4 2.6 2.7 2.8 2.9 3.0
Milpitas, City of 10.4 11.3 11.1 11.5 11.9 12.5
Mountain View, City of 10.6 11.1 11.4 12.1 12.4 12.8
North Coast County Water District 3.1 3.1 3.1 3.1 3.1 3.1
Palo Alto, City of 12.5 14.3 14.1 14.7 15.3 16.0
Purissima Hills Water District 1.9 1.9 1.9 1.9 1.9 1.9
Redwood City, City of 10.6 11.7 11.7 11.7 11.8 11.9
San Bruno, City of 3.6 4.0 4.4 4.7 5.1 5.5
San Jose, City of 5.8 8.5 9.8 10.9 11.9 12.8
Santa Clara, City of 21.6 22.5 22.8 23.1 23.6 24.2
Stanford University 3.4 3.5 3.7 4.0 4.3 4.6
Sunnyvale, City of 18.8 21.1 21.6 22.2 23.0 23.1
Westborough Water District 0.8 0.8 0.8 0.8 0.8 0.8
TOTAL* 232.6 254.4 260.6 267.4 275.1 284.3 * Total projections account for the total projected water demand in a service area water system regardless of source. Source include: purchases from SF Regional Water System, groundwater, surface water, recycled water, desalination, SWP, or SCVWD.
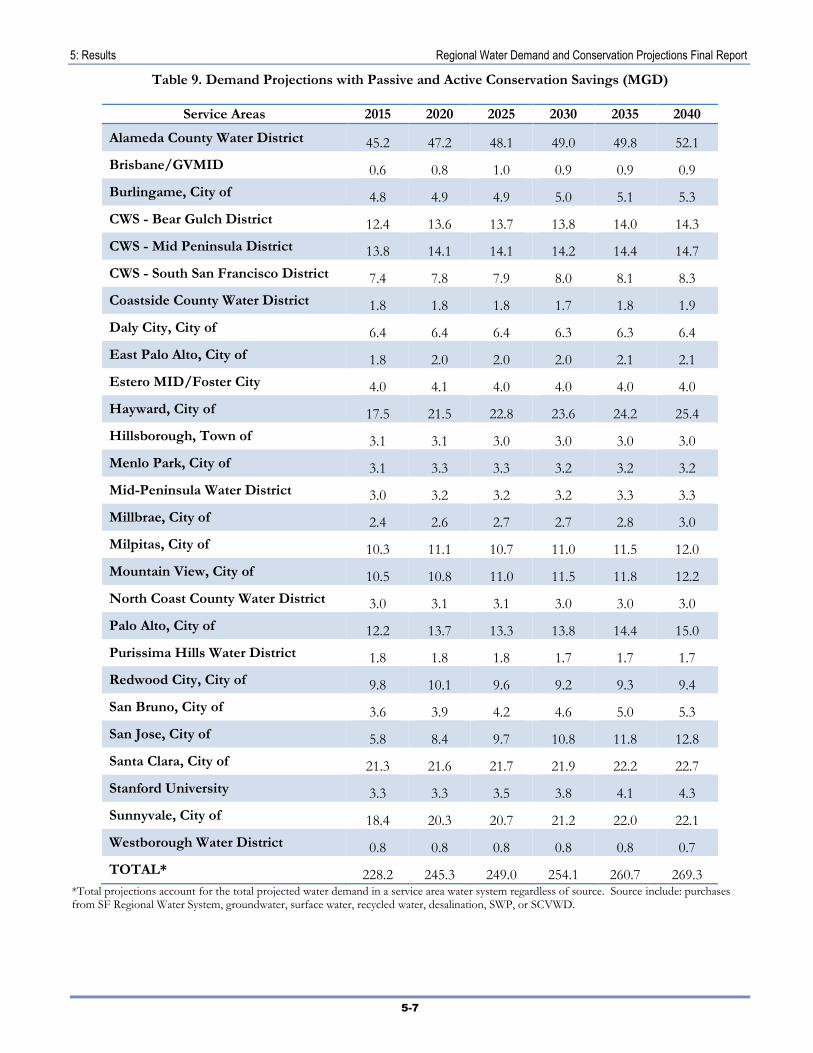
5: Results Regional Water Demand and Conservation Projections Final Report
5-7
Table 9. Demand Projections with Passive and Active Conservation Savings (MGD)
Service Areas 2015 2020 2025 2030 2035 2040
Alameda County Water District 45.2 47.2 48.1 49.0 49.8 52.1
Brisbane/GVMID 0.6 0.8 1.0 0.9 0.9 0.9
Burlingame, City of 4.8 4.9 4.9 5.0 5.1 5.3
CWS - Bear Gulch District 12.4 13.6 13.7 13.8 14.0 14.3
CWS - Mid Peninsula District 13.8 14.1 14.1 14.2 14.4 14.7
CWS - South San Francisco District 7.4 7.8 7.9 8.0 8.1 8.3
Coastside County Water District 1.8 1.8 1.8 1.7 1.8 1.9
Daly City, City of 6.4 6.4 6.4 6.3 6.3 6.4
East Palo Alto, City of 1.8 2.0 2.0 2.0 2.1 2.1
Estero MID/Foster City 4.0 4.1 4.0 4.0 4.0 4.0
Hayward, City of 17.5 21.5 22.8 23.6 24.2 25.4
Hillsborough, Town of 3.1 3.1 3.0 3.0 3.0 3.0
Menlo Park, City of 3.1 3.3 3.3 3.2 3.2 3.2
Mid-Peninsula Water District 3.0 3.2 3.2 3.2 3.3 3.3
Millbrae, City of 2.4 2.6 2.7 2.7 2.8 3.0
Milpitas, City of 10.3 11.1 10.7 11.0 11.5 12.0
Mountain View, City of 10.5 10.8 11.0 11.5 11.8 12.2
North Coast County Water District 3.0 3.1 3.1 3.0 3.0 3.0
Palo Alto, City of 12.2 13.7 13.3 13.8 14.4 15.0
Purissima Hills Water District 1.8 1.8 1.8 1.7 1.7 1.7
Redwood City, City of 9.8 10.1 9.6 9.2 9.3 9.4
San Bruno, City of 3.6 3.9 4.2 4.6 5.0 5.3
San Jose, City of 5.8 8.4 9.7 10.8 11.8 12.8
Santa Clara, City of 21.3 21.6 21.7 21.9 22.2 22.7
Stanford University 3.3 3.3 3.5 3.8 4.1 4.3
Sunnyvale, City of 18.4 20.3 20.7 21.2 22.0 22.1
Westborough Water District 0.8 0.8 0.8 0.8 0.8 0.7
TOTAL* 228.2 245.3 249.0 254.1 260.7 269.3 *Total projections account for the total projected water demand in a service area water system regardless of source. Source include: purchases from SF Regional Water System, groundwater, surface water, recycled water, desalination, SWP, or SCVWD.

5: Results Regional Water Demand and Conservation Projections Final Report
5-8
5.5 Projected Consumption by Customer Class
Table 10 and Figure 9 present the BAWSCA region-wide projected water consumption by customer category through 2040.
Table 10 Projected Consumption by Customer Category (MGD)*
Customer Category 2015 2020 2025 2030 2035 2040
Single Family Residential 94.3 98.8 99.2 99.8 101.6 104.4
Multi Family Residential 35.7 37.4 37.6 37.9 38.6 39.5
Non-Residential* 83.1 94.4 97.0 99.8 103.1 106.3
Non-Revenue Water 15.1 14.7 15.2 16.6 17.5 19.0
TOTAL* 228.2 245.3 249.0 254.1 260.7 269.3
*Non-Residential includes commercial, industrial, institutional, public, and other uses.
Figure 9. Projected Consumption By Customer Category

5: Results Regional Water Demand and Conservation Projections Final Report
5-9
5.6 Next Steps
The demand projections developed through the Project will be used the Final Phase of the Strategy. BAWSCA will work with the member agencies to determine each agency’s planned water supply portfolio for meeting its projected water demands in order to identify any new water supply needs. This information will be used in the evaluation of new supply options to meet the water demands of the BAWSCA member agencies through 2040.
Most of the BAWSCA member agencies are required to prepare UWMPs, which are due to DWR by December 2015. Member agencies may elect to utilize the demand and conservation savings projections developed through this Project in completion of their respective UWMPs. Member agencies may also update these demands for the 2015 UWMPs if necessary to incorporate new information for their respective service areas.
At this point, no formal commitment has been made at the individual agency level to implement the new water conservation measures that were evaluated as part of the Project, or at the BAWSCA level to implement the new conservation programs that were identified for possible regional implementation. BAWSCA will work with the member agencies to further evaluate these programs and to implement new regional programs as appropriate. BAWSCA recognizes that actual implementation of water conservation to achieve the identified water savings goals must be managed in an adaptive fashion, making both small and large program changes as needed over time.

Appendix Regional Water Demand and Conservation Projections Final Report
A
A P P E N D I X A . C O N S E R V A T I O N S C R E E N I N G G R A P H I C S
The following graphics present the results of the SurveyMonkey survey that solicited BAWSCA member agency feedback on conservation measures that would be considered in the DSS Model Analysis.
Figure 10. Summary of Online Survey Ranking of Water Use Efficiency Measures
Note: Highest Ranking Measures are Near the Top of the List. Weighted based on 5 points High, 3 points Medium and 1 point Low Interest.

Appendix Regional Water Demand and Conservation Projections Final Report
B
Figure 11. Summary of BAWSCA Member Input on Lead Implementation Agency
Note: Highest ranking (most interested) conservation measures are farthest to the left

C
A P P E N D I X B . L I S T O F M E A S U R E S S E L E C T E D A N D N O T S E L E C T E D F O R C O S T E F F E C T I V E N E S S A N A L Y S I S
The following table presents the list of conservation measures selected and not selected for the DSS Model cost-effectiveness analysis.
Table 11. Selected 25 Measures to be Included in the DSS Model for Cost Effectiveness Analysis
Measure Name Category BAWSCA Regional or Agency Led
CUWCC BMP No.
Water Loss Control Program Utility Agency 1.2 Metering (with AMI benefits to Conservation) Utility Agency 1.3 Submetering (retrofit incentive) Residential Agency Conservation Pricing (incremental behavioral change – most savings counted as device changes)
Utility Agency 1.4
Public Information & Program Administration (BAWSCA Water Saving Hero type campaign, SCVWD – Save 20 Gallons, Agency Program Expenses not associated with incentives)
Utility BAWSCA 2.1
School Education (WaterWise Program) Utility BAWSCA 2.2
SF MF Surveys Residential Agency 3.1 WaterSense Fixtures Giveaway Residential Agency 3.1 HE Clothes Washer SF MF Rebate Residential BAWSCA 3.3 HET SF/MF Rebates Residential BAWSCA 3.4 “Lawn Be Gone” SF Landscape Conversion/Turf Removal Residential/
Landscape BAWSCA Only Flex-
Track or GPCD
Weather Based Irrigation Controllers (WBICs) Giveaway Program (and Classes) SF
Residential/Landscape
BAWSCA Only Flex-Track or GPCD
Small Irrigation Hardware Incentives (Drip Irrigation and Rain Sensors)
Residential/ Landscape
BAWSCA Only Flex-Track or GPCD
Gray Water Retrofits SF Rebate Residential/Landscape
BAWSCA Only Flex-Track or GPCD
Water Conserving Landscape & Codes (not including WBICs and turf removal) SF MF CII
Residential/Landscape
Agency Code Savings
Customized Top Users Survey & Incentive Program & CII Rebates for Inefficient Equipment
CII Agency 4 - Savings
HE Clothes Washer CII Rebate CII BAWSCA 4 - Savings HET CII Rebates CII BAWSCA 4 - Savings HE Urinal CII Rebates CII BAWSCA 4 - Savings Focused School Retrofit Program CII BAWSCA 4 - Savings Outdoor Water Audit – Large Landscape Landscape BAWSCA 5 Landscape Water Budgets/Monitoring- Large Landscape Dedicated Meters & Mixed Use Conversion
Landscape BAWSCA
5

Appendix Regional Water Demand and Conservation Projections Final Report
D
Measure Name Category BAWSCA Regional or Agency Led
CUWCC BMP No.
“Lawn Be Gone” MF CII Large Landscape Landscape Conversion/Turf Removal
Landscape BAWSCA 5
WBICs Incentive Program (more money) MF CII Large Landscape
Landscape BAWSCA 5
Rotating Sprinkler Nozzle Incentive Program SF MF CII Large Landscape
Landscape BAWSCA 5
Table 12. Measures Considered that were NOT be Included in the DSS Model
Measure Name Reason for Not Including in DSS Model
Prohibit Water Waste Practices Include in toolbox but do not model per agency feedback at 12/19/13 meeting
Outdoor Only SF MF Surveys Include SF MF Surveys in lieu of this measure per agency feedback at 12/19/13 meeting
Top Users Incentive Program Include SF MF Survey and CII Top Users in lieu of this measure per agency feedback at 12/19/13 meeting
Pre-Rinse Spray Nozzles - Incentive Exclude per discussion at 12/19/13 meeting Pressure Regulator Incentive Program Exclude per discussion at 12/19/13 meeting Financial Incentives for Irrigation and Landscape Upgrades (not including WBICs and turf removal)
Overlaps with other higher-ranked included measures
Shade Tree Program Giveaway or Rebate Low Ranking Submetering (Ordinance) Low Ranking
Require Plan CII Review Low Ranking High Efficiency Fixtures Direct Install (Commercial and/or Government Buildings Only)
Low Ranking
HET SF/MF - Direct Install (Low income) Low Ranking Rebates for Mixed-use Meter Conversion to Dedicated Landscape Meter (Santa Clara Valley WD)
Low Ranking
HET Bulk Purchase (all types) Low Ranking Require SF Hot Water On-Demand Rebates (Ordinance) Low Ranking HET or HEU CII - Direct Install (CII) Low Ranking Gray Water in SF New Development (Ordinance) Low Ranking Hot Water On-Demand Rebate Low Ranking Gray Water Retrofits SF Rebate Low Ranking HET SF MF - Direct Install (i.e., Green City Niagara) Low Ranking Artificial Turf Sport Fields Rebate Low Ranking Rebates for Flow Sensors/Hydrometers (SCVWD) Low Ranking

Appendix Regional Water Demand and Conservation Projections Final Report
E
A P P E N D I X C . E C O N O M E T R I C M O D E L D E S C R I P T I O N
Econometric Modeling Framework
Introduction
In the past BAWSCA has relied on projections of population and jobs to predict future baseline water demand. Residential demand was projected by multiplying per household use by population growth and CII demand by multiplying per employee use by projected job growth. These estimates of baseline demand were then converted into estimates of net demand by subtracting likely savings from various plumbing codes and active conservation programs. While the simplicity of this methodology makes it appealing and easy to understand, econometric analysis studying historical data (assuming historical relationships remain valid) can provide helpful information for answering questions such as, how much and at what rate will demand rebound as the economy expands; how much will future price increases continue to depress demand; and, how does demand respond to weather?
To address these questions, we have developed econometric demand models for each agency that aims to estimate the relationship between water demand and its key drivers such as price, economic conditions, and weather. The model estimates the water demands based on the data (independent variables) in Table 13.
Table 13. Independent Variables Evaluated for the Econometric Analysis
Variable Type Variables Units Data Source Note
Weather Precipitation Inches per month NOAA Weather Data
Weather Avg Daily Max Air Temp
Fahrenheit NOAA Weather Data
Weather Avg Air Temp Fahrenheit NOAA Weather Data See note 1
Weather Min Air Temp Fahrenheit NOAA Weather Data See note 1
Weather Reference ETo Inches Not available for all areas
Economy # of Jobs Jobs per capita ABAG See note 2
Economy Unemployment Unemployment rate CA EDD / BLS
Service Area Housing Mix
SF and MF Units Dwelling units DOF See note 3
Service Area Data Rates $/MG Provided by Agencies
Service Area Data Population People ABAG or other selected source
Service Area Data # Customers Accounts Agency billing data See note 4
Conservation Conservation savings per year
Million gallons per day
BAWSCA WCDB
NOTES: 1Maximum temperature was a better predictor than average or minimum temperature. 2Jobs were collinear with population, thus not a good metric for capturing the state of the economy. The unemployment rate performed better in this regard.

Appendix Regional Water Demand and Conservation Projections Final Report
F
3The single-family/multi-family split showed very little variation over time. It was excluded from the models on account of being statistically insignificant.
4Number of accounts was collinear with population, thus, excluded from the final models. Using the independent variables listed above, regression methods were applied to historical data to evaluate alternative model specifications. Based on these analyses, the following best fit equation was developed:
( ) ( ) ( )
Where, Monthly production is measured in gallons per capita per day (GPCD)
is a scaling constant Trend is a variable that takes on a value of 0 in the first year, 1 in the second year, and so on Unemployment rate is captured as an annual percent (for example, 7%) Marginal price for single-family customers, measured in dollars per hundred cubic feet Temperature deviation is measured in degrees Fahrenheit (average maximum daily temperature in a given
month minus average for the same month between 1995 and 2012) Rainfall deviation is measured in total inches (total rainfall in a given month minus average total rainfall for
same month between 1995 and 2012) Monthly indicators are binary 0-1 variables, taking on a value of 1 for a given month in question, 0 otherwise ε denotes random error.
Each independent variable on the right hand side of the equation is preceded by a coefficient (i.e. ) that measures the strength of the impact of an independent variable on monthly demand (the variable on the left hand side of the equation is also known as the dependent variable). A positive coefficient implies that an increasing independent variable will cause the dependent variable to also increase; a negative coefficient, the opposite. The purpose of model development is both to select the elements of the equation, as well as to estimate each independent variable’s coefficient. Continuous variables such as the marginal price and the unemployment rate are logarithmically transformed so that their respective coefficients can be given a proportional interpretation. So, for example, the coefficient on logarithmically transformed marginal price becomes the price elasticity, and so on. The trend variable captures changes in GPCD over time not accounted for by price, unemployment rate, or weather.
Our basic model specification includes several features. First, agency-specific production data are modeled at a monthly, not annual level. The reason for estimating monthly level models is to allow for the impact of weather to vary by time of year. Prior research strongly indicates that abnormal temperature and abnormal rainfall do not have the same effect in January as, say, in May.1 Working with monthly production data allows one to incorporate time-varying weather effects. Second, temperature and rainfall enter the model as deviations from their respective monthly averages, capturing directly how demand reacts to weather as it deviates from average. Normal seasonality in monthly demand (that is, July demand being much higher than January demand) is captured by the monthly indicator variables.
1 Bamezai, A., GPCD Weather Normalization Methodology, final report submitted to the California Urban Water Conservation Council, 2011.
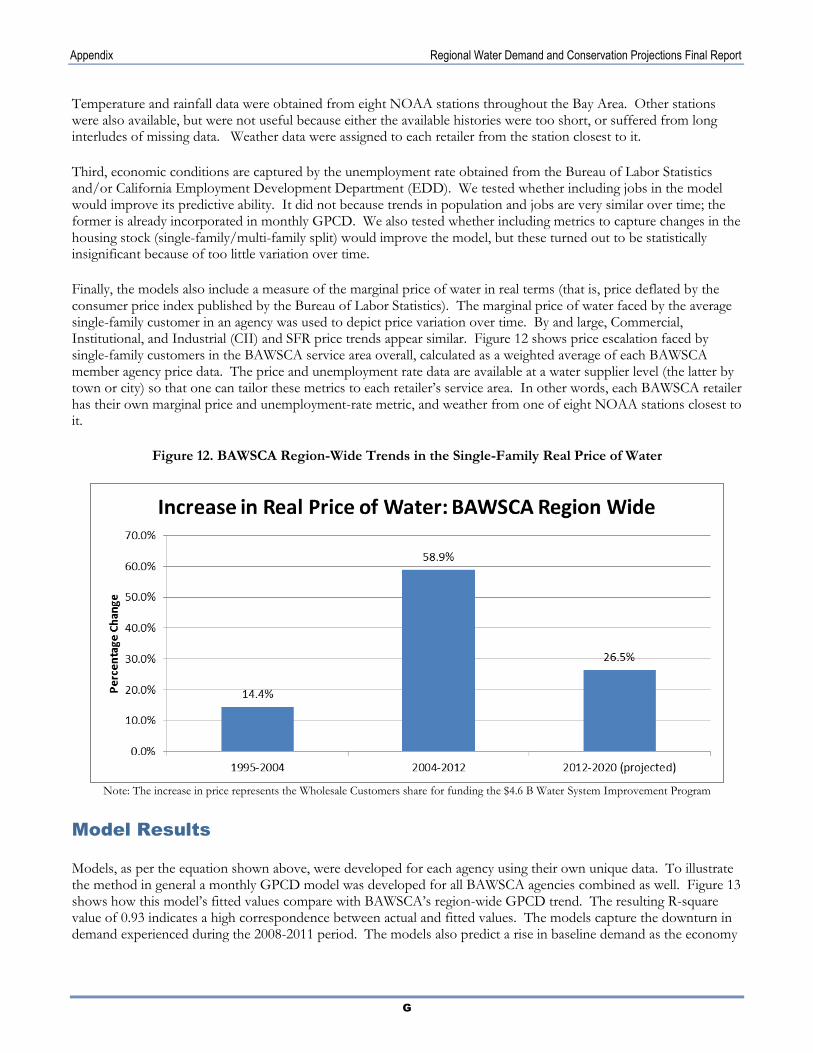
Appendix Regional Water Demand and Conservation Projections Final Report
G
Temperature and rainfall data were obtained from eight NOAA stations throughout the Bay Area. Other stations were also available, but were not useful because either the available histories were too short, or suffered from long interludes of missing data. Weather data were assigned to each retailer from the station closest to it.
Third, economic conditions are captured by the unemployment rate obtained from the Bureau of Labor Statistics and/or California Employment Development Department (EDD). We tested whether including jobs in the model would improve its predictive ability. It did not because trends in population and jobs are very similar over time; the former is already incorporated in monthly GPCD. We also tested whether including metrics to capture changes in the housing stock (single-family/multi-family split) would improve the model, but these turned out to be statistically insignificant because of too little variation over time.
Finally, the models also include a measure of the marginal price of water in real terms (that is, price deflated by the consumer price index published by the Bureau of Labor Statistics). The marginal price of water faced by the average single-family customer in an agency was used to depict price variation over time. By and large, Commercial, Institutional, and Industrial (CII) and SFR price trends appear similar. Figure 12 shows price escalation faced by single-family customers in the BAWSCA service area overall, calculated as a weighted average of each BAWSCA member agency price data. The price and unemployment rate data are available at a water supplier level (the latter by town or city) so that one can tailor these metrics to each retailer’s service area. In other words, each BAWSCA retailer has their own marginal price and unemployment-rate metric, and weather from one of eight NOAA stations closest to it.
Figure 12. BAWSCA Region-Wide Trends in the Single-Family Real Price of Water
Note: The increase in price represents the Wholesale Customers share for funding the $4.6 B Water System Improvement Program
Model Results
Models, as per the equation shown above, were developed for each agency using their own unique data. To illustrate the method in general a monthly GPCD model was developed for all BAWSCA agencies combined as well. Figure 13 shows how this model’s fitted values compare with BAWSCA’s region-wide GPCD trend. The resulting R-square value of 0.93 indicates a high correspondence between actual and fitted values. The models capture the downturn in demand experienced during the 2008-2011 period. The models also predict a rise in baseline demand as the economy

Appendix Regional Water Demand and Conservation Projections Final Report
H
expands, but tempered by projected price increases (shown earlier in Figure 12), which have been factored into the forecast.
Figure 13. BAWSCA Region-Wide Econometric Model Fit and Forecast
This type of model is known as a time-series, cross-sectional model. This region-wide model incorporates agency-level fixed effects, a correction for autocorrelation in the error term, and also population weighting to account for different agency sizes. Agency-specific fixed effects capture the impact of agency characteristics that do not vary much over time, such as average household income and lot size, leading to a much more robust model specification than one without these fixed effects. In other words, our model captures the impact on GPCD of income, lot size, and other unobservable time-invariant differences across agencies implicitly through these fixed effects.
In addition to the fixed effects, each agency is allowed to have its own time trend to capture the impact of service area dynamics that influence water use but are not fully captured either by price, unemployment rate or weather. The normal seasonality in water use is also allowed to vary across agencies. The impact of weather deviations from normal is also allowed to vary by season and across agencies by interacting these deviation variables with an agency’s transformed seasonal peaking factor2. A greater summer-winter differential indicates a greater prevalence of weather-sensitive end uses, making the impact of non-normal weather also correspondingly greater. The feasibility of using peaking factors to scale the impact of non-normal weather across agencies was demonstrated by Bamezai (2011) in a study completed for the CUWCC (op. cit.). Those concepts have been applied here as well.
2 Peaking factor is calculated by dividing maximum monthly summer demand by minimum winter monthly demand in any given year, then averaging these ratios across all years included during the baseline period. Transformed peaking factor is calculated as 1-(1/Peaking Factor).

Appendix Regional Water Demand and Conservation Projections Final Report
I
An important goal of the econometric modeling is to forecast baseline water demand, that is, demand excluding the effect of plumbing codes and active conservation programs. After establishing baseline demand, one can layer on the impact of plumbing codes going forward and the impact of a specifically designed conservation program to reach a GPCD goal. However, historical production data provided by water suppliers embed the impact of past plumbing codes and active conservation programs, which need to be accounted for first. This was done by relying on prior conservation savings models (2008 DSS Models) developed for BAWSCA. Estimated conservation savings by supplier and year forecasted by these conservation models were added back to the production data reported by water suppliers prior to estimation of the econometric model. Forecasts based on these revised production data then yield baseline demand.
Table 14. BAWSCA Region-Wide Model Results
Independent Variable Coefficient Std. Error t-statistic
Ln(Marginal Price) -0.168 0.010 -16.3
Ln(Unemployment Rate) -0.051 0.004 -12.5
Temp. Dev. (Apr-Jun) x TPF‡ 0.021 0.001 13.8
Temp Dev. (Jul-Oct) x TPF 0.011 0.001 7.1
Temp. Dev. (Nov-Mar) x TPF 0.019 0.001 14.2
Rain Dev. (Apr-Jun) x TPF -0.132 0.005 -24.0
Rain Dev. (Jul-Oct) x TPF -0.045 0.007 -6.0
Rain Dev. (Nov-Mar) x TPF -0.009 0.001 -7.1
Jan Indicator -0.021 0.005 -3.9
Feb -0.013 0.006 -2.2
Mar 0.020 0.006 3.2
Apr 0.187 0.006 28.9
May 0.353 0.006 54.1
Jun 0.518 0.006 79.9
Jul 0.566 0.006 87.0
Aug 0.551 0.006 85.3
Sep 0.526 0.006 82.7
Oct 0.366 0.006 59.7
Nov 0.153 0.006 29.1
Constant 4.936 0.015 322.0
Agency specific fixed effects Included
Agency specific trend terms Included
Agency interactions with monthly dummies Included
R-Square 0.93
Notes: 1. The large number of coefficients associated with the agency fixed effects, agency trend terms and agency interactions with
monthly dummies not shown for the sake of brevity. 2. ‡TPF denotes transformed peaking factor. 3. Dependent Variable: Ln(Monthly GPCD), 27 retail agencies, up to 18 years of data per agency.
The model coefficients for the region-wide model are shown in Table 14 and are presented in three columns, including one for the estimated coefficient, one for the likely band of error surrounding this coefficient (referred to as standard error), and one for the t-statistic. An independent variable’s t-statistic is the ratio of the coefficient over its standard error. A t-statistic of 2 or greater indicates a statistically significant relationship between the dependent and

Appendix Regional Water Demand and Conservation Projections Final Report
J
independent variable; less than 2 indicates that the data are not able to conclusively demonstrate a relationship. The latter finding may reflect the lack of any relationship. Or, it may occur because of data errors or other problems, such as, two or more independent variables being highly correlated with one another. The model’s R-square is shown at the bottom, which is indicative of the explanatory power of a statistical model. It can vary between zero and a maximum of 1, with higher numbers indicating greater explanatory power.
The coefficients found in Table 14 have the following interpretation. A price elasticity of -0.168 indicates that a 10% real increase in the marginal price of water can be expected to reduce demand by 1.7%. Our region-wide estimate of price elasticity compares well with the published literature on this topic. A 10% increase in the annual unemployment rate is likely to depress water demand by 0.05%, a statistically significant effect, but one weaker than price. The weather coefficients are all significant and behave in expected ways. For an agency with a peaking factor of 2, or a transformed peaking factor of 0.5 (a fairly typical agency) an extra inch of rainfall per month during the spring season reduces monthly demand by roughly 6.6%, while the same extra inch during the winter months only depresses monthly demand by 0.4%. On the temperature dimension, if daily maximum temperature is 1 degree higher on average in a given month, then this is likely to raise monthly water demand by 1.0% during the spring season, 0.5% during the summer season, and 0.9% during late fall and winter seasons. Lower than average temperatures would have the opposite effect.
The monthly dummy variables also exhibit the expected pattern with July exhibiting the largest coefficient, indicating that July demand is greatest during the year, reaching a minimum during January.

Appendix Regional Water Demand and Conservation Projections Final Report
K
A P P E N D I X D . C O N S E R V A T I O N T A R G E T S A N D G O A L S
State Mandated Water Conservation
Senate Bill X7-7 (SB X7-7) or “The Water Conservation Act of 2009” was enacted to ensure California continues to have reliable water supplies, requiring urban water agencies to collectively reduce statewide per capita water use by 20% before December 31, 2020. The law establishes that the base daily per capita use be based on total gross water use, divided by the service area population. Complying with SB X7-7 can be via one of four approved methods. BAWSCA member agencies plan to use a combination of water use efficiency (WUE) measures and recycled water to help meet or exceed the per capita consumption water use targets to support the overall goal of more supply reliability for the BAWSCA member agencies.
Water Reduction Targets Methodology
The baseline volume of gallons per capita per day (GPCD) was calculated for each BAWSCA member agency in most cases by using a 10-year base period average. BAWSCA member agencies chose one of four compliance methods, which can be found in their specific DSS model in addition to their target GPCD value. BAWSCA member agency per capita water use trends can be found in their DSS Model.
Each conservation measure targets a particular water use such as indoor single-family water use. Targeted water uses are categorized by water user group and by end use. Targeted water user groups could include Single-Family Residential (SF); Multi-Family Residential (MF); Commercial, Industrial, and Institutional (CII); and public (PUB). Measures may apply to more than one water user group. Targeted end uses include indoor and outdoor use. The targeted water use is important to identify because the water savings are generated from reductions in water use for the targeted end use. For example, Residential Retrofits targets Single-Family and Multi-Family Residential indoor use, specifically shower use. When considering the water savings potential generated by a residential retrofit one considers the water saved by installing low-flow showerheads in single- and multi-family homes.
The market penetration goal for a measure is the extent to which the product or service related to the conservation measure occupies the potential market. In essence, the market penetration goal identifies how many fixtures, rebates, surveys, etc. the wholesale customer would have to offer or conduct over a period of time to reach its water savings goal for that conservation measure. This is often expressed in terms of the number of fixtures, rebates, surveys, etc. offered or conducted per year.
The potential for errors in market penetration goal estimates for each measure can be significant because they are based on previous experience, chosen implementation methods, projected utility effort and funds allocated to implement the measure. The potential error can be corrected through re-evaluation of the measure as the implementation of the measure progresses. For example, if the market penetration required to achieve specific water savings turns out to be more or less than predicted, adjustments to the implementation efforts can be made. Larger rebates or additional promotions are often used to increase the market penetration. The process is iterative to reflect actual conditions and helps to ensure that market penetration and needed savings are achieved regardless of future variances between estimates and actual conditions.
In contrast, market penetration for mandatory ordinances can be more predictable with the greatest potential for error occurring in implementing the ordinance change. For example, requiring dedicated irrigation meters for new accounts through an ordinance can assure an almost 100 percent market penetration for affected properties.

Appendix Regional Water Demand and Conservation Projections Final Report
L
A P P E N D I X E . K E Y A S S U M P T I O N S F O R T H E D S S M O D E L
The following section presents the key assumptions used in the DSS Model. The assumptions having the most dramatic effect on future demands are the natural replacement rate of fixtures, how residential or commercial future use is projected, and finally the percent of estimated real water losses.
Table 15. List of Key Assumptions
List of Baseline Demand Projection Assumptions for DSS Model
Parameter Model Input Value, Assumptions, and Key References
Model Start Year 2013
Model End Year 2040
Non-Revenue Water Based on individual billing
Population Projection Source Provided by and verified by individual agencies
Employment Projection Source Provided by and verified by individual agencies
Number of Water Accounts for Start Year
Provided by and verified by individual agencies
Avoided Cost of Water $/AF Provided by and verified by individual agencies
Residential End Uses
CA DWR Report "California Single Family Water Use Efficiency Study", 2011, AWWARF Report “Residential End Uses of Water” 1999, Agency supplied data on costs and savings, professional judgment where no published data available
Non-Residential End Uses, % AWWARF Report "Commercial End Uses of Water” 1999
Efficient Residential Fixture Current Installation Rates
U.S. Census, Housing age by type of dwelling plus natural replacement plus rebate program (if any).
Reference "High Efficiency Plumbing Fixtures - Toilets and Urinals" Koeller & Company July 23, 2005.
Reference Consortium for Efficient Energy (www.cee1.org)
Water Savings for Fixtures, gal/capita/day
AWWARF Report “Residential End Uses of Water” 1999, ,CA DWR Report "California Single Family Water Use Efficiency Study", 2011, Agency supplied data on costs and savings, professional judgment where no published data available
Non-Residential Fixture Efficiency Current Installation Rates
U.S. Census, assume commercial establishments built at same rate as housing, plus natural replacement
Residential Frequency of Use Data, Toilets, Showers, Washers, Uses/user/day
Falls within ranges in AWWARF Report “Residential End Uses of Water” 1999
Non-Residential Frequency of Use Data, Toilets and Urinals,
Estimated based using AWWARF Report “Commercial and Institutional End Uses of Water” 1999

Appendix Regional Water Demand and Conservation Projections Final Report
M
List of Baseline Demand Projection Assumptions for DSS Model
Parameter Model Input Value, Assumptions, and Key References
Uses/user/day
Natural Replacement Rate of Fixtures
Residential Toilets 3% (1.28 gpf toilets), 3% (1.6 gpf and higher toilets)
Commercial Toilets 2% (1.28 gpf toilets), 4% (1.6 gpf and higher toilets)
Residential Showers 4%
Residential Clothes washers 6.7%
A 3% replacement rate corresponds to 33 year life of a new fixture.
A 6.67% replacement rate corresponds to 15 year washer life based on “Bern Clothes Washer Study, Final Report, Energy Division, Oak Ridge National Laboratory, for U.S. Department of Energy, March 1998, Internet address: www.energystar.gov
Present Value Analysis and the Utility and Community Perspective
Present value analysis using constant FY 2014 dollars and a real discount rate of 3% is used to discount costs and benefits to the base year. From this analysis, benefit-cost ratios of each measure are computed. When measures are put together in programs, the model is set up to avoid double counting savings from multiple measures that act on the same end use of water. For example, multiple measures in a program may target toilet replacements. The model includes assumptions to apportion water savings between the multiple measures.
Economic analysis can be performed from several different perspectives, based on which party is affected. For planning water conservation programs for utilities, the perspectives most commonly used for benefit-cost analyses are the “utility” perspective and the “community” perspective. The “utility” benefit-cost analysis is based on the benefits and costs to the water provider. The “community” benefit-cost analysis includes the utility benefit and costs together with account owner/customer benefits and costs. These include customer energy and other capital or operating cost benefits plus costs of implementing the measure, beyond what the utility pays.
The utility perspective offers two advantages. First, it considers only the program costs that will be directly borne by the utility. This enables the utility to fairly compare potential investments for saving versus supplying increased quantities of water. Second, revenue shifts are treated as transfer payments, which means program participants will have lower water bills and non-participants will have slightly higher water bills so that the utility’s revenue needs continue to be met. Therefore, the analysis is not complicated with uncertainties associated with long-term rate projections and retail rate design assumptions. It should be noted that there is a significant difference between the utility’s savings from the avoided cost of procurement and delivery of water and the reduction in retail revenue that results from reduced water sales due to water use efficiency. This budget impact occurs slowly, and can be accounted for in water rate planning. Because it is the water provider’s role in developing a water use efficiency plan that is vital in this study, the utility perspective was primarily used to evaluate elements of the Plan.
The community perspective is defined to include the utility and the customer costs and benefits. Costs incurred by customers striving to save water while participating in water conservation programs are considered, as well as the benefits received in terms of reduced energy bills (from water heating costs) and wastewater savings, among others. Water bill savings are not a customer benefit in the aggregate for reasons described above. Other factors external to

Appendix Regional Water Demand and Conservation Projections Final Report
N
the utility, such as environmental effects, are often difficult to quantify or are not necessarily under the control of the utility. They are therefore frequently excluded from economic analyses, including this one.
Present Value Parameters
The time value of money is explicitly considered. Typically the costs to save water occur early in the planning period whereas the benefits usually extend to the end of the planning period. A long planning period of 20-30 years is typically used because costs and benefits that occur beyond 2040 years have very little influence on the total present value of the costs and benefits. The value of all future costs and benefits is discounted to the first year in the DSS Model (the base year, which in this case is 2013), at the real interest rate of 3.0%. The DSS Model calculates this real interest rate, adjusting the current nominal interest rate (assumed to be approximately 6.1%) by the assumed rate of inflation (3.0%). Cash flows discounted in this manner are herein referred to as “Present Value” sums.
Assumptions about Measure Costs
Costs were determined for each of the measures based on industry knowledge, past experience and data provided by BAWSCA and BAWSCA member agencies. Costs may include incentive costs, usually determined on a per-participant basis; fixed costs, such as marketing; variable costs, such as the costs to staff the measures and to obtain and maintain equipment; and a one-time set-up cost. The set-up cost is for measure design by staff or consultants, any required pilot testing, and preparation of materials that will be used in marketing the measure. The model was run for 27 years (each year between FY 2013 and FY 2040). Costs were spread over the time period depending on the length of the implementation period for the measure and estimated voluntary customer participation levels.
Lost revenue due to reduced water sales is not included as a cost because the water conservation measures evaluated herein generally take effect over a long span of time that is sufficient to enable timely rate adjustments, if necessary, to meet fixed cost obligations and savings on variable costs such as energy and chemicals.
Assumptions about Measure Savings
Data necessary to forecast water savings of measures include specific data on water use, demographics, market penetration, and unit water savings. Savings normally develop at a measured and predetermined pace, reaching full maturity after full market penetration is achieved. This may occur three to seven years after the start of implementation, depending upon the implementation schedule. For every water conservation activity or replacement with more efficient devices, there is a useful life. The useful life is called the “Measure Life” and is defined to be how long water conservation measures stay in place and continue to save water. It is assumed that measures implemented because of codes, standards or ordinances, like toilets for example, would be “permanent” and not revert to an old inefficient level of water use if the device needed to be replaced. However, some measures that are primarily behavioral based, such as residential surveys, are assumed to need to be repeated on an ongoing basis to retain the water savings (e.g., homeowners move away and new homeowners may have less efficient water using practices around the home). Surveys typically have a measure life on the order of five years.
Assumptions about Avoided Costs
The estimated avoided cost of water was provided by BAWSCA and BAWSCA member agency staff and can be found in each BAWSCA member agency’s specific DSS Model. This value is the average cost of blended water for the 2013-2032 period including any purchased water as well as the agency’s energy, treatment, and facilities improvement costs.

Appendix Regional Water Demand and Conservation Projections Final Report
O
A P P E N D I X F . D E T A I L E D S T A R T I N G V A L U E S F O R W A T E R U S E E F F I C I E N C Y M E A S U R E S E V A L U A T E D
The following figures present the DSS Model starting values for the conservation measures that were analyzed for possible inclusion into each BAWSCA member agency’s conservation program.
Measure 1 Water Loss
The savings is over the life of the program which is tied to the agency current Non Revenue Water percentage which can be found in the GREEN "Non
Revenue Water" portion of the DSS Model. All programs are advised to have “Annual Maintenance Costs” inputted to allow for budget estimates for
complete program. Additional water savings of “Non-Revenue Water” real water losses may be available when technically feasible. Rule of thumb is
minimum system water losses below approximately 6% (as defined as the difference between production and consumption or alternatively as a percent of
System Input Volume using AWWA Water System Audit definitions). For NRW below 6% (which can be found in the GREEN "Non Revenue Water" portion of
the DSS Model), input “0%” for new real water savings and “$0” in the Backlog Cost section. For NRW above 6%, a GPCD savings input volume can be
computed (an estimate of annual savings volume divided by total population). For example a 4.0 GPCD is equivalent to a 2% reduction for the system with a
150 GPCD water use. Additional Water Loss Control Program budget to achieve these water savings is inputted into the “Backlog Cost” section along with
the duration of the years to accomplish the estimated reduction. In other words, $250,000 over 5 years would add $50,000 per year to assist with meeting
NRW reduction goals.
Agency specific.
Large Systems: Program Cost $1,000,000 over 10 years; Annual Maint. Costs $50,000
Medium Systems: $500,000 over 10 years; Annual Maint cost $25,000
Small Systems: $250,000 over 10 years; Annual Maint. Costs $15,000
Also, look at the NRW % in the green section of the model - if NRW is less than 6%, NO program cost, only maintenance costs.
AGENCY MEASURE: Maintain a thorough annual accounting of water production, sales by customer class and quantity of water produced but not sold (non-
revenue water). In conjunction with system accounting, include audits that identify and quantify known legitimate uses of non-revenue water in order to
determine remaining potential for reducing water losses. Goal would be to lower the Infrastructure Leakage Index (ILI) and non-revenue water every year
by a pre-determined amount based on cost-effectiveness. These programs typically pay for themselves based on savings in operational costs (and saved
rate revenue can be directed more to system repairs/replacement and other costs). Specific goals and methods to be developed by Utility. May include
accelerated main and service line replacement. Enhanced real loss reduction may include more ambitious main replacement and active leak detection.
Capture water from water main flushing and hydrant flow testing for reuse.
Comments
Time Period
First Year 2013
Cost
Total Multi Year Cost $250,000
Number of Years 10
Maintenance Costs
Annual Maintenance Costs $50,000
Target
Total GPCD Reduction 4.0
Description
Overview
Name Water Loss
Abbr 1
Category 0
Measure Type 3
Water Loss

Appendix Regional Water Demand and Conservation Projections Final Report
P
Measure 2 AMI
#
#
#
#
#
Administration Costs
Markup Percentage 40%
Basis for the starting value cost estimate is $500 per AMI unit
where assumes (a) partial % cost share for the “utility” of
estimated AMI (automatic meter infrastructure) retrofit cost of
$200 with other water utility departments such as operations;
and (b) customer side cost of $300 to cover the reminder of the
total unit cost (assumed paid by rate revenue). Cost estimate
includes leak repair for those customer-side leaks found and
fixed. Cost estimate does not include service leak repair
(assume included in Water Loss Control program).
Annual % of Accts 10%
Outdoor 0%
Target
Pool 0%
Wash Down 0%
Car Washing 0%
0%
Process 0%
Spray Rinse 0%
Bath 0%
External Leakage 0%
OTH $0 $0 0
$0 $0 0
REC $0 $0 0
IRR $0 $0 0
AG $0 $0 0
INST $0 $0 0
MUN
Showers 0%
Dishwashers 0%
Clothes Washers 0%
COM $200 $1,000 1
IND $0 $0 0
Internal Leakage 20%
Other 0%
Irrigation
SF $200 $300 1
MF $200 $300 1
Outdoor
Fixture Costs
Utility Customer Fix/Acct
AGENCY MEASURE: Retrofit system with AMI meters and associated network capable
of providing continuous consumption data to Utility offices. Improved identification
of system and customer leaks is a major conservation benefit. Some costs of these
systems are offset by operational efficiencies and reduced staffing, as regular meter
reading and opening and closing accounts are accomplished without the need for a site
visit. Also enables enhanced billing options and ability to monitor unauthorized usage,
such as use/tampering with closed accounts or irrigation when time of day or days per
week are regulated. Customer service is improved as staff can quickly access
continuous usage records to address customer inquiries. Optional features include
online customer access to their usage, which has been shown to improve
accountability and reduce water use. A ten year change-out would be a reasonable
objective. Require that new, larger or irrigation customers install such AMI meters as
described above and possibly purchase means of viewing daily consumption inside
their home, business, or by their landscape/property managers, either through the
Internet (if available) or separate device. The AMI system would, on demand, indicate
to the customer and Utility where and how their water is used, facilitating water use
reduction and prompt leak identification. This would require Utility to install an AMI
system.
Irrigation
Pool
Wash Down
Car Washing
External Leakage
Dishwashers
Clothes Washers
Process
Spray Rinse
Bath
Internal Leakage
AG
REC
OTH
End Uses
Toilets
Urinals
Faucets
Showers
Other
Comments
Categories
SF
MF
COM
IND
INST
Total Years 5
Permanent TRUE
Years
Repeat ####
Time Period Measure Life
Start Year 2021
Last Year 2025
MUN
IRR
Affects Only New Accounts
Abbr 2
Category 0
Measure Type 1
Overview
Name AMI
Fixture Water Savings
Toilets 0%
Urinals 0%
Faucets 0%
Description
AMI

Appendix Regional Water Demand and Conservation Projections Final Report
Q
Measure 3 Submetering
Measure 4 Pricing
#
# #
#
#
#
#
#
#
#
#
#
#
#
#
#
#
#
Markup Percentage 25%
According to SCVWD study assume 150 submeters per property
for 1-2 properties per year. Estimated cost based on $150 per
meter x 150 DUs = $22,500 per account for utility cost. Also
assumes $50 per meter x 150 DUs per property for customer
cost = $7,500. DU = dwelling unit (i.e., mobile home)” The
participation rate of 0.1% assumes 1 property per 1,000 MF
accounts.
15%
Process 15%
Spray Rinse 15%
Bath 15%
External Leakage 15%
Annual % of Accts 0.10%
Outdoor 15%
Target
Pool 15%
Wash Down 15%
Car Washing 15%
0
Internal Leakage 15%
Other 15%
Irrigation
$0 $0 0
IRR $0 $0 0
Showers 15%
Dishwashers 15%
Clothes Washers 15%
COM $0 $0 0 Administration Costs
SF $0 $0 0
MF $150 $50 150
Outdoor
Fixture Costs
Utility Customer Fix/Acct
AGENCY MEASURE: Require or provide a partial cost rebate to meter all remaining
mobile home parks that are currently master metered but not separately metered.
Pattern after Santa Clara Valley Water District program.
Provide a rebate (per unit) to assist MF building owners installing submeters on each
existing individual apartment or condominium unit.
Provide a rebate (per unit) to assist MF building owners installing submeters on each
new individual apartment unit.
Require the submetering of individual units in new multi-family, condos, townhouses,
and mobile-home parks.
INST $0 $0 0
MUN
IND $0 $0
Wash Down
Car Washing
External Leakage
Dishwashers
Clothes Washers
Process
Spray Rinse
Bath
Internal LeakageOTH
End Uses
Toilets
Urinals
Faucets
Showers
Other
Irrigation
Pool
Categories
SF
MF
COM
IND
INST
Total Years 11
Permanent TRUE
Years 0
Repeat ####
Time Period Measure Life
Start Year 2015
Last Year 2025
MUN
IRR
AG
REC
Affects Only New Accounts
Abbr 3
Category 0
Measure Type 1
Overview
Name Submetering
Fixture Water Savings
Toilets 15%
Urinals 15%
Faucets 15%
Description
Comments
Submetering
Consumer Price Index
First Year Index 100.0
Annual Increase 2%
Rate Study Frequency (every # yrs) 5
First Year of Rate Study 2021
Annual Maintenance Cost $10,000
-0.15 -0.05 CALC'D
Utility Costs
Rate Study Cost $50,000
Price Elasticity
Overall Indoor Outdoor
Benefit to Cost Ratio
Utility CALC'D
Community CALC'D
Cost of Savings per Unit Volume ($/mg)
2035 VARIES CALC'D
2034 VARIES CALC'D
CALC'D
2029 VARIES CALC'D
2030 VARIES
Community CALC'D
Lifetime Costs - Present Value ($)
Utility CALC'D
Community CALC'D
2027 VARIES CALC'D
2028 VARIES CALC'D
Utility CALC'D
2033 VARIES CALC'D
2031 VARIES CALC'D
2032 VARIES CALC'D
2026 VARIES CALC'D
Results
Average Water Savings (mgd)
CALC'D
Lifetime Savings - Present Value ($)
Utility CALC'D
This measure uses the dollar price and SF price
elasticities for the year 2035-36 as provided in the
report written by Sunding and published by the
Brattle Group and SFPUC in 2014. The pricing
measure only addresses SF customer as this was
the only class with price elasticities defined by
Sunding for individual BAWSCA water agencies.
Planned Rate Increases
Change
Year
Price Incr
(%)
Price Incr
Adjusting for
Inflation
Customer Class
Customer Class 1
Time Period
First Year 2021
Abbr 4
Category -1
Measure Type 5
2023 VARIES CALC'D
2024
Overview
Name Conservation Pricing
Description
AGENCY MEASURE: Assumes price increases from
the year 2021 to the year 2040. Converts price
increases to real price increases net of inflation;
Annual increase must be above user set threshold
(such as assuming a 2% inflation) to trigger a
demand reduction. The near term price increases
Comments
VARIES CALC'D
2021 VARIES CALC'D
2022 VARIES CALC'D
2025 VARIES CALC'D
Add Rate Increase
Delete
Delete
Delete
Delete
Delete
Delete
Delete
Delete
Delete
Delete
Delete
Delete
Delete
Delete
Delete
Conservation Pricing

Appendix Regional Water Demand and Conservation Projections Final Report
R
Measure 5A Public Information
Measure 5B Public Information Home Water Use Reports
# #
# #
# #
# #
# #
# #
# #
# #
# #
# #
#
#
#
#
#
#
#
Markup Percentage 15%
Cost assumes SF category but impacts all customer classes.
The $0.23 is the BAWSCA cost per SF connection for the entire
region. BAWSCA budget of $40,000 is spent on WaterWise
Gardening Website, Landscape classes ($26k) and Sponsorships
($6-9k). Add money to this measure if there is additional funds
spent above and beyond the BAWSCA regional program efforts.
0.10%
Process 0.10%
Spray Rinse 0.10%
Bath 0.10%
External Leakage 0.10%
Annual % of Accts 50%
Outdoor 0.10%
Target
Pool 0.10%
Wash Down 0.10%
Car Washing 0.10%
0
Internal Leakage 0.10%
Other 0.10%
Irrigation
$0 $0 0
IRR $0 $0 0
Showers 0.10%
Dishwashers 0.10%
Clothes Washers 0.10%
COM $0 $0 0 Administration Costs
SF $0.23 $0 1
MF $0 $0 0
Outdoor
Fixture Costs
Utility Customer Fix/Acct
BAWSCA REGIONAL MEASURE: Continue with a regional campaign. May modify to be a general “Use Only
What You Need” message like Denver Water's program or a “Beat the Peak” message media campaign like
Cary, North Carolina or Tucson Arizona: aahttp://cms3.tucsonaz.gov/water/beatthepeak. Considering a
program with focused action like: “Take Control of your Controller” Campaign for a focused social media
based campaign as a media campaign. Consider determining appropriate usage and media campaign message
with marketing study/focus groups. Utility would sponsor bilingual training for managers and workers in
landscape maintenance methods that will save irrigation water. Model after Green Gardener Program. Santa
Barbara County Water Agency example: http://www.greengardener.org. With some of these programs,
names of businesses that have obtained training are included in Utility publications and/or Web sites (as an
incentive to participate).
INST $0 $0 0
MUN
IND $0 $0
Wash Down
Car Washing
External Leakage
Dishwashers
Clothes Washers
Process
Spray Rinse
Bath
Internal LeakageOTH
End Uses
Toilets
Urinals
Faucets
Showers
Other
Irrigation
Pool
Categories
SF
MF
COM
IND
INST
Total Years 28
Permanent ####
Years 2
Repeat TRUE
Time Period Measure Life
Start Year 2013
Last Year 2040
MUN
IRR
AG
REC
Affects Only New Accounts
Abbr 5A
Category 0
Measure Type 1
Overview
Name Public Info
Fixture Water Savings
Toilets 0.10%
Urinals 0.10%
Faucets 0.10%
Description
Comments
Public Info
# #
#
#
#
#
#
#
#
#
#
#
#
#
#
Administration Costs
Markup Percentage 15%
Cost excludes start which is $3 per
account. The $9 is based on BAWSCA
bids received in April 2014. Assumes only
SF accounts participate and assume large-
user account targeting to get highest 25%
of users. No customer costs assigned for
this measure as assume customer takes
an action for another measure. This
avoids any double counting with Measure
5A or other measures.
Annual % of Accts 25%
Outdoor 0%
Target
Pool 5%
Wash Down 5%
Car Washing 5%
5%
Process 0%
Spray Rinse 0%
Bath 5%
External Leakage 5%
OTH $0 $0 0
$0 $0 0
REC $0 $0 0
IRR $0 $0 0
AG $0 $0 0
INST $0 $0 0
MUN
Showers 5%
Dishwashers 5%
Clothes Washers 5%
COM $0 $0 0
IND $0 $0 0
Internal Leakage 5%
Other 5%
Irrigation
SF $9 $0 1
MF $0 $0 0
Outdoor
Fixture Costs
Utility Customer Fix/Acct
Irrigation
Pool
Wash Down
Car Washing
External Leakage
Dishwashers
Clothes Washers
Process
Spray Rinse
Bath
Internal Leakage
AG
REC
OTH
End Uses
Toilets
Urinals
Faucets
Showers
Other
Comments
Categories
SF
MF
COM
IND
INST
Total Years 27
Permanent ####
Years 2
Repeat TRUE
Time Period Measure Life
Start Year 2014
Last Year 2040
MUN
IRR
Affects Only New Accounts
Abbr 5B
Category 0
Measure Type 1
Overview
Name Public Info-Home Water Use Reports
Fixture Water Savings
Toilets 5%
Urinals 0%
Faucets 5%
Description
AGENCY MEASURE: Home Water Use
Reports would report for single family
home customers. Provides much more
insights on the water bills, and strongly
promotes customer programs.
Public Info-Home Water Use Reports

Appendix Regional Water Demand and Conservation Projections Final Report
S
Measure 6 School Education
Measure 7 SF MF Surveys
#
#
#
#
#
#
#
Annual % of Accts 5%
Outdoor 0%
Target
Pool 0%
Wash Down 0%
Car Washing 0%
1%
Process 0%
Spray Rinse 0%
Bath 1%
External Leakage 0%
Administration Costs
Markup Percentage 30%
OTH $0 $0 0
$0 $0 0
REC $0 $0 0
IRR $0 $0 0
AG $0 $0 0
INST $0 $0 0
MUN
Showers 1%
Dishwashers 0%
Clothes Washers 0%
COM $0 $0 0
IND $0 $0 0
Internal Leakage 1%
Other 0%
Irrigation
SF $40 $0 1
MF $40 $0 1
Outdoor
Fixture Costs
Utility Customer Fix/Acct
Irrigation
Pool
Wash Down
Car Washing
External Leakage
Dishwashers
Clothes Washers
Process
Spray Rinse
Bath
Internal Leakage
AG
REC
OTH
End Uses
Toilets
Urinals
Faucets
Showers
Other
Comments
BAWSCA $112k budget for 3,221
students. Average cost per student is $34.
Assuming a mostly $35 indoor kit cost
with admin and future cost increases, use
$40 as basis for unit cost.
Categories
SF
MF
COM
IND
INST
Total Years 28
Permanent TRUE
Years 7
Repeat ####
Time Period Measure Life
Start Year 2013
Last Year 2040
MUN
IRR
Affects Only New Accounts
Abbr 6
Category 0
Measure Type 1
Overview
Name School Education
Fixture Water Savings
Toilets 0%
Urinals 0%
Faucets 1%
Description
BAWSCA REGIONAL MEASURE:
School assembly program, classroom
presentations, other options for school
education. Measure based on the
Resource Action Program.
School Education
# #
# #
#
#
#
#
#
#
#
#
#
#
#
#
#
Administration Costs
Markup Percentage 30%
Annual % of Accts 2%
Outdoor 0%
Target
Pool 10%
Wash Down 10%
Car Washing 10%
10%
Process 0%
Spray Rinse 0%
Bath 5%
External Leakage 10%
OTH $0 $0 0
$0 $0 0
REC $0 $0 0
IRR $0 $0 0
AG $0 $0 0
INST $0 $0 0
MUN
Showers 5%
Dishwashers 5%
Clothes Washers 5%
COM $0 $0 0
IND $0 $0 0
Internal Leakage 5%
Other 5%
Irrigation
SF $100 $50 1
MF $100 $50 1
Outdoor
Fixture Costs
Utility Customer Fix/Acct
AGENCY MEASURE: Indoor and outdoor water surveys for existing single family and
multi-family (2 units or more) residential customers. Target those with high water use
and provide a customized report to owner. May include give-away of efficient shower
heads, aerators, and toilet devices. Usually combined with outdoor surveys (see
Irrigation Measures). Customer leaks can go uncorrected at properties where owners
are least able to pay costs of repair. These programs may require that customer leaks
be repaired, with either part of the repair subsidized and/or the cost paid with
revolving funds paid back with water bills over time. May also include an option to
replace inefficient plumbing fixtures at low-income residences. Provide incentive to
install pressure regulating valve on existing properties with pressure exceeding 80 psi.
Irrigation
Pool
Wash Down
Car Washing
External Leakage
Dishwashers
Clothes Washers
Process
Spray Rinse
Bath
Internal Leakage
AG
REC
OTH
End Uses
Toilets
Urinals
Faucets
Showers
Other
Comments
4% of account participants is based on
median value from BAWSCA Water
Conservation Database records (2004-
2013).
Categories
SF
MF
COM
IND
INST
Total Years 28
Permanent ####
Years 5
Repeat TRUE
Time Period Measure Life
Start Year 2013
Last Year 2040
MUN
IRR
Affects Only New Accounts
Abbr 7
Category 0
Measure Type 1
Overview
Name SF MF Surveys
Fixture Water Savings
Toilets 5%
Urinals 0%
Faucets 5%
Description
SF MF Surveys

Appendix Regional Water Demand and Conservation Projections Final Report
T
Measure 8 WS Giveaway
Measure 9 SF MF HECW Rebates
#
#
#
#
Administration Costs
Markup Percentage 25%
Assumes minimum 2 bathrooms per SF account and 4 units or 8
bathrooms per MF account. Utility Costs provided by BAWSCA
for 1.8gpm showerhead / 1.5 gpm aerator kit. Customer cost is
to repair leaks or other minor costs. Current customer
participation based on WCDB Residential retrofit kits measure
record (2004-2013).
Assume kits save 27.6% (reduced to be conservative) by
assuming only 25% of kits are actually installed in the homes
and yield water savings.
Annual % of Accts 2%
Outdoor 0%
Target
Pool 0%
Wash Down 0%
Car Washing 0%
0%
Process 0%
Spray Rinse 0%
Bath 0%
External Leakage 0%
OTH $0 $0 0
$0 $0 0
REC $0 $0 0
IRR $0 $0 0
AG $0 $0 0
INST $0 $0 0
MUN
Showers 7%
Dishwashers 0%
Clothes Washers 0%
COM $0 $0 0
IND $0 $0 0
Internal Leakage 0%
Other 0%
Irrigation
SF $12 $25 2
MF $12 $25 8
Outdoor
Fixture Costs
Utility Customer Fix/Acct
AGENGY MEASURE: Utility would buy showerheads and faucet aerators in bulk and
give them away at Utility office or community events. Need to coordinate this
program with the School Education measure on retrofit kit giveaways to the same
customer categories.
Irrigation
Pool
Wash Down
Car Washing
External Leakage
Dishwashers
Clothes Washers
Process
Spray Rinse
Bath
Internal Leakage
AG
REC
OTH
End Uses
Toilets
Urinals
Faucets
Showers
Other
Comments
Categories
SF
MF
COM
IND
INST
Total Years 7
Permanent TRUE
Years
Repeat ####
Time Period Measure Life
Start Year 2014
Last Year 2020
MUN
IRR
Affects Only New Accounts
Abbr 8
Category 0
Measure Type 1
Overview
Name WS Giveaway
Fixture Water Savings
Toilets 0%
Urinals 0%
Faucets 7%
Description
WS Giveaway
#
#
#
Administration Costs
Markup Percentage 30%
Annual % of Accts 3%
Outdoor 0%
Target
Pool 0%
Wash Down 0%
Car Washing 0%
0%
Process 0%
Spray Rinse 0%
Bath 0%
External Leakage 0%
OTH $0 $0 0
$0 $0 0
REC $0 $0 0
IRR $0 $0 0
AG $0 $0 0
INST $0 $0 0
MUN
Showers 0%
Dishwashers 0%
Clothes Washers 37%
COM $0 $0 0
IND $0 $0 0
Internal Leakage 0%
Other 0%
Irrigation
SF $88 $550 1
MF $50 $550 1
Outdoor
Fixture Costs
Utility Customer Fix/Acct
BAWSCA REGIONAL MEASURE: Provide a rebate for efficient washing machines to
single family homes and apartment complexes with common laundry rooms. It is
assumed that the rebates would remain consistent with relevant state and federal
regulations (Department of Energy, Energy Star) and only offer the best available
technology. This program would be similar the BAWSCA's current program.
Water savings is based on difference
between a 34 gallon per load machine
compared to a 12 gallon per load CEE Tier
3 machine. Rebate of $88/unit cost is
based on a blended rate of current
BAWSCA program data and includes the
PGE share of $75 for most efficient
beyond Tier 3 CEE (see
waterenergysavings.com). This is ($125 +
$50)/2.
Irrigation
Pool
Wash Down
Car Washing
External Leakage
Dishwashers
Clothes Washers
Process
Spray Rinse
Bath
Internal Leakage
AG
REC
OTH
End Uses
Toilets
Urinals
Faucets
Showers
Other
Comments
Categories
SF
MF
COM
IND
INST
Total Years 9
Permanent TRUE
Years 0
Repeat ####
Time Period Measure Life
Start Year 2013
Last Year 2021
MUN
IRR
Affects Only New Accounts
Abbr 9
Category 0
Measure Type 1
Overview
Name SF MF HECW Rebates
Fixture Water Savings
Toilets 0%
Urinals 0%
Faucets 0%
Description
SF MF HECW Rebates

Appendix Regional Water Demand and Conservation Projections Final Report
U
Measure 10 SF MF UHET Rebates
Measure 11 Turf Removal SF
# #
#
Administration Costs
Markup Percentage 30%
Annual % of Accts 1%
Outdoor 0%
Target
Pool 0%
Wash Down 0%
Car Washing 0%
0%
Process 0%
Spray Rinse 0%
Bath 0%
External Leakage 0%
OTH $0 $0 0
$0 $0 0
REC $0 $0 0
IRR $0 $0 0
AG $0 $0 0
INST $0 $0 0
MUN
Showers 0%
Dishwashers 0%
Clothes Washers 0%
COM $0 $0 0
IND $0 $0 0
Internal Leakage 0%
Other 0%
Irrigation
SF $100 $150 2
MF $100 $150 3
Outdoor
Fixture Costs
Utility Customer Fix/Acct
BAWSCA REGIONAL MEASURE: Provide a rebate or voucher for the installation of a
ultra high efficiency toilet (UHET). (Toilets flushing 1.28 gpf or less and include dual
flush technology). Rebate amounts would reflect the incremental purchase cost.
Utility cost is for toilet purchase. Rebate
value based on SCVWD program and
approved by BAWSCA staff for use for
this measure unit cost. Customer cost is
for installation.
Irrigation
Pool
Wash Down
Car Washing
External Leakage
Dishwashers
Clothes Washers
Process
Spray Rinse
Bath
Internal Leakage
AG
REC
OTH
End Uses
Toilets
Urinals
Faucets
Showers
Other
Comments
Categories
SF
MF
COM
IND
INST
Total Years 3
Permanent TRUE
Years 0
Repeat ####
Time Period Measure Life
Start Year 2014
Last Year 2016
MUN
IRR
Affects Only New Accounts FALSE
Abbr 10
Category 0
Measure Type 1
Overview
Name SF MF UHET Rebates
Fixture Water Savings
Toilets 63%
Urinals 0%
Faucets 0%
Description
SF MF UHET Rebates
#
#
#
Administration Costs
Markup Percentage 35%
SCVWD: $1 per sf per site with no cap
(changed as 1/1/2014) 300% increase.
Past average was about 900 s.f. per SF
property. Palo Alto and SJ Muni add $1
per sf. These are non-drought values as
this is a long term study.
Annual % of Accts 1%
Outdoor 0%
Target
Pool 0%
Wash Down 0%
Car Washing 0%
25%
Process 0%
Spray Rinse 0%
Bath 0%
External Leakage 0%
OTH $0 $0 0
$0 $0 0
REC $0 $0 0
IRR $0 $0 0
AG $0 $0 0
INST $0 $0 0
MUN
Showers 0%
Dishwashers 0%
Clothes Washers 0%
COM $0 $0 0
IND $0 $0 0
Internal Leakage 0%
Other 0%
Irrigation
SF $1,000 $2,000 1
MF $0 $0 0
Outdoor
Fixture Costs
Utility Customer Fix/Acct
BAWSCA REGIONAL MEASURE: Provide a per square foot incentive to remove turf and
replace with low water use plants or permeable hardscape. Rebate based on dollars
per square foot removed and capped at an upper limit for single family residences.
Irrigation
Pool
Wash Down
Car Washing
External Leakage
Dishwashers
Clothes Washers
Process
Spray Rinse
Bath
Internal Leakage
AG
REC
OTH
End Uses
Toilets
Urinals
Faucets
Showers
Other
Comments
Categories
SF
MF
COM
IND
INST
Total Years 27
Permanent TRUE
Years 0
Repeat ####
Time Period Measure Life
Start Year 2014
Last Year 2040
MUN
IRR
Affects Only New Accounts
Abbr 11
Category 0
Measure Type 1
Overview
Name Turf Removal SF
Fixture Water Savings
Toilets 0%
Urinals 0%
Faucets 0%
Description
Turf Removal SF

Appendix Regional Water Demand and Conservation Projections Final Report
V
Measure 12 SF WBIC Rebate
Measure 13 Irrigation Incentives
#
#
Administration Costs
Markup Percentage 25%
Annual % of Accts 1%
Outdoor 0%
Target
Pool 0%
Wash Down 0%
Car Washing 0%
15%
Process 0%
Spray Rinse 0%
Bath 0%
External Leakage 0%
OTH $0 $0 0
$0 $0 0
REC $0 $0 0
IRR $0 $0 0
AG $0 $0 0
INST $0 $0 0
MUN
Showers 0%
Dishwashers 0%
Clothes Washers 0%
COM $0 $0 0
IND $0 $0 0
Internal Leakage 0%
Other 0%
Irrigation
SF $700 $800 1
MF $0 $0 0
Outdoor
Fixture Costs
Utility Customer Fix/Acct
BAWSCA REGIONAL MEASURE: Provide a per station rebate (i.e., $25 per station) for
the purchase of a weather based irrigation controller. These controllers have on-site
weather sensors or rely on a signal from a central weather station that modifies
irrigation times at least weekly. Requires local irrigation contractors who are
competent with these products, and so may require sponsoring a training program in
association with this measure.
SCVWD has background information for SF WBICs in a summary
report. From the report the actual SF WBICs controller costs
are estimated to be the following: smaller controller size with 1-
12 stations costs $458 per controller; larger controller cost with
12-24 stations is $1,583. This measure assumes the cost of the
larger 12-24 station controller is ~$1,500. Current customer
participation based on WCDB ET controller rebate program
record (2004-2013).
Irrigation
Pool
Wash Down
Car Washing
External Leakage
Dishwashers
Clothes Washers
Process
Spray Rinse
Bath
Internal Leakage
AG
REC
OTH
End Uses
Toilets
Urinals
Faucets
Showers
Other
Comments
Categories
SF
MF
COM
IND
INST
Total Years 18
Permanent TRUE
Years 0
Repeat ####
Time Period Measure Life
Start Year 2013
Last Year 2030
MUN
IRR
Affects Only New Accounts
Abbr 12
Category 0
Measure Type 1
Overview
Name SF WBIC Rebate
Fixture Water Savings
Toilets 0%
Urinals 0%
Faucets 0%
Description
SF WBIC Rebate
#
#
#
#
#
#
Administration Costs
Markup Percentage 25%
Annual % of Accts 1%
Outdoor 0%
Target
Pool 0%
Wash Down 0%
Car Washing 0%
5%
Process 0%
Spray Rinse 0%
Bath 0%
External Leakage 0%
OTH $0 $0 0
$0 $0 0
REC $0 $0 0
IRR $500 $500 1
AG $0 $0 0
INST $0 $0 0
MUN
Showers 0%
Dishwashers 0%
Clothes Washers 0%
COM $500 $500 1
IND $0 $0 0
Internal Leakage 0%
Other 0%
Irrigation
SF $250 $100 1
MF $100 $100 1
Outdoor
Fixture Costs
Utility Customer Fix/Acct
BAWSCA REGIONAL MEASURE: Provide a rebate or free rain sensor shut-off device for
existing irrigation controllers. These cancel scheduled sprinkling when sufficient rain
has been received. This measure is most effective in areas with intermittent rain in
peak watering seasons.
Require installation of rain sensor shut-off devices when installing new irrigation
systems.
Offer drip conversion kits (RainBird 1800 Retro). Potentially model after Western
MWD's pilot program.
Based on SCVWD program. Average per
site: Rain sensor (rebate $50, $75 cost),
sprinklers ($5 rebate, $6 cost), flow
sensors ($500 per meter rebate, $1556
cost), spray bodies (up to $20 for rebate
and $12 cost for each).
Irrigation
Pool
Wash Down
Car Washing
External Leakage
Dishwashers
Clothes Washers
Process
Spray Rinse
Bath
Internal Leakage
AG
REC
OTH
End Uses
Toilets
Urinals
Faucets
Showers
Other
Comments
Categories
SF
MF
COM
IND
INST
Total Years 16
Permanent TRUE
Years 0
Repeat ####
Time Period Measure Life
Start Year 2015
Last Year 2030
MUN
IRR
Affects Only New Accounts
Abbr 13
Category 0
Measure Type 1
Overview
Name Irrigation Incentives
Fixture Water Savings
Toilets 0%
Urinals 0%
Faucets 0%
Description
Irrigation Incentives

Appendix Regional Water Demand and Conservation Projections Final Report
W
Measure 14 SF Gray Water Retrofit
Measure 15 Landscape Irrigation Code
#
#
Cost of SFPUC Program to reimburse for
cost of permit is $225 per permit.
SCVWD: only landscape to laundry - no
permit systems. SCVWD rebate is $100.
Model customer cost assumes DIY and
cost of materials only. Cost will be much
higher than this if retrofit situation.
Water savings of 10% from CUWCC BMP
reports.
Administration Costs
Markup Percentage 15%
Annual % of Accts 1%
Outdoor 0%
Target
Pool 0%
Wash Down 0%
Car Washing 0%
10%
Process 0%
Spray Rinse 0%
Bath 0%
External Leakage 0%
OTH $0 $0 0
$0 $0 0
REC $0 $0 0
IRR $0 $0 0
AG $0 $0 0
INST $0 $0 0
MUN
Showers 0%
Dishwashers 0%
Clothes Washers 0%
COM $0 $0 0
IND $0 $0 0
Internal Leakage 0%
Other 0%
Irrigation
SF $100 $150 1
MF $0 $0 0
Outdoor
Fixture Costs
Utility Customer Fix/Acct
Irrigation
Pool
Wash Down
Car Washing
External Leakage
Dishwashers
Clothes Washers
Process
Spray Rinse
Bath
Internal Leakage
AG
REC
OTH
End Uses
Toilets
Urinals
Faucets
Showers
Other
Comments
Categories
SF
MF
COM
IND
INST
Total Years 17
Permanent TRUE
Years 0
Repeat ####
Time Period Measure Life
Start Year 2014
Last Year 2030
MUN
IRR
Affects Only New Accounts
Abbr 14
Category -1
Measure Type 1
Overview
Name SF Gray Water Retrofit
Fixture Water Savings
Toilets 0%
Urinals 0%
Faucets 0%
Description
BAWSCA REGIONAL MEASURE: Provide a
rebate to assist a certain percentage of
single family homeowners per year to
install gray water systems.
SF Gray Water Retrofit
#
#
#
#
#
#
#
#
Administration Costs
Markup Percentage 25%
Affects Only New Accounts TRUE
Outdoor 0%
Target
Pool 0%
Wash Down 0%
Car Washing 0%
Annual % of Accts 100%
15%
Process 0%
Spray Rinse 0%
Bath 0%
External Leakage 0%
OTH $0 $0 0
$100 $1,000 1
REC $0 $0 0
IRR $100 $1,000 1
AG $0 $0 0
INST $100 $1,000 1
MUN
Showers 0%
Dishwashers 0%
Clothes Washers 0%
COM $100 $1,000 1
IND $100 $1,000 1
Internal Leakage 0%
Other 0%
Irrigation
SF $0 $0 0
MF $100 $1,000 1
Outdoor
Fixture Costs
Utility Customer Fix/Acct
BAWSCA REGIONAL MEASURE: Develop and enforce Water Efficient Landscape
Design Standards. Standards specify that development projects subject to design
review be landscaped according to climate appropriate principals, with appropriate
turf ratios, plant selection, efficient irrigation systems and smart irrigation controllers.
There are many examples that have demonstrated significant water savings. The
ordinance could require certification of landscape professionals.
Other
Irrigation
Pool
Wash Down
Car Washing
External Leakage
Dishwashers
Clothes Washers
Process
Spray Rinse
Bath
Internal Leakage
MUN
IRR
AG
REC
OTH
End Uses
Toilets
Urinals
Faucets
Showers
Description
Comments
Only new accounts apply. Utility cost is
an inspection cost. Customer cost
assumes it is more expensive to comply
than typical all turf landscape.
Categories
SF
MF
COM
IND
INST
Total Years 28
Permanent TRUE
Years 0
Repeat ####
Time Period Measure Life
Start Year 2013
Last Year 2040
Abbr 15
Category 0
Measure Type 1
Overview
Name Landscape Irrigation Codes
Fixture Water Savings
Toilets 0%
Urinals 0%
Faucets 0%
Landscape Irrigation
Codes
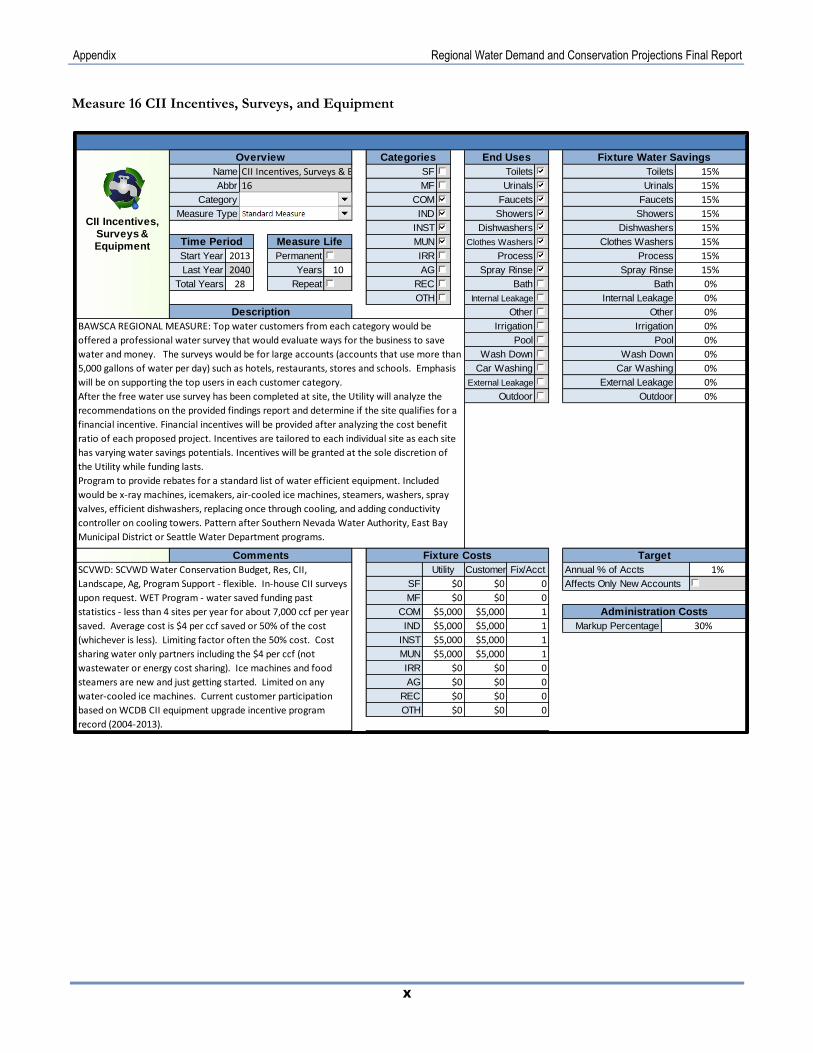
Appendix Regional Water Demand and Conservation Projections Final Report
X
Measure 16 CII Incentives, Surveys, and Equipment
#
#
# #
# #
# #
# #
#
#
#
#
#
Administration Costs
Markup Percentage 30%
SCVWD: SCVWD Water Conservation Budget, Res, CII,
Landscape, Ag, Program Support - flexible. In-house CII surveys
upon request. WET Program - water saved funding past
statistics - less than 4 sites per year for about 7,000 ccf per year
saved. Average cost is $4 per ccf saved or 50% of the cost
(whichever is less). Limiting factor often the 50% cost. Cost
sharing water only partners including the $4 per ccf (not
wastewater or energy cost sharing). Ice machines and food
steamers are new and just getting started. Limited on any
water-cooled ice machines. Current customer participation
based on WCDB CII equipment upgrade incentive program
record (2004-2013).
Annual % of Accts 1%
Outdoor 0%
Target
Pool 0%
Wash Down 0%
Car Washing 0%
0%
Process 15%
Spray Rinse 15%
Bath 0%
External Leakage 0%
OTH $0 $0 0
$5,000 $5,000 1
REC $0 $0 0
IRR $0 $0 0
AG $0 $0 0
INST $5,000 $5,000 1
MUN
Showers 15%
Dishwashers 15%
Clothes Washers 15%
COM $5,000 $5,000 1
IND $5,000 $5,000 1
Internal Leakage 0%
Other 0%
Irrigation
SF $0 $0 0
MF $0 $0 0
Outdoor
Fixture Costs
Utility Customer Fix/Acct
BAWSCA REGIONAL MEASURE: Top water customers from each category would be
offered a professional water survey that would evaluate ways for the business to save
water and money. The surveys would be for large accounts (accounts that use more than
5,000 gallons of water per day) such as hotels, restaurants, stores and schools. Emphasis
will be on supporting the top users in each customer category.
After the free water use survey has been completed at site, the Utility will analyze the
recommendations on the provided findings report and determine if the site qualifies for a
financial incentive. Financial incentives will be provided after analyzing the cost benefit
ratio of each proposed project. Incentives are tailored to each individual site as each site
has varying water savings potentials. Incentives will be granted at the sole discretion of
the Utility while funding lasts.
Program to provide rebates for a standard list of water efficient equipment. Included
would be x-ray machines, icemakers, air-cooled ice machines, steamers, washers, spray
valves, efficient dishwashers, replacing once through cooling, and adding conductivity
controller on cooling towers. Pattern after Southern Nevada Water Authority, East Bay
Municipal District or Seattle Water Department programs.
Irrigation
Pool
Wash Down
Car Washing
External Leakage
Dishwashers
Clothes Washers
Process
Spray Rinse
Bath
Internal Leakage
AG
REC
OTH
End Uses
Toilets
Urinals
Faucets
Showers
Other
Comments
Categories
SF
MF
COM
IND
INST
Total Years 28
Permanent ####
Years 10
Repeat ####
Time Period Measure Life
Start Year 2013
Last Year 2040
MUN
IRR
Affects Only New Accounts
Abbr 16
Category 0
Measure Type 1
Overview
Name CII Incentives, Surveys & Equipment Replacement
Fixture Water Savings
Toilets 15%
Urinals 15%
Faucets 15%
Description
CII Incentives, Surveys & Equipment

Appendix Regional Water Demand and Conservation Projections Final Report
Y
Measure 17 CII HECW Rebates
Measure 18 CII HET Rebates
#
#
#
#
Administration Costs
Markup Percentage 30%
Annual % of Accts 3%
Outdoor 0%
Target
Pool 0%
Wash Down 0%
Car Washing 0%
0%
Process 0%
Spray Rinse 0%
Bath 0%
External Leakage 0%
OTH $0 $0 0
$0 $0 0
REC $0 $0 0
IRR $0 $0 0
AG $0 $0 0
INST $400 $1,100 10
MUN
Showers 0%
Dishwashers 0%
Clothes Washers 37%
COM $400 $1,100 10
IND $400 $1,100 10
Internal Leakage 0%
Other 0%
Irrigation
SF $0 $0 0
MF $0 $0 0
Outdoor
Fixture Costs
Utility Customer Fix/Acct
BAWSCA REGIONAL MEASURE: Provide a rebate for the installation of a high
efficiency commercial washer (HECW). Rebate amounts would reflect the incremental
purchase cost. Program will be shorter lived as it is intended to be a market
transformation measure and eventually would be stopped as efficient units reach
saturation.
Water savings between conventional and
Energy Star machines is 37% from Energy
Star website appliance savings calculator
downloaded on September 20, 2013.
Customer cost based on Tier 3 machines
cost difference of a high end machine
according to Google price research as of
April 2014. Assumes 10 machines per
account.
Irrigation
Pool
Wash Down
Car Washing
External Leakage
Dishwashers
Clothes Washers
Process
Spray Rinse
Bath
Internal Leakage
AG
REC
OTH
End Uses
Toilets
Urinals
Faucets
Showers
Other
Comments
Categories
SF
MF
COM
IND
INST
Total Years 9
Permanent TRUE
Years 0
Repeat ####
Time Period Measure Life
Start Year 2013
Last Year 2021
MUN
IRR
Affects Only New Accounts
Abbr 17
Category 0
Measure Type 1
Overview
Name CII HECW Rebates
Fixture Water Savings
Toilets 0%
Urinals 0%
Faucets 0%
Description
CII HECW Rebates
#
#
#
#
Administration Costs
Markup Percentage 30%
Rebate for utility is $125 premium (less than 1.0 gpf) toilet
purchase. $50 rebate offered for non-UHET. The $150
customer cost is for installation. Current customer participation
based on WCDB measure record (2004-2013). Assumes 10
toilets per CII account.
Annual % of Accts 1%
Outdoor 0%
Target
Pool 0%
Wash Down 0%
Car Washing 0%
0%
Process 0%
Spray Rinse 0%
Bath 0%
External Leakage 0%
$0 $0 0
INST $125 $150 10
MUN
Showers 0%
Dishwashers 0%
Clothes Washers 0%
COM $125 $150 10
IND $125 $150 10
Internal Leakage 0%
Other 0%
Irrigation
SF $0 $0 0
MF $0 $0 0
Outdoor
Fixture Costs
Utility Customer Fix/Acct
BAWSCA REGIONAL MEASURE: Provide a rebate or voucher for the installation of a
high efficiency toilet (HET) - toilets flushing 1.28 gpf or less and include dual flush
technology. Rebate amounts would reflect the incremental purchase cost.
Irrigation
Pool
Wash Down
Car Washing
External Leakage
Dishwashers
Clothes Washers
Process
Spray Rinse
Bath
Internal Leakage
AG
REC
OTH
End Uses
Toilets
Urinals
Faucets
Showers
Other
Comments
Categories
SF
MF
COM
IND
INST
Total Years 8
Permanent TRUE
Years 0
Repeat ####
Time Period Measure Life
Start Year 2013
Last Year 2020
MUN
IRR
Affects Only New Accounts
Abbr 18
Category 0
Measure Type 1
Overview
Name CII HET Rebates
Fixture Water Savings
Toilets 46%
Urinals 0%
Faucets 0%
Description
CII HET Rebates

Appendix Regional Water Demand and Conservation Projections Final Report
Z
Measure 19 HE Urinal Rebates
Measure 20 School Building Retrofit
#
#
#
#
Annual % of Accts 1%
Outdoor 0%
Target
Pool 0%
Wash Down 0%
Car Washing 0%
0%
Process 0%
Spray Rinse 0%
Bath 0%
External Leakage 0%
INST $300 $50 10
Showers 0%
Dishwashers 0%
Clothes Washers 0%
COM $300 $50 10
IND $300 $50 10
Internal Leakage 0%
Other 0%
Irrigation
SF $0 $0 0
MF $0 $0 0
Outdoor
Fixture Costs
Utility Customer Fix/Acct
BAWSCA REGIONAL MEASURE: Provide a rebate or voucher for the installation of a
high efficiency urinals. WaterSense standard is .5 gpf or less, though models flushing as
low as 0.125 gpf (1 pint) are available and function well, so could be specified. Rebate
amounts would reflect the incremental purchase cost of approx. $300.
Irrigation
Pool
Wash Down
Car Washing
External Leakage
Dishwashers
Clothes Washers
Process
Spray Rinse
Bath
Internal Leakage
AG
REC
OTH
End Uses
Toilets
Urinals
Faucets
Showers
Other
Comments
Cost based on SCVWD Direct install unit
cost rebate of $300. Water savings of
75% is based on the difference between
1.0 gpf urinal and a 0.25 gpf to 0.125 gpf
(1 pint) urinal. Assumes 10 urinals per CII
account.
Categories
SF
MF
COM
IND
INST
Total Years 5
Permanent TRUE
Years 0
Repeat ####
Time Period Measure Life
Start Year 2013
Last Year 2017
MUN
IRR
Affects Only New Accounts
Abbr 19
Category 0
Measure Type 1
Overview
Name HE Urinal Rebates
Fixture Water Savings
Toilets 0%
Urinals 75%
Faucets 0%
Description
HE Urinal Rebates
#
#
# #
#
#
# #
#
#
#
#
#
Administration Costs
Markup Percentage 25%
Annual % of Accts 1%
Outdoor 0%
Target
Pool 0%
Wash Down 0%
Car Washing 0%
20%
Process 20%
Spray Rinse 20%
Bath 0%
External Leakage 0%
INST $5,000 $5,000 1
Showers 20%
Dishwashers 0%
Clothes Washers 20%
COM $5,000 $5,000 1
IND $0 $0 0
Internal Leakage 20%
Other 20%
Irrigation
SF $0 $0 0
MF $0 $0 0
Outdoor
Fixture Costs
Utility Customer Fix/Acct
BAWSCA REGIONAL MEASURE: School retrofit program wherein school receives a
grant to replace inefficient fixtures and upgrade irrigation systems. Consider
patterning after other programs. One example is EBMUD's program.
Irrigation
Pool
Wash Down
Car Washing
External Leakage
Dishwashers
Clothes Washers
Process
Spray Rinse
Bath
Internal Leakage
AG
REC
OTH
End Uses
Toilets
Urinals
Faucets
Showers
Other
Comments
The $5,000 utility cost assumes
replacement of high use toilets and some
irrigation system improvement (where
applicable).
Categories
SF
MF
COM
IND
INST
Total Years 15
Permanent TRUE
Years 0
Repeat ####
Time Period Measure Life
Start Year 2016
Last Year 2030
MUN
IRR
Affects Only New Accounts
Abbr 20
Category 0
Measure Type 1
Overview
Name School Building Retrofit
Fixture Water Savings
Toilets 20%
Urinals 20%
Faucets 20%
Description
School Building Retrofit

Appendix Regional Water Demand and Conservation Projections Final Report
AA
Measure 21 Irrigation Surveys
Measure 22 Landscape Budgets and Meters
#
#
#
#
#
#
#
Administration Costs
Markup Percentage 25%
Annual % of Accts 1%
Outdoor 0%
Target
Pool 0%
Wash Down 0%
Car Washing 0%
20%
Process 0%
Spray Rinse 0%
Bath 0%
External Leakage 0%
$1,500 $500 1
IRR $1,500 $500 1
INST $1,500 $500 1
MUN
Showers 0%
Dishwashers 0%
Clothes Washers 0%
COM $1,500 $500 1
IND $0 $0 0
Internal Leakage 0%
Other 0%
Irrigation
SF $0 $0 0
MF $1,500 $500 1
Outdoor
Fixture Costs
Utility Customer Fix/Acct
BAWSCA REGIONAL MEASURE: Outdoor water audits offered for existing large
landscape customers. Normally those with high water use are targeted and provided a
customized report on how to save water. All large multi-family residential, CII, and
public irrigators of large landscapes would be eligible for free landscape water audits
upon request. Tied to the WaterFluence Budget Program.
Irrigation
Pool
Wash Down
Car Washing
External Leakage
Dishwashers
Clothes Washers
Process
Spray Rinse
Bath
Internal Leakage
AG
REC
OTH
End Uses
Toilets
Urinals
Faucets
Showers
Other
Comments
Assumes all large landscape accounts can
apply. Assume average site is 3 acres and
costs $500/acre, $1,500 per site. Current
customer participation based on BAWSCA
Water Conservation Data Base measure
record (2004-2013).
Categories
SF
MF
COM
IND
INST
Total Years 28
Permanent ####
Years 10
Repeat TRUE
Time Period Measure Life
Start Year 2013
Last Year 2040
MUN
IRR
Affects Only New Accounts
Abbr 21
Category 0
Measure Type 1
Overview
Name Irrigation Surveys
Fixture Water Savings
Toilets 0%
Urinals 0%
Faucets 0%
Description
Irrigation Surveys
#
#
#
Administration Costs
Markup Percentage 25%
Annual % of Accts 5%
Outdoor 0%
Target
Pool 0%
Wash Down 0%
Car Washing 0%
10%
Process 0%
Spray Rinse 0%
Bath 0%
External Leakage 0%
$0 $0 0
IRR $2,500 $500 1
INST $0 $0 0
MUN
Showers 0%
Dishwashers 0%
Clothes Washers 0%
COM $0 $0 0
IND $0 $0 0
Internal Leakage 0%
Other 0%
Irrigation
SF $0 $0 0
MF $0 $0 0
Outdoor
Fixture Costs
Utility Customer Fix/Acct
Irrigation
Pool
Wash Down
Car Washing
External Leakage
Dishwashers
Clothes Washers
Process
Spray Rinse
Bath
Internal Leakage
AG
REC
OTH
End Uses
Toilets
Urinals
Faucets
Showers
Other
Comments
Current customer participation based on
BAWSCA Water Conservation Database
measure record (2004-2013). NOTE - This
measure will not have cost data or water
savings if there is no IRR account
category for the water agency.
Categories
SF
MF
COM
IND
INST
Total Years 26
Permanent ####
Years 15
Repeat TRUE
Time Period Measure Life
Start Year 2015
Last Year 2040
MUN
IRR
Affects Only New Accounts
Abbr 22
Category 0
Measure Type 1
Overview
Name Landscape Budgets & Meters
Fixture Water Savings
Toilets 0%
Urinals 0%
Faucets 0%
Description
BAWSCA REGIONAL MEASURE: Website
that provides feedback on irrigation
water use (budget vs. actual) current
WaterFluence Program. May include the
cost for dedicated meter conversion.
Landscape Budgets &
Meters

Appendix Regional Water Demand and Conservation Projections Final Report
BB
Measure 23 Turf Removal CII/MF
Measure 24 CII WBIC Rebate
#
#
#
#
#
Overview
Name Turf Removal CII/MF
Fixture Water Savings
Toilets 0%
Start Year 2014
Last Year 2040
MUN
IRR
Affects Only New Accounts
Abbr 23
Category -1
Measure Type 1
Urinals 0%
Faucets 0%
Description
End Uses
Toilets
Urinals
Faucets
Showers
Other
Comments
Current customer participation based on
BAWSCA WCDB measure record.
Categories
SF
MF
COM
IND
INST
Total Years 27
Permanent TRUE
Years 0
Repeat ####
Time Period Measure Life
Dishwashers
Clothes Washers
Process
Spray Rinse
Bath
Internal Leakage
AG
REC
OTH
SF $0 $0 0
MF $5,000 $20,000 1
Outdoor
Fixture Costs
Utility Customer Fix/Acct
BAWSCA REGIONAL MEASURE: Provide a per square foot
incentive to remove turf and replace with low water use plants
or hardscape. Rebate is based on price per square foot removed,
and capped at an upper limit for multi-family or commercial
residence.
Irrigation
Pool
Wash Down
Car Washing
External Leakage
INST $5,000 $20,000 1
Showers 0%
Dishwashers 0%
Clothes Washers 0%
COM $5,000 $20,000 1
IND $5,000 $20,000 1
Internal Leakage 0%
Other 0%
Irrigation 25%
Process 0%
Spray Rinse 0%
Bath 0%
External Leakage 0%
Administration Costs
Markup Percentage 40%
Annual % of Accts 0.4%
Outdoor 0%
Target
Pool 0%
Wash Down 0%
Car Washing 0%
Turf Removal CII/MF
#
#
#
#
#
Administration Costs
Markup Percentage 20%
Annual % of Accts 1%
Outdoor 0%
Target
Pool 0%
Wash Down 0%
Car Washing 0%
15%
Process 0%
Spray Rinse 0%
Bath 0%
External Leakage 0%
INST $1,000 $2,000 3
Showers 0%
Dishwashers 0%
Clothes Washers 0%
COM $1,000 $2,000 3
IND $1,000 $2,000 3
Internal Leakage 0%
Other 0%
Irrigation
SF $0 $0 0
MF $1,000 $2,000 3
Outdoor
Fixture Costs
Utility Customer Fix/Acct
BAWSCA REGIONAL MEASURE: Provide a per station rebate (i.e. $25 per station) for
the purchase of a weather based irrigation controller. These controllers have on-site
weather sensors or rely on a signal from a central weather station that modifies
irrigation times at least weekly. Requires local irrigation contractors who are
competent with these products, so may require sponsoring a training program in
association with this measure.
Irrigation
Pool
Wash Down
Car Washing
External Leakage
Dishwashers
Clothes Washers
Process
Spray Rinse
Bath
Internal Leakage
AG
REC
OTH
End Uses
Toilets
Urinals
Faucets
Showers
Other
Comments
Cost assumes 25 stations. For large sites
assumes 3 controller needed.
Categories
SF
MF
COM
IND
INST
Total Years 25
Permanent TRUE
Years 0
Repeat ####
Time Period Measure Life
Start Year 2016
Last Year 2040
MUN
IRR
Affects Only New Accounts
Abbr 24
Category 0
Measure Type 1
Overview
Name CII WBIC Rebate
Fixture Water Savings
Toilets 0%
Urinals 0%
Faucets 0%
Description
CII WBIC Rebate

Appendix Regional Water Demand and Conservation Projections Final Report
CC
Measure 25 Sprinkler Nozzle Rebate
#
#
#
#
#
#
Administration Costs
Markup Percentage 20%
Utility cost based on SCVWD program rebate cost of $5. Actual
cost of device is typically $6 per nozzle, so customer cost is $1
per nozzle. Assumes 20 nozzles for SF, 30 nozzles for MF and 50
nozzles for CII accounts. Water savings assumption at 10% is
conservative for Bay Area conditions. Many studies on this
device are from Southern California and claim 20% savings (but
that is for a different climate). The 10% savings is also
conservative as many sites upgrade more than just sprinkler
nozzles if they do a landscape retrofit and do not want to
overstate the water savings for landscape measures.
Annual % of Accts 2%
Outdoor 0%
Target
Pool 0%
Wash Down 0%
Car Washing 0%
10%
Process 0%
Spray Rinse 0%
Bath 0%
External Leakage 0%
$0 $0 0
REC $0 $0 0
IRR $0 $0 0
AG $0 $0 0
INST $5 $1 50
MUN
Showers 0%
Dishwashers 0%
Clothes Washers 0%
COM $5 $1 50
IND $5 $1 50
Internal Leakage 0%
Other 0%
Irrigation
SF $5 $1 20
MF $5 $1 30
Outdoor
Fixture Costs
Utility Customer Fix/Acct
Irrigation
Pool
Wash Down
Car Washing
External Leakage
Dishwashers
Clothes Washers
Process
Spray Rinse
Bath
Internal Leakage
AG
REC
OTH
End Uses
Toilets
Urinals
Faucets
Showers
Other
Comments
Categories
SF
MF
COM
IND
INST
Total Years 26
Permanent ####
Years 7
Repeat TRUE
Time Period Measure Life
Start Year 2015
Last Year 2040
MUN
IRR
Affects Only New Accounts
Abbr 25
Category 0
Measure Type 1
Overview
Name Sprinkler Nozzle Rebate
Fixture Water Savings
Toilets 0%
Urinals 0%
Faucets 0%
Description
BAWSCA REGIONAL MEASURE: Provide
rebates to replace standard spray
sprinkler nozzles with rotating nozzles
that have lower application rates. This is
a current SCVWD program.
Sprinkler Nozzle Rebate
Appendix Regional Water Demand and Conservation Projections Final Report
DD
REFERENCES
Association of Bay Area Governments, Projections, 2013.
Bamezai, A., GPCD Weather Normalization Methodology, Final Report submitted to the California Urban Water Conservation Council, 2011.
BAWSCA Water Conservation Implementation Plan – MWM and BC, 2009.
Maddaus Water Management. DSS SFPUC Wholesale Customer Model, 2004 and 2006.
Maddaus Water Management. BAWSCA Regional Water Conservation Analysis, 2005.
San Francisco Public Utilities Commission (SFPUC). Water System Improvement Program, 2006.
URS Corporation and San Francisco Public Utilities Commission (SFPUC), Investigation of Regional Water Supply Option Number 4, Technical Memorandum, 2006.
URS Corporation and Maddaus Water Management, SFPUC Wholesale Customer Water Demand Projections, 2004.
URS Corporation and Maddaus Water Management, SFPUC Wholesale Customer Water Conservation Potential, 2004.