Embed Size (px)
Citation preview

Regional Water Table (1996) and Water-Level Changes in the Mojave River, the Morongo, and the Fort Irwin Ground-Water Basins, San Bernardino County, California
By GREGORY O. MENDEZ and ALIEN H. CHRISTENSEN
U.S. GEOLOGICAL SURVEY
Water-Resources Investigations Report 97-4160
Prepared in cooperation with the
MOJAVE WATER AGENCY, the
U.S. MARINE CORPS AIR/GROUND COMBAT
CENTER AT TWENTYNINE PALMS, and the
FORT IRWIN NATIONAL TRAINING CENTER
CM C\lCO O
R
Sacramento, California 1997

U.S. DEPARTMENT OF THE INTERIOR
BRUCE BABBITT, Secretary
U.S. GEOLOGICAL SURVEY
Gordon P. Eaton, Director
The use of firm, trade, and brand names in this report is for identification purposes only and does not constitute endorsement by the U.S. Geological Survey.
For additional information write to:
District ChiefU.S. Geological SurveyPlacer Hall6000 J StreetSacramento, CA 95819-6129
Copies of this report can be purchased from:
U.S. Geological Survey Information Services Box 25286 Federal Center Denver, CO 80225

CONTENTS
Abstract........................................................................................................................._ 1Introduction..................................................................................^ 1
Purpose and Scope...................................................................................................................................... 2Acknowledgments.......................................^ 2
Description of the Study Area.............................................................................................................................. 3Geohydrology.............................................^ 3Ground-Water Levels and Movement.................................................................................................................. 4Water-Level Change............................................................................................................................................. 5Long-Term Water-Level Changes........................................................................................................................ 5Short-Term Water-Level Changes........................................................................................................................ 6References.............................................................._ 7
PLATE
1. Map showing regional water table (1996) and water-level changes in the Mojave River, theMorongo, and the Fort Irwin ground-water basins, San Bernardino County, California................. In pocket
FIGURES
1, 2. Maps showing:1. Location of the Moj ave River, the Morongo, and the Fort Irwin ground-water basins...................... 22. Short-term water-level changes in the Mojave River, the Morongo, and the Fort Irwin
ground-water basins............................................................................................................ On Plate 1
TABLES
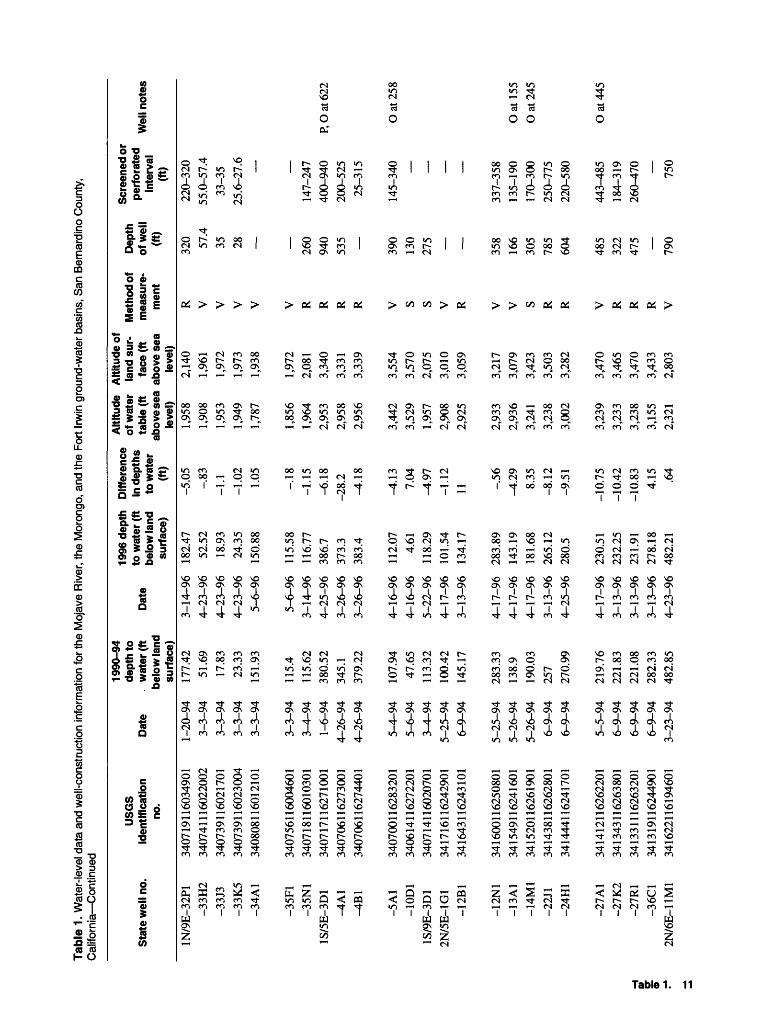
1. Water-level data and well-construction information for the Mojave River, the Morongo, andthe Fort Irwin ground-water basins, San Bernardino County, California................................................. 9
CONVERSION FACTORS
Multiply By To obtain
inch (in.) 25.4 millimeter
foot (ft) 3048 meter
mile (mi) 1.609 kilometer
square mile (mi2) 2.590 square kilometer
Contents III

VERTICAL DATUM AND WELL-NUMBERING SYSTEM
VERTICAL DATUM
Sea level: In this report, "sea level" refers to the National Geodetic Vertical Datum of 1929 (NGVD of 1929) a geodetic datum derived from a general adjustment of the first- order level nets of both the United States and Canada, formerly called Sea Level Datum of 1929.
Water Year: A water year is the 12-month period October 1 through September 30. The water year is designated by the calendar year in which it ends. Thus, the water year ending September 30, 1996, is called water year 1996.
Temperature in degrees Fahrenheit (°F) may be converted to degrees Celsius (°C) as follows:
DC = (°F-32)71.8
WELL-NUMBERING SYSTEM
Wells and springs are identified and numbered according to their location in the rectangular system for the subdivision of public lands. Identification consists of the township number, north or south; the range number, east or west; and the section number. Each section is divided into sixteen 40-acre tracts lettered consecutively (except I and O), beginning with A in the northeast corner of the section and progressing in a sinusoidal manner to R in the southeast corner. Within the 40-acre tract, wells are sequentially numbered in the order they are inventoried. The final letter refers to the base line and meridian. In California, there are three base lines and meridians; Humboldt (H), Mount Diablo (M), and San Bernardino (S). All wells in the study are referenced to the San Bernardino base line and meridian (S). Well numbers consist of 15 characters and follow the format 004N004W36Q001S. In this report, well numbers are abbreviated and written 4N/4W-36Q1. The following diagram shows how the number for well 4N/4W-36Q1 is derived:
R5W R4W R3W R2W R1W
T8N
T7N
T6N
T5N
T4N
SMeridi
o
1CO
:.S .--- <i>CO
COC/J
R4W
Section 36
T 4 N
6
7
18
19
30
31
5
8
17
20
29
32
4
9
16
21
28
33
3
10
15
22
27
34
2
11
14
23
26
35
1
12
13 /
34
,25
1111
D
E
M
N
C
F
L
P
B
G
K
a.
A
H
J
R4N/4W-36Q1
IV Contents

Regional Water Table (1996) and Water-Level Changes in the Mojave River, the Morongo, and the Fort Irwin Ground-Water Basins, San Bernardino County, California
By Gregory O. Mendez and Alien H. Christensen
Abstract
The Mojave River, the Morongo, and the Fort Irwin ground-water basins lie in the southwestern part of the Mojave Desert Region of southern California. These basins supply ground water to local water districts, military bases, and private wells. The rapid growth in population in these basins, which is due, in part, to their proximity to Los Angeles, has increased the demand for water and, therefore, the need to understand the Mojave ground-water systems.
Ground-water conditions for the Mojave River, the Morongo, and the Fort Irwin ground- water basins for 1996 and areas with significant changes in water levels are identified in this report. Water-level data were compiled for 632 wells in the study area during January-September 1996 to define the water-table surface and direction of ground-water movement. These data were used to construct the water-table map included in this report. Also shown on the map are 31 hydrographs that show long-term water-level changes in the study area. Short-term water-level changes were determined and a water-level change map was made by comparing 1996 ground-water conditions to 1990-94 conditions in the Mojave ground- water basin and to 1994 conditions in the Morongo and the Fort Irwin ground-water basins.
In general, ground-water levels and the direction of ground-water movement in the regional aquifer have not changed significantly
since previously published maps (1995). However, the short-term water level did change at specific locations in all three ground-water basins. Water levels in the Mojave River ground-water basin had a maximum rise during the period 1992- 96 of 52 feet and a maximum decline of 28. Water levels in the Morongo ground-water basin had a maximum rise of 66 feet and a maximum decline of 57 feet. The Fort Irwin ground-water basins, however, had relatively little change in water level with a maximum rise of 6 feet and a maximum decline of 8 feet. Hydrographs in the regional aquifer system indicate a decline or, in some areas, no change in the water table during the period of record. Water levels in the shallow alluvial aquifer, generally within 1 mile of the Mojave River, fluctuate in response to streamflow. Ground-water levels rise during wet periods, when floodflows in the Mojave River recharge the shallow alluvial aquifer.
INTRODUCTION
The Mojave River, the Morongo, and the Fort Irwin ground-water basins lie in the southwestern part of the Mojave Desert region of southern California (fig. 1). Surface water, including the Mojave River, is intermittent in most of the region; there is no reliable supply of surface water. Local water districts, municipalities, military bases, and private well owners rely almost entirely on local ground water for supply.
Introduction 1

Mojave 'eserf
San Diego Co | Imperial Co *
California. Mexico
Figure 1. Location of the Mojave River, the Morongo, and the Fort Irwin ground-water basins in the southwestern Mojave Desert, California.
Localized heavy ground-water withdrawal has resulted in overdraft in parts of the basins. To understand and manage the ground-water resources, ground-water conditions periodically need to be documented.
This study was done by the U.S. Geological Survey (USGS), in cooperation with the Mojave Water Agency, the U.S. Marine Corps Air/Ground Combat Center at Twentynine Palms (USMCAGCC), and the Fort Irwin National Training Center (NTC).
Purpose and Scope
The purposes of this study were to document the ground-water conditions for the Mojave River, the Morongo, and the Fort Irwin ground-water basins in 1996 and to identify areas that have had significant
short- or long-term water-level change. In 1996, water- levels were measured in 632 wells (table 1, at back of report) and the data were used to construct a water- table map (pi. 1, in pocket). Historical water-level data were used to construct hydrographs (pi. 1) that show long-term water-level changes in selected wells in the study area. Short-term water-level changes in the Mojave River, the Morongo, and the Fort Irwin ground-water basins were determined by comparing 1996 and 1990-94 data.
Acknowledgments
The authors thank the local water agencies that provided water-level data and access to their wells for this study: the city of Adelanto, the Apple Valley
2 Regional Water Table (1996), Water-Level Changes Mojave River, Morongo, Ft. Irwin Ground-Water Basins, San Bernardino Co.

Ranchos Water Company in Apple Valley, the Baldy Mesa and the Hesperia Water Districts in Hesperia, the Bighorn-Desert View Water Agency in Landers, the Hi-Desert Water District in Yucca Valley, the Joshua Basin Water District in Joshua Tree, the Twentynine Palms Water District in Twentynine Palms, and the Victor Valley Water District in Victorville. The authors also thank the personnel of the USGS for their dedicated assistance and attention to detail in the collection, review, and graphical representation of data.
DESCRIPTION OF THE STUDY AREA
The climate of the Mojave Desert region of southern California is characterized by low precipitation and humidity and temperatures that range from above 100°F in the summer to below 32°F in the winter. Average annual precipitation in the study area ranges from 4 to 6 in., although it can be greater than 20 in. in the San Bernardino and the San Gabriel Mountain Ranges to the south (Rantz, 1969). Recharge to the ground-water system from direct infiltration (areal recharge) of precipitation is minimal.
The area of the Mojave River, the Morongo, and the Fort Irwin ground-water basins is about 2,430 mi2 (fig. 1). Although these basins are largely undeveloped, desert communities are expanding rapidly in areas within commuting distance of the Los Angeles metropolitan area. The military bases the NTC north of Barstow and the USMCAGCC near Twentynine Palms cover much of the study area (pi. 1). Agricultural development primarily is concentrated along the Mojave River and around the communities of Newberry Springs and Lucerne Valley.
The Mojave River ground-water basin has an area of about 1,400 mi2 and extends from the San Bernardino and the San Gabriel Mountains on the south to Afton Canyon on the northeast (pi. 1). The basin is bounded by Antelope Valley to the west and shares its southeastern boundary with the Morongo ground-water basin near the town of Lucerne Valley. The Mojave River ground-water basin consists of several alluvial-filled valleys and ground-water basins that are hydraulically connected. The Mojave River ground-water basin, which is an adjudicated ground- water basin, consists of five subareas: Alto, Baja, Centra, Este, and Oeste (fig. 2 on pi. 1). The Alto subarea has a component called the Alto Transition area, which is the area between the Lower Narrows and the Centra subarea.
The Mojave River is the principal source of ground-water recharge to the Mojave River ground- water basin. When surface water is present, the river flows northward from the San Bernardino Mountains through Victorville, then eastward through Barstow, and exits the Mojave ground-water basin at Afton Canyon almost 100 mi from its headwaters.
The Morongo ground-water basin has an area of about 1,000 mi2 and is bounded by the San Bernardino Mountains to the southwest, the Granite and the Ord Mountains to the northwest, the Bullion Mountains to the northeast, and the Little San Bernardino and the Pinto Mountains to the south (pi. 1). The Morongo ground-water basin is divided into 17 ground-water subbasins: Copper Mountain, Deadman, Emerson, Fry, Giant Rock, Johnson, Joshua Tree, Lucerne, Mainside, Means, Mesquite, Pipes, Reche, Surprise Spring, Twentynine Palms, Upper Johnson, and Warren (fig. 2 on pi. 1). The Morongo ground-water basin has no significant source for ground-water recharge other than from small, intermittent washes.
The Irwin, the Langford, and the Bicycle ground-water basins are referred to in this report as the Fort Irwin ground-water basins (pi. 1). These three basins lie within and provide the water supply to the NTC. The Fort Irwin ground-water basins have a total area of about 30 mi2. Similar to the Morongo ground- water basin, the Fort Irwin ground-water basins have no perennial surface-water and, therefore, no significant source of natural ground-water recharge.
GEOHYDROLOGY
Non-water-bearing igneous and metamorphic rocks underlie the ground-water basins and form the surrounding mountains and hills in the study area. These rocks contain virtually no water, except in joints or fractures. In some places within the ground-water basins and along their boundaries, these non-water bearing rocks are not exposed, but their presence above the altitude of the water table forms a barrier to ground- water movement.
In the Mojave River ground-water basin, the water-bearing deposits are unconsolidated and partly consolidated continental deposits of Quaternary and Tertiary age. These deposits form two major aquifers: a shallow alluvial aquifer and an underlying regional aquifer. The shallow alluvial aquifer overlies the regional aquifer along the Mojave River and consists of permeable river deposits as thick as 200 ft that are
Geohydrology 3

generally within 1 mi of the river. The shallow alluvial aquifer is the most productive aquifer in the ground- water basin and yields much of the ground-water supply. The regional aquifer consists of unconsolidated older alluvium, fan deposits, and partly consolidated to consolidated sedimentary deposits as thick as 1,000 ft. These deposits are generally fine grained and their permeability declines with depth.
Continental deposits of Quaternary and Tertiary age fill the Morongo ground-water basin to a maximum depth of 10,000 ft near the eastern edge of the basin north of Deadman Lake (Moyle, 1984). In general, the continental deposits are unconsolidated at land surface and become partly consolidated with depth. Most wells in the ground-water basin yield water from the unconsolidated deposits.
The Fort Irwin ground-water basins (modified from Wilson F. So and Associates, 1989) are filled with unconsolidated alluvial deposits from Quaternary to Tertiary age. The alluvial deposits are as thick as 950 ft in the northern part of the Irwin ground-water basin (Densmore and Londquist, in press). Preliminary seismic studies of the Bicycle and the Langford ground-water basins, which are two of the Fort Irwin ground-water basins, indicate that the alluvial deposits are as thick as 1,000 ft (David L. Berger, U.S. Geological Survey, written commun., 1996).
The Mojave Desert region of southern California is dominated by northwest- to southeast-trending right- lateral faults, which indicate some vertical movement. Large differences in water levels across some of these faults indicate that they are impediments to ground- water movement. The fault coverage shown on plate 1 was modified from Bortugno (1986) and Cox and Wilshire (1994). A fault coverage was not available north of latitude 35°N.
GROUND-WATER LEVELS AND MOVEMENT
Water-level data were collected from 632 wells (table 1) during January-September 1996 to define the water-table surface and the direction of ground-water movement in the study area (pi. 1). The water table is best defined as the surface on which the fluid pressure in the pores of a porous medium is exactly atmospheric. The location of this surface is revealed by the level at which water stands in a shallow well open along its length and penetrating the surficial deposits just deep enough to encounter standing water in the
bottom (Freeze and Cherry, 1979). Most water levels were measured by the USGS with calibrated steel or electric tapes. Some water levels were reported by local water agencies (table 1). Water-table altitudes were calculated by subtracting the measured depth to water from the land-surface datum (determined from a leveling survey or estimated from topographic maps).
The USGS and other agencies have completed multiple-well monitoring sites (nested wells) within the study area for the collection of depth-dependent data (table 1). The water-table map (pi. 1) presents data collected from the shallowest well at a multiple-well monitoring site, except if the well is perforated in a perched aquifer. One area where perched water is well documented (2N/9E-29M3, -32J1, and -32R3, table 1) is in the Mainside subbasin under Mesquite Dry Lake (Morongo ground-water basin) and is about 140 ft above the regional aquifer (2N/9E-29Q1 and 29R1, table 1).
Ground water flows from areas of higher to areas of lower water-level altitude and perpendicular to lines of equal water-table altitude (contours) presented on the water-table map (pi. 1). In areas where water-table data were unavailable for 1996, the general shape of the contour was defined on the basis of previous water- table maps by Stamos and Predmore (1995) and Trayler and Koczot (1995). An inset map of southern Warren subbasin, within the Morongo ground-water basin, was made to enhance the detail of water-level contours in the Yucca Valley area (inset A, pi. 1).
Inspection of water-table contours in the vicinity of faults indicates that some faults in the study area are barriers to ground-water flow (pi. 1). The barrier effect of the faults is probably caused by compaction and deformation of water-bearing deposits immediately adjacent to the faults and by cementation of the fault zone by mineral deposits from ground water (Londquist and Martin, 1991). For example, there is approximately a 60-ft drop in the water level across the Calico-Newberry Fault, which crosses the Mojave River about 10 mi east of Barstow in the Mojave River ground-water basin. Similarly, there is a change in the water level of more than 300 ft across the Surprise Spring Fault near the extinct Surprise Spring about 10 mi east of Landers in the Morongo ground-water basin. The effect of faults on ground-water flow is emphasized by the past and current existence of springs at fault boundaries (Mesquite Spring, Old Woman Springs, Rabbit Springs, and Surprise Spring), which
4 Regional Water Table (1996), Water-Level Changes Mojave River, Morongo, Ft. Irwin Ground-Water Basins, San Bernardino Co.

indicates that ground water is, or has been, diverted to the surface at these locations.
WATER-LEVEL CHANGE
Historical water-level data were used in conjunction with data collected during this study to determine both long-term and short-term water-level changes in the study area. Long-term water-level changes were determined by constructing water-level hydrographs of wells in different parts of the study area (pi. 1) and short-term water-level changes (fig. 2 on pi. 1) were determined by comparing 1996 ground-water levels with previously published water-level measurements collected in 1990-94 (Stamos and Predmore, 1995) for the Mojave River ground-water basin and 1994 (Trayler and Koczot, 1995) for the Morongo and the Fort Irwin ground-water basins (table 1; fig. 2 on pi. 1).
LONG-TERM WATER-LEVEL CHANGES
Thirty-one hydrographs show (pi. 1) long-term water-level changes in the study area. Selected hydrographs include data from more than one well in order to show a longer period of record. These long- term hydrographs indicate a general decline in water levels in wells near areas of heavy ground-water withdrawal in the regional aquifer.
In the Alto subarea of the Mojave ground-water basin, water levels have declined as much as 60 ft since the 1940's (4N/3W-1M1 and 5N/5W-22E1, -22E2). This decline is a reflection of ground-water withdrawal for the cities of Adelanto, Apple Valley, Hesperia, and Victorville. In the Centre subarea, water levels west of Harper Lake (11N/4W-29R1) have declined about 90 ft since 1954; water levels east of Harper Lake (11N/3W- 28R1, -28R2) have declined about 30 ft since 1950, probably because of agricultural pumpage; and water levels east of Iron Mountain and south of the Mojave River (combined hydrograph 9N/2W-19B1 and 9N/ 3W-13R1) have declined about 30 ft since 1932. Water levels have remained relatively constant in the southeastern part of the subarea (9N/1W-27D1), where ground-water withdrawal from the regional aquifer is minimal. In the eastern part of the Baja subarea near Newberry Springs, the water table has declined as much as 75 ft since 1930 (9N/3E-34D1, -34N1); this
decline also reflects the effects of ground-water withdrawal for agriculture.
The hydrographs of wells in the shallow alluvial aquifer in the Alto and the Centro subareas, and to a lesser degree in the Baja subarea, show alternating periods of declining and rising water levels (4N/4W- 1D2; 5N/4W-11P1, -11P3; 8N/4W-12Q1; 8N/4W- 31R1; 9N/3E-3D1, -3D2; 10N/2W-32B1, and-33R16). This cyclic pattern is related to the amount of flow in the Mojave River. During dry periods, when most of the Mojave River is dry and recharge from the river to the shallow alluvial aquifer is minimal, ground-water levels decline in response to natural discharge (evapotranspiration and ground-water underflow to other subbasins) and ground-water withdrawal. Ground-water levels rise during wet periods, when floodflows in the Mojave River recharge the shallow alluvial aquifer.
In the Alto and the Centro subareas of the Mojave ground-water basin, long-term hydrographs indicate a general declining trend for wells in the shallow alluvial aquifer. The exception to this declining trend is shown by the hydrographs for wells (5N/4W-11P1, -11P3; 7N/4W-30C1), which have remained relatively constant. These wells are in the vicinity of the Narrows near Victorville where the Mojave River flows perennially. However, long-term hydrographs for wells in the Baja subarea indicate water-level declines of 50 ft or more (9N/1E-10L1; 9N/ 3E-3D1, -3D2 and 9N/3E-34D1, -34N1). Lines (1996) estimated that the shallow alluvial aquifer in the Alto and the Centro subareas receives some recharge from the Mojave River each year, whereas the aquifer in the Baja subarea receives recharge only during periods of high flow. The water-level declines in the Baja subarea are the result of natural discharge and agricultural pumpage.
In the Morongo ground-water basin, hydrographs indicate that water-levels have remained relatively constant in the Copper Mountain, the Deadman, the Johnson, and the Mesquite subbasins (1N/7E-23A1; 3N/7E-36G1, 3N/8E-29C1; 4N/3E- 23G1; 1N/8E-12G1 and 1N/9E-33H2, respectively) where the population is small and the pumpage is minimal. Available data were insufficient to determine long-term water-table fluctuations in the Emerson, the Fry, the Pipes, or the Upper Johnson subbasins. Water- tables have declined in the Lucerne, the Reche, the Surprise Spring, the Twentynine Palms, and the Warren subbasins. In the Lucerne subbasin, the water levels
Long-Term Water-Level Changes 5

have declined about 100 ft in wells 5N/1W-25G1 and 5N/1E-17D1 since the early 1950's. In the Reche subbasin, The water level has declined 45 ft in well 2N/ 6E-18B1 since 1963. In the Twentynine Palms subbasin, the water level has declined 32 ft in well IS/ 9E-3D1 since 1940. In the Surprise Spring subbasin, the water levels have remained relatively constant in well 3N/7E-31E1, but it has declined 115 ft in well 2N/ 7E-2C1 since 1952 as a result of ground-water withdrawal for USMCAGCC. In the Warren subbasin near Yucca Valley, water levels have declined 309 ft in wells 1N/5E-36K1 AND -36K2 (combined hydrograph, pi. 1), since 1947. In the western part of the Warren subbasin, the water table has declined about 178 ft in well 1N/5E-34N1 since the late 1950's. These large declines probably are a result of pumpage for the Yucca Valley area.
In the Fort Irwin ground-water basins, data were available to construct long-term hydrographs for wells 14N/3E-14H1 and -32J1 in the Bicycle and the Irwin ground-water basins, respectively. These long-term hydrographs indicate that ground-water withdrawals to supply the NTC have resulted in water-table declines of about 70 ft since the late 1960's in the northern part of the Bicycle ground-water basin and about 30 ft since 1943 in the central part of the Irwin ground-water basin.
SHORT-TERM WATER-LEVEL CHANGES
A water-table change map (fig. 2 on pi. 1) was made by comparing 1996 ground-water levels with water levels reported by Stamos and Predmore (1995) for the Mojave River ground-water basin and by Trayler and Koczot (1995) for the Morongo ground- water basin. Short-term water-level changes were determined by comparing 1996 ground-water levels with previously published water-level measurements collected during 1990-94 for the Mojave River ground-water basin and during 1994 for the Morongo ground-water basin (Trayler and Koczot, 1995). Twenty wells measured in 1994 in the Fort Irwin ground-water basins were compared with 1996 water- level data.
In the Mojave River ground-water basin, the maximum water table rise was 52 ft and the maximum decline was 28 ft during the period 1992-96. The water level rose in at least one well during this period in all subareas. The most significant rises were in the Alto and the Centre subareas in the shallow alluvial aquifer,
owing to ground-water recharge from floodflows in the Mojave River. Near the headwaters of the Mojave River in the Alto subarea, the water level rose about 22 ft in well 4N/3W-31L9. In the Transition area (within the Alto subarea), two wells had a rise in water level, the largest of which was about 30 ft in well 7N/4W- 6N1. Where the Mojave River enters the Centre subarea, the water level rose about 13 ft in well 8N/4W- 10Q1. Near Barstow, the water level rose about 45 ft in well 9N/3W-1R7 and 52 ft in well 9N/2W-1A2. East of Barstow, the water level rose about 28 ft in well 9N/ 1W-4J8. In the Baja subarea, east of the Camp Rock- Harper Lake Fault zone, formerly called the Waterman Fault, the water table indicated no significant change from previous measurements. In the Este subarea, the water level in well 4N/2W-12N2 rose about 12 ft. In the Oeste subarea, the water level in well 5N/7W-17D1 rose about 7 ft.
The water-table change map also indicates the Mojave River ground-water basin had some areas where the water table has declined. In the Alto, the Centre, the Este, and the Oeste subareas, 11 wells indicated a decline in the water table. In the Baja subarea north of the Mojave River, 13 wells indicated a decline. The quantity and frequency of flow in the Mojave River declines rapidly when it reaches the Baja subarea (Lines, 1996); therefore, this subarea does not receive much ground-water recharge from stormflo ws.
In the Morongo ground-water basin, the maximum rise in the water table was 66 ft and the maximum decline was 57 ft. There was an rise in water levels in only 6 of the 17 ground-water subbasins. Of the wells measured in the Copper Mountain, the Deadman, the Pipes, and the Surprise Spring subbasins, only one well in each subbasin had a rise in water level. In the Lucerne subbasin, five wells had a rise in water levels with the largest rise of about 14 ft in well 5N/1W-36R1. The largest water table rise and decline in the Morongo ground-water basin was in the Warren subbasin. The water-level rise of nearly 66 ft in well 1N/5E-36K3 probably resulted from a decrease in pumpage in the subbasin. The decline of nearly 57 ft in well 1N/6E-31C1 probably resulted from inadequate time for recovery from pumping before the water-level measurement was made. The water-table change map also indicates that the water table declined by more than 5 ft in wells near the towns of Landers, Twentynine Palms, and Yucca Valley, which are supplied by municipal and domestic withdrawals of ground water.
6 Regional Water Table (1996), Water-Level Changes Mojave River, Morongo, Ft. Irwin Ground-Water Basins, San Bernardino Co.
The water table in the Fort Irwin ground-water basins has remained relatively unchanged, with a maximum rise in the water table of 6 ft and the maximum decline of 8 ft. Of the 11 wells measured in the Irwin ground-water basin, only well 14N/3E-32P6 indicated a significant rise in the water table (about 6 ft). In the Bicycle ground-water basin, well 14N/3E- 24H1 had a decline in the water level of about 6 ft and well 14N/4E-18N2 had a decline of about 8 ft. In the Langford ground-water basin, none of the four wells measured had water level fluctuations of more than 5 ft.
References
Bortugno, E.J., 1986, Map showing recency of faulting, San Bernardino, Quadrangle, California: California Division of Mines and Geology Regional Geologic Map Series, San Bernardino Quadrangle-map no. 3A, scale 1:250,000.
Cox, B.F., and Wilshire, H.G.,1994, Geologic map of the Yermo Annex and vicinity, Marine Corps Logistics Base, Barstow, California: U.S. Geological Survey Open-File Report 94-681, scale 1:12,000,1 sheet.
Densmore, J.N., and Londquist, C.J., in press, Ground-water hydrology and water quality of Irwin Basin at Fort Irwin National Training Center, California: U.S. Geological Survey Water-Resources Investigations Report 97-4092,110 p.
Freeze, A.R., and Cherry, J.A., 1979, Groundwater:Englewood Cliffs, New Jersey, Prentice-Hall, 604 p.
Lines, G.C., 1996, Ground-water and surface-water relations along the Mojave River, southern California, U.S. Geological Survey Water-Resources Investigations Report 95-4189,43 p.
Londquist, C.J., and Martin, P., 1991, Geohydrology and ground-water-flow-simulation of the Surprise Spring Basin aquifer system, San Bernardino County, California: U.S. Geological Survey Water-Resources Investigations Report 89-4099, 41 p.
Moyle, W.R., Jr., 1984, Bouguer gravity anomaly map of the Twentynine Palms Marine Corps Base and vicinity, California: U.S. Geological Survey Water-Resources Investigations Report 84-4005, scale 1:62,500,1 sheet.
Rantz, S.E., 1969, (1972), Mean annual precipitation in the California region: U.S. Geological Survey Open-File Report, 5 p., scale 1:1,000,000, 2 sheets.
Schaefer, D.H., 1978, Ground-water resources of the Marine Corps Base, Twentynine Palms, San Bernardino County, California: U.S. Geological Survey Water- Resources Investigations Report 77-37, 29 p.
Stamos, C.L., and Predmore, S.K., 1995, Data and water- table map of the Mojave River ground-water basins, San Bernardino County, California, November 1992: U.S. Geological Survey Water-Resources Investigations Report 95-4148, scale 1:125,000,1 sheet.
Trayler, C.R., and Koczot, K.M., 1995, Regional water table (1994) and water-level changes in the Morongo Basin, San Bernardino County, California: U.S. Geological Survey Water-Resources Investigations Report 95- 4209, scale 1:125,000,1 sheet.
Wilson F So and Associates, 1989, U.S. Army National Training Center at Fort Irwin California, Water Basin Development Plan, Final report, June 1989: Consultant's Report prepared for and in the files of the commander of the National Training Center at Fort Irwin, 85 p.
References 7

oc,

Tab
le 1
. Wat
er-le
vel d
ata
and
wel
l-con
stru
ctio
n in
form
atio
n fo
r the
Moj
ave
Riv
er, t
he M
oron
go,
and
the
Fort
Irwin
gro
und-
wat
er b
asin
s, S
an B
erna
rdin
o C
ount
y, C
alifo
rnia
[ft, f
oot.
Stat
e w
ell N
o.: S
ee "
Wel
l-Num
berin
g Sy
stem
" se
ctio
n in
text
; som
e nu
mbe
rs s
ubje
ct to
cha
nge
upon
ver
ifica
tion.
U.S
. Geo
logi
cal S
urve
y (U
SGS)
iden
tific
atio
n N
o.: l
atitu
de, l
ongi
tude
, and
sequ
ence
nu
mbe
r. W
ater
-leve
l diff
eren
ce, c
ompa
rison
bet
wee
n 19
96 d
ata
and
1990
-94
data
(Sta
mos
and
Pre
dmor
e, 1
995;
Tra
yler
and
Koc
zot,
1995
). M
easu
rem
ent m
etho
d: A
, airl
ine;
R, r
epor
ted
by lo
cal w
ater
ag
enci
es; S
, ste
el ta
pe; V
, cal
ibra
ted
elec
tric
tape
. ,
no d
ata.
Wel
l not
es:
D, d
ry; H
, wel
ls u
sed
for h
isto
rical
dat
a on
hyd
rogr
aphs
; N, d
ata
not p
lotte
d on
pla
te 1
bec
ause
of o
verc
row
ding
of s
imila
r dat
a;
O, o
bstru
ctio
n at
spe
cifie
d de
pth;
P, p
umpi
ng; P
W, w
ell w
ith p
erch
ed w
ater
; R, r
ecen
t pum
ping
; S, n
earb
y pu
mpi
ng]
51 a (D *
Stat
e w
ell n
o.
1N/5
E-2N
1-2
8N1
-33J
1-3
4K1
-34N
1
-34P
4-3
4Q1
-34Q
2-3
5K1
-35P
1
-36H
2-3
6K1
-36K
2-3
6K3
-36L
1
-36M
11
-36M
21
-36M
31
-36M
4-3
6M6
1N/6
E-13
R1
-17A
1-2
5M2
-29J
3-2
9R3
USG
S Id
entif
icat
ion
no.
3411
4411
6260
601
3408
1511
6281
301
3407
2911
6272
901
3407
2911
6264
701
3407
2511
6272
401
3407
2711
6270
801
3407
2411
6264
801
3407
2711
6263
801
3407
2911
6253
701
3407
2211
6260
301
3407
5111
6241
901
3406
3511
6244
601
3407
3611
6244
601
3407
3811
6244
301
3407
3411
6245
401
3407
3711
6250
801
3407
3711
6250
802
3407
3711
6250
803
3407
3111
6251
001
3407
3211
6251
601
3409
5311
6175
801
3410
3611
6221
301
3408
1711
6185
801
3408
2111
6220
901
3408
1611
6220
901
Dat
e 5-
6-94
1-5-
941-
4-94
1-6-
941-
4-94
1-5-
941-
6-94
1-5-
94
1-5-
94 1-
5-94
1-4-
941-
4-94
5-23
-94
5-23
-94
5-23
-94
1-4-
941-
4-94
5-3-
946-
9-94
3-30
-94
7-29
-94
7-29
-94
1990
-94
dept
h to
w
ater
(ft
belo
w la
nd
surf
ace)
255.
9741
5.2
385
428.
542
3.7
409.
635
433
5.2
322.
3 42
3.2
374
413.
1
368.
86
430.
441
4.7
440.
5229
7.57
444.
62
180
186
Dat
e
5-15
-96
4-16
-96
4-16
-96
4-25
-96
4-25
-96
3-26
-96
4-25
-96
4-25
-96
3-26
-96
4-25
-96
4-25
-96
4-25
-96
4-25
-96
3-26
-96
3-12
-96
3-12
-96
3-15
-96
4-25
-96
4-25
-96
5-22
-96
4-25
-96
4-30
-96
4-16
-96
4-17
-96
1996
dep
th
to w
ater
(ft
belo
w la
nd
surf
ace)
44.2
911
1.48
253.
0941
3.5
377
431.
741
9.5
408.
333
5.4
337.
7
306.
2 37
4.3
308.
137
9.3
387.
17
290.
76
280.
3437
136
1.4
440.
4528
0.2
448.
54
175.
2617
8.08
Dif
fere
nce
in d
epth
s to
wat
er
(ft)
2.88
1.7
8 -3.2 4.2
1.3
18.6
-2.5
16.1 48
.965
.933
.8
-18.
31
59.4
53.3 .0
717
.37
-3.9
2 4.
747.
92
Alti
tude
of
wat
er
tabl
e (f
t ab
ove s
ea
leve
l)3,
476
3,52
43,
118
2,96
72,
963
2,92
82,
941
2,95
22,
925
2,94
2
2,90
4
2,85
62,
922
2,85
1
2,85
3 2,
949
2,96
02,
874
2,88
4
2,21
03,
029
2,27
4 2,
920
2,92
7
Alti
tude
of
land
sur
fa
ce (f
t ab
ove
sea
leve
l)3,
520
3,63
53,
371
3,38
03,
340
3,36
03,
360
3,36
03,
260
3,28
0
3,21
03,
230
3,23
03,
230
3,23
0
3,24
0 3,
240
3,24
03,
245
3,24
5
2,65
03,
309
2,72
3 3,
095
3,10
5
Met
hod
of
mea
sure
m
ent
S S V R R R R R R R R R R R V
V
V R R V R R S V
Dep
th
of w
ell
(ft)
310
640
548
1,01
075
799
086
050
4
1,00
033
380
51,
115
735
570
390
300
800
800
715 500
803
680
Scre
ened
or
perf
orat
ed
inte
rval
(ft
)
245-
310
340-
640
245-
545
398-
1,01
037
0-57
136
0-90
030
0-85
019
4-49
4
400-
1,00
0 30
7-77
055
0-1,
115
275-
725
550-
570
370-
390
280-
300
400-
800
450-
800
455-
710
452
350-
773
360-
660
Wel
l not
es
O a
t 280
H N
(OSe
e fo
otno
te a
t end
of t
able
.

Tab
le 1
. Wat
er-le
vel d
ata
and
wel
l-con
stru
ctio
n in
form
atio
n fo
r the
Moj
ave
Riv
er, t
he M
oron
go, a
nd th
e Fo
rt Irw
in g
roun
d-w
ater
bas
ins,
San
Ber
nard
ino
Cou
nty,
C
alifo
rnia
Con
tinue
d
Regional Water
' » 2 i ~ 1 1 2. O ffi to 8 T 0 ICD 31 < S o o 3
<O O i 5' O 3 c 3 Q. i 0 00
ffi 2. jo 3 00 CD 3 ffi 5. 3 O O O
Stat
e w
ell n
o.
1N/6
E-3
1C1
-31E
1-3
1G1
1N/7
E-1
0N1
-22D
1
-22L
2-2
3A1
-23P
1-2
8Q1
-34B
1
-34D
11N
/8E
-12G
1-3
0J2
-30N
1-3
3A2
-34M
1-3
4N1
-36A
1-3
6G1
1N/9
E-4
N3
-16H
4-1
7E1
-27C
1-3
1A4
-31C
1
USG
S id
entif
icat
ion
no.
3407
5011
6234
401
3407
4411
6240
601
3407
4011
6233
401
3410
4411
6144
301
3409
4711
6144
101
3409
2311
6142
501
3409
4511
6125
001
3409
0111
6132
301
3408
1911
6145
001
3408
0311
6140
601
3407
5411
6144
501
3411
1411
6053
301
3408
3111
6104
301
3408
0711
6113
101
3408
0411
6083
001
3407
3111
6082
601
3407
2211
6081
701
3408
0111
6052
401
3407
4211
6053
201
3411
4111
6030
901
3410
2011
6021
901
3410
3111
6041
401
3408
5511
6013
601
3407
5511
6042
501
3407
5711
6045
601
Dat
e
1-5-
947-
29-9
47_
29-9
42-
2-94
2-28
-94
2-2-
945-
2-94
2-3-
942-
2-94
2-28
-94
2-2-
943-
2-94
9-28
-93
2-17
-94
2-1-
94
3-4-
943-
4-94
1-18
-94
1-4-
943-
3-94
3-3-
943-
2-94
3-3-
941-
18-9
41-
18-9
4
1990
-94
dept
h to
w
ater
(ft
belo
w la
nd
surf
ace)
230.
931
537
820
8.24
233.
94
232.
8220
5.15
203.
9320
4.06
216.
15
262.
5920
0.78
164.
530
7.67
311.
33
311.
2624
9.97
185.
6621
8.58
16.9
15.7
610
9.88
84.6
314
4.67
158.
5
Dat
e
3-26
-96
4-17
-96
4-17
-96
4-18
-96
4-18
-96
5-15
-96
5-15
-96
4-18
-96
4-18
-96
4-18
-96
4-18
-96
5-6-
963-
14-9
63-
14-9
63-
15-9
6
5-22
-96
5-22
-96
3-15
-96
3-14
-96
5-7-
96
5-7-
965-
7-96
4-24
-96
3-15
-96
3-15
-96
1996
dep
th
to w
ater
(ft
belo
w la
nd
surf
ace)
287.
630
9.25
381.
7420
7.92
233.
5
232.
4420
6.14
202.
2420
5.25
218.
27
264.
8320
0.86
167.
730
9.8
311.
3
308.
225
7.43
198.
7323
0.03
16.9
3
17.2
411
1.15
84.8
615
4.07
170.
6
Dif
fere
nce
in d
epth
s to
wat
er
(ft)
-56.
7-3
.74
5.75 .3
2.4
4
.38
-.99 1.69
-1.1
9-2
.12
-2.2
4-.
08-3
.2
-2.1
3.0
3
3.06
-7.4
6-1
3.07
-11.
45-.
03
-1.4
8-1
.27
-.23
-9.4
-12.
1
Alti
tude
of
wat
er
tabl
e (ft
ab
ove s
ea
leve
l)2,
911
2,89
12,
868
2,17
72,
172
2,17
62,
170
2,18
02,
278
2,27
1
2,27
81,
772
2,18
52,
180
2,19
9
2,39
22,
433
1,93
11,
928
1,77
0
1,77
81,
759
1,78
21,
931
1,93
4
Alti
tude
of
land
sur
fa
ce (f
t ab
ove
sea
leve
l)3,
199
3,20
03,
250
2,38
52,
405
2,40
82,
376
2,38
22,
483
2,48
9
2,54
31,
973
2,35
32,
490
2,51
0
2,70
02,
690
2,13
02,
158
1,78
7
1,79
51,
870
1,86
72,
085
2,10
5
Met
hod
of
mea
sure
m
ent
R V V S V V V S V V V V R R R V V R R V V V V R R
Dep
th
of w
ell
(ft)
729 267
506
393
370
429
412
590
396 380
400
350
410
350
292
430
500 55 398
Scre
ened
or
inte
rval
(ft
)
464-
506
241-
387
360-
370
527-
590
261-
391
145-
312
200-
400
195-
345
391
250-
350
220-
420
39(M
95
160-
398
Tab
le 1
. Wat
er-le
vel d
ata
and
wel
l-con
stru
ctio
n in
form
atio
n fo
r the
Moj
ave
Riv
er, t
he M
oron
go, a
nd th
e Fo
rt Irw
in g
roun
d-w
ater
bas
ins,
San
Ber
nard
ino
Cou
nty,
C
alifo
rnia
Con
tinue
d
Stat
e w
ell n
o.
1N/9
E-3
2P1
-33H
2
-33J
3-3
3K5
-34A
1
-35F
1-3
5N1
1S/5
E-3
D1
-4A
1-4
EI
-5A
1
-10D
11S
/9E
-3D
12N
/5E
-1G
1-1
2B1
-12N
1-1
3A1
-14M
1-2
2J1
-24H
1
-27A
1-2
7K2
H
-27R
1|
-36C
1^
2N/6
E-1
1M1
USG
S Id
entif
icat
ion
no.
3407
1911
6034
901
3407
4111
6022
002
3407
3911
6021
701
3407
3911
6023
004
3408
0811
6012
101
3407
5611
6004
601
3407
1811
6010
301
3407
1711
6271
001
3407
0611
6273
001
3407
0611
6274
401
3407
0011
6283
201
3406
1411
6272
201
3407
1411
6020
701
3417
1611
6242
901
3416
4311
6243
101
3416
0011
6250
801
3415
4911
6241
601
3415
2011
6261
901
3414
3811
6262
801
3414
4411
6241
701
3414
1211
6262
201
3413
4311
6263
801
3413
3111
6263
201
3413
1911
6244
901
3416
2211
6194
601
Dat
e
1-20
-94
3-3-
943-
3-94
3-3-
943-
3-94
3-3-
94
3^-9
41-
6-94
4-26
-94
4-26
-94
5^-9
45-
6-94
3-4-
94
5-25
-94
6-9-
94
5-25
-94
5-26
-94
5-26
-94
6-9-
946-
9-94
5-5-
946-
9-94
6-9-
946-
9-94
3-23
-94
1990
-94
dept
h to
w
ater
(ft
belo
w la
nd
surf
ace)
177.
4251
.69
17.8
323
.33
151.
93
115.
411
5.62
380.
5234
5.1
379.
22
107.
9447
.65
113.
3210
0.42
145.
17
283.
3313
8.9
190.
0325
727
0.99
219.
7622
1.83
221.
0828
2.33
482.
85
Dat
e
3-14
-96
4-23
-96
4-23
-96
4-23
-96
5-6-
96
5-6-
963-
14-9
64-
25-9
63-
26-9
63-
26-9
6
4-16
-96
4-16
-96
5-22
-96
4-17
-96
3-13
-96
4-17
-96
4-17
-96
4-17
-96
3-13
-96
4-25
-96
4-17
-96
3-13
-96
3-13
-96
3-13
-96
4-23
-96
1996
dep
th
to w
ater
(ft
belo
w la
nd
surf
ace)
182.
4752
.52
18.9
324
.35
150.
88
115.
5811
6.77
386.
737
3.3
383.
4
112.
074.
6111
8.29
101.
5413
4.17
283.
8914
3.19
181.
6826
5.12
280.
5
230.
5123
2.25
231.
9127
8.18
482.
21
Diff
eren
ce
In d
epth
s to
wat
er
(ft)
-5.0
5-.
83-1
.1
-1.0
21.
05
-.18
-1.1
5-6
.18
-28.
2-4
.18
-4.1
37.
04-4
.91
-1.1
211 -.
56
^.2
98.
35-8
.12
-9.5
1
-10.
75-1
0.42
-10.
834.
15 .64
Alti
tude
of
wat
er
tabl
e (f
t ab
ove
sea
leve
l)1,
958
1,90
81,
953
1,94
91,
787
1,85
61,
964
2,95
32,
958
2,95
6
3,44
23,
529
1,95
72,
908
2,92
5
2,93
32,
936
3,24
13,
238
3,00
2
3,23
93,
233
3,23
83,
155
2,32
1
Alti
tude
of
land
sur
fa
ce (f
t ab
ove
sea
leve
l)2,
140
1,96
11,
972
1,97
31,
938
1,97
22,
081
3,34
03,
331
3,33
9
3,55
43,
570
2,07
53,
010
3,05
9
3,21
73,
079
3,42
33,
503
3,28
2
3,47
03,
465
3,47
03,
433
2,80
3
Met
hod
of
mea
sure
m
ent
R V V V V V R R R R V s s V R V V s R R V R R R V
Dep
th
of w
ell
(ft)
320 57
.435 28 260
940
535 390
130
275 358
166
305
785
604
485
322
475 790
Scre
ened
or
perf
orat
ed
inte
rval
(ft
)
220-
320
55.0
-57.
4
33-3
525
.6-2
7.6
147-
247
400-
940
200-
525
25-3
15
145-
340
337-
358
135-
190
170-
300
250-
775
220-
580
443-
485
184-
319
260-
470 750
Wel
l not
es
P, O
at 6
22
O a
t 258
O a
t 15
5O
at 2
45
Oat
445

Tab
le 1
. Wat
er-le
vel d
ata
and
wel
l-con
stru
ctio
n in
form
atio
n fo
r the
Moj
ave
Riv
er, t
he M
oron
go, a
nd th
e Fo
rt Irw
in g
roun
d-w
ater
bas
ins,
San
Ber
nard
ino
Cou
nty,
C
alifo
rnia
Con
tinue
d
Regional Water
' ^ <t i ~ & (D i 2. O § (0
(D .O.
(D 5 S O 3 3
(O O 3 2 3 O 5 c 3 O, 1 S 0) 5" 0) S D)
(D 3 1 O O P
Stat
e w
ell n
o.
2N/6
E-1
8B1
-30N
1
-31D
1
2N/7
E-2
C1
-3A
1
-3B
1
^H
l-5
B1
-10D
11
-10D
21
-10D
31
-10D
41
-11R
11
-11R
21
-11R
31
-19A
1
-36R
1
2N/8
E-4
B1
^F
l.
^L
l1
-4L
21
-4L
31
-5A
1
-7K
1
-12P
1
USG
S id
entif
icat
ion
no.
3415
5611
6233
401
3413
3211
6241
301
3413
1611
6240
101
3417
4111
6132
501
3417
4011
6134
201
3417
3611
6141
201
3417
2011
6145
601
3417
4211
6160
701
3416
4311
6144
401
3416
4311
6144
402
3416
4311
6144
403
3416
4311
6144
404
3416
0111
6124
801
3416
0111
6124
802
3416
0111
6124
803
3415
0111
6170
601
3412
3811
6114
301
3417
3711
6085
501
3417
2511
6090
401
3417
0911
6090
401
3417
0911
6090
402
3417
0911
6090
403
3417
3511
6093
101
3416
2111
6110
601
3416
0011
6055
501
Dat
e
5-26
-94
6-9-
945-
5-94
3-23
-94
3-23
-94
3-23
-94
3-23
-94
8-23
-94 _ _
5-3-
943-
1-94
3-1-
947-
20-9
41-
26-9
4
1-26
-94
1-26
-94
3-2-
943-
22-9
42-
22-9
4
1990
-94
dept
h to
w
ater
(ft
belo
w la
nd
surf
ace)
221.
935
1.08
316.
6913
5.22
160.
54
186.
0221
6.02
356.
16_ _ 50
5.95
291.
8520
4.41
221.
0724
0.66
240.
6524
0.61
237.
6544
1.34
192.
3
Dat
e
3-13
-96
3-13
-96
4-17
-96
5-23
-96
4-23
-96
4-23
-96
4-23
-96
4-23
-96
1-10
-96
1-10
-96
1-10
-96
1-10
-96
1-31
-96
1-31
-96
1-31
-96
4-25
-96
4-25
-96
5-23
-96
5-23
-96
4-24
-96
4-24
-96
4-24
-96
5-23
-96
4-23
-96
5-23
-96
1996
dep
th
to w
ater
(ft
belo
w la
nd
surf
ace)
229.
5235
0.58
316.
3113
9.5
161.
94
155.
1121
6.68
357.
3636
1.78
362.
3
362.
236
1.5
396.
7423
7.84
237.
38
506.
3329
0.27
203.
9722
0.75
240.
42
240.
4924
0.47
238.
2344
0.96
191.
05
Diff
eren
ce
in d
epth
s to
wat
er
(ft)
-7.6
2.5 .3
8^.
28
-1.4
30.9
1-.
66-1
.2_ _ -.
38 1.58 .44
.32
.24
.16
.14
-.58 .3
81.
25
Alti
tude
of
wat
er
tabl
e (f
t ab
ove
sea
leve
l)2,
857
3,01
53,
079
2,13
3
2,13
9
2,20
02,
225
2,22
92,
219
2,21
9
2,21
92,
219
2,05
22,
211
2,21
1
2,24
22,
015
1,80
11,
801
1,80
1
1,80
11,
801
1,80
11,
829
1,65
7
Alti
tude
of
land
sur
fa
ce (f
t ab
ove
sea
leve
l)3,
087
3,36
63,
395
2,27
22,
301
2,35
52,
442
2,58
72,
581
2,58
1
2,58
12,
581
2,44
92,
449
2,44
9
2,74
82,
305
2,00
52,
022
2,04
2
2,04
22,
042
2,03
92,
270
1,84
8
Met
hod
of
mea
sure
m
ent
R R V V S S V V V V V V V V V V V V V V V V V V V
Dep
th
of w
ell
(ft)
310
920
358
398
560
700
481
405
900
640
525
420
640
485
300
650
462
227
240
591
380
285
259
525
212
Scre
ened
or
perf
orat
ed
inte
rval
(f
t)
187-
305
300-
920
337-
358
149-
398
210-
550
260-
690
300-
420
385^
0588
0-90
062
0-64
0
505-
525
400-
420
620-
640
465^
8528
0-30
0
500-
645
305^
6220
2-22
721
5-24
0
571-
591
360-
380
245-
285
234-
259
125-
505
186-
211
Wel
l not
es
O a
t 750
O a
t 353
.4
S, O
at 3
77
O a
t 550
O a
t 420
O a
t 372
See
foot
note
at e
nd o
f tab
le.

Tab
le 1
. Wat
er-le
vel d
ata
and
wel
l-con
stru
ctio
n in
form
atio
n fo
r the
Moj
ave
Riv
er, t
he M
oron
go,
and
the
Fort
Irwin
gro
und-
wat
er b
asin
s, S
an B
erna
rdin
o C
ount
y,
Cal
iforn
ia C
ontin
ued
Stat
e w
ell n
o.
2N/9
E-1
9R1
1-1
9R2
1-1
9R3
1
-20G
1-2
0N1
1
-20N
21
-20N
31
-28L
1-2
9M1
1-2
9M2
1
-29M
31
-29Q
1-2
9R1
-30P
2-3
1C2
-32J
1-3
2R1
1-3
2R2
1-3
2R3
1
3N/3
W-6
F3
-7E
1
3N/4
E-3
C1
5"
-4*
2
f
-5K
1r*
-1
2N1
USG
S id
entif
icat
ion
no.
3414
1611
6042
501
3414
1611
6042
502
3414
1611
6042
503
3414
4911
6034
201
3414
1911
6040
401
3414
1911
6040
402
3414
1911
6040
403
3413
4111
6024
901
3413
4011
6040
501
3413
4011
6040
502
3413
4011
6040
503
3413
2311
6033
801
3413
2311
6031
601
3413
2311
6045
501
3413
2111
6050
001
3412
4711
6032
601
3412
3211
6032
201
3412
3211
6032
202
3412
3211
6032
203
3422
3011
7140
201
3421
4111
7141
901
3423
0411
6334
401
3422
2911
6341
001
3422
2411
6350
101
3421
1711
6311
501
Dat
e
1-26
-94
1-26
-94
1-26
-94
1-26
-94
1-26
-94
1-26
-94
1-26
-94
1-25
-94
1-25
-94
2-9-
942-
23-9
43-
2-94
3-2-
94
3-22
-94
2-27
-94
2-27
-94
2-27
-94
5-24
-94
5-16
-94
5-25
-94
5-25
-94
1990
-94
dept
h to
w
ater
(ft
belo
w la
nd
surf
ace)
220.
7722
0.36
373
223.
44
224.
34 34
3.96
213.
2618
5.62
75.1
321
8.12
220.
67
31.9
933 72
.921
2.58
189.
11
65.2
7 92
.115
5.78
17
3.9
180.
15
Dat
e
1-14
-96
1-19
-96
1-19
-96
1-25
-96
4-24
-96
4-24
-96
4-24
-96
1-31
-96
1-25
-96
1-25
-96
1-25
-96
5-23
-96
5-23
-96
4-24
-96
4-24
-96
5-23
-96
1-17
-96
1-17
-96
1-17
-96
3-29
-96
3-29
-96
4-22
-96
5-15
-96
4-22
-96
5-8-
96
1996
dep
th
to w
ater
(ft
belo
w la
nd
surf
ace)
220.
5322
0.14
372.
9522
4.25
224.
14 34
4.02
213.
2618
5.3
75.3
621
7.45
220.
0132
.05
32.7
73.0
221
2.19
189.
3265
.76
103.
56
20.7
392
.28
155.
8 17
3.91
188.
07
Dif
fere
nce
in d
epth
s to
wat
er
(ft)
0.24 .2
2
.05
-.81 .2
-.06
0 .32
-.23 .6
7.6
6-.
06 .3
-.12 .3
9-.
21-.
49 -.
18
-.02
-.
01
-7.9
2
Alti
tude
of
wat
er
tabl
e (ft
ab
ove s
ea
leve
l)1,
548
1,54
8
1,54
81,
547
1,54
7
1,54
71,
547
1,57
5
1,68
51,
548
1,54
71,
758
1,76
2
1,68
51,
547
1,56
9
1,69
32,
896
2,92
42,
748
2,75
9 2,
756
3,06
7
Alti
tude
of
land
sur
fa
ce (f
t ab
ove
sea
leve
l)1,
768
1,76
81,
768
1,92
11,
771
1,77
11,
771
1,89
11,
760
1,76
0
1,76
01,
765
1,76
7
1,79
01,
795
1,75
81,
759
1,75
91,
759
3,00
0
2,94
52,
840
2,91
5 2,
930
3,25
5
Met
hod
of
mea
sure
m
ent
V V V V V V V V V V V V V V V V V V V s V V s V V
Dep
th
of w
ell
(ft)
460
310 70 440
450
270
120
397
410
250 90 239
256 59 86 470
255 80 200 137
510
211
203
Scre
ened
or
perf
orat
ed
inte
rval
(f
t)
440-
460
290-
310
40-7
040
0-44
043
0-45
0
250-
270
100-
120
367-
387
390-
410
220-
250
70-9
021
3-23
823
5.5-
255.
5
65.5
-85.
545
0-47
023
5-25
5
60-8
010
0-20
0
107-
137
360-
510
166-
206
Wel
l not
es
D D PW PW PW
O a
t 186
See
foot
note
at e
nd o
f tab
le.

Tab
le 1
. Wat
er-le
vel d
ata
and
wel
l-con
stru
ctio
n in
form
atio
n fo
r the
Moj
ave
Riv
er, t
he M
oron
go, a
nd th
e Fo
rt Irw
in g
roun
d-w
ater
bas
ins,
San
Ber
nard
ino
Cou
nty,
C
alifo
rnia
Con
tinue
d
Regional Water ' i 5T <o
<o O) 1 i o § CO T .2.
30 1 S 1 TJ
i 3 O 5 c 3 Q.
O3 0 CO 3 S O3 1 O O
Stat
e w
ell n
o.
3N/4
W-1
2G2
-12Q
1-3
1B2
3N/5
W-2
2E2
3N/6
E-2
J1
-27B
13N
/7E
-19N
1-2
0C1
-20M
1-2
7H1
-28D
1-2
9G1
-31E
1-3
2D3
1-3
2D4
1
-32D
51
-32D
61
-34D
1-3
6G1
3N/8
E-1
7L1
-28P
11
-28P
21
-28P
31
-29C
1-3
1J1
1
USG
S id
entif
icat
ion
no.
3421
5411
7144
901
3421
2411
7144
401
3418
4011
7200
501
3420
0611
7235
101
3422
2111
6190
801
3419
2511
6202
501
3419
3911
6174
501
3421
1111
6174
801
3419
5211
6164
601
3419
0911
6134
101
3419
1811
6153
001
3419
1211
6160
801
3418
2311
6175
001
3418
2911
6164
401
3418
2911
6164
402
3418
2911
6164
403
3418
2911
6164
404
3418
3311
6144
201
3418
0911
6115
801
3420
3711
6101
101
3418
4311
6090
401
3418
4311
6090
402
3418
4311
6090
403
3419
1811
6101
501
3418
0111
6104
601
Dat
e 3_
29-9
4
3_28
-94
3-29
-94
3-29
-94
3-29
-94
3_29
-94
3-24
-94
3-24
-94
3-24
-94 _
8-22
-94
8-23
-94
3-29
-94
1-26
-94
1-26
-94
1-26
-94
3-29
-94
1-26
-94
1990
-94
dept
h to
w
ater
(ft
belo
w la
nd
surf
ace)
_ 161.
63
309.
224
1.74
198.
5521
1.54
407.
05
230.
5725
8.17
254.
32 _ 27
.32
270.
32
47.8
1
30.9
30.8
530
.81
88.4
320
6.68
Dat
e
5-15
-96
3-29
-96
5-17
-96
5-20
-96
5-23
-96
4-23
-96
4-23
-96
4-23
-96
4-23
-96
4-23
-96
4-23
-96
4-23
-96
5-23
-96
1-18
-96
1-18
-96
1-18
-96
5-23
-96
5-23
-96
4-23
-96
5-23
-96
4-24
-96
4-24
-96
4-24
-96
5-23
-96
4-24
-96
1996
dep
th
to w
ater
(ft
belo
w la
nd
surf
ace)
59.5
88.6
99.
6530
9.25
162.
8
308.
6124
319
9.68
212.
6540
7.57
232
259.
5425
2.5
324.
7830
1.67
306.
8330
0.8
272.
6927
9.68
47.6
2
30.6
930
.61
30.6
388
.320
6.34
Dif
fere
nce
in d
epth
s to
wat
er
(ft)
-1.1
7
.59
-1.2
6-1
.13
-1.1
1-.
52
-1.4
3-1
.37
1.82
_ -2.3
7-9
.36
.19
.21
.24
.18
.13
.34
Alti
tude
of
wat
er
tabl
e (ft
ab
ove
sea
leve
l)2,
913
2,91
13,
200
3,31
82,
250
2,33
42,
245
2,24
52,
245
1,83
2
2,24
12,
241
2,26
22,
220
2,24
3
2,23
82,
244
2,22
81,
831
1,80
3
1,80
11,
801
1,80
11,
803
1,83
0
Alti
tude
of
land
sur
fa
ce (f
t ab
ove
sea
leve
l)2,
972
3,00
03,
210
3,62
72,
413
2,64
32,
488
2,44
52,
458
2,24
0
2,47
32,
501
2,51
42,
544
2,54
4
2,54
42,
544
2,50
12,
111
1,85
0
1,83
21,
832
1,83
21,
891
2,03
6
Met
hod
of
mea
sure
m
ent
S S S S V V V V V V V V V V V V V V V V V V V V V
Dep
th
of w
ell
(ft)
128 363
335
415
334
605
295
572
618
351
401
790
660
540
370
605
399
456
395
180 85 800
390
Scre
ened
or
perf
orat
ed
inte
rval
(ft
)
102-
120
310-
360
315-
335
395^
1527
5-29
522
8-60
527
5-29
547
2-57
2
418-
598
312-
348
300-
401
770-
790
640-
660
520-
540
350-
370
270-
605
384-
399
248^
56
375-
395
160-
180
45-8
550
0-68
437
0-39
0
Wel
l not
es
S, O
at 3
98
S S S S S
See
foot
note
at e
nd o
f tab
le.

Ta
ble
1. W
ater
-leve
l dat
a an
d w
ell-c
onst
ruct
ion
info
rmat
ion
for t
he M
oj'a
ve R
iver
, the
Mor
ongo
, an
d th
e Fo
rt Irw
in g
roun
d-w
ater
bas
ins,
San
Bem
ardi
no C
ount
y,
Cal
ifom
ia C
on
tin u
ed
Sta
te w
ell n
o.
3N/8
E-3
1J2
1 -3
1J3
1
-33N
1-3
4D1
4N/1
E-2
Q2
-5P
2-9
D4
-13E
1-1
5R1
-17L
1
-18C
2-2
0E1
-20Q
1-2
1C1
-27D
1
4N/1
W-2
J1-3
K1
-7E
1-7
R1
-10H
1
-10R
1-1
3M3
1
-13M
41
-13R
21
USG
S id
entif
icat
ion
no.
3418
0111
6104
602
3418
0111
6104
603
3417
5111
6092
201
3418
2311
6082
201
3427
3211
6504
701
3427
3611
6540
401
3427
2811
6531
901
3426
1311
6502
201
3425
4611
6513
901
3426
0911
6541
001
3426
2711
6551
801
3425
3011
6542
101
3425
0111
6535
201
3425
4511
6530
301
3424
4111
6522
201
3427
4411
6565
801
3427
5511
6580
301
3427
1411
7015
601
3426
3911
7005
501
3427
1711
6580
001
3426
3911
6580
001
3426
1011
6564
101
3426
1011
6564
102
3425
4411
6555
001
3425
4411
6555
002
Dat
e
1-26
-94
1-26
-94
1-5-
944-
7-94
6-30
-94
5-16
-94
10-7
-94
7-22
-94
8-29
-94
5-18
-93
8-3-
9410
-7-9
410
-7-9
47-
26-9
410
-7-9
4
10-5
-93
7-22
-94
7-26
-94
7_26
-94
10-6
-93
11-1
8-93
11
-19-
93
1990
-94
dept
h to
w
ater
(ft
belo
w la
nd
surf
ace)
206.
63
206.
5919
1.85
24.1
611
6.07
183.
419
0.28
161.
0419
5.03
157.
63
158.
413
6.1
126.
7318
1.37
248.
15
136.
817
.53
44.5
18.2
912
.69
17.4
1 55
.15
Dat
e
4-24
-96
4-24
-96
5-23
-96
5-23
-96
5-24
-96
5-14
-96
4-15
-96
5-24
-96
4-16
-96
5-14
-96
4-15
-96
4-16
-96
5-24
-96
4-16
-96
4-16
-96
4-4-
964-
15-9
64-
4-96
4-4-
964-
4-96
4-15
-96
4-15
-96
4-15
-96
3-29
-96
3-29
-96
1996
dep
th
to w
ater
(ft
belo
w la
nd
surf
ace)
206.
29
206.
2718
4.74
24.4
116.
95
185.
1917
8.88
152.
5819
5.5
161.
58
159.
8812
8.9
123.
02
186.
524
5.4
129.
519
.88
43.2
19.0
312
.73
18.2
5 53
.09
54.3
284.
62
274.
45
Dif
fere
nce
in d
epth
s to
wat
er
(ft)
0.34
.3
27.
11-.
24-.
88
-1.7
911
.4 8.46
-.47
-3.9
5
-1.4
87.
23.
71-5
.13
2.75
7.3
-2.3
51.
3-.
74-.
04
-.84
2.
06
Alti
tude
of
wat
er
tabl
e (f
t ab
ove
sea
leve
l)1,
830
1,83
01,
808
1,80
02,
809
2,72
52,
746
2,84
72,
867
2,81
7
2,82
02,
891
2,96
72,
877
2,98
0
2,73
72,
840
2,90
72,
917
2,89
7
2,92
8 2,
937
2,93
62,
790
2,80
1
Alti
tude
of
land
sur
fa
ce (f
t ab
ove
sea
leve
l)2,
036
2,03
6
1,99
31,
824
2,92
6
2,91
02,
925
3,00
03,
062
2,97
9
2,98
03,
020
3,09
03,
063
3,22
5
2,86
62,
860
2,95
0
2,93
62,
910
2,94
6 2,
990
2,99
03,
075
3,07
5
Met
hod
of
mea
sure
m
ent
V
V V s V s V V s s s V V V V s V s s s V
V s V
V
Dep
th
of w
ell
(ft)
320
250
208
396 300
505
405
301
200
280
260 425 405 130 189
100
200
490
380
Scre
ened
or
perf
orat
ed
inte
rval
(ft
)
300-
320
210-
250
183-
208
186
Oat
40
400
180-
300
220-
488
O a
t 357
240-
340
189-
291
120-
200
120-
260
165-
384
240-
418
470-
490
360-
380
See
foot
note
at e
nd o
f tab
le.

Tab
le 1
. Wat
er-le
vel d
ata
and
wel
l-con
stru
ctio
n in
form
atio
n fo
r the
Moj
ave
Riv
er, t
he M
oron
go, a
nd th
e Fo
rt Irw
in g
roun
d-w
ater
bas
ins,
San
Ber
nard
ino
Cou
nty,
C
alifo
rnia
Con
tinue
d
Regional Water
' ^ ST i 1 1 § s $ (0 T .0.
3D I o 5 <§ 3 i 3 O 8 c 1 I 2 JO 3 5
Stat
e w
ell n
o.
4N/1
W-1
3R3
1-1
3R4
1
-14A
2-1
8Q1
-21G
1
-26J
14N
/2E
-9N
2-1
3P1
-17H
24N
/2W
-4Q
1
-9Q
1
-12N
2-1
6E1
4N/3
E-7
G1
-15J
1
-16D
1-2
3G1
-30C
14N
/3W
-1C
3-1
M1
-4H
1-7
N1
-12A
11
-12A
21
-12A
31
USG
S id
entif
icat
ion
no.
3425
4411
6555
003
3425
4411
6555
004
3426
2911
6564
401
3425
4411
7011
501
3425
1911
6591
401
3424
1611
6564
501
3426
4311
6471
101
3425
5111
6434
301
3426
1211
6471
601
3427
2811
7053
001
3426
3611
7054
201
3426
3711
7025
401
3426
1811
7060
701
3427
0811
6422
401
3426
0011
6385
101
3426
3111
6405
301
3425
1711
6380
601
3424
4811
6424
601
3428
1411
7090
301
3427
4411
7091
101
3427
5711
7113
901
3426
4111
7141
601
3427
2611
7082
401
3427
2611
7082
402
3427
2611
7082
403
Dat
e 8-
3-94
10-6
-93
12-2
-92
3-21
-94
6-30
-94
6-29
-94
6-30
-94
4-21
-94 _
7-26
-94
12-7
-93
6-29
-94
6-29
-94
6-29
-94
6-29
-94
6-29
-94
4-21
-94
4-21
-94
4-19
-94
1990
-94
dept
h to
w
ater
(ft
belo
w la
nd
surf
ace)
105.
3479
.46
172.
46
325.
513
9.54
108.
113
5.95
241.
97
_ 104.
7534
1.12
64.3
82.6
4
101.
5672
.72
198.
1820
7.95
240.
35
303.
22
Dat
e
3-29
-96
3-29
-96
4-15
-96
5-15
-96
5-14
-96
5-14
-96
5-8-
965-
8-96
5-8-
964-
^-96
11-1
5-96
4-^-
965-
15-9
65-
9-96
5-8-
96
5-9-
965-
8-96
5-9-
964-
5-96
4-^-
96
3-16
-96
3-29
-96
3-29
-96
3-29
-96
3-29
-96
1996
dep
th
to w
ater
(ft
belo
w la
nd
surf
ace)
223.
34 10
5.95
79.8
917
3.42
345
146.
1510
7.93
135.
9724
2.08
314 92.9
833
8.35
63.9
282
.07
101.
5372
.519
7.8
205.
9423
5.29
203.
4545
.35
299.
3229
8.31
Diff
eren
ce
in d
epth
s to
wat
er
(ft)
-0.6
1-.
43-.
96
-19.
5-6
.61 .17
-.02
-.11
_ 11.7
72.
77 .38
.57
.03
.22
.38
2.01
5.06
3.9
Atti
tude
of
wat
er
tabl
e (ft
ab
ove s
ea
leve
l)2,
852
2,85
62,
920
2,94
8
3,07
72,
889
2,88
72,
894
2,83
8
2,85
12,
910
2,85
22,
831
2,78
1
2,78
32,
778
2,88
22,
801
2,81
0
2,79
22,
813
2,82
32,
824
Atti
tude
of
land
sur
fa
ce (f
t ab
ove
sea
leve
l)3,
075
3,07
52,
962
3,00
03,
121
3,42
23,
035
2,99
53,
030
3,08
0
3,16
53,
003
3,19
02,
895
2,86
3
2,88
52,
850
3,08
03,
007
3,04
5
2,99
52,
858
3,12
23,
122
3,12
2
Met
hod
of
mea
sure
m
ent
V V V s s R V V R S R S V V V S S V S V R V V V V
Dep
th
of w
ell
(ft)
260
130 250
470 205
500
420
192
380 97 89 200
154 _ 300 404 600
345
270
Scre
ened
or
inte
rval
(ft
)
240-
260
110-
130
70-1
50
415^
70
163-
201
300-
500
0-39
660
-192
325-
375
95-9
787
-89
76-1
50 _ _
580-
600
325-
345
250-
270
Wel
l not
es
D
Oat
107
D
I o o o
See
foot
note
at e
nd o
f tab
le.

Tab
le 1
. Wat
er-le
vel d
ata
and
wel
l-con
stru
ctio
n in
form
atio
n fo
r the
Moj
ave
Riv
er, t
he M
oron
go,
and
the
Fort
Irwin
gro
und-
wat
er b
asin
s, S
an B
erna
rdin
o C
ount
y,
Cal
iforn
ia C
ontin
ued
Stat
e w
ell n
o.
4N/3
W-1
2D1
-15C
1-1
7E3
-17M
1-1
8B1
-19G
21
-19G
31
-19G
41
-19G
51
-19G
61
-19M
1-3
0A6
-31L
61
-31L
71
-31L
81
-31L
91
4N/4
E-17
C1
-19B
1-2
9D1
-32Q
1
-36B
14N
/4W
-1A
2H
-1
C2
1|
-1C
31
:*
-1C
41
USG
S id
entif
icat
ion
no.
3427
2411
7090
301
3426
3011
7104
501
3426
1311
7132
601
3425
5411
7132
601
3426
3111
7134
501
3425
1411
7134
801
3425
1411
7134
802
3425
1411
7134
803
3425
1411
7134
804
3425
1411
7134
805
3425
1611
7141
801
3424
3611
7133
801
3423
1811
7141
101
3423
1811
7141
102
3423
1811
7141
103
3423
1811
7141
104
3426
2011
6351
701
3425
3311
6360
801
3424
4611
6354
101
3423
0611
6350
301
3423
5011
6305
801
3428
1311
7143
102
3428
1411
7150
501
3428
1411
7150
502
3428
1411
7150
503
Dat
e
4-19
-94
11-1
5-93
4-21
-94 _
9-24
-93
11-1
7-92
12-3
0-92
5-25
-94
5-25
-94
5-24
-94
5-24
-94
5_24
-94
3_24
-94
1990
-94
dept
h to
w
ater
(ft
belo
w la
nd
surf
ace)
280.
1627
1.21
58.3
4 _ 54
.22
77 62.7
438
.95
38.0
529
.96
80.0
2
63.2
242
.13
Dat
e
4-3-
965-
16-9
64-
^-96
5-16
-96
3-29
-96
3-29
-96
3-29
-96
3-29
-96
3-29
-96
3-29
-96
3-29
-96
5-21
-96
3-29
-96
3-29
-96
3-29
-96
3-29
-96
4-22
-96
4-22
-96
4-22
-96
4-22
-96
4-22
-96
9-10
-96
3-28
-96
3-28
-96
3-28
-96
1996
dep
th
to w
ater
(ft
belo
w la
nd
surf
ace)
282.
8926
6.27
49.9
951
.62
49.2
1
57.2
458
.51
56.4
843 40
.94
79.6
757
.98
34 41.2
41.7
4
40.2
338
.83
37.9
929
.93
79.8
5
63.3
957 14
.61
37.6
3 35
.95
Diff
eren
ce
In d
epth
s to
wat
er
(ft)
-2.7
34.
948.
35 _ 13
.28
19.0
2 22
.51 .12
.06
.03
.17
-.17
-14.
87
Alti
tude
of
wat
er
tabl
e (ft
ab
ove s
ea
leve
l)2,
807
2,81
02,
815
2,80
82,
811
2,82
42,
822
2,82
52,
838
2,84
0
2,82
02,
836
2,88
82,
881
2,88
0
2,88
22,
696
2,73
72,
740
2,74
5
2,56
72,
779
2,80
32,
780
2,78
2
Alti
tude
of
land
sur
fa
ce (f
t ab
ove
sea
leve
l)3,
090
3,07
62,
865
2,86
02,
860
2,88
12,
881
2,88
12,
881
2,88
1
2,90
02,
894
2,92
22,
922
2,92
2
2,92
22,
735
2,77
52,
770
2,82
5
2,63
02,
836
2,81
82,
818
2,81
8
Met
hod
of
mea
sure
m
ent
V S S V V V V V V V V S V V V V V V V V V A V V
V
Dep
th
of w
ell
(ft)
320
390 600
375
195 95 55 123
550
380
260
140 61 120 47 490 72 275
620
330
190
Scre
ened
or
perf
orat
ed
We|
|not
es
inte
rval
(ft
)
245-
308
330-
390
580-
600
355-
375
175-
195
75-9
545
-55
D
153-
173
70-1
20
R53
0-55
036
0-38
024
0-26
0
120-
140
59-6
1 O
at 5
4
45^7
119-
12.5
70-7
213
0-27
560
0-62
031
0-33
0 17
0-19
0
See
foot
note
at e
nd o
f tab
le.

18
Regional Water ' » O1 (0 § i (0 1 2. O Q> (D £ T o I 5 ? | 1 T
l
i 3 O 1 i s o CD
0 (0 5' 0)
0) o 1 0) 5.
i aoi
e i .
wat
er-i
evei
aai
a an
a w
en-c
onst
ruct
ion
inTo
rmat
ion
ror i
ne M
ojav
e M
iver
, ine
Mor
ongo
, ana
ine
ron
irwm
gro
una-
wai
er o
asin
s, £
>an
eern
arai
no o
ouni
y,
Cal
ifor
nia
Con
tinue
d
Stat
e w
ell n
o.
4N/4
W-1
C5
1-1
D2
-1R
1
-3A
21
-3 A
31
-3A
41
-3A
51
-8N
2
-24P
3-3
6Q1
4N/5
W-1
C1
-2H
1
-21H
14N
/6E
-27D
14N
/6W
-23M
1
5N/1
E-17
D1
-32B
2-3
2L1
-35F
35N
/1W
-12H
2
-25G
1-2
8F1
-31C
1-3
6R1
5N/2
W-3
2Q1
uses
iden
tific
atio
n no
.
3428
1411
7150
504
3428
1511
7152
701
3427
2911
7144
501
3428
0511
7164
501
3428
0511
7164
502
3428
0511
7164
503
3428
0511
7164
504
3426
3911
7194
001
3424
5011
7151
201
3423
0511
7145
201
3428
1311
7212
901
3427
4911
7214
801
3425
1911
7240
701
3424
2911
6205
601
3425
0311
7290
301
3431
5311
6542
301
3429
1011
6534
801
3428
3711
6540
401
3428
5111
6510
701
3432
1911
6553
701
3429
4311
6555
201
3429
4811
6593
301
3429
1611
7012
601
3428
2611
6553
901
3428
2611
7063
201
Dat
e
11-1
9-92
11-1
8-92
11-1
9-92 _ _
3-9-
9412
-1-9
3 _ 3-
8-94
12-1
7-92
7-22
-94
12-2
-92
6-30
-94
7-21
-94
7-22
-94
7-22
-94
7-26
-94
7-22
-94
1990
-94
dept
h to
w
ater
(ft
belo
w la
nd
surf
ace)
39.2
541
.150
.52
_ _ 207.
2343
5 _ 980.
08
158.
0516
9.84
160.
215
4.85
151.
16
132.
0835
.77
218.
715
6.98
Dat
e
4-29
-96
4-1-
963-
28-9
63-
29-9
63-
29-9
6
2-29
-96
3-29
-96
4-1-
965-
16-9
63-
29-9
6
3-29
-96
3-29
-96
2-20
-96
5-23
-96
4-5-
96
8-7-
965-
16-9
65-
24-9
65-
8-96
5-17
-96
5-15
-96
5-17
-96
5-17
-96
5-16
-96
5-15
-96
1996
dep
th
to w
ater
(ft
belo
w la
nd
surf
ace)
30.0
729
.96
37.4
417
8.66
204.
02
203.
0320
4.12
434
186.
2342
.34
436
481
646.
669
.57
1001 15
716
2.9
159.
215
6.1
175.
52
130.
2836
.25
229.
314
3.5
184.
87
Diff
eren
ce
in d
epth
s to
wat
er
(ft)
9.18
11.1
413
.08
_ _ 3.11 1
_ -20.
92 1.05
6.94
1-1
.25
-24.
36 1.8
-.48
-10.
613
.48
Alti
tude
of
wat
er
tabl
e (f
t ab
ove
sea
leve
l)2,
788
2,79
72,
808
2,80
42,
779
2,78
02,
779
2,78
42,
820
2,88
1
2,77
42,
784
2,88
32,
253
2,91
9
2,72
32,
707
2,71
12,
786
2,69
6
2,72
02,
829
2,85
12,
718
2,82
9
Alti
tude
of
land
sur
fa
ce (f
t ab
ove
sea
leve
l)2,
818
2,82
72,
845
2,98
32,
983
2,98
32,
983
3,21
83,
006
2,92
3
3,21
03,
265
3,53
02,
323
3,92
0
2,88
02,
870
2,87
02,
942
2,87
2
2,85
02,
865
3,08
02,
861
3,01
4
Met
hod
of
mea
sure
m
ent
V V V V V V V R V V R R V V V V V V V S S S S V S
Dep
th
of w
ell
(ft)
80 50 790
510
360
235
900
605 _ 670
1,03
0 465
200
250
230
200 252
468
315
Scre
ened
or
perf
orat
ed
inte
rval
(ft
)
60-8
0
770-
790
490-
510
340-
360
195-
235
600-
900
245-
605 _
240-
400
210-
250
80-2
30
164-
200
148-
468
250-
295
Wel
l not
es
R S
O a
t 345
See
foot
note
at e
nd o
f tab
le.

Tab
le 1
. Wat
er-le
vel d
ata
and
wel
l-con
stru
ctio
n in
form
atio
n fo
r the
Moj
ave
Riv
er, t
he M
oron
go,
and
the
Fort
Irwin
gro
und-
wat
er b
asin
s, S
an B
erna
rdin
o C
ount
y,
Cal
iforn
ia C
ontin
ued
Stat
e w
ell n
o.
5N/3
W-^
P1-5
R3
-22G
1-2
2J1
-23B
1
-23R
1-2
7E3
1-2
7E4
1-2
7E5
1-2
7E6
1
-30A
11
-30A
21
-30A
31
5N/4
W-3
P3-6
R1
-8Q
1
-11P
1-1
1P3
-13N
1-1
4D1
1
-14D
21
-14D
31
-14D
41
-15K
1-2
0J3
USG
S id
entif
icat
ion
no.
3432
3911
7120
101
3432
1811
7123
401
3430
3511
7104
901
3430
1511
7102
301
3430
5311
7094
401
3430
0511
7092
301
3429
3811
7111
901
3429
3811
7111
902
3429
3811
7111
903
3429
3811
7111
904
3429
5911
7133
001
3429
5911
7133
002
3429
5911
7133
003
3432
3911
7172
401
3432
3911
7194
801
3431
4611
7190
401
3431
5011
7151
501
3431
5011
7151
502
3430
5411
7152
901
3431
4511
7163
501
3431
4511
7163
502
3431
4511
7163
503
3431
4511
7163
504
3431
1111
7165
801
3430
2311
7185
501
Dat
e
5-18
-94
11-1
8-92
H_1
7_93
4-19
-93
1-5-
93 _ 11
-18-
9211
-18-
92
1-5-
94 11
-23-
92 _ 11
-19-
9211
-18-
92
1990
-94
dept
h to
w
ater
(ft
belo
w la
nd
surf
ace)
145.
69 14
2.69
133.
1811
3.77
126.
56 _ 18
2.97
9.98
183.
9 58
.94
_ 18.3
74.
73
Dat
e
5-14
-96
5-14
-96
3-13
-96
5-16
-96
4-5-
96
5-16
-96
5-14
-96
5-20
-96
5-14
-96
5-20
-96
5-14
-96
5-14
-96
5-14
-96
3-28
-96
4-12
-96
4-12
-96
5-22
-96
3-29
-96
3-28
-96
3-28
-96
3-28
-96
3-28
-96
4-4-
964-
12-9
6
1996
dep
th
to w
ater
(ft
belo
w la
nd
surf
ace)
149.
6411
0.15
138.
7513
0.85
115.
28
127.
1815
3.79
153.
5915
1.43
147.
35
175.
9917
5.75
173.
910
.74
151.
9
161.
2 59
.56
66.8
37.
94 .74
12.4
414
.42
2.35
183.
3
Diff
eren
ce
in d
epth
s to
wat
er
(ft)
-3.9
5 3.
942.
33-1
.51
-.62
_ 9.07
-.76
22.7 -.
62 _ 3.
952.
38
Alti
tude
of
wat
er
tabl
e (f
t ab
ove s
ea
leve
l)2,
760
2,79
42,
796
2,80
32,
801
2,80
32,
796
2,79
62,
799
2,80
3
2,78
42,
784
2,78
62,
699
2,70
8
2,73
3
2,72
82,
743
2,74
2
2,74
92,
738
2,73
62,
743
2,74
7
Alti
tude
of
land
sur
fa
ce (f
t ab
ove
sea
leve
l)2,
910
2,90
42,
935
2,93
42,
916
2,93
02,
950
2,95
02,
950
2,95
0
2,96
02,
960
2,96
02,
710
2,86
0
2,89
52,
788
2,78
82,
810
2,75
0
2,75
02,
750
2,75
02,
745
2,93
0
Met
hod
of
mea
sure
m
ent
S S R V V V V V S S V V V V R V S V R R R R S R
Dep
th
of w
ell
(ft)
240
150
384
347
153
264
237
194
168
148
285
233
200 400 65 130 340
200
100 50 600
Scre
ened
or
80-2
40
180-
384
90-1
53 _
232-
236.
518
9-19
416
3-16
814
3-14
8
270-
280
218-
228
185-
195
R
142-
360
H
320-
340
180-
200
80-1
0030
-50
200-
600
R
See
foot
note
at e
nd o
f tab
le.

Tab
le 1
. Wat
er-le
vel d
ata
and
wel
l-con
stru
ctio
n in
form
atio
n fo
r the
Moj
ave
Riv
er, t
he M
oron
go,
and
the
Fort
Irwin
gro
und-
wat
er b
asin
s, S
an B
erna
rdin
o C
ount
y,
Cal
iforn
ia C
ontin
ued
Regional Water
' -i 5" i * I § § 1 T o I 3)
| S O 5 1 Tl
i 3 O 1 1 1 tt 5' 0)
0) tt 1 1 o. o o
o
Stat
e w
ell n
o.
5N/4
W-2
3B1
-25Q
1-3
4N1
-35J
25N
/5W
-22E
1
-22E
2-3
5C3
-35J
15N
/6W
-12E
2-2
2E1
1
-22E
21
-22E
31
-36R
15N
/7W
-17D
1-2
8L1
6N/1
W-5
J1-2
2P1
-27B
1-2
7R1
-36J
1
6N/3
W-8
N1
-9M
1
-15Q
1-1
7B3
-32R
3
USG
S Id
entif
icat
ion
no.
3430
4611
7155
801
3429
1611
7145
501
3428
2511
7173
301
3428
4011
7153
301
3430
2711
7235
201
3430
2711
7235
001
3429
0411
7223
501
3428
3511
7220
301
3432
1311
7275
301
3430
3011
7300
901
3430
3011
7300
902
3430
3011
7300
903
3428
1411
7271
801
3431
3911
7383
101
3429
2311
7370
601
3438
0211
6595
901
3435
1311
6582
201
3435
0011
6581
401
3434
1711
6574
501
3433
3811
6553
801
3437
0811
7132
401
3437
2211
7122
001
3436
0511
7103
101
3436
5511
7124
601
3433
2811
7122
401
Dat
e 11
-18-
92 11
-19-
92
9-9-
91 11
-15-
90 6-
8-94
11-1
3-92
3-21
-94
7-21
-94
7-21
-94
7-21
-94
7-21
-94
1-5-
934-
11-9
410
-5-9
34-
11-9
41-
5-93
1990
-94
dept
h to
w
ater
(ft
belo
w la
nd
surf
ace)
15.9
1 74
.73
354.
99 17
8 _ 349.
29 30
8.56
115.
3515
0.46
141.
5618
2.72
197.
53
74.6
222
.74
114.
9767
.94
175.
1
Dat
e
1-16
-96
3-28
-96
4-12
-96
3-28
-96
4-10
-96
3-29
-96
3-29
-96
5-16
-96
3-28
-96
3-28
-96
3-28
-96
3-29
-96
5-29
-96
4-10
-96
5-17
-96
5-17
-96
5-17
-96
5-17
-96
5-17
-96
5-14
-96
4-3-
965-
14-9
64-
3-96
4-3-
96
1996
dep
th
to w
ater
(ft
belo
w la
nd
surf
ace)
2.07
12.7
623
1.4
54.4
1 35
6.52
441
432
180.
1535
2.16
357.
9935
3.61
527
301.
3554
3.85
115.
7214
9.45
144.
818
7.83
192.
9
73.1
622
.57
113.
4368
.29
165.
99
Diff
eren
ce
in d
epth
s to
wat
er
(ft)
3.15
20.3
2 -1
.53
-2.1
5 ^.3
2 7.
21 -.
37 1.01
-3.2
4-5
.11
4.63 1.46 .17
1.54
-.35 9.11
Alti
tude
of
wat
er
tabl
e (f
t ab
ove s
ea
leve
l)2,
748
2,78
72,
769
2,76
1
2,76
52,
764
2,77
82,
880
2,90
8
2,90
22,
906
2,89
52,
924
2,96
1
3,10
42,
910
2,89
52,
850
2,75
5
2,99
93,
055
3,01
92,
974
2,75
6
Alti
tude
of
land
sur
fa
ce (f
t ab
ove
sea
leve
l)2,
750
2,80
03,
000
2,81
53,
121
3,12
23,
205
3,21
03,
060
3,26
0
3,26
03,
260
3,42
23,
225
3,50
5
3,22
03,
059
3,04
03,
038
2,94
8
3,07
23,
078
3,13
23,
042
2,92
2
Met
hod
of
mea
sure
m
ent
S V R V S R R S V V V R S V S S S S S S V S V S
Dep
th
of w
ell
(ft)
10 100 400
340
510 400
750
565
400
672 626 350 354
266 72 230 197
Scre
ened
or
perf
orat
ed
inte
rval
(ft
)
0-9.
5
100-
400
230-
400
730-
750
545-
565
380-
400
480-
672
606-
626
168-
288
226-
266
140-
230
166-
196
Wel
l not
es
R H R
See
foot
note
at e
nd o
f tab
le.

Tab
le 1
. Wat
er-le
vel d
ata
and
wel
l-con
stru
ctio
n in
form
atio
n fo
r the
Moj
ave
Riv
er, t
he M
oron
go,
and
the
Fort
Irwin
gro
und-
wat
er b
asin
s, S
an B
erna
rdin
o C
ount
y,
Cal
iforn
ia C
ontin
ued
51 O1
(0 r*
Stat
e w
ell n
o.
6N/3
W-3
4N4
6N/4
W-6
D13
-7M
3
-19C
8-1
9E2
-19K
1-2
9M1
-30G
4-3
0J2
-30P
5
-33N
1-3
4E2
-34M
86N
/5W
-1J1
-1K
1
-1L
11
-1L
21
-2Q
1-3
Q2
-4K
I
-6R
3
-12F
1-1
2G21
-12G
31
-12H
1
uses
iden
tific
atio
n no
.
3433
2611
7111
701
3438
3311
7203
801
3437
1811
7203
301
3435
5111
7202
301
3435
4911
7203
601
3435
3011
7200
401
3434
3311
7194
201
3434
4611
7201
201
3434
3511
7195
501
3434
3011
7202
401
3433
3711
7183
101
3433
5111
7173
202
3433
4311
7172
601
3438
0511
7205
101
3438
1511
7211
101
3438
1511
7211
901
3438
1511
7211
902
3437
5711
7221
001
3437
5211
7232
501
3438
0611
7241
601
3437
5611
7260
701
3437
2611
7213
001
3437
3311
7210
801
3437
3311
7210
802
3437
2311
7205
501
Dat
e
4-11
-94
11-1
9-92
8-5-
93
11-1
8-92
2-21
-93
11-1
8-92
11-1
6-92 _
11-1
9-92
12-8
-92
3-9-
94
3-10
-94
11-2
5-92
1990
-94
dept
h to
w
ater
(ft
belo
w la
nd
surf
ace)
164.
3 10
.220
.73
10.1
255
.857
.19
14.0
8 _ 22
0.23
206.
3391
.49
77.9
6 14
.66
Dat
e
4-3-
964-
9-96
4-9-
964-
9-96
4-9-
96
4-9-
963-
29-9
65-
14-9
62-
14-9
63-
29-9
6
3-28
-96
3-13
-96
3-28
-96
3-28
-96
2-21
-96
2-22
-96
2-28
-96
5-21
-96
5-16
-96
4-3-
96
4-3-
963-
13-9
63-
14-9
63-
14-9
65-
15-9
6
1996
dep
th
to w
ater
(ft
belo
w la
nd
surf
ace)
184.
5151
.14
32.5
612
.47
18.6 6.04
9.54
20.4
58.
2465
.11
10.8
460
.958
.35
17.9
57.
62
7.34
11.4
216.
3220
6.88
91.3
1
68.4
772
.211
.95
11.6
719
.72
Diff
eren
ce
in d
epth
s to
wat
er
(ft)
-20.
21
.66
.28
-.72
-5.1
-1.1
6-3
.87
_ 3.91
-.55 .1
8
9.49
-5.0
6
Alti
tude
of
wat
er
tabl
e (f
t ab
ove
sea
leve
l)2,
735
2,52
92,
563
2,60
32,
576
2,61
92,
650
2,63
02,
612
2,58
5
2,66
92,
675
2,67
22,
552
2,54
4
2,54
52,
542
2,58
42,
585
2,67
9
2,69
62,
576
2,55
92,
559
2,56
0
Alti
tude
of
land
sur
fa
ce (
ft ab
ove
sea
leve
l)2,
920
2,58
02,
596
2,61
52,
595
2,62
52,
660
2,65
02,
620
2,65
0
2,68
02,
736
2,73
02,
570
2,55
2
2,55
32,
553
2,80
02,
792
2,77
0
2,76
42,
648
2,57
12,
570
2,58
0
Met
hod
of
mea
sure
m
ent
S V V V S V V V S V S R S V V V V V S S V V V V V
Dep
th
of w
ell
(ft)
86 83 221 25 25 103 25 247
256 150
Scre
ened
or
perf
orat
ed
Inte
rval
(ft
)
14.5
-24.
519
2^20
144-
324
130-
179
15-2
5
93-1
0315
-25
202-
244
68-7
893
-103
15-2
530
-150
Wel
l not
es
P,N S S
See
foot
note
at e
nd o
f tab
le.

Tab
le 1
. Wat
er-le
vel d
ata
and
wel
l-con
stru
ctio
n in
form
atio
n fo
r the
Moj
ave
Riv
er,
the
Mor
ongo
, and
the
Fort
Irwin
gro
und-
wat
er b
asin
s, S
an B
erna
rdin
o C
ount
y,
Cal
iforn
ia C
ontin
ued
Regional Water
u- <D (0 i JD 1 O 0) tO 2 i- Q) $ 33 I 2 o i (O p 3 I 5' O 3 Q. i A 00 0) « F S 00 3 3. o o o
Stat
e w
ell n
o.
6N/5
W-1
2K1
-12K
2-1
2L5
-12P
2-1
2Q2
-13B
11
-13B
21
-13G
4-1
3G6
-20A
1
-24P
3-3
4E3
-34F
16N
/6W
-6Q
3-1
3R1
1
-13R
21
-14L
1-2
1J2
-21L
2
-30M
1
6N/7
W-9
L1
-10P
2-1
8N1
-21A
27N
/4W
-6N
1
uses
iden
tific
atio
n no
.
3437
1011
7211
701
3437
1911
7211
701
3437
2111
7213
001
3437
0411
7212
801
3436
5911
7211
701
3436
5511
7210
701
3436
5511
7210
702
3436
3211
7211
201
3436
3711
7211
102
3436
0211
7251
001
3435
2211
7212
101
3433
5811
7235
701
3433
5811
7232
801
3438
0111
7324
401
3436
0711
7271
201
3436
0711
7271
202
3436
3111
7285
801
3435
3411
7303
001
3435
3211
7305
902
3434
3511
7333
301
3437
2611
7372
201
3437
1211
7361
701
3436
1311
7394
101
3436
0611
7365
601
3443
1811
7204
701
Dat
e _ 3-
10-9
4 _ 5-
21-9
36-
22-9
3 _11
-15-
925-
27-9
14-
1-94
11-1
5-92
4-28
-93
10-3
0-91
4-28
-93
11-1
-90
11-1
9-92
1990
-94
dept
h to
w
ater
(ft
belo
w la
nd
surf
ace)
_ 234.
05
_ 114 55.9
9
142.
9813
3.03
92.6
511
8.34
76.4
337
.49
66.6
570
.64
69.6
1
Dat
e
4-9-
963-
13-9
63-
13-9
64-
9-96
4-9-
96
5-14
-96
5-14
-96
4-9-
964-
9-96
4-3-
96
3-26
-96
4-8-
964-
8-96
4-3-
965-
16-9
6
5-16
-96
4-3-
965-
16-9
64-
3-96
5-16
-96
4-3-
965-
22-9
64-
3-96
5-16
-96
3-28
-96
1996
dep
th
to w
ater
(ft
belo
w la
nd
surf
ace)
13.3
27.
458
.14
34.4
521
.97
5.86
6.03
31.6
414
.96
234.
76
277.
5332
7.32
330.
0812
1.9
55.3
3
55.7
514
3.62
129.
9892
.49
119.
25
79.9
538
.99
67.3
172
.72
38.7
2
Diff
eren
ce
in d
epth
s to
wat
er
(ft)
_ -0.7
1
_ -7.9 .6
6
-.64 3.05 .1
6-.9
1
-3.5
2-1
.5 -.66
-2.0
830
.89
Alti
tude
of
wat
er
tabl
e (f
t ab
ove s
ea
leve
l)2,
576
2,57
12,
578
2,58
12,
580
2,57
42,
574
2,58
52,
584
2,58
7
2,58
32,
588
2,58
82,
773
2,76
2
2,76
12,
665
2,75
62,
803
2,87
3
2,78
22,
825
2,84
82,
836
2,45
1
Alti
tude
of
land
sur
fa
ce (f
t ab
ove
sea
leve
l)2,
589
2,57
82,
636
2,61
52,
602
2,58
02,
580
2,61
62,
599
2,82
2
2,86
12,
915
2,91
82,
895
2,81
7
2,81
72,
809
2,88
62,
895
2,99
2
2,86
22,
864
2,91
52,
909
2,49
0
Met
hod
of
mea
sure
m
ent
V V V V V V V V V V V V S S V V S V S S V S V S V
Dep
th
of w
ell
(ft)
60 57 43 45 38 18 294 150 _ 280
200 172
320
160
200
Scre
ened
or
perf
orat
ed
inte
rval
(ft
)
64-7
4 _
93-1
0315
-25
274-
294 _
110-
200
130-
142
70-3
20
80-1
9474
-452
Wel
l not
es
N N N
O a
t 260
See
foot
note
at e
nd o
f tab
le.

Tab
le 1
. Wat
er-le
vel d
ata
and
wel
l-con
stru
ctio
n in
form
atio
n fo
r the
Moj
ave
Riv
er, t
he M
oron
go,
and
the
Fort
Irwin
gro
und-
wat
er b
asin
s, S
an B
erna
rdin
o C
ount
y,
Cal
iforn
ia C
ontin
ued
Stat
e w
ell n
o.
7N/4
W-7
B3
-19Q
51
-19Q
61-1
9Q7
1
-30C
1
-30E
1-3
1D3
-31E
3-3
1L1
7N/5
W-5
D2
-13H
11
-13H
21
-23R
11
-23R
21
-23R
31
-23R
41
-24P
4-2
4R5
1-2
4R6
1-2
4R7
1
-24R
81
-25K
6-2
5R4
-25R
5-3
4G1
USG
S id
entif
icat
ion
no.
3442
5911
7201
001
3440
3011
7201
101
3440
3011
7201
102
3440
3011
7201
103
3440
2611
7202
301
3440
0411
7204
301
3439
3411
7204
801
3439
1811
7203
301
3438
5811
7202
801
3443
4611
7260
101
3441
5911
7205
701
3441
5911
7205
702
3440
3611
7215
201
3440
3611
7215
202
3440
3611
7215
203
3440
3611
7215
204
3440
2911
7213
601
3440
2811
7210
601
3440
2811
7210
602
3440
2811
7210
603
3440
2811
7210
604
3439
5511
7211
201
3439
4511
7205
801
3439
4611
7205
001
3439
0911
7232
201
1990
-94
dept
h to
D
ate
wat
er (f
t be
low
land
su
rfac
e)11
-17-
92
26.6
3
11-1
6-92
87
.03
11-2
0-92
29
3.62
_
_
11-1
6-92
9.
98
3-9-
94
176.
15
Dat
e
3-28
-96
4-9-
964-
9-96
4-9-
964-
9-96
4-9-
964-
9-96
4-9-
963-
28-9
65-
16-9
6
3-14
-96
3-14
-96
3-28
-96
3-28
-96
3-28
-96
2-29
-96
3-28
-96
4-9-
964-
9-96
4-9-
96
4-9-
964-
9-96
3-28
-96
4-9-
964-
4-96
1996
dep
th
to w
ater
(ft
belo
w la
nd
surf
ace)
19.0
167
.75
79.7
587
.83
60.8
2
30.2
428
.748
.47
101.
7132
1.58
14.1
51.
1628
3.02
283.
7423
9.46
10.5
72 69.9
129
.35
9.33
8.71
10.2
522
.14
172.
1
Diff
eren
ce J£
tow£
ter
abov
esea
(ft)
leve
l)7.
62
2,45
1
2,52
2
2,51
0-.
8 2,
502
2,50
0
2,50
5
2,51
4
2,52
7
2,51
8-2
7.96
2,
398
2,46
1
2,47
4
2,44
2
2,44
1
2,48
6
2,50
0
2,43
3
2,43
5
2,47
6
.65
2,49
6
2,51
4
2,52
0
2,51
44.
05
2,57
4
Alti
tude
of
land
sur
fa
ce (f
t ab
ove
sea
leve
l)2,
470
2,59
02,
590
2,59
02,
561
2,53
52,
543
2,57
52,
620
2,72
0
2,47
52,
475
2,72
52,
725
2,72
5
2,72
52,
510
2,50
52,
505
2,50
5
2,50
52,
523
2,53
02,
536
2,74
6
Met
hod
of
mea
sure
m
ent
V V V V V V V s V s V V R R R R S V V V V V V V V
Dep
th
of w
ell
(ft)
594
276
150 73 42 200 402
100 25 740
510
315 92 550
285
150 50 240 32 500
Scre
ened
or
perf
orat
ed
.....
inte
rval
e
no e
s
534-
574
256-
276
130-
150
90-1
0015
-25
700-
740
490-
510
295-
315
57-9
2 D
510-
550
265-
285
130-
150
45-5
0
65-8
5
See
foot
note
at e
nd o
f tab
le.

Tab
le 1
. Wat
er-le
vel d
ata
and
wel
l-con
stru
ctio
n in
form
atio
n fo
r the
Moj
ave
Riv
er,
the
Mor
ongo
, and
the
Fort
Irwin
gro
und-
wat
er b
asin
s, S
an B
erna
rdin
o C
ount
y,
Cal
iforn
ia C
ontin
ued
egional Water i (D 50 S5 £ ? 1 2. O o> (O T O = i 31 1 O (O p 3 i 3 O O 3 Q. i S* 03 S __ 3 03
(D
Stat
e w
ell n
o.
8N/3
W-I
A7
-5J1
-8F1
-19Q
18N
/4E-
10E1
8N/4
W-9
R1
-10Q
1-1
2C1
-12Q
1-1
9G1
1
-19G
21
-19G
31 1
-19G
41
-20Q
71
-20Q
81
-20Q
91
-20Q
101
-20Q
111
-21M
11
-21M
21
-21M
31
-21M
41
-23Q
1-2
4J2
-29E
31
USG
S id
entif
icat
ion
no.
3448
5911
7113
001
3448
4111
7125
301
3448
0311
7125
101
3445
4711
7134
201
3448
1011
6331
201
3447
3311
7173
801
3447
2811
7165
001
3448
1811
7151
501
3447
2811
7145
601
3446
1111
7200
801
3446
1111
7200
802
3446
1111
7200
803
3446
1111
7200
804
3445
4611
7190
101
3445
4611
7190
102
3445
4611
7190
103
3445
4611
7190
104
3445
4611
7190
105
3446
0911
7182
901
3446
0911
7182
902
3446
0911
7182
903
3446
0911
7182
904
3445
4411
7154
601
3445
5711
7143
701
3445
2411
7193
401
Dat
e
11-1
9-92
11-2
4-92
11-1
8-92
11-1
4-92
4-20
-93 _
11-1
7-92
11-1
9-92
11-1
7-92
9-24
-93
11-1
5-90
11-1
4-92
1990
-94
dept
h to
w
ater
(ft
belo
w la
nd
surf
ace)
17.5
512
.74
33.7
617
3.52
21.3
3
_ 24.8
446
.726
.38
9.49
172.
516
4.99
Dat
e
3-27
-96
5-23
-96
3-27
-96
4-17
-96
5-2-
96
5-21
-96
3-27
-96
3-28
-96
3-27
-96
3-27
-96
3-27
-96
4-29
-96
4-29
-96
3-27
-96
3-27
-96
3-27
-96
3-27
-96
3-27
-96
3-27
-96
3-27
-96
3-27
-96
3-27
-96
5-14
-96
4-8-
964-
29-9
6
1996
dep
th
to w
ater
(ft
belo
w la
nd
surf
ace)
11.6 6.07
22.7
217
3.25
25.1
8
67.8
211
.51
34.2
813
.42
70.1
1
70.1
969
.69
70 6.84
6.53
5.81
5.8
6.75
12.2
59.
66
6.38
6.5
171.
8816
6.37
19.3
9
Diff
eren
ce
in d
epth
s to
wat
er
(ft)
5.95
6.67
11.0
4.2
7-3
.85
_ 13.3
312
.42
12.9
6 _ 2.
99 .62
-1.3
8
Alti
tude
of
wat
er
tabl
e (f
t ab
ove s
ea
leve
l)2,
263
2,28
42,
292
2,34
11,
757
2,29
92,
343
2,31
62,
316
2,38
8
2,38
82,
388
2,38
82,
390
2,39
1
2,39
12,
392
2,39
12,
373
2,37
5
2,37
92,
379
2,31
72,
312
2,39
0
Alti
tude
of
land
sur
fa
ce (f
t ab
ove
sea
leve
l)2,
275
2,29
02,
315
2,51
41,
782
2,36
72,
355
2,35
02,
329
2,45
8
2,45
82,
458
2,45
82,
397
2,39
7
2,39
72,
397
2,39
72,
385
2,38
5
2,38
52,
385
2,48
92,
478
2,40
9
Met
hod
of
mea
sure
m
ent
S S V V V V V V V V R V V V V V V V V V V V S S V
Dep
th
of w
ell
(ft)
50 115 180
200 49 315
240
170
100
460
350
270
160 50 370
230
140 40 253
360
309
Scre
ened
or
perf
orat
ed
We|
|not
es
inte
rval
(ft
)
60-1
15
100-
140 _
295-
315
220-
240
150-
170
80-1
0044
0-^6
033
0-35
0
250-
270
140-
160
30-5
035
0-37
021
0-23
0
120-
140
30-^
015
3-25
3
289-
309
See
foot
note
at e
nd o
f tab
le.

Tab
le 1
. Wat
er-le
vel d
ata
and
wel
l-con
stru
ctio
n in
form
atio
n fo
r the
Moj
'ave
Riv
er, t
he M
oron
go,
and
the
Fort
Irwin
gro
und-
wat
er b
asin
s, S
an B
emar
dino
Cou
nty,
C
alifo
rnia
Con
tinue
d
Stat
e w
ell n
o.
8N/4
W-2
9E4
1-2
9E5
1-2
9E6
1
-31R
18N
/6W
-9A
1
-15J
1-2
7H1
9N/1
E-4
K1
1-4
K2
1-4
K3
1
-6E
1-6
H2
-10L
1-1
0Q21
-10Q
31
-10Q
41
-15H
1-1
5N3
-16F
11
-16F
21
-16F
31
-16F
41
-19J
1-2
2B6
-23J
1
uses
iden
tific
atio
n no
.
3445
2411
7193
402
3445
2411
7193
403
3445
2411
7193
404
3444
0111
7194
701
3448
1911
7302
801
3446
5811
7293
501
3445
2011
7293
101
3453
5611
6523
001
3453
5611
6523
002
3453
5611
6523
003
3454
1311
6552
201
3454
1011
6544
101
3453
0411
6515
801
3452
5911
6514
201
3452
5911
6514
202
3452
5911
6514
203
3452
3011
6512
101
3452
0711
6520
801
3452
2411
6525
701
3452
2411
6525
702
3452
2411
6525
703
3452
2411
6525
704
3451
2611
6543
301
3451
5111
6515
201
3451
2711
6502
701
Dat
e 11
-21-
92
11-2
1-92
10-2
6-92
9-21
-93
4-22
-93
1-11
-94
9-21
-93
11-2
0-92
11-1
7-92 _
9-21
-93
4-23
-93
11-1
7-92
11-1
7-92
1990
-94
dept
h to
w
ater
(ft
belo
w la
nd
surf
ace)
127.
69
158.
4416
5.01
142.
62
251.
85 13
7.75
134.
3713
2.54
151.
82 _ 10
8.85
178.
6714
8.18
169.
02
Dat
e
4-29
-96
4-29
-96
4-29
-96
3-28
-96
5-21
-96
5-21
-96
4-18
-96
3-26
-96
3-26
-96
3-26
-96
4-24
-96
5-13
-96
3-26
-96
3-26
-96
3-26
-96
3-26
-96
3-26
-96
3-26
-96
3-26
-96
4-29
-96
3-26
-96
4-22
-96
3-26
-96
3-26
-96
1996
dep
th
to w
ater
(ft
belo
w la
nd
surf
ace)
18.9
618
.21
11.8
324
.512
7.65
158.
4116
3.57
152.
4715
2.22
151.
2
111
131.
94 14
3.29
144.
04
144.
0813
4.92
162.
8612
7.11
127.
55
127.
9913
0.01
181.
515
9.33
171.
21
Diff
eren
ce
in d
epth
s to
wat
er
(ft)
0.04 .0
31.
44 -8
.58
-25.
15 -9
.71
-2.3
8-1
1.04
_ -21.
16-2
.83
-11.
15-2
.19
Alti
tude
of
wat
er
tabl
e (ft
ab
ove s
ea
leve
l)2,
391
2,39
12,
398
2,42
52,
637
2,65
12,
768
1,81
31,
813
1,81
4
1,82
21,
848
1,80
51,
804
1,80
41,
825
1,80
71,
823
1,82
2
1,82
21,
820
1,96
31,
816
1,80
9
Alti
tude
of
land
sur
fa
ce (f
t ab
ove
sea
leve
l)2,
409
2,40
92,
409
2,44
92,
765
2,80
92,
932
1,96
51,
965
1,96
5
2,09
91,
980
1960
1,94
81,
948
1,94
81,
960
1,97
01,
950
1,95
0
1,95
01,
950
2,14
41,
975
1,98
0
Met
hod
of
mea
sure
m
ent
V V V s V V V V V V V s V V V V V V V V V V s V V
Dep
th
of w
ell
(ft)
210
130 40 240
294
403
470
340
195
480
320
428
550
350
200 410
340
250
150
415
200
Scre
ened
or
perf
orat
ed
We|
|not
es
inte
rval
(f
t)
190-
210
110-
130
30-4
0
383-
403
450-
470
320-
340
175-
195
530-
550
330-
350
180-
200
120-
200
390-
410
320-
340
230-
250
130-
150
180-
218
Oat
323
See
foot
note
at e
nd o
f tab
le.

Tab
le 1
. Wat
er-le
vel d
ata
and
wel
l-con
stru
ctio
n in
form
atio
n fo
r the
Moj
ave
Riv
er, t
he M
oron
go, a
nd th
e Fo
rt Irw
in g
roun
d-w
ater
bas
ins,
San
Ber
nard
ino
Cou
nty,
C
alifo
rnia
Con
tinue
d
Regional Water
' i (D*
CD I ? SL O S <
0 L o 1 30 1 cf
5 1 i 3 O 5 c 3 Q. I 03 0) tO 5' to s 03 1 O o
o
Stat
e w
ell n
o.
9N/1
W-4
J8-4
M5
1-4
M6
1-4
M7
1-4
R2
1
-4R
31
-4R
41
-9D
51
-9D
61
-9D
71
-9D
81
-10E
4-1
0J12
1-1
0J13
1-1
0J14
1
-10J
151
-11K
121
-11K
131
-11K
141
-11K
151
-11M
11-1
1R1
1-1
1R21
-12L
21-1
2L3
1
USG
S id
entif
icat
ion
no.
3453
4511
6585
401
3453
5111
6593
302
3453
5111
6593
303
3453
5111
6593
304
3453
3911
6584
501
3453
3911
6584
502
3453
3911
6584
503
3453
2811
6594
301
3453
2811
6594
302
3453
2811
6594
303
3453
2811
6594
304
3453
0411
6584
201
3452
5111
6574
201
3452
5111
6574
202
3452
5111
6574
203
3452
5111
6574
204
3452
5411
6570
401
3452
5411
6570
402
3452
5411
6570
403
3452
5411
6570
404
3452
5411
6572
404
3452
4311
6563
801
3452
4311
6563
802
3452
5111
6560
601
3452
5111
6560
602
1990
-94
dept
h to
D
ate
wat
er (f
t D
ate
belo
w la
nd
surf
ace)
11-2
0-92
37
.92
3-26
-96
_
_
3-26
-96
_
_
3-26
-96
1-28
-93
28.1
7 3-
26-9
6_
_
3-26
-96
_
_
3-26
-96
_
_
3-26
-96
_
_
3-26
-96
_
_
3-26
-96
_
_
3-26
-96
2-11
-93
54.1
7 3-
26-9
6_
_
5-14
-96
_
_
3-26
-96
_
_
3-26
-96
_
_
3-26
-96
11-1
6-92
21
.77
3-26
-96
_
_
3-26
-96
_
_
3-26
-96
_
_
3-26
-96
11-1
6-92
14
.57
3-26
-96
5-14
-96
5-14
-96
_
_
5-14
-96
_
_
3-26
-96
3-26
-96
1996
dep
th
to w
ater
(ft
belo
w la
nd
surf
ace)
9.62
29.3
229
.65
29.3
27.
48
10.1 9.98
19.8
327
.33
37.5
3
47.1
620
.77
13.7
114
.69
12.1
1
11.6 8.29
8.58
6.49
6.55
4.27
20.6
922
.58
9.89
9.25
Dif
fere
nce
Afltl
tude
in
dea
ths
wat
erto
w*
er
abov
esea
(fl)
leve
l)28
.3
2,04
0
2,04
1
2,04
0-1
.15
2,04
1
2,03
8
2,03
5
2,03
5
2,07
4
2,06
7
2,05
6
7.01
2,
047
2,03
9
2,02
0
2,01
9
2,02
1
10.1
7 2,
022
2,01
4
2,01
4
2,01
68.
02
2,01
6
2,01
1
2,01
1
2,01
0
1,99
2
1,99
3
Alti
tude
of
land
sur
fa
ce (f
t ab
ove
sea
leve
l)2,
050
2,07
02,
070
2,07
02,
045
2,04
52,
045
2,09
42,
094
2,09
4
2,09
42,
060
2,03
42,
034
2,03
4
2,03
42,
022
2,02
22,
022
2,02
2
2,01
52,
032
2,03
32,
002
2,00
2
Met
hod
of
mea
sure
m
ent
V V V V V V V V V V V s V V V V V V V V s s s V V
Dep
th
of w
ell
(ft)
250
160 80 280
140 40 500
300
190 80 102
610
370
200
100
590
315
180 90 75 52 _ 450
320
Scre
ened
or
perf
orat
ed
...
in
terv
al
Wel
lnot
es
(ft)
230-
250
140-
160
40-8
0
260-
280
120-
140
20-4
048
0-50
028
0-30
017
0-19
0
60-8
099
.6-1
01.6
590-
610
350-
370
180-
200
80-1
0057
0-59
029
5-31
516
0-18
070
-90
35-7
550
-52
100-
102
430-
450
300-
320
See
foot
note
at e
nd o
f tab
le.
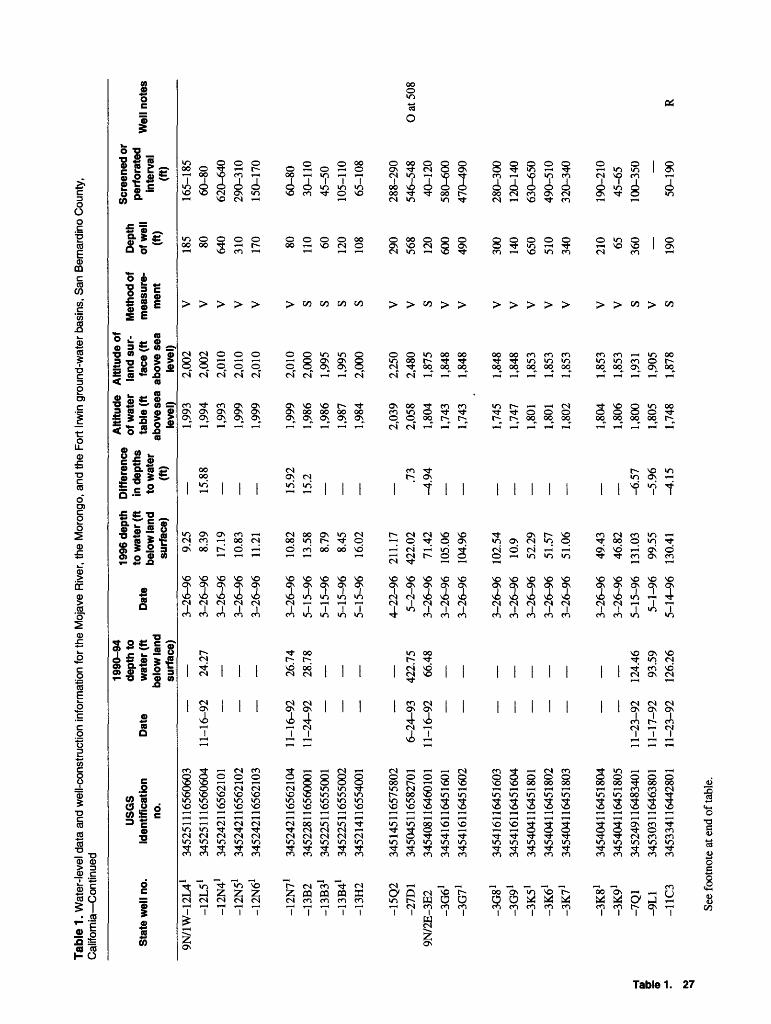
Tab
le 1
. Wat
er-le
vel d
ata
and
wel
l-con
stru
ctio
n in
form
atio
n fo
r the
Moj
ave
Riv
er, t
he M
oron
go,
and
the
Fort
Irwin
gro
und-
wat
er b
asin
s, S
an B
emar
dino
Cou
nty,
C
alifo
rnia
Con
tinue
d
Sta
te w
ell n
o.
9N/1
W-1
2L4
1-1
2L5
1-1
2N4
1-1
2N5
1-1
2N6
1
-12N
71
-13B
2-1
3B3
1-1
3B4
1
-13H
2
-15Q
2-2
7D1
9N/2
E-3
E2
-3G
61
-3G
71
-3G
81
-3G
91
-3K
51
-3K
61
-3K
71
-3K
81
-3K
91
-7Q
1-9
L1
-11C
3
uses
iden
tific
atio
n no
.
3452
5111
6560
603
3452
5111
6560
604
3452
4211
6562
101
3452
4211
6562
102
3452
4211
6562
103
3452
4211
6562
104
3452
2811
6560
001
3452
2511
6555
001
3452
2511
6555
002
3452
1411
6554
001
3451
4511
6575
802
3450
4511
6582
701
3454
0811
6460
101
3454
1611
6451
601
3454
1611
6451
602
3454
1611
6451
603
3454
1611
6451
604
3454
0411
6451
801
3454
0411
6451
802
3454
0411
6451
803
3454
0411
6451
804
3454
0411
6451
805
3452
4911
6483
401
3453
0311
6463
801
3453
3411
6442
801
1990
-94
dept
h to
D
ate
wat
er (f
t be
low
land
su
rfac
e)
11-1
6-92
24
.27
11-1
6-92
26
.74
11-2
4-92
28
.78
6-24
-93
422.
7511
-16-
92
66.4
8
_
_
_
_
_
_
11-2
3-92
12
4.46
11-1
7-92
93
.59
11-2
3-92
12
6.26
Dat
e
3-26
-96
3-26
-96
3-26
-96
3-26
-96
3-26
-96
3-26
-96
5-15
-96
5-15
-96
5-15
-96
5-15
-96
4-22
-96
5-2-
963-
26-9
63-
26-9
63-
26-9
6
3-26
-96
3-26
-96
3-26
-96
3-26
-96
3-26
-96
3-26
-96
3-26
-96
5-15
-96
5-1-
965-
14-9
6
1996
dep
th
to w
ater
(ft
belo
w la
nd
surf
ace)
9.25
8.39
17.1
910
.83
11.2
1
10.8
213
.58
8.79
8.45
16.0
2
211.
1742
2.02
71.4
210
5.06
104.
96
102.
5410
.952
.29
51.5
751
.06
49.4
346
.82
131.
0399
.55
130.
41
Dif
fere
nce
^Jj
in d
epth
s °
*a
...
. .
tabl
e (ft
towf
er
abov
esea
(ft)
leve
l)
1,99
315
.88
1,99
4
1,99
3
1,99
9
1,99
9
15.9
2 1,
999
15.2
1,
986
1,98
6
1,98
7
1,98
4
2,03
9.7
3 2,
058
-4.9
4 1,
804
1,74
3
1,74
3
1,74
5
1,74
7
1,80
1
1,80
1
1,80
2
1,80
4
1,80
6-6
.57
1,80
0-5
.96
1,80
5-4
.15
1,74
8
Alti
tude
of
land
sur
fa
ce (
ft ab
ove
sea
leve
l)2,
002
2,00
22,
010
2,01
02,
010
2,01
02,
000
1,99
51,
995
2,00
0
2,25
02,
480
1,87
51,
848
1,84
8
1,84
81,
848
1,85
31,
853
1,85
3
1,85
31,
853
1,93
11,
905
1,87
8
Met
hod
of
mea
sure
m
ent
V V V V V V s s s s V V s V V V V V V V V V s V s
Dep
th
of w
ell
(ft)
185 80 640
310
170 80 110 60 120
108
290
568
120
600
490
300
140
650
510
340
210 65 360 190
Scr
eene
d or
pe
rfor
ated
W
e||n
otes
in
terv
al
(ft)
165-
185
60-8
062
0-64
029
0-31
015
0-17
0
60-8
030
-110
45-5
010
5-11
065
-108
288-
290
546-
548
0 a
t 508
40-1
2058
0-60
047
0-49
0
280-
300
120-
140
630-
650
490-
510
320-
340
190-
210
45-6
510
0-35
0
50-1
90
R
See
foot
note
at e
nd o
f tab
le.

Tab
le 1
. Wat
er-le
vel d
ata
and
wel
l-con
stru
ctio
n in
form
atio
n fo
r the
Moj
ave
Riv
er, t
he M
oron
go, a
nd th
e Fo
rt Irw
in g
roun
d-w
ater
bas
ins,
San
Ber
nard
ino
Cou
nty,
C
alifo
rnia
Con
tinue
d
Regional Water
'
0) o- (D i i 1 1 3 0) (Q ^ O I 3D I O I (Q O 3 i 3 O § i(D DO 5' w 3 8? 3 0) &
Stat
e w
ell n
o.
9N/2
E-1
1H3
-11Q
1-1
2A4
-12F
4-3
0B2
9N/2
W-1
A2
-2B
5-2
E1
-3A
11
-3A
21
-3D
3-3
E1
1-3
E2
1-3
E3
1-4
D1
-4Q
IO-5
N7
-5N
8-6
A4
-6H
6
-6L
8-6
L11
1-6
L12
1-6
L13
1-6
P2
USG
S id
entif
icat
ion
no.
3453
1611
6441
003
3452
4811
6442
401
3453
3011
6425
501
3453
1411
6433
701
3450
5211
6484
001
3454
1611
7014
601
3454
2111
7031
101
3454
0711
7034
701
3454
2111
7035
301
3454
2111
7035
302
3454
1911
7044
601
3454
0611
7044
001
3454
0611
7044
002
3454
0611
7044
003
3454
1811
7055
701
3453
4411
7052
601
3453
3911
7065
001
3453
4411
7065
901
3454
2211
7071
001
3454
0211
7070
401
3453
5011
7074
601
3453
5011
7074
001
3453
5011
7074
002
3453
5011
7074
003
3453
4511
7074
901
Dat
e 11
-16-
9211
-16-
9212
-10-
924-
21-9
3
11-1
7-92
11-1
9-92 _
11-1
7-92
11-1
8-92
11-1
8-92
11-1
8-92
1990
-94
dept
h to
w
ater
(ft
belo
w la
nd
surf
ace)
75.5
101.
7411
5.05
161.
99
89.2
793
.47
_ 99.3
3
95.4
101.
9 10
5.26
Dat
e
5-14
-96
5-1-
963-
26-9
64-
22-9
65-
2-96
3-27
-96
3-27
-96
3-27
-96
3-27
-96
3-27
-96
5-22
-96
3-27
-96
3-27
-96
3-27
-96
3-27
-96
3-27
-96
5-15
-96
5-15
-96
5-13
-96
3-27
-96
3-27
-96
3-27
-96
3-27
-96
3-27
-96
3-27
-96
1996
dep
th
to w
ater
(ft
belo
w la
nd
surf
ace)
78.3
883
.58
110.
6411
9.68
170.
26
36.9
443
.27
42.8
40.5
940
.07
48.2
942
.94
42.9
942
.34
53.6
5
53.9
961
.96
60.7
763
.48
58.6
7
57.9
655
.54
53.8
755
.36
51.4
8
Diff
eren
ce
in d
epth
s to
wat
er
(ft)
-8.0
8-8
.9
-4.6
3-8
.27
52.3
350
.2 _ 45
.68
41.4
1 41
.13
47.3
Alti
tude
of
wat
er
tabl
e (ft
ab
ove s
ea
leve
l)1,
787
1,79
11,
734
1,73
51,
795
2,06
82,
087
2,09
72,
098
2,09
9
2,10
72,
107
2,10
72,
108
2,11
6
2,11
12,
122
2,12
32,
118
2,12
1
2,13
22,
129
2,13
12,
130
2,13
4
Alti
tude
of
land
sur
fa
ce (f
t ab
ove
sea
leve
l)1,
865
1,87
51,
845
1,85
51,
965
2,10
52,
130
2,14
02,
139
2,13
9
2,15
52,
150
2,15
02,
150
2,17
0
2,16
52,
184
2,18
42,
181
2,18
0
2,19
02,
185
2,18
52,
185
2,18
5
Met
hod
of
mea
sure
m
ent
S V S V V V V V V V S V V V V V S S S V V V V V V
Dep
th
of w
ell
(ft)
160
160 220
294
120 160
120
120
160
230
185
120 195 300 99 _ 200
155 95 94
Scre
ened
or
perf
orat
ed
Inte
rval
(ft
)
60-1
6090
-130
80-2
0012
0-22
040
-294
80-1
10
140-
160
100-
120
35-5
5
80-1
6021
0-23
016
5-18
510
0-12
050
-185
90-1
50
80-3
0095
-99
100-
220
190-
200
135-
155
75-9
574
-94
Wel
l not
es
R
Oat
55
R
See
foot
note
at e
nd o
f tab
le.

Tab
le 1
. Wat
er-le
vel d
ata
and
wel
l-con
stru
ctio
n in
form
atio
n fo
r the
Moj
ave
Riv
er, t
he M
oron
go,
and
the
Fort
Irwin
gro
und-
wat
er b
asin
s, S
an B
erna
rdin
o C
ount
y,
Cal
if orn
ia C
on
tin u
ed
Stat
e w
ell n
o.
9N/2
W-1
9B1
-19B
2-2
1R1
-27C
19N
/3E-
3D1
-3D
2-5
H1
-5N
2-6
A1
-15E
4
-22R
41
-22R
51
-22R
61
-22R
71
-29D
1
-34D
1-3
4N1
-35D
39N
/3W
-1R
51
-1R
61
-1R
71
-3J2
H
-11C
1
1 -1
3R1
^
-15A
1
USG
S id
entif
icat
ion
no.
3451
4711
7071
801
3451
4811
7072
401
3451
0411
7045
701
3450
5011
7042
701
3454
2911
6393
501
3454
2811
6394
001
3454
0911
6404
901
3453
4411
6413
401
3454
1711
6420
001
3452
2411
6393
601
3451
0411
6384
001
3451
0411
6384
002
3451
0411
6384
003
3451
0411
6384
004
3450
5211
6413
601
3450
1111
6394
201
3449
2711
6394
101
3450
0111
6381
701
3453
4111
7082
101
3453
4111
7082
102
3453
4111
7082
103
3453
5111
7101
601
3453
3311
7095
601
3451
5311
7080
701
3452
3411
7101
701
Dat
e 11
-21-
925-
17-9
411
-21-
92
11-1
6-92
11-1
6-92
11-1
6-92
11-1
3-92
12-9
-92 _
9-21
-93
12-1
0-92
11-2
4-92
1-15
-93
11-1
6-92
1-20
-93
11-2
4-92
11-1
7-92
1990
-94
dept
h to
w
ater
(ft
belo
w la
nd
surf
ace)
115.
9723
6.88
278.
48 92
.62
91.2
710
5.42
85.8
910
3.24
_ 103.
49 52
.03
83.6
894
.21
107.
65 77
.18
107.
8274
.85
Dat
e 4-
22-9
65-
13-9
64-
22-9
6
5-1-
963-
25-9
63-
25-9
63-
25-9
65-
14-9
6
3-25
-96
3-25
-96
3-25
-96
3-25
-96
4-22
-96
5-14
-96
5-14
-96
3-27
-96
3-27
-96
3-27
-96
5-21
-96
4-5-
965-
14-9
63-
27-9
6
1996
dep
th
to w
ater
(ft
belo
w la
nd
surf
ace)
111.
0323
8.04
280.
25 97
.12
95.6
710
1.26
89 109.
63
105.
5910
5.48
107.
6410
4.4
60.7
1
91.5
895
.17
75.8
870
.09
63.1
789
.72
69.8
793
.64
54.4
Diff
eren
ce
in d
epth
s to
wat
er
(ft)
4.94
-1.1
6-1
.77
-4.5
-4A 4.16
-3.1
1-6
.39
_ ^.15
-8.6
8
-7.9 -.96
44.4
8 7.
3114
.18
20.4
5
Alti
tude
of
wat
er
tabl
e (ft
ab
ove s
ea
leve
l)
2,14
92,
152
2,16
5
1,72
11,
729
1,73
91,
751
1,71
8
1,71
91,
720
1,71
71,
721
1,79
4
1,72
81,
727
2,11
92,
125
2,13
22,
150
2,15
02,
151
2,16
1
Alti
tude
of
land
sur
fa
ce (f
t ab
ove
sea
leve
l)2,
256
2,26
02,
390
2,44
52,
145
1,81
81,
825
1,84
01,
840
1,82
8
1,82
51,
825
1,82
51,
825
1,85
5
2,28
01,
820
1,82
22,
195
2,19
5
2,19
52,
240
2,22
02,
245
2,21
5
Met
hod
of
mea
sure
m
ent
V S V V s s V s V V V V V V s V V V V s s V
Dep
th
of w
ell
(ft)
300
187 85 200 150
610
510
290
110
197 44 99 219
330
210
130 200
212
Scre
ened
or
perf
orat
ed
inte
rval
(ft
)
60-2
00
60-1
50
590-
610
490-
510
270-
290
90-1
1016
7-19
7
40-9
960
-219
310-
330
190-
210
110-
130
120-
200
Wel
l not
es
H R H R H P S S
ro
<o
See
foot
note
at e
nd o
f tab
le.

Tab
le 1
. Wat
er-le
vel d
ata
and
wel
l-con
stru
ctio
n in
form
atio
n fo
r the
Moj
ave
Riv
er,
the
Mor
ongo
, and
the
Fort
Irwin
gro
und-
wat
er b
asin
s, S
an B
erna
rdin
o C
ount
y,
Cal
iforn
ia C
ontin
ued
igional Water
' o- <F i 1(D T 1 SL O 31 § 03 S O I(D 31 <'
S 0 1 i 5 O | F» DO
e> w 5' w SP D> ? e> o.
Stat
e w
ell n
o.
9N/3
W-2
1K1
-22J
4-2
3C1
-23F
11
-23F
21
-23F
31
-23F
41
-24Q
29N
/4W
-8D
1-3
4D1
1 ON/
1 E 2
0M 1
-20M
21
-28G
3-2
8J8
10N
/1W
-32F
12
-32Q
4-3
3L3
10N
/2E-
31L3
-32P
1-3
5A1
-35M
210
N/2
W-3
0D1
-31D
1-3
2B1
-33C
4
USG
S id
entif
icat
ion
no.
3451
1911
7113
601
3451
1211
7101
901
3451
4611
7094
301
3451
2411
7094
301
3451
2411
7094
302
3451
2411
7094
303
3451
2411
7094
304
3450
5911
7082
901
3453
3211
7194
201
3449
5911
7173
101
3456
3111
6541
401
3456
3111
6541
402
3456
0011
6523
901
3455
4211
6522
401
3454
4811
7003
301
3454
2711
7000
701
3454
4311
6591
701
3454
4611
6485
101
3454
3211
6474
201
3455
1611
6440
601
3454
5311
6444
501
3456
1011
7080
601
3455
1811
7080
301
3455
1711
7062
001
3455
0511
7053
604
Dat
e 3-
23-9
4 _ _ _ _11
-17-
9211
-21-
924-
21-9
3 9-
23-9
3 4-
22-9
3
11-1
7-92
6-2-
9211
-17-
92H
_17_
92
11-1
8-91
1-19
-93
1-19
-93
1-20
-93
1990
-94
dept
h to
w
ater
(ft
belo
w la
nd
surf
ace)
42.4
4 _ _ _ 200.
8734
3.21
396.
06
251.
25 13
8.92
48.4
121.
9196
.39
127.
85
121.
786
.94
85.2
8 94
.48
Dat
e
5-16
-96
3-27
-96
3_27
-96
3-27
-96
3-27
-96
3-27
-96
3-27
-96
3-27
-96
4-30
-96
4-5-
96
3-26
-96
3-26
-96
5-14
-96
4-24
-96
3-26
-96
3-26
-96
3-26
-96
5-15
-96
3-26
-96
3-26
-96
3-26
-96
4-23
-96
4-23
-96
5-21
-96
4-23
-96
1996
dep
th
to w
ater
(ft
belo
w la
nd
surf
ace)
42.8
43.4
49 47.9
543
.83
43.6
443
.54
188.
0534
339
6.06
255.
225
5.18
153.
5113
1.5
31.3
5
26.2
242
.88
129.
8410
1.48
130.
9
128.
0578
.75
66.1
57.4
353
.2
Diff
eren
ce
in d
epth
s to
wat
er
(ft)
-0.9
6 _ _ _ _ 12
.82
.21
0 -3.9
3 7.
42 22
.18
-7.9
3-5
.09
-3.0
5
-6.3
58.
1919
.18
41.2
8
Alti
tude
of
wat
er
tabl
e (ft
ab
ove s
ea
leve
l)2,
203
2,18
72,
174
2,17
92,
187
2,18
32,
183
2,15
22,
012
2,08
7
1,83
51,
835
1,83
11,
841
2,05
4
2,05
42,
047
1,80
51,
804
1,74
4
1,74
72,
101
2,10
92,
117
2,11
2
Alti
tude
of
land
sur
fa
ce (f
t ab
ove
sea
leve
l)2,
246
2,23
02,
223
2,22
72,
230
2,22
72,
227
2,34
02,
355
2,48
3
2,09
02,
090
1,98
51,
972
2,08
5
2,08
02,
090
1,93
51,
905
1,87
5
1,87
52,
180
2,17
52,
174
2,16
5
Met
hod
of
mea
sure
m
ent
S V V V V V V S V S V V S S V S V S V V V V V V S
Dep
th
of w
ell
(ft)
150 77 585
310
200 90 232 620
350
285
227
255
190 120
240 225 _ 63 174
Scre
ened
or
perf
orat
ed
inte
rval
(ft
)
50-1
50
57-7
756
5-58
529
0-31
0
180-
200
70-9
012
2-13
2
340-
350
265-
285
127-
227
211-
255
40-1
3950
-120
100-
240
100-
200
68-1
38 _
132-
174
Wel
l not
es
R H
See
foot
note
at e
nd o
f tab
le.

Tab
le 1
. Wat
er-le
vel d
ata
and
wel
l-con
stru
ctio
n in
form
atio
n fo
r the
Moj
'ave
Riv
er, t
he M
oron
go,
and
the
Fort
Irwin
gro
und-
wat
er b
asin
s, S
an B
erna
rdin
o C
ount
y,
Cal
iforn
ia C
ontin
ued
Stat
e w
ell n
o.
10N
/2W
-33R
1610
N/3
E-3
Q1
-4K
1-7
R1
-12F
1
-14L
4-1
5Q2
-23D
1-2
5B2
-26H
1
-26Q
1-2
7 Jl
1 -2
7J2
1 -2
7 J3
1
-27J
41
-27
J51
-27Q
3-2
8J1
-30P
2-3
3H3
-34L
2-3
5L1
-36A
110
N/3
W-4
H2
-11L
5
USG
S id
entif
icat
ion
no.
3454
2611
7050
801
3459
0311
6385
601
3459
0611
6400
001
3458
0111
6414
701
3458
3611
6370
401
3457
2711
6381
601
3457
1011
6385
601
3457
0211
6382
601
3456
0811
6364
901
3455
4911
6373
701
3455
3011
6380
201
3455
4211
6383
901
3455
4211
6383
902
3455
4211
6383
903
3455
4211
6383
904
3455
4211
6383
905
3455
3311
6391
101
3455
3811
6395
501
3455
3411
6422
201
3455
0311
6394
401
3454
5711
6391
901
3454
5611
6381
601
3455
1611
6363
801
3459
2411
7111
901
3458
2211
7095
401
Dat
e 1-
13-9
311
-18-
92
11-1
3-92
11-1
3-92
11-1
2-92
11-1
6-92
11-1
3-92
11-1
7-92
11-1
6-92
11-1
3-92
11-1
2-92
11-1
8-92
1990
-94
dept
h to
w
ater
(ft
belo
w la
nd
surf
ace)
120.
1510
7.59
115.
0412
4.42
50.9
7
32.3
7
40.7
83.8
2 49
.78
73.7
82.7
4 63
.09
Dat
e
10-0
8-96
4-24
-96
4-24
-96
5-14
-96
5-14
-96
3-25
-96
3-25
-96
4-24
-96
4-24
-96
1-17
-96
5-1-
96
3-25
-96
3-25
-96
3-25
-96
3-25
-96
3-25
-96
3-25
-96
3-25
-96
5-22
-96
3-25
-96
3-25
-96
3-25
-96
4-24
-96
4-17
-96
4-17
-96
1996
dep
th
to w
ater
(ft
belo
w la
nd
surf
ace)
53.8
481
.496
.111
6.85
108.
1
109.
6711
8.67
98.2
212
.75
17.5
2
49.4
18
.41
21.4
1 33
.52
32.5
3
3.62
41.4
883
.24
105.
550
.22
73.1
84.8
368
.85
74.4
662
.53
Diff
eren
ce
in d
epth
s to
wat
er
(ft)
3.3
-.51
5.37
5.75
1.57
-.16
-.78 .5
8 -.
44 .6-2
.09
.56
Alti
tude
of
wat
er
tabl
e (ft
ab
ove
sea
leve
l)2,
105
1,70
91,
701
1,70
21,
669
1,68
01,
681
1,69
21,
707
1,71
2
1,72
1 1,
732
1,72
9 1,
717
1,71
8
1,71
91,
719
1,72
71,
735
1,72
5
1,72
41,
715
1,71
12,
026
2,06
7
Alti
tude
of
land
sur
fa
ce (f
t ab
ove
sea
leve
l)2,
159
1,79
01,
797
1,81
91,
777
1,79
01,
800
1,79
01,
720
1,73
0
1,77
0 1,
750
1,75
0 1,
750
1,75
0
1,75
01,
760
1,81
01,
840
1,77
5
1,79
71,
800
1,78
02,
100
2,13
0
Met
hod
of
mea
sure
m
ent
S S S S S V S S S S V
R
R
R
R V S V V V V V S S V
Dep
th
of w
ell
(ft)
150 234 25 570
370
255
255 45 200 300
160 225
Scre
ened
or
Inte
rval
80-1
50
R
60-2
60
14.7
-24.
7
550-
570
350-
370
235-
255
70-9
0
35-4
5
100-
207.
6
70-1
20
0> cr 9
See
foot
note
at e
nd o
f tab
le.

Tab
le 1
. Wat
er-le
vel d
ata
and
wel
l-con
stru
ctio
n in
form
atio
n fo
r the
Moj
'ave
Riv
er, t
he M
oron
go,
and
the
Fort
Irwin
gro
und-
wat
er b
asin
s, S
an B
erna
rdin
o C
ount
y,
Cal
ifom
ia C
on
tin u
ed
Regional Water
' -i
or (D <O IE 1 1 o 3 (Q ^ "5" 3 I S 0 (Q Tl
i 5' O 5 c 3 ^ § 03 5' y w 3 ff i I 0 o 0
Stat
e w
ell n
o.
10N
/3W
-25E
6-2
6L2
-27F
1-2
8M1
-36J
4
10N
/4E
-7P2
-19M
2-2
0C4
-29E
3-3
0F1
10N
/4W
-10D
1-3
3D1
10N
/6W
-36D
311
N/2
E-26
R1
11N
/3E-
16R
1
11N
/3W
-7D
1-1
6D1
-28R
1-2
8R2
11N
/4W
-29R
1
-30N
111
N/5
E-16
J111
N/6
W-1
7L1
-31A
111
N/7
W-3
6B1
USG
S id
entif
icat
ion
no.
3455
5411
7090
901
3455
3911
7094
301
3455
4611
7104
601
3455
4211
7121
201
3454
4111
7080
801
3458
0211
6361
201
3456
3211
6362
701
3456
5911
6350
101
3456
0111
6352
101
3456
0011
6360
201
3458
5111
7172
901
3455
1611
7183
601
3455
1811
7280
601
3500
3611
6435
601
3502
1711
6393
301
3503
5811
7142
201
3503
0811
7121
901
3500
4411
7112
001
3500
3911
7112
101
3500
3911
7185
301
3500
5011
7204
901
3502
3011
6264
001
3502
5011
7320
601
3500
3611
7324
701
3500
3511
7341
001
Dat
e
3-24
-93
12-1
0-92
11-1
4-90
11-1
-90
3-18
-93
11-1
2-92
11-1
2-92
11-1
2-92
11-1
9-92
6-24
-93
11-1
7-92
11-2
2-92
11-2
2-92
11-2
3-92
11-2
1-92
11-1
5-92
11-1
9-92
11-1
9-92
1990
-94
dept
h to
w
ater
(ft
belo
w la
nd
surf
ace)
86.7
790
.05
92.4
667
.37
93.2
9
3.34
128.
5642
.4 23
6.53
269.
5524
1 91.1
373
.72
59.4
2 22
3.07
271.
0517
4.81
169.
66
Dat
e
4-30
-96
4-17
-96
5-16
-96
5-16
-96
4-30
-96
3-25
-96
3-25
-96
3-25
-96
3-25
-96
3-25
-96
5-13
-96
5-14
-96
4-18
-96
5-14
-96
4-24
-96
4-17
-96
4-17
-96
5-14
-96
4-11
-96
5-13
-96
3-25
-96
5-13
-96
4-18
-96
4-18
-96
1996
dep
th
to w
ater
(ft
belo
w la
nd
surf
ace)
9.43
97.1
891
.84
80.0
17.
6
62.1
11.
3712
7.86
42.1
217
.42
238.
6427
0.17
240.
955
.05
73.3
3
95.5
578
.54
63.5
117
4.57
222.
9320
0.45
270.
8820
1.86
169.
12
Diff
eren
ce
in d
epth
s to
wat
er
(ft)
-3.6
6-7
.13 .62
-12.
6422
.69
1.97 .7 .28
-2.1
1-.
62 .1 -4
.42
-4.8
2 -4
.09
.14
.17
-27.
05 .54
Alti
tude
of
wat
er
tabl
e (f
t ab
ove
sea
leve
l)2,
078
2,07
62,
077
2,09
62,
114
1,71
01,
709
1,60
21,
698
1,70
6
1,89
62,
009
2,47
91,
723
1,70
9
1,97
51,
998
2,00
91,
870
1,87
71,
438
2,28
52,
260
2,30
8
Alti
tude
of
land
sur
fa
ce (f
t ab
ove
sea
leve
l)2,
168
2,17
32,
169
2,17
62,
185
1,77
21,
710
1,73
01,
740
1,72
3
2,13
52,
279
2,72
01,
778
1,78
2
2,07
12,
077
2,07
42,
073
2,04
5
2,10
01,
639
2,55
62,
462
2,47
7
Met
hod
of
mea
sure
m
ent
V V S S V S V V V V S S V V V V V S V V S S V V
Dep
th
of w
ell
(ft)
200 130
217
250 363
329
454
109 126 105
223
361
500 618
258
330
Scre
ened
or
perf
orat
ed
Inte
rval
(ft
)
80-2
0038
-156
80-1
3075
-217
70-2
50
11-1
80 _
181^
54
298-
618
188-
258
260-
330
Wel
l not
es
R R
Oat
400
H
0 a
t 577
See
foot
note
at e
nd o
f tab
le.

Tab
le 1
. Wat
er-le
vel d
ata
and
wel
l-con
stru
ctio
n in
form
atio
n fo
r the
Moj
ave
Riv
er, t
he M
oron
go,
and
the
Fort
Irwin
gro
und-
wat
er b
asin
s, S
an B
erna
rdin
o C
ount
y,
Cal
iforn
ia C
ontin
ued
Stat
e w
ell n
o.
13N
/3E-
4C1
1-4
C2
1-4
C3
1^D
l1-4
D2
1
-4D
3*-4
K2
1^H
G1
-4K
41
-4Q
2
-5G
2
-10D
1 -1
0E1
1 -1
0E2
1
-10E
31
-23F
1-2
6N1
-34Q
1-3
5A1
14N
/3E
-14H
1
-22N
11
-22N
21
-22P
1-2
3G1
-24H
1
USG
S id
entif
icat
ion
no.
3515
1411
6401
401
3515
1411
6401
402
3515
1411
6401
403
3515
2311
6402
801
3515
2311
6402
802
3515
2311
6402
803
3514
4911
6400
501
3514
4911
6400
502
3514
4911
6400
503
3514
4111
6400
401
3515
0411
6405
501
3514
2211
6392
501
3514
1611
6392
201
3514
1611
6392
202
3514
1611
6392
203
3512
2611
6380
401
3511
0711
6382
701
3510
2011
6385
101
3510
5411
6373
601
3518
3011
6372
601
3517
1011
6392
701
3517
1011
6392
702
3517
1911
6390
301
3517
3811
6374
101
3517
4211
6362
401
Dat
e
2-15
-94
2-15
-94
2-15
-94
2-15
-94
2-15
-94
2-15
-94
H_3
0_94
11-3
0-94
11-3
0-94
11-2
-94
2-15
-94
4-1-
94
2-15
-94
2-15
-94
2-15
-94
7-22
-94
9-7-
969-
7-94
9-7-
949-
8-94
9-8-
949-
8-96
12-2
0-96
1990
-94
dept
h to
w
ater
(ft
belo
w la
nd
surf
ace)
118.
6311
8.56
118.
4414
3.64
143.
19
142.
894
.95
94.0
695
.33
76 187.
327
.86
34.8
9 32
.24
30.1
54.8
316
0.46
243.
6812
5.25
301.
53
190.
2314
7.23
172.
18
Dat
e
5-16
-96
5-16
-96
5-16
-96
6-12
-96
6-12
-96
6-12
-96
6-11
-96
6-11
-96
6-11
-96
5-15
-96
9-18
-96
5-15
-96
6-13
-96
6-13
-96
6-13
-96
9-18
-96
9-18
-96
9-18
-96
9-18
-96
9-18
-96
5-22
-96
5-22
-96
9-18
-96
9-18
-96
9-18
-96
1996
dep
th
to w
ater
(ft
belo
w la
nd
surf
ace)
115.
8211
5.52
115.
2314
1.32
140.
76
140.
3292
.37
91.9
293
.173
.7
187 25
.35
31.7
1 29
.88
28.4
5
54.8
216
3.35
245.
2912
1.42
297.
14
171.
54
191.
5114
9.57
178.
57
Diff
eren
ce
In d
epth
s to
wat
er
(ft)
2.81
3.04
3.21
2.32
2.43
2.48
2.58
2.14
2.23
2.3 .3 2.51
3.
18
2.36
1.
65 .01
-2.8
9-1
.61
3.83
4.39
-1.2
8-2
.34
-6.3
9
Alti
tude
of
wat
er
tabl
e (ft
ab
ove s
ea
leve
l)2,
284
2,28
42,
285
2,27
92,
279
2,28
02,
293
2,29
32,
292
2,31
1
2,27
32,
320
2,31
1 2,
313
2,31
4
2,13
52,
097
2,13
52,
069
2,12
3
2,24
8
2,23
82,
215
2,17
9
Alti
tude
of
land
sur
fa
ce (f
t ab
ove
sea
leve
l)2,
400
2,40
02,
400
2,42
02,
420
2,42
02,
385
2,38
52,
385
2,38
5
2,46
02,
345
2,34
3 2,
343
2,34
3
2,19
02,
260
2,38
02,
190
2,42
0
2,42
0 2,
420
2,43
02,
365
2,35
8
Met
hod
of
mea
sure
m
ent
V V V V V V V V V V V R
V
V
V V V V V V V
V V V V
Dep
th
of w
ell
(ft)
320
220
150
320
250
170
238
190
135 90 450 65
243
170 60 585 260
170
Scre
ened
or
perf
orat
ed
We|
|not
es
inte
rval
(ft
)
300-
320
200-
220
130-
150
300-
320
230-
250
150-
170
228-
238
170-
190
115-
135
85-9
0
210-
440
15-6
5 22
3-24
3 15
0-17
0 40
-60
95-5
75
240-
260
150-
170
D
See
foot
note
at e
nd o
f tab
le.

s Regional Water ' i » i & a i o § (Q 5 O IID JJ .1 5 O 1 T
l
i 3 O Q.
S 2* jo CD 0) (0 5' j« 0) 0) CD I 0) a. 5' 0 O o
Tab
le 1
. W
ater
-leve
l dat
a an
d w
ell-c
onst
ruct
ion
info
rmat
ion
for t
he M
ojav
e R
iver
, the
Mor
ongo
, and
the
Fort
Irwin
gro
und-
wat
er b
asin
s, S
an B
erna
rdin
o C
ount
y,
Cal
ifor
nia
Con
tinue
d
Stat
e w
ell n
o.
14N
/3E-
32B
11
-32B
21
-32B
31
-32F
21
-32F
31
-32J
1-3
2P2
1-3
2P3
1-3
2P4
1-3
2P5
1
-32P
61
-33E
21
-33E
31
-33J
1-3
3R1
14N
/4E-
18N
2
USG
S id
entif
icat
ion
no.
3516
1611
6410
701
3516
1611
6410
702
3516
1611
6410
703
3515
5811
6412
101
3515
5811
6412
102
3515
4711
6405
001
3515
2711
6412
501
3515
2711
6412
502
3515
2711
6412
503
3515
2711
6412
504
3515
2711
6412
505
3515
5611
6402
401
3515
5611
6402
402
3515
4911
6393
801
3515
3011
6394
401
3518
1111
6361
701
Dat
e
2-15
-94
2-15
-94
2-15
-94
11-3
0-94
11-3
0-94
12-2
0-94
9-7-
949-
7-94
9-7-
949-
7-94
9-7-
949-
7-94
9-7-
94 2-
15-9
4
9-7-
94
1990
-94
dept
h to
w
ater
(ft
belo
w la
nd
surf
ace)
262.
826
2.4
262.
725
3.14
253.
53
203.
4523
9.8
240.
8524
2.97
241.
25
240.
2814
9.2
149.
18 62
.9
217.
8
1996
dep
thD
ate
tow
ater
(ft
u e
belo
w la
ndsu
rfac
e)
5-21
-96
263.
025-
21-9
6 26
2.85
5-21
-96
262.
69-
18-9
6 25
2.55
9-18
-96
252.
84
9-18
-96
240.
089-
18-9
6 24
0.00
9-18
-96
241.
399-
18-9
6 24
1.37
9-18
-96
234.
139-
18-9
6 14
8.56
9-18
-96
148.
619-
18-9
6 85
.58
9-18
-96
59.1
3
9-18
-96
226.
08
Diff
eren
ce
in d
epth
s to
wat
er
(ft)
-0.2
2-.
45 .1 .59
.69
-.28 .8
51.
58-.
12 6.15 .6
4.5
7 3.
77
-8.2
8
Alti
tude
of
wat
er
tabl
e (f
t ab
ove
sea
leve
l)2,
267
2,26
72,
267
2,27
72,
277
2,25
72,
277
2,27
72,
277
2,27
6
2,28
32,
276
2,27
62,
304
2,32
0
2,15
4
Alti
tude
of
land
sur
fa
ce (f
t ab
ove
sea
leve
l)2,
530
2,53
02,
530
2,53
02,
530
2,46
02,
517
2,51
72,
517
2,51
7
2,51
72,
425
2,42
52,
389
2,37
9
2,38
0
Met
hod
of
mea
sure
m
ent
V V V V V V V V V V V V V V V V
Dep
th
of w
ell
(ft)
630
540
300
460
290
550
904
730
580
405
270
220
175
117
Scre
ened
or
perf
orat
ed
...
in
terv
al
Wel
lnot
es
(ft)
610-
630
520-
540
280-
300
440-
460
270-
290
200-
536
850-
870
710-
730
560-
580
385-
405
250-
270
200-
220
155-
175
Mul
tiple
-wel
l com
plet
ion
site
.