Embed Size (px)
Citation preview

Regionality and drivers of consumer liking: the case of
Australian Shiraz in the context of the Australian
domestic wine market.
Trent E. Johnson
A thesis submitted for the degree of Doctor of Philosophy
University of Adelaide
Faculty of Sciences
School of Agriculture, Food and Wine
Wine Science and Business Group
May 2013

ii
Thesis Summary Understanding the needs of consumers is a fundamental principle of marketing and Shiraz
is arguably the most important grape variety produced in Australia, as it is the variety
most widely associated, both domestically and globally, with Australia’s wine industry.
This three part project examined consumers in the Australian domestic wine market in
respect of their liking of Australian Shiraz and provided up to date market intelligence on
that market.
The first stage of the project consisted of a study that segmented the Australian domestic
market using a newly developed Fine Wine Instrument (FWI) that consisted of three
variables, as the base. This instrument identified three segments in the market which were
denoted: “Connoisseurs”; “Aspirants”; and “No Frills” wine consumers. The Connoisseur
segment consumed more wine, spent more money on wine and was more knowledgeable
about wine than the other segments identified in the market. The results demonstrated
that this segment of consumers was important to the Australian wine industry, as they
offered large potential lifetime earnings to the industry. This project also identified a
number of stable segments within that market and provided updated information on the
market.
The next stage introduced the Shiraz variety into the project and was motivated by Wine
Australia’s “Regional Heroes” brand segmentation. The aim of the project was to identify
those sensory attributes that might differentiate Shiraz wines from a number of delimited
Australian Shiraz producing regions. The study employed a number of wine experts to
undertake a sorting task, where wines that were perceived as similar by the experts were
sorted together in groups. If wines from a single region were perceived as similar, then

iii
they were sorted together. The data from this task identified three dimensions that
separated the wines and these dimensions generally represented sensory attributes
associated with Australian Shiraz. The wines also underwent sensory descriptive analysis
which confirmed that the wines occupied diverse sensory spaces. However, identifying
specific sensory attributes that differentiated wines from different regions was problematic
and we concluded that any future studies of this type should concentrate on a single wine
region, with a large cross section of wines from that region, rather than examining a
number of wines from many regions.
The last study combined elements of the previous two, where a diverse sub set of twelve
of those Shiraz wines was tasted by a cohort of Australian Shiraz wine consumers and the
consumers rated their acceptability, or liking, of each wine. Those consumers also
completed a questionnaire so that they might be segmented using the FWI developed in
the first study. The sensory data for each of the wines was married with the consumers’
acceptability data and the sensory attributes that drove the liking (and disliking) of the
wines were identified. A similar exercise was undertaken with a cohort of wine experts
and the results compared. The results demonstrated that as consumers’ wine knowledge
and wine involvement increased, their wine preferences mimicked those of the wine
experts and they preferred more elegant and complex wines. By comparison, the
consumers with lower levels of wine knowledge and involvement tended to prefer wines
that demonstrated more one dimensional fruit and oak characters. This technique of
marrying sensory with consumer data can be transferred to any wine style and identified
consumer segment.

iv
The project provides the wine industry with tools that might enable producers to better
identify and meet the needs of their consumers. This, in turn, might improve their
profitability and increase consumer satisfaction, both admirable goals.

v
Declaration
I declare that this thesis is a record of original work and contains no material which has
been accepted for the award of any other degree or diploma in any university or other
tertiary institution. To the best of my knowledge and belief, this thesis contains no
material previously published or written by another person, except where due reference
has been made in the text.
The manuscripts included in this thesis have not been previously submitted for the award
of any degree at the University of Adelaide or other University. I give consent to this
copy of my thesis when deposited in the University library, being made available for loan
and photocopying, subject to the provisions of the Copyright Act 1968. The author
acknowledges that copyright of work contained within this thesis that may be published
resides with the copyright holders of those works.
I also give permission for the digital version of my thesis to be made available on the web,
via the University’s digital research repository, the Library catalogue, the Australasian
Digital Thesis Program (ADTP) and also through web search engines, unless permission
has been granted by the University to restrict access for a period of time.
Trent Johnson
May 2013

vi
Panel of Supervisors Dr Sue Bastian, Principal Supervisor
School of Agriculture, Food and Wine
The University of Adelaide
Mr Brian Croser, AO, External Supervisor
Managing Director, Tapanappa Wines
Former Deputy Chancellor,
The University of Adelaide

vii
Acknowledgements This thesis is dedicated to my late father, John E Johnson. I hope I have made him proud.
This has been quite a journey and I have met a whole lot of people who have helped,
mentored and motivated me throughout it. If I have omitted anyone, it is not deliberate
and I apologise in advance.
Sandra, Anna, Amy, Crystal, Damo, Renata and Chris have all played a part along the
way and your support is much appreciated.
Many thanks to Brian Croser for his early input and impetus for the project and his
ongoing help during its duration and to Peter Dry for his input during the submission
stage.
Thanks to the University of Adelaide for their support via a scholarship and also to
Orlando for their support.
Thank you to Anne Hasted for her invaluable statistical advice.
To Karel and Barb who were always supportive and let me know that there was life
outside of study - like running, latterly riding, travelling and above all, friendship, fun,
food and wine!

viii
Through my training I met Cyd and Gary from Modesto in the US. Our friendship with
them has blossomed and we have now spent time in each others' homes. Now that the
journey has finished, I am confident that the friendship will not.
To Mum and Dad in the early stages and latterly Mum - thanks for all of your support and
love.
Last but certainly not least, I would like to thank two amazing women, without whom,
none of this would have happened. The first is my principal supervisor, Sue Bastian, but
she is far more than that. She is the person who first sowed the seed of a PhD in my mind
and then took on the responsibility of guiding me through the process. She has a wealth
of knowledge, is forever positive and kept me positive throughout the journey and I am
proud to call her a friend.
Finally I come to my wife, Brenda. I said a few years ago that she had put up with a lot
when I decided to take on post grad study at a time when she might have contemplated
slowing down herself. Ten years on and not much has changed - I studied and she was the
bread winner. Uncomplaining about working, always supporting, encouraging (and
occasionally cajoling), she has been my strength, my rock and my love. I couldn't have
done it without her.

ix
Table of Contents Thesis Summary............................................................................................................ ii Declaration ..................................................................................................................... v Panel of Supervisors .................................................................................................... vi Acknowledgements ..................................................................................................... vii Table of Contents ......................................................................................................... ix Table of Tables ............................................................................................................ xii Table of Figures.......................................................................................................... xiv 1 Introduction............................................................................................................. 1
1.1 Background to the research ................................................................................ 1 1.2 Research problem .............................................................................................. 3 1.3 Justification of the research................................................................................ 6 1.4 Methodology...................................................................................................... 7 1.5 Outline of this report .......................................................................................... 9 1.6 Delimitations of scope and key assumptions .................................................... 11 1.7 Conclusion....................................................................................................... 11
2 Literature Review ..................................................................................................... 12 2.1 The Market Segmentation Concept .................................................................. 12
2.1.1 Wine Market Segmentation Studies of the Australian Domestic wine market ................................................................................................................. 20 2.1.2 Other wine market segmentation studies ................................................... 25
2.2 Fine Wine Consumers .......................................................................................... 29 2.2.1 How to measure fine wine consumer behaviour ........................................ 32
2.3 Knowledge as a construct................................................................................. 34 2.3.1 Objective Wine Knowledge ...................................................................... 35 2.3.2 Subjective Wine Knowledge ..................................................................... 37 2.3.3 Australian Wine Knowledge Studies......................................................... 40
2.4 Involvement as a Construct .............................................................................. 41 2.4.1 Levels of Involvement .............................................................................. 42 2.4.2 Measuring Involvement ............................................................................ 43 2.4.3 Involvement and Wine .............................................................................. 43
2.5 Sorting Tasks and Multidimensional scaling (MDS) ........................................ 47 2.6 The use of wine experts in wine related research.............................................. 49 2.7 Descriptive Analysis ........................................................................................ 51
2.7.1 Descriptive Analysis – A Brief History ..................................................... 51 2.7.2 Quantitative Descriptive Analysis (QDA) ................................................. 54 2.7.3 Descriptive Analysis and Wine ................................................................. 56
2.8 Wine consumers and wine research.................................................................. 59 2.8.1 Preference Mapping.................................................................................. 59 2.8.2 Preference Mapping and wine ................................................................... 62
2.9 The project's objectives................................................................................. 64 2.10 Literature Review Summary ......................................................................... 66
Chapter 3. Identification of Australian fine wine consumers and comparisons of their wine related behaviour with other segments in the domestic wine market. .. 69
3.1 Introduction ..................................................................................................... 73 3.2 Materials and Methods..................................................................................... 75
3.2.1 The data collection questionnaire .............................................................. 77 3.2.2 Statistical analyses .................................................................................... 79

x
3.3 Results............................................................................................................. 80 3.3.1 Demographic Data .................................................................................... 80 3.3.2 Wine purchase and consumption information............................................ 82 3.3.3 Wine purchase and consumption information by gender............................ 83 3.3.4 Wine purchase and consumption information by fine wine consumer segment .................................................................................................... 85 3.3.5 Fine Wine Consumer Segments ................................................................ 97 3.3.6 The economic importance of each segment ............................................... 99 3.3.7 Correlations between the six wine scale values ....................................... 100
3.4 Discussion ..................................................................................................... 101 3.4.1 Fine Wine Consumers............................................................................. 101 3.4.2 Purchase channels in the Australian domestic wine market ..................... 105 3.4.3 The structure of the Australian domestic wine market ............................. 108
3.5 Study limitations............................................................................................ 109 3.6 Conclusion..................................................................................................... 110 3.7 Acknowledgements........................................................................................ 111
Chapter 4 Multidimensional scaling (MDS), cluster and descriptive analyses provide preliminary insights into Australian Shiraz wine regional characteristics. .... ............................................................................................................... 112
4.1 Introduction ................................................................................................... 117 4.1.1 Wine regionality and typicality ............................................................... 118 4.1.2 The use of expert panellists ..................................................................... 119 4.1.3 Sorting Tasks and Multidimensional scaling (MDS) ............................... 120 4.1.4 Study Purpose ......................................................................................... 121
4.2 Materials and Methods................................................................................... 122 4.2.1 Wines ..................................................................................................... 122 4.2.2 Expert Panellists ..................................................................................... 124 4.2.3 Sorting tasks ........................................................................................... 125 4.2.4 Descriptive analysis of 29 Shiraz wines .................................................. 127 4.2.5 Statistical analyses .................................................................................. 131
4.3 Results........................................................................................................... 131 4.3.1 Chemical composition of the wines......................................................... 131 4.3.2 Experts’ Hedonic (Liking) and Technical Quality Ratings....................... 133 4.3.3 MDS Analysis ........................................................................................ 134 4.3.4 Drivers of the experts’ liking and technical quality scores ....................... 140 4.3.5 Descriptive Analysis (DA) and principal component analysis of the 29 ........ Shiraz wines ........................................................................................... 141
4.4 Discussion ..................................................................................................... 147 4.4.1 The drivers of the experts’ liking and technical quality scores................. 147 4.4.2 Sorting task analysis ............................................................................... 149 4.4.3 DA panel data ......................................................................................... 150 4.4.4 Can a true Australian regional Shiraz character be determined? .............. 151 4.4.5 Study Limitations.................................................................................... 153
4.5 Conclusion..................................................................................................... 154 4.6 Acknowledgements........................................................................................ 154
Chapter 5 The sensory drivers of Australian consumers’ liking of Australian Shiraz ............................................................................................................... 156
5.1 Introduction ................................................................................................... 160 5.2 Materials and Methods................................................................................... 163
5.2.1 Wines and chemical analysis................................................................... 163

xi
5.2.2 Wine Experts .......................................................................................... 165 5.2.3 Consumers and consumer wine tasting.................................................... 165 5.2.4 Descriptive analysis of 12 Shiraz wines .................................................. 167 5.2.5 Statistical analyses .................................................................................. 171
5.3 Results........................................................................................................... 172 5.3.1 Chemical composition of the wines......................................................... 172 5.3.2 Wine consumer demographics and wine behaviour ................................. 174 5.3.3 Expert hedonic (Liking) rating of the 12 wines........................................ 177 5.3.4 Consumer hedonic rating of the 12 wines................................................ 178 5.3.5 Cluster analysis of the consumers’ hedonic scores................................... 181 5.3.6 Descriptive Analysis (DA) and principal component analysis (PCA) of the 12 Shiraz wines....................................................................................... 185 5.3.7 Internal preference mapping.................................................................... 187 5.3.8 Partial least squares (PLS) regression analysis ........................................ 188
5.4 Discussion ..................................................................................................... 193 5.4.1 Was the sample representative of Australian Shiraz wine consumers?..... 193 5.4.2 Consumers’ hedonic scores and the price relationship ............................. 194 5.4.3 The drivers of consumer liking of Australian Shiraz................................ 195 5.4.4 The drivers of liking of Australian Shiraz of the Connoisseur and No Frills' consumer segments ................................................................................. 198 5.4.5 Implications for the Australian wine industry.......................................... 200 5.4.6 The relationship between consumers’ and experts’ wine liking scores..... 201
5.5 Study limitations............................................................................................ 203 5.6 Conclusion..................................................................................................... 203 5.7 Acknowledgements........................................................................................ 204
Chapter 6 Conclusion ............................................................................................ 206 6.1 Stage 1: Identification of Australian fine wine consumers and comparisons of their wine related behaviour with other segments in the domestic wine market. ....... 207 6.2 Stage 2: Multidimensional scaling (MDS), cluster and descriptive analyses provide preliminary insights into Australian Shiraz wine regional characteristics. ... 212 6.3 Stage 3: The sensory drivers of Australian consumers’ liking of Australian Shiraz 215
Reference List............................................................................................................ 219 Appendix 1 Details of the FWI ............................................................................. 265 Appendix 2 Exploratory Factor Analysis data of the FWI. ................................ 267 Appendix 3 CFA Data for the three FWI variables ............................................ 274 Appendix 4 Chapter 4 as published in Food, Quality and Preference ............. 280 Appendix 5 Statement of the contributions of jointly authored papers ............ 293

xii
Table of Tables Table 2.1 Classification of Segmentation Bases 16
Table 2.2 Classification of methods used for Segmentation 18
Table 2.3 McKinna’s 1986 Australian wine consumer segments 22
Table 2.4 Comparison of Australian Wine Market Segmentation Studies 24 Table 2.5 QDA – Advantages and Disadvantages 54 Table 2.6 A non-exhaustive list of Descriptive Analysis and Wine studies 56 Table 2.7 Comparison of Internal and External Preference Mapping. 61 Table 3.1 Confirmatory Factor Analysis data for the three factors
suggested by EFA. 77
Table 3.2 Demographic data of the survey’s respondents (n = 1017 respondents)
80
Table 3.3 Wine consumption and purchase data of the respondents 82 Table 3.4 Selected wine consumption and purchase data of the respondents
sorted by gender 84
Table 3.5 Percentage of wine purchases made in the HORECA category, by gender and age group.
85
Table 3.6 Cluster Centroids following AHC 86 Table 3.7 Demographic data of the three fine wine segments. Data are
percentages. 87
Table 3.8 Objective and subjective wine knowledge, wine involvement scores and other relevant data calculated for each fine wine consumer segment (standard deviations are in parentheses).
89
Table 3.9 Alcoholic beverages and wine styles consumed by fine wine consumer segments. Data are percentages.
90
Table 3.10 Purchase driver responses by fine wine segment. 94
Table 3.11 Correlation matrix of the wine related scales/variables 101
Table 4.1 Geographical Indication, vintage and expert score details of the 29 wines used in the study.
123
Table 4.2 Colour, aroma and palate vocabulary generated by the DA panel, with agreed definitions and reference standards of the significant attributes.
129
Table 4.3 Cluster analysis results of the 27 wines based on the sorting task and DA panel consensus data.
138
Table 4.4 One way ANOVA of the DA sensory data with the regions as the source of variation
146
Table 5.1 Details of the 12 Shiraz wines used in the consumer tasting. 164 Table 5.2 Colour, aroma and palate attribute vocabulary with agreed
definitions and reference standards of the 17 attributes that significantly differentiated the wines, as generated by the DA panel.
169
Table 5.3 Chemical composition data of the 12 Shiraz wines tasted by the consumers. Standard deviations are in parentheses.
173
Table 5. 4 Australian Shiraz Wine Consumer Demographics 174 Table 5.5 Pearson correlation coefficients of the three wine related scales
administered to the consumers. 176

xiii
Table 5.6 Mean Shiraz wine liking scores of the various knowledge, involvement and fine wine segments.
179
Table 5.7 Pearson correlation coefficients of the wine experts’ and the three objective wine knowledge segments’ and three fine wine segments’ mean liking scores.
181
Table 5.8 Mean liking score for each Shiraz wine by cluster as determined by cluster analysis of the consumer liking scores. Numbers in parentheses indicate the percentage of consumers per cluster.
183

xiv
Table of Figures Figure 2.1 Example of a Category Scale used in FP 53 Figure 2.2 Project Schematic 65 Figure 3.1 Average price points spent on a bottle of wine, by fine wine
consumer segments. 92
Figure 3.2 Wine purchases within the HORECA channel by respondent gender, age and fine wine segment level. Values with different superscripts are significantly different (t – Test, p < 0.05).
93
Figure 3.3 PCA plot of variables used to characterise the three segments with the segments' bi plots projected.
96
Figure 3.4 Comparison of each segments' relative size and percentage of wine spend.
100
Figure 4.1 PCA plot of the 29 wine's chemical data with wine bi - plot scores also projected.
133
Figure 4.2 Three dimensional MDS solution of the 29 sorted wines (A = dimensions 1 and 2 – Blackberry, plum, pepper and spice; and Herbal, vanilla, cedar and berry jam; B = dimensions 1 and 3 – Blackberry, plum, pepper and spice; and Earthy, savoury, dusty and meaty). Clusters identified by AHC (Table 3A) are circled and labelled C 1-C5.
136
Figure 4.3 PCA plot of MDS solution, experts’ quality and hedonic scores, wine MJT and RRP data with wine bi-plot scores for PC also projected. Chemical data are superimposed as supplementary variables.
139
Figure 4.4 PLS regression coefficients of the 29 wines with the RRP, MJT and MDS solution data as the X variables and the experts’ liking and quality scores as the Y variables.
141
Figure 4.5 PCA plot of DA and MDS data with wine bi - plot scores projected.
143
Figure 4.6 Bi - plot of the wines' DA data with clusters identified by AHC (Table 3B) circled and labelled DA CX
145
Figure 5.1 Shiraz wine preference segmentation of the 179 consumers. The aggregated consumer results are shown on the right and the results of the 4 clusters are shown on the left.
184
Figure 5.2 Vector plot of the significant attributes identified by the DA panel, with the bi-plot of the 12 wines overlaid.
186
Figure 5.3 Internal preference map of the 12 Shiraz wines. 188 Figure 5.4 PLS regression coefficients of the 12 wines scored by the overall
consumer cohort, the four identified clusters and the wine experts (A) and the three fine wine segments (B) (Y variables). The sensory attributes described by the DA panel were the X variables.
190

1
1 Introduction
1.1 Background to the research
Wine “Brand Australia” achieved considerable success in export markets in the
twenty years from the mid 1980s, built mainly on the back of sales of easy drinking,
cheaper, commercial wines and in later years, the so called “critter brands” (Johnson
& Bruwer 2003, Grossman 2006, WFA, AWBC 2007, Durrieu 2008). However, those
historical feats do not guarantee future success and the Australian wine industry is
currently experiencing a period of immense challenge. These and other challenges are
recognised in “Wine Australia: Directions to 2025”, a joint publication of the
Winemakers’ Federation of Australia and the Australian Wine and Brandy
Corporation (2007). Importantly, that document recognised the perceived
stereotyping of all Australian wine as commodity wine and introduced a four level
segmentation strategy that aimed to capture the personalities of all Australian wines.
The document specifically acknowledged that the Australian wine industry must be
recognised around the globe as a producer of regionally distinct fine wines and the
four level segmentation strategy had a specific aim to encourage consumers to “trade
up” to higher quality Australian wine (WFA, AWBC 2007: 13 - 14).
Although the main focus of the strategic plan is on export, that document and other
comments by wine industry analysts have specifically highlighted the importance of
the Australian domestic market over the next decade (WFA et al. 2009, Jones 2010).
One group of consumers in the Australian market who have already traded up are fine
wine consumers. Although the definition of a fine wine consumer may be self

2
evident, there is no discussion or definition of these consumers in the academic
literature. Whilst the literature makes many references to fine wine consumers or
wine connoisseurs, it does not reveal any detailed examination of the wine related
behaviours of these wine consumers. Without a clear identification of this consumer
segment, no meaningful comparisons can be made with other segment’s behaviours,
as there is no way of knowing whether a like for like analysis was made. Australian
wine industry leader Brian Croser (2005) stated that Australians are the major
consumers of Australian fine wine. Therefore, understanding the wine behavioural
characteristics of the identified fine wine consumer segment of the Australian wine
market would be of benefit to the industry. The concept of fine wine consumers in the
Australian domestic market is not new. In the earliest segmentation study of the
Australian market, McKinna (1986) identified one segment as" Connoisseurs", who
were knowledgeable about wine and used that knowledge to experiment in their wine
purchase and consumption decisions. In the present day market, it is logical to assume
that these connoisseur type consumers are likely to be highly involved in wine and
also have a high level of wine expertise (Vigneron and Johnson 1999). The
development of an instrument to identify these consumers would have academic merit
as novel segmentation base and by better understanding this potentially lucrative
consumer segment, the wine industry would acquire consumer relevant information to
allow it to make fact-based decisions and give their products a competitive edge.
The four level segmentation strategy mentioned above introduced the "Regional
Heroes" segment (WFA, AWBC 2007) that encouraged consumers to associate
particular wine styles of grape varieties with particular wine producing regions, with
each wine style or variety having their own unique sensory properties that reflected

3
their region of origin. Shiraz is the most widely planted red grape variety grown in
Australia (ABS 2010) and at a global level, Australia is most closely associated with
fruit forward, easy drinking wines made from the Shiraz grape (DFAT 2009), although
there is evidence that Shiraz wines such as Penfolds Grange and Henschke Hill of
Grace are recognised world wide as two of the finest examples of the variety
(Beverland 2004, Fogarty 2006, Wood et al. 2008). The identification of any sensory
attributes that define the regional characteristics of Australian Shiraz would be of
importance to the industry. Further, to identify those sensory attributes that drive the
liking of Australian Shiraz of those fine wine consumers would provide a more
detailed picture of those consumers and also provide the industry with the means to
specifically target those consumers with wines that might increase profit margins.
1.2 Research problem
The research problem was:
Who are the fine wine consumers in the Australian domestic wine market, how do
their wine purchase and consumption behaviours differ from other wine consumers
and what are the sensory attributes that drive their liking of Australian Shiraz?
The scope of the research problem included the Australian domestic wine market and
the nomination and examination of Shiraz wines from ten Australian Shiraz producing
regions. The aim was to identify any sensory attributes that differentiate Shiraz wines
from different Australian Shiraz producing regions and whether any of those sensory
attributes might be attributable to regional influences.

4
The research problem was solved in the following manner. An instrument (Fine Wine
Instrument = FWI) was developed to identify fine wine consumers in the Australian
domestic wine market and that instrument was used as a base to segment the market.
The various wine related behaviours of the fine wine segments were compared and
contrasted. This was followed by a preliminary examination of Shiraz wines produced
from ten de-limited Australian Shiraz producing regions, with a particular emphasis on
identifying any sensory attributes that might be considered regionally specific. This
also identified a number of sensory attributes that distinguish those wines from one
another. These sensory attributes were used in the last part of the project, where a sub
set of those wines were tasted by wine consumers and their acceptability of those
wines was measured. The fine wine consumer segments (and identified hedonic
segments) were analysed and the sensory attributes that drive their liking (or disliking)
of the wines identified. These attributes might provide some direction to wine
producers who choose to target specific segments of the Australian wine market.
The various constructs, concepts, sensory and statistical techniques employed in the
research project are examined in detail in Chapter 2.
The following hypotheses relate to the research problem:
H1: The Fine Wine Instrument (FWI) is a suitable base to segment the Australian
domestic wine market.

5
H2: Wine consumers identified as belonging to the Connoisseurs segment will have
significantly higher scores on all three components of the FWI than consumers
in other segments.
H3: Wine consumers identified as belonging to the Connoisseurs segment have
significantly higher wine knowledge and wine involvement scores compared to
consumers in other segments.
H4: The segment of consumers identified as Connoisseurs will display different
wine purchase and consumption behaviour compared to consumers in other
segments. In particular, they will:
(a) spend significantly more money on wine: and
(b) consume significantly more wine than the consumers in the other identified
segments.
H5: Australian shiraz wines originating from the same delimited wine producing
region will share similar sensory characteristics.
H6: The preferences for Australian Shiraz wines of hedonic segments are
determined by different sensory attributes.
H7: The sensory attributes that drive the identified Connoisseur FWI consumer
segment's liking of Australian Shiraz are of a more complex nature than those
of the other FWI segments.

6
H8: Wine experts can be used to predict the acceptance of wines of more wine
knowledgeable consumers.
1.3 Justification of the research
Fine wine consumers are often mentioned in both the academic and popular press, but
to date, no research has been undertaken to identify the characteristics of these
consumers, beyond the stereotypical view of a wine connoisseur being middle aged
and male. The development of an instrument to identify and examine these
consumers' wine purchase and consumption behaviours would therefore hold
considerable academic merit as a novel segmentation base of the Australian domestic
wine market.
From a practical point of view, the outcomes of the research should provide the wine
industry with relevant data in relation to these identified wine consumer segments.
Understanding their wine purchase and consumption behaviours should allow the
development of targeted marketing communications. The identification of sensory
attributes that drive a segment's liking of Australian Shiraz should provide the industry
with the knowledge to produce Shiraz wines that interest the identified segment. Both
these initiatives could provide wine producers with an increased profit margin and
hence the project has considerable managerial implications and potential benefits.

7
1.4 Methodology
The project consists of three parts which are described in more detail in the paragraphs
that follow.
An instrument to measure the fine wine behaviour of respondents (Fine Wine
Instrument (FWI)), was tested and developed iteratively and included in an internet
based survey offered in all States of Australia. A market research firm was employed
to ensure some stratification of responses and social media was employed to also
garner responses. Exploratory factor analysis followed by confirmatory factor
analysis revealed the uni - dimensionality of each component of the FWI and
Cronbach Alpha indicated that the scale was internally reliable. Cluster and
discriminant analysis was used to segment the respondents using the FWI scores as the
segmentation base. T-tests, ANOVAs and frequency tables were used to examine the
differences in wine related behaviours between the identified consumer segments.
For the second part of the project, a cohort of wine experts was used to assess a
selection of Shiraz wines. These wines were sourced from 10 delimited Australian
Shiraz producing regions, some multi regional blended Shiraz wines and from an
international wine region. The experts were required to sort wines together that they
considered similar in their ortho and retronasal properties and also provide hedonic
and quality scores for each of the wines. Contemporaneously, a Descriptive Analysis
(DA) panel convened to quantify the sensory attributes of each wine. The expert

8
panel data were initially analysed using Multidimensional scaling (MDS) and cluster
analysis to identify those wines that were considered similar in aroma and flavour and
to see whether wines from the same geographical region were considered similar.
Finally, the experts' quality and hedonic data were subjected to one way ANOVA to
ascertain whether any wines were considered significantly better quality or were
significantly more liked than other wines. The DA panel data were initially analysed
using a mixed model two-way ANOVA with assessors as random and samples as
fixed factor effects to ascertain which of the sensory attributes significantly
differentiated the wines, followed by Principal Component Analysis (PCA) to provide
an accurate picture of the sensory attributes that contributed to the aroma and flavour
profiles of each wines. Finally, this DA data were subjected to cluster analysis to see
whether any wines from the same region were grouped together, as a counterpoint to
the expert panel data.
The final part of the project saw a cross section of twelve wines that were analysed in
the previous section, that had different sensory profiles and a range of expert hedonic
scores, presented to two cohorts of wine consumers who had previously completed the
internet based survey which allowed segmentation of the consumers based on their
FWI scores. The consumers that indicated their willingness to be involved in a wine
tasting were invited to tastings in Adelaide or Melbourne (Australia) during which
they indicated their liking of each wine on 9-point Likert scale.. Each consumer tasted
2 brackets of six wines and indicated their liking of each wine by placing a mark on a
categorical 9 point scale which had three word anchors from left to right reading;
“dislike extremely”, “neither like nor dislike” and “like extremely” The hedonic
scores were married to the DA data to identify the sensory attributes that contributed

9
to each segments' liking (and disliking) of the wines. In the first instance, the
consumers' overall hedonic scores were analysed by one way ANOVA to see if one
wine was preferred over another. Cluster analysis of the consumer hedonic scores
revealed four distinct hedonic segments and those segments, along with the FWI
segments were subjected to both internal preference mapping and partial least squares
regression to identify the sensory attributes that drove the various segments' liking of
the Shiraz wines.
1.5 Outline of this report
The thesis consists of six chapters, described in more detail below.
Chapter 1 - Introduction
This chapter provides an introduction to the thesis, including the project background,
the research problem, methodology and research limitations.
Chapter 2 - Literature Review
The literature review examines the relevant literature and identifies gaps in the extant
knowledge. It also explores the various techniques used to complete the project.
Chapter 3 - Identification of Australian fine wine consumers and comparisons of
their wine related behaviour with other segments in the domestic wine market.
This chapter is concerned with the development and implementation of the FWI and
subsequent segmentation of the Australian domestic wine market using that instrument
as a novel segmentation base. A discussion on the wine related behaviours of the
identified segments follows.

10
Chapter 4 - Multidimensional scaling (MDS), cluster and descriptive analyses
provide preliminary insights into Australian Shiraz wine regional characteristics.
This chapter describes the expert panel ortho and retro nasal assessments of Shiraz
wines and the subsequent analysis of that data. The DA of the wines is outlined in
detail and the results discussed. A number of sensory attributes that differentiate
Shiraz wines from 10 delimited Australian Shiraz producing regions are identified and
an attempt made to quantify the sensory attributes of those regions. The chapter
concludes that although there are some generic attributes that might be attached to
each region, a more sensible approach would be to examine each region individually
and try to identify any intra regional sensory differences.
Chapter 5 - The sensory drivers of Australian consumers’ liking of Australian
Shiraz
This chapter explores the various sensory attributes that drive the liking of Australian
Shiraz of a number of identified segments in the Australian domestic wine market. In
particular, these segments are of both a hedonic nature and based on their responses to
the FWI. The drivers of experts' liking are also compared to those of the consumers
and the conclusion reached that wine experts could be used to predict consumer
acceptance in some circumstances.
Chapter 6 - Conclusion
The final chapter draws together the conclusions of the previous three chapters,
examines the hypotheses relevant to each section of the project and highlights both the

11
academic and managerial implications of the research. Limitations in the research and
future research possibilities are discussed.
1.6 Delimitations of scope and key assumptions
The segmentation of the Australian domestic wine market using the FWI as a base was
limited to those respondents over the age of 18 who live in Australia and had
consumed wine in the four weeks prior to completing the survey.
The examination of Australian Shiraz provided a number of limitations. The first was
the choice of the ten Australian de - limited wine producing regions to include in the
study and the second was the choice of wines from each of those regions. These
decisions were both guided by wine expert input.
The consumer wine study was limited to Australian residents over the age of 18 years
who like Shiraz wines and had consumed the same within four weeks of completing
the study.
1.7 Conclusion
This chapter laid the foundations for the thesis. The background to the research was
presented and the research problem and hypotheses stated. The research was justified
and a brief overview of the research methodology was presented along with the
limitations of the research. The thesis was also outlined. With this detail in place, the
remaining chapters of the thesis provide a detailed description of the research.

12
2 Literature Review
This Literature Review follows the three major components of the research project.
The first section provides a brief history of the market segmentation concept and
examines various wine market segmentation studies. The related concepts of fine
wine, fine wine consumers and wine connoisseurs then follow. As one of the project’s
hypotheses was that fine wine consumers are wine knowledgeable and wine involved,
these two concepts are then covered.
Sorting tasks performed by a cohort of wine experts and Descriptive Analysis (DA)
undertaken by a trained panel were the major techniques employed in the second part
of the project. A number of multivariate statistical analyses were used to marry the
experts’ data with that generated by the DA panel and these techniques are examined
in some detail. As wine experts were used to inform the project on a number of
matters, including wine quality, the review examines the use of experts in wine related
research.
The last section details some of the consumer research undertaken with wine and
highlights the techniques used to determine the sensory attributes that drive
consumer’s liking (and disliking) of wines.
2.1 The Market Segmentation Concept
The mid twentieth century saw a major change in which companies sought a
competitive advantage. The primary focus until then was on reducing production

13
costs and offering ever cheaper products to customers (Wedel & Kamakura 2000).
However, enlightened firms realised that understanding and meeting customer needs
was a powerful business tool. This approach became known as a marketing
orientation. Various definitions of marketing orientation have been suggested in the
literature. For example, Narver and Slater (1990: 22) suggest “…an organizational
culture that most effectively and efficiently creates the necessary behaviours for the
creation of superior value for buyers and, thus, continuous superior performance for
the business”. In further research they stated that … “a market orientation is valuable
because it focuses the organization on (i) continuously collecting information about
target customers’ needs and competitors’ capabilities, and (ii) using this information to
create continuously superior customer value.” (Slater & Narver, 1995: 63). Another
view is that of Jaworski and Kohli (1993: 53) who proposed that a marketing
orientation consisted of three components: “(i) organization wide generation of market
intelligence pertaining to current and future customer needs, (ii) dissemination of the
intelligence across departments, and (iii) organization wide responsiveness to it”.
The common themes that emerged from these various views are that any organisation
that has adopted a marketing orientation has a customer and competitor focus,
undertakes intelligence gathering about its markets, consumers and competitors and
then creatively uses that intelligence to remain ahead of its competitors. This ensures
that the organisation is quick to react to consumer needs and wants, provides its goods
and services in a timely and efficient manner and ultimately provides shareholders
with greater returns on their investments.

14
Therefore, the key to understanding any market lies with the intangibles inherent in
consumer demand and consumer behaviour. The social changes of the mid twentieth
century fragmented the consumer market so that mass marketing techniques were
often redundant. Smith (1956) was the first to introduce the concept of market
segmentation. He recognised that these fragmented markets were not heterogeneous,
but within each market exist groups or segments of consumers with similar or
homogenous needs who would react in similar ways to a firm's marketing efforts. In
his words, products would ... "find their markets of maximum potential as a result of
recognition of differences in the requirements of market segments" (Smith 1956:7).
Market segmentation could then be seen as the ... "process of subdividing a market
into distinct subsets of consumers that behave in the same way or have similar needs.
Each subset may conceivably be chosen a market target to be reached with a
distinctive marketing strategy" (Bennett 1995: 165 - 166), where each segment is
..."an aggregation of customers and prospects sharing a common set of needs different
from the needs of other segments" (Bonoma & Shapiro 1984: 258).
However, merely identifying a market segment is no guarantee that the segment will
be effective. Researchers have identified a number of characteristics that market
segments should possess to be both effective and profitable. These are: identifiability,
substantiality, accessibility, responsiveness, stability and actionable. Each is briefly
discussed below.
• Identifiability - can managers identify distinct segments in the market using
appropriate measurement tools?
• Substantiality - is the target segment large enough to justify managers spending
time and effort on it?

15
• Accessibility - are managers able to reach the target segments through their
marketing mix?
• Responsiveness - do segments respond uniquely to their individual marketing
mixes?
• Stability - are the segments stable over a period of time so that managers see a
return on their investment in them?
• Actionable - are managers able to use the information to derive marketing mixes
for each identified segment that are consistent with the objectives and
competencies of the firm? (Wedel & Kamakura 2000, Kotler et al. 2010).
It is clear from the previous discussion the crucial role that managers play in the
identification and any subsequent action taken on target segments. These segments
may not be tangible, but artificially derived entities constructed by managers to better
meet their firm's objectives. This phenomenon was recognised by Smith (1956) in his
seminal work (Wedel & Kamakura 2000).
Wedel and Kamakura (2000) state that Frank et al.'s (1972) book, “Market
Segmentation”, was the first to identify the two major elements of segmentation
research - segmentation bases and segmentation methods. The manager's choice of
segmentation base and method is critical in determining the number and
characteristics of the resulting segments and that choice is dictated by the firm's
objectives in segmenting the market, the type of market in which the firm operates and
those choices are not independent of each other (Wind 1978, Bonoma & Shapiro
1984, Wedel & Kamakura 2000).

16
Segmentation bases are ... "sets of characteristics that are used to assign customers to
segments" (Steenkamp & Ter Hofstede 2002: 196) and can be considered the
dependent variable (Wind 1978) . Frank et al. (1972) suggested the following
classification of segmentation bases.
Table 2.1 Classification of Segmentation Bases
General Product Specific
Observable Cultural, geographic,
demographic and socio
economic variables
User status, usage
frequency, store loyalty
and patronage, situations
Unobservable Psychographics, values,
personality and lifestyles
Psychographics, benefits,
perceptions, elasticities,
attributes, preferences,
intention
Source: Wedel & Kamakura 2000
General refers to bases that are independent of the product or service and product
specific variables relate directly to the product or the customer. Segmentation bases
may also be observable, where they are measured directly, or unobservable where they
will be inferred (Wedel & Kamakura 2000). Although not mentioned in the table,
these segmentation bases may also be classified as either macro or micro level
indicators (Foedermayr & Diamantopoulos 2008b), however, macro level indicators

17
are rarely used with consumer markets because they provide country level data
(Steenkamp & Ter Hofstede 2002). On the other hand, micro level indicators are
frequently used at the individual customer level (Bonoma & Shapiro 1984,
Foedermayr & Diamantopoulos 2008b).
Data for general observable bases are relatively easy to access as much are in the
public domain. These tend to be more simple segmentation studies and are often used
in conjunction with other segmentation bases. The observable, product specific bases
relate to purchase and consumption behaviours and are suitable for both consumer and
business markets. This base best meets the substantiality criterion for effective market
segmentation (Wedel & Kamakura 2000). Unobservable general bases are used
primarily in consumer markets and provide a deeper understanding of consumer
motivations towards a product category as opposed to a single brand (Frank 1972,
Plummer 1974, Wind 1978, Gunter & Furnham 1992, Wedel & Kamakura 2000).
Unobservable product specific bases include variables such as product specific
psychographics, benefit perceptions and buying intentions. This class of base is
generally the most effective for market segmentation (Wedel & Kamakura 2000).
However, each base has its strengths and weaknesses and recent practices suggest that
a hybrid or combination of bases be used to meet management's objectives (Wind
1978, Gunter & Furnham 1992, Wedel & Kamakura 2000).
The second major element identified by Frank et al. (1972) was segmentation methods
and they are detailed in Table 2.2 .

18
Table 2.2 Classification of methods used for Segmentation
A priori Post hoc
Descriptive Contingency tables, Log -
liner tables
Clustering methods:
nonoverlapping,
overlapping, fuzzy
techniques, ANN1, mixture
models
Predictive Cross - tabulation,
regression, logit and
discrimination analysis
AID2, CART3, clusterwise
regression, ANN, mixture
models
Source: Wedel & Kamakura 2000
In this classification, a priori indicates that the number of segments was determined in
advance of the research and post hoc indicates that the number and type of segments
are dependent on the data analyses (Green 1977, Wind 1978). Descriptive and
predictive methods differ in that predictive methods have a set of dependent variables
explained by independent variables and descriptive methods make no distinction
between the two (Wedel & Kamakura 2000).
A priori descriptive methods have a pre - determined number and type of segments
with some common examples being usage situation or consumption frequency of a
product. This method is not considered particularly effective but is useful for
1 Artificial Neural Network 2 Automatic Interaction Detection 3 Classification and Regression Trees

19
obtaining an overview of segments and their associations with other segmentation
bases (Wedel & Kamakura 2000). This method is also used in so called hybrid
models with a priori segments identified and then post hoc procedures applied to the
resultant segments (Green 1977).
Post hoc descriptive methods identify segments following data analysis, with
clustering techniques and latent class analysis the most popular methods employed. If,
for example, psychographic data about consumes were captured, the identified
segments would each have similar attitudes, interests and opinions. These methods
are generally considered useful tools for market segmentation and are frequently used
(Wedel & Kamakura 2000).
A priori predictive methods define segments on one set of criteria and then use
predictive models to describe the relationship between segment membership and a set
of independent variables (Wedel & Kamakura 2000). Wilkie and Cohen (1977)
suggested two types of approaches: forward and backward. These methods both
employ a two stage approach where a priori segments are identified and then
described by a set of independent variables. The weakness in this method is often the
a priori stage of the exercise (Wedel & Kamakura 2000).
Mixture, mixture regression, mixture MDS and conjoint analyses are amongst the
most important post hoc predictive methods (Green 1977, Wedel & DeSarbo 1994,
DeSarbo et al. 1994, Wedel & Kamakura 2000). These methods identify segments
that are grouped on the homogeneity of the relationship between dependent and

20
independent variables. For example, an Australian wine producer may segment
consumers in the UK wine market on how important they consider various attributes
of red wine, such as grape variety, region of origin, alcohol content and price. Wedel
and Kamakura (2000) state that these methods are amongst the most powerful in
market segmentation.
The foregoing has provided a brief outline of the development of the marketing
segmentation concept and the segmentation bases and methods that mangers or
researchers might apply. It should be re - iterated that market segments are
determined by the manager's strategic view of the market and do not occur naturally in
that market (Wedel & Kamakura 2000). The development of the so called mixture
models that "provide a statistical model - building approach" (Wedel & Kamakura
2000: 341) to the issue of providing effective and flexible data analysis techniques and
the introduction of advanced information technologies has enriched market
segmentation in the last decade. The ability to access scanner and other data now
allow the identification of smaller segments using micro marketing and direct
marketing approaches. Increased globalisation has seen geographic regions blur and
the introduction of international market segmentation (Wedel & Kamakura 2000). It
is clear that market segmentation is a dynamic concept.
2.1.1 Wine Market Segmentation Studies of the Australian Domestic wine
market
This review now examines the various market segmentation studies undertaken on the
Australian domestic wine market.

21
Gluckman (1990), Spawton (1991a, b), Jennings and Wood (1994), Lockshin (1999),
Bruwer et al. (2002) and Geraghty and Torres (2009) have all been critical of the wine
industry’s mass marketing approach. Spawton (1991a) noted that the main objective
of mass marketing was to create a homogenous market. He further indicated that an
alternative to this approach in Australia was to market to particular, identified target
markets. Thus Spawton (1991a) recognised that the wine market was not
homogenous, and acknowledged the importance of wine market segmentation in
developing a deeper understanding of the wine consumer.
The first formally recognised reported approach to segmenting the Australian wine
market was that of McKinna in 1986 who acknowledged that the most important task
of the study was to understand and segment the market (McKinna 1986). He
identified five segments in the wine market and given that much of the work that
followed on the Australian wine market was based on this seminal work, it is relevant
to mention those segments, which were:.
(i) The Wine Knowledgeable or Connoisseur
(ii) The Wine Pretentious or Aspirational
(iii) The Young Bottle Wine Drinkers
(iv) The Average Cask Wine Drinker
(v) The New Wine Drinker
The relevant characteristics of each of these segments are listed in the following table.

22
Table 2.3 McKinna’s 1986 Australian wine consumer segments
Segment
The Wine
Knowledgeable
or Connoisseur
The Wine
Pretentious
or
Aspirational
The Young
Bottle Wine
Drinkers
The Average
Cask Wine
Drinker
The New
Wine
Drinker
Highly wine knowledgeable
Enjoys social aspects of wine
< 35 years old Almost exclusively cask wine consumers
Very interested in wine
Willing to experiment
Uses wine to make a statement
Detest cask wine
Not experimental - purchase from a small safe set of brands
Willing to experiment with wine purchases
Not price sensitive
Seeks information about wine to impress others
Drink what they like
Price sensitive – seek out advertised specials
Even though they are younger, they may have well developed palates
Branding less important
Lacks detailed wine knowledge
Career oriented and don’t have time to learn more about wine
Unsophisticated about wine
Reasonably price sensitive
Highly wine involved
Some may become connoisseurs
Drink what they like and not influenced by others
Relatively low level of wine knowledge
Well developed palate
Social life spent with people of similar wine tastes
Wine is for relaxation/reward
Subsequent studies of the Australian domestic wine market used various approaches to
segment that market. A behavioural approach was employed by Johnson et al. (1991),
whilst wine involvement was first examined by Lockshin et al (1997) and wine usage
occasion was used by Hall and Lockshin (1999).

23
A number of other studies were built upon the work originated by McKinna and either
confirmed or amended the various segments identified in 1986 (Spawton 1991a, b;
Hall & Winchester 1999). More recently, several studies adopted a wine related
lifestyle approach to identify segments in the Australian wine market (Bruwer et al.
2002, Johnson and Bruwer, 2003, Bruwer and Li, 2007). Johnson and Bastian (2007)
examined wine consumers' wine purchase drivers and used multivariate analyses to
identify a number of segments in the market. A comparison of the various segments
identified in the Australian domestic wine market from these studies is displayed in
the table 2.4 below.

24
Table 2.4 Comparison of Australian Wine Market Segmentation Studies
Authors Segments
McKinna 1986 Connoisseurs Aspirational Young bottle
wine drinkers
Beverage New Wine
Drinkers
Spawton 1991 Connoisseurs Aspirational Beverage New Wine
Drinkers
Hall &
Winchester
1999
Connoisseurs Image
Concerned
Risk Averse Enjoyment
- oriented
Bruwer et al
2002
Ritual –
oriented
conspicuous
wine
enthusiasts
Purposeful
inconspicuous
premium wine
drinkers
Fashion/image
oriented
Basic wine
drinkers
Enjoyment –
oriented social
drinkers
Johnson &
Bruwer 2003
Image
oriented,
knowledge
seeking wine
drinkers
Conservative,
knowledgeable
wine drinkers
Basic wine
drinkers
Enjoyment
– oriented
social
drinkers
Experimenter,
highly
knowledgeable
wine drinkers
Bruwer & Li
2007
Conservative,
knowledgeable
wine drinkers
Basic wine
drinkers
Enjoyment –
oriented social
drinkers
Mature,
time – rich
wine
drinkers
Young
professional
wine drinkers
Johnson &
Bastian 2007
Conservative
wine
purchasers
No nonsense,
everyday wine
purchasers
Adventurous,
confident wine
purchasers
Source: Adapted from Bruwer et al. (2002) and Bruwer and Li (2007
25
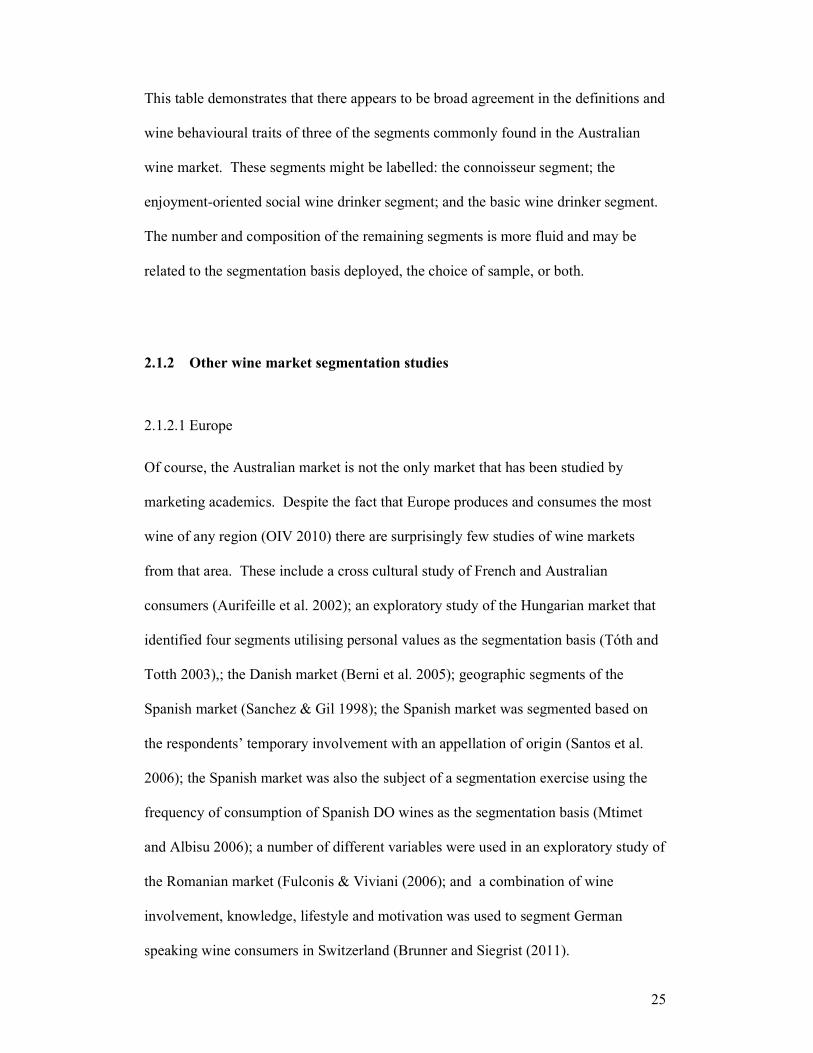
This table demonstrates that there appears to be broad agreement in the definitions and
wine behavioural traits of three of the segments commonly found in the Australian
wine market. These segments might be labelled: the connoisseur segment; the
enjoyment-oriented social wine drinker segment; and the basic wine drinker segment.
The number and composition of the remaining segments is more fluid and may be
related to the segmentation basis deployed, the choice of sample, or both.
2.1.2 Other wine market segmentation studies
2.1.2.1 Europe
Of course, the Australian market is not the only market that has been studied by
marketing academics. Despite the fact that Europe produces and consumes the most
wine of any region (OIV 2010) there are surprisingly few studies of wine markets
from that area. These include a cross cultural study of French and Australian
consumers (Aurifeille et al. 2002); an exploratory study of the Hungarian market that
identified four segments utilising personal values as the segmentation basis (Tóth and
Totth 2003),; the Danish market (Berni et al. 2005); geographic segments of the
Spanish market (Sanchez & Gil 1998); the Spanish market was segmented based on
the respondents’ temporary involvement with an appellation of origin (Santos et al.
2006); the Spanish market was also the subject of a segmentation exercise using the
frequency of consumption of Spanish DO wines as the segmentation basis (Mtimet
and Albisu 2006); a number of different variables were used in an exploratory study of
the Romanian market (Fulconis & Viviani (2006); and a combination of wine
involvement, knowledge, lifestyle and motivation was used to segment German
speaking wine consumers in Switzerland (Brunner and Siegrist (2011).

26
Given that the UK is amongst the largest importers of wine in the world, due in part to
its lack of domestic production (Ritchie 2007), it is a little surprising that more
segmentation studies have not been undertaken. Perhaps the earliest examination of
the UK market was undertaken by Gluckman (1991). He acknowledged that market
segmentation was one way of identifying the needs of groups of wine consumers and
suggested a behavioural approach, with the amount of wine consumed per month, as
an appropriate segmentation method. Drummond and Rule (2005) suggested that
further market segmentation research on the UK market be undertaken, but their
advice appears not to have been heeded. Geraghty and Torres (2009) provided a
detailed examination of the Irish market using a behavioural approach to arrive at
three market segments.
2.1.2.2 USA
The US market has been the focus of both regional and national studies undertaken by
academics and also proprietary research. From an industry point of view,
Constellation Wines undertook a survey of over 3,500 US wine consumers across the
country and concluded that there were six segments of consumers in that market
(Constellation Wines 2005). As that research was proprietary, no details were
provided on the methodology employed at arriving at their conclusions. From a more
academic point of view, perhaps the earliest attempt to segment that market was
documented by Moulton et al. (2001) who undertook a meta-analysis of the US
market. They concluded that 40% to 45% of the adult US population did not consume
any alcohol and of the remainder, only 20% were regular consumers of wine. They

27
defined four segments of these regular wine consumers as: Connoisseurs; Aspirants;
Newcomers; and Simple Drinkers. Some of these segments shared similar
behavioural traits to those segments previously identified in the Australian market
(McKinna 1986, Spawton 1991, Hall & Winchester 1999). Cholette and Castaldi
(2005) took the segments identified by Moulton et al. (2001) and noted that even
within segments, consumers purchased wines across a number of price points
(Johnson & Bruwer 2003). Using this presumption, they calculated the volume and
value of wine sales for each of those segments.
Hughson and colleagues (2004) undertook a web based survey of predominantly US
wine consumers (Hughson pers. com.), using conjoint analysis of a number of wine
related attributes, including mood and emotional elements. They identified four
segments of red wine and three of white wine consumers and concluded that their
consumers were generally conservative in that they sought more traditional attributes
(ones that did not deviate far from the norm) in their wines (Hughson et al. 2004).
Demographic variables were employed in a number of US studies. Some used age as
the primary distinguisher between segments (Thach & Olsen 2006, Nowak et al. 2006,
Olsen et al. 2007, Barber et al. 2008b) or gender (Barber 2009, Kolyesnikova et al.
2009), whilst others used a combination of demographic variables (Barber et al. 2006).
The Wine Market Council (2011) used a combination of behavioural and demographic
variables to segment the market. Frequency of wine consumption allowed them to
identify a core group of consumers who consumed wine at least two or three times a
month and then this segment was further disaggregated by age (Wine Market Council

28
2011). Lifestyle as a basis for segmenting the market was investigated in an
exploratory, qualitative study undertaken by Thach and Olsen (2004). Whilst they
arrived at five wine lifestyles in the market, the sample consisted of only 20
consumers and the resultant analysis of the segments did not provide detailed
information on the consumers in each segment that might have been provided with a
more quantitative approach.
It is generally considered that there are four major methods for segmenting a market:
geographic; demographic; psychographic; and behavioural (Kotler et al. 2010).
However, Costanigro et al. (2007) adopted an econometric approach and determined
four market segments of red wine, as distinct from red wine consumers, based on the
price of the wine. It seems to this observer that one conclusion that might be drawn
from the discussion above about the various studies undertaken on the US market, is
that the segmentation variables appear to be quite "naive", with an emphasis on
demographics as the segmentation base. Few of the studies provide the in depth
analysis of the resulting segments that might be obtained using more sophisticated
methods including multivariate analyses.
2.1.2.3 Asia
There is a dearth of studies of Asian wine markets that concentrate on understanding
the Asian wine consumer. An exploratory study used demographic variables to
segment the Korean market and concluded that age and gender were correlated with
wine consumption frequency. In particular, female consumers drank less wine and
liked red wine less than their male counterparts (Lee et al. 2005).

29
The Chinese wine market offers great potential to wine exporters (Balestrini &
Gamble 2006, Jenster & Cheng 2008, Mitry et al. 2009). Despite this, it appears that
the only research conducted on Chinese wine consumers has been at the collective
level, rather than identifying homogenous groups of consumers within that market.
Topics researched include country of origin effects (Balestrini & Gamble 2006, Hu et
al. 2008) and Chinese wine purchase and consumption behaviour (Liu & Murphy
2007). Given the strategic importance of this emerging market to the Australian wine
industry (Wine Australia 2011), it would appear that a focus on better understanding
the Chinese wine consumer might provide the industry with some competitive
advantages.
The literature review now turns to the issue of fine wine consumers, the identification
of whom was a central tenant of the research project.
2.2 Fine Wine Consumers
In a project that aims to examine the consumer behaviour of fine wine consumers, it is
appropriate to review the literature pertinent to that and other related concepts.
The terms fine wine, fine wine consumers and wine connoisseurs are common in both
the popular wine press and academic literature, however, definitions of these terms are
scarce. It is almost as if the terms are self defining, but is this really the case? Let us
firstly examine the case of fine wine, which is likely to have a very different definition
depending on who might be asked for a response (Vigneron & Johnson 1999). A
number of studies have examined luxury wine brands, where the terms luxury wines

30
and fine wines are used interchangeably (Beverland 2004a, 2004b, 2005, 2006,
Beverland & Luxton 2005). Price is regularly used as a defacto indicator of prestige
or luxury (Vigneron & Johnson 1999). In three of these studies, luxury or fine wines
were defined as wines with a track record of performance and quality and costing
greater than US$100 per bottle (Beverland 2005, 2006, Beverland & Luxton 2005),
whilst in the remaining studies, the definition reverted to a price of greater than US$50
per bottle (Beverland 2004a, b). Fogarty (2006) took another approach and decided
that any wines that were included in the Caillard and Langton classification of
Australian quality wines (Langton’s 2010) were fine wines. A further approach was
adopted by Halstead et al. (2010), who defined a luxury wine as one costing in excess
of US$25 per bottle. Clearly there is no consistent definition of "fine wine".
Who then, is a fine wine consumer? Is it sufficient to conclude that a fine wine
consumer is one who consumes fine wine? From the foregoing discussion, the
conclusion should be "No". The terms fine wine consumer, wine connoisseur and
wine enthusiast occur frequently in the literature and seem to be used synonymously.
For example, Lawless et al. (1997) called consumers “fine wine consumers” because
of their membership of a local wine tasting club. On the other hand, Langlois et al.
(2011) argued that a wine connoisseur obtained their knowledge of wine through
reading about and tasting wine and had not received any formal wine training. They
segmented their respondents into connoisseurs or consumers based on the results of an
objective knowledge wine test and their level of experience, reading about and tasting
of wine. Yuan et al. (2005) defined their wine enthusiasts as those respondents who
scored greater than the sample mean on a five item Personal Involvement Inventory

31
scale (Zaichkowsky 1985, Mittal 1995) What appears clear is that however labelled,
these consumers are likely to be highly involved in wine (Vigneron & Johnson 1999).
The Concise Oxford Dictionary states that a connoisseur is “an expert judge (of or in
matters of taste, especially in the fine arts)”, whilst the Merriam - Webster online
dictionary defines a connoisseur as: (1) “one who understands the details, technique,
or principles of an art and is competent to act as a critical judge”; or (2) “one who
enjoys with discrimination and appreciation of subtleties (a connoisseur of fine
wines)” (Merriam – Webster 2011). Both of these definitions have the dimensions of
expertise and taste noted by Strand (2005). Eisner (2002) defines a connoisseur as a
person who can “notice in the field of their expertise what others may miss seeing” (p.
187). Kramer (2003) provides a relatively simple definition of a connoisseur “one
who can distinguish between what he or she likes and what is good” (p. 25). Veblen
(Elliott 2006, pp. 232 – 233) outlined a number of traits that might help to identify a
connoisseur. These included consumption for status purposes; the witnessing of taste;
specialisation in the goods consumed; and the cultivation of a particular language to
negotiate that consumption.
It is not a stretch of the imagination to apply these traits to the stereotypical image of a
wine connoisseur (Miletic 2008) and picture a group of (mainly) older males standing
in an oak panelled bar, examining in some detail a rare and expensive bottle of wine,
in an overt manner, using language that might be unintelligible to the general public to
do so. Howard and Stonier (2002: 82) echoed younger consumers' views in these
terms “Big Eyebrows, Bulbous Nose, Bow Ties and Bulging Belly". This
stereotypical view of a wine connoisseur might encompass some fine wine consumers,

32
but in the 21st century Australian wine market, is it a realistic picture of that segment
of the market?
2.2.1 How to measure fine wine consumer behaviour
Notwithstanding the paucity of information defining fine wine consumers and the
stereotypical view of wine connoisseurs noted above, it is a logical step to consider
that fine wine consumers display some of the traits described above. They are likely
to have a great deal of knowledge about wine and be highly wine involved (Vigneron
& Johnson 1999).
A major aim of the project was to identify fine wine consumers within the Australian
domestic wine market. How then might this be achieved? Following the discussion in
section 2.1 above, the decision was taken to develop an unobservable product specific
segmentation base (known as the Fine Wine Instrument) and that a post hoc
segmentation method would apply. We hypothesised that fine wine consumers would
demonstrate some wine connoisseur type behaviours; be wine knowledgeable but also
wish to continually increase that knowledge; be very interested in the provenance of
the wine they consumed; and that the consumption occasion might influence their
purchase decision. These hypotheses formed the basis for the development of the
protocol.
Previous studies using a Wine Related Lifestyle™ (WRL) methodology to segment
the Australian wine market had a connoisseur element in their studies’ frameworks
(Bruwer et al. 2002, Johnson & Bruwer 2003, Bruwer & Li 2007). This element

33
considered such wine behavioural traits as attendance at wine club tastings/meetings;
recall of wines consumed; regular reading of wine related magazines/web sites;
purchase of rare or expensive wines; and keeping a record of wines purchased and
consumed. Therefore, these traits were considered a relevant starting point for the
connoisseur type behaviours that might identify fine wine consumers.
Consistent with the earlier discussion on the elements of a luxury or fine wine and also
consistent with Yuan et al.’s (2005) assertion that wine enthusiasts use complex
information such as wine region and country of origin, winemaker and vintage
information to make their wine purchase decisions, it was appropriate that further
questions should be added to the protocol. These questions explored such issues as
the importance of a wine’s provenance (country and region of origin, grape variety
and vintage); questions about the respondent's wine knowledge; and the impact of
wine consumption occasion on purchase behaviour. The developed instrument was
applied to the project's respondents and used to identify a number of segments in the
market that were denoted “Connoisseurs”, “No Frills” and “Aspirants” (Moulton et al.
2001, Hughson et al. 2004). Detailed information on the development and
implementation of the instrument are provided in Chapter 3.
As the project hypothesised that fine wine consumers are likely to be highly wine
knowledgeable and wine involved, it is appropriate to review the literature on these
two concepts.

34
2.3 Knowledge as a construct
Understanding the relationship between consumers’ knowledge and their decision
making behaviour in relation to a myriad of products has long been studied and wine
is no exception (Park and Lessig 1981, Brucks 1985).
Park and Lessig (1981) believed that consumer knowledge is linked with product
familiarity and concluded that there were two major approaches for measuring this
familiarity. One was to measure in terms of “how much a person knows about the
product” and the other in terms of “how much a person thinks s/he knows about the
product” (1981: 223). In the case of the former construct, the knowledge was
contained in the person’s long term memory and in the latter, it was based on an
individual’s self reporting about the product in question (“self assessed familiarity”
(1981: 223)).
Brucks (1985) labelled self assessed familiarity “subjective knowledge” and described
it as “what individuals perceive they know”. The measure of an individual’s prior
knowledge was labelled “objective knowledge” and was a measure of “what is
actually stored in memory” (1985: 2). She concluded that these two constructs were
“conceptually and operationally distinct” (1985: 2) and argued that both types of
knowledge played different roles in the amount and types of information sought in
relation to consumer decision making behaviour, with objective knowledge facilitating
information search efficiency. Raju et al (1995) agreed with Brucks (1985) that
objective and subjective knowledge should be considered as distinct constructs, even
though they were often positively correlated. They further argued that this distinction
was reflected in the different ways that the two types of knowledge were measured.
Subjective knowledge was typically measured using a self reporting mechanism and

35
objective knowledge by a series of questions testing knowledge of the topic of interest
(Raju et al. 1995).
2.3.1 Objective Wine Knowledge
Much of the early work involved in establishing participants’ wine knowledge was
secondary to the main research objectives, which were generally examining linguistic
and other language effects associated with wine descriptions. As early as 1975, in her
seminal work “Talking about wine”, Adrienne Lehrer measured the wine knowledge
of her respondents, by asking them a series of questions for which written answers
were required. She then segmented her respondents into three groups (that is, those
who obtained scores in the top, middle or bottom third of the test) and concluded that
there was considerable variation in the wine knowledge of her respondents. This
method of determining respondents’ wine knowledge was replicated by Lawless
(1984), who found that people with formal wine training, or who were employed in
the wine industry (“experts”) scored significantly higher on the test than non - experts.
Reizenstein and Barnaby (1980) devised a modest wine knowledge test that they
administered to both wine consumers and wine retailers in a south eastern USA state.
This test consisted of open ended questions exploring areas such as the serving
temperature of wine, the age wine should be at consumption and the types of wine that
should be served with food. They concluded that wine as a product was in the early
stages of adoption in that particular part of the USA and that the level of wine
knowledge of both consumers and retailers was relatively low.

36
Solomon (1990) also segmented his respondents by level of wine expertise. He
analysed the work of both Lehrer and Lawless but chose not to use a written test to
determine levels of expertise. He decided that those respondents who had professional
involvement in the wine industry or were regular members of a long standing wine
tasting group, were experts. Those respondents without that level of industry
involvement were labelled as novices. In 1997, using a slightly different approach, he
had his respondents complete a self directed “Novice Questionnaire” (1997: 59).
Using the respondents’ questionnaire results, their wine consumption frequency and
their efforts to improve wine knowledge, Solomon segmented the respondents as
experts, intermediaries or novices. He included the new segment of intermediary in
order to explore how expertise might be acquired. Melcher and Schooler (1996)
became more sophisticated in determining the wine knowledge level of their
respondents. They used a “General Wine Knowledge Test” (1996: 244), red wine
consumption frequency, formal wine training and professional involvement in wine to
classify their respondents as novices, intermediates or experts. More recently, Parr et
al. (2002) used a similar classification scheme to determine whether their respondents
were experts or novices.
In 2002, Frøst and Noble devised an experiment to examine differences in wine
preferences amongst respondents with varying levels of objective wine knowledge and
sensory expertise. They argued that wine knowledge and sensory acuity were two
very different forms of expertise and by attaining a level of objective wine knowledge
through reading and other means, did not automatically suggest that the individual had
sensory expertise. Therefore, they administered a “Wine Trivia Quiz” and a “Smell
Association Test” (2002: 277) to determine both objective knowledge and sensory

37
ability. They found a lack of correlation between the objective wine knowledge scores
and sensory expertise, thereby confirming their views that one skill could not be
inferred from the other. That conclusion was subsequently supported by Johnson and
Bastian (2007). The scores from the two tests were combined to produce an overall
wine expertise score. Respondents were then segmented into three groups, using the
lower and upper quartiles of the wine expertise scores as the cut off points (high,
medium and low wine expertise).
The preceding analysis has demonstrated the evolution of multiple choice questions as
a suitable method to measure objective knowledge with the number of correct answers
being an appropriate index of that knowledge (Johnson and Russo 1984).
2.3.2 Subjective Wine Knowledge
Flynn and Goldsmith (1999) noted that although considerable attention had been paid
to the topic, no serious attempt had been made to measure subjective knowledge.
They agreed with previous researchers (for example, Park and Lessig 1981; Brucks
1985; Raju et al. 1995) that objective and subjective knowledge were separate but
related constructs and that subjective knowledge might be measured by some form of
scale. For the purposes of their study, Flynn and Goldsmith (1999) defined subjective
knowledge as “a consumer’s perception of the amount of information they have stored
in their memory” (1999: 59). Their study found that a five item scale consisting of
both positively and negatively worded items was a valid and reliable measure of
subjective knowledge across a range of product categories.

38
The findings of Flynn and Goldsmith (1999) were used as the basis to measure
subjective wine knowledge in a number of studies. Goldsmith and colleagues
measured the subjective and objective wine knowledge of respondents in the USA and
France. They reported the correlations between subjective and objective wine
knowledge as 0.28 for US student respondents, 0.39 for US adults and 0.51 for French
respondents (Goldsmith et al. 1998, Goldsmith and d’Hauteville 1998). They offered
no explanation for these cross cultural differences, although it is possible that the
differences might be attributable to the role that wine plays in the respective cultures.
It can be inferred that for US respondents, subjective wine knowledge is not a reliable
indicator of objective wine knowledge, whereas it is for French respondents.
French respondents have been further investigated for their objective and subjective
wine knowledge, amongst other attributes (Aurier and Ngobo 1999). A set of twenty
multiple choice questions were used to measure objective knowledge and a six item,
five point Likert scale to measure subjective knowledge. Aurier and Ngobo (1999)
concluded that subjective knowledge was highly correlated to the other constructs
being measured, in accord with the findings of Goldsmith et al. (1998).
Dodd et al. (2005) measured both objective and subjective wine knowledge of a
sample chosen from subscribers to a US wine accessories magazine to explore the
relationship between knowledge and information sources. They reported a correlation
of 0.36 between objective and subjective knowledge and this is consistent with the US
findings of Goldsmith et al. (1998). In a generally knowledgeable sample, they found
that consumers with high levels of both subjective and objective knowledge used

39
impersonal sources of information (e.g. wine media) when making wine purchasing
decisions. High subjective knowledge consumers were also comfortable in using their
perceived knowledge in making those purchasing decisions (Dodd et al. 2005).
Perrouty et al. (2006) used a modified version of Flynn and Goldsmith’s 1999 scale to
measure the subjective wine knowledge of respondents in four European countries.
Based on the work of Aurier and Ngobo (1999), they argued that subjective
knowledge was an appropriate basis for determining whether respondents were wine
experts or novices. Following the method described by Quester and Smart (1998), the
top 40% in terms of mean scores were denoted experts and the bottom 40% novices.
The remaining 20% were described as moderately expert. They concluded that as
consumers’ level of expertise increased, the region of origin effect in wine purchasing
was moderated by other brand components such as price and the commercial brand
itself (Perrouty et al. 2006).
In a later study, Hussain et al. (2007) used a self reporting scale (1 being “clueless”
and 5 being “most knowledgeable” or “expert”) to segment their respondents
according to their wine knowledge level. Given that the scale was self reported, it is
reasonable to conclude that the results were a measure of subjective wine knowledge.
Interestingly, no respondent reported their knowledge at the expert level. They found
a positive and significant correlation between (self reported) knowledge and wine
consumption and that regardless of the level of wine knowledge, their respondents
purchased wine across multiple price points. They concluded that wine knowledge
was a most important predictor of wine consumption (Hussain et al. 2007).

40
2.3.3 Australian Wine Knowledge Studies
In contrast with other countries, there is a paucity of studies that have investigated
Australian wine consumers’ wine knowledge. Hughson and Boakes (2001)
acknowledged that after the work of Lehrer (1975), several studies were published
using a knowledge test to determine respondents’ wine knowledge levels, however all
of these tests were about European wines. They therefore developed a test suitable for
the Australian population - the “Australian Wine Knowledge Questionnaire (AWKQ)”
(2001: 106) that consisted of eight multiple choice questions and two questions
concerning the frequency of wine consumption and the amount of reading undertaken
about wine. This test was given to 89 first year psychology students at the University
of Sydney, plus 28 wine experts and showed that: (1) the experts had a significantly
higher score on the knowledge questions than the students; and (2) the knowledge
score correlated highly with both wine drinking frequency and reading about wine.
Hughson and Boakes concluded that the test was “highly discriminating” (2001: 106).
These researchers applied the same test to a number of wine novices and wine experts
alike across four different experiments and similar discriminating results were
reported (Hughson & Boakes 2002).
At the same time as Hughson and Boakes were undertaking their research, an
independent study was undertaken by Johnson and Bruwer (2003), who used a series
of ten multiple choice questions to determine respondents’ objective wine knowledge.
Once again, these questions were designed for the Australian wine consumer. The
results of this test were used as one discriminator when a segmentation study of the
Australian wine market was undertaken. Five segments were identified and labelled

41
respectively: Conservative, wine knowledgeable wine drinker; Image oriented,
knowledge seeking wine drinker; Basic wine drinker; Experimenter, highly
knowledgeable wine drinker; and Enjoyment oriented, social wine drinker. It was
shown that the mean wine knowledge score of the Experimenter, highly
knowledgeable wine drinker segment was significantly higher than the other four
segments (p < 0.05) and in particular, significantly higher than the mean scores of the
two segments that had other similar behavioural characteristics. It was therefore
concluded that wine knowledge was a legitimate variable to discriminate between
segments.
As mentioned above, Johnson and Bastian (2007) measured both the objective and
subjective wine knowledge scores of a cohort of Australian wine consumers, as part of
an exercise to determine the overall wine expertise of these consumers. They arrived
at an r value of 0.64 between the two variables which inferred that one form of
knowledge was a good predictor of the other. This finding was consistent with that of
Aurier and Ngobo (1999) but differed from those of Goldsmith et al. (1998) and Dodd
et al. (2005), who both found lower correlations between the two variables in US wine
consumers.
2.4 Involvement as a Construct
Consumer behaviour can be described as the set of responses to the various marketing
efforts of a company. These consumer responses are shaped in part by cultural and
psychological influences and manifest themselves in the how, what, where, when and
why of a purchase (Kotler et al. 2006). The concept of involvement in the study of

42
consumer behaviour was first mooted in Sherif and Cantril’s 1947 work (cited in
Laurent and Kapferer 1985). Various researchers have used concepts like the interest
and enthusiasm consumers have towards a product or product category to define the
involvement construct (Zaichkowsky 1985, Goldsmith and Emmert 1991). The level
of a consumer’s involvement impacts on issues as diverse as brand loyalty, marketing
communication efforts and retail shopper segmentation (Quester and Lim 1988, Flynn
and Goldsmith 1993, Lockshin et al. 1997). Highly involved consumers attach
particular importance and relevance to products or product categories and therefore
may play a role in the success or failure of brands and marketing strategies (Bloch
1986). Therefore, understanding a consumer’s level of involvement towards a product
or product category would help to demystify their decision making process.
2.4.1 Levels of Involvement
Engel and Blackwell (1982) noted that an individual may have high or low levels of
involvement with a product or product category. Furthermore, Laurent and Kapferer
(1985) argued that the level of involvement would influence the purchase decision
process and also the processing of information relating to that decision. More highly
involved consumers are more likely to read newspapers and magazines about their
preferred product/category in order to gain further information and less likely to place
emphasis on price than their lower level counterparts. This implies that the more
involved consumers use attributes other than price in their purchasing behaviour
(Flynn and Goldsmith 1993, Zaichkowsky 1988).

43
2.4.2 Measuring Involvement
Due to the importance placed upon the involvement concept in developing consumer
behaviour theory (Mittal and Lee 1989), many researchers have set about developing
scales that would measure the level of consumer involvement in a product. Goldsmith
and Emmert (1991) analysed a number of different scales and concluded that the;
Personal Involvement Inventory (Zaichkowsky 1985), Consumer Involvement Profile
Inventory (Laurent and Kapferer 1985) and Involvement Scale (Mittal 1988) could be
used in research with some confidence and that they all measure the same construct.
2.4.3 Involvement and Wine
Wine is a product that is very suitable for measuring consumers’ levels of
involvement. There are thousands of wine brands and wine is subjected to a range of
marketing strategies practised across a number of different retail settings (Lockshin et
al. 1997). This affinity between wine and involvement was recognised by some of the
early researchers devising involvement scales (Zaichkowsky 1985, Laurent and
Kapferer 1985, Kapferer and Laurent 1993). Zaichkowsky (1988) used red wine in
her research and interestingly, she also administered the wine knowledge test devised
by Reizenstein and Barnaby (1980) to her subjects. She found that there was no
relationship between wine involvement and wine expertise, but cautioned that the
results may not be reliable because she doubted that the test was suitable for
measuring the wine knowledge of average wine consumers.

44
In later years, wine and involvement have been used in a number of studies. Lockshin
et al. (1997) used three different scales to measure product, brand and purchase
involvement, to arrive at an overall involvement score that was then used to segment a
wine retail market. They demonstrated that high involvement wine consumers buy
wine more frequently and at higher price points than their low involvement
counterparts and these results were subsequently confirmed by Lockshin et al. (2006).
Hollebeek et al. (2007) used a sample of New Zealand wine consumers to extend the
work of Lockshin et al. (2006) and found that region of origin was a more important
cue in purchase decisions for high product involvement wine consumers than low
involvement consumers. They also offered qualified support to the view that high
involvement consumers were willing to pay more for their wine than lower
involvement consumers but suggested that some high product involvement wine
consumers may be as price sensitive as their low involvement counterparts. The price
sensitivity of low involvement consumers was also confirmed by Barber et al. (2008a).
Quester and Smart (1998) examined both wine involvement and consumption
situation, as they argued that effective market segmentation often requires a
consideration of the proposed use of the product. They adopted the involvement scale
developed by Lockshin at al (1997) and used the top 40% and bottom 40% of
involvement scores to denote high and low involved consumers, respectively. They
found that the wine purchase behaviour was influenced by both the level of consumer
involvement and the usage situation.
In addition to their work on wine knowledge, Goldsmith and colleagues also examined
wine involvement. They found that the level of wine involvement was positively

45
correlated with both heavy wine consumption (this concept was not defined) and with
wine innovativeness, the latter described as the readiness to accept new wine products
(Goldsmith et al. 1998, Goldsmith and d’Hauteville 1998).
Other studies used wine involvement to segment international wine retail markets.
These studies concluded that even in countries as diverse in wine culture as France
and Australia, similar segments existed, thereby providing further opportunities for
global marketing efforts (Lockshin et al. 2001, Aurifeille et al. 2002).
More recently, Charters and Pettigrew (2006, 2007) examined the relationship
between wine involvement and wine quality. They argued that high involvement wine
consumers require both disposable incomes and time to indulge in their pursuit of
wine and therefore, they are likely to be older consumers. In a departure from
previous studies, they adopted a qualitative approach in segmenting their respondents’
wine involvement levels. They used factors such as the price respondents paid for
wine and frequency of wine consumption (amongst others) to determine involvement.
Their findings suggested that in addition to the traditional dichotomy of high versus
low involvement wine consumers, that there was also a medium involvement
consumer who exhibited traits of both high and low involvement consumers. These
findings support the views of earlier researchers who suggested that levels of
involvement formed part of an involvement continuum, starting with no involvement
and ending with the highest level of involvement but with many involvement levels in
between (for example, Bloch 1986). They also concluded that wine quality was a
“multi-dimensional concept” (Charters & Pettigrew 2007: 1006) and that the

46
involvement level played a crucial role in the relevance that the various quality
elements played in a consumer’s assessment of a wine’s quality.
The wine involvement literature therefore suggests that high involvement consumers
seek out and use more information in their wine purchasing behaviour and that they
also strive for greater levels of wine knowledge (Lockshin 2003). This high level of
wine knowledge should be considered an element of a high involvement wine
consumer (Goldsmith and d’Hauteville 1998).
A recent Australian study examined many of the variables discussed above (Cox
2009). He collected data on subjective wine knowledge, wine involvement as well as
a number of other psychometric measures. Cox concluded that wine involvement was
a predictor of red wine consumption, confirming the earlier findings of Dodd et al.
(2005) and Perrouty et al. (2006), but not vice versa. Rather, he was in agreement
with Hussain et al. (2007), in finding that subjective knowledge predicted wine
involvement (Cox 2009).
As a final comment on the involvement and knowledge constructs described in some
detail above, wine innovativeness, as measured by a Domain Specific Innovativeness
Scale, was found to be strongly and significantly positively correlated with wine
involvement and both objective and subjective knowledge (Goldsmith 2000).
The literature relating to the first part of the project that involved the development of a
novel base for segmenting the Australian domestic wine market was reviewed in the
preceding sections. This review now turns to an examination of the relevant literature

47
regarding the remaining parts of the project. The first area covered relates to sorting
tasks and multi - dimensional scaling.
2.5 Sorting Tasks and Multidimensional scaling (MDS)
A sorting task is a simple technique whereby judges are asked to form groups of
products based on their similarity. The judges' instructions might be to use their own
criteria to form the groups, or they may be limited to a set number of groups or
provided the criteria for sorting (Lawless 1989). The term Multidimensional scaling
was coined by Torgerson in 1952 (Torgerson 1952) and is a statistical technique that
provides a geometrical picture of the distance (or similarity) between two or more
objects. This picture is usually depicted in two or three dimensions (Young 1985). In
1968, a study in the field of psychology which examined the multidimensionality of
personality traits provided the first use of a sorting task combined with multivariate
analysis and specifically MDS (Rosenberg et al. 1968). This technique was pursued in
that field (see for example, Rosenberg & Kim 1975), however, it was Harry Lawless
who first employed it in the study of olfaction (Lawless 1989). He argued that this
technique could overcome the judge fatigue that would arise if they had to rate many
pair wise comparisons of odours or products, as n products generate n(n - 1)/2
comparisons (Lawless et al. 1995, Pagès 2005). Lawless’ study required the judges to
sort the odours into groups based on their similarity and the number of times two
samples were grouped together was counted and the resultant similarity matrix was
subjected to MDS. This analysis produces a map whereby two products that are
perceived as similar are close together and those that are perceived as noticeably

48
different are far apart (Abdi et al. 2007). Lawless then used cluster analysis to assist
in the interpretation of the MDS results. He concluded that the technique was a useful
way of analysing a number of different odours at one time and that the complexity of
the results was directly related to the directions given to the judges and specifically,
whether the judges were required to sort the odours into a given number of groups, or
whether the judges were left to decide their own sorting criteria (Lawless 1989).
The process was extended to other chemical odours (MacRae et al. 1990), food
products such as cheese (Lawless et al. 1995), beer (Chollet & Valentin 2001, Lelièvre
et al. 2008), yoghurt (Saint – Eve et al. 2004), breakfast cereals (Cartier et al. 2006)
and wine (Gawel et al. 2001, Ballester et al. 2005, Piombino et al. 2004, Preston et al.
2008, Parr et al. 2007, Campo et al. 2008, Ballester et al. 2008). Although none of
these studies specifically examined the efficacy of the technique, Piombino and
colleagues (2004) found that the sorting task was an effective and quick way to
compare a large number of products and also concluded that with more judges, the
resultant groups of products were more stable.
The issue of whether sorting tasks were better carried out by expert or trained judges
compared to novices or untrained judges was addressed by a few of these studies, with
conflicting results. Ballester et al. (2008) concurred with the earlier work of Chollet et
al. (2005) when they concluded that the expert judges provided superior performance
compared to the novice judges. However, this was at odds with Cartier et al. (2006)
who found similar levels of performance between their trained and untrained
panellists. In the current study, the decision was taken to use expert wine judges, as

49
they were very familiar with the products under examination ((Solomon 1997,
Hughson & Boakes 2002, Ballester et al. 2005).
More recently a modified version of a sorting task known as Napping® (from the
French word “nappe” meaning tablecloth) has been employed in wine research. Here
judges use their own criteria to sort products that they perceive as similar and those
similar products are placed together on a large sheet of blank paper. Those products
that are perceived as dissimilar are place far apart on the paper. The X and Y co-
ordinates of the products are recorded and then subjected to multivariate analysis
(Pagès 2005, Perrin et al. 2008). It is outside the scope of this review to explore this
process in any major detail; however, one prominent sensory scientist now undertakes
a napping task alongside all descriptive analyses and compares the results (H.
Heymann pers. com.).
Like some of the studies mentioned above, the project utilised a cohort of wine experts
in undertaking some specific tasks. A review on the use of experts in wine related
studies follows.
2.6 The use of wine experts in wine related research
The use of experts familiar with the production process and the subsequent product to
determine its quality is a long established practice (Lawless et al. 1997, Sun et al.
1997, Perrin et al. 2008). Consistent with this practice was the view that any
judgements made about a product’s typicality or regionality should be made by those
people with a deal of expertise in that product (Sauvageot 1994). The International

50
Standards Organisation defines an expert as: “In the general sense, a person who,
through knowledge or experience, has competence to give an opinion in the fields
about which he/she is consulted” (ISO 1992). In other words, they are recognised by
their peers as experts and they are not required to undertake any special tests or
examinations to prove their knowledge or skill levels (Sauvageot et al. 2006). In the
case where wine is the product in question, Parr et al. (2002) argued that a wine expert
should meet one or more of the following criteria:
• Established winemaker;
• Wine science researchers and teaching staff regularly involved in winemaking
and/or wine evaluation;
• Wine professionals (e.g. Masters of Wine, wine judges, wine writers, wine
retailers);
• Graduate students in Viticulture and Oenology who had relevant professional
experience (e.g. had participated in one vintage; had run wine tasting classes);
• Persons with extensive (>10 years) history of wine involvement (i.e. family
history, extensive wine cellar, regular involvement in formal wine tasting).
Experts who met the criteria set out above have been involved in wine related research
for a number of years. Some were involved in studies examining the different
cognitive or perceptual processes, such as language use and odour recognition and
identification employed by experts and novices (Lawless 1984, Melcher & Schooler
1996, Gawel 1997, Bende & Nordin 1997, Parr et al. 2002, Hughson & Boakes 2002,
Parr et al. 2004, Ballester et al. 2009). Other wine experts were involved in
oenological research by undertaking sensory exercises evaluating wines made from
different grape varieties. For example, Sauvignon Blanc was examined by Lawless et

51
al. 1997, Parr et al. 2007 and Parr et al. 2010; Chenin Blanc by Perrin et al. 2008;
Chardonnay by Zamora and Guirao 2004 and Ballester et al. 2005; Chardonnay and
Melon de Bourgogne by Ballester et al. 2008; Cabernet Sauvignon by Preston et al.
2008; Cabernet Sauvignon and Shiraz by Lattey et al. 2010; and Shiraz by Bastian et
al. 2009 and Bastian et al. 2010.
2.7 Descriptive Analysis
2.7.1 Descriptive Analysis – A Brief History
Descriptive analysis is a subset of the broader science of sensory analysis (Moskowitz
et al. 2006). According to Standards Australia, descriptive analysis is ... “A formal
procedure for assessing the sensory characteristics of a sample using appropriate terms
(descriptors) (AS 2542.3 – 1989). Lawless and Heymann (2010: 227) describe
descriptive analyses as “the most sophisticated tools in the arsenal of the sensory
scientist”. Moskowitz et al. (2006) liken the output of descriptive analysis to a
product signature. These techniques are widely used in the food and wine industries
when analysis of the sensory attributes of a product or a range of products is required
or when the factors that might impact on a product’s sensory profile need to be
identified. However, sensory or descriptive analyses do not operate in a vacuum.
They quite often operate in concert with market research, whereby consumers’ needs
are identified within the new product development process. The role of descriptive
analysis in these processes might include establishing the existence, in the newly
developed product, the various attributes previously identified by market research,
required to meet consumers’ needs (Moskowitz et al. 2006). The current descriptive

52
analysis techniques involving the use of specially trained panels of judges has not
always been the norm.
Prior to the 1940s, companies employed experts whose vast experience with a product
or material saw them valued as the font of all knowledge about that product or
material. Their qualitative judgements were relied upon for many of the critical
decisions in the product development process, including quality assurance. However,
as the marketplace became more complex and business objectives and the role of
marketing became more prominent, it was realised that there were limits to the
abilities of these experts.
Because of this increasingly complex environment, the capacity of any one individual
was limited. Companies came to decide that panels of trained experts using a
systematic approach to evaluate specific products were more likely to provide useful
product information and that consumers were more likely to purchase those products
that reached standards of excellence (Stone et al. 1974, Moskowitz et al. 2006).
The original panel procedure was developed in the late 1940s/early 1950s at Arthur D
Little & Company by Sjostrom, Cairncross and Caul and became known as the
Flavour Profile® (FP) (Cairncross and Sjostrom 1950 and Caul 1957 cited in Lawless
and Heymann 2010). FP is a technique that requires a highly trained panel to reach
consensus on a product evaluation. A category scale (see Figure 2.1) is used that
typically consists of symbols and numbers to record the judges’ observations on two
elements – the intensity of flavour and the degree and balance (amplitude) of flavour.
Even though numbers appear in the scale, the final result was not an average of the
judges’ scores. Rather, a consensus result was derived by the panel leader (who also

53
took part in the evaluation process) after discussion and re-evaluation of the product.
The use of symbols did not allow any statistical analysis of the data and therefore FP
is classified as a qualitative technique ((Lawless and Heymann 2010).
Figure 2.1 Example of a Category Scale used in FP
Rating Explanation
0 Not present
)( Threshold or just recognisable
1 Slight
2 Moderate
3 Strong
(Source: Lawless and Heymann 2010: 232)
The qualitative nature of the FP was a major criticism of the technique (Amerine et al.
1965) and with the introduction of numerical scales that allowed statistical analysis of
the judges’ mean scores it was renamed the Profile Attribute Analysis (Moskowitz
1988). Syarief et al. (1985) argued that the introduction of statistical analysis
provided superior results than the consensus approach. Other criticisms included; that
FP was time consuming and expensive, that the scale lacked precision and as the panel
leader also took part in rating the product, that person may have undue influence over
the consensus result (Amerine et al. 1965). Supporters of FP contend that with well
trained panels and panel leaders, the results are reliable and reproducible (Lawless and
Heymann 2010).

54
2.7.2 Quantitative Descriptive Analysis (QDA)
In response to some of the perceived criticisms of the FP, Stone et al. (1974) proposed
QDA which uses trained panellists who individually identify and quantify the sensory
attributes of a product. An interval or line scale, as distinct from a category scale, is
used with a minimum of two word anchors (usually maximum and minimum). The
anchor points are indented to reduce the central tendency effect. Repeated measures
are undertaken on each product to allow an analysis of subject/judge and overall panel
performance. The objective is to obtain internal consistency within the panel. In
contrast to the opinions of individual company experts or panels of experts, QDA uses
panel data, in order to remove individual variability, analysis of variance and
multivariate statistical analyses to produce a multi dimensional picture of the sensory
attributes of the product (Stone et al. 1974, Sidel & Stone 1993). In addition, the role
of the panel leader also differs from that of the FP. In this technique, the panel leader
does not participate in any product evaluation or language development (Lawless and
Heymann 2010). Table 2.5 outlines the advantages and disadvantages of QDA as
posited by Lawless and Heymann (2010).
Table 2.5 QDA – Advantages and Disadvantages
Advantages Disadvantages
It takes less time to train the panellists Some training of panellists is still
required and this takes time and money
Individual scores are used, therefore
reducing the likelihood of consensus by a
dominant personality
The results are relative and not absolute.
That is, the results examine the relative
differences between attributes and not the

55
Advantages Disadvantages
absolute measure of the attribute.
Therefore the inclusion of a benchmark
and repeated measures are required.
Statistical analyses (as noted above) are
readily applied to the data
The results may be presented graphically
(radar plots are common)
The panel leader facilitates only and does
not direct panellists or evaluate samples
QDA is a trademarked technique and is a standard methodology; however, other
techniques have evolved based on that methodology. Notwithstanding those
alternative techniques, it is generally recognised that a generic Descriptive Analysis
(DA) comprises a three stage process (Lawless and Heymann 2010). The first stage is
to recruit and train the panellists and have them agree on the sensory descriptors to be
used. The second stage is to determine the judge reproducibility/consistency. This is
achieved through panel evaluation of some of the products to be used in the final
evaluation and the data analysed for internal consistency. Further training may be
required as a result of this second stage. The final stage is the evaluation of all of the
samples in the trial with repeated measures, followed by data analysis (Lawless and
Heymann 2010).

56
2.7.3 Descriptive Analysis and Wine
Wine is a product that particularly lends itself to DA techniques. The sensory
attributes of each individual variety of grapes used in both table and sparkling wine
production differ enormously, as do the specific sensory attributes of a single variety
grown in different wine producing regions or made under different production
regimes. Wine producers are keen to benchmark their products and DA is an
appropriate technique to do so (Lawless and Heymann 2010).
Following Stone et al.’s 1974 paper proposing QDA, wine was evaluated using this
technique as early as 1977 (Noble 1978). Since that time, the wine/DA fit has been
extensively researched. This research includes, but is not limited to, the following
grape varieties and wine related tools and materials.
Table 2.6 A non-exhaustive list of Descriptive Analysis and Wine studies
Grape Variety Research/ers Year
Cabernet Sauvignon Noble 1978
Aiken and Noble 1984
Heymann and Noble 1987
Sivertsen et al. 2001
Madrigal-Galan and Heymann 2006
Preston et al. 2008
Zinfandel Noble and Shannon 1987
Pinot Noir Guinard and Cliff 1987

57
Grape Variety Research/ers Year
McDaniel et al. 1987
Aubry et al. 1999
Madrigal-Galan and Heymann 2006
Piombino et al. 2004
Seyval Blanc Andrew et al. 1990
Chardonnay Noble 1979
Zamora and Guirao 2004
Schlosser et al. 2005
Piombino et. al. 2004
Falconer et al. 2006
Merlot Madrigal-Galan and Heymann 2006
King et al. 2001
Semillon Blackman and Saliba 2009
Albariño Vilanova et al. 2010
Spanish White Grape Varieties De La Presa - Owens and Noble 1995
Spanish Red Grape Varieties Saenz – Navajas et al. 2011
Bordeaux varieties Noble et al 1984
Wine from four major French
regions
Sivertsen et al. 1998
Tempranillo Etaio et al. 2008a, b, c
Aglianico Piombino et. al. 2004
Gambuti et al. 2007
Greek dry red wines Koussissi et al. 2003

58
Grape Variety Research/ers Year
Tannat Varela & Gambaro 2006
Oak influences in wine Francis et al. 1992
Shiraz/Syrah Abbott et al*. 1991
Walker et al. 2004
Madrigal-Galan and Heymann* 2006
Gawel et al.* 2007
Shiraz and Cheese Bastian et al.* 2010
Cabernet Sauvignon and Shiraz* Lattey et al. 2010
Of all of the studies cited above, only the works indicated by an asterisk (*) involved
Australian Shiraz. None of these studies involved a comparison of the sensory
attributes of Australian Shiraz grown in different wine producing regions, or attempted
to identify those sensory attributes that might differentiate wines from different Shiraz
producing regions. The issue of wine regionality might be considered analogous to
wine terroir. That term originated in France in the early nineteenth century and is used
to describe wines from a specific district or region (McGee and Patterson 2007).
Despite the prevalence of the use of words like terroir and regionality, very few
researchers have studied the specific characteristics of any given region or terroir.
Recently, a few studies have looked at the typicality of various grape varieties grown in
specific regions: Merlot and Washington State (Lesschaeve 2003); Marlborough
Sauvignon Blanc (Parr et al. 2007); Chardonnay predominantly from Burgundy (Ballester
et al. 2005); and Chardonnay and Melon de Bourgogne from Burgundy (Ballester et al.

59
2008). T he current project therefore addresses a gap in the extant knowledge of
Australian Shiraz.
2.8 Wine consumers and wine research
The last part of the project characterised a cohort of wine consumers who drank
Australian Shiraz and tasted a sub set of the wines that had gone through the DA
process described above. These consumers were required to provide a hedonic score
for each of the wines. The following sections discuss the techniques employed to
analyse the subsequent consumer data and also examine previous similar wine
research.
2.8.1 Preference Mapping
Preference mapping is a set of multivariate statistical techniques based on principal
component, cluster and regression analyses that provide: (1) identification of
consumers' preferences for a number of products; (2) identify the relationship between
those products; and (3) identifies the products' attributes that drive the consumer
preferences or dislikes (MacFie & Thomson 1988, Schlich 1995, van Kleef et al.
2006, Lawless & Heymann 2010).
Preference mapping originated in the field of psychometrics in the United States and
was adopted by the UK food industry in the late 1980s (Schlich 1995). It is now
widely accepted in market research and new product development (Jaeger et al. 2000,
60
van Kleef et al. 2006), although the wine industry was slower on the uptake, with the
first published studies appearing in the early 2000s (Lattey et al. 2010).
Preference mapping traditionally takes two forms, denoted as internal and external
analyses (Carroll 1972). The most basic internal preference map is derived purely
from consumer preference or hedonic data (Marketo et al. 1994, Schlich 1995,
Lawless & Heymann 2010). The aim of this analysis is to find the lowest number of
underlying dimensions that explain the highest proportion of the variability in the
hedonic data (Jaeger et al. 2000, van Kleef et al. 2006, Lawless & Heymann 2010).
Each consumer's preference is represented on that perceptual map by a vector
originating at the zero point intersection (Lawless & Heymann 2010). The resultant
map may be very busy, especially if there are a large number of consumers. Therefore
segmenting the consumers by cluster analysis of their preference scores is commonly
undertaken (Schlich 1995).
If other objective data about the products are available for example, sensory data, that
data may be projected onto the internal preference map, in a process known as
extended internal preference mapping. In this way, the underlying dimensions may be
identified (MacFie & Hedderley 1993, van Kleef et al. 2006, Lawless & Heymann
2010).
External preference mapping can be considered the reverse of the process just
described. The product space is formed from the objective data and the preference
data are fitted to that map (van Kleef et al. 2006, Lawless & Heymann 2010). van
Kleef et al. (2006: 387) state that ... "internal and external preference analysis

61
emphasise fundamentally different perspectives on the same data". This process
employs quite complex statistical models with the possibility of four solutions: vector,
circular, elliptical or quadratic (Schlich 1995, Jaeger et al. 2000). Jaeger et al. (2000)
contend that because no reference is made to the underlying consumer behaviour
pertinent to their preferences in those models, interpretation problems may arise,
especially with elliptical or quadratic solutions. They argue that these two models
should be used with caution in real world applications (McEwan 1996, Jaeger et al.
2000).
The differences in internal and external preference mapping are outlined in Table 2.7.
Table 2.7 Comparison of Internal and External Preference Mapping.
Internal preference
mapping
External preference
mapping
Primacy of Preference Perception
Product position in the
map
Account for variation in
hedonic data
Account for variation in
(often) sensory data
1st dimension Explains maximum
variability in hedonic data
between products
Explains maximum
variability in sensory data
between products
Hedonic data Drive orientation of the
product space
Is supplementary: is fitted
into the derived perceptual
(sensory) product space
Sensory data Is supplementary: fitted
into the derived hedonic

62
product space
Source: van Kleef et al. (2006: 389)
2.8.2 Preference Mapping and wine
As mentioned above, the first published work using this technique in relation to wine
was in the early 2000s (Lattey et al. 2010). International studies include the work of
Yegge & Noble (2000), Lesschaeve et al. (2001), Robichaud et al. (2007), Lund et al.
(2009), Meillon et al. (2010), Lesschaeve & Findlay (2004) and Frøst & Noble (2002).
In the Australian context this type of study is limited to Lattey and her co-workers
(2004, 2010) who examined Australian consumers’ liking of Riesling and Chardonnay
and Shiraz and Cabernet Sauvignon wines, respectively and Mueller et al. (2010) who
examined Shiraz as part of a discrete choice experiment. Given the context of the
present project, the two most recent Australian studies will be examined in more
detail.
Mueller et al.'s (2010) study contained several interesting design elements. The first
was that their consumers made informed decisions about the wines being tasted; as
they were shown pictures of the wine as well as the price for each prior to tasting. The
second feature was that each consumer only rated five of the twenty available wines.
Therefore a balanced incomplete block design was employed and as a result, the
consumer cohort could not be segmented based on their liking scores of the wines.
The last feature was the inclusion of a standard reference wine that was tasted by the
consumers before each of the experimental wines were scored and the wines were
scored relative to the consumers' liking of that reference standard (the hedonic scale
with reference reported by Bergara-Almeida et al. (2002)) (Mueller et al. 2010).

63
The researchers found that the most important driver of wine liking was price, which
was consistent with the findings of Plassmann et al.’s (2008) neural imaging study.
They also concluded that sensory attributes played a role in wine liking, with
characteristics such as fresh fruit aromas and sweetness being positive influences and
aromas associated with older wines such as medicinal and earthy/vegetal aromas being
negative influences (Mueller et al. 2010).
Lattey and her co – workers (2010) adopted a more traditional approach with their
consumer study, where all of their respondents were offered an incentive to attend the
tasting and were not required to expectorate. Each consumer tasted all twelve wines
in the experiment and therefore a cluster analysis was undertaken on the consumers’
hedonic scores. This analysis identified four clusters of consumers with similar wine
preferences (Lattey et al. 2010).
For their consumer cohort, the positive drivers of liking were less prominent than the
negative, with the latter sensory attributes associated with Brettanomyces being to the
fore which accorded with the earlier work of Frøst & Noble (2002). Bitterness was
also considered a negative driver of liking. The most positive influence for the overall
cohort was the floral attribute. The cluster that displayed the most preference for
Shiraz wines perceived negative influences in pepper, woody and bitter attributes with
very few important positive influences (Lattey et al. 2010).
An additional component in the study by Lattey et al. 2010 was the fact that a cohort
of wine experts also tasted and provided a quality rating, based on the Australian 20

64
point rating (Rankine 1990), of ten of the twelve wines tasted by the consumers. They
found a low, non significant correlation between the experts’ quality scores and the
consumers’ hedonic scores, a result consistent with those of Lattey et al. (2004) and
Lesschaeve (2007). However, this contrasted with the results of Bastian et al. (2010)
who found a strong positive correlation between the two scores. This result was at
odds with those authors who are of the view that expert scores cannot be used as a
predictor of consumer liking (Moskowitz 1996). Consistent with the consumer cohort,
sensory attributes associated with Brettanomyces were a negative influence on the
experts’ quality scores. In contrast, bitterness was a positive influence on the experts’
scores, which the authors concluded was attributable to some bitterness being present
in wines with higher stringency, an attribute which was also a positive driver of
quality (Lattey et al. 2010). One last finding of this study which should be of interest
to observers of wine consumer behaviour, was that consumers’ wine preferences
change over time and the authors suggested that this was an area for future research
(Lattey et al. 2010).
2.9 The project's objectives
The preceding review outlined the theoretical framework for the three stages of the
research project. The objectives of the project were:
1. To develop a novel segmentation base for the Australian domestic wine market,
using fine wine consumer behaviour. Compare and contrast the wine related
behaviours of the identified consumer segments and in doing so, provide updated
market intelligence on the Australian domestic wine market.

65
2. At a preliminary level, identify any regional sensory characteristics of Australian
Shiraz, including the identification of the sensory attributes that differentiated the
wines from the ten delimited Australian Shiraz producing regions used in the
project.
3. Identify the sensory attributes that drive various segments of Australian wine
consumers’ liking of Australian Shiraz.
The project is described in the following figure.
Figure 2.1 Project Schematic
Identify the sensory attributes that significantly differentiate various Shiraz wines sourced from a number of Australian Shiraz producing regions:
�Examine the results for any regional similarities
Identify the sensory attributes that drive consumer liking of Australian Shiraz:
�Do these attributes differ between consumer segments and in particular, how do the various segments identified in part 1 above, differ?
Develop a Fine Wine Instrument to act as a novel segmentation base of the Australian domestic wine market. Compare and contrast the wine related behaviours of the identified fine wine segments:
�Update intelligence on the Australian domestic wine market

66
2.10 Literature Review Summary
This review provided a detailed examination of the literature in respect of the three
distinct parts of the research project. It commenced with an overview of the history
and development of market segmentation as an important tool in a manager's
strategies. It identified that the Australian domestic wine market has been the focus of
a number of previous segmentation studies, however, none used consumers’ fine wine
behaviour as the base, thereby identifying a gap in the extant knowledge. The project
was therefore the first to use this novel base to segment the Australian wine market
and as a result, has significant academic interest. Wine consumers' fine wine
behaviour will be measured using the FWI which consists of three scales (denoted as
Connoisseur, Provenance and Knowledge) developed using Attitudes, Interests and
Opinions (AIO) methodologies (Plummer 1974). The use of these scales as a
segmentation base has the potential to provide a more detailed, richer and
sophisticated description of the consumers in the resulting segments than might
ordinarily be achieved by using more common measures such as wine knowledge and
wine involvement as the bases. From a theoretical and conceptual point of view, the
use of the FWI addresses the gap in the knowledge identified above and introduces a
novel, alternative segmentation base for use in wine markets.
The review also identified a gap in the knowledge of the sensory attributes of
Australian Shiraz wines and the project added to this body of knowledge by
undertaking the first examination of the regional sensory characteristics of that wine
style. Although one previous study had identified the sensory attributes that drove the
liking for Australian Shiraz and Cabernet Sauvignon, this project extended that work
67
by identify the drivers of liking of Australian Shiraz of the fine wine consumer
segments mentioned above.
This project offered a number of potential benefits to wine producers, the wine
industry and wine consumers and these are summarised below.
For individual wine producers, these benefits include:
• The provision of a tool that might enhance the new product development process,
whereby producers might tailor a wine for specific market segments. The project
details this tool in respect of the Shiraz var iety, however, the same techniques can
be applied to any wine variety, style or blend. In this way, producers might more
effectively and efficiently meet the needs of their target market and in the process,
add value to their business through increased sales, increased profit margins, or
both. The use of this tool may also save producers time and money in that they
might not target consumer segments with wines that do not meet their consumers’
needs.
For wine consumers, these benefits include:
• By understanding the specific sensory attributes that drive consumer liking for a
particular grape variety or wine style, the needs of consumers in respect of those
wines will be better met. Satisfied consumers are more likely to be brand loyal
and therefore more profitable to the brand owner (Kotler et al. 2010).

68
For the wine industry, these benefits include:
• Updated market intelligence on the Australian domestic wine market – the wine
market that is the most accessible to the industry.
• An impetus for the industry to focus more attention on the domestic market (a
market that in the opinion of this author has been largely ignored to the detriment
of the industry) – a market that is arguably the most researched of all global wine
markets and one that is the cheapest and easiest to enter. An increased focus on
this market may introduce more people to the category and build industry loyalty,
which in turn might provide some additional stability to the (mainly) rural
communities that are the backbone of the industry.
• The provision of additional information on the different sensory characteristics of
Australian Shiraz, which might then be used in marketing communications.
The thesis now moves to a detailed discussion of the three phases of the research
project4.
4 Please note that for ease of reading and to save space, the reference lists that would normally appear as part of each of the next three chapters, in their paper format, have been amalgamated and included in the complete reference list that appears at Appendix 1.

69
Chapter 3. Identification of Australian fine wine
consumers and comparisons of their wine related
behaviour with other segments in the domestic wine
market.
The Literature Review highlighted that even though the term “fine wine consumer”
was prevalent in both academic and popular wine literature, it was not a term that had
been defined, nor had the behaviour of this segment of wine consumers been
investigated.
The following paper addresses these shortcomings. In the first instance, a new scale to
measure the fine wine related behaviour of consumers was developed and the results
used to place consumers into one of three fine wine related segments. The wine
related behaviour of the resulting segments was investigated in some detail and
conclusions drawn on their relative importance to the Australian wine industry.
The Literature Review concluded that the Australian domestic wine market had been
the subject of a number of previous segmentation studies. It also noted that no wine
market remains stable and does evolve over time, thereby requiring periodical
intelligence updates and this was an opportune time to provide further information on
that market. Some constant structural elements of the market are noted.
This chapter was submitted to the International Journal of Wine Business Research.

70
Identification of Australian fine wine consumers and
comparisons of their wine related behaviour with other
segments in the domestic wine market.
TRENT E. JOHNSON1 and SUSAN E.P. BASTIAN1*
1Wine Science and Wine Business Group, The University of Adelaide, Waite Campus,
PMB 1, Glen Osmond, SA, 5064, Australia
*Corresponding author: Dr Susan Bastian, phone +61 8 8303 6647,
facsimile +61 8 8303 7116, email [email protected]
Abstract
Purpose
No market remains static over time and in order to understand any market, reliable
intelligence should be gathered. With the recent decline in Australia’s wine export
performance, there is a view that more emphasis should be placed on the Australian
domestic wine market. For the first time, this market was segmented based on scores
returned by respondents on a recently developed Fine Wine Instrument (FWI) that
measured fine wine consumer behaviour. Three segments were identified and denoted
“Connoisseurs”, “Aspirants” and “No Frills” wine drinkers, respectively. The wine
related behaviour of these segments was compared and contrasted. The study

71
therefore proposes a novel segmentation base for the Australian domestic wine market
and provides up to date information on this market.
Design/methodology/approach
An online survey collected quantitative information from Australian wine consumers
with 1017 valid responses received. Wine purchasing and consumption data, wine
knowledge and involvement, fine wine consumer behaviour formed the basis for
segmenting the market. To identify the various market segments, factor, cluster and
discriminant analyses, ANOVA and Students’ t tests were performed.
Findings
The behaviour of the Connoisseurs' segment was compared to the other segments and
it was found that they consumed more wine, spent more money on wine and were
more knowledgeable about wine than their counterparts. The importance to the wine
industry of a number of consumer segments that were willing to spend more than
AUD$20 per bottle of wine was highlighted as was the role of younger wine
consumers in this market. The change in the nature of purchase channels in the
market was also highlighted, with the market share of the supermarket owned chain
stores increasing.

72
Research limitations/implications
The sample was of a convenience nature and although the sample was large, different
behavioural data may have been obtained if a true probability sampling method were
employed.
Originality/value
This study was the first to segment this market using the FWI and examine in detail
the wine consumption behaviour of the segmented denoted as Connoisseur and it
identified their importance to the wine industry. The study provided the latest
information on the market and the data suggests that the Australian domestic wine
market is robust and healthy, which may provide some relief to a beleaguered
industry.
Key Words: Australian domestic wine market, fine wine consumers, market
segmentation
Paper Type: Research paper

3.1 Introduction
Market segmentation is an appropriate strategy to better understand a heterogeneous
market (Wedel & Kamakura 2000, Kotler et al. 2010). The Australian domestic wine
market, with in excess of two thousand producers and a plethora of brands on wine
retailers’ shelves is such a market (Wine Australia 2010a, 2010b). It has been a rich
source of information for wine marketing academics and practitioners alike and has
been extensively studied since the mid 1980s (see, for example McKinna 1986,
Spawton 1991a,b, Johnson et al. 1991, Lockshin et al.1997, Hall & Winchester 1999,
Hall & Lockshin 1999, Bruwer et al. 2002, Johnson & Bruwer 2003, Bruwer & Li
2007, Johnson & Bastian 2007, Cox 2009). It is arguably the most studied of any
global wine market. However, with the recent decline in growth in Australia’s export
markets, there is a view that more resources should be aimed at the domestic wine
market (WFA et al. 2009, Jones 2010). That market has seen sluggish growth over the
past decade (Johnson & Bruwer 2003) with the average annual growth over the past
five years at 1.3%, however, it was worth AUD$ 1.962 billion in sales in the 2008/09
financial year (ABS 2010). Markets, however, do not remain static and evolve over
time. It is therefore imperative that our knowledge of any market should be
continually updated and this wine market is no exception (Johnson & Bruwer 2003,
Thomas & Pickering 2003, Bruwer & Li 2007, Hollebeek et al. 2007). A recent
preliminary study of this market concluded that the level of a wine consumer’s wine
expertise influenced their wine purchase and consumption decisions (Johnson &
Bastian 2007). The current study provides an update on the state of the Australian
domestic market. For the first time, it segments that market based on consumers’ fine
wine related behaviours and examines in detail the wine purchasing and consumption
habits of the resultant segments

74
The study was developed in response to the “Influencing the consumers” strategy
outlined in the Directions 2025 document (WFA, AWBC 2007). This strategy
highlighted the role of Australia’s fine wine products in all markets and the
requirement for the Australian industry to encourage consumers to spend more money
per bottle on their wine purchases. The implication was that the consumers would
then be introduced to the fine wine category and hence improve the return on
investment to wine producers and grape growers alike.
Fine wine and fine wine consumers are frequently mentioned in the literature, yet
there is a scarcity of definitions of both, notwithstanding the obvious that fine wine
consumers consume fine wine. Lawless et al. (1997) recruited knowledgeable wine
consumers from local wine tasting clubs and labelled them as fine wine consumers. In
a more recent analysis of luxury wine drinkers in the UK, US and Swiss markets,
Wine Intelligence defined luxury wines as costing in excess of UK£10, US$25 and
CHF25 (Wine Intelligence 2010). In his study of the return on investment in
Australian fine wine, Fogarty (2006) decided that any wines that were included in the
Caillard and Langton classification of Australian quality wines met the criterion for
inclusion. The wines on that classification are considered to be Australian fine wines,
however, the list is by no means definitive, as at least another 100 Australian brands
are regularly traded on the Australian secondary wine market (Langton’s 2010).
Notwithstanding the limited nature of this classification, we define fine Australian
wines as wines that are either contained within the Langton’s Classification, or are

75
wines that cost in excess of AUD$25 (the mean of the three Wine Intelligence price
points calculated in AUD).
The aims of this study were therefore to develop an instrument based on Attitudes,
Interests and Opinions (AIO) (Plummer 1974) that measured respondents' fine wine
behaviour and subsequently segment the market based on the results of that
measurement; and identify the wine related behaviours of the consumers within the
identified segments. In doing so, we would also update the current knowledge on the
state of the Australian domestic wine market. By using AIO methodology, we could
provide a more sophisticated description of the consumers in the identified segments
than might ordinarily be achieved by using such measures as wine knowledge and
wine involvement as the segmentation bases. However, we hypothesised that
respondents who were identified as fine wine consumers would also be wine
knowledgeable and wine involved and that their wine purchasing and consumption
behaviour would be different to respondents in other identified segments.
3.2 Materials and Methods
Measuring fine wine consumer behaviour
We hypothesised that consumers who exhibited fine wine behaviour would have
favourable attitudes to four general variables or constructs. We felt that they would
exhibit connoisseur like behaviour through actions such as drinking rituals and record
keeping. They would not only be knowledgeable about wine but would want to seek
out further wine knowledge. They would be interested in the provenance of the wines

76
they consumed and that the wine consumption occasion would influence their wine of
choice. We labelled these variables: connoisseur; knowledge; provenance and
occasion respectively. The “connoisseur related” component of the
“Quality/attributes” dimension, a series of AIO type statements, described by Johnson
and Bruwer (2003) in their Wine Related Lifestyle study formed the basis to measure
this behaviour. The process outlined by Churchill (1979) was adopted to create the
four variables. Johnson and Bruwer's (2003) "connoisseur related" statements were
augmented by a number of other statements through an iterative approach of test,
analyse, re - test and re - analyse the results using a cohort of wine experts and
"ordinary" wine drinkers, until the connoisseur measure consisted of seven statements;
the knowledge consisted of five statements; provenance of seven; and occasion three
statements giving a total of 22 positively and negatively worded statements. Scale
validity of the four separate variables returned a Cronbach Alpha (CA) of 0.82, 0.85,
0.84 and 0.62 for the connoisseur, knowledge, provenance and occasion variables,
respectively. One item was deleted from the provenance variable as the CA increased
with its deletion. Following the protocol outlined by Costello and Osborne (2005),
exploratory factor analysis (EFA) of each of the individual variables suggested that
one factor should be retained for the connoisseur, knowledge and provenance
variables and that EFA was not appropriate for the occasion variable. As the occasion
variable returned a CA of less than the recommended 0.7 and consisted of only three
items and was not suitable for EFA, it was removed leaving 18 statements in the final
analysis.
Confirmatory factor analysis of the three variables returned appropriate results for the
indices suggested by Brown (2006) and are shown in Table 3.1. We were therefore

77
confident that the three variables were internally reliable and unidimensional (Gerbing
& Anderson 1988) and should therefore form the basis for the proposed analysis. The
statements that comprise each variable, detailed data generated from EFA and data
from CFA are available at Appendices 1, 2 and 3, respectively.
Table 3.1 Confirmatory Factor Analysis data for the three factors suggested by
EFA.
Chi-Square GFI RMSEA CFI NFI
Connoisseur 0.19 0.994 0.034 0.995 0.991
Knowledge 0.538 0.999 0.00 1.0 0.999
Provenance 0.11 0.997 0.027 0.998 0.996
Where Chi-Square should not be statistically significant; Goodness of Fit Index (GFI) ≥0.95; Root Mean Square
Error of Approximation (RMSEA) recommended ≤0.06; Comparative Fit Index (CFI) recommended ≥0.95;
Normed Fit Index (NFI) recommended ≥0.95 (Brown 2006)
3.2.1 The data collection questionnaire
An online, structured survey collecting quantitative data was the research
methodology of choice (Geraghty & Torres 2009). Ilieva et al. (2002) reported that
the major advantages of online surveys included low set up costs, short response times
and direct load of data into data analysis software, thereby saving data entry and other
administrative time and costs. They outlined that the disadvantages included
confidentiality issues with respondents and that the sample may not be representative
of the population, due to the uptake rates of use of the internet. In order to overcome

78
these perceived inadequacies, the email invitation to complete the survey highlighted
that all data collected would be reported in an aggregated manner and that therefore all
respondents’ anonymity was guaranteed. The Australian Bureau of Statistics (2009)
reported that 72% of Australian households had home Internet access and Levine and
Pownall (2004) reported that 55% of Australians over the age of 18 consume wine.
Therefore it was reasonable to conclude that the sample was representative of the
population.
Respondents for this study formed a convenience sample. The inclusion criteria were
that respondents were wine drinkers and had purchased and consumed wine in the
previous month. Respondents were asked to complete a questionnaire that collected
quantitative data. Behavioural information relating to wine purchase, storage and
consumption was collected by self reported data. Objective wine knowledge scores
were achieved by asking respondents fifteen multiple choice questions, where one
point was awarded to a correct answer and no points to an incorrect answer (Johnson
& Bastian 2007). Wine involvement and subjective wine knowledge levels were
measured by reliable and validated existing scales (Lockshin et al. 1997, Flynn &
Goldsmith 1999). The importance of a number of potential wine purchase drivers was
measured by respondents placing a mark on a nine point category scale against each
statement, where 1 was strongly disagree and 9 was strongly agree with each
statement (adapted from Bruwer & Johnson 2004). Similarly, the instrument
described above was scored by respondents placing a mark on a nine point category
scale, indicating how much they agreed or disagreed with the series of 18 statements.

79
Respondents were recruited through two distinct methods. The first recruitment
method was via a Sydney (Australia) market research company who guaranteed a
minimum total of four hundred respondents drawn from all States and Territories of
Australia and that these respondents would be a proportional representative sample of
the Australian wine drinking population. The second recruitment method was
originated by the authors who sent an email to all of their wine consuming
acquaintances in which the recipients were asked to visit a link in order to complete an
online survey. They were also asked to forward the link to any of their wine drinking
friends for completion. This latter method was undertaken in order to increase the
number of respondents. These two recruitment methods provided online responses to
the questionnaire. At the completion of the data collection window which was
between May 2009 and September 2009, the data were downloaded from the host
server (SurveyMonkey™) in a spreadsheet that was suitable for analysis. The
questionnaire and data collection methods were approved by the University of
Adelaide’s Human Ethics Committee. A copy of the questionnaire is available upon
request from the corresponding author.
3.2.2 Statistical analyses
The data were analysed with a combination of descriptive techniques, Student’s t test,
one way ANOVA with LSD post-hoc test, correlation analyses, Exploratory Factor
Analysis (EFA), Confirmatory Factor Analysis (CFA), discriminant and cluster
analyses and Principal Component Analysis (PCA) using SPSS 17.0 (SPSS Inc. 2008),
Microsoft Excel 2003 (Microsoft Corporation 2003) and XLSTAT Version 2010.3.08
(Addinsoft SARL, France).

80
3.3 Results
3.3.1 Demographic Data
A total of 1017 usable responses were received. The demographic information is
described in Table 3.2. There was an imbalance in the gender split with 41.9% of
respondents being female. The age ranges were evenly divided between under and
over 45 years of age, 59.2% of respondents possessed a tertiary degree and 39.7% of
respondents reported a household income in excess of AUD$100,000 per annum.
South Australian respondents accounted for 34% of the sample.
Table 3.2 Demographic data of the survey’s respondents (n = 1017 respondents)
Gender %
Female 41.9
Male 58.1
Age Group
18 - 24 years 13.8
25 - 28 years 7.8
29 - 34 years 11.3
35 - 39 years 9.0
40 - 44 years 8.5
45 - 54 years 20.9
55 - 65 years 20.0
65+ years 8.8
Highest Education
School leaving certificate 9.9
HSC 12.8

81
TAFE/Trade 16.8
Bachelor's degree 27.2
Graduate/Post Grad
Diploma 14.6
Master's Degree 11.1
Doctorate 6.3
Other 1.3
Household Income
<$25,000 7.3
$25,001 to $50,000 14.1
$50,001 to $75,000 15.0
$75,001 to $100,000 15.6
$100,001 to $150,000 20.1
$150,001 to $200,000 9.7
>$200,000 9.9
Not Provided 8.1
State of residence
South Australia 34.1
New South Wales 20.1
Victoria 18.5
Queensland 9.7
Western Australia 6.5
Tasmania 3.9
Northern Territory 1.8
Not Supplied 5.4

82
3.3.2 Wine purchase and consumption information
The respondents spent on average AUD $174.06 (± $237.52) per month on buying 8.1
(± 9.5) bottles and 0.5 (± 2.2) 2 litre casks of wine. They typically purchased 6.9 (±
8.3) bottles per purchase occasion and consumed 2.4 (± 2.4) bottles of wine per week.
Sixty two percent of respondents indicated that they had a wine collection and the
median number of bottles in their collections was 80. Wine was their preferred
alcoholic beverage and red wine was the most preferred wine style, followed by light
bodied and full bodied white wine (Table 3.3). Supermarket owned wine retailers
were the main wine purchase channel, followed by independently owned wine
retailers and cellar doors.
Table 3.3 Wine consumption and purchase data of the respondents
Beverages %
consumption
Wine % Wine Purchase
Channels
%
Beer 22.6 Red wine 50.7 Bars/hotels 7.3
Wine 59.5 Light bodied
white wine
19.4 Independent retailers 13.8
Spirits 11.1 Full bodied
white wine
9.7 Supermarket owned
retailers
37.6
RTD 2.0 Sparkling red 3.3 Drive thru 4.5
Alcopops 1.6 Sparkling white 7.6 Cellar door 9.6
Cider 1.8 Fortified 3.1 Supermarket/grocery
store
4.9

83
Beverages %
consumption
Wine % Wine Purchase
Channels
%
Other 1.5 Dessert 2.1 Restaurant 7.2
Rosé 2.5 Mail order 6.6
Bottling club 0.6
Online retailer 4.3
HORECA 14.5
RTD = ready to drink and was defined as pre mixed cans of spirits. Alcopops were defined as pre mixed bottles of spirits. HORECA = Hotels, restaurants, cafes. This is the on-premise category of wine consumption.
3.3.3 Wine purchase and consumption information by gender
Some relevant wine purchase and consumption data were split by gender and the
results are displayed in Table 3.4. Males spent significantly more money per month
on wine than females. Their preferred wine style was red wine and that was a
significantly higher percentage of their wine consumption than females. On the other
hand, females consumed significantly more light bodied, aromatic white wines than
their male counterparts. Females also consumed significantly more sparkling wine
(both red and white) and Rosé than males. Both genders indicated that their preferred
purchase channel for wine was supermarket owned chain retailers and there was no
significant difference between the two genders for that channel. Females bought
significantly more wine at bars, hotels and restaurants (the on – premise or HORECA
category) than males, although this channel still accounted for almost 13% of male
wine purchases. Females also bought significantly more wine at supermarkets or
grocery stores than males and males used on line retailers significantly more than
females.

84
Table 3.4 Selected wine consumption and purchase data of the respondents sorted
by gender Wine purchase/consumption category Male Female
Monthly wine spend $217.16a $113.84b
Preferred wine style % %
Red wine 55.8a 43.4b
Light bodied white wine 18.0b 21.4a
Fuller bodied white wine 9.2a 10.3a
Sparkling red wine 2.6b 4.1a
Sparkling white wine 6.4b 9.2a
Fortified 3.4a 2.8a
Dessert wine 1.9a 2.3a
Rosé wine 1.8b 3.4a
Preferred wine purchase channel
Bars/hotels 6.5b 8.3a
Independent wine retailers 14.1a 13.3a
Chain wine retailers 37.3a 38.2a
Drive through 3.9a 5.3a
Cellar doors 10.5a 8.4a
Supermarkets 4.0b 6.1a
Restaurants 6.2b 8.7a
Mail order/wine clubs 6.8a 6.3a
Wine bottling clubs 0.6a 0.5a
On-line wine retailers 6.0a 2.1b
HORECA 12.7b 17.0a
Categories sharing a letter within a row are not significantly different (p <0.05), Fisher’s LSD.

85
Given the importance of the on – premise channel to the market, that data was
examined in further detail, with particular emphasis on the age of consumers who
frequented that channel. The results are displayed in Table 3.5. Young females
(under 35 years old) purchased significantly more wine at this channel than all males
and older females and this amounted to slightly under a quarter of all their wine
purchases. Their young male counterparts purchased significantly more wine at this
channel than other males, however that amount was significantly less than younger
females.
Table 3.5 Percentage of wine purchases made in the HORECA category, by gender and age group.
Age Group HORECA % of wine purchases
Male Female
<35 17.4a # 22.7a *
35 to 44 12.2b # 18.6a *
45+ 10.4c # 10.9b #
Values sharing a letter within a column are not significantly different (p < 0.05) Fisher’s LSD. Values sharing a
symbol within a row are not significantly different (p < 0.05) Fisher’s LSD
3.3.4 Wine purchase and consumption information by fine wine consumer segment
The respondents were required to indicate their level of agreement (on a nine point
category scale) to eighteen statements that made up the three variables (Connoisseur,
Knowledge & Provenance) of the FWI that underpinned the identification of the fine
wine consumers. Given the internal reliability and homogeneity of the three variables

86
demonstrated by both CA and CFA, they therefore formed the basis of a cluster
analysis to identify segments of consumers in the market. Agglomerative hierarchical
clustering (AHC) using Euclidean distance and Ward's method suggested a three
cluster solution best fitted the data. Subsequent Discriminant Analysis revealed that
this solution provided a 95% accurate fit to the data, so that solution was accepted.
The cluster centroids are displayed in Table 3.6 below.
Table 3.6 Cluster Centroids following AHC
Construct
Cluster Connoisseur Knowledge Provenance
1 4.7b 4.3b 5.0b 2 6.8a 6.8a 7.1a 3 2.2c 1.5c 2.2c
Values sharing a letter within a column are not significantly different (p < 0.05) Fisher’s LSD.
Cluster 1 consisted of respondents who scored close to the mid point of five on each of
the three constructs. Cluster 2 consisted of respondents who scored highly on each of
the constructs and Cluster 3's respondents scored quite low on all three items. The
three clusters or segments were therefore denoted Aspirants, Connoisseurs and No
Frills wine consumers respectively.
Demographic details of the three segments are displayed in Table 3.7. Given the
definition of a fine wine consumer adopted for this study, the list of favourite Shiraz
wines provided by the Connoisseurs was examined to see if the definition was met.
Approximately 90% of the Connoisseurs’ consumers’ favourite Shiraz met the criteria
outlined above (data not shown). The Connoisseurs' segment was male dominant and
the Aspirants' and No Frills' segments effectively gender balanced. The No Frills had
the most consumers over 45 years of age and the Connoisseurs had the most even

87
spread of consumers over the three age groups. The Connoisseurs had the least
number of consumers with only a high school education and the highest with a tertiary
degree, which was the opposite of the No Frills' segment. These education levels were
reflected in the respective household incomes where the Connoisseur segment
recorded the least incomes under $50,000 pa and the most over $200,000 pa which
was the opposite of the No Frills' segment.
Table 3.7 Demographic data of the three fine wine segments. Data are percentages.
Fine Wine Consumer Segment
Gender
Connoisseur
(n = 342)
Aspirants
(n = 555)
No Frills
(n = 120)
Male 72.4 51.3 50.8
Female 27.6 48.7 49.2
Age Group
<35 39.3 30.7 25.0
35 to 44 23.8 15.9 6.7
45+ 37.0 53.4 68.3
Highest level of education attained
High School 16.4 22.4 41.7
Trade Certificate 12.6 18.1 23.3
Bachelor Degree or Post Graduate
Qualification 48.9 40.8 25.9
Higher Degree (e.g. Masters, PhD) 21.4 17.3 6.7
Household Income (pa)
<$50,000 13.5 23.4 34.7

88
$50,000 to $100,000 29.4 31.5 30.5
$100,000 to $200,000 38.4 27.7 15.3
>$200,000 15.0 8.2 3.4
The mean scores for the objective and subjective wine knowledge and wine
involvement scale were calculated for each of the fine wine consumer segments.
These results are displayed in Table 3.8. The Connoisseurs had significantly higher
mean scores (p < 0.05 unless otherwise stated) than the other two segments for each of
the wine related scales and the medium segment’s scores were significantly higher
than the low segment’s. The Connoisseurs reported spending AUD$306.89 (±
$332.30) per month on 12.8 (± 12.4) bottles of wine. This spend was significantly
higher than the other two fine wine segments and was also significantly higher than
the study’s overall mean spend value reported above, as was the mean for the number
of bottles purchased per month. 90.1% of the Connoisseurs reported having a wine
collection at home, with a median number of 415 (± 647) bottles in each collection,
representing wine from 4.0 (± 3.1) countries. In order to provide a deeper
understanding of each segment, their attitudes towards a number of statements were
examined. The Connoisseurs had significantly higher scores than the other two
segments on the following statements: “I often look for rare or scarce wines”; “I
prefer shopping for and buying wine from specialty outlets”; and “I prefer to dine at
bring your own wine restaurants than those with only a wine list”.

89
Table 3.8 Objective and subjective wine knowledge, wine involvement scores and other relevant data calculated for each fine wine consumer segment (standard deviations are in parentheses).
Connoisseur
Segment
Aspirants
Segment
No Frills Segment
Objective Wine Knowledge
72.4(15.3) a 55.8 (16.6) b 41.2 (14.1) c
Subjective Wine Knowledge
76.3(16.3) a 54.2 (18.6) b 33.4 (17.6) c
Wine Involvement 89.1 (10.3) a 72.4 (15.7) b 48.7 (19.0) c
Average spend per month on wine
$306.89 ($332.30) a $118.93 ($128.22) b $44.27 ($75.64) c
Weekly wine consumption (bottles)
3.0 (2.0) a 2.1 (1.7) b 1.9 (4.9) b
I often look for rare or scarce wines
6.0 (2.0) a 2.9 (1.9) b 1.1 (0.4) c
I prefer shopping for and buying wine from specialty outlets
6.5 (1.9) a 4.4 (2.0) b 2.1 (1.8) c
I prefer to dine at bring your own wine restaurants than those with only a wine list
6.6 (2.0) a 5.5 (2.0) b 3.1 (2.7) c
Segments’ % of overall wine spend
65.3 25.3 9.4
Means sharing a letter within rows are not significantly different (ANOVA, p < 0.05, Fisher’s LSD)
Data in relation to the three segments’ alcoholic beverage and wine style preferences
are displayed in Table 3.9. Wine was the preferred alcoholic beverage of choice
across all three segments, with the Connoisseurs' mean score significantly higher than
the other two segments. Red wine was the preferred wine style of all segments. Light
bodied white wine was the next most consumed wine style with the Connoisseurs and
Aspirants consuming significantly more than the No Frills' segment. The
Connoisseurs consumed significantly more full bodied white wine than the other two
segments. The No Frills' consumption of sweet dessert style wine was significantly
higher than the Aspirants and their Rosé consumption was significantly lower than the
other segments’.

90
Supermarket owned chain wine retailers were the preferred wine purchase channel for
all consumer segments. The No Frills reported 54% (± 40.2) of their wine purchases
through that channel, which was significantly higher than the Aspirants' 41% (± 32.8)
and the Connoisseurs' 26.4% (± 25.7). The Connoisseurs purchased 19.7% (± 22.4) of
their wine from independently owned wine retailers, which was significantly higher
than the other two segments. The Connoisseurs' cellar door purchases of 15.1% (±
19.6) was also significantly higher than the other two segments as was their use of on-
line wine retailers at 7% (± 15.5) of their purchases.
Table 3.9 Alcoholic beverages, wine styles consumed and wine purchase channels by fine wine consumer segments. Data are percentages.
Fine Wine Segment
Alcoholic beverages consumed Connoisseur Aspirant No Frills
Beer 20.4b 23.9a 23.2ab
Wine 67.3a 57.4b 46.9c
Spirits 9.2c 11.2b 16.0a
RTD 1.0b 2.5a 2.6a
Alcopops 0.5c 1.8b 4.0a
Cider 1.1b 1.9ab 2.9a
Wine styles consumed
Red wine 52.8a 49.7a 48.6a
Light bodied white 18.9a 21.0a 13.6b
Full bodied white 10.8a 9.1b 8.7b
Sparkling red 3.2a 3.2a 3.9a
Sparkling white 6.9b 7.7a 9.1a

91
Fortified 2.5a 3.3a 4.1aa
Sweet 2.0ab 1.9b 3.1a
Rosé 2.7a 2.6a 1.4ba
Preferred Wine Purchase Channels
Bars or hotels 5.5b 7.9a 9.4a
Specialty independent stores 19.7a 11.4b 7.7b
Chain / Supermarket owned wine
retailers 26.4c 41.0b 54.0a
Drive-through 3.5b 4.7ab 6.2a
Cellar doors 15.1a 7.9b 1.7c
Supermarkets/grocery stores 1.9b 6.0a 7.9a
Restaurants 7.4a 7.7a 4.7b
Mail-order 7.5a 6.7a 3.2b
Wine bottling club 0.5a 0.8a 0a
On – line wine retailers 7.0a 3.4b 0.9b
HORECA 12.9b 15.6a 14.1ab
RTD = ready to drink and was defined as pre mixed cans of spirits. Alcopops were defined as pre mixed bottles of spirits. Means sharing a letter within rows are not significantly different (p < 0.05, Fisher’s LSD)
Respondents were asked to nominate a price point that represented an average spend
on a bottle of wine. Figure 3.1 displays the results for the three fine wine segments.
The Connoisseurs reported that 67.5% of their wine purchases were in excess of
AUD$20 per bottle compared to 29.5% and 14.2% for the Aspirants and No Frills'
segments respectively. This Connoisseurs’ data accords well with their average
monthly wine spend and bottles purchased mentioned above.

92
Figure 3.1 Average price points spent on a bottle of wine, by fine wine consumer
segments.
0
5
10
15
20
25
30
35
40
<$10 $10 to
$14.99
$15 to
$19.99
$20 to
$24.99
$25 to
$29.99
$30 to
$39.99
$40 to
$49.99
>$50
Price Points
% o
f p
urc
hases i
n t
hat
pri
ce r
an
ge
Connoisseurs Aspirants No Frills
One final analysis was performed to examine the different use of the HORECA wine
purchase channel. The data were split by respondents’ gender, age and fine wine
segment level and the results are displayed in Figure 3.2. Females were active in this
channel, with the Connoisseurs' females being the most active. Older respondents,
regardless of fine wine segment, were more reluctant to purchase wine in this channel.

93
Figure 3.2 Wine purchases within the HORECA channel by respondent gender,
age and fine wine segment level. Values with different superscripts are
significantly different (t – Test, p < 0.05).
0
5
10
15
20
25
30
35
40
18 to 34
years
35 to 44
years
45+ years 18 to 34
years
35 to 44
years
45+ years 18 to 34
years
35 to 44
years
45+ years
Connoisseur Aspirants No Frills
% o
f w
ine p
urc
hased
at
HO
RE
CA
ch
an
nel
Male Female
b
a
a a
a
b
b
b
Age groups with different letters are significantly different (p < 0.05, Fischer's LSD)
The respondents were asked to rate their level of agreement on a 9 point Likert scale
to 25 statements that referred to the types of issues that might be considered when
purchasing a bottle of wine (purchase drivers). The responses by fine wine segment
are displayed in Table 3.10. On the statements that might be considered relevant to
the provenance of the wine (e.g. year of vintage, grape variety, region and country of
origin), the Connoisseur segment scored significantly higher than the other two
segments, which was consistent with the analysis above. That segment also scored
significantly higher than the other two segments on statements relating to cellar door
visits, wine quality and cellaring potential of the wine. These consumers might also
be considered risk takers as they scored significantly higher on the statement about
trying something different. Conversely, the No Frills' segment scored significantly
higher than the Connoisseur segment on the statements relating to the health benefits

94
of wine and the price of the wine, indicating that they might be health and price
conscious.
Table 3.10 Purchase driver responses by fine wine segment.
Fine Wine Segment
Purchase Driver Connoisseurs Aspirants No Frills
Year of vintage 7.1a 5.9b 4.4c
Wine Style 7.9a 7.6b 7.1c
Reputation of the winemaker 6.9a 6.5b 5.6c
Wine grape variety 7.8a 7.4b 6.3c
Packaging or labels 4.7a 4.7a 4.3b
Winery cellar door visits 6.1a 5.3b 3.8c
Wine region of origin 7.4a 6.5b 4.7c
The reputation of the winery 6.9a 6.5b 5.6c
Quality of the wine 8.3a 7.8b 6.8c
The occasion at which the wine will be
consumed 7.0a 6.7b 5.9c
The opportunity to try something different 7.1a 6.6b 5.6c
Attendance at a wine festival event 5.4a 4.9b 3.9c
Recommendation from staff at a restaurant 5.3a 5.2a 4.6b
Recommendation from wine writers in
magazines, newspapers 6.3a 5.5b 4.0c
Country of origin of the wine 6.8a 6.4b 5.1c
Cellaring potential 6.5a 4.9b 3.4c
Recommendation from staff at the retail store 5.3a 5.4a 5.4a
The health benefits of wine 3.6b 4.3a 4.5a

95
Fine Wine Segment
Purchase Driver Connoisseurs Aspirants No Frills
Awards or medals 4.9b 5.4a 4.9b
Price 6.7b 6.8b 7.3a
Recommendation from friends, family or
colleagues 6.6ab 6.7a 6.3b
Wine brand 6.0b 6.3a 5.9b
The antioxidant effect of wine 3.6b 4.4a 4.4a
Advertising, promotion or specials 5.2ab 5.4a 5.0b
Previous consumption or purchase of the wine 7.2a 7.2a 6.9a
Means sharing a letter within rows are not significantly different (p < 0.05, Fisher’s LSD)
To assist in a detailed description of each of the segments, selected data from Tables
3.6 to 3.10 were amalgamated and transposed so that the segments became rows and
the variables, columns. That data were then subjected to PCA. The first two principal
components (PC) explained 100% of the variability in the data. PC1 had consistent
loadings on all but HORECA and advertising, promotions and specials with over 45
years of age, no tertiary education, health benefits, female and chain stores being
negatively opposed to the remainder of the attributes. PC2 described seeking out
advertised specials, promotions and buying wine through the HORECA channel. The
bi plot scores of the three segments on these two components were also projected to
provide a pictorial view of each segment (Figure 3.3). The segment in the bottom
right quadrant consisted of younger wine knowledgeable males, who preferred to shop
at independent wine retailers often for rare or scarce wines with cellaring potential and
these consumers contrasted with those in the bottom left quadrant who were older, did
not have a tertiary education, were price conscious and preferred to buy wine at chain

96
retailers. The remaining segment described consumers who were active in the
HORECA channel and were swayed by advertising, promotions and specials when
purchasing their wine.
Figure 3.3 PCA plot of variables used to characterise the three segments, with the
segments’ bi plots projected.
Variables (axes F1 and F2: 100.00 %)
PROV
KNOCON
TE
NTE
45+
35 to 44
<35
F
M
BYO
SPO
RAR
$$
WI
SWK
OWK
HORECA
CHA
IND
APS
PR
HEA
CP
WWTSD
QAL
Connoisseurs
Aspirants
No Frills
-0.75
-0.5
-0.25
0
0.25
0.5
0.75
1
1.25
-1.25 -1 -0.75 -0.5 -0.25 0 0.25 0.5 0.75 1 1.25
F1 (90.23 %)
F2
(9
.77
%)
Where: APS = Purchase driver – advertising, promotion or specials; BYO = preference for BYO restaurants: CHA
= % of purchases at supermarket owned retailers; CON = Connoisseur scale: CP = Purchase driver – cellaring
potential: F = Female; HEA = Health benefits; HORECA = Hotels, restaurants, café purchase channel: IND = % of
purchases at independent retailers: KNO = Knowledge scale; M = Male; NTE = no tertiary education; OWK =
Objective wine knowledge score; PR = Purchase driver – price; PROV = Provenance scale; QAL = Purchase
driver – Quality of the wine; ; RAR = buying rare or scarce wines: SPO = buying wine from specialty outlets; TE =
tertiary education: TSD = Purchase driver - try something different; WI = Wine involvement score; WW =

97
Purchase driver –recommendations from wine writers; $$ = Spend per month on wine; <35 = <35 years old; 35 to
44 = 35 to 44 years old; 45+ = 45 years of age or older.
3.3.5 Fine Wine Consumer Segments
We are now in a position to describe each of the three fine wine segments in some
detail.
Connoisseurs (n = 342, 33.6% of the sample)
These consumers are more likely to be male with approximately 40% under the age of
35. They are well educated with 70% holding tertiary qualifications and they are
knowledgeable about wine and actively enjoy increasing that knowledge. They
exhibited connoisseur like behaviour by keeping records of the wines they purchase,
having a special wine storage space and ritually checking their wines for faults prior to
consumption. The provenance of the wines they purchased was also of considerable
interest and this was manifested in their use of specialty wine stores to purchase wines
that were often rare or scarce. These consumers could also be considered risk takers
as they liked to try something different in their wines. They would not be considered
parochial wine consumers as many had wines from other countries in their wine
cellars, which might be a reflection of their knowledge and interest in wine. They
spent the most money on wine (which was significantly higher than the other two
segments), purchased the most number of bottles of wine per month (data not shown)
and 67.5% of their purchases were in excess of $20 per bottle. This segment had the
highest incidence of purchases from independent wine retailers, cellar doors and on
line retailers and the lowest in chain retailers, although this last purchase channel was
their most preferred. They were confident in their own ability to choose wines for
purchase, however, they were not afraid to ask questions or seek recommendations

98
from others whose opinions they trust. The perceived health benefits of wine play no
role in their purchasing decisions, rather, wine is part of their lifestyle.
Aspirants (n = 555, 54.6%)
The characteristics of the consumers in this segment shared some similarities with
those in the Connoisseur segment, however, their wine knowledge and wine
involvement scores were all significantly lower than the latter segment. These
consumers placed more reliance on the health benefits of wine than the Connoisseur
segment, possibly because they were slightly older consumers, with 53.4% older than
45 compared with 37% in the Connoisseur segment and the segment was quite gender
balanced. The respondents in this segment were not as confident in their wine
purchasing abilities and were guided in their wine purchasing efforts by the opinions
of others, including friends and family, staff at restaurants and wine retailers and wine
writers whose opinions they trusted. They were quite happy to pay extra for their
wines, as 29.5% of their purchases were in excess of $20 per bottle and 36.9% of this
segment reported household incomes in excess of AUD$100,000 per annum. Their
purchases were predominantly at chain retailers where they were influenced by
advertising, promotions and specials and any awards or medals the wines received.
They were also happy to visit independent retailers and use the services of mail order
wine clubs and they were very active in the HORECA channel. These consumers
were not as adventurous as the Connoisseur segment in their wine purchasing and did
not display the same level of connoisseur type behaviour nor interest in the
provenance of their wine, although given the opportunity, they would like to learn
more about wine.

99
No Frills (n = 120, 11.8%)
This segment was gender balanced with the highest representation of consumers over
the age of 45. It had the lowest mean scores on each of the three variables in Table
3.6 indicating little connoisseur type behaviour, knowledge about wine or interest in
the provenance of their wine purchases. Although wine was their alcoholic beverage
of choice, they consumed significantly more spirits, RTDs, Alcopops and cider than
the Connoisseur segment. 28.3% of their wine purchases were under $10 per bottle
and 83.3% under $20 per bottle, indicating their price consciousness. These
consumers had the significantly lowest mean scores for each of the objective and
subjective wine knowledge and wine involvement scales. They purchased the
majority of their wine in chain retailers and were infrequent purchasers at independent
retailers. They purchased the least amount of wine per month of the three segments
and 52.5% of these consumers reported drinking wine less than once per week (data
not shown). This segment was the least educated, with 32.6% reporting a tertiary
education and the health benefits of wine played some part in their purchase decisions.
3.3.6 The economic importance of each segment
The percentage of the sample represented by each segment was identified above. In
order to examine the economic importance of each segment to the Australian market,
their percentage of wine spend was compared to their sample representation (Table
3.7). The Connoisseur segment represented a far greater percentage of the overall
spend on wine than its relative size and the reverse was true for the other two
segments. The data are shown in Figure 3.4.

100
Figure 3.4 Comparison of each segments' relative size and percentage of wine
spend.
0
10
20
30
40
50
60
70
Connoisseur Aspirants No Frills
%
% sample % spend
3.3.7 Correlations between the six wine scale values
The respondents’ scores on objective and subjective wine knowledge, wine
involvement and the three fine wine behaviour variables were calculated as described
above. These scores were subjected to a Pearson correlation in order to test our
hypotheses that the scores would be positively correlated and the resultant correlation
matrix is presented in Table 3.11. All correlations were significant (p< 0.05) and large
(Cohen 1988), with the relationship between the provenance and knowledge scales
being the largest with r = 0.82.

101
Table 3.11 Correlation matrix of the wine related scales/variables
Variables Connoisseur Knowledge Provenance
Wine
Involvement
Subjective
Wine
Knowledge
Objective
Wine
Knowledge
Connoisseur 1 0.75 0.80 0.65 0.64 0.51
Knowledge 1 0.82 0.66 0.62 0.53
Provenance 1 0.67 0.62 0.55
Wine
Involvement 1 0.59 0.54
Subjective
Wine
Knowledge 1 0.58
Objective
Wine
Knowledge 1
All values are different from 0 with a significance level alpha=0.05
3.4 Discussion
This study collected data from 1017 Australian wine drinkers and introduced three
variables that could measure the fine wine consumer behaviour of the respondents.
These variables were used to identify a number of fine wine segments in the market.
Those segments and the subsequent wine consumer behavioural information are
discussed below.
3.4.1 Fine Wine Consumers
This study has added to the body of knowledge about fine wine consumers in response
to a perceived lack of information about such consumers. We asserted that the
popular and academic literature often made mention of fine wine consumers, but
beyond the obvious definition that fine wine consumers were the consumers of fine
wine, no exploration had been made of the wine related behaviours of that class of
consumer. We hypothesised that consumers who exhibited fine wine behavior would
score highly on three variables which we denoted Connoisseur, Knowledge and
Provenance. These three variables were developed from the “connoisseur related”

102
component of the wine related lifestyle methodology described by Johnson and
Bruwer (2003) and explored the importance to the respondents of such issues as; the
rituals associated with consumption of wine; wine storage; reading about wine; being
knowledgeable about wine and increasing that knowledge; and the provenance of the
wine they consumed. We concluded that each of these variables was valid, reliable
and uni - dimensional and were therefore appropriate for use.
Wine involvement and wine knowledge (either objective or subjective) have
previously been used to segment wine consumers (for example, Zaichkowsky 1988,
Lockshin et al. 1997, Hughson & Boakes 2002, Dodd et al. 2005, Lockshin et al.
2006, Perrouty et al. 2006, Johnson & Bastian 2007). Involvement might be described
as an individual’s interest and enthusiasm towards a product or product category
(Zaichkowsky 1985, Goldsmith & Emmett 1991) and that involvement level may be
high or low (Engel & Blackwell 1982). Objective and subjective wine knowledge can
be considered respectively as how much a person actually knows about wine and how
much a person thinks they know about wine (Park & Lessig 1981, Brucks 1985, Raju
et al 1995). These are usually measured by some form of test and a self reported scale
respectively (Raju et al. 1995). It follows logically that unless the information
obtained from these constructs is linked to other data such as socio - demographics,
little sophisticated information might be gleaned about the wine consumers
themselves. On the other hand, information obtained from lifestyle questions based
on Attitudes, Interests and Opinions provide a more detailed, multi dimensional view
of respondents and allow more focussed marketing communications (Plummer 1974).
As the three fine wine variables we used consisted entirely of AIO type statements, it
is appropriate to see what might be learned from examining the behaviour of those

103
consumers who scored highly on all three of those variables, who we have denoted
“Connoisseurs”. We would make the point that these three variables offer an
alternative segmentation base to both wine knowledge and wine involvement and
require little extra effort on behalf of researchers to operationalise. The number of
statements requiring a response if wine involvement and subjective wine knowledge
were used in a questionnaire is ten (Lockshin et al. 1997, Flynn & Goldsmith 1999).
We are suggesting that an additional eight statements and the more sophisticated
analysis and detailed consumer profiling subsequently afforded outweighs the
additional effort in administering the questionnaire.
The Connoisseur consumer segment had significantly higher scores on the three fine
wine variables than the other two segments (Table 3.6) and we would argue that not
only do they share some characteristics with wine connoisseurs, but also differ from
the stereotypical view of those consumers being wine snobs (Miletic 2008). The
profile of these Connoisseur consumers indicates that they are predominantly male
and are quite evenly spread in age, with about 40% of the segment aged less than
thirty five years, which might be considered a departure from the commonly held view
of a connoisseur. They are highly educated and wine knowledgeable with disposable
incomes available to spend on wine. Although price is an important consideration
when they purchase wine, their average price paid per bottle is significantly higher
than other consumers. What also sets them apart from other consumers is their
willingness to take a risk when purchasing wines that they perceive as new, exciting,
different or rare. They frequent specialty wine stores in order to source these rare or
different wines, although they also use supermarket owned chain retailers. It might be
that they use this latter channel to source their preferred commercial wines that might
104
be cheaper, through economies of scale, than at their specialty wine retailer. They are
also willing to seek out recommendations for purchases, especially from trusted wine
writers. Although there is a dearth of studies concentrating on the consumer
behaviour of connoisseurs, some of the behaviours noted above are similar to those of
French cheese connoisseurs described by Roberts and Micken (1996).
These Connoisseur consumers spend significantly more money on wine, purchase
significantly more wine, have significantly more wine stored than any other consumer
and spend above their weight in comparison to the size of their segment and for those
reasons alone, are of great importance to the industry. Also of interest is that about a
third of these consumers are under the age of thirty five and at that age, have clearly
shown that wine is their preferred alcoholic beverage of choice. Given their behaviour
described above, this younger Connoisseur consumer has considerable customer
lifetime value (Kotler et al. 2010) to the wine industry and the segment as a whole
adds great value to the market, not only to wine producers, but also to suppliers of
wine related paraphernalia such as storage facilities. Recent media coverage has
highlighted both the growth of wine consumption in younger drinkers in the United
States (Yadegaran 2010) and strategies to target this younger demographic, including
brands specifically aimed at younger males and another targeting younger females
(Anon 2010, Greenblat 2010). It might be appropriate for the Australian industry to
also specifically target this demographic, given its potential value.
We have demonstrated that our Connoisseur consumer is both wine knowledgeable
and wine involved (Table 3.8), confirming our earlier views. We demonstrated that
the three variables of the FWI used to measure fine wine consumer behaviour were

105
positively correlated with both objective and subjective wine knowledge and wine
involvement. However, given the points made above regarding the more sophisticated
analysis provided by these variables, we would argue that the FWI is not redundant
and provides a novel and valuable segmentation base for the Australian domestic wine
market.
3.4.2 Purchase channels in the Australian domestic wine market
The way that Australians buy wine has undergone a fundamental change in the past
five years, with the market share of independently owned wine retailers eroded by the
supermarket owned chain wine retailers, such as Dan Murphys and 1st Choice. The
former’s share has dropped from 43.4% of purchases in 2005 (Bruwer & Johnson
2005) to 13.8% in this study, while the latter’s has risen from 27.1% in 2007 (Johnson
& Bastian 2007) to 37.6% here. To counteract this surge in sales by the supermarket
owned chains, independent retailers offer a very different retail mix (AWBC 2010) as
a point of difference. This strategy may be working with independent retailers’ target
markets, as the Connoisseurs reported that almost a quarter of their wine purchases
were made through this channel. With their high monthly wine spend, this segment of
consumers is an important one for the independent wine retailers.
The HORECA, or on – premise, channel is another that has seen an erosion in market
share, declining from 22% of purchases in 2007 (Johnson & Bastian 2007) to 14.5% in
this study. The data collection period for the current study was mid to late 2009, at a
time when the impact of the global financial crisis was being felt and this may account
for some of the reported decline (AWU 2009, Dunn 2010). It will be interesting to see
whether this market share increases once the full impact of the global financial crisis
106
has abated. The observations made by Johnson and Bastian (2007) in their
preliminary study in relation to younger female consumers and the HORECA channel
are confirmed in this national study. Female wine consumers under the age of thirty
five purchase a quarter of their wine on premise. Their significantly higher
consumption of light bodied white wine, sparkling red and white wine and Rosé would
confirm that females are the drivers of any likely growth in these on-premise
categories. Those consumption figures would also paint a picture of these younger
females enjoying these styles of wines amongst friends in the on – premise setting,
confirming the earlier findings of Johnson and Bastian (2007).
The younger females’ use of this channel may also present an opportunity for the
industry. Targeted in house tastings or wine education activities might introduce this
demographic to different wine styles or wine regions that might afford greater margins
to producers. For example, McCutcheon et al. (2009) stated that females took more
notice of region of origin when purchasing wines. If a specific region, perhaps one
that was renowned for producing wine styles favoured by these female consumers,
wished to increase awareness of its products, then wine tastings at on – premise
establishments might achieve that aim. Any education activities might also increase
wine knowledge and wine involvement levels and thus move consumers into more
profitable consumer segments. The importance of this demographic to the wine
industry should not be underestimated.
The reluctance of older males to purchase wines through the HORECA channel
reported by Johnson and Bastian (2007) was replicated in this study, with only 10.4%
of wine purchases made through this channel by males over the age of forty five.

107
Johnson and Bastian (2007) hypothesised that the older male age group may have
preferred bring your own wine restaurants rather than those where the only alternative
available was to purchase wine off the wine list. Our data would support that
hypothesis. Older males, especially those in the Connoisseurs segment, had a
significantly higher score than other age groups on the question “I prefer to dine at
bring your own wine restaurants than those with only a wine list” (data not shown). It
would appear that these consumers prefer to consume wines that they have previously
purchased that meet their stylistic and preference needs and were cellared for an
optimum period of time, rather than rely on a restaurant’s wine list offerings. Johnson
and Bastian’s (2007) comments about mark ups charged by restaurants are also
relevant in this situation as are similar comments made by Bruwer and Nam (2010) in
their contemporaneous study. This topic of byo might be an area for future research.
A final observation on the changing nature of the preferred wine purchase channels in
the Australian domestic wine market relates to the growing use of the internet. Both
Bruwer and Johnson (2005) and Johnson and Bastian (2007) reported internet
purchases of wine at less than one percent of all purchases compared to 4.3% in this
study, an increase of about 450% in a relatively short period of time. Males were
significantly higher users of this channel than females and interestingly, males over
the age of thirty five used this channel significantly more than their younger
counterparts. The Connoisseurs reported 7% of their purchases were online. Whilst
this study did not differentiate between online wine retailers, online wine auction sites
and online wine purchases made via a winery’s website, it is reasonable to conclude
that the majority of these purchases would not have been commercial wines available
at most bricks and mortar wine retailers. Rather, these purchases were more likely to

108
have been rarer wines, harder to source and wines that might appeal to highly wine
involved consumers or the Connoisseurs. Bruwer and Wood (2005) concluded that
online wine buyers were predominantly male and well educated and that profile fits
very well with that of our Connoisseurs.
3.4.3 The structure of the Australian domestic wine market
After more than twenty years of research into the Australian domestic wine market,
some structural elements of the market are becoming clearer. An examination of the
relevant literature would indicate that three segments in this market appear to be
stable, irrespective of the segmentation methodology or choice of sample employed by
the various researchers. These segments might be labelled: basic wine drinkers;
knowledgeable wine drinkers; and conservative or traditional wine drinkers.
Segments similar to these were identified in the studies of McKinna (1986), Spawton
(1991 a,b), Hall and Winchester (1999), Bruwer et al. (2002), Johnson and Bruwer
(2003), Bruwer and Li (2007) and Johnson and Bastian (2007). The current study
supports this trend. For example, The Connoisseur segment identified in this study
might equate to McKinna's (1986) "Connoisseurs", Bruwer et al.'s (2002) " Ritual –
oriented conspicuous wine enthusiasts" or Johnson and Bruwer's (2003) "Image
oriented, knowledge seeking wine drinkers". Similarly, the aspirational segment
identified here could equate to Spawton’s (1991a) “Aspirational Wine Drinkers”, the
“Image Concerned” of Hall and Winchester (1999), or the fashion/image oriented
wine drinkers identified by Bruwer et al. (2002). It would therefore appear that these
three segments (however they might be denoted by researchers) form the core of the
Australian domestic wine market, with the size of each core segment and the
identification and size of any non core segments varying depending on the

109
segmentation methodology and choice of sample. For example, a convenience sample
of wine drinkers may provide more consumers in a knowledgeable type segment and
less in a basic segment than a sample drawn through probability sampling, such as that
employed by Jaeger et al. (2009). The importance of these three core segments to the
wine industry should not be underestimated.
Although we argue that there are three stable, core components in the Australian
domestic wine market, we also believe that the individuals in each segment do not
remain static. As an example, an aspirational wine drinker identified in this study may
increase their wine knowledge or wine involvement over time and become more
confident in their wine purchasing abilities. As a result, they may move into the
Connoisseur segment at some time in the future. This movement would alter the
dynamics of both segments and reinforces the importance of continually updating the
intelligence in relation to this market (Johnson & Bruwer 2003; Thomas & Pickering
2003, Bruwer & Li 2007, Hollebeek et al. 2007). A longitudinal study of a cohort of
wine drinkers might reveal motivations and behavioural changes that occur as
consumers move from one market segment to another.
3.5 Study limitations
Although the sample size was large enough to provide meaningful data analysis and
comparisons and was consistent in demographic detail with earlier studies (Johnson &
Bruwer 2003, Johnson & Bastian 2007, Cox 2009), the sample was convenient in
nature and likely to include more wine involved or knowledgeable consumers, as they
would be more likely to undertake a survey about wine. If a true probability sample
were drawn from, for example, a household population (Jaeger et al. 2009), some of

110
the behavioural data may likely have differed. Having said that, we are confident that
the data captured were representative of the Australian wine consumer, as our data
were consistent with previous studies (Johnson & Bruwer 2003, Johnson & Bastian
2007, Cox 2009).
3.6 Conclusion
This study introduced a novel segmentation base (the FWI) for the Australian
domestic wine market and provided up to date information on the state of that market.
It provided insights into an identified consumer segment that scored highly on three
fine wine variables of the FWI, who we denoted the Connoisseur segment. It found
that this male predominant, well educated, highly wine knowledgeable and wine
involved consumer was one willing to spend considerable sums of money on
purchasing wines that they perceived were new, different and exciting. Detailed
knowledge of this consumer segment might provide the industry with intelligence that
would allow more targeted marketing communications with that segment. The
importance of younger consumers in a number of segments was also highlighted and it
was suggested that this demographic might benefit from targeted marketing
approaches.
The channels in which consumers purchase wine have also undergone change over the
last five years. The growing market share of the supermarket owned chain wine
retailers at the expense of independent wine retailers was confirmed, although the
latter channel still retained considerable influence with some important consumer
segments. The on-premise channel was also examined and a downturn in its market

111
share was seen, possibly due to the influence of the global financial crisis. The
reliance on this channel by younger female wine consumers was highlighted.
Although there have been concerns within the industry because of issues like the
supply and demand imbalance and the strength of the Australian dollar against the
currencies of our two largest wine trading partners, this study may provide some
solace. It appears that the domestic wine market is healthy and robust and perhaps
ready for further attention from the industry.
3.7 Acknowledgements
The authors would like to thank the respondents who took their time and effort to
complete the online questionnaire. The University of Adelaide is a member of the
Wine Innovation Cluster (www.wineinnovationcluster.com) Adelaide, South
Australia.

112
Chapter 4 Multidimensional scaling (MDS), cluster
and descriptive analyses provide preliminary insights
into Australian Shiraz wine regional characteristics.
The preceding chapter set the context for the remainder of the research project. An
instrument to measure the fine wine related behaviour of wine consumers was
introduced and the Australian domestic wine market was segmented using that
instrument as the base. Those consumers who scored highly on that scale were
identified and labelled as "Connoisseurs" and their wine purchasing and consumption
behaviours were compared to other segments in the market. Their value to the wine
industry was highlighted.
A further way to investigate any segment's value to the wine industry is to examine the
sensory attributes that drive that segment's liking of a particular wine style. At a
global level, Australia is most closely associated with fruit forward, easy drinking
wines made from the Shiraz grape (DFAT 2009), although there is evidence that
Shiraz wines such as Penfolds Grange and Henschke Hill of Grace are recognised
world wide as two of the finest examples of the variety (Beverland 2004, Fogarty
2006, Wood et al. 2008). Shiraz is the most widely planted red grape variety in
Australia, accounting for 47.7% of red grape production and 26.3% of all grape
production at 30 June 2010 (ABS 2010). At the regional level, the Barossa Valley and
McLaren Vale, two of South Australia’s best known wine regions, revealed Shiraz as
the most purchased and valuable grape variety in 2010, with 71.9% purchased and

113
77.6% of value and 66.9% purchased and 71.2% of value, respectively (Phylloxera
and Grape Industry Board of SA 2010). Therefore the importance of the Shiraz grape
variety to the Australian wine industry cannot be ignored.
In 2007, the Australian wine industry adopted a four tier wine brand segmentation
strategy. One of these segments was entitled “Regional Heroes” and the wines within
this segment were defined as … “Wines from somewhere rather than wines from
anywhere -adding and sustaining interest for consumers by fostering a clear
association between region and variety and/or style” (WFA, AWBC 2007: 13). It was
this definition that influenced this part of the research project.
The following chapter introduces the first of the sensory components of the research
project. The literature review highlighted the lack of any work that examined the
perceived regional differences between Australia's Shiraz producing regions, although
this is a generally accepted premise in the popular wine press and amongst wine
producers and wine consumers.
This chapter provides a preliminary examination of those perceived regional
differences and also identifies the sensory attributes that significantly differentiate the
Shiraz wines from a number of Australian Shiraz producing regions.
This chapter was accepted for publication by Food, Quality and Preference on
21/3/2013 and that version is provided at Appendix 4.

114
Multidimensional scaling (MDS), cluster and
descriptive analyses provide preliminary insights into
Australian Shiraz wine regional characteristics.
TRENT E. JOHNSON1, ANNE HASTED2, RENATA RISTIC1 and
SUSAN E.P. BASTIAN1*
1Wine Science and Wine Business Group, The University of Adelaide, Waite Campus,
PMB 1, Glen Osmond, SA, 5064, Australia
2 Qi Statistics, Ruscombe, Reading, UK
*Corresponding author: Dr Susan Bastian, phone +61 8 8303 6647,
facsimile +61 8 8303 7116, email [email protected]
Key Words: Australian Shiraz, cluster analysis, Descriptive Analysis,
multidimensional scaling, sorting tasks, wine experts.
Running title: Australian Shiraz regional characteristics

Abstract
Much has been written in the popular wine press about the various sensory properties
of Australian Shiraz produced from different regions. This study had an objective of
exploring whether wine experts would group Shiraz wines from the same region
together, following ortho and retro nasal assessments of the wines. A cohort of wine
experts and a trained Descriptive Analysis (DA) panel undertook sensory analysis of
29 Shiraz wines sourced from 10 delimited Australian wine producing regions, plus a
multi-regional blended Australian Shiraz and a Northern Rhone Syrah. The expert
panel undertook sorting tasks based on their ortho and retro nasal assessment of the
wines. Multidimensional scaling (MDS) of the resultant data provided a 3
dimensional solution that included many attributes commonly associated with
Australian Shiraz. Cluster analysis of the MDS and DA data revealed that at least 2
wines from Canberra, Langhorne Creek, Coonawarra, McLaren Vale, Barossa Valley
and Great Western were grouped together. Although wines from the same region may
have shared similar sensory attributes, the more diverse the region in terms of
geography and meso-climate, the more difficult it was to determine those common
sensory attributes. This is the first study to attempt to define the sensory attributes of a
number of delimited Australian Shiraz producing regions. The data suggested that
there were some sensory similarities between wines from the same region but other
factors impact the sensory profile, so to determine regional Shiraz characters more
extensive research using these techniques and wines made under controlled conditions
would be required.

116
Abbreviations
AWBC = Australian Wine and Brandy Corporation
AWRI = Australian Wine Research Institute
ABS = Australian Bureau of Statistics
DFAT = Department of Foreign Affairs and Trade
INAO = Institut National des Appellations d’Origine
WFA = Winemakers’ Federation of Australia

117
4.1 Introduction
One of the challenges currently confronting the Australian wine industry is the
perceived “commoditisation” of Australian wine. This refers to the success of
Australia’s commercial wine brands, such as Jacob’s Creek and Yellowtail, in export
markets and the resultant fear that all Australian wine might be stereotyped as such
(for example, see Walton 2006, Apstein 2007, The Economist 2008, Colman 2009,
Foley 2009, Gargett 2009, WFA et al. 2009). These commercial brands are the
“Brand Champions” segment that are described in the Strategy 2025 document as ...
“wines that appeal to a broad market base through accessibility, ease of enjoyment and
a strong premium brand message about product and country” (WFA, AWBC 2007:
13). Influential Australian wine industry figures Brian Croser (Croser 2005) and the
late Len Evans (Robinson 2006) state that Australia produces two types of wine –
commercial wine referred to above and high quality, fine wines that display regional
characteristics. Importantly, they also argued that there is a place in all wine markets
for both types of Australian wine but the challenge for the Australian wine industry is
to have both types of wine realised and accepted by those markets.
The strategy to encourage consumers to “trade up” to higher quality Australian wine is
specifically addressed under the “Influencing the Consumer” strategic response
(WFA, AWBC 2007: 14) and is a tactic to overcome this perceived commoditisation.
The Australian wine industry must be recognised around the globe as a producer of
regionally distinct fine wines if that trade up is to occur. Wine Australia has recently
commenced a program of showcasing Australia’s “Regional Heroes” in various
markets (AWBC 2009).

118
At a global level, Australia is most closely associated with fruit forward, easy drinking
wines made from the Shiraz grape (DFAT 2009). Shiraz is the most widely planted
red grape variety in Australia, accounting for 43.7% of red grape plantings and 25.8%
of all grape plantings (ABS 2009). The importance of the Shiraz variety to the
Australian wine industry, Australia’s international reputation for production of Shiraz
based wines and the international push to introduce global markets to Australia’s
regional wines (including Shiraz) underpinned this study.
4.1.1 Wine regionality and typicality
The General Agreement on Tariffs and Trade (GATT) defines geographical
indications as … “ indications which identify a good as originating in the territory of a
[m]ember [country], or a region or locality in that territory, where a given quality,
reputation or other characteristic of the good is essentially attributable to its
geographical origin” (GATT 1994). A well known wine example of a geographical
indication is the French appellation d’origine côntrolée (Barham 2003). The
Australian wine industry has adopted a formal Geographical Indication (GI) system
whose primary purpose is to protect the regional name under international law and
ensures that a wine that carries a GI name contains 85% of fruit from that region
(Iland and Gago, 2002). A map of Australia's GIs is available at the Wine Australia
website, www.wineaustralia.com (Wine Australia, 2012). Wine Australia (2009)
defines a GI for wine as one that “identifies the wine as originating in a region or
locality where a given quality, reputation or other characteristics of the wine is
essentially attributable to the geographical origin”. Inherent in this definition is that
an Australian wine produced from a designated GI should possess unique
characteristics associated with that region of origin and showcase the varietal

119
characters of the wine, rather than external influences such as winemaking
intervention (Parr et al. 2007). This should infer unique sensory characteristics in
these wines compared to similar products from other regions of origin (Ballester et al.
2005). Intrinsic to this discussion is the concept of a typical wine from a particular
region. Maitre et al. (2010) stated that a wine is typical ... "if some of its own
characteristics can be identified and make it recognizable as belonging to a type and
distinctive from others". Giraud (2003, 2004) (cited in Maitre et al. 2010) argued that
the distinctiveness of a product can be related to its geographic origins. A number of
studies have examined wine typicality using a variety of panellists including experts
and/or trained judges (for example Ballester et al. 2005, 2008, Perrin & Pages 2009,
Parr et al. 2009). Ballester et al. (2005) did not use the word typical in their
experiment, due to the lack of an appropriate definition and adopting that procedure
here, we chose to inform our judges that the wines were commercially produced
Shiraz wines.
4.1.2 The use of expert panellists
Sauvageot (1994) argued that judgements about a product’s typicality should lie in the
hands of those with some expertise of that product. The use of wine experts in wine
sensory related research has been well documented (for example, Melcher & Schooler
1996, Bende & Nordin 1997, Parr et al. 2002, Parr et al. 2004, Zamora & Guirao 2004,
Ballester et al. 2005, Parr et al. 2007, Perrin et al. 2007, Ballester et al. 2008, Preston
et al. 2008). The experts' and trained panellists’ performance in a variety of sensory
based tasks has sometimes been found to be comparable(Cartier et al. 2006, Preston et
al. 2008, Ballester et al. 2009, Langlois et al. 2011). Wine professionals hold
particular knowledge about wines and production techniques from specific regions of

120
origin (Hughson & Boakes 2001, Perrin et al. 2007). Experts are recognised as such
by their industry and peers and are not required to take a test to demonstrate their
skills (Sauvageot et al. 2006). More specifically, Parr et al. (2002) suggested that a
wine expert should meet one or more of the following criteria: (1) Established
winemaker; (2) Wine science researchers and teaching staff regularly involved in
winemaking and/or wine evaluation; (3) Wine professionals (e.g. Masters of Wine,
wine judges, wine writers, wine retailers); (4) Graduate students in Viticulture and
Oenology who had relevant professional experience (e.g. had participated in one
vintage; had run wine tasting classes); and (5) Persons with extensive (>10 years)
history of wine involvement (i.e. family history, extensive wine cellar, regular
involvement in formal wine tasting).
With the repeated exposure in their professional lives to the Australian Shiraz wine
category, Australian wine experts refine and adjust their classification systems in
respect of that category and are therefore ideal candidates to undertake this research
study (Solomon 1997, Hughson & Boakes 2002, Ballester et al. 2005).
4.1.3 Sorting Tasks and Multidimensional scaling (MDS)
As early as 1968, the combination of a sorting task and multivariate data analysis
using multidimensional scaling was used in the field of psychology (Rosenberg et al.
1968). However, Lawless (1989) was the first to apply these techniques in the study
of olfaction. He argued that sorting tasks, where judges formed groups of products
based on their similarity of odour, were simpler and less fatiguing than pairwise
comparisons. The number of times a pair of stimuli was grouped together was
counted and this data formed a similarity matrix. This matrix was then subjected to

121
MDS. MDS analysis of such a matrix produces a map where two products that were
often sorted together appear close together and those that were rarely sorted together
appear far apart on that map (Abdi et al. 2007). Lawless (1989) concluded that MDS
provided solutions that were interpretable and reasonable, but the complexity of the
solutions was dependent upon the instructions provided to the judges about the
number of permitted groups.
Piombino et al. (2004) found that the sorting task was an effective and quick way to
compare a large number of products and also concluded that with more judges, the
resultant groups of products were more stable. However, MDS in itself does not
characterise the products being sorted and complementary DA would provide that
detailed product information (Pages 2005, Perrin et al. 2008). The literature would
therefore indicate that a sorting task followed by MDS analysis is an appropriate
methodology to determine which products are perceived by judges as similar (and by
extension, dissimilar).
4.1.4 Study Purpose
There is anecdotal evidence that wines from various regions may be identified by
specific sensory attributes. For example, Dijkstra (2009) argued that Shiraz wines
from the Barossa Valley possess dark berry and dark chocolate characters compared to
the red berry, black pepper and spice characters noted in McLaren Vale Shiraz wines.
Given the strategy to showcase Australia’s regionally distinct and unique wines and
that no rigorous examination of any perceived regional differences in Australian
Shiraz has been previously attempted, the aim of the study was to have a number of
Australian wine experts undertake a series of sorting tasks on commercial Shiraz wine

122
sourced from 10 Australian Shiraz producing regions. We hypothesised that if there
were wines with similar attributes present then it was likely that those wines would be
sorted together. We also hypothesised that some wines from the same region were
likely to be sorted together because of the presence of some distinct regional
characteristics. Descriptive analysis (DA) of the wines would provide quantitative
sensory measures of the differences between the wines (Stone et al. 1974). By
integrating the results from the two distinct types of sensory analyses, we would
attempt to identify the attributes that brought about the perceived similarities in the
wines. We were also interested in comparing the outcomes of the two types of
sensory analysis.
4.2 Materials and Methods
4.2.1 Wines
In conjunction with noted Australian winemaker and wine judge, Brian Croser, the
authors selected 10 GIs that represented the breadth of Shiraz wines produced in
Australia. The nine GIs and sub – region GI were respectively: Barossa Valley, Clare
Valley, McLaren Vale, Langhorne Creek, Coonawarra (South Australia); Heathcote
and Great Western (Victoria); Hunter Valley (New South Wales); Canberra District
(Australian Capital Territory and New South Wales); and Frankland River sub –
region of the Great Southern GI (Western Australia). The authors and Croser, with the
assistance of wine experts within each region, produced a short list of wines which
they all believed were representative or typical of the Shiraz wines of each region.
Twenty nine wines were secured, with three from each region (with the exception of
Hunter Valley, Heathcote and Great Southern which only had two wines), across price

123
points ranging from commercial type wines (approximately AUD$15 retail) through to
wines priced in excess of AUD$50, as well as one iconic Shiraz wine (from the
Northern Rhone) and one multi regional wine. The availability of current release
wines meant that the wines were not all from the same vintage. Table 4.1 provides
details of these wines. Each wine was sampled and chemically analysed in triplicate
for pH, levels of titratable acidity (TA, g/L), residual sugar (RS, g/L) by the Rebelein
method, volatile acidity (VA, g/L expressed as acetic acid) and total phenolics (Iland
et al. 2004). Alcohol (%v/v) was determined using the Wine analysis system
Alcolyzer Wine (Anton Paar, Graz, Austria). In addition, 24 of the 29 wines (due to
sample volume constraints) were tested by the Australian Wine Research Institute
(Adelaide, Australia) for the presence of the “Brettanomyces” character compounds,
4-ethylguaiacol (4-EG) and 4-ethylphenol (4-EP), using Liquid/Liquid extraction
combined with stable isotope dilution analysis (SIDA) ( d4 – 4EP which was
synthesized in-house at AWRI), Gas Chromatography-Mass Spectrometry (GC-MS)
analysis.
Table 4.1 Geographical Indication, vintage and expert score details of the 29
wines used in the study.
Wine
Code
Vintage Experts’
Hedonic
(Liking) Score
Experts’
Technical
Quality Score
MJT † RRP‡
BV1 2005 5.7 ab 15.8 ab 21.2 30 BV2
¶ 2005 4.4 abc 15.1 abc 21.2 75
BV3 2005 5.7 ab 15.6 ab 21.2 14
CA1 2006 5.9 ab 15.8 ab 23.5 27
CA2 2006 4.9 abc 15.2 abc 23.5 25
CA3 2006 5.4 abc 15.3 ab 23.5 46
CO1 2004 5.1 abc 15.6 ab 16.4 28
CO2 2005 5.6 ab 15.7 ab 19.4 45
CO3 2005 5.2 abc 15.3 ab 19.4 38
COM 2005 5.8 ab 15.7 ab 22.5 13
CV1 2006 5.9 ab 15.8 ab 25.4 16

124
Wine
Code
Vintage Experts’
Hedonic
(Liking) Score
Experts’
Technical
Quality Score
MJT † RRP‡
CV2 2004 3.9 bc 14.9 abc 19.0 25
CV3 2004 4.9 abc 15.2 abc 19.0 60
GS1 2005 5.2 abc 15.5 abc 20.5 17
GS2 2005 4.0 bc 14.3 bc 20.5 39 GW1
§ 2004 5.9 ab 15.7 ab 16.7 25
GW2 2004 5.4 abc 15.6 ab 16.7 45 GW3
§ 2004 4.6 abc 14.8 abc 16.7 50
HE1 2006 5.6 ab 15.6 ab 23.8 17 HE2
¶ 2004 5.0 abc 15.2 abc 19.1 27
HV1 2006 5.3 abc 15.3 ab 25.2 70
HV2 2006 3.1 c 13.7 c 25.2 22 IC
¶ 2003 3.8 bc 14.3 bc 21.6* 135
LC1¶ 2006 4.9 abc 15.5 ab 17.1 45
LC2 2006 5.8 ab 16.0 a 20.5 19
LC3 2006 5.6 ab 15.6 ab 20.5 45
MV1 2005 4.2 abc 14.7 abc 21.1 55
MV2 2006 6.5 a 16.0 a 21.4 20
MV3 2005 5.5 ab 15.6 ab 21.1 28 Where BV = Barossa Valley, CV = Clare Valley; IC = Icon; COM = Commercial, multi-regional wine; HE = Heathcote; GS = Great Southern (West Australia); GW = Great Western (Victoria); HV = Hunter Valley; CA = Canberra District; CO = Coonawarra; MV = McLaren Vale; LC = Langhorne Creek. The number following the initials is the unique identifier of the wine from that region. † MJT = Mean January Temperature; ‡ RRP = Recommended Retail Price in $AUD; ¶Wines were not donated; §
Wines were discounted. Values sharing a letter within a column are not significantly different (one way ANOVA, p < 0.05, Tukey’s HSD). *this value represents the Mean July Temperature as the wine was from the northern hemisphere.
4.2.2 Expert Panellists
Twenty two wine experts (13 males and 9 females), including winemakers, Masters of
Wine, wine writers, academic wine researchers, fine wine retailers and post graduate
oenology students, all of whom met some or all of the criteria detailed in Parr et al.
(2002) agreed to participate in the experiment. Their ages ranged from 24 to 60 and
the average length of time working in the wine industry by the panel was 14.7 years
and 90% of panellists had received tertiary wine training.

125
4.2.3 Sorting tasks
Due to logistical considerations, the experiment was split into two sessions, held two
weeks apart in the winter of 2008. Thirteen experts participated in the first session
and nine in the second.
Bottled wines were stored at 15ºC and 75% humidity and allowed to equilibrate at
room temperature for 24 hours before tasting. The study was interested in the
orthonasal and retronasal attributes of Shiraz wines from different regions. It has been
previously demonstrated that the colour of a wine can influence the perception of the
wine's other sensory attributes (Morrot et al. 2001, Parr et al. 2003). The wines in this
study were from different vintages due to what was commercially available and thus
were likely to have different hues. Therefore, it was an appropriate assumption that
the wine experts would have picked up on these colour cues with a subsequent
influence of their assessment of the other sensory attributes. The decision was
therefore taken to use black glasses to remove the colour cue, so that the wine experts
could primarily focus on the orthonasal and retronasal attributes. After the authors
verified through orthonasal assessment that each wine was free of cork taint, thirty ml
was poured into black INAO approved tasting glasses coded with three digit random
numbers, covered with a Petri dish and presented to each of the experts in a
randomised, balanced block design that took account of first order carry over effects
(Macfie et al. 1989). Testing was conducted in an open plan sensory laboratory.
The first assignment that the experts undertook was an orthonasal assessment of the
wines. Each expert was required to smell each wine once in the order presented and
was permitted to make notes during that process. They were then allowed to smell the

126
samples as many times as they liked and in any order, so as to sort the wines into as
many groups as they wished, based on the wines’ odour similarity. Each group could
contain as many wines as the experts felt appropriate. Therefore, the minimum
number of groups was 1 and the maximum 29. They were not permitted to discuss
their choices with other panellists. The experts were encouraged to write a few words
to describe the odour similarity of each group (Ballester et al. 2008). The only other
information provided was that all wines were made from the Shiraz grape variety
(Ballester et al. 2005).
After a 90 minute break following the first session, the second assignment was a
retronasal assessment of the wines. The order of orthonasal followed by retronasal
assessment is appropriate when using expert judges (Parr et al. 2007). The wines were
re-presented with the same codes in a second random order and tasted in the same
black glasses as during orthonasal assessment. During the experts’ initial assessment
of each wine, they were requested to provide brief tasting notes and both a hedonic
and a technical quality rating of the wine. As colour could not be rated, each wine
received uniformly the maximum of 3 points for colour in context of the technical
quality assessment. The hedonic and technical quality assessments were included to
see whether either influenced the sorting task (Ballester et al. 2008) as conceivably, a
wine that is well made and has Shiraz varietal characteristics, may not be a style that is
liked by all the experts (Parr et al. 2007). The hedonic rating was scored on a 9-point
hedonic scale, indented at both ends and anchored at 1 by “Don’t like the wine at all”,
at 5 by “Neither like nor dislike the wine” and at 9 by “Like the wine very much”.
The experts rated each wine by placing a vertical mark on the scale. The technical
quality of each wine was scored out of 20 according to the Australian wine show

127
judging system, where 3 points were awarded for colour, 7 for aroma and 10 for palate
and overall impression of the wine (Iland et al. 2009, p. 97), with the judges told to
score each wine a maximum of 3 for colour. The experts then grouped the wines
according to their retronasal similarities and were asked to provide a few words to
describe each group. They were provided with filtered water and unsalted cracker
biscuits in order to regularly cleanse their palates during the assessment. The experts
were required to expectorate the wines during the retro nasal assessment.
4.2.4 Descriptive analysis of 29 Shiraz wines
A descriptive analysis (DA) was performed to define the sensory profiles of each
wine. The wines were evaluated in winter 2008 by a panel of 9 people (2 females and
7 males, aged between 22 and 48 years). The panellists were University of Adelaide
students enrolled in oenology and viticulture programs. Prior to formal DA training,
the panellists had approximately 25 hours of training in aroma and taste detection,
identification and discrimination, sensory evaluation, ranking and quality rating in
wine. Although the panellists had good levels of wine evaluation abilities, none had
any previous experience with DA.
A further 20 hours of training was held over an eight week period during which the
panellists evaluated each of the 29 wines at least once. Thirty ml of each wine was
served in coded, covered INAO 215 ml tasting glasses and the panellists were asked to
individually generate and then reach panel consensus on appropriate descriptive terms
that differentiated the wines. Since the wines in this study were also part of a
consumer trial distinct from this research, out of necessity the wines in the DA were
analysed in clear glasses to generate overall sensory profiles. As the DA panel were

128
trained to be objective in the assessment of all the attributes, we were confident that
the influence of wine colour on the panellists’ assessment of other attributes would be
minimised as far as practicable. This training familiarised the judges with both those
descriptive terms and their respective intensities. The descriptive terms agreed upon
included; two colour, thirteen aroma, five flavour (where flavour is defined as
retronasal aroma), one taste, three mouth feel and one after taste, attributes. The
panellists practiced rating the wines’ attributes using the protocol outlined in Bastian
et al. (2010). The wines’ sensory attributes were measured using an unstructured 15
cm line scale with indented end anchor points of “low” and “high” intensity placed at
10% and 90% of the scale, respectively and a mid-line anchor point of “medium”.
These scales were identical to those used in the subsequent formal tasting session.
Aroma intensity rating standards (high intensity = a 1 in 4 dilution, medium intensity
= a 1 in 8 dilution and low intensity = a 1 in 40 dilution of raspberry cordial,
respectively, Cottee’s Cordials, Australia) were provided at each session as an
intensity rating aid. Aroma reference standards were prepared in 40 ml of the same
batch of cask Shiraz wine from South Eastern Australia in covered wine tasting
glasses. Colour swatches and mouth feel touch standards, consisting of a range of
fabric and sand paper samples were presented to panellists at each session and were
modified in response to panellists’ feedback, to produce a final set of attribute
reference standards that were provided at each formal evaluation session (Table 4.2).
Panel performance was evaluated over the last three training sessions by having each
panellist assess a 5 wine sub sample of the 29 wines in triplicate. These data were
analysed by ANOVA using PanelCheck (Nofima Mat and DTU – Informatics and
Mathematical Modelling, Norway) and SENPAQ (Qi Statistics, UK) and the panellist
by sample interactions monitored. Panellists underwent more training in any attributes

129
with significant panellist by sample interactions and when these interactions were
minimised, the panel commenced final evaluation of the samples.
Prior to the first formal assessment session, the panel was informed of the assessment
protocol. Four, 3 hour formal rating sessions were conducted in a temperature
controlled sensory lab with 9 individual booths under fluorescent light which had a
light temperature of 6500oK. At the first 3 formal sessions, each panellist was
presented with and individually assessed 22 wines and at the last session, 21 wines.
These wines were presented monadically over 4 flights per session, with an enforced
break of one minute between each wine and five minutes between each flight. Each
wine was evaluated in a randomised presentation order balanced for carry over effects
and in triplicate over the course of the formal rating period. Thirty ml wine samples
were presented in coded, clear INAO approved 215 ml tasting glasses covered with
small plastic Petri dishes. Distilled water and unsalted crackers were provided for
palate cleansing. At the beginning of each session, panellists familiarised themselves
with the reference and intensity standards and had free access to these outside their
booths during the rating period if required. During all training and formal assessment
sessions, the panellists were required to expectorate the wines.
Table 4.2 Colour, aroma and palate vocabulary generated by the DA panel, with agreed definitions and reference standards of the significant attributes.
Attribute Definition
Colour Colour Intensity
Depth of colour from light plum to dark plum/opaque (colour patches provided)
Orthonasal Aroma
Overall Aroma Intensity Overall intensity of the nose ranging from weak to strong Dark fruit Any dark skinned fruit including, blackberry, blueberry,
blackcurrant, plum, dark cherry etc. (1 blackberry, 2

130
Attribute Definition
blueberries, 1 black cherry, 6 black currants, all frozen and mashed)
Green All green attributes such as eucalyptus, mint, menthol, green capsicum. Low to high intensity ½ cm
2 frozen
green capsicum mashed + pinch dried mint + 1 drop of 0.001% solution of eucalyptus oil (Bosisto’s Eucalyptus Oil, Felton Grimwade & Bosisto’s Pty Ltd. Oakleigh South Vic, 3167)
Oak - vanilla Low to high intensity 0.5 g each medium toast French and American oak (O.C. Inc. Piketon, OH, 45661) + 2 drops vanilla essence (Queen Fine Foods Pty Ltd, Alderley QLD 4051)
Oak - coconut Low to high intensity 0.5 g each medium toast French and American oak (O.C. Inc. Piketon, OH, 45661) + 1 drop coconut essence (Queen Fine Foods Pty Ltd, Alderley QLD 4051)
Chocolate Low to high intensity ½ square Lindt 75% and 50% cocoa chocolate bar melted in wine
Savoury ½ cm3 bacon + ½ cm3 salami + 1 cm2 piece of mulch
Retronasal Aroma Overall flavour intensity Low to high intensity Sweet fruit Low to high intensity (1/8 red plum cut into 4 pieces =
high intensity) Dark fruit Low to high intensity (1 blackberry, 2 blueberries, 1 black
cherry, 6 black currants, all frozen and mashed) Oak Low to high intensity presence of any oak perceived on
the palate
Taste Acid Low to high 1.5g/L Citric acid in distilled water
Mouthfeel Tannin Fine grained to coarse grained tannin (touch standards
provided) Alcohol Low to high warmth on the palate (5ml Bacardi rum) Body Light bodied Shiraz to full bodied Shiraz.
Aftertaste Length – the length of time the wine was experienced after expectoration
Short to long 0-20secs = short; 21 – 59 medium to long; >60secs = very long
Unless otherwise stipulated, all standards were presented in 40ml of a 2 Litre cask Shiraz wine (South Eastern Australia).

131
4.2.5 Statistical analyses
The study data were analysed with a combination of descriptive techniques, Student’s
t test and correlation analyses. The expert sorting data underwent multidimensional
scaling and Agglomerative Hierarchical Cluster (AHC) analyses using XLSTAT
Version 2009.1.01 (Addinsoft SARL, France) and INDSCAL using SPSS 15.0 (SPSS
Inc. 2004). The hedonic and technical quality data underwent one way ANOVA using
XLSTAT Version 2009.1.01 (Addinsoft SARL, France), with Tukey HSD post hoc
test where p < 0.05 was considered significant. Partial least squares regression was
performed using XLSTAT Version 2009.1.01 (Addinsoft SARL, France). The
presentation orders for the wines were generated by Design Express Version 1.6 (Qi
Statistics, UK). For the DA, a mixed model two-way ANOVA with assessors as
random and samples as fixed factor effects was used, with Fisher’s LSD post-hoc test
where P< 0.05 was considered significant using SENPAQ version 4.3 (Qi Statistics,
UK) and PanelCheck (Nofima Mat and DTU – Informatics and Mathematical
Modelling, Norway). The mean panel data generated by SENPAQ then underwent
Principal Component Analysis (PCA) using XLSTAT Version 2009.1.01 (Addinsoft
SARL, France).
4.3 Results
4.3.1 Chemical composition of the wines
The 29 Shiraz wines underwent standard chemical analyses and 24 of the wines were
tested for the presence of 4-EG and 4-EP. The resultant data were subjected to
Principal Component Analysis (PCA) and the results are presented in Figure 4.1. The
first two Principal Components (PCs) accounted for 50.3% of the variation in the data.

132
Since the expert panel did not detect any Brettanomyces character in the five wines not
chemically tested for 4-EG and 4-EP, the assumption was made that there were no
detectable levels of these compounds in those wines for the PCA analysis. PC1 was
positively driven by 4EP/4EG and to a lesser extent VA, and negatively by ethanol
and RS. PC2 was associated with pH and RS opposed to TA. Wine GS2 was shown
to have high levels of both 4EG and 4EP, at levels of ethylphenols that would be
considered a Brettanomyces taint (Chatonnet et al. 1992). Wine COM showed both
high RS and pH; wine CO3 was high in TA; LC2 had high pH; wine GW2 was high in
VA and CV2 in ethanol and TA. The majority of the other wines were positioned
closer to the origin of the PCA bi - plot, indicating that their wine chemistry profiles
were similar to each other (Figure 4.1).

133
Figure 4.1 PCA plot of the 29 wine's chemical data with wine bi - plot scores also projected.
4.3.2 Experts’ Hedonic (Liking) and Technical Quality Ratings
The experts’ hedonic range of scores was 3.05 to 6.5. An AUD$20 wine from
McLaren Vale (MV2) was the most liked wine and an AUD$20 wine from the Hunter
Valley (HV2) was the least liked wine (Table 4.1) and was liked significantly less than
12 wines. The experts’ quality scores ranged between 13.7 and 15.98. Fifteen of the
Variables (axes F1 and F2: 50.29 %)
pH
TA
Ethanol
VA
RS
Total Phenolics
4EG
4EP
MV3
MV2
MV1
LC3
LC2
LC1
IC
HV2
HV1
HE1
HE2
GW3
GW2
GW1
GS2
GS1
CV3
CV2
CV1
COM
CO3
CO2
CO1
CA3
CA2
CA1 BV3 BV2
BV1
-0.75
-0.5
-0.25
0
0.25
0.5
0.75
1
1.25
-0.75 -0.5 -0.25 0 0.25 0.5 0.75 1 1.25
F1 (29.07 %)
F2 (
21.2
2 %
)

134
wines, or 52%, achieved scores that equated to a bronze medal in the Australian wine
judging system (15.5 out of 20, Iland et al. 2009). The highest and lowest scoring
wines were a reflection of the hedonic ratings (MV2 and HV2, respectively). In fact,
the bottom 7 wines in both rating scales were identical (although some rank orders had
changed). Given that the rank orders for both the experts’ liking and technical quality
scores were similar, the Co-efficient of Determination was calculated and returned an
R2 of 0.89 (p<0.0001).
4.3.3 MDS Analysis
The data from the ortho nasal and retro nasal assessments of the two panels were
placed in a similarity matrix, where the entry in cell (i, j) represented the number of
times the wine in row i was paired with the wine in column j. The data in the four
matrices were transformed into four dissimilarity matrices and subjected to INDSCAL
analysis. This analysis revealed that the data from the four matrices were not
dissimilar and could therefore be aggregated. The MDS analysis was repeated on the
aggregated data and a three dimensional solution returned a stress figure of 0.197,
meaning that the solution was acceptable (Kruskal 1964).
Labels for each of the dimensions had to be established. For each wine that loaded
positively onto a dimension, the tasting notes provided by the experts were examined
to see if any particular attributes were recurring in relation to that dimension. In
particular, the three layers of the Aroma Wheel© (Noble et al. 1984) were used as a
template to identify those attributes. This analysis revealed that there was a fruit
element associated with two of the dimensions and that a strong secondary
characteristic was also present in each dimension. Using an analysis of the frequency

135
of terms associated with each dimension, the following labels were assigned to the
three dimensions: Blackberry, plum, pepper and spice (BPPS); Herbal, vanilla, cedar
and berry jam (HVCBJ) and Earthy, savoury, dusty and meaty (ESDM). For this latter
description many of the experts noted microbiological elements that they perceived as
the presence of Brettanomyces in the wines that loaded positively on that dimension.
Examination of the pairwise bi-plots of the 3 dimensions (Figures 4.2A and 4.2B)
revealed some wines from a single region occupied similar space on the plot,
indicating that there were perceived similarities between these wines (Abdi et al.
2007). Wines from LC, two from CO and CA were perceived as HVCBJ driven,
whilst CO, CA and two of the GW wines displayed more BPPS characters (Figure
4.2A). Wines from MV all displayed similar BPPS and HVCBJ characters (Figure
4.2A), but were distinguished by their ESDM attributes (Figure 4.2B). HV wines had
similar HVCBJ characters and were differentiated by both BPPS and ESDM attributes
(Figure 4.2B). The wines from the remaining regions (HE, CV, GS and BV) were not
grouped together by this process and were thus differentiated across all three
dimensions, appearing in different quadrants of the plots (Figures 4.2A and 4.2B).

136
Figure 4.2 Three dimensional MDS solution of the 29 sorted wines (A =
dimensions 1 and 2 – Blackberry, plum, pepper and spice; and Herbal,
vanilla, cedar and berry jam; B = dimensions 1 and 3 – Blackberry,
plum, pepper and spice; and Earthy, savoury, dusty and meaty).
Clusters identified by AHC (Table 4.3A) are circled and labelled C 1-
C5
BV3
LC3
CV2
LC2
IC
BV1
GW3
HV1
HV2
LC1
CV1
MV2
CA3
MV1
GS1
CO3
COM
GW1
CO1
MV3
CO2
GW2
CA2
CA1 GS2
HE2
HE1
CV3 BV2
-0.8
-0.6
-0.4
-0.2
0
0.2
0.4
0.6
0.8
-0.8 -0.6 -0.4 -0.2 0 0.2 0.4 0.6 0.8 1
Blackberry, plum, pepper & spice Herb
al,
va
nil
la,
ced
ar
& b
err
y j
am
fru
it
C1
C2 C3
C4
C5
A

137
The wines are denoted by filled boxes and the notations are detailed in Table 4.1. Wines BV3 and CO3 had
identical co-ordinates in the 2ndand 3rd dimensions and could not be separated on the pair wise bi-plot of those two
dimensions.
To further interpret the MDS analysis, the aggregated MDS matrix only was subjected
to agglomerative hierarchical cluster (AHC) analysis, using an unweighted pair-group
average agglomeration method with automatic truncation. The resultant five clusters
(C1 – C 5) are shown in Table 4.3A and the wines from each cluster are circled in
Figures 4.2A and 4.2B. Of the 5 distinct groups identified in the AHC, 4 groups
contained at least two wines that originated from single wine regions. Wines in
Cluster 1 (including BV and GW wines) were BPPS driven and differentiated by
lower HVCBJ and diverse ESDM characters. Cluster 2 wines, predominantly from LC
and MV regions, had moderate to high HVCBJ and lower ESDM profiles and
differentiated by their lower BPPS. CA & CO wines in Clusters 3 and 4 were similar,
with higher BPPS and HVCBJ but lower ESDM characters. The fifth cluster
consisted of seven disparate wines that were not rated highly on either the hedonic or
BV3 LC3
CV2
LC2
IC
BV1
GW3
HV1
HV2
LC1
CV1
MV2
CA3
MV1
GS1
CO3
COM GW1
CO1
MV3
CO2
GW2
CA2 CA1
GS2 HE2
HE1
CV3
BV2
-0.8
-0.6
-0.4
-0.2
0
0.2
0.4
0.6
0.8
-0.8 -0.6 -0.4 -0.2 0 0.2 0.4 0.6 0.8 1
Blackberry, plum, pepper & spice
Eart
hy
, sa
vo
ury
, d
usty
& m
ea
ty
C1
C4
C3
C5
C2
B

138
technical quality scales and were perceived as having high ESDM characters, with low
to moderate BPPS and a range of HVCBJ characters. These wines were the bottom
scoring wines in both the hedonic and technical quality ratings of the experts,
however, the cluster was generated independently of those ratings. In contrast, the
better performing wines on the hedonic and technical quality scales showed a range of
BPPS and HVCBJ characters, but notably, were all perceived as low in the ESDM
attributes. ANOVA between the clusters for technical quality ratings revealed no
statistical difference between C1 to C4, but that C5 obtained a significantly lower
technical quality score compared to all other clusters (p<0.0001, data not shown).
Table 4.3 Cluster analysis results of the 27 wines based on the sorting task and
DA panel consensus data.
COM and IC were excluded as only one wine was representing a region
The data from the three dimensional solution were added to the hedonic and technical
quality ratings and two additional sets of data were created for each wine. The Mean
All 3 wines of the region in the same cluster
2 wines of the region in the same cluster
1 wine of the region in the same cluster
Sorting task data Cluster 1 BV2, BV3; GW1, GW2 HV1; CV1; GS1, Cluster 2 LC1, LC2,
LC3 MV2, MV3 BV1; CO3; HE1
Cluster 3 CO1, CO2, CV 3 Cluster 4 CA1,
CA2, CA3
Cluster 5 CV2; GW3; HV2; MV1; GS2; HE2
Matches 22% 30% 48%
DA panel consensus data Cluster 1 BV1, BV2 CO2, CV2, HV1 Cluster 2 LC2, LC3; CV1, CV3 BV3, CA3, MV2 Cluster 3 CA1, CA2; CO1, CO3;
GS1, GS2; GW1, GW3
Cluster 4 MV1, MV3 GW2, HE1, HV2, LC1 Cluster 5 HE2 Matches 0% 59% 41%

139
January Temperature (MJT) for each region was used as a de facto climatic index and
the recommended retail price (RRP) was included as a secondary quality indicator
(Mitchell & Greatorex, 1989). The chemical data were used as supplementary
variables in the analysis. These data were then subjected to principal component
analysis (PCA) and the first two principal components explained 60.7% of the
variance as shown in Figure 4.3.
Figure 4.3 PCA plot of MDS solution, experts’ quality and hedonic scores, wine
MJT and RRP data with wine bi-plot scores for PC also projected.
Chemical data are superimposed as supplementary variables.
Variables (axes F1 and F2: 60.7 %)
Hedonic
Liking
Technical
Quality
MJT
RRP
BPPS
HVCBJ
ESDM pH
TA
OH
VA
RS
Total
Phenolics
4EG4EP
MV3MV2
MV1
LC3
LC2
LC1
IC
HV2
HV1
HE1
HE2
GW3
GW2 GW1GS2
GS1
CV3
CV2
CV1
COM
CO3
CO2
CO1
CA3CA2
CA1BV3
BV2
BV1
-1
-0.75
-0.5
-0.25
0
0.25
0.5
0.75
1
1.25
-1.25 -1 -0.75 -0.5 -0.25 0 0.25 0.5 0.75 1 1.25
F1 (39.9 %)
F2 (
20.8
%)
The wines are denoted by filled boxes and the notations are detailed in Table 4.1. BPPS = Blackberry, plum,
pepper & spice - MDS Dimension 1; HVCBJ = Herbal, vanilla, cedar, berry jam - MDS Dimension 2; ESDM =
140
Earthy, savoury, dusty, meaty - MDS Dimension 3. MJT = Mean January Temperature, RRP = Recommended
retail price. The chemical measures are supplementary variables represented by the lighter vectors and are
underlined. TA = titratable acidity; VA = volatile acidity; RS = residual sugar; OH = alcohol; 4EG = 4-
ethylguaiacol ; 4EP = 4-ethylphenol .
Principal component PC1 had high loadings on the hedonic and technical quality
scores and negative loadings for RRP and ESDM. PC2 described the climatic index
and had to a lesser extent, the BPPS characters. It was negatively loaded on the
HVCBJ character. The bi – plot scores for all the wines on the 2 components were
also projected. The wines in the right quadrants were the most liked and were rated as
being of good quality, with the mean score of these wines greater than 15.5. These
wines were sourced from a range of climatic conditions and had varying degrees of
fruit and oak character. The majority of the wines in the two left hand quadrants were
expensive and perceived as having higher ESDM characters and varying intensity of
BPPS and HVCBJ characters. Seven out of 10 of these wines (HV2, IC, GS2, GW3,
CV2, HE2 and MV1) comprised the fifth cluster mentioned above. The ESDM
dimension has a strong positive correlation with both the 4EG and 4EP chemical
measures, all of which were negatively correlated with the experts' hedonic liking and
technical quality evaluations.
4.3.4 Drivers of the experts’ liking and technical quality scores
As commented upon above, the PCA plot revealed that the experts’ liking and
technical quality scores were negatively correlated with both the RRP and the ESDM
wine attributes. To further explore these results, both the liking and technical quality
scores were subjected to partial least squares (PLS) regression where the RRP, MJT
and the MDS data were the X variables and the liking and technical quality scores the

141
Y variables. The subsequent R2 values for the hedonic liking and technical quality
measures were both 0.54. Figure 4.4 represents the regression co-efficients for both Y
variables. The ESDM dimension was a large negative influence on both liking and
technical quality scores and the BPPS dimension was a large positive influence on
both. The HVCBJ dimension was an influence on the experts’ technical quality scores
but had minimal impact on their liking scores. Neither MJT nor RRP had an impact
on the experts’ liking or quality scores
Figure 4.4 PLS regression coefficients of the 29 wines with the RRP, MJT and
MDS solution data as the X variables and the experts’ liking and
quality scores as the Y variables.
-1.2
-1.0
-0.8
-0.6
-0.4
-0.2
0.0
0.2
0.4
0.6
Reg
resio
n c
o-e
ffic
ien
ts
Experts' Hedonic Liking Experts' Technical Quality
MJT RRP Berry Fruit & Spice Red & Dark Fruit
& Oak
Developed Fruit
& Savoury
4.3.5 Descriptive Analysis (DA) and principal component analysis
of the 29 Shiraz wines
The mean intensity ratings of the significant attributes that differentiated the 29 wines,
as identified by an ANOVA, were subjected to PCA; the attributes that did not
significantly distinguish the wines (at p<0.05) were subsequently excluded, leaving 17

142
attributes for further analysis. The MDS data, represented by each wine's individual
loading on the three MDS dimensions, were included as supplementary data in the
PCA. Figure 4.5 details the first two principal components which accounted for
61.8% of the variation in the wines’ data and also shows the MDS vectors. Principal
component PC1 separated the wines mainly on the attributes dark fruit aroma and
palate, colour intensity, perceived length and mouthfeel, body and alcohol perception.
PC2 contrasted the wines on savoury aroma, mouthfeel tannin and alcohol opposed to
coconut and vanillin oak and fruit sweetness on the palate. PC3 (data not shown)
contributed a further 10.2% to the explained variation in the data and contrasted the
wines on colour intensity and the oak aromas of chocolate and vanilla opposed to the
wine’s length, alcohol perception and fruit sweetness on the palate.
The vector plots indicated that there were weak, positive correlations between the
MDS HVCBJ dimension and dark fruit aroma and sweet fruit and oak attributes
coconut (R2 = 0.2 , p< 0.05) and vanilla identified by the DA panel. Similarly, the
MDS ESDM dimension was positively correlated with the DA panel’s savoury aroma
(R2= 0.2, p< 0.05) attribute. The BPPS dimension was negatively correlated with the
taste and mouthfeel attributes; acid, tannin and alcohol and to a lesser extent aroma
intensity. The majority of the wines that loaded positively on the BPPS dimension are
located in the lower left hand quadrant of the vector plot.

143
Figure 4.5 PCA plot of DA and MDS data with wine bi - plot scores projected.
Col I
A I
A Dk F
A Gr
OA Van
OA CocA Cho
A Sav
Fl I
T Ac
P Ft Sw
P Dk Fr
P O
MF Tan
MF OH
MF B
AT L
BPPS
HVCBJ
ESDM
MV3
MV2
MV1
LC3
LC2
LC1
IC
HV2
HV1
HE1
HE2
GW3
GW2
GW1
GS2
GS1 CV3
CV2
CV1
COM
CO3
CO2
CO1
CA3
CA2
CA1
BV3
BV2 BV1
-1
-0.75
-0.5
-0.25
0
0.25
0.5
0.75
1
1.25
-1 -0.75 -0.5 -0.25 0 0.25 0.5 0.75 1 1.25
F1 (44.2 %)
F2
(1
7.6
4 %
)
Solid squares represent the wines. Solid vectors are DA panel attributes. Dashed vectors represent MDS data and
are underlined. AI = Aroma intensity; Fl I = Flavour intensity; Col I = colour intensity. MF = mouthfeel; AO = oak
aroma; T = taste; AT = aftertaste; L = length; A = Aroma; P = Palate; Dk F = dark fruit; Tan = tannin; Gr = green
aroma; OH = alcohol; Van = vanilla; Ft Sw = fruit sweet; Cho = chocolate; B = body; O = oak; Ac = acid; Sav =
savoury; Coc = coconut. . BPPS = Blackberry, plum, pepper & spice - MDS Dimension 1; HVCBJ = Herbal,
vanilla, cedar, berry jam - MDS Dimension 2; ESDM = Earthy, savoury, dusty, meaty - MDS Dimension 3.

144
The bi - plots of the 29 wines against the PCs 1 and 2 were also projected onto Figure
4.5. The even distribution of wines in all four quadrants indicated that the wines
occupied a varied sensory space. Wines in the two right hand quadrants showed
attributes related to PC1. Wines HE2 and CV3 were perceived as having the most
dark fruit palate and palate length. Wine LC3 was perceived as having the greatest
vanillin and coconut oak and chocolate aroma. Wines MV1 and 3 and LC1 were
perceived as quite similar, with high tannin, acid and alcohol. Wines in the top left
hand quadrant were perceived by the DA panel as possessing a savoury aroma. Wines
HE1, GS2 and CA1 were rated as having high savoury aroma and lower in dark fruit
aroma and palate.
This bi - plot also reveals wines from the same geographical region occupying similar
sensory space indicating that the DA panellists perceived them as having similar
attributes. Wines from CO were perceived as lower in savoury aroma, acid, tannin
and alcohol. MV wines were rated as higher in acid, tannin, alcohol and were fuller
bodied. LC wines had a range of oak and dark fruit characters and generally lower in
savoury aromas, while CV wines were perceived as having dark fruit, oak with a long
finish. BV wines were perceived as having BPPS characters with lower acid and
tannin and GW wines were rated as moderate on most attributes.
To supplement the PCA a further AHC was performed on the DA panel consensus
means and the results are displayed in Table 4.3B and Figure4. 6. Clusters 1 and 3,
which contained wines from CO, BV, GS, GW and CA displayed similar BPPS
characters and were distinguished by the ESDM characters and savoury aroma

145
attribute. Cluster 2 wines, including CV and LC wines displayed dark fruit aroma and
palate attributes and a range of oak attributes which also reflected the MDS results.
Cluster 4 contained wines from MV which displayed more assertive mouthfeel,
leaving a single wine, HE2, that showed dark fruit and a long aftertaste.
Figure 4.6 Bi - plot of the wines' DA data with clusters identified by AHC (Table
4.3B) circled and labelled DA CX.
A one way ANOVA of the DA sensory data with the regions as the source of variation
was also performed in order to identify those attributes that differentiated the regions
(Table 4.4). The MV region had significantly higher colour intensity than the CA
region. The LC region displayed consistently high results for the aroma attributes and
was significantly higher than CO and HV on aroma intensity. That region was also
Observations (axes F1 and F2: 61.84 %)
MV3
MV2
MV1
LC3
LC2
LC1
IC
HV2
HV1
HE1
HE2 GW3 GW2 GW1
GS2
GS1 CV3
CV2
CV1 COM
CO3
CO2
CO1
CA3
CA2
CA1
BV3 BV2
BV1
-3
-2
-1
0
1
2
3
-4.5 -3.5 -2.5 -1.5 -0.5 0.5 1.5 2.5 3.5 4.5
F1 (44.20 %)
F2 (
17.6
4 %
)
DA C3
DA C2
DA C4
DA C5
DA C1

146
significantly higher than all but BV and CV on the coconut aroma and significantly
higher than HV on chocolate aroma, although these latter attributes may be down to
the choice of oak reflecting the winemaking practices in the regions. The MV region
was significantly higher than many other regions on the palate and mouthfeel
attributes which is consistent with the views expressed above. Similarly, CV and LC
regions displayed significantly higher dark fruit and mouthfeel sensory attributes than
regions such as GS, GW and HV, consistent with those highlighted by the cluster
analysis above.
Table 4.4 One way ANOVA of the DA sensory data with the regions as
the source of variation
Region BV CA CO CV GS GW HE HV LC MV
Col I 10.3ab 9.6b 10.1ab 11.3ab 9.9ab 10.9ab 11.2ab 9.8ab 11.5ab 11.7a
A I 9.6ab 9.8ab 9.2b 9.5ab 9.9ab 9.7ab 10.4a 9.0b 10.1a 10.0ab
A - Dk F 7.4a 7.3a 7.3a 7.9a 7.0a 7.3a 8.3a 7.5a 8.2a 7.4a
A -Gr 4.7a 4.9a 5.2a 5.2a 4.9a 5.4a 4.8a 4.7a 5.2a 4.7a
OA -Van 5.4a 5.1a 5.2a 5.2a 4.7a 4.8a 4.8a 4.6a 5.6a 5.2a
OA -
Coc 3.6ab 3.3bcd 2.7de 3.5abc 2.7de 2.5e 2.9cde 2.6de 4.0a 3.2bcde
A - Cho 4.6ab 4.2ab 4.4ab 4.6ab 3.7ab 4.4ab 4.1ab 3.7b 5.0a 5.0ab
A - Sav 5.4a 6.9a 5.9a 5.9a 6.9a 6.6a 6.7a 6.2a 6.4a 7.3a
Fl I 9.1abc 8.3c 8.6bc 9.6a 8.2c 8.6bc 9.6ab 8.6bc 9.4ab 9.4ab
T - Ac 7.6a 7.9a 7.5a 7.8a 7.6a 8.1a 7.9a 7.5a 8.1a 8.1a
P -Ft Sw 8.0ab 7.9abc 7.6abcd 8.2a 7.0bcd 6.9d 8.2a 7.0cd 7.9abc 7.6abcd
P - Dk
Fr 7.8abc 7.3c 7.4bc 8.3ab 7.0c 7.6abc 8.6a 7.8abc 8.3ab 7.9abc
P - O 7.5abc 7.2bc 7.1c 7.9ab 7.0c 7.4abc 8.1a 7.5abc 7.6abc 8.0a
MF - Tan 8.3ab 7.9ab 7.6b 8.7a 8.1ab 8.3ab 8.8a 8.8a 8.1ab 8.8a
MF - OH 7.9ab 7.8ab 7.6b 8.5a 7.6b 8.0ab 8.6a 8.0ab 8.1ab 8.2ab
MF - B 8.4bc 8.3bc 8.1bc 9.5a 7.5c 8.2bc 9.7a 8.3bc 9.0ab 9.5a
AT - L 8.8abc 8.1bcde 8.0cde 9.0a 7.7de 7.6e 9.2a 8.1abcde 8.7abcd 9.0ab The region identifiers are as per Table 4.1. The DA sensory attributes are identified in Figure 4.5. Values sharing a letter within a row are not significantly different (one way ANOVA, p < 0.05, Tukey’s HSD

147
4.4 Discussion
Lawless (1989) suggested sorting tasks as a method of reducing the sensory fatigue
inherent in numerous pair wise assessments of odours. Subsequently, the method has
been used to assess wines; however, it has not been as widely practised as DA. The
literature suggests that orthonasal assessment of wines by this method is more
commonly used (for example, Piombino et al. 2004, Ballester et al. 2005, Parr et al.
2007, Preston et al. 2008, Ballester et al. 2008, Campo et al. 2008, Parr et al. 2009)
and the number of wines assessed varied between 12 and 23. This current study may
be the first sorting task reported using a retronasal assessment of wines. To avoid
sensory fatigue in the present study, we allowed approximately two hours for each
assessment and ensured that there was a 90 minute break between assessments and
required that the experts expectorated the wines. In addition, many of the wine
experts were regular judges on the Australian wine show circuit and were therefore
attuned to tasting and evaluating many wines over a relatively short period of time.
We were confident that the number of wines was not overwhelming for the experts.
4.4.1 The drivers of the experts’ liking and technical quality scores
The experts’ hedonic liking and technical quality scores were highly positively
correlated with R2 = 0.88 (p< 0.001). This is not a surprising result, but as the only
information about the wines provided was that the variety was Shiraz, the technical
quality evaluation could be argued to be an evaluation of each wine’s typicity. That is,
if an expert felt that a wine lacked Shiraz varietal characteristics, or that those
characteristics were suppressed, it was unlikely to receive a high quality score. If that
assertion is accepted, then our results mirror those of other researchers, who found
148
strong associations between hedonic liking and wine typicality (Lesschaeve 2003, Parr
et al. 2007, Ballester et al. 2008).
The MDS solution provided 2 dimensions that are often associated with Australian
Shiraz – “blackberry, plum, pepper and spice” (BPPS) and “herbal, vanilla, cedar and
berry jam” (HVCBJ) characters. Wines perceived as having moderate levels of both
these dimensions’ characteristics, were favourably received by the experts. However,
the absence of the third identified dimension which described an “earthy, savoury,
dusty and meaty” (ESDM) character was the primary driver of their hedonic and
quality ratings. This ESDM dimension contained both positive descriptors like meaty
and earthy (the latter being an ambiguous term but in this study the experts were
referring to more developed fruit character (Iland and Gago, 2002)) and negative
descriptors related to the (perceived) presence of Brettanomyces character, Some of
the more expensive wines were perceived as having that ESDM character and this may
have contributed to their lower than expected hedonic and quality scores. Of the seven
wines identified by the experts as having this character, four had 4-EG/4-EP values
within the range that would be considered responsible for a “Brettanomyces” fault
(Chatonnet 1992). It would therefore appear that the experts were recognising the
presence of this fault in some of the wines and subsequently marked down their
quality and liking scores for those wines. The presence of some ESDM characters and
the absence of primary fruit characters was also a detriment to higher quality and
liking scores. The PLS undertaken in respect of both the liking and quality scores
confirmed that the BPPS dimension was a positive factor in both scores and that the
ESDM dimension was the major negative factor in both. It seemed that the experts’
technical quality evaluation of the wines contributed to their hedonic liking scores,

149
whereby they did not assign a high hedonic score to a wine that they perceived was
faulty due to the presence of the ESDM character and therefore both ratings played a
part in their sorting of the wines (Ballester et al. 2008).
4.4.2 Sorting task analysis
Multivariate analysis (such as MDS) enables the original multidimensional space to be
interpreted by a reduced number of dimensions (Malhotra et al. 1996). In the case of
MDS analysis, the ideal result would be to explain the relationships between the
variables in one or two dimensions. In our study, a three dimensional solution to the
sorting task data was achieved and the judges were instructed to form groups of wines
based on separate ortho and retro nasal assessments of those wines and they were free
to form any number of groups of wines that they wished. The subsequent relatively
complicated and complex three dimensional MDS solution would support Lawless’
(1989) hypothesis that the complexity of the MDS solution was positively related to
the level of instructions provided to judges
We took the view that if two out of three wines from a single region were sorted
together (or in the case where only two wines were present, both must be sorted
together) then, prima facie, there was some evidence of similarities between the wines.
The MDS and cluster analysis solutions to the sorting task data showed that 14 out of
the 29 wines were grouped with another wine from their region, representing 6 out of
the 10 delimited Australian wine regions and arguably similar sensory characters were
displayed intra - region. All three wines from Langhorne Creek and Canberra District
region were grouped together in cluster 2 and 4, while two wines from Barossa Valley,
Coonawarra, Great Western and McLaren Vale were paired in cluster 1, 2 or 3 (Table

150
4.3). The wines from CO, CA and GW were perceived as displaying similar BPPS
characters. These 3 regions are considered as cool climate regions with their average
MJT falling between 19.0˚C and 20.9˚C (Gladstones 2002, Dry et al. 2004). Cool
climate Shiraz wines display pepper, spice and a range of berry fruit characters (Iland
et al. 2009) which fits the ortho and retronasal profiles described by the experts. LC,
which has a similar MJT data as CO, CA and GW, had wines which displayed a range
of HVCBJ characters, which is consistent with the descriptors used by Iland et al.
(2009). These LC wines also displayed similar oak characters to the wines from CO
and CA, however, these characters could not be considered as a regional attribute, as
they are introduced during the winemaking process. BV and MV are considered warm
climate regions, with MJTs of 21.2 and 21.4 respectively (Gladstones 2002, Dry et al.
2004). The fruit characteristics displayed by the wines from these regions were a mix
of blackberry, plum, pepper, spice, herbal, vanilla, cedar and berry jam fruits which
was entirely consistent with the warmer climate Shiraz descriptors provided by Iland
et al. (2009). It would seem that the experts used their knowledge of Shiraz to loosely
group wines by regional climate.
4.4.3 DA panel data
The DA panel identified 17 attributes that significantly discriminated the 29 wines in
the study (Table 4.2). These attributes were all consistent with typical Shiraz varietal
characters identified by others (for example, Abbott et al., 1991, Jackson, 2002, Iland
et al., 2009). After adopting the same selection criteria as per the sorting tasks, the
AHC analysis of the DA panel data produced clusters where 16 wines were paired
with another wine from their region, representing 8 of the 10 selected regions and 59%
match of all wines; 41% were presented with only one wine in a cluster (Table 4.3).

151
This might indicate that the more structured approach explicit in a DA panel,
identified slightly more wines that were perceived as similar, in comparison to the
more informal approach adopted by the expert panel. We note that the DA panel
produced more pairs of wines from the same region but did not group all three wines
together, as did the expert panel. However, the ANOVA that differentiated the
regions by sensory attribute (Table 4.4) confirmed some of the DA panel's findings.
The cost benefit of the expert panel versus a DA approach may therefore have some
merit. The proximity of the MDS dimensions to similar DA attributes on the PCA
plot (Figure 4.5) might indicate that the experts and trained panellists perceived
similar sensory attributes in the wines, thereby lending some credence to the findings
of Cartier et al. (2006) and Preston et al. (2008). As with the sorting task data, the
regions that had wines grouped together displayed attributes and characteristics that
are generally considered appropriate for those regions. For example, the regions of
CO and CA had spicy wines that displayed the commonly accepted attributes for
cooler climate Shiraz (Iland et al. 2009) while the BV wines displayed a combination
of blackberry, plum, pepper, spice and berry jam fruits which is entirely consistent
with Jefford’s (2008) description of wines from Barossa Valley region.
4.4.4 Can a true Australian regional Shiraz character be
determined?
All of the foregoing analysis and discussion has pointed to the presence of some
similarities in wines that originate from the same delimited Australian wine region.
However, trying to label the definitive character of, say, Barossa Valley Shiraz has
proved to be limited to very general descriptors only. We have undertaken two
different cluster analyses on two very different data sets and both of these analyses

152
suggested that regional similarities were identified by the respective judges. If these
results are further analysed, we see that in the case of the sorting task data, only two
(CA and LC) of the 10 regions had all three wines represented in the same cluster, but
none based on the DA data set. All other regions with wines clustered together had
only two wines represented. Herein lies a major issue with trying to label a region’s
characteristics in any definitive way. The size and varying geographies and the
subsequent plethora of mesoclimates (Smart & Dry, 2004) of most of the regions defy
identifying a single, all encompassing regional description. For example, White
(2012) reports that the Barossa Valley may consist of up to 9 sub regions, each with its
own separate sub regional Shiraz identity. It is likely therefore, that the regions from
which all wines were grouped together may have been smaller in geography or
reasonably homogenous in terms of geography, for example, CO and LC. On the
other hand, the wines from CA, which has quite diverse geography, elevation and
temperature variations (Canberra District Wines 2010), may have had some other
distinguishing feature that was perceived by the various judges. In this particular case,
all three wines had a small component of Viognier in their blends that may have
contributed to their consistent groupings. The two regions that did not have any wines
grouped together in either analysis were HV and HE. HE covers a large geographic
area and has marked differences in climate from north to south (Heathcote
Winegrowers Association 2010) and HV is large enough to encompass two distinct
sub regions (Hunter Valley Wine Association 2010). In both cases, only two wines
from those regions were available for analysis and it is conceivable that those wines
were from quite different parts of their respective regions. It is therefore reasonable to
suggest that it would be an almost impossible task to determine an Australian Shiraz
regional sensory map using commercial wines, beyond some generic descriptors,

153
much like those offered in the popular wine press. Although all of the wines were
commercially available and labelled Shiraz, up to 15% of other varieties could be
present in the final blend and any presence of other varieties would complicate the
identification of a definitive regional Shiraz character. Winemaking interventions like
oak additions and malolactic fermentation might also complicate this matter (Parr et
al. 2007). However, it would appear to be much more feasible to determine the
specific Shiraz attributes of the smaller, more compact sub regions identified within a
region. An adequate sample size of wines would be required to determine these sub
regional attributes. However, if the true characteristics of the sub regions were to
show through in the wines, one would need to undertake a rigorously controlled trial
holding variables such as vintage, clone, harvesting and processing constant and
possibly incorporate vineyard specific measures and climatic data.
4.4.5 Study Limitations
The most obvious limitation of this study was the small number of wines from each
region. Whilst the authors were confident that the wines chosen were a representative
sample of wines from each region, a larger sample of wines would have been more
ideal. However, if the number of wines from each region were increased, this would
have significantly increased the workload of both the sorting task judges and the DA
panel judges. This increased workload, especially in the case of the sorting tasks may
then have hastened any potential sensory overload on behalf of the judges.
The argument in relation to the sample size of wines might also be mounted in relation
to the disparate vintages represented. We were reliant on the availability of wines and
with some, the current release vintages were not consistent across the board.

154
4.5 Conclusion
Whilst much is written in the wine popular press espousing the regional differences in
Australian Shiraz, no scientific study has been attempted to qualify or quantify those
differences. This study was a first, very small step, in that direction. We showed that
a cohort of wine experts, some of whom are wine writers and may well have
previously written of those differences, were able to group together some wines from a
number of regions in a sorting exercise. DA panel analysis also grouped some wines
from a single region together; however, with such a small sample size of wines from
each region, any regional attributes were only generic. The work undertaken here has
emphasised the difficulty of characterising wine regionality using consensus sensory
descriptors. To further this research and to provide a genuine “sensory map” of each
region’s Shiraz styles, research wines made under exactly the same controlled
conditions from each region/sub-region should be studied. This would then provide
each region with a definitive list of attributes that genuinely differentiate their Shiraz
wines from other regions which could then aid their marketing communications.
4.6 Acknowledgements
The authors would like to thank the wineries for their kind donations of wine used in
the project. Their generous support of the project is very much appreciated. We
would also like to sincerely thank the 22 wine experts who freely gave up their time to
participate. Without the experts’ time and the wine donations, this project would not
have been possible. The DA panellists are also thanked for their assistance in
evaluating the wines. Brian Croser’s contribution to the selection of regions and their

155
wines is greatly appreciated. The University of Adelaide is a member of the Wine
Innovation Cluster (www.wineinnovationcluster.com) Adelaide, South Australia.

156
Chapter 5 The sensory drivers of Australian
consumers’ liking of Australian Shiraz
The previous two chapters have set the scene for this final piece of the research
project. The Australian domestic wine market was segmented using a fine wine
instrument and those respondents who scored highly on that scale were identified and
labelled as "Connoisseurs". The value of these consumers to the Australian wine
industry was highlighted. In the previous chapter, the importance of the Shiraz variety
to the success of Australian wine in both the domestic and international markets was
discussed. As no previous work had examined, in a structured way, the perceived
regional differences in Australian Shiraz, an attempt was made to identify those
sensory characteristics that differentiated various Australian Shiraz producing regions,
in an effort to clarify those regional differences. This was done through a two stage
process involving wine experts and a DA panel. The sensory attributes that
significantly differentiated a number of Shiraz wines from 10 Australian Shiraz
producing regions were identified.
The final stage of the research project combines the outputs of the previous two
chapters and explores the sensory attributes that contribute to consumers’ liking (and
disliking) of Australian Shiraz. In particular, the drivers of the liking of the
Connoisseur segment, identified using the technique addressed in chapter 3, were
examined in some detail, as well as the drivers of a number of hedonic based
consumer segments.

157
The data were captured in two central location trials undertaken in Adelaide and
Melbourne (Australia), where 179 consumers attended and tasted 12 Shiraz wines in
two brackets of six wines. These wines were a subset of the wines examined in detail
in Chapter 4 and included wines that were sensorially different and had a range of
expert panellists' hedonic scores. Each consumer indicated their liking for each wine.
That data was combined with the DA data through internal preference mapping and
partial least squares regression to provide the resultant drivers.
This paper was submitted to the journal: Food, Quality and Preference

158
The sensory drivers of Australian consumers’ liking of
Australian Shiraz
TRENT E. JOHNSON1, RUSSELL KEAST2 and SUSAN E.P. BASTIAN1*
1Wine Science and Wine Business Group, The University of Adelaide, Waite Campus,
PMB 1, Glen Osmond, SA, 5064, Australia
2 Centre for Physical Activity and Nutrition, Sensory Science Group, Deakin
University, Victoria, Australia
*Corresponding author: Dr Susan Bastian, phone +61 8 8303 6647,
facsimile +61 8 8303 7116, email [email protected]
Key Words: fine wine consumers, wine influences, descriptive analysis, wine experts,
wine liking, Shiraz
Abstract
Understanding the sensory attributes that influence consumers’ liking of a wine style
is potentially a source of competitive advantage for a wine producer. In two central
locations in Adelaide and Melbourne (Australia), a cohort of wine consumers (n =
179) blind tasted and hedonically scored twelve Australian Shiraz wines, ten of which
had been sourced from delimited Australian wine regions, one of which was a multi
regional commercial blend and the last was generally considered to be of exceptional
quality. The wines displayed a diverse range of styles. The same wines had also been

159
hedonically scored by 22 wine experts. At the overall consumer level, there were very
few differences apparent in wine liking. However, at the disaggregated level,
preference clusters and segments of fine wine consumers, denoted Connoisseurs,
Aspirants and No Frill wine consumers, displayed differences in the drivers
(influences) of their respective liking scores. As consumers’ wine knowledge and fine
wine consumer behaviour increased, the influences on their liking of Australian Shiraz
closely mirrored those of the wine experts. More complex sensory attributes were
strong positive influences on liking. The Connoisseur segment bought and consumed
significantly more wine than their counterparts and spent more money on their wine
purchases. The wine experts’ and consumers’ hedonic scores were strongly positively
correlated (r = 0.71), a result that contradicts some earlier studies and indicates that
experts’ liking may be used to predict that of some consumer segments. This study
highlighted that there is a place for most Shiraz wines in the market, however,
producers should not assume that the market is homogeneous as different segments of
consumers had different drivers of their liking for Australian Shiraz.
Abbreviations
WFA = Winemakers’ Federation of Australia
AWBC = Australian Wine and Brandy Corporation
GWRDC = Grape and Wine Research and Development Corporation
HORECA = Hotels, restaurants, cafes = on premise wine sector
WGGA = Wine Grape Growers’ Australia

160
5.1 Introduction
It has been well documented that the Australian wine industry is currently
experiencing a most difficult trading period in its key international markets (see, for
example, WFA et al. 2009). As a direct result of these difficulties, the industry has
stated that … “the reallocation of expenditure towards market development priorities
includes increased investment and presence in … the domestic Australian market”
(Jones 2010, p.10). The Australian domestic wine market has been extensively
studied from a wine marketing view point over the years (for example an incomplete
list includes, McKinna 1986, Spawton 1991a,b, Johnson et al. 1991, Lockshin et
al.1997, Hall & Winchester 1999, Hall & Lockshin 1999, Bruwer et al. 2001, Johnson
& Bruwer 2003, Bruwer & Li 2007, Johnson & Bastian 2007, King et al. 2011a) but
little information exists regarding the sensory attributes (drivers) that influence
Australian wine consumers’ liking for various wine styles (Lattey et al. 2004, 2010,
Bastian et al. 2010). In a typical wine industry scenario, various roles within a
winemaking organisation would make assumptions regarding consumers’ likes or
preferences in relation to wine styles and then interpret these assumptions in the form
of wine products which may, or may not, meet consumer expectations. These
decisions would be made without any sensory science input (Lesschaeve et al. 2001).
This is in direct contrast to the food industry which has used sensory science in its
product development and consumer acceptance decisions for a number of years (Stone
et al. 1974, Lattey et al. 2010). There would appear to be a role for applied sensory
research in the wine industry to help inform decisions about specific wine styles that
meet consumer demand (Fischer 2000).

161
The most common forms of applied sensory science techniques used in these
situations are internal and external preference mapping. Here, statistical analyses
provide the sensory drivers describing the preferences of a group of consumers
(internal preference mapping) and identifying ideal products in that sensory space
(external preference mapping) (Greenhoff & MacFie 1994, Schlich 1995). Although
individual wine companies may have undertaken this type of sensory science based
research in the past, the results remain proprietary and are thus not in the public
domain. The only published information of this sort in the Australian context is
limited to Lattey and her co-workers (2004, 2010) who examined Australian
consumers’ liking of Riesling and Chardonnay and Shiraz and Cabernet Sauvignon
wines, respectively, Mueller et al. (2010) who examined Shiraz as part of a discrete
choice experiment and King et al. (2010, 2011b) who examined Sauvignon Blanc
wines made with different yeast treatments. Other similar international research
includes the work of Yegge & Noble (2000), Lesschaeve et al. (2001), Robichaud et
al. (2007), Lund et al. (2009), Meillon et al. (2010), Lesschaeve & Findlay (2004),
Frøst & Noble (2002).
The challenges facing the Australian wine industry have been addressed in a number
of documents (AWBC 2007, WFA et al. 2009). One strategy outlined concentrates on
the adoption of a specific Wine Australia brand segmentation and in particular,
repositioning Australia’s regional and fine wines in all markets (AWBC 2007).
Influential Australian winemaker, Brian Croser, argues that a fine wine approach is the
key to industry sustainability (Croser, 2010). The Directions 2025 document (AWBC
2007) has a stated aim to encourage consumers to spend more money on a bottle of
Australian wine and in the process, explore the diversity of regionally distinct and fine

162
wines on offer. An important benefit is a greater return on investment to grape
growers and wine producers. A valid assumption is that consumers of fine wines,
however that term may be defined, have already traded up and it therefore follows
that an examination of wine drinkers who already consume fine wines should be of
benefit to the industry in general.
Shiraz is arguably the wine variety for which Australia is best known and accounts for
48% of the Australian red grape production (WFA 2010) and red wine accounts for
43% of sales in the Australian domestic market (Wine Australia 2010). The aims of
the research were therefore to examine the hedonic liking of a number of Australian
Shiraz wines sourced from 10 delimited Australian wine regions, a multi regional
commercial Shiraz and a Shiraz wine that is generally recognised as one of
exceptional quality by a cohort of Australian wine consumers. Both quantitative and
qualitative information was collected from each consumer, in order that any geo-
demographic and other differences in liking might be explored. In particular, we
hypothesised that different segments of consumers would like different wines and that
different wine sensory attributes would drive their liking of those wines. We also
hypothesised that consumers who scored highly on the three scales comprising the
Fine Wine Instrument (FWI) (Chapter 3), consistent with the argument above, would
provide interesting insights. By combining this consumer data with that derived from
a trained Descriptive Analysis (DA) panel, through the use of internal preference
mapping and partial least squares statistical techniques (MacFie & Thomson 1988,
Schlich 1995, van Kleef et al. 2006, Lawless & Heymann 2010), the sensory attributes
that influenced both the liking and disliking of the various segments could be

163
identified. In addition, a small panel of wine experts also provided a hedonic rating of
each of the wines for comparison with the consumer results.
5.2 Materials and Methods
5.2.1 Wines and chemical analysis
The wines used in this research were sourced from 10 delimited Australian wine
regions: Barossa Valley, Clare Valley, McLaren Vale, Langhorne Creek, Coonawarra
(South Australia); Heathcote and Great Western (Victoria); Hunter Valley (New South
Wales); Canberra District (Australian Capital Territory and New South Wales); and
Frankland River sub – region of the Great Southern GI (Western Australia) (Wine
Australia 2010). In addition, a multi regional blended commercial wine and a wine
that was placed in the top third of Langton’s Classification of Australian Wines
(Langton’s 2010) and thereby generally acknowledged as a high quality wine, were
included. Wines from each region were either purchased or donated by producers
(Table 5.1). These wines were a sub set of the wines examined in the previous chapter
and were chosen to provide a wide cross section of both sensory attributes and
experts’ quality and hedonic scores. Each wine was sampled and chemically analysed
in triplicate for its pH, levels of titratable acidity (TA, g/L), residual sugar (RS, g/L)
by the Rebelein method, volatile acidity (VA, g/L) and total phenolics (Iland, Bruer,
Edwards, Weeks, & Wilkes, 2004). Alcohol (%v/v) was determined using the Wine
analysis system: Alcolyzer Wine (Anton Paar, Graz, Austria). In addition, the wines
were tested by the Australian Wine Research Institute (Adelaide, Australia) for the
presence of 4-ethylguaiacol (4-EG) and 4-ethylphenol (4-EP) using Liquid/Liquid

164
extraction combined with stable isotope dilution (SID) Gas Chromatography Mass
Spectrometry (GC-MS) analysis.
Table 5.1 Details of the 12 Shiraz wines used in the consumer tasting.
Wine
Code
Vintage Consumers’
Liking Score
(n = 179)
Experts’
Liking
Score
(n = 22) RRP†
Closure
Type‡
BV
2005 5.22 abc (1.96)
5.69 ab (1.74) 14
S
CA
2006 5.41 abc (2.01)
5.4 ab (2.33) 46
S
CO
2005 5.16 bc (2.11)
5.61 ab (2.57) 45
C
COM
2005 5.15 bc (1.83)
5.8 ab (2.05) 13
S
CV
2006 5.3 abc (1.91)
5.87 ab (1.75) 16
S
GS
2005 4.29 d (2.29)
3.99 c (2.36) 39
C
GW
2004
5.27 abc (2.0)
5.38 ab (2.37) 45
C
HE
2005
5.32 ab (2.07)
4.65 bc (1.27) 60
C
HV
2005
5.07 c (1.89)
4.87 abc (2.67) 55
S
IC
2004 4.6 d (2.01)
5.21 abc (1.74) 110
C
LC
2006 5.27 abc (2.06)
5.61 ab (1.98) 45
C
MV
2006 5.59 a (1.79)
6.5 a (1.69) 20
S
†RRP = recommended retail price in AUD$. ‡S = screw cap; C = cork closure. Values sharing a letter within a
column are not significantly different (p <0.05), Fisher’s LSD. Standard deviations are in parentheses. BV =
Barossa Valley; CA = Canberra District; CO = Coonawarra; COM = multi regional blended commercial wine; CV
= Clare Valley; GS = Great Southern; GW = Great Western; HE = Heathcote; HV = Hunter Valley; IC = Icon; LC
= Langhorne Creek; MV = McLaren Vale

165
5.2.2 Wine Experts
A panel of wine experts (n = 22), consisting of wine makers, wine writers, Masters of
Wine and wine academics, all of whom met the definition of a wine expert described
by Parr et al. (2002), convened at the University of Adelaide’s sensory laboratory to
blind taste the 12 wines. The wines were stored at 15ºC and 75% humidity and
allowed to equilibrate at a temperature of 21ºC for 24 hours before tasting. After two
experienced wine tasters verified that each wine was free of noticeable cork taints,
thirty ml was poured into standard XL5 215 ml tasting glasses coded with three digit
random numbers, covered with a Petri dish and presented to each of the experts in a
randomised, balanced block design that took account of first order carry over effects
(Macfie et al. 1989). The experts were seated in an open plan sensory laboratory and
did not communicate with their peers during the experiment. Their hedonic rating was
scored on a 9 point categorical Likert scale and anchored at 1 by “dislike extremely”,
at 5 by “neither like nor dislike” and at 9 by “like extremely”. The experts rated each
wine by placing a mark on the scale that represented their score.
5.2.3 Consumers and consumer wine tasting
Wine consumers who liked Australian Shiraz and had consumed that variety in the
past four weeks were either recruited through an online questionnaire in which
respondents were asked whether they were available to take part in a wine tasting in
either Adelaide or Melbourne commencing in April 2009, or from the Waite campus
of the University of Adelaide. Ultimately, 179 wine consumers undertook the tastings.
Each consumer completed a questionnaire that collected demographic information

166
plus self reported data relating to their wine purchasing behaviour, wine consumption
habits, wine style preferences and general attitudes towards wine. Specifically,
consumer data on their wine involvement, subjective wine knowledge and objective
wine knowledge were collected (Lockshin et al. 1997, Flynn & Goldsmith 1999,
Johnson & Bastian 2007). In addition, the FWI mentioned above and described in
detail in Chapter 3 was administered to the consumers in order to segment the
respondents on their scores on that instrument.
The wine tastings took place in purpose built sensory laboratories that were
temperature controlled and had fluorescent lighting, in both the Adelaide and
Melbourne locations (The University of Adelaide’s Waite campus and Deakin
University’s Burwood campus sensory laboratories, respectively). Each consumer
was seated in an individual booth separated from their neighbour by a partition and
evaluated the 12 wines in two brackets of 6 wines presented in a randomised order,
balanced for carry over effects (Macfie et al. 1989). The 12 wines were presented in
coded, covered XL5 (ISO standard), 215 ml tasting glasses. The consumers were
provided with distilled water and dry cracker biscuits with which to cleanse their
palates between wines and took a 30 second break between each wine. At the
completion of the first bracket of 6 wines, a five minute break was taken. The only
information provided to the consumers was that the wines were all commercial Shiraz
wines available in the Australian market.
All consumers rated their hedonic liking of the 12 wines on a 9 point categorical
hedonic scale which had three word anchors from left to right reading; “dislike
extremely”, “neither like nor dislike” and “like extremely”. The consumers were
167
required to place a tick in the box on the ballot paper that indicated their liking of the
wine.
The participation of the consumers was approved by the Human Research Ethics
Committees of the University of Adelaide and Deakin University, respectively.
5.2.4 Descriptive analysis of 12 Shiraz wines
A modified quantitative descriptive analysis (DA) was performed to define the sensory
profiles of each wine. The wines were evaluated between July and October 2008 by a
panel of 9 people (2 females and 7 males). All panellists were University of Adelaide
students enrolled in either postgraduate coursework oenology and viticulture programs
or the undergraduate wine marketing program. They were aged between 22 and 48
years. Prior to formal DA training, the panellists had a minimum of 25 hours of
training in aroma and taste detection, identification, discrimination, evaluation and
quality rating of wine. Although the panellists had good levels of wine evaluation
abilities, none had any previous experience with DA.
A further 24 hours of training was held over a ten week period during which the
panellists evaluated each of the 12 wines at least once. Thirty ml of each wine was
served in coded, covered XL5 (ISO standard), 215 ml tasting glasses and the panellists
were asked to individually generate and then reach panel consensus on appropriate
descriptive terms. This training familiarised the judges with both those descriptive
terms and their respective intensities. The descriptive terms agreed upon included:
two colour, thirteen aroma, five flavour (where flavour is defined as aroma by mouth),
one taste, three mouth feel and one after taste attribute. The panellists practiced rating

168
the wines’ attributes using an unstructured 15 cm line scale with indented end anchor
points of “low” and “high” intensity placed at 10% and 90% of the scale, respectively
and a mid-line anchor point of “medium”. These conditions were identical to those
used in the subsequent formal tasting session. Intensity rating standards (high
intensity = 1 in 4 , medium intensity = 1 in 8 and low intensity = 1 in 40 dilution of
raspberry cordial, Cottee’s Cordials, Australia) were provided at each session as an
intensity rating aid. Aroma reference standards prepared in 40 ml of a cask Shiraz
wine from South Eastern Australia in covered wine tasting glasses plus colour and
fabric, mouth feel touch standard swatches were presented to panellists at each session
and were modified in response to panellists’ feedback, to produce a final set that were
provided at each formal evaluation session (Table 5.2). Panel performance was
evaluated over the last three training sessions by having each panellist assess a sub
sample of the wines in triplicate. These data were analysed using PanelCheck and
SENPAQ and the panellist by sample interactions monitored. When these significant
interactions were minimised, the panel commenced final evaluation of the samples.

169
Table 5.2 Colour, aroma and palate attribute vocabulary with agreed definitions
and reference standards of the 17 attributes that significantly
differentiated the wines, as generated by the DA panel.
Attribute Definition
Colour
Colour Intensity Depth of colour from light plum to dark plum/opaque (colour patches provided)
Aroma
Overall Aroma Intensity Dark fruit
Green Oak - vanilla Oak - coconut
Chocolate Savoury
Overall intensity of the aroma ranging from low to high. High intensity = 1 in 4, medium intensity = 1 in 8 and low intensity = 1 in 40 dilution of raspberry cordial, Cottee’s Cordials, Australia Any dark skinned fruit including, blackberry, blueberry, blackcurrant, plum, dark cherry etc. (1 blackberry, 2 blueberries, 1 black cherry, 6 black currants, all frozen and mashed) All “green” attributes such as eucalyptus, mint, menthol, green pepper. Low to high intensity ½ cm
2 frozen
green capsicum
mashed + pinch dried mint + 1 drop of 0.001% solution of eucalyptus oil (Bosisto’s Eucalyptus Oil, Felton Grimwade & Bosisto’s Pty Ltd. Oakleigh South Vic, 3167) Low to high intensity 0.5 g each medium toast French and American oak (O.C. Inc. Piketon, OH, 45661) + 2 drops vanilla essence (Queen Fine Foods Pty Ltd, Alderley QLD 4051) Low to high intensity 0.5 g each medium toast French and American oak (O.C. Inc. Piketon, OH, 45661) + 1 drop coconut essence (Queen Fine Foods Pty Ltd, Alderley QLD 4051) Low to high intensity, ½ cm2 Lindt 75% and 50% cocoa chocolate bar melted in wine. ½ cm3 bacon + ½ cm3 salami + 1 cm2 piece of mulch
Palate
Overall flavour intensity
Low to high intensity

170
Attribute Definition
Fruit sweet Dark fruit Oak
Taste
Acid
Mouthfeel
Tannin Alcohol Body
Aftertaste
Length
Low to high intensity (1/8 red plum cut into 4 pieces = high intensity) Low to high intensity (1 blackberry, 2 blueberries, 1 black cherry, 6 black currants, all frozen and mashed) Low to high intensity presence of any oak perceived on the palate
Low to high 1.5g/L Citric acid in distilled water
Fine grained to coarse grained tannin (sandpaper touch standards provided) Low to high warmth on the palate (5ml Bacardi rum) Light bodied Shiraz to full bodied Shiraz.
Short to long. The time the wine was experienced after expectoration. 0-20secs = short; 21 – 59 medium to long; >60secs = very long
Unless otherwise stipulated, all standards were presented in 40ml of 2 Litre cask Shiraz wine (South Eastern Australia).
Prior to the first formal assessment session, the panel was informed of the assessment
protocol. Two 3 hour formal rating sessions were conducted in a temperature
controlled sensory lab with 9 individual booths under fluorescent light. At each
formal session, each panellist was presented with 18 wines, in three flights of six
wines with an enforced five minute break between flights. Each wine was evaluated in
a randomised presentation order balanced for carry over effects (MacFie et al. 1989)
and in triplicate over the course of the formal rating period. Thirty ml wine samples
were presented in coded, XL5 (ISO standard) 215 ml tasting glasses covered with
small plastic Petri dishes. Distilled water and unsalted crackers were provided for
palate cleansing and panellists were forced to have a 30 second rest between each
sample. At the beginning of each session, panellists familiarised themselves with the

171
reference and intensity standards and had free access to these outside their booths
during the rating period if required.
5.2.5 Statistical analyses
The data were analysed with a combination of descriptive techniques, Student’s t test,
one way ANOVA with Fisher’s LSD (least significant difference) post-hoc test,
correlation analyses, cluster analyses, internal preference mapping and Partial Least
Squares (PLS) regression using SPSS 17.0 (SPSS Inc. 2008), Microsoft Excel 2003
(Microsoft Corporation 2003) and XLSTAT Version 2010.3.08 (Addinsoft SARL,
France). The presentation orders for the wines were generated by Design Express
Version 1.6 (QiStatistics, UK). For the DA, a mixed model two-way ANOVA with
assessors as random and samples as fixed factor effects was used, with Fisher’s LSD
post-hoc test where p< 0.05 was considered significant using SENPAQ version 4.3 (Qi
Statistics, UK) and PanelCheck (Nofima Mat and DTU – Informatics and
Mathematical Modelling, Norway).

172
5.3 Results
5.3.1 Chemical composition of the wines
The 12 Shiraz wines underwent a number of standard chemical analyses and the
results are presented in Table 5.3. The wines ranged in pH from 3.06 to 3.67. Wine
COM was significantly (p<0.05 unless stated otherwise) higher in pH than all other
wines and wines MV and HE were significantly lower than all other wines. TA values
ranged from 5.97g/L to 8.0g/L. Wine HV was significantly higher than all other wines
and wines CA, GW, COM (which had the highest pH), CO and HE and CO2 were
significantly lower than all other wines. The ethanol % v/v ranged between 13.53%
and 14.69%. Wines IC and COM were significantly higher in ethanol than all the
other wines and wines CA and GS (both from cool climate regions) were significantly
lower than all others. Volatile acidity was significantly lowest at 0.53g/L acetic acid
for both the IC and CV wines and significantly highest at 0.76g/L acetic acid for the
GW wine. With the exception of the COM wine which had the significantly highest
amount of RS at 8.98g/L, all other wines had values less than 5g/L. Wine GS was
significantly lower in RS than all other wines at 1.43g/L. Total phenolics were
measured by absorbance at A280 and revealed that the IC and GW wines were
significantly higher than all other wines. Wine CA was significantly lower than all but
one other wine. Wine GS had significantly higher 4-EG and 4-EP values than all
other wines and along with wines GW and HV, had levels of ethylphenols that may
possibly be perceived as “Brettanomyces” fault affected (Chatonnet et al. 1992).

173
Table 5.3 Chemical composition data of the 12 Shiraz wines tasted by the consumers. Standard deviations are in parentheses.
Wine pH
TA
(g/L)
Ethanol
(%v/v)
VA
(g/L)
RS
(g/L)
Total
Phenolics
(AU)
4-
ethylguaiacol
(µg/L)*
4-
ethylphenol
(µg/L)*
BV 3.20(0.0)e 6.90(0.0)cd 14.29(0.02)d 0.57(0.01)cde 3.1(0.26)de 49(1.65)bcd ND d ND h
CA 3.38(0.0)b 6.17(0.06)f 13.53(0.05)g 0.64(0.02)bcd 1.8(0.26)g 42.3(2.56)ef ND d ND h
CO 3.30(0.01)cd 5.97(0.06)f 14.43(0.02)c 0.61(0.02)bcde 2.4(0.1)f 46.6(1.48)de ND d 77 f
COM 3.67(0.1)a 5.98(0.3)f 14.67)0.04)a 0.66(0.13)b 8.98(0.28)a 52.8(4.84)bc ND d ND h
CV 3.36(0.02)bc 6.73(0.06)d 14.61(0.03)b 0.53(0.02)e 3.17(0.25)d 49.5(2.03)bcd ND d 51 g
GS 3.21(0.0)e 6.43(0.12)e 13.53(0.03)g 0.66(0.01)bc 1.43(0.21)h 39.7(4.41)f 139 a 1874 a
GW 3.43(0.0)b 6.07(0.06)f 14.05(0.0)e 0.76(0.01)a 1.8(0.1)g 59.6(3.51)a 72 b 611 c
HE 3.06(0.1)f 5.97(0.06)f 13.96(0.01)f 0.59(0.01)bcde 3.5(0.0)c 50.2(4.2)bcd 59 b 299 d
HV 3.23(0.0)de 8.0(0.0)a 14.6(0.02)b 0.56(0.02)de 4.8(0.06)b 48.3(2.0)cd 34 c 804 b
IC 3.25(0.01)de 6.9(0.0)cd 14.69(0.05)a 0.56(0.05)de 2.83(0.15)e 58.4(3.46)a ND d 28 h
LC 3.25(0.1)de 6.97(0.06)c 14.6(0.06)1b 0.69(0.02)ab 1.87(0.15)g 54.3(2.21)ab ND d 25 h
MV 3.12(0.0)f 7.40(0.0)b 14.4(0.02)c 0.66(0.0)bc 2.93(0.12)de 48.9(2.14)bcd ND d 100 e
Values sharing a letter within a column are not significantly different (p < 0.05), Fisher’s LSD. ND = not detected in the sample. * Measured by a commercial laboratory and are absolute values.

174
5.3.2 Wine consumer demographics and wine behaviour
The majority of consumers were male and 30% were aged between 18 and 24 years,
which could be explained by some of the sample being recruited from a university
campus (Table 5.4). This might also explain why 61% of consumers had a tertiary
degree, although previous studies have also demonstrated that wine drinkers are more
likely to have a tertiary education than non wine drinkers (Johnson 2002, Johnson &
Bastian 2007, Cox 2009). The Cronbach alpha coefficients for the subjective wine
knowledge (Flynn & Goldsmith 1999), wine involvement (Lockshin et al. 1997) and
the aggregated FWI scores (refer Chapter 3) were 0.88, 0.79 and 0.87, respectively,
indicating their reliability.
Table 5. 4 Australian Shiraz Wine Consumer Demographics
Gender %
Female 34.5 Male 65.5
Age
18 - 24 30.5 25 - 28 16.9 29 – 34 18.1 35 - 39 7.9 40 - 44 5.1 45 - 54 13.6 55 - 65 4.5 65+ 3.4
Education
School leaving certificate 13.0 HSC 11.3 TAFE/Trade 14.7 Bachelor's degree 34.5
Graduate/Post Grad Diploma 8.5
Master's Degree 13.0 Doctorate 4.5 Other 0.6
Household Income
<$25,000 16.7 $25,001 to $50,000 17.9

175
$50,001 to $75,000 20.2 $75,001 to $100,000 14.3 $100,001 to $150,000 13.7 $150,001 to $200,000 7.7 >$200,000 7.1 Not Provided 2.4
Usual State of Residence
NSW 2.8
VIC 32.9
SA 62.6
WA 1.7
The consumers’ mean: objective wine knowledge (Johnson & Bastian 2007),
subjective wine knowledge, wine involvement and fine wine scores (all calculated as
a percentage) were 68.2 ± 15.4 (± s.d.), 66.9 21.1, 82.6 ± 17.6 and 66.0 ± 13.9,
respectively. These consumer scores were significantly lower (p < 0.001) than the
corresponding scores achieved by the cohort of experts, which were 84.8 ± 8.7 (±
s.d.); 87.8 ± 13.8; 95.2 ± 8.3; and 75.4 ± 8.5, respectively. The Pearson correlation
coefficients were calculated for the four measures reported above and are shown in
Table 5.5. There was a significant large (Cohen 1988) positive correlation between
the FWI and involvement scores (r = 0.64), the fine wine and subjective wine
knowledge scores (r = 0.52) and the objective and subjective wine knowledge scores (r
= 0.52). All other correlations were significant, positive and medium in size. The
respondents’ preferred alcoholic beverage was wine and their preferred wine style was
red wine followed by lighter bodied white wines, such as Riesling and Sauvignon
Blanc. Supermarket owned chain wine retailers were their preferred choice of wine
purchase channel and females purchased significantly (p < 0.05) more wine at bars or
hotels than did males. The respondents spent an average of AUD$160.18 ± $145.20
on wine per month, purchasing an average of 8.0 ± 7.4 bottles of wine per month.
They self reported an average consumption per week of 2.2 ± 1.5 bottles of wine.

176
Table 5.5 Pearson correlation coefficients of the four wine related scales
administered to the consumers.
Wine
Involvement Fine Wine
Scale
Subjective Wine
Knowledge
Objective Wine
Knowledge
Wine Involvement 1 0.64 0.39 0.36
FWI 1 0.52 0.39
Subjective Wine Knowledge 1 0.52
Objective Wine Knowledge 1
Values in bold are different from 0 with a significance level alpha=0.001
Given that one of the aims of this study was to examine the behaviour of those
respondents identified as fine wine consumers, it is pertinent to report some of their
data separately. In order to identify those consumers who exhibited high fine wine
consumer behaviour, the protocol outlined in Chapter 3 was followed. The resultant
segments were denoted Connoisseurs, Aspirants and No Frills wine consumers,
respectively (refer Chapter 3). The Connoisseur segment consisted of 26.3% of the
sample and was the most gender balanced of the 3 segments with a 53%/47%
male/female split. This segment had the lowest number of consumers under the age of
28, the most with a tertiary education (64%) and 30.5% reported a household income
in excess of AUD$100,000 per annum. Any significant differences (p<0.05 unless
stated otherwise) between the Connoisseur and No Frills segments are reported below.
The Connoisseurs’ objective, subjective and involvement scores were significantly
higher than their No Frills counterparts at 76.0 ± 12.4 (± s.d.), 79.5 ± 20.8 and 91.3 ±
9.3 compared to 59.9 ± 15.0, 53.4 ± 21.2and 67.4 ± 21.7, respectively. They spent on
average AUD $243.40 ± 185.83 on wine per month compared to AUD $113.21 ±

177
88.80, purchased on average 11.4 ± 9.7 bottles of wine per month compared to 6.3 ±
6.0 and consumed a self reported 2.5 ± 1.5 bottles of wine per week compared to 1.9 ±
1.5. In both segments, their preferred alcoholic beverage was wine, however, the
Connoisseur’s wine consumption was significantly higher at 63.7% compared to 52%.
Red wine was both segments’ preferred wine style. The Connoisseur segment
reported that 51.2% of their wine consumption was red wine, which was significantly
higher than the No Frills’ segment’s 40.6%. On the other hand, the No Frills’ segment
consumed significantly more sparkling white wine at 12.8% compared to 6.7%. The
Connoisseurs’ preferred purchase channel for wine was independent wine retailers
accounting for 30.1% of their wine purchases, followed by supermarket owned chain
stores at 22% of purchases. The No Frills’ segment preferred supermarket owned
chain stores which accounted for 39.2% of their purchases, which was significantly
higher than the Connoisseur segment. Although there was no statistical difference
between the overall amount of wine purchased through the HORECA channel, the
female Aspirants purchased significantly more (p<0.05) through this channel (24.4% ±
23.1) than their male counterparts.
5.3.3 Expert hedonic (Liking) rating of the 12 wines
The experts’ hedonic scores ranged from 3.99 to 6.5, a range of 2.51 over a nine point
scale (Table 5.1). The MV wine, with a recommended retail price (RRP) of AUD$20,
was the most liked wine by the experts and it was significantly more liked than the
bottom two ranked wines (HE and GS). The GS wine, with a RRP of AUD$40 was
the least liked wine by the experts and was significantly less liked than 8 other wines.
The standard deviations indicated that the experts had a large range of liking scores for
each wine.

178
5.3.4 Consumer hedonic rating of the 12 wines
The hedonic scores of the consumers ranged from 4.29 to 5.59, a range of 1.3 over a 9
point scale (Table 5.1). Once again, wine MV was the most liked of all wines, but
from a statistical point of view, was equally liked with 6 other wines and was
significantly more liked than 5 wines. Wine IC (RRP AUD$110) and consistent with
the experts, wine GS, were significantly less liked than all the other wines in the
tasting. Also consistent with the experts’ scores, the consumer standard deviations
indicated a wide range of scores and wine MV had the smallest standard deviation. A
Pearson correlation co-efficient of r = 0.71 (p < 0.05) was calculated between the
consumer and expert liking scores.
The consumer liking data were examined to see if there were any differences in wine
liking between genders, education level and age and only in rare cases were significant
differences found in the liking scores (data not shown). The large standard deviations
mentioned above might account for this phenomenon. The objective wine knowledge
and wine involvement scores were segmented using the protocol described by Quester
and Smart (1998). The mean wine liking scores were subsequently calculated for each
segment, including the fine wine segments, and subjected to one way ANOVA to
ascertain whether any differences in scores existed (Table 5.6).

179
Table 5.6 Mean Shiraz wine liking scores of the various knowledge, involvement and fine wine segments.
Objective Wine Knowledge
Segment Wine Involvement Segment Fine Wine Consumer Segment
Wine High Medium Low High Medium Low Connoisseur Aspirant No Frills
BV 5.24a 5.28a 5.02a 4.87a 5.53a 5.0a 5.4a 5.14a 5.16a
CA 5.17a 5.38a 5.68a 5.67a 5.32a 5.29a 5.36a 5.52a 5.27a
CO 5.72a 4.94a 5.34a 4.96a 5.4a 4.91a 5.21a 5.0a 5.4a
COM 5.07a 5.3a 4.81a 5.14a 5.24a 5.0a 5.23a 5.14a 5.09a
CV 5.76a 5.3a 4.93a 5.46a 5.41a 4.83a 5.47a 5.36a 4.98a
GS 4.21a 4.13a 4.83a 4.69a 4.45a 3.99a 4.23a 4.2a 4.58a
GW 5.17a 5.19a 5.54a 5.21a 5.26a 5.36a 5.15a 5.25a 5.42a
HE 4.97a 5.2a 5.88a 5.27a 5.14a 5.74a 4.94a 5.41a 5.53a
HV 5.35a 5.06a 4.9a 5.06a 5.08a 5.05a 5.28a 5.05a 4.89a
IC 4.69a 4.62a 4.46a 4.33ab 5.0a 4.12b 4.79a 4.68a 4.24a
LC 5.55a 5.57a 5.29a 5.06a 5.75a 5.55a 5.45a 5.63a 5.31a
MV 5.59a 5.57a 5.63a 5.42a 5.75a 5.45a 5.53a 5.55a 5.71a
Wines sharing a letter within rows, within categories are not significantly different (p < 0.05), Fisher’s LSD. Significant differences in mean liking (p<0.05) are in bold

180
Consistent with the earlier observation, only wine IC was significantly (p < 0.05) more
liked by medium wine involvement consumers over low wine involvement consumers.
All other pair wise comparisons within the reported scales were not significantly
different. With particular reference to the three fine wine segments and the three wine
knowledge segments, a logical assumption would be that the higher a consumer’s fine
wine score and wine knowledge, the closer they might be associated with wine
experts. Therefore, a Pearson’s correlation analysis was performed on the experts’
mean liking scores, the wine knowledge segments’ liking scores and the fine wine
segments’ liking scores (Table 5.7). A large significant positive correlation was found
between the Connoisseur segment and the experts (r = 0.84, p < 0.001) and a large
significant positive correlation between the Aspirant consumer segment and the
experts’ liking scores (r = 0.66, p< 0.05). A medium, non significant correlation was
found between the No Frills consumer segment and the experts’ liking scores (r =
0.48). Interestingly, the high and medium wine knowledge segments had an identical,
significant, large positive correlation with the experts’ liking scores (r = 0.76, p <
0.01) and the low knowledge segment had a low, non significant correlation with the
experts’ liking scores (r = 0.16).

181
Table 5.7 Pearson correlation coefficients of the wine experts’ and the three
objective wine knowledge segments’ and three fine wine segments’
mean liking scores.
Fine Wine Consumer Segment Objective Wine
Knowledge Segment
Variables Connoisseur Aspirant
No Frill
s High Med Low
Experts' Mean
Fine Wine Consumer Segment
Connoisseur 1 0.86 0.59 0.9 0.92 0.32 0.84
Aspirant 1 0.76 0.73 0.97 0.66 0.66
No Frills 1 0.6 0.73 0.88 0.48
Objective Wine
Knowledge Segment
High 1 0.76 0.32 0.76
Med 1 0.53 0.76
Low 1 0.16
Experts' Mean 1
Values in bold are different from 0 with a significance level alpha=0.05
5.3.5 Cluster analysis of the consumers’ hedonic scores
The overall consumer liking data only revealed that one wine was significantly more
liked than five other wines and that two wines were significantly less liked than all the
other wines, indicating that at the aggregate level, there was very little product
differentiation demonstrated by the consumers (Stone & Sidel 2009). Therefore, the
consumers’ hedonic scores for the 12 wines were subjected to a series of k-means
cluster analyses using Determinant (W) as the clustering criterion. Four clusters or
segments each containing consumers with similar liking of the wines were identified,
representing 25.7%, 27.9%, 24.6% and 21.8% of the sample, respectively (Table 5.8
and Figure 5.1). Cluster 2 had the most gender balance with a 52/48 male/female

182
split, whilst cluster 3 had the most males at 65.1%. Cluster 4 had the most consumers
under the age of 28 and cluster 3 had the most over the age of 45. 68% of Cluster 2’s
consumers had a tertiary education, whilst cluster 1 had the highest percentage of
consumers who had only completed high school. Cluster 3 had the highest proportion
of consumers who reported a household income in excess of AUD$100,000 per
annum. Clusters 1 and 4 had the highest percentage of Connoisseurs with 28.3% and
28.2%, respectively. Cluster 2 had the highest component of both high wine
involvement and high objective knowledge consumers, with 34% and 22%,
respectively. An examination of the wine consumption data of each cluster (data not
shown) revealed that clusters 1 and 3 consumed significantly more red wine (p< 0.05)
than cluster 2 and that cluster 2 consumed significantly more Rosé (p< 0.05) than
cluster 3.

183
Table 5.8 Mean liking score for each Shiraz wine by cluster as determined by
cluster analysis of the consumer liking scores. Numbers in parentheses
indicate the percentage of consumers per cluster.
Cluster
Wine 1 (25.7%) 2 (27.9%) 3 (24.6%) 4 (21.8%)
BV 5.74a 4.06c 6.25a 4.9b
CA 5.74b 4.48c 6.98a 4.46c
CO 5.65b 4.12c 6.48a 4.41c
COM 6.07a 4.3b 5.86a 4.36b
CV 6.37a 4.72b 5.93a 4.03b
GS 2.89c 4.96b 6.64a 2.49c
GW 6.09a 4.06c 6.14a 4.87b
HE 5.7b 5.26b 6.66a 3.44c
HV 5.41ab 4.82b 5.89a 4.05c
IC 4.74b 3.26c 5.77a 4.82b
LC 6.11a 4.76c 6ab 5.18bc
MV 5.48b 4.28c 6.71a 6.13ab
Wines sharing a letter within a row are not significantly different (p <0.05), Fisher’s LSD. The most liked wine in
each cluster is in bold and the least liked is underlined.

184
Figure 5.1 Shiraz wine preference segmentation of the 179 consumers. The
aggregated consumer results are shown on the right and the results of
the 4 clusters are shown on the left.
BV
BV
CA
CA
CA
CO
COM
CV
CV
CV
GS
GS
GS
GS
GS
GW
HE
HE
HVIC
IC
IC
IC
IC
LC
M V
M V
BV
BV
BV
CA
CA
CO
CO
CO
CO
COM
COM
COM
COM
CV
CVGW
GW
GW
GW
HE
HE
HEHV
HV
HV
HV
LC
LC
LC
LC
M V
M V
M V
2.3
2.8
3.3
3.8
4.3
4.8
5.3
5.8
6.3
6.8
7.3
Tru
ncate
d h
ed
on
ic s
co
re
C2 C3 C4C1Overall
consumers
C1-C4 = Clusters 1 to 4. The 12 wines are represented by the letters described in Table 5.1.
The most liked and least liked wines in each cluster are in bold and underlined,
respectively (Table 5.8). The two least liked wines overall (IC and GS) are the least
liked wines in 3 of the 4 clusters, however, the most liked wine overall (MV) was the
most liked wine in just one cluster (cluster 4). Figure 5.1 is particularly informative.

185
The right hand column shows the results of the overall consumer cohort (n = 179)
range of liking scores and indicates that all wines are similarly liked at this level.
However, the other columns indicate the range of liking scores for the four clusters
and show that the wines are now disaggregated. Cluster 3 liked all of the wines and
cluster 1, which was similar to the overall consumer results (r = 0.85, p < 0.001), liked
most of the wines with the exception of wine GS and to a lesser extent, IC. Clusters 2
and 4, although not significantly positively correlated, were similar in that they did not
like many of the wines tasted, with only 1 and 2 wines respectively, scoring over five
on the nine point scale. These exceptions were wine HE and wines MV and LC.
5.3.6 Descriptive Analysis (DA) and principal component analysis (PCA) of the 12 Shiraz wines
A correlation matrix of the mean intensity ratings of the significant attributes of the 12
wines was subjected to PCA. The attributes that did not significantly distinguish the
wines (at p<0.05) were subsequently excluded from further analysis. Figure 5.2
details the first two principal components which accounted for 63% of the variation in
the wines’ data and the bi-plot of the 12 wines is overlaid. Principal component (PC)
1 separated the wines by the savoury aroma opposed to the dark fruit, chocolate and
coconut aromas and colour intensity attributes. PC2 contrasted the wines on green
aroma, oak palate, tannin mouthfeel perception and acid taste opposed to aroma
intensity. PC3 (data not shown) contributed a further 10.5% to the variation in the
data and was predominantly driven by colour intensity opposed to aroma intensity and
to a lesser extent, the oak derived vanilla aroma.

186
Figure 5.2 Vector plot of the significant attributes identified by the DA panel, with
the bi-plot of the 12 wines overlaid.
Variables (axes F1 and F2: 62.58 %)
C- I
A-I
A-DkF
A-Gr
AO-V
AO-Coc
A-Ch
A-Sav
F-I
T-A
P-Ft Sw
P-DkF
P-O
MF-T
OH
MF-B
AT-L
MV
LC
IC
HV
HE
GW
GS
CV
COM
CO
CA
BV
-0.5
-0.25
0
0.25
0.5
0.75
1
-1.25 -1 -0.75 -0.5 -0.25 0 0.25 0.5 0.75 1 1.25
F1 (45.69 %)
F2
(1
6.8
9 %
)
Where prefix A- = Aroma; P = Palate; T = Taste; MF = Mouthfeel; AT = Aftertaste; F = Flavour; C = Colour; AO = Aroma from Oak; OH = Alcohol perception; and suffix Ft Sw = Fruit Sweet; V = Vanilla; I = Intensity; Ch = Chocolate; Coc = Coconut; DkF = Dark Fruit; B = Body; L = Length; T = Tannin perception; O = Oak; A = Acid; Gr = Green; and Sav = Savoury. Wine codes are described in Table 5.1.
The bi-plot of the 12 wines showed the wines evenly spread over the four quadrants
and indicated that the wines were well represented in the sensory space and could be
considered sensorially diverse. The HV and GW wines were perceived as having
green and savoury aromas, whereas the COM, CO and GS wines had strong aroma
intensity and less of the attributes such as acid, tannin and oak palate. The GS wine
was also perceived as having a strong savoury aroma, which probably accounted for
its overall high aroma intensity score. Wines MV, CA, LC and IC were perceived as
having oak derived aromas of coconut and vanilla, with sweet fruit on the palate.
Wines HE, CV and BV displayed dark fruit on the palate, body and palate length.

187
5.3.7 Internal preference mapping
Internal preference mapping was performed on the mean scores of the four consumer
clusters identified above, the overall consumer mean scores and the sensory attributes,
in order to identify the sensory attributes that influenced consumer liking of the wines.
The results are displayed in Figure 5.3. Cluster 1’s liking scores were positively
aligned with the aroma attribute chocolate, dark fruit on the palate and the attributes of
body and length and negatively influenced by the savoury aroma attribute. The
consumers in Cluster 2 liked the savoury and green aroma attributes and did not like
the body attribute which contrasted with the Cluster 4 consumers who did not like the
savoury aroma and did like wines with fruit sweetness on the palate, chocolate aroma
and the oak derived character of vanilla and the mouthfeel attribute of body weight.
Cluster 2’s liking scores moderately positively correlated (Cohen 1988) with the
attributes colour intensity, the perception of oak on the palate and savoury aroma. The
consumers in Cluster 3 liked wines that were perceived as lower in tannins, acid and
alcohol and higher in overall aroma intensity and disliked wines with the green aroma
attribute.

188
Figure 5.3 Internal preference map of the 12 Shiraz wines.
Variables (axes F1 and F2: 29.36 %)
Cons Mean
C1
C2
C3
C4C- I
A-I
A-DkF
A-Gr
AO-V
AO-Coc
A-Ch
A-Sav
F-I
T-A
P-SwF
P-DkF
P-O
MF-T
OH
MF-B
AT-L
MV
LC
IC
HV
HE
GWGS
CV
COM
COCA
BV
-0.75
-0.5
-0.25
0
0.25
0.5
0.75
-1.25 -1 -0.75 -0.5 -0.25 0 0.25 0.5 0.75 1
F1 (16.51 %)
F2
(1
2.8
4 %
)
Cons Mean = overall consumer mean; C1-C4 = Clusters 1 to 4. Sensory attributes are described in Figure 5.1.
Sensory attributes are solid vectors and consumer cluster means are shaded vectors.
5.3.8 Partial least squares (PLS) regression analysis
In order to further determine the drivers of consumer liking of Shiraz wines, PLS
analysis was undertaken, with the sensory data as the X-variables and the mean
consumer and experts’ liking scores as the Y-variables. The sensory data therefore
became the predictors of the consumer liking scores (Lattey et al. 2010). This analysis
was undertaken on the four consumer clusters, the overall consumer mean scores and
the experts’ mean scores. It was also performed on the three fine wine segments’
scores in an effort to determine whether the consumer sample was as homogenous as

189
the ANOVA of their mean scores suggested. Figure 5.4 plots the regression
coefficients for the clusters described above.

190
Figure 5.4 PLS regression coefficients of the 12 wines scored by the overall consumer cohort, the four identified clusters and the
wine experts (A) and the three fine wine segments (B) (Y variables). The sensory attributes described by the DA panel
were the X variables.
-0.3
-0.2
-0.1
0.0
0.1
0.2
0.3
Reg
ressio
n C
o-e
ffic
ien
t
C1 C2 C3 C4 Consumers' Mean Experts' Mean
A
C-I A-IA-
DkFA-Gr AO-V
AO-
CocA-Ch A-Sav F-I T-A
P-
SwF
P-
DkFP-O MF-T OH MF-B AT-L

191
CON = Connoisseurs; NF = No Frills; ASP = Aspirants. The sensory attributes are described in Figure 5.2.

Regression coefficients with absolute values greater than 0.2 are considered the most
important and those less than 0.1 are not important (Lattey et al. 2010). The R2 values
ranged from 0.72 for Cluster 1 to 0.48 for Cluster 4. The majority of the attributes
were not particularly important influences on the overall consumer liking with dark
fruit and vanillin oak aromas being the positive drivers of liking. The green aroma
was the biggest negative influence on liking. On the other hand, the experts’ liking
was positively influenced by colour intensity, chocolate aromas and the various fruit
driven attributes on the palate, plus body and length of aftertaste. The major negative
influences were tannins and aroma intensity and savoury aroma.
The three most prominent drivers of Cluster 1’s liking were dark fruit on the palate
and body and length of the wine. Aroma intensity and savoury aroma were the most
important negative influences. Cluster 2’s positive influences were aroma intensity,
vanillin oak aroma and tannins. Their negative influences were green aroma and
colour intensity. Cluster 3 was positively influenced by aroma intensity and vanillin
oak aromas and negatively by green aroma and body. Chocolate aroma, dark fruit on
the palate and body were the most important positive drivers for Cluster 4 and their
negative drivers were aroma intensity and savoury aroma. The majority of these
results were consistent with the correlations noted in the internal preference maps
(Figure 5.2).
The three fine wine segments liking scores were also modelled and returned R2 values
between 0.91 (Connoisseur segment) to 0.8 (No Frills segment). The Connoisseur
segment’s positive influences were length, acid and oak on the palate and the

193
important negative drivers were coconut oak aromas, alcohol and tannins. The
Aspirant segment had similar positive influences as the Connoisseur segment with the
inclusion of chocolate aromas and a negative influence being coconut aroma. The No
Frills segment had important positive attributes in aroma intensity and vanillin oak
aroma and negative influences in coconut and green aromas.
5.4 Discussion
A cohort (n = 179) of consumers of Australian Shiraz who normally reside in a
number of Australian states undertook a tasting of 12 Australian Shiraz wines at two
central locations, one in Adelaide and the other in Melbourne. The aim was to
examine the liking scores of those 12 wines and link those scores to consumer
segments.
5.4.1 Was the sample representative of Australian Shiraz wine consumers?
The number of consumers in this study was reasonably consistent with those in
previous studies of this type (Robichaud et al. 2007, Lattey et al. 2010) . The two
central location trials were held in Adelaide and Melbourne in the two states that
produce the majority of Australia’s wine (Wine Australia 2010) so it is reasonable that
96% of the convenience sample was normally resident in those two states. One way
ANOVA of the liking scores from both central locations revealed that the data were
homogenous (data not shown). The sample’s wine involvement score of 82.9% might
be considered high; however, it was significantly lower (p < 0.001) than the cohort of
wine experts who provided a hedonic score of the wines. It is not unreasonable to

194
assume that these consumers were highly wine involved, as they not only spent time in
initially completing the survey but also freely gave up their time on a weekend to
travel to a University campus and undertake the tasting. It is unlikely that an
uninvolved wine consumer would display that type of wine related behaviour. Given
that this sample’s demographic and other details are similar to those reported
elsewhere about the Australian wine market (Johnson 2002, Johnson & Bastian 2007,
Cox 2009), this sample is considered representative of Australian Shiraz wine
consumers and not a homogeneous collection of wine consumers that might have been
concluded based on the similarities of their wine liking scores. Despite the diversity
of Shiraz wine styles in the market place, our research demonstrated that the market is
not homogenous and it is likely that each wine will be accepted by at least one
segment of consumers (Schlich 1995).
5.4.2 Consumers’ hedonic scores and the price relationship
The wines chosen for the tasting ranged in price from AUD$13 to $110. The most
liked wine by both the consumers and the experts was a reasonably inexpensive wine
from McLaren Vale and the most expensive wine in the tasting was liked significantly
less than ten other wines by the consumers. No identifying or other information were
provided to the consumers prior to the tasting and in particular, the price of each wine
was not revealed. A consumer’s wine experience is certainly subjective (Goldstein et
al. 2008) and consumer liking of wines is highly heterogeneous (Amerine & Roessler
1976). Several studies have shown that information about price may influence
consumer liking (Goldstein et al. 2008, Plassmann 2008, Almenberg & Dreeber 2010)
and in particular, informed liking is influenced by this extrinsic cue (Mueller et al.
2010) and in the absence of any other extrinsic cues, consumers will use price as a

195
defacto indicator of wine quality (Mitchell & Greatorex 1989, Rao & Monroe 1989).
In the present study, the consumers were making an uninformed liking decision in that
the price of the wines was not disclosed. This meant that they were using only the
intrinsic cues (sensory attributes) in arriving at their decision. The subsequent result
where the most expensive wine was significantly less liked than all but one of the
other wines might provide further evidence to suggest that price does influence
consumer liking and thus support the findings of those earlier studies.
5.4.3 The drivers of consumer liking of Australian Shiraz
The PLS data indicated that the consumers’ liking of the wines were influenced, in
both positive and negative ways, by many of the attributes assessed by the DA panel.
In some cases, certain attributes were a positive influence for some segments of
consumers and a negative influence for others. For example, the body of the wine was
an important positive attribute for consumers in Clusters 1 and 4, yet the same
attribute was a negative driver of liking for consumers in Clusters 2 and 3. Body was
also an important positive driver of the experts’ liking scores. The chemical data of
the wines revealed that the wines with the highest phenolic and alcohol levels were
liked by consumers in Clusters 1 and 4 and disliked by consumers in Clusters 2 and 3
and adds weight to the findings.
The drivers of the experts’ liking were quite different from the overall consumer
results and those of the consumers in Clusters 1, 2 and 3. Cluster 4’s drivers were
very similar to the experts and was confirmed by the strong positive correlation
between the two sets of liking scores (r = 0.86, p<0.001). These two quite disparate
cohorts had positive influences of liking in the body and length of the wine, colour

196
intensity, chocolate aroma and dark fruit palate attributes. Negative influences
included tannins, aroma intensity and savoury aroma. The structural elements of the
wine, such as mouthfeel and taste characteristics, played an important role, both
positive and negative, in driving the liking scores of these cohorts and indicated that
winemakers need to pay careful attention in balancing these attributes in their wines.
If one or more of these attributes are out of balance, for example, too much or too little
tannin structure, it is liable to have a marked impact on the subsequent liking of the
wine. Given that many wine experts also act as wine judges and that previous studies
have shown a very strong positive correlation between wine experts’ liking scores and
quality assessments, decreased liking of a wine is also likely to result in a decreased
quality assessment of that wine (Bastian et al. 2010, refer Chapter 4). These results
are consistent with the findings of Lattey and her co-workers (2010). They concluded
that the richer flavoured wines (described as those wines higher in fruit and oak,
amongst other attributes) in their study were more favoured by their wine experts,
which is a conclusion that can be drawn from this study’s data. Their experts also
displayed a very different set of attributes that influenced their wine liking than their
consumers (Lattey et al. 2010).
In respect to the consumers in this study, there were a number of attributes that
consistently negatively impacted on their liking. In particular, green and savoury
aromas were two attributes that the consumers apparently did not like in the 12 wines
tasted. The savoury aroma attribute was a combination of descriptors such as meaty,
gamey and barnyard, some of which might be associated with the presence of
Brettanomyces characters. The least liked wine by both the consumers and experts
returned significantly higher 4-EG/4-EP levels than all other wines. This accords with

197
the work of Lattey et al. (2010) who found that attributes associated with the presence
of Brettanomyces were important negative influences on the liking scores within some
of their identified consumer segments and with the findings of Mueller et al. (2010)
who identified a similar conclusion with band aid aromas and their consumers’ liking
scores. Positive influences on consumer liking, apart from the structural elements
discussed above, include many of the attributes for which Australian Shiraz is best
known; intensity of aroma and flavour, dark fruit on both the nose and palate and oak
derived characters like vanillin and chocolate. These accord well with Muller et al.’s
(2010) findings, who found that fresh and dark fruit and oak characters were well
liked by their consumers..
The aroma intensity attribute polarised most of the wine consumers and experts, some
of whom (Clusters 2 and 3) found it an important positive influence on liking and
others (Clusters 1,4 and the experts) had it as an important negative attribute. A closer
examination of the data revealed that for those who found it a positive influence, other
aroma attributes were also important. These included dark fruit, vanillin oak and to a
lesser extent, chocolate. These generally pleasant aromas contributed to the overall
positive aroma intensity that drove their liking ratings. On the other hand, it would
appear that the savoury aroma and to a lesser extent the green aroma, contributed to
what was perceived by many of the consumers and the wine experts as an unpleasant
aroma intensity and thus contributed in a negative manner to their liking.

198
5.4.4 The drivers of liking of Australian Shiraz of the Connoisseur and No Frills' consumer segments
Of the consumers in the Connoisseur segment, 79% named their favourite Shiraz as
one that met the criterion for a fine wine set out in Chapter 3 (data not shown). We
are therefore confident that these consumers were a true representation of the segment.
As would be expected with a strong correlation between the Connoisseurs’ segment
and the experts’ liking scores, there were similarities in their drivers of liking.
Specifically, the structural components of the wines had both a positive and negative
influence on the Connoisseurs’ liking. The body and length of the wine were positive
influences and overt tannin and alcohol warmth were negative influences. Other
positive influences on liking included dark fruit and chocolate aroma, fruit sweetness
and oak on the palate, flavour intensity and good acid balance. The major negative
driver was coconut aroma. It seems that this segment of consumers like many of the
attributes that are synonymous with Australian Shiraz, including fruit sweetness and
an oak component that manifests as a chocolate rather than a coconut character. It
would also seem that the negative influences reflect some of the criticisms of the style
in that the wines may be overly tannic and high in alcohol (Savage 2010). On the
other hand, the No Frills segments’ main positive influence was aroma intensity,
gained primarily from oak derived vanillin and chocolate characters and dark fruit.
Their primary negative influences were coconut and green aroma and colour intensity.
As a major point of difference with the Connoisseur segment, the structural
components of the wine did not play as important a role in driving this segment’s
liking, indicating that the No Frills segment is more likely to tolerate the higher
alcohol and tannic wines.

199
A further dimension is added to this analysis when the behavioural data of these
segments is examined. The Connoisseurs' preferred wine purchase channel was
independent wine retailers. These retailers carry a greater assortment of non
commercial, more expensive and generally rarer brands as a point of differentiation
from their chain counterparts (AWBC 2010) and these are the types of wines that
might often be sought after by knowledgeable and fine wine consumers. Some of
these wines may be Shiraz wines that are being made in a style that is not reminiscent
of the perceived typical Australian Shiraz that is a fruit and oak driven style (Iland et
al. 2009, Czerwinski 2010). These alternative wines might be from cooler climates,
aged in French oak rather than American oak and have relatively lower alcohol levels.
This style of Shiraz would closely align with the positive influences of liking of the
Connoisseur segment of consumers. This segment buys more wine and spends more
money on wine per month and at higher price points than other fine wine segments.
These higher price points are likely to lead to higher margins for both wine producers
and retailers. The Connoisseurs and independent retailers are a good fit. Conversely,
the No Frills’ consumers’ wine liking is driven by those sensory attributes that are
more readily identified with the more commercial styles of Australian Shiraz and these
styles are found in greater assortment in the supermarket owned and chain retailers. It
therefore comes as no surprise that this segment’s preferred wine purchase channel
was the chain retailers.
The preceding discussion has highlighted that at an aggregated data level, there was
little to distinguish one consumer’s liking of Shiraz wine, from another. However, at
the disaggregated level, the differences in liking became much clearer and in

200
particular, the drivers of liking for the Connoisseur segment were shown to be quite
different from other consumer segments, but similar to the drivers of the expert cohort.
Our hypothesis that the Connoisseur segment had different liking of Shiraz wines
relative to other consumers would therefore seem correct.
On a cautious note, however, the fact remains that even though a consumer might like
a wine and that the drivers of that consumer’s liking are understood by the wine
producer, it does not necessarily follow that the wine will be purchased. Other
extrinsic cues and components of the marketing mix will impact on that final decision
(Lesschaeve et al. 2001, Almenberg & Dreber 2010, Mueller et al. 2010).
5.4.5 Implications for the Australian wine industry
It is clear that the Connoisseur segment is an important one in the Australian domestic
wine market and a key outcome for the industry would be to move more consumers
into this segment. However, the successful strategies to achieve that outcome are not
readily apparent. Let us assume that many of the consumers in the Aspirant segment
may (given their name), like to move into the Connoisseur segment. How might this
be achieved? Their preferred purchase channels are chain retailers. It might therefore
be possible to influence the merchandise mix of these retailers and include a greater
variety of the more complex Shiraz wines preferred by the Connoisseur segment.
These wines would need to be available for tasting so that the Aspirants can compare
and contrast the differing styles. As aspirational wine consumers, it is likely that they
would seek out wine education opportunities and it might be through this avenue that
they are introduced to different styles of Shiraz, with the differing structural properties
explained in a non threatening environment. The female Aspirants also present an

201
opportunity, through their frequenting of the HORECA sector. It might be a strategy
to influence these consumers by placing more of these more elegant and complex
Shiraz wines in the on premise sector and perhaps through sales of that style by the
glass, However, there are no guarantees that any strategy will succeed (Hollebeek et
al. 2007), as it may merely be a purely economic consideration that dictates the
amount of money spent on a bottle of wine. The strategies that influence a consumer’s
move from one segment to another are certainly worthy of further study.
5.4.6 The relationship between consumers’ and experts’ wine liking scores.
Experts have long played a role in the sensory analysis of food and beverages and
were often the arbiters of quality but whether experts’ opinions matched those of
consumers was considered contentious (Moskowitz 1996). More recently, this
discussion has been centred on wine and more specifically, the relationship between
experts’ and consumers’ liking or preference scores. The amount of research
conducted on this aspect is limited (Bastian et al. 2010), however some researchers
reported small or minor correlations between the two scores (Lattey et al. 2004,
Lesschaeve 2007, Lattey et al. 2010). On the other hand, Bastian et al. (2010)
concluded that their strong positive correlation (r= 0.87) between their experts’ and
consumers’ liking scores may have been the first such relationship reported in the
literature. This current study adds to this debate.
The reported r value between these experts and the overall consumer cohort in this
study, of 0.71 was also a large positive correlation, but was not of the same magnitude
reported by Bastian et al. (2010). However, as our consumer sample was segmented

202
by levels of wine knowledge and fine wine consumer behaviours, a closer examination
of this relationship is warranted. In relation to the fine wine consumers, Table 5.7
shows that as the level of fine wine consumer behaviour increases, so does the
corresponding r value between that and the wine experts. This value moves from non
significant, medium strength at the No Frills segment to a significant large positive
value of 0.84 at the Connoisseur segment. A similar pattern was detected with the
three wine knowledge segments.
There are two conclusions that might be drawn from these results. The first is that as
consumers’ wine knowledge increases and with increasing fine wine consumer
behavioural tendencies, the closer to a wine expert the consumer might be considered.
Schiefer and Fischer (2008) stated that, in part, consumers with greater wine
knowledge and experience (length of time drinking wine), particularly those with
experience between 4.5 and 24.5 years, were more closely aligned to wine experts and
our results would accord with their views. Our results also provide support for
Meillon et al. (2010) who found that their experienced wine consumers exhibited
similar preferences to the wine professionals employed in their study.
The second conclusion is that wine experts’ liking scores may be used to predict those
of some consumers. As any consumer market is not homogenous, it would be unwise
to make a global statement that experts can be used to predict all consumers’
preferences for a particular wine style or category. However, our results indicate that
wine expert’s scores might be used to predict some consumer liking. In particular, the
more knowledgeable and the more fine wine behavioural traits exhibited by the
consumers, the closer their liking will match those of wine experts. However, we

203
acknowledge that these views are not universally shared (Lattey et al. 2004, 2010,
Lesschaeve 2007, Goldstein et al. 2008) and further work on this issue may be
warranted.
5.5 Study limitations
Although the number of consumers in this study was appropriate, it might be argued
that the numbers who were based in South Australia was sufficient to bias the data.
However, a one way ANOVA of the liking scores of both the Victorian and South
Australian respondents only revealed one wine that was significantly more liked by
one state over the other (data not shown). Notwithstanding that result, for
completeness, it would be valuable to repeat the exercise with additional consumers
from at least the Sydney market and if at all possible, from Brisbane and Perth. That
would provide a truly representative sample of the Australian wine market. In
addition, the wines that were used in the study, although demonstrating wide sensory
differences, were mainly donated by producers who felt that the wines displayed
characters typical of their respective regions. We had no access to sales or other data
that may have provided guidance on the choice of wines to use in the study and
therefore we had no short listing procedure in place for our wines. Any future study
might consider this aspect and procure a number of wines from various regions that
might then be bench tested to arrive at the final set of wines.
5.6 Conclusion
A number of consumers of Australian Shiraz tasted twelve Australian Shiraz wines
and rated each wine on how much they were liked. These results were compared to

204
those of a cohort of wine experts and a strong positive correlation was found. We
concluded that, contrary to the findings of earlier research, expert wine preferences
could be used to predict the liking of some segments of wine consumers. In particular,
those consumers with high wine knowledge and who scored highly on the FWI (who
we called Connoisseurs) were shown to mimic the preferences of those experts. As
wine consumers are not homogenous, it would be dangerous to state equivocally that
all consumer wine preferences may be predicted by wine experts.
The study also examined the differences in wine liking amongst the consumer sample
and found that at the aggregate level, there were very few noted. However, when the
data were examined in more detail, it was shown that clusters of consumers based on
their wine preferences emerged and that very different wine attributes influenced the
liking of those different clusters. Based on their FWI scores, three segments of
consumers were identified and their wine behaviours and drivers of Shiraz wine liking
examined. The Connoisseur segment spent substantially more money on wine than
their counterparts and also bought and consumed more wine, thus indicating their
relative importance to the industry. The sensory attributes influencing consumers’
liking of Shiraz wines were identified and it was shown that as their fine wine
behaviour increased, consumers’ liking drivers closely aligned with those of the wine
experts. In particular, the sensory attributes that produced more elegant and complex
wines were seen as positive influences on the liking of Australian Shiraz.
5.7 Acknowledgements
The authors would like to sincerely thank the wine producers who donated wine for
the project, without whose support this project would not have been possible. We

205
would also like to thank the DA panellists for their time and enthusiasm and the wine
experts for donating their time and palates. The consumers who freely gave up their
time to complete the questionnaire and attend the tastings on a weekend are also
thanked. The University of Adelaide is a member of the Wine Innovation Cluster
(www.wineinnovationcluster.com) Adelaide, South Australia.

206
Chapter 6 Conclusion
The genesis of this research was the introduction by Wine Australia in 2007 of a four
tiered brand segmentation strategy for the Australian wine industry and in particular,
the segment entitled “Regional Heroes” that produce high quality, fine wines that
display regional characteristics. Inherent in the four tier strategy was a need for
consumers to trade up to higher quality wine. The downturn in Australia’s global
wine markets that was evident in the last years of the first decade of the 21st century,
the perception that the domestic market had been effectively ignored during the
successful years and that there were consumers who had traded up to higher quality
wine, led to the following three part research question:
1. Who are the fine wine consumers in the Australian domestic wine
market?;
2. How do their wine purchase and consumption behaviours differ from
other wine consumers?; and
3. What are the sensory attributes that drive their liking of Australian
Shiraz?
A three stage research project was pursued in order to answer that question. The first
stage of the project developed a novel means of segmenting the Australian domestic
wine market by identifying those consumers who displayed fine wine consumer
behaviour. The sensory attributes that differentiated Australian Shiraz wines sourced
from a number Australian Shiraz producing regions were examined in the second
stage of the project. Finally, the data from the first two stages were married in a

207
consumer study to identify those sensory attributes that drove the liking (and disliking)
of Australian Shiraz by a number of identified segments in the market.
This conclusion revisits the hypotheses related to each stage of the project and briefly
examines each in turn, highlights academic or managerial implications, any research
limitations and potential areas for further research that arise from each stage of the
project.
6.1 Stage 1: Identification of Australian fine wine consumers and comparisons of their wine related behaviour with other segments in the domestic wine market.
H1: The Fine Wine Instrument (FWI) is a suitable base to segment the Australian
domestic wine market.
The FWI consisted of three scales which were labeled Connoisseur, Knowledge and
Provenance, respectively. The three scales were internally reliable and confirmatory
factor analysis suggested unidimensionality for each, so these formed the basis of a
cluster analysis to segment the respondents. This cluster analysis suggested a three
segment solution: one segment that scored highly on all three scales; one that scored at
about the mid point of each scale; and one that scored quite low on all three.
Discriminant analysis suggested that 95% of the respondents were correctly classified,
so that solution was accepted. The three segments were denoted Connoisseur;
Aspirants; and No Frills wine consumers respectively.

208
Given that both EFA and CFA returned suitable data in relation to the three scales that
formed the FWI and that cluster analysis provided a robust three segment formation,
H1 is confirmed.
H2: Wine consumers identified as belonging to the Connoisseurs segment will have
significantly higher scores on all three components of the FWI than consumers
in other segments.
The segment labeled "Connoisseurs" had significantly higher mean scores than the
other two segments on all three components of the FWI, that is the Connoisseur,
Provenance and Knowledge variables (Table 3.6). H2 is therefore confirmed.
H3: Wine consumers identified as belonging to the Connoisseurs segment have
significantly higher wine knowledge and wine involvement scores compared to
consumers in other segments.
The Connoisseur segment had significantly higher objective wine knowledge,
subjective wine knowledge and wine involvement scores (72.4%, 76.3% and 89.1%
respectively) than the other two segments (Table 3.8), thereby confirming H3.
H4: The segment of consumers identified as Connoisseurs will display different
wine purchase and consumption behaviour compared to consumers in other
segments. In particular, they will:
(a) spend significantly more money on wine: and

209
(b) consume significantly more wine than the consumers in the other identified
segments.
The Connoisseur segment spent an average of $306.89 on purchasing an average 12.8
bottles of wine per month, both figures being significantly higher than the other two
segments. That segment also contributed 65% of the overall spend on and consumed
significantly more wine (self reported) than the other two segments (table 3.8). H4 is
confirmed.
Academic and Managerial implications of this stage of the project.
The findings from this stage of the project have both academic and managerial
implications. From an academic point of view, the FWI contributes to the body of
knowledge about wine market segmentation, by providing an alternative segmentation
base to the more commonly used wine knowledge and wine involvement bases. The
FWI is a novel segmentation base and has the potential to supply more sophisticated
analysis with richer consumer profiling and greater understanding of consumers'
underlying motivations than either wine knowledge or wine involvement, bases that
have been previously used in wine market segmentation studies (see, for example,
Lockshin et al. 1997, Hughson & Boakes 2002, Johnson & Bruwer 2003, Lockshin et
al. 2006, Johnson & Bastian 2007, Hollebeek et al. 2007). Also from an academic
point of view, this stage reinforced information about the basic structure of the
Australian domestic wine market. Three segments in the market appear to be
relatively stable and have consistently appeared in various studies of the market since
the mid 1980s. These segments might be termed: basic wine drinkers; knowledgeable
wine drinkers; and conservative or traditional wine drinkers, or No Frills,

210
Connoisseurs and Aspirants as denoted here. Segments similar to these were
identified in the studies of McKinna (1986), Spawton (1991 a, b), Hall and Winchester
(1999), Bruwer et al. (2002), Johnson and Bruwer (2003), Bruwer and Li (2007) and
Johnson and Bastian (2007) and their continuing existence confirmed by the current
study. All these previous studies reported either four or five segments in the
Australian market, including those three stable segments. The format and structure of
any other potential segments within the market might be related to the segmentation
base and type of sample employed in the study. Additionally, the number of any
remaining segments might also be related to these two factors.
Similarly, this novel base may provide detailed information to any manager who
implements such a study and the insights that they might gain could provide them with
a competitive advantage in the marketplace. For example, the Connoisseurs' segment
was not the stereotypical view of a wine connoisseur (Miletic 2008), although some
individuals within this segment might share some of those behavioural traits. About a
third of the consumers in this segment were aged under 35, which might be considered
a departure from the accepted view of a wine connoisseur. These consumers were
willing to take a risk when purchasing wine and had the disposable income to spend a
relatively large sum of money per month on wine. It was demonstrated that this
segment was of particular importance to the Australian wine industry, through their
customer lifetime value (Kotler et al. 2010). They are a segment in which the industry
might reap increased return on its investment through targeted marketing
communications and the provision of unique or alternative wine styles that might
appeal to their risk taking nature. It would also be a folly if the industry ignored other
consumer segments, as those segments displayed behaviours that would benefit the

211
industry. As an example, the importance of younger, female wine consumers to the on
- trade was demonstrated.
Potential research topics.
A number of potential research topics arose from this stage of the project. The use of
the novel FWI as a segmentation base should be replicated. In the current study, a
reliable and validated three segment structure was found. However, replication of the
study might confirm the existence of other segments in the market (as seen in the
previous studies of the Australian wine market mentioned above) and may verify the
assertion of the fundamental structure of the Australian market. Replication would
also provide further updated market intelligence. It would also be of interest to
examine whether the FWI had any cross cultural validity or whether it is only relevant
for Australian consumers.
The way that wine consumers move from one segment to another might be an area of
future research, but the logistics and experimental design of such a study would have
to be well thought through, as a longitudinal study of many wine consumers might
need to be employed.
Originally there was a fourth component to the FWI - one that hypothesised that the
wine consumption occasion might impact on the fine wine behaviour. This
component was excluded from the analysis as EFA revealed that the proposed scale to
measure that behaviour was not unidimensional and also the Cronbach Alpha was
below the accepted threshold of 0.7. Further investigation might provide an

212
unidimensional scale that measures this construct and that may then strengthen the
FWI further.
Limitations revealed in this stage of the project include:
Ideally, a market research firm would have been used to recruit all respondents, to
ensure a stratified sample. However, in practice approximately half of the sample was
recruited in that manner and the remainder were recruited through the use of social
media. This method may have increased the number of more wine involved
respondents, as they might be more inclined to complete a survey about a topic of their
interest. The data from the two separate forms of recruitment were compared and no
significant differences were noted in socio - demographic variables and therefore the
data were combined.
6.2 Stage 2: Multidimensional scaling (MDS), cluster and descriptive analyses provide preliminary insights into Australian Shiraz wine regional characteristics.
H5: Australian shiraz wines originating from the same delimited wine producing
region will share similar sensory characteristics.
Table 4.3 and Figure 4.2 detail the results of the sorting tasks undertaken by the cohort
of wine experts. If two or more wines from the same region were sorted together, this
was considered prima facie evidence that the experts perceived some similarities
between those wines. 52% of the wines in the study were sorted with wines from the
same region. The DA results described in Table 4.3 and Figure 4.6 provide a similar
picture to that of the wine experts. 59% of the wines were grouped with wines from

213
the same region in that exercise. Whilst not a truly convincing result, there is enough
evidence to suggest that H5 was partially confirmed.
Academic and managerial implications.
This was the first time that any study was attempted to try and identify the sensory
attributes that differentiated Shiraz wines produced from different Australian Shiraz
producing regions. The popular wine press has long countenanced the existence of
such differences, however, none had been identified in a structured manner. However,
the data collected did not allow the identification of the sensory attributes that might
be truly regionally specific. The smaller Shiraz producing regions with more
homogenous climatic and geographic conditions, such as Coonawarra, were more
likely to have all their respective wines grouped together. The larger, more diverse
regions had results that were more problematic.
These results should not detract from the academic merit of this stage of the project.
The body of knowledge about Australian Shiraz has been improved and the
suggestions for future research (see below) in relation to specific wine regions, if
undertaken, will strengthen any knowledge about wines (the technique is suitable for
any wine variety or wine style) from that region and provide valuable intelligence to
their marketing communications program.
Research limitations and suggestions for future research.
On reflection, this stage of the research project was ambitious and that ambition was
perhaps reflected in the results. The sample size of three wines from each region was
perhaps too small, however, that was balanced with the required workloads of both the

214
cohort of wine experts and the DA panel. Both may have experienced sensory
overload if the number of wines were increased.
To undertake a true regional comparison of any wine varietal using the techniques
described in this stage of the project would require a great number of wines from each
region and may require extended resources. This might be offset by examining the
wines from a small number of regions, or more likely, from a single region to identify
whether any sub regional differences are evident. The suggestion in Chapter 4 to
facilitate such an exercise is relevant here: "for the true characteristics of the sub
regions to show through in the wines, one would need to undertake a rigorously
controlled trial holding variables such as vintage, clone, harvesting and processing
constant and possibly incorporate vineyard specific measures and climatic data".
One such project, known as the "Barossa Grounds", was initiated in the Barossa
Valley in early 2010 and the candidate was involved in the experimental design and
data analysis. That project has the support of the local wine growers' association and
many of the region's producers donated Shiraz wines for assessment. The 2011 and
2012 tastings saw over 65 individual wines assessed. The very preliminary results
indicate that some sub regional differences might be identified. The McLaren Vale
Grape, Wine and Tourism Association has initiated a similar project which they
named "Scare Earth" (http://www.mclarenvale.info/scarceearth).

215
6.3 Stage 3: The sensory drivers of Australian consumers’ liking of Australian Shiraz
At the aggregated consumer level, there was very little that separated the liking scores
for each of the twelve wines tasted, indicating that there was little product
differentiation shown by the consumers and hence there might be a place in the market
for each of these wines (Schlich 1995, Stone & Sidel 2009). However, at the
disaggregated level, noticeable differences in the sensory attributes that drove the
liking were displayed. These differences are discussed in the next two hypotheses.
H6: The preferences for Australian Shiraz wines of hedonic segments are
determined by different sensory attributes.
Four hedonic clusters of consumers were identified in the data and each of these
clusters had different sensory attributes drive their liking of Australian Shiraz (Figures
5.1, 5.4A and the discussion of Chapter 5). For example, the body of the wine was an
important positive attribute for consumers in Clusters 1 and 4, yet the same attribute
was a negative driver of liking for consumers in Clusters 2 and 3. For the sake of
brevity, further examples of the differences are not provided. H6 is confirmed.

216
H7: The sensory attributes that drive the identified Connoisseur FWI consumer
segment's liking of Australian Shiraz are of a more complex nature than those
of the other FWI segments.
Major differences were evident in the sensory attributes that drove the liking of the
three fine wine segments. In particular, the Connoisseur segment preferred attributes
such as wine body and length, flavour intensity and good acid balance, all of which
contribute to complexity in wines, whereas the No Frills segment were more attracted
to higher alcohol and oaked wines that might be described as commercial wines
(Figure 5.4B and the discussion section of Chapter 5) . The data indicated that H7 was
confirmed.
H8: Wine experts can be used to predict the acceptance of wines of more wine
knowledgeable consumers.
This hypothesis that the hedonic scores of wine experts can be used to predict the
preferences of more knowledgeable consumers might be considered controversial in
some circles. The results demonstrated (Table 5.7) that for the Connoisseur segment,
not only their hedonic scores, but also wine knowledge and wine involvement scores,
were strongly, positively correlated with the respective scores of the wine experts. H8
is therefore confirmed. However, because the wine market is not homogeneous, the
experts' scores could (and should) not be used to predict the preferences of the wider
market or all segments.

217
Academic and managerial implications
This stage of the project expanded on the previous work of Lattey et al. (2010) in a
number of ways. It found that this study's experts’ and consumers’ acceptability
scores were strongly, positively correlated and in particular, found that the correlation
became stronger as the three fine wine segments were progressed. Several arguments
were put forward as to why this might be the case and this was a very different result
from that previously reported by Lattey and her co - workers (2010). The current
study was more targeted in its approach to its consumers, by identifying the consumer
segments prior to examining their acceptance of the wines on offer. The respondents
for this study were drawn mainly from South Australia and Victoria and voluntarily
gave up their time to attend the tasting, as opposed to Lattey et al.’s (2010)
respondents who were all drawn from the Sydney metropolitan area and were paid to
attend. There may well be differences in acceptability for consumers living in
different states, however, to our knowledge, this has not been studied. Although both
studies examined clusters of consumers with similar hedonic scores, the present study
went a step further and looked at the drivers of liking of the three fine wine consumer
based segments. This was the first time such an exercise was undertaken and provided
invaluable information on the likes and dislikes of, in particular, those consumers who
scored highly on the FWI (denoted Connoisseurs). As mentioned above, the
confirmation of H8 might be considered controversial in some academic circles.
Chapter 5 also highlighted some managerial outcomes of this research. In particular,
strategies centred on the importance of the HORECA purchase channel that might be
employed to move Aspirants to the Connoisseur segment were discussed.

218
Limitations and future research
The central location trials (CLTs) were undertaken in Adelaide and Melbourne. For
completeness, in the future similar CLTs might be undertaken in Sydney, Brisbane,
Perth, Hobart and Darwin, to arrive at a truly representative national picture. In
addition, the fact that a CLT was chosen for the consumer study may provide an
avenue for future research. If an alternative setting were chosen, for example a
situational one where consumers rated their acceptability of the wines in a familiar
environment, different results may have been achieved. Running two such studies in
parallel might then provide some fascinating insights.
As alluded to above, the methodological differences may have played a part in the
respective results. Further research might be conducted to examine whether there are
any differences in acceptability between wine consumers resident in different parts of
Australia. In particular, research that examines whether parochial familiarity of
products might underlie the consumer acceptability between States might be very
valuable.
This chapter revisited the research problem and how it was answered and examined
the project hypotheses and showed that the majority of these were confirmed. The
current knowledge base on the research topic has been extended as a result of this
project. As with any research study, not everything went according to plan and the
experience indicated ways that the research might have been improved. However, the
results of the research are valuable to both academia and the wine industry and
provide techniques that might be applied in real world situations.

219
Reference List
ABARE research report 10.4 (2010) Australian wine grape production projections to
2011 – 12 available at www.abare.gov.au/publications_html/crops (accessed 21
January 2011)
Abbott, N. A., Coombe, B. G. and Williams, P. J. (1991) The Contribution of
Hydrolyzed Flavor Precursors to Quality Differences in Shiraz Juice and Wines: An
Investigation by Sensory Descriptive Analysis. Am. J. Enol. Vitic. 42(3), 167 – 174.
Abdi, H., Valentin, D., Chollet, S. and Chrea, C. (2007) Analyzing assessors and
products in sorting tasks: DISTATIS, theory and applications. Food Quality and
Preference 18, 627 – 640.
Aiken, J. W. and Noble, A. C. (1984) Comparison of the Aromas of Oak- and Glass-
Aged Wines. Am. J. Enol. Vitic. 35(4), 196 – 199.
Almenberg, J. and Dreber, A. (2010). When Does the Price Affect the Taste? Results
from a Wine Experiment. SSE/EFI Working Paper Series in Economics and Finance
No. 717. Available at SSRN: http://ssrn.com/abstract=1392208
Amerine, M.A. and Roessler, E.B. (1976) Wines: Their Sensory Evaluation. San
Francisco; W.H. Freeman and Company.

220
Amerine, M. A., Pangborn, R. M., Roessler, E. E. (1965) Principles of Sensory
Evaluation of Food. Academic Press, New York, NY
Andrews, J. T., Heymann, H. and Ellersieck, M. R. (1990) Sensory and Chemical
Analyses of Missouri Seyval Blanc Wines. Am. J. Enol. Vitic. 41(2), 116 – 120.
Anon (2010) Foster's hopes 'Sledgehammer' wines will drive sales growth. Available
at http://www.adelaidenow.com.au/news/breaking-news/fosters-hopes-sledgehammer
wines-will-drive-sales-growth/story-e6frea73-1225942164439 accessed 23 October
2010.
Apstein, M. (2007) Regional Diversity in Australian Wine, Part 2. Available at
http://www.winereviewonline.com accessed 3/4/08
Aubry, V., Etievant, P., Sauvageot, F. and Issanchou, S. (1999) Sensory analysis of
Burgundy Pinot Noir wines: A comparison of orthonasal and retronasal profiling.
Journal of Sensory Studies, 14, 97 – 117.
Aurier, P. and Ngobo, P-V. (1999) Assessment of Consumer Knowledge and its
Consequences: A Multi-Component Approach. Advances in Consumer Research 26,
569-575.
Aurifeille, J-M., Quester, P.G., Lockshin, L. and Spawton, T. (2002) Global vs
international involvement – based segmentation A cross – national exploratory study.
International Marketing Review 19(4), 369 – 386.

221
Australian Bureau of Statistics (2009) 8146.0 - Household Use of Information
Technology, Australia, 2008-09. Available at http://www.abs.gov.au/Ausstats
(accessed 26 October 2010).
Australian Bureau of Statistics (2010) 1329.0 – Australian Wine and Grape Industry,
2010. Available at http://www.abs.gov.au/Ausstats (accessed 21 January 2011)
Australian Standard (1989) Sensory analysis of foods Part 3: Glossary of terms AS
2542.3 – 1989 Standards Australia
Australian Wine and Brandy Corporation (2007b) WineFacts Australian Domestic
Sales, 1996/97 to 2006/07 available at https://www.awbc.com.au/winefacts (accessed
13 August 2007).
Australian Wine and Brandy Corporation (2009) Wine Australia – Regional Heroes
available at http://www.wineaustralia.com/australia (accessed 19 June 2009)
Australian Wine and Brandy Corporation (2010) Retail future trends. Available at
http://www.wineaustralia.com/australia/Default.aspx?tabid=826 Accessed 10 Sep
2010
Australian Workers’ Union (2009) The impact of the Global Financial Crisis on
Australian workers. Available at
http://www.awu.net.au/awu_gfc_report___final_released__30_01_09_.pdf accessed
19 Oct 2010

222
Balestrini, P. and Gamble, P. (2006) Country – of – origin effects on Chinese wine
consumers. British Food Journal, 108(5), 396 – 412.
Ballester, J., Dacremont, C., Le Fur, Y. and Etiévant, P. (2005) The role of olfaction in
the elaboration and use of the Chardonnay wine concept. Food Quality and Preference
16(4), 351 - 359
Ballester, J., Patris, B., Symoneaux, R. and Valentin, D. (2008) Conceptual vs.
perceptual wine spaces: Does expertise matter. Food Quality and Preference 19(3),
267 – 276.
Ballester, J., Abdi, H., Langlois, J., Peyron, D., and Valentin, D. (2009) The odor of
colors: can wine experts and novices distinguish rthe odors of white, red and Rosé
wines? Chemosensory Perception 2, 203 – 213.
Barber, N. (2009) Wine consumers information search: Gender differences and
implications for the hospitality industry. Tourism and Hospitality Research, 9 (3),
250 - 269.
Barber, N., Almanza, B. A. and Donovan, J. R. (2006) Motivational factors of gender,
income and age on selecting a bottle of wine. International Journal of Wine
Marketing, 18 (3), 218 - 232.
Barber, N., Ismail, J. and Dodd, T. (2008a) Purchase attributes of wine consumers
with low involvement. Journal of Food Products Marketing, 14 (1), 69 - 86.

223
Barber, N., Dodd, T. and Ghiselli, R. (2008b) Capturing the younger wine consumer.
Journal of Wine Research, 19 (2), 123 - 141.
Barham, E. (2003) Translating terroir: the global challenge of French AOC labeling.
Journal of Rural Studies 19(1), 127 – 138.
Bastian S.E.P., Collins, C. and Johnson T.E. (2010) Understanding consumer
preferences for Shiraz wine and Cheddar cheese pairings. Food Quality and
Preference 21(7), 668 – 678.
Bastian, S.E.P.,. Payne, C.M., Perronoud, B., Joscelyne, V.L., and. Johnson T. E.
(2009) Comparisons between Australian consumers' and industry experts' perceptions
of ideal wine and cheese combinations. Australian Journal of Grape and Wine
Research 15(2), 175 - 184.
Bende, M. and Nordin, S. (1997) Perceptual learning in olfaction: Professional wine
tasters versus controls. Physiology and Behaviour 62(5) 1065 – 1070.
Bennett, P. D. (1995) Dictionary of marketing terms (2nd Ed.). Chicago: American
Marketing Association.
Bergara – Almeida, S., Aparecida, M. and da Silva, A. P. (2002) Hedonic scale with
reference: performance in obtaining predictive models. Food Quality and Preference,
13, 57 – 64.

224
Berni, P., Begalli, D. and Capitello, R. (2005) An occasion - based segmentation
approach to the wine market in Denmark. Journal of International Food &
Agribusiness Marketing, 17, 117 - 145.
Beverland, M. (2004a) Uncovering “theories – in – use”: building luxury wine brands.
European Journal of Marketing, 38 (3/4), 446 – 466.
Beverland, M. (2004b) An exploration of the luxury wine trade. International Journal
of Wine Marketing, 16(3), pp. 14 – 28.
Beverland, M. (2005) Crafting brand authenticity: The case of luxury wines. Journal
of Management Studies 42(5), 1003 - 1029.
Beverland, M. and Luxton, S. (2005) Managing integrated marketing communication
(IMC) through strategic decoupling. How luxury wine firms retain brand leadership
while appearing to be wedded to the past. Journal of Advertising, 34 (4) 103 – 116.
Beverland, M. (2006) The "real thing": Branding authenticity in the luxury wine
trade. Journal of Business Research 59 (2006), 251 - 258.
Blackman, J. and Saliba, A. (2009) Sensory characterization of Hunter Valley
Semillon using descriptive analysis. Flavour and Fragrance Journal, 24, 238 – 244.
Bloch, P. H. (1986) The Product Enthusiast: Implications for Marketing Strategy
Journal of Consumer Marketing 3(3), 51 - 62

225
Bonoma, T. V. and Shapiro, B. P. (1984) Evaluating market segmentation approaches.
Industrial Marketing Management 13(4), 257 - 268.
Brown, T.A. (2006) Confirmatory factor analysis for applied research. New York,
NY: The Guildford Press.
Brucks, M. (1985) The Effects of Product Class Knowledge on Information Search
Behavior. The Journal of Consumer Research 12, 1-16.
Brunner, T. A. and Michael Siegrist, M. (2011) A consumer-oriented segmentation
study in the Swiss wine market. British Food Journal, Vol. 113 (3), 353 – 373
Bruwer, J and Li, E. (2007) Wine-Related Lifestyle (WRL) Market Segmentation:
Demographic and Behavioural Factors. Journal of Wine Research, 18 (1), 19 – 34.
Bruwer, J., Li, E. and Reid, M. (2002) Segmentation of the Australian wine market
using a Wine – Related Lifestyle approach. Journal of Wine Research 13(3), 217 –
242.
Bruwer, J. and Johnson, T.E. (2004) unpublished confidential business report,
Regional Branding Study: Adelaide Hills Wine Region.
Bruwer, J. d. W. and Johnson, T. E. (2005) The Drivers of On-premise Beverage
Selection in Australia. ISBN 0-9593180-1-1. published by Australian Wine and
Brandy Corporation, Adelaide

226
Bruwer, J. and Wood, G. (2005) The Australian online wine-buying consumer:
Motivational and behavioural perspectives. Journal of Wine Research, 16(3), 193 –
211.
Bruwer, J and Li, E. (2007) Wine-Related Lifestyle (WRL) Market Segmentation:
Demographic and Behavioural Factors. Journal of Wine Research, 18 (1), 19 – 34.
Bruwer, J. and Nam, K-H. (2010) The BYOB of wine phenomenon of consumers in
the Australian licensed on – premise foodservice sector. International Journal of
Hospitality Management 29 (2010) 83 – 91.
Canberra District Wines 2010 Available at http://www.canberawines.com.au accessed
17/03/2010
Campo, E., Do, B.V., Ferreira, V. and Valentin, D. (2008) Aroma properties of young
Spanish monovarietal white wines: a study using sorting task, list of terms and
frequency of citation. Australian Journal of Grape and Wine Research 14, 104 – 115.
Carroll, J.D. (1972) Individual differences and multidimensional scaling. In R. N.
Shepard, A. K. Romney & S. B. Nerlove, Multidimensional scaling: theory and
applications in the behavioral sciences (Vol. 1, pp. 105 - 155). New York: Seminar
Press
227
Cartier, R., Rytz, A., Lecomte, A., Poblete, F., Krystlik, J., Belin, E. and Martin, N.
(2006) Sorting procedure as an alternative to quantitative descriptive analysis to
obtain a product sensory map. Food Quality and Preference, 17, 562 - 571
Charters, S. and Pettigrew, S. (2006) Product Involvement and the evaluation of wine
quality. Qualitative Market Research: An International Journal 9(2), 181 – 193.
Charters, S. and Pettigrew, S. (2007) The dimensions of wine quality Food Quality
and Preference 18 (2007), 997 – 1007.
Chatonnet, P., Dubourdieu, D., Boidron, J-N. and Pons, M. (1992) The origin of
Ethylphenols in Wines. Journal of the Science of Food and Agriculture, 60, 165 –
178.
Chollet, S. and Valentin, D. (2001) Impact of training on beer flavor perception and
description: Are trained and untrained subjects really different? Journal of Sensory
Studies 16, 601 - 608.
Chollet, S., Valentin, D. and Abdi, H. (2005) Do trained assessors generalize their
knowledge to new stimuli? Food Quality and Preference, 16 (1), 13 - 23.
Cholette, S. and Castaldi, R. M. (2005) Analyzing the US retail wine market using
price and consumer segmentation models. In Proceedings of the 2nd Annual
International Wine Marketing Symposium, Sonoma, CA, 2005. Available at
http://academyofwinebusiness.com/ accessed 13 July 2011.

228
Cohen, J.W. (1988). Statistical power analysis for the behavioural sciences. 2nd
Ed.
Hillsdales: Lawrence Erlbaum Associates, pp. 75-81.
Colman, T. (2009) The Land Down Under makes more than just cheap, mass –
produced shiraz, available at http://www.forbes.com/2009/06/18/good-australian-
wines-lifestyle-wine-australia.html (accessed 19 June 2009)
Constellation Wines (2005) Project GenomeSM Home and Habits Available at
www.cwineus.com/export/sites/cwine accessed 12 July 2011.
Costanigro, M., McCluskey, J. J. and Mittelhammer, R. C. (2007) Segmenting the
wine market based on price: Hedonic regression when different prices mean different
products. Journal of Agricultural Economics, 58 (3), 454 - 466.
Costello, A. B. and Osborne, J. W. (2005) Best practices in exploratory factor
analysis: Four recommendations for getting the most from your analysis. Practical
Assessment, Research & Evaluation, 10 (7), 1 - 9.
Cox, D. (2009). Predicting Consumption, Wine Involvement and Perceived Quality of
Australian Red Wine. Journal of Wine Research, 20(3), pp. 209 – 229.
Croser, B. (2005) The Idea of Quality - Creating Sustainable Competitive Advantage,
available at
http://www.finewinepress.com/modules.php?op=modload&name=News&file=article
&sid=11 (accessed 18 June 2009).

229
Croser, B. (2010) Prospects for Australian Smaller “Fine Wine” Producers. Pre-
AARES conference workshop, The World’s Wine markets by 2030: Terroir, Climate
Change, R&D and Globalization, Adelaide, South Australia, 7-9 February, 2010.
Czerwinski, J. (2010) Finding the Soul in Australian Shiraz. Available at
http://www.winemag.com/Wine-Enthusiast-Magazine/Best-Of-Year-2000/Finding
the-Soul-in-Australian-Shiraz/ Accessed 10/9/2010
De La Presa – Owens, C. and Noble, A. C. (1995) Descriptive Analysis of Three
White Wine Varieties from Penedes. Am. J. Enol. Vitic. 46(1), 5 – 9.
Department of Foreign Affairs and Trade (2009) Australia Now – The
Australian wine industry, available at http://www.dfat.gov.au/facts/wine.html
(accessed 18 June 2009)
DeSarbo, W. S., Manrai, A. K. and Manrai, L. A. (1994) Latent class
Multidimensional Scaling: A review of recent developments in the Marketing and
Psychometric literature. In Advanced Methods for Marketing Research, Richard P.
Bagozzi (ed.), Cambridge: Blacwell 190 - 222.
Dodd, T. H., Laverie, D. A., Wilcox, J. F. and Duhan, D. F. (2005) Differential
Effects of Experience, Subjective Knowledge, and Objective Knowledge on Sources
of Information used in Consumer Wine Purchasing. Journal of Hospitality &
Tourism Research 29, 3-19.

230
Drummond, G. and Rule, G. (2005) Consumer confusion in the UK wine industry.
Journal of Wine Research, 16 (1), 55 - 64.
Dry, P.R., Maschmedt, D.J., Anderson, C.J., Riley, E., Bell, S-J. and Goodchild, W.S.
(2004) The grapegrowing regions of Australia. In Viticulture Volume 1 – Resources
2nd
Edition Coombe, B. and Dry, P.R. (Eds.). Adelaide, Winetitles
Dunn, J. (2010) Restaurants experience strongest February sales. Available at
http://www.ausfoodnews.com.au/2010/04/01/restaurants-experience-strongest-
february-sales.html accessed 19 Oct 2010.
Durrieu, F. (2008) Impact of brand identity on labelling: the case of regional branding.
In proceedings of the 4th International Conference of the Academy of Wine Business
Research, Siena, 17-19 July, 2008.
Elliott, C. (2006) Considering the Connoisseur: Probing the language of taste.
Canadian Review of American Studies, 36(2), 229 – 236.
Engel, J. F. and Blackwell, R. D. (1982) Consumer behavior. Dryden Press, Chicago
IL.
Etaio, I., Elortondo, F. J. P., Albisu, M., Gaston, E., Ojeda, M. and Schlich, P. (2008a)
Effect of winemaking process and addition of white wine grapes on the sensory and
physiochemical characteristics of young red wines. Australian Journal of Grape and
Wine Research, 14, 211 – 222.

231
Etaio, I., Elortondo, F. J. P., Albisu, M., Gaston, E., Ojeda, M. and Schlich, P.
(2008b) Development of a quantitative sensory method for the description of young
red wines from the Rioja Alavesa. Journal of Sensory Studies, 23, 631 – 655.
Etaio, I., Elortondo, F. J. P., Albisu, M., Gaston, E., and Schlich, P. (2008c) Sensory
attribute evolution in bottled young red wines from Rioja Alavesa. Eur Food Res
Technol, 228, 695 – 705.
Falconer, R., Liebich, B. and Hart, A. (2006) Automated color sorting of hand –
harvested Chardonnay. Am. J. Enol. Vitic., 57(4), 491 – 496
Fischer, U. (2000) Practical Applications of Sensory Research: Effect of Glass Shape,
Yeast Strain, and Terroir on Wine Flavor. Proceedings of the ASEV 50th Anniversary
Annual Meeting, Seattle, Washington June 19 – 23, 2000.
Flynn, L. R. and Goldsmith, R. E. (1993) Application of the Personal Involvement
Inventory in Marketing. Psychology and Marketing 10(4), 357 – 366.
Flynn, L. R. and Goldsmith, R. E. (1999) A Short, Reliable Measure of Subjective
Knowledge. Journal of Business Research 46, 57-66.
Foedermayr, E. K. and Diamantopoulos, A. (2008a) Exploring the construct of
segmentation effectiveness: Insights from international companies and experts.
Journal of Strategic Marketing, 16(2), 129 - 156.

232
Foedermayr, E. K. and Diamantopoulos, A. (2008b) Market segmentation in practice:
Review of empirical studies, methodological assessment, and agenda for future
research. Journal of Strategic Marketing, 16(3), 223 - 265.
Fogarty, J.J. (2006) The return to Australian fine wine. European Review of
Agricultural Economics Vol 33 (4) (2006) pp. 542–561.
Foley, M. (2009) A grim morning after for Australian wines, available at
http://www.nytimes.com/2009/06/23/business/global/23wine.html?_r=1&ref=asia
(accessed 23/6/09)
Francis, I. L., Sefton, M. A. and Williams, P. J. (1992) A Study by Sensory
Descriptive Analysis of the Effects of Oak Origin, Seasoning, and Heating on the
Aromas of Oak Model Wine Extracts. Am. J. Enol. Vitic. 43(1), 23 – 30.
Frank, R. E. (1972) Predicting new product segments. Journal of Advertising
Research, 12(3), 9 - 13.
Frank, R. E., Massy, W. F. and Wind, Y. (1972) Market Segmentation, Englewood
Cliffs, NJ: Prentice Hall.
Frøst, M. B. and Noble, A. C. (2002) Preliminary Study of the Effect of
Knowledge and Sensory Expertise on Liking for Red Wines. American Journal
of Enology and Viticulture 53, 275-284.

233
Fulconis, F. and Viviani, J-L. (2006) Segmentation of the Romanian wine market: An
exploratory study. Refereed paper, 3rd International Wine Business Research
Conference, Montpellier, 6 – 8 July, 2006. Available at
http://academyofwinebusiness.com/ accessed 3 May 2011.
Gambuti, A., Lamorte, S., Capuano, R., Genovese, A., Lisanti, M.T.,
Piombino, P. and Moio, L. 2007. Study of the influence of grape ripeness
degree on aroma characteristics of Aglianico wines by instrumental and
sensory analysis.. Acta Hort. (ISHS) 754:533-540
Gargett, K (2009) One man mission to change how Aussie wines are perceived,
available at http://www.news.com.au/couriermail/story/0,23739,26389423-
5013512,00.html (accessed 24/11/09).
GATT (1994) available at
http://www.wto.org/english/docs_e/legal_e/legal_e.htm (accessed 1 July 2009)
Gawel, R. (1997) The use of language by trained and untrained experienced wine
tasters. Journal of Sensory Studies 12, 267 – 284.
Gawel, R., Iland, P. G. and Francis, I. L. (2001) Characterizing the astringency of red
wine: a case study. Food Quality and Preference 12(1), 83 – 94.
Gawel, R., Francis, I. L. and Waters, E. J. (2007) Statistical Correlations between the
In-Mouth Textural Characteristics and the Chemical Composition of Shiraz Wines. J.

234
Agric. Food Chem. 58(7), 2683-2687.
Geraghty, S. and Torres, A. M. (2009) The Irish wine market: a market
segmentation study. International Journal of Wine Business Research, 21(2), 143 -
154.
Gerbing, D. W. and Anderson, J. C. (1988) An updated paradigm for scale
development incorporating unidimensionality and its assessment. Journal of
Marketing Research, 25 (2), 186 - 192.
Gladstones, J. S. (2002) Viticulture and Environment (5th
Ed.) Adelaide, Winetitles
Gluckman, R. L., (1990) A Consumer Approach to Branded Wines. European Journal
of Marketing, Vol. 24(4), pp.27 - 46
Goldsmith, R. E. and Emmert, J. (1991) Measuring product category involvement: A
multitrait-multimethod study. Journal of Business Research 23(4), 363-371
Goldsmith, R. E., d’Hauteville, F. and Flynn, L. R. (1998) Theory and Measurement
of Consumer Innovativeness A Transnational Evaluation. European Journal of
Marketing 32, 340-353
Goldsmith, R. E. and d’Hauteville, F. (1998) Heavy wine consumption: empirical and
theoretical perspectives. British Food Journal 100(4), 184-190.

235
Goldsmith, R. E. (2000) Identifying wine innovators: A test of the Domain Specific
Innovativeness Scale using known groups. International Journal of Wine Marketing,
12(2), 37 - 46.
Green, P. E. (1977) A new approach to Market Segmentation. Business Horizons, 20,
61 - 73.
Greenblat, E. (2010) California dreaming. Available at
www.smh.com.au/business/california-dreaming-20101114-17sos.html accessed
16/11/2010.
Greenhoff, K. and MacFie, H. (1994) Preference mapping in practice. In H.J.H.
MacFie and D.M.H. Thompson, Measurement of food preferences, Blackie Academic
& Professional, London, pp. 137 – 166.
Grossman, D. (2006) Can Aussie wines gain traction above $10? Wine Business
Monthly, April 2006, pp. 58 - 62
Guinard, J-X. and Cliff, M. (1987) Descriptive Analysis of Pinot noir Wines from
Carneros, Napa, and Sonoma. Am. J. Enol. Vitic. 38(3), 211 – 215.
Gunter, B. and Furnham, A. (1992) Consumer Profiles: An Introduction to
Psychographics, London, Routledge.

236
Hall, J. & Lockshin, L. S., 1999, Understanding Wine Purchasing - It’s not the
consumer, it’s the occasion, Wine Industry Journal, Vol. 14, No. 3, 69 – 78.
Hall, J. & Winchester, M., 1999, An Empirical Confirmation of Segments in the
Australian Wine Market, International Journal of Wine Marketing, Vol. 11 (1), 19 –
35
Halstead, L., Neudorf, E., Rastegar, N. and Spitzer, N. (2010) Energising established
wine markets. In Proceedings, 14th Australian Wine Industry Technical Conference.
Heathcote Winegrowers Association 2010 available at
http://www.heathcotewinegrowers.com.au accessed 17/03/2010
Heymann, H. and Noble, A. C. (1987) Descriptive Analysis of Commercial Cabernet
Sauvignon Wines from California. Am. J. Enol. Vitic. 38(1), 41 -44
Hollebeek, L.D., Jaeger, S.R., Brodie, R.J. and Balemi, A. (2007) The influence of
involvement on purchase intention for new world wine. Food Quality and Preference
18(8), 1033-1049.
Howard, R. and Stonier, J. (2002) Marketing wine to Generation - X. Australia New
Zealand Wine Industry Journal, 17 (3), 78 - 82.
Hu, X., Li, L., Xie, C. And Zhou, J. (2008) The effects of country – of – origin on
Chinese consumers’ wine purchasing behaviour. Journal of Technology Management

237
in China, 3(3), 292 – 306.
Hughson, A. L. and Boakes, R. A. (2001) Perceptual and cognitive aspects of wine
expertise. Australian Journal of Psychology 53, 103-108.
Hughson, A. L. and Boakes, R. A. (2002) The knowing nose: the role of knowledge
in wine expertise. Food Quality and Preference 13, 463-472.
Hughson, A. L., Ashman, H., De La Huerga, V. and Moskowitz, H. (2004) Mind -
sets of the wine consumer. Journal of Sensory Studies, 19 (2004), 85 - 105.
Hunter Valley Wine Association 2010 available at
http://www.winehuntervalley.com.au accessed 17/03/2010.
Hussain, M., Cholette, S. and Castaldi, R. (2007) Determinants of wine
consumption of US consumers: an econometric analysis International Journal
of Wine Business Research 19(1) 49 – 62.
Iland, P., Bruer, N., Edwards, G., Weeks, S., & Wilkes, E. (2004) Chemical analysis
of grapes and wine: techniques and concepts. Adelaide: Winetitles.
Iland, P., Gago, P., Caillard, A. and Dry, P. (2009) A Taste of the World of Wine,
Patrick Iland Wine Promotions Pty ltd. Adelaide, South Australia

238
Ilieva, J., Baron, S. and Healey, N. M. (2002) Online surveys in marketing research:
pros and cons. International Journal of Market Research 44(3), 361 – 376.
ISO (1992) Sensory Analysis – Vocabulary. NF ISO 5492, V 09-021.
ISO, 2000 ISO, International Organization of Standardization, 14040 Series—
environmental management, Geneva, Switzerland (2000).
Jackson, R. S. (2002) Wine tasting: a professional handbook San Diego: Academic
Press.
Jaeger, S. R., Wakeling, I. N., and MacFie, H. J. H. (2000) Behavioural extensions to
preference mapping: the role of synthesis. Food Quality and Preference, 11, 349 -
359.
Jaeger, S.R., Danaher, P.J. and Brodie, R.J. (2009) Wine purchase decisions and
consumption behaviours: Insights from a probability sample drawn in Auckland, New
Zealand. Food Quality and Preference, 20(4), 312 – 319.
Jaworski, B.J. and Kohli, J.C., 1993, Market Orientation: Antecedents and
Consequences. Journal of Marketing, Vol. 57, (July 1993), pp.53 – 70.
Jefford, A. (2008) Andrew Jefford’s wine course. London Ryland Peters & Small

239
Jennings, D. &Wood, C., 1994 Wine: Achieving Competitive Advantage Through
Design, International Journal of Wine Marketing Vol. 6, no.1, pp. 49 – 61.
Jenster, P. and Cheng, Y. (2008) Dragon wine: developments in the Chinese wine
industry. International Journal of Wine Business Research, 20(3), 244 – 259.
Johnson, E. J. and Russo, J. E. (1984) Product Familiarity and Learning New
Information. The Journal of Consumer Research 11, 542-550.
Johnson, L. W., Ringham, L., & Jurd. K., 1991, Behavioural Segmentation in the
Australian Wine Market Using Conjoint Choice Analysis, International Journal of
Wine Marketing, 3(1), 26 – 31
Johnson, T.E. (2002) Lifestyle based segments in the South Australian wine market
And their impact on wine retailing. Master’s Thesis, The University of Adelaide,
Department of Horticulture, Viticulture and Oenology.
Johnson, T. E. and Bruwer, J. d. W. (2003) An empirical confirmation of wine-
related lifestyle segments in the Australian wine market. International Journal of
Wine Marketing 15, 5-33.

240
Johnson, T. E. and Bastian, S.E.P. (2007) A preliminary study of the relationship
between Australian wine consumers’ wine expertise and their wine purchasing and
consumption behaviour. Australian Journal of Grape and Wine Research 13(3), 186 –
197.
Jones, L. (2010) AWBC restructure to help enhance wine image, reputation. The
Australian & New Zealand Grapegrower & Winemaker April 2010, Issue 555, p.10.
Kapferer, J-N. (2004) The New Strategic Brand Management: Creating and
Sustaining Brand Equity Long Term. 3rd Edition London: Sterling, VA: Kogan Page
Kapferer, J-N. and Laurent, G. (1993) Further Evidence on the Consumer
Involvement Profile: Five Antecedents of Involvement. Psychology and Marketing,
10(4), 347 – 355.
King, M. C., Hall, J. and Cliff, M. A. (2001) A comparison of methods for evaluating
the performance of a trained sensory panel. Journal of Sensory Studies, 16, 567 –
581.
King. E. S., Kievit, R. L., Curtin, C., Swiegers, J. H., Pretorius, I. S., Bastian, S. E. P.
and Francis, I. L. (2010) The effect of multiple yeasts co – inoculations on Sauvignon
Blanc wine aroma composition, sensory properties and consumer preference. Food
Chemistry, 122, 618 – 626.

241
King, E. S., Osidacz, P., Francis, I. L., Bastian, S. E. P. and Johnson, T. E. (2011a)
Consumer liking of white wines: segmentation using self-reported wine liking and
wine knowledge. International Journal of Wine Business Research, in print.
King, E. S., Osidacz, P., Curtin, C., Bastian, S. E. P., and Francis, I. L. (2011b),
Assessing desirable levels of sensory properties in Sauvignon Blanc wines – consumer
preferences and contribution of key aroma compounds. Australian Journal of Grape
and Wine Research 17 (2), 169-180
Kolyesnikova, N., Dodd, T. H. and Wilcox, J. B. (2009) Gender as a moderator of
reciprocal behavior. Journal of Consumer Marketing 26 (3), 200 - 213.
Kotler, P., Brown, L., Burton, S. Deans, K.R. and Armstrong, G. (2010) Marketing, 8th
edn, Pearson Prentice Hall, Sydney, Australia.
Koussissi, E., Paterson, A. and Piggott, J. R. (2003) Sensory flavour discrimination of
Greek dry red wines. Journal of the Science of Food and Agriculture, 83, 797 – 808.
Kruskal, J. B. (1964). Multidimensional scaling by optimizing goodness-of-fit to a
non-metric hypothesis. Psychometrika, 29, 1–27.
Langlois, J., Ballester, J., Campo, E., Dacremont, C. and Peyron, D. (2010)
Combining olfactory and gustatory clues in the judgement of aging potential of red
wine by wine professionals. Am. J. Enol. Vitic. 61(1), 15 – 22

242
Langlois, J., Dacremont, C., Peyron, D., Valentin, D. and Dubois, D. (2011) Lexicon
and types of discourse in wine expertise: The case of vin de garde. Food Quality and
Preference, 22 (2011), 491 – 498.
Langton’s 2010 Langton’s Classification of Australian Wine available at
http://www.langtons.com.au/Wine/Classification.aspx (accessed 23 April 2010).
Lattey, K.A., Smyth, H.E., D’Costa, N.E., Leibich, B.K. and Francis. I.L. (2004).
Consumer acceptability and sensory properties of a set of commercial Australian
Riesling and unwooded Chardonnay wines. In proceedings of the 12th Australian
Wine Industry Technical Conference, Melbourne, Australia (Australian Wine Industry
Technical Conference Inc) p 319.
Lattey, K.A., Bramley, B.R. and Francis, I.L. (2010) Consumer acceptability, sensory
properties and expert quality judgements of Australian Cabernet Sauvignon and Shiraz
wines. Australian Journal of Grape and Wine Research 16, 189 – 202.
Laurent, G. and Kapferer, J-N. (1985) Measuring Consumer Involvement Profiles.
Journal of Marketing Research 22(1), 41 - 53
Lawless, H. T. (1984) Flavor description of white wine by ‘‘expert' and nonexpert
wine consumers. Journal of Food Science 49, 120 - 123.
Lawless, H. T. (1989) Exploration of fragrance categories and ambiguous odors using
multidimensional scaling and cluster analysis. Chemical Senses, 14 (3), 349 - 360.

243
Lawless, H. T., Sheng, N. and Knoops, S. S. C. P. (1995) Multidimensional Scaling
of sorting data applied to cheese perception. Food Quality and Preference, 6, 91 - 98.
Lawless, H., Liu, Y-F. and Goldwyn, C. (1997) Evaluation of wine quality using a
small – panel hedonic scaling method. Journal of Sensory Studies 12, 317 – 332.
Lawless, H T and Heymann, H. (2010) Sensory Evaluation of Food: Principles
and Practices (2nd Ed). Food Science Text Series, Springer Science + Business
Media LLC, New York 10013.
Lee, K., Zhao, J. and Ko, J-Y. (2005) Exploring the Korean wine market. Journal of
Hospitality & Tourism Research, 29 (1), 20 - 41.
Lehrer, A. (1975) Talking about Wine. Language 51, 901-923.
Lelièvre, M., Chollet, S., Abdi, H. and Valentin, D. (2008) What is the validity of the
sorting task for describing beers? A study using trained and untrained assessors. Food
Quality and Preference 19 (8), 697 – 703.
Lesschaeve, I., Norris, L.N. and Lee, T.H. (2001) Defining and targeting consumer
preferences. In proceedings of the 11th Australian Wine Industry Technical
Conference, Adelaide, Australia (Australian Wine Industry Technical Conference Inc)
pp 118 - 122.

244
Lesschaeve, I. (2003) Evaluating wine "Typicité" using sensory techniques:
application to Washington Merlot Wines. In proceedings, 5th Pangborn sensory
science symposium, Boston
Lesschaeve, I. and Findlay, C. (2004) Development of a wine style guided by
consumer research. In proceedings of the 12th Australian Wine Industry Technical
Conference, Melbourne, Australia (Australian Wine Industry Technical Conference
Inc) pp. 34 – 37.
Lesschaeve, I. (2007) Sensory Evaluation of Wine and Commercial Realities: Review
of Current Practices and Perspectives. Am. J. Enol. Vitic. 58(2), 252 – 258.
Levine, M. and Pownall, S. (2004) Wine Industry Outlook: Consumption
Demographics, Market Segmentation, Trends and Opportunities in proceedings of
2004 Wine Industry Outlook Conference, Darling Harbour, Sydney, Australia.
Liu, F. and Murphy, J. (2007) A qualitative study of Chinese wine consumption and
purchasing Implications for Australian wines. International Journal of Wine Business
Research, 19(2), 98 – 113.
Lockshin, L. S., Spawton, A. L. and Macintosh, G. (1997) Using product, brand and
purchasing involvement for retail segmentation. Journal of Retailing and Consumer
Services 4(3), 171 – 183.

245
Lockshin, L. S., 1999, Wine Marketing: Science or science fiction? Wine Industry
Journal, Vol. 14, No.1, 65 – 67
Lockshin, L. S., Quester, P. G. and Spawton, A. L. (2001) Segmentation by
Involvement or Nationality for Global Retailing: A Cross-national Comparative Study
of Wine Shopping Behaviours. Journal of Wine Research 12(3), 223 – 236.
Lockshin, L. S. (2003) Consumer Purchasing Behaviour for Wine: What We Know
and Where We Are Going in Márches et Marketing du Vin, Centre de recherche de
Bordeaux Ecole de Management, Bordeaux, France
Lockshin, L., Jarvis, W., d’Hauteville, F., and Perrouty, J-P. (2006) Using simulations
from discrete choice experiments to measure consumer sensitivity to brand, region,
price, and awards in wine choice. Food Quality and Preference 17(3-4), 166 – 178.
Lund, C.M., Thompson, M.K., Benkwitz, F., Wohler, M.W., Triggs, C.M., Gardner,
R., Heymann, H. and Nicolau, L. (2009) New Zealand Sauvignon Blanc distinct
flavour characteristics: Sensory, chemical and consumer aspects. American Journal of
Enology and Viticulture 60(1), 1 - 12.
MacFie, H. J. H. and Thomson, D. M. H. (1988) Preference mapping and
multidimensional scaling. In J. R. Piggott (ed), Sensory Analysis of Foods. Elsevier
Applied Science, New York, 381 - 409.

246
MacFie, H. J. H. and Hedderley, D. (1993) Current practice in relating sensory
perception to instrumental measurements. Food Quality and Preference, 4, 41 - 49.
MacFie, H. J., Bratchell, N., Greenhoff, K. and Vallis, L. (1989) Designs to balance
the effect of order of presentation and first order carry-over effects in Hall tests.
Journal of Sensory Studies 4(2), 129 – 148.
McGee, H., & Patterson, D. (2007). Talk dirt to me. New York Times, 6May2007
MacRae, A. W., Howgate, P. and Geelhoed, E. (1990) Assessing the similarity of
odours by sorting and by triadic comparison. Chemical Senses, 15 (6), 691 - 699.
McCutcheon, E., Bruwer, J. and Li, E. (2009) Region of origin and its importance
among choice factors in the wine – buying decision making of consumers.
International Journal of Wine Business Research, 21(3), 212 – 234.
McDaniel, M., Henderson, L. A., Watson, B. T. and Heatherbell, D. (1987) Sensory
Panel Training and Screening for Descriptive Analysis of the Aroma of Pinot Noir
Wine Fermented by Several Strains of Malolactic Bacteria. Journal of Sensory
Studies 2(3), 149 – 167.
McEwan, J. A. (1996) Preference mapping for product optimization. In T. Naes & E.
Risvik, Multivariate analysis of data in sensory science ( 71 - 102). Amsterdam:
Elsevier.

247
McKinna, D., (1986) Attitudes, Behaviours, Perceptions and Knowledge with Respect
to South Australian Wine, A Report on a Qualitative and Quantitative Research
Program, David McKinna et al. Pty. Ltd., Unit 15, Albert Square, 37 Albert Road,
Melbourne, 3004.
McLaren Vale "Scare Earth" available at http://www.mclarenvale.info/scarceearth
accessed 13 December 2012.
Madrigal – Galan, B. and Heymann, H. (2006) Sensory Effects of Consuming Cheese
Prior to Evaluating Red Wine Flavor. Am. J. Enol. Vitic. 57(1), 12 – 22.
Malhotra, N.K., Hall, J., Shaw, M. and Crisp, M. (1996) Marketing research: an
applied orientation (Australian Edition), Prentice Hall, New York, Sydney
Marketo, C. G., Cooper, T., Petty, M. F. and Scriven, F. M. (1994) The reliability of
MDPREF to show individual preference. Journal of Sensory Studies, 9, 337 - 350.
Melcher, J.M. and Schooler, J. W. (1996) The Misremembrance of Wines Past:
Verbal and Perceptual Expertise Differentially Mediate Verbal Overshadowing of
Taste Memory. Journal of Memory and Language 35, 231-245.
Meillon, S., Dugas, V., Urbano, C. and Schlich, P. (2010) Preference and
acceptability of partially dealcoholised white and red wines by consumers and
professionals. American Journal of Enology and Viticulture 61(1), 42 - 52.

248
Merriam – Webster Dictionary available at
http://www.merriam webster.com/dictionary/connoisseur accessed 5 July 2011
Miletic, D. (2008) Four sommeliers walk into a bar … Available at
http://www.theage.com.au/news/national/how-not-to-be-a-wine
wanker/2008/02/22/1203467387114.html accessed 6 December 2010.
Mitchell, V.W. and Greatorex, M. (1989) Risk reducing strategies used in the
purchase of wine in the UK. European Journal of Marketing 23, 31–46.
Mitry, D. J., Smith, D. E. and Jenster, P. V. (2009) China’s role in global competition
in the wine industry: A new contestant and future trends. International Journal of
Wine Research, 1(2009), 19 – 25.
Mittal, B. (1988) The role of affective choice mode in the consumer purchase of
expressive products. Journal of Economic Psychology, 9(4), 499-524.
Mittal, B. and Lee, M-S. (1989) A causal model of consumer involvement. Journal of
Economic Psychology 10(3), 363-389.
Mittal, B. (1995) A comparative analysis of four scales of consumer involvement.
Psychology and Marketing, 12 (7), 663 – 682.
Monash University Faculty of Business and Economics (2010),
http://www.buseco.monash.edu.au/mkt/dictionary/mmm.html (accessed 9March
249
2011)
Moskowitz, H. R. (1988) Applied Sensory Analysis of Foods: Vols 1 and 11. CRC
Press, Boca Raton, FL.
Moskowitz, H. (1996) Experts versus consumers: A comparison. Journal of Sensory
Studies 11 (1996), 19 – 37.
Mtimet, N. and Albisu, L. M. (2006) Spanish wine consumer behavior: A choice
experiment approach. Agribusiness, Vol 22(3), 343 - 362.
Mueller, S., Osidacz, P., Francis, L. And Lockshin, L. (2010) The relative importance
of extrinsic and intrinsic wine attributes: Combining discrete choice and informed
consumer testing. Proceedings of 5th International Conference of the Academy of
Wine Business Research, February 2010, Auckland, New Zealand.
Narver, J.C. and Slater, S.F., 1990, The Effect of Market Orientation on Business
Profitability, Journal of Marketing, Vol. 54 (October 1990), pp.20 – 35.
Noble, A. C. (1978) Sensory and instrumental evaluation of wine aroma. In: Analysis
of Food and Beverages, G. Charalambous (Ed). P. 260. Academic Press, New York,
NY.
Noble, A. C. (1979) Evaluation of Chardonnay Wines Obtained from Sites with
Different Soil Compositions. Am. J. Enol. Vitic. 30(3), 214 – 217

250
Noble, A. C., Williams, A. A. and Langron S. P. (1984) Descriptive analysis and
quality ratings of 1976 wines from four Bordeaux communes. J Sci. Food Agric. 35,
88 – 98.
Noble, A. C., Arnold, R. A., Masuda, B. M., Pecore, S. D., Schmidt, J. O. and Stern,
P. M (1984) Progress Towards a Standardized System of Wine Aroma Terminology
Am. J. Enol. Vitic. 35, 107 – 109
Noble, A. C. and Shannon, M. (1987) Profiling Zinfandel Wines by Sensory and
Chemical Analyses. Am. J. Enol. Vitic. 38(1), 1-5.
Nowak, L., Thach, L. and Olsen, J. E. (2006) "Wowing the millennials: creating brand
equity in the wine industry", Journal of Product & Brand Management, Vol. 15 Iss: 5,
pp.316 - 323.
OIV (2010) Report of the Director General of the OIV on the world vitiviniculture
situation in 2009. Available at www.news.reseau-concept.net accessed 21/5/2011.
Olsen, J. E., Thach, L. and Nowak, L. (2007) Wine for My Generation: Exploring
How US Wine Consumers are Socialized to Wine. Journal of Wine Research, 18 (1),
1 - 18.
Pagès, J. (2005) Collection and analysis of perceived product inter - distances using
multiple factor analysis: Application to the study of 10 white wines from the Loire
Valley. Food Quality and Preference, 16, 642 - 649.

251
Park, C. W. and Lessig, V. P. (1981) Familiarity and Its Impact on Consumer
Decision Biases and Heuristics. The Journal of Consumer Research 8, 223-231.
Parr, W. V., Heatherbell, D.A. and White, K. G. (2002) Demystifying wine expertise:
Olfactory threshold, perceptual skill and semantic memory in expert and novice wine
judges. Chemical Senses 27(8), 747 – 755
Parr, W. V., White, K. G. and Heatherbell, D. A. (2004) Exploring the nature of wine
expertise: what underlies wine experts' olfactory recognition memory advantage?
Food Quality and Preference 15(5), 411 – 420.
Parr, W. V., Green, J. A., White, K. G. and Sherlock, R. R. (2007) The distinctive
flavour of New Zealand Sauvignon blanc: Sensory characterisation by wine
professionals. Food Quality and Preference 18(6), 849 – 861
Parr, W.V., Valentin, D., Green, J.A. and Dacremont, C. (2010) Evaluation of French
and New Zealand Sauvignon wines by experienced French wine assessors. Food
Quality and Preference, 21, 56 - 64
Paxton, A., (1994), The original in-depth report examines the social and ecological
costs of long distance food transport. SAFE Alliance
Perrin, L., Symoneaux, R., Maitre, I., Asselin, C., Jourjon, F. and Pages, J. (2007)
Comparison of conventional profiling by a trained tasting panel and free profiling by
wine professionals. Am. J. Enol. Vitic. 53(4), 508 – 517.

252
Perrin, L., Symoneaux, R., Maître, I., Asselin, C., Jourjon, F., and Pagès, J. (2008)
Comparison of three sensory methods for use with the Napping procedure: Case of
ten wines from the Loire valley. Food Quality and Preference 19 (2008), 1 – 11.
Perrouty, J. F., d'Hauteville, F., and Lockshin, L. (2006) The influence of wine
attributes on region of origin equity: An analysis of the moderating effect of
consumer's perceived expertise. Agribusiness 22, 323-341.
Phylloxera and Grape Industry Board of SA (2010) SA Winegrape Utilisation and
Pricing Survey 2010 available at www.phylloxera.com.au (accessed 20 January 2011)
Piombino, P., Nicklaus, S., Le Fur, Y., Moio, L., and Le Quéré, J-L. (2004) Selection
of Products Presenting Given Flavor Characteristics: An Application to Wine. Am. J.
Enol. Vitic. 55(1) 27 – 34.
Plassmann, H., O’Doherty, J., Shiv, B. and Rangel, A. (2008) Marketing actions can
modulate neural representations of experienced pleasantness. Proceedings of the
national Academy of Sciences USA, 105, 1050 – 1054.
Plummer, J. T. (1974) The concept and application of life style segmentation. Journal
of Marketing, 38(1), 33 - 37.
Preston, L. D., Block, D. E., Heymann, H., Soleas, G., Noble, A. C., and
Ebeler, S. E. (2008) Defining Vegetal Aromas in Cabernet Sauvignon Using Sensory
and Chemical Evaluations. Am. J. Enol. Vitic. 59(2) 137 – 145.

253
Quester, P. G. and Smart, J. (1998) The influence of consumption situation and
product involvement over consumers’ use of product attribute. Journal of Consumer
Marketing 15, 220 - 238.
Quester, P. G. and Lim, A. L. (2003) Product involvement/brand loyalty: is there a
link? Journal of Product & Brand Management 12(1), 22- 38
Raju, P. S., Lonial, S. C. and Mangold, W. G. (1995) Differential Effects of
Subjective Knowledge, Objective Knowledge, and Usage Experience on Decision
Making. Journal of Consumer Psychology 4, 153-180.
Rankine, B. (1990) Tasting and enjoying wine. (Winetitles: Adelaide)
Rao A.R., and Monroe K.B. (1989). The effect of price, brand name, and store name
on buyers’ perceptions of product quality: an integrative review. Journal of Marketing
Research, 36, 351 – 357.
Reizenstein, R. C. and Barnaby, D. J. (1980) Assessing Consumer and Retailer
Perception of Table Wine and Wine Store Attributes. Advances in Consumer
Research 7(1), 95 – 100.
Ritchie, C. (2007) Beyond drinking: the role of wine in the life of the UK consumer.
International Journal of Consumer Studies, 31 (5), 534 - 540.

254
Roberts, S. D. and Micken, K. S. (1996), "Le Fromage as life: French attitudes and
behavior toward cheese”. In Advances in Consumer Research Volume 23, eds. Kim
P. Corfman and John G. Lynch Jr., Provo, UT : Association for Consumer Research,
Pages: 111-119.
Robichaud, J., Bleibaum, R.N., & Thomas, H. (2007). Cracking the consumer code –
linking winemakers to consumers to increase brand loyalty. In proceedings of the 13th
Australian Wine Industry Technical Conference; 28 July – 2 August 2007; Adelaide,
Australia. 151-156.
Robinson, J. (2006) Croser salutes his mentor. www.jancisrobinson.com/articles/
accessed 12/07/07.
Rosenberg, S., Nelson, C. and Vivekananthan, P.S. (1968) A multidimensional
approach to the structure of personality impressions. J Pers. Soc. Psychol. 9, 283 –
294.
Rosenberg, S. and Kim, M. P. (1975) The method of sorting as a data gathering
procedure in multivariate research. Multivariate Behavioral Research, 10, 489-502.
Sáenz – Navajas, M. –P., Martín – López, C., Ferreira, V. and Fernández – Zurbano,
P. (2011) Sensory properties of premium Spanish red wines and their implication in
wine quality perception. Australian Journal of Grape and Wine Research, 17(1), 9 –
19.

255
Saint-Eve, A., Paçi Kora, E. and Martin, N. (2004) Impact of the olfactory quality and
chemical complexity of the flavouring agent on the texture of low fat stirred yogurts
assessed by three different sensory methodologies. Food Quality and Preference 15 (7-
8), 655 – 668.
Sanchez, M. and Gil, J.M. (1998) Consumer preferences for wine attributes in
different retail stores: a conjoint approach. International Journal of Wine Marketing,
10 (1), 25-39.
Santos, C. R., Blanco, M. C. and Fernández, A. G. (2006) Segmenting wine
consumers according to their involvement with appellations of origin. Brand
Management, 13(4/5), 300 - 312.
Sausen, K., Tomczak, T. and Hermann, A. (2005) Development of a taxonomy of
strategic market segmentation: a framework for bridging the implementation gap
between normative segmentation and business practice. Journal of Strategic
Marketing, 13(3), 151 - 173.
Sauvageot, F. (1994) Les sciences de l'aliment et le concept de typicité ou le chercheur
e sciences de la nature a-t-il quelque chose à déclarer sur la typicité d'un produit
alimentaire? Sciences des Aliments 14(5), 557 - 571
Sauvageot, F., Urdapilleta, I. and Peyron, D. (2006) Within and between variations of
texts elicited from nine wine experts Food Quality and Preference 17, 429 – 444.

256
Savage, G (2010) Australian Shiraz: A plum job. Available at
http://www.thedrinksbusiness.com/index.php?option=com_content&task=view&d=10
76&Itemid=66 Accessed 10/9/2010
Schiefer, J. and Fischer, C. (2008). The gap between wine expert ratings and
consumer preferences: Measures, determinants and marketing implications.
International Journal of Wine Business Research, 20(4), 335 – 351
Schlich, P. (1995) Preference mapping: Relating consumer preferences to sensory or
instrumental measurements. In: P. Etievant and P. Schreier (eds), Bioflavour:
Analysis/Precursor Studies/Biotechnology. INRA Editions, Versailles, France
Schlosser, J., Reynolds, A. G., King, M. and Cliff, M. (2005) Canadian terroir:
sensory characterization of Chardonnay in the Niagara Peninsula. Food Research
International 38(1), 11 – 18.
Sidel, J.L. and Stone, H. (1993) The role of sensory evaluation in the food industry.
Food Quality and Preference, 4, 65 – 73.
Sivertsen, H. K., Holen, B., Nicolaysen, F. and Risvik, E. (1999) Classification of
French red wines according to their geographical origin by the use of multivariate
analyses. Journal of the Science of Food and Agriculture 79(1), 107 – 115.
Sivertsen, H. K., Figenschou, E., Nicolaysen, F. And Risvik, E. (2001) Sensory and
chemical changes in Chilean Cabernet Sauvignon wines during storage in bottles at

257
different temperatures. Journal of the Science of Food and Agriculture, 81, 1561 –
1572.
Slater, S.F. and Narver, J.C., 1995, Market orientation and the learning organization
Journal of Marketing, Vol. 59 (July 1995), pp.63 – 74.
Smart, R. E. and Dry, P.R. (2004) Vineyard Site Selection. In Viticulture Volume 1 –
Resources 2nd Edition Coombe, B. and Dry, P.R. (Eds.). Adelaide, Winetitles.
Smith, W. (1956) Product differentiation and market segmentation as alternative
marketing strategies. Journal of Marketing, 21, 3- 8.
Solomon, G. E. A. (1990) Psychology of Novice and Expert Wine Talk. The
American Journal of Psychology 103, 495-517.
Solomon, G. E. A. (1997) Conceptual Change and Wine Expertise. The Journal of
the Learning Sciences 6, 41-60.
Spawton, A. L., 1991a, Grapes and Wine Seminar – Prospering in the 1990s:
Changing Your View of the Consumer, International Journal of Wine
Marketing, Vol. 3(1), 32 – 41
Spawton, A. L., 1991b, Of Wine and Live Asses: An Introduction to the Wine
Economy and State of Marketing, European Journal of Wine Marketing, 25(3), 1 –

258
48.
Steenkamp, J-B, E.M., and Ter Hofstede, F. (2002) International market segmentation:
Issues and perspectives. International Journal of Research in Marketing, 19(3), 185 -
213.
Stone, H., Sidel, J., Oliver, S., Woolsey, A., and Singleton, R. C. (1974) Sensory
Evaluation by Quantitative Descriptive Analysis. Food Technology 28, 25-26, 28-29,
32-22.
Stone, H. and Sidel, J. (2009) Sensory Science and Consumer Behavior. In: Global
Issues in Food Science and Technology. Eds. Barbosa-Canovas, G., Mortimer, A.,
Lineback, D., Spiess, W., Buckle, K. and Colonna, P. Academic Press, London, UK.
pp67 – 77.
Strand, G. (2005) Against Connoisseurship. Swink Magazine available at
http://swinkmag.com/stand.html
Sun, L-X., Danzer, K., and Thiel G. (1997) Classsification of wine samples by means
of artificial neural networks and discrimination analytical methods. Fresenius’
Journal of Analytical Chemistry 359, 143 – 149.
Syarief, H., Hamann, D. D., Giesbrecht, F. G., Young, C. T., and Monroe, R. J. (1985)
Comparison of Mean and Consensus Scores from Flavor and Texture Profile Analyses
of Selected Food Products. Journal of Food Science 50(3), 647 – 650.

259
Thach, E. C. and Olsen, J. E. (2004) The Search for New Wine Consumers: Marketing
Focus on Consumer LifeStyle or LifeCycle. International Journal of Wine Marketing,
16 (3), pp.44 - 57.
Thach, E. C. and Olsen, J. E. (2006) Market segment analysis to target young adult
wine drinkers. Agribusiness, 22 (3), 307 - 322.
The Economist (2008) From quantity to quality available at
http://www.economist.com/business accessed 31/3/08.
Thomas, A. and Pickering, G. (2003) Behavioural segmentation: a New Zealand wine
market application. Journal of Wine Research, 14(2), 127 – 138.
Torgerson, W. S. (1952) Multidimensional Scaling: 1. Theory and Method.
Psychometrika, 17 (4), 401 - 419.
Tóth, A. H. and Totth, G. (2003) Wine purchase behavior and personal value based
consumer segmentation. In Proceedings 1st Colloquium in Wine Marketing,
Adelaide, 2003. Available at http://academyofwinebusiness.com/ accessed 13 July
2011.
van Kleef, E., van Trijp, H. C. M. and Luning, P. (2006) Internal versus external
preference analysis: An exploratory study on end - user evaluation. Food Quality and
Preference, 17, 387 - 399.

260
Varela, P. and Gámbaro, A. (2006) Sesnory descriptive analysis of Uruguyan Tannat
wine: Correlation to quality assessment. Journal of Sensory Studies, 21, 203 – 217.
Vigneron, F. and Johnson, L. W. (1999) A Review and a Conceptual Framework of
Prestige-Seeking Consumer Behavior. Academy of Marketing Science Review
1999(1), 1 - 15.
Vilanova, M., Genisheva, Z., Masa, A. and Oliveira, J. M. (2010) Correlation between
volatile composition and sensory properties in Spanish Albariño wines.
Microchemical Journal, 95, 240 – 246.
Walker, T., Morris, J., Threlfall, R. and Main, G. (2004) Quality, Sensory and Cost
Comparison for pH Reduction of Syrah Wine Using Ion Exchange or Tartaric Acid.
Journal of Food Quality 27(6), 483 – 496.
Walton, S. (2006) Down under going backwards? available at http://www.wine-
pages.com/guests/stuart/australia.htm accessed 12/07/07
Warren, C. (2009) Australia Wine – A Beginner’s Guide Ottawa, ON, The Pocket
Sommelier.
Wedel, M. and DeSarbo, W. S. (1994) A review of latent class regression models and
their applications. In Advanced Methods for Marketing Research, Richard P. Bagozzi
(ed.), Cambridge: Blacwell 353 - 388.

261
Wedel, M. and Kamakura, W. A. (2000) Market Segmentation Conceptual and
Methodological Foundations (2nd Ed.) Kluwer Academic Publishers, Boston,
Dordrecht, London.
White, P. (2010) A taste of Barossa. Available at http://www.indaily.com.au accessed
20/01/2010.
Wilkie, W. L. and Cohen, J. B. (1977) An overview of Market Segmentation concepts
and approaches. Marketing Science Institute Working Paper.
Wind, Y. (1978) Issues and advances in segmentation research. Journal of Marketing
Research, 15, 317 - 337.
Wine Australia: Directions to 2025 An Industry Strategy for Sustainable Success.
Winemakers’ Federation of Australia, Australian Wine and Brandy Corporation,
2007.
Wine Australia (2009) GI Introduction. Available at http://www.wineaustralia.com
(accessed 1 July 2009).
Wine Australia (2010a) Winefacts Australian wine export approvals, by country,
volume and value. Available at http://www.wineaustralia.com/australia/ accessed
16/11/10.

262
Wine Australia (2010b) Winefacts Domestic sales of Australian wine by type (‘000
litres). Available at http://www.wineaustralia.com/australia/ accessed 16/11/10.
Wine Australia (2010c) Retail. Available at
http://www.wineaustralia.com/australia/Default.aspx?tabid=4191 accessed 24
October 2010.
Wine Australia (2011) Wine Australia Overview 2011. Available at
http://www.wineaustralia.com/australia/Default.aspx?tabid=5530 accessed
26/7/11.
Wine Intelligence (2010) Fine Wine Intelligence Who drinks expensive wine?
Available at www.wineintelligence.com (accessed 3 June 2010).
Winemakers’ federation of Australia (WFA) and Australian Wine and Brandy
Corporation (AWBC) (2007) Wine Australia: Directions to 2025 An industry strategy
for sustainable success.
Winemakers’ Federation of Australia, Wine Grape Growers’ Australia, Australian
Wine and Brandy Corporation and Grape and Wine Research Development
Corporation (2009) Wine industry must confront the reality of oversupply available at
http://www.wfa.org.au/resources/1/Reports/WRAA/WRAA_statement_10-11.pdf
(accessed 24/11/09).

263
Winemakers’ Federation of Australia (2010) 2010 WFA Vintage Report. Available at
www.wfa.org.au (accessed 26 May 2010).
Wine Market Council (2011) Consumer Research Summary. Available at
http://www.winemarketcouncil.com/research_summary.asp Accessed 29 July 2011.
Wood, C., Siebert, T.E., Parker, M., Capone, D.L., Elsey, G.M., Pollnitz, A.P.,
Eggers, M., Meier, M., Vössing, T., Widder, S., Krammer, G., Sefton, M.A. and
Herderich, M.J. (2008) From Wine to Pepper: Rotundone, an Obscure Sesquiterpene,
Is a Potent Spicy Aroma Compound. J. Agric. Food Chem., 2008, 56 (10), pp 3738–
3744.
Wyner, G., 1992, Segmentation Design, Marketing Research, Volume 4 (December
1992), Issue 4, pp 38 – 42.
Young, F. W. (1985) Multidimensional Scaling. In Encyclopedia of Statistical
Sciences, Volume 5, Kotz-Johnson (Ed.), John Wiley & Sons, Inc.
Yadegaran, J. (2010) Millenials: The next generation of wine judges. Available at
http://www.mercurynews.com/libations/ci_15580076?sourdce=email accessed 30
July 2010.
Yegge, J.M., and Noble, A.C. (2000) The Identification of Sensory and Non-sensory
Attributes of Californian Chardonnay Wines That Influence Acceptance and Purchase
Intent For Differing Segments of Consumers. Proceedings of the ASEV 50th

264
Anniversary Annual Meeting, Seattle, Washington June 19 – 23, 2000.
Yuan, J., So, S-I. and Chakravarty, S. (2005) To Wine or Not to Wine: Profiling a
Wine Enthusiast for a Successful List. Journal of Nutrition in Recipe & Menu
Development 3(3/4), 63 - 79
Zaichkowsky, J. L. (1985) Measuring the Involvement Construct. The Journal of
Consumer Research 12(3), 341-352.
Zaichkowsky, J. L. (1988) Involvement and the Price Cue. Advances in Consumer
Research 15(1), 323 - 327
Zamora, M. C. and Guirao, M. (2004) Performance Comparison Between Trained
Assessors and Wine Experts Using Specific Sensory Attributes. Journal of Sensory
Studies 19(6), 530 – 545.

265
Appendix 1 Details of the FWI
The statements that comprise the three variables of the Fine Wine Instrument are
detailed below. Respondents were required to indicate their level of agreement to
each statement on a 9 point categorical scale, where 1 = they strongly disagreed with the
statement; 5 meant that they neither agreed nor disagreed; and 9 meant that they strongly
agreed with the statement. The words in parentheses represent the coding of the various
statements in SPSS and allow interpretation of the data in the following Appendices.
Connoisseur Variable
I can generally recall the memorable wines that I drink (Recallwines).
I keep a record of the wines that I buy (recordkeeping).
I prefer shopping for and buying wine from specialty outlets (shopspecialtywinestores).
I have a special wine storage space (either at home or elsewhere) that allows me to age my
wines and maintain a wine collection (storagespace).
I usually buy at least a half dozen bottles (mixed or same) each time I buy wine (sixbottlebuy).
I always check my wine for cork or other taints (checkfortaints).
I prefer to drink older wines than younger wines (olderatherthanyoungerwines).
Provenance Variable
I am choosy when it comes to selecting wines from particular vintages (Choosyvintages).
I often look for rare or scarce wines (rarescarcewines).
When drinking wine, it is important for me to know in which country the wine was made
(provenanceimportant).
For me, the grape variety from which the wine is made is an important consideration
(varietyimportant).

266
I prefer wines from certain geographical regions (winefromcertainregions).
In my wine collection, it is important to have wines from countries other than Australia
(lotsacountries).
Knowledge Variable
I regularly attend special wine tastings or wine club meetings (Attendtastings).
I regularly read wine magazines and wine reviews in newspapers (Readwinemags).
I take more notice of wine related articles in the press and TV than I did two years ago
(morenoticewine).
Being knowledgeable about wine gives me a great deal of satisfaction
(knowledgeableimportant).
I would like to learn more about wine styles and their countries of origin (liketolearnmore).

267
Appendix 2 Exploratory Factor Analysis data of the
FWI. The following data are the outputs from SPSS following Exploratory Factor Analysis
of each of the three variables of the Fine Wine Instrument.
Connoisseur Variable
Reliability Statistics
Cronbach's Alpha N of Items
.817 7
Item-Total Statistics
Scale
Mean if
Item
Deleted
Scale
Variance
if Item
Deleted
Corrected
Item-Total
Correlation
Cronbach's
Alpha if
Item
Deleted
Recallwines 29.86 123.723 .582 .789
recordkeeping 32.30 122.286 .519 .799
shopspecialtywinestores 30.99 125.553 .519 .799
storagespace 30.77 105.886 .698 .765
sixbottlebuy 30.89 120.307 .450 .815
checkforfaults 29.88 112.563 .678 .770
olderatherthanyoungerwine
s
30.33 132.558 .482 .805

268
KMO and Bartlett's Test
Kaiser-Meyer-Olkin Measure of Sampling Adequacy. .854
Approx. Chi-Square 2140.158
df 21
Bartlett's Test of Sphericity
Sig. .000
Total Variance Explained
Initial Eigenvalues
Extraction Sums of Squared
Loadings
Factor Total
% of
Variance
Cumulative
% Total
% of
Variance
Cumulative
%
1 3.394 48.484 48.484 2.838 40.538 40.538
2 .891 12.725 61.208
3 .758 10.831 72.039
4 .643 9.184 81.223
5 .504 7.194 88.418
6 .443 6.334 94.752
7 .367 5.248 100.000
Extraction Method: Maximum Likelihood.

269
Factor Matrixa
Factor
1
Recallwines .663
recordkeeping .562
shopspecialtywinestores .587
storagespace .772
sixbottlebuy .510
checkforfaults .772
olderatherthanyoungerwines .534
Extraction Method: Maximum Likelihood.
a. 1 factors extracted. 4 iterations required.

270
Provenance Variable
Reliability Statistics
Cronbach's Alpha N of Items
.843 6
Item-Total Statistics
Scale Mean
if Item
Deleted
Scale
Variance if
Item Deleted
Corrected
Item-Total
Correlation
Cronbach's
Alpha if
Item Deleted
Choosyvintages 26.98 83.365 .653 .812
rarescarcewines 28.33 82.827 .568 .828
provenanceimportant 25.95 81.022 .650 .811
varietyimportant 25.58 81.031 .681 .805
winefromcertainregi
ons
26.03 80.871 .694 .803
lotsacountries 27.48 84.770 .503 .842
KMO and Bartlett's Test
Kaiser-Meyer-Olkin Measure of Sampling Adequacy. .821
Approx. Chi-Square 2605.432
df 15
Bartlett's Test of Sphericity
Sig. .000

271
Total Variance Explained
Initial Eigenvalues
Extraction Sums of Squared
Loadings
Facto
r Total
% of
Variance
Cumulative
% Total
% of
Variance
Cumulative
%
1 3.404 56.739 56.739 2.891 48.191 48.191
2 .935 15.577 72.316
3 .643 10.712 83.028
4 .408 6.797 89.825
5 .345 5.743 95.568
6 .266 4.432 100.000
Extraction Method: Maximum Likelihood.
Factor Matrixa
Factor
1
Choosyvintages .648
rarescarcewines .534
provenanceimportant .751
varietyimportant .819
winefromcertainregions .840
lotsacountries .496
Extraction Method: Maximum Likelihood.
a. 1 factors extracted. 4 iterations required.

272
Knowledge Variable
Reliability Statistics
Cronbach's Alpha N of Items
.846 5
Item-Total Statistics
Scale Mean
if Item
Deleted
Scale
Variance if
Item Deleted
Corrected
Item-Total
Correlation
Cronbach's
Alpha if
Item Deleted
Attendtastings 20.50 64.851 .613 .826
Readwinemags 19.74 59.877 .703 .801
morenoticewine 19.56 65.999 .579 .835
knowledgeableimport
ant
18.86 63.683 .731 .796
liketolearnmore 18.13 64.317 .654 .815
KMO and Bartlett's Test
Kaiser-Meyer-Olkin Measure of Sampling
Adequacy.
.832
Approx. Chi-Square 2063.049
df 10
Bartlett's Test of
Sphericity
Sig. .000

273
Total Variance Explained
Initial Eigenvalues
Extraction Sums of Squared
Loadings
Fact
or Total
% of
Variance
Cumulativ
e % Total
% of
Variance
Cumulativ
e %
1 3.114 62.280 62.280 2.661 53.218 53.218
2 .662 13.242 75.522
3 .528 10.552 86.074
4 .382 7.638 93.712
5 .314 6.288 100.000
Extraction Method: Maximum Likelihood.
Factor Matrixa
Factor
1
Attendtastings .678
Readwinemags .770
morenoticewine .629
knowledgeableimportant .824
liketolearnmore .731
Extraction Method: Maximum Likelihood.
a. 1 factors extracted. 4 iterations required.

274
Appendix 3 - CFA Data for the three FWI variables
CFA Data -Connoisseur Variable
CMIN
Model NPAR CMIN DF P CMIN/DF
Default model 19 19.848 9 .019 2.205
Saturated model 28 .000 0
Independence model 7 2146.850 21 .000 102.231
RMR, GFI
Model RMR GFI AGFI PGFI
Default model .097 .994 .982 .320
Saturated model .000 1.000
Independence model 2.437 .504 .339 .378
Baseline Comparisons
Model NFI
Delta1 RFI
rho1 IFI
Delta2 TLI
rho2 CFI
Default model .991 .978 .995 .988 .995
Saturated model 1.000 1.000 1.000
Independence model .000 .000 .000 .000 .000
Parsimony-Adjusted Measures
Model PRATIO PNFI PCFI
Default model .429 .425 .426
Saturated model .000 .000 .000
Independence model 1.000 .000 .000
NCP
Model NCP LO 90 HI 90
Default model 10.848 1.626 27.766
Saturated model .000 .000 .000
Independence model 2125.850 1977.412 2281.623

275
FMIN
Model FMIN F0 LO 90 HI 90
Default model .020 .011 .002 .027
Saturated model .000 .000 .000 .000
Independence model 2.113 2.092 1.946 2.246
RMSEA
Model RMSEA LO 90 HI 90 PCLOSE
Default model .034 .013 .055 .885
Independence model .316 .304 .327 .000
AIC
Model AIC BCC BIC CAIC
Default model 57.848 58.149 151.415 170.415
Saturated model 56.000 56.444 193.889 221.889
Independence model 2160.850 2160.961 2195.322 2202.322
ECVI
Model ECVI LO 90 HI 90 MECVI
Default model .057 .048 .074 .057
Saturated model .055 .055 .055 .056
Independence model 2.127 1.981 2.280 2.127
HOELTER
Model HOELTER
.05 HOELTER
.01
Default model 867 1110
Independence model 16 19

276
CFA Data - Knowledge Variable
CMIN
Model NPAR CMIN DF P CMIN/DF
Default model 12 2.170 3 .538 .723
Saturated model 15 .000 0
Independence model 5 2068.138 10 .000 206.814
RMR, GFI
Model RMR GFI AGFI PGFI
Default model .040 .999 .996 .200
Saturated model .000 1.000
Independence model 2.676 .469 .204 .313
Baseline Comparisons
Model NFI
Delta1 RFI
rho1 IFI
Delta2 TLI
rho2 CFI
Default model .999 .997 1.000 1.001 1.000
Saturated model 1.000 1.000 1.000
Independence model .000 .000 .000 .000 .000
Parsimony-Adjusted Measures
Model PRATIO PNFI PCFI
Default model .300 .300 .300
Saturated model .000 .000 .000
Independence model 1.000 .000 .000
NCP
Model NCP LO 90 HI 90
Default model .000 .000 6.677
Saturated model .000 .000 .000
Independence model 2058.138 1912.333 2211.282

277
FMIN
Model FMIN F0 LO 90 HI 90
Default model .002 .000 .000 .007
Saturated model .000 .000 .000 .000
Independence model 2.036 2.026 1.882 2.176
RMSEA
Model RMSEA LO 90 HI 90 PCLOSE
Default model .000 .000 .047 .964
Independence model .450 .434 .467 .000
AIC
Model AIC BCC BIC CAIC
Default model 26.170 26.312 85.265 97.265
Saturated model 30.000 30.178 103.869 118.869
Independence model 2078.138 2078.198 2102.761 2107.761
ECVI
Model ECVI LO 90 HI 90 MECVI
Default model .026 .027 .033 .026
Saturated model .030 .030 .030 .030
Independence model 2.045 1.902 2.196 2.045
HOELTER
Model HOELTER
.05 HOELTER
.01
Default model 3660 5313
Independence model 9 12
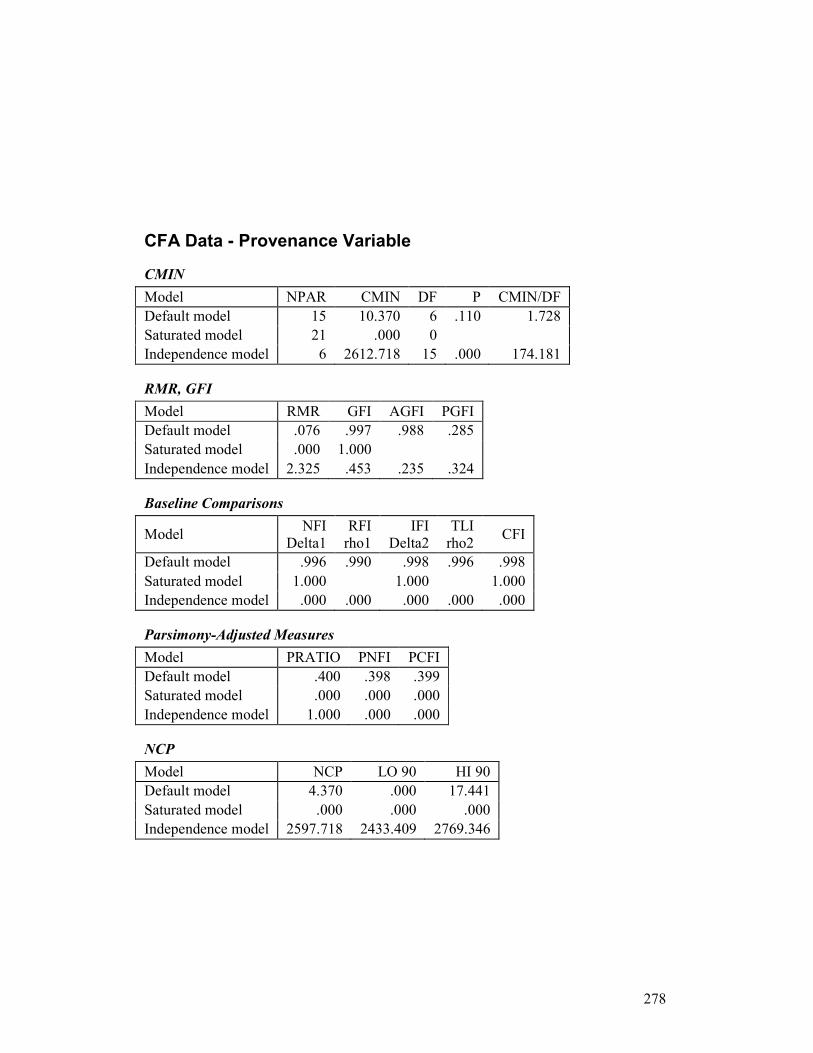
278
CFA Data - Provenance Variable
CMIN
Model NPAR CMIN DF P CMIN/DF
Default model 15 10.370 6 .110 1.728
Saturated model 21 .000 0
Independence model 6 2612.718 15 .000 174.181
RMR, GFI
Model RMR GFI AGFI PGFI
Default model .076 .997 .988 .285
Saturated model .000 1.000
Independence model 2.325 .453 .235 .324
Baseline Comparisons
Model NFI
Delta1 RFI
rho1 IFI
Delta2 TLI
rho2 CFI
Default model .996 .990 .998 .996 .998
Saturated model 1.000 1.000 1.000
Independence model .000 .000 .000 .000 .000
Parsimony-Adjusted Measures
Model PRATIO PNFI PCFI
Default model .400 .398 .399
Saturated model .000 .000 .000
Independence model 1.000 .000 .000
NCP
Model NCP LO 90 HI 90
Default model 4.370 .000 17.441
Saturated model .000 .000 .000
Independence model 2597.718 2433.409 2769.346

279
FMIN
Model FMIN F0 LO 90 HI 90
Default model .010 .004 .000 .017
Saturated model .000 .000 .000 .000
Independence model 2.572 2.557 2.395 2.726
RMSEA
Model RMSEA LO 90 HI 90 PCLOSE
Default model .027 .000 .053 .919
Independence model .413 .400 .426 .000
AIC
Model AIC BCC BIC CAIC
Default model 40.370 40.578 114.239 129.239
Saturated model 42.000 42.291 145.417 166.417
Independence model 2624.718 2624.802 2654.266 2660.266
ECVI
Model ECVI LO 90 HI 90 MECVI
Default model .040 .035 .053 .040
Saturated model .041 .041 .041 .042
Independence model 2.583 2.422 2.752 2.583
HOELTER
Model HOELTER
.05 HOELTER
.01
Default model 1234 1648
Independence model 10 12

280
Appendix 4: Chapter 4 as published in Food, Quality
and Preference

Johnson, T.E., Hasted, A., Ristic, R. & Bastian, S.E.P. (2013). Multidimensional scaling (MDS), cluster and descriptive analyses provide preliminary insights into Australian Shiraz wine regional characteristics. Food Quality & Preference, v. 29 (2), pp. 174-185
NOTE:
This publication is included on pages 281-292 in the print copy of the thesis held in the University of Adelaide Library.
It is also available online to authorised users at:
http://dx.doi.org/10.1016/j.foodqual.2013.03.010

293
Appendix 5: Statement of the contributions of jointly
authored papers