Embed Size (px)
Citation preview
The Journal of Neuroscience, February 1995, 15(2): 970-980
Regionalization of the Developing Forebrain: A Comparison of FORSE-1, Dlx-2, and BF-1
Shubha Tole and Paul H. Patterson
Division of Biology, California Institute of Technology, Pasadena, California 91125
The FORSE-1 monoclonal antibody (mAb) was generated using a strategy designed to produce mAbs against neuronal cell surface antigens that might be regulated by regionally restricted transcription factors in the developing CNS. To determine whether FORSE-1 has a labeling pattern similar to that of known transcription factors, the expression of BF-1 and Dlx-2 was examined by in situ hybridization on sections serial to those labeled with FORSE-1. We find a striking overlap between BF-1 and FORSE-1 in the telencephalon; both are expressed in the lateral but not the medial walls of the telencephalon, and the boundaries of expression are apparently identical. FORSE-1 staining is detected prior to BF-1 expression in the neural tube, however. FORSE-1 and Dlx-2 have very different patterns of expression in the forebrain, suggesting that regulation by Dlx-2 cannot by itself explain the distribution of FORSE-1. However, they share some sharp boundaries in the diencephalon. In addition, FORSE-1 identifies some previously unknown boundaries In the developing forebrain. These results indicate that a new cell surface marker can be used to subdivide the embryonic telencephalon and diencephalon into regions smaller than previously described, providing necessary complexity to the developmental patterning in the forebrain.
[Key words: regionalization, forebrain, neuromeres, prosomeres, dlencephalon, thalamus, telencephalon]
The forebrain is structurally and functionally the most complex region of the mammalian CNS. How the different regions of the embryonic forebrain give rise to various adult structures is not well understood. Moreover, it is important to determine if patterning in the forebrain is an extension of that in the midbrain, hindbrain, and spinal cord, with similar features. Part of this analysis involves searching for transverse and longitudinal domains in the forebrain that are delineated before, or coincident with, overt cellular differentiation. Recent data concerning molecular differences (Bulfone et al., 1993; Puelles and Rubenstein, 1993; Price, 1993) and cell mixing boundaries (Figdor and Stern, 1992) between various forebrain regions have forced a reevaluation of classical views.
Received May 3, 1994; revised July 18, 1994; accepted July 25, 1994. We thank Dr. John Rubenstein for the probe to Dlx-2; Dr. Eseng Lai for the
probe to BF-I; Dr. Salvadore Martinez for useful discussions; and Drs. Karen Allendoerfer, Scott Fraser, and Z. Kaprielian for helpful comments on the manuscript. We also thank Bob Turing, Richard Gomez, Ben Sewell, Lance Brown, Ella McClanahan, Jim Staub, Theo Steiner, Alice Edel, and Le Hanh Dinh from the Graphic Arts facility at Caltech for their assistance with the illustrations. This work was supported by an NINOS grant to P.H.P.
Correspondence should be addressed to P. H. Patterson at the above address. Copyright© 1995 Society for Neuroscience 0270-6474/95/150970-11$05.00/0
Herrick (1910) proposed that various regions of the diencephalon are organized as longitudinal columns, the epithalamus, dorsal thalamus, ventral thalamus, and hypothalamus, separated by ventricular sulci. In this model, the longitudinal axis of the diencephalon cannot be an extension of the axis of the spinal cord and hindbrain, but is separate and nearly perpendicular to it. The expression patterns of several transcription factors and other molecules present in restricted regions of the diencephalon (Bulfone et al., 1993; Puelles and Rubenstein, 1993; Price, 1993) do not fit the regional boundaries on Herrick's model, however. Instead, these data fit the "neuromeric theory" (Puelles, 1987; Bulfone et al., 1993), which proposes that the longitudinal axis of the diencephalon is continuous with that of the spinal cord and hindbrain, and curves with the flexures of the neural tube. Furthermore, various diencephalic regions can be organized as transverse domains about this longitudinal axis. FORSE-1, a cell surface, proteoglycan-like antigen, exhibits regional specificity in the developing diencephalon (role et al., 1995), and may therefore contribute to this analysis. FORSE-1 labeling also exhibits regional specificity in the telencephalon (Tole et al., 1995). Bulfone et al. (1993) interpret the telencephalon to be a dorsal part of the secondary prosencephalon, the rostralmost neuromere of the CNS. The hypothalamus of Herrick's diencephalon forms the ventral part of the secondary prosencephalon. Thus in the neuromeric theory, the telencephalon is not an independent structure in the CNS. Furthermore, it is subdivided into transverse domains that are dorsal extensions of hypothalamic domains.
Since FORSE-1 is a cell surface molecule, it may be regulated by a regionally restricted transcription factor with an identical pattern of expression. On the other hand, several transcription factors, with expression patterns only partially overlapping that of FORSE-1, may act as combinatorial regulators of FORSE-1. We have compared the FORSE-1, BF-1, and Dlx-2 patterns in this context
Materials and Methods For in situ hybridization, all reagents and glassware were maintained RNAase free. The probes were prepared using the Ambion MEGAscript kit, and digoxigenin-11-UTP (Boehringer Mannheim), following the manufacturers' instructions. The probes were stored in hybridization buffer, at a concentration of 0.5-1 µ,g/ml at -20°C. Hybridization buffer for Dlx-2 consisted of50% formamide, SX SSC, IO mM jl-mercaptoethanol (BME), 2X Denhardt's, and 250 µ,g/ml tRNA (modified from Bulfone et al., 1993). Hybridization buffer for BF-1 consisted of 50% formamide, 0.3 M NaCl, 20 mM Tris, pH 8.5, 5 mM EDTA, 10 mM sodium phosphate buffer, pH 8, I X Denhardt's, 10 mM BME, and 500 µ,g/ml tRNA (modified from Tao and Lai, 1991).
Fresh-frozen embryos were sectioned at 15 µm and placed on SuperfrostJPlus slides (Fisher Scientific). They were dried overnight at room temperature (RT), and either stored at - 80°C or processed im-
mediately. All subsequent treatments, including hybridization, were carried out in slide mailers (Baxter). Sections were fixed in freshly prepared 4% paraformaldehyde for 20 min at RT, followed by three washes in PBS. Dehydration was carried out through grades (30%, 50%, 70%, 80%, 95%, and 100%) of ethanol. Sections were then air dried, and treated with I µg/ml proteinase K in buffer containing 100 mM TrisHCI, pH 8, and SO ITLVI EDTA for 30 min at 37°C. This was followed by fixation once more in 4% paraformaldehyde for 20 min at RT, a PBS rinse, and acetylation, which consisted of rinsing with 0.1 M TEA, draining well, and incubating in a solution of freshly dispersed acetic anhydride in 0.1 M tetraethyl ammonium (TEA) at a concentration of 0.25%, for 10 min at RT. Sections were then rinsed in water, air dried, and either stored at 4°C for a few days or used immediately.
Prehybridization consisted of a 1 hr incubation in hybridization buffer, at the same temperature used for hybridization. Hybridization was performed for 16 hr at 48°C for Dlx-2 and at 58°C for BF-1. At the end of this period, the probe was saved for reuse, and sections were washed twice in 2X SSC with 10 mM BME for 30 min at RT, followed by RNAase treatment for 40 min at RT using a solution of 20µ,g/ml RNAase A plus 1-10 units/ml RNAase Tl in 2X SSC with 1 mM EDTA. This was followed by two 30 min washes at 56°C for Dlx-2 and 60°C for BF-1, in a solution of 2X SSC, 50% formamide, 50 mM EDTA, and 10 mM BME. Sections were then rinsed in 0.2X SSC at RT, washed twice in 10 mM Tris-HCI, pH 7.5, and 150 mM NaCl, and blocked in 20% heat-inactivated sheep serum in PBS containing 0.1 % Tween-20 (PBS-Tw).
Overnight incubation followed in a solution containing anti-digoxigenin Fab fragments, conjugated to alkaline phosphatase (Boehringer Mannheim). These fragments were preabsorbed to reduce background labeling, as follows. Embryos of the same age and species being used for in situ hybridization were dissected out, cut into small pieces, fixed in 4% paraformaldehyde for I hr at RT, washed in PBS, and stored at 20°C in methanol. The samples were then rehydrated through grades of methanol up to 50% methanol, then incubated in 25% methanol, 75% PBS-Tw, and finally in 100% PBS-Tw. The pieces were centrifuged to obtain a loose pellet, which was minced to obtain a coarse homogenate, and resuspended in twice the volume of anti-digoxigenin Fab fragments at an initial concentration of 1 :200, in PBS-Tw with I% heat-inactivated sheep serum. This incubation was performed for 3 hr with gentle endover-end mixing. The tissue fragments were then centrifuged down, and the antibody-containing supernatant removed and diluted with 20% sheep serum in PBS-Tw to give a final antibody concentration of 1: 1000. This antibody solution was stored at 4°C and reused several times.
Incubation of sections in the above antibody solution was performed overnight, at 4°C, with gentle rocking. Sections were then washed three times for 30 min each at RT, in PBS-Tw containing 2 mg/ml BSA. This was followed by a 10 min incubation, at RT, in developing buffer, which contained 100 mM Tris, pH 9.5, 50 mM MgCl2 , 100 mM NaCl, 0.1% Tween-20, and freshly added levamisole at a concentration of 1.2 mg/ ml. The color reaction was carried out by incubation in developing buffer with 4.5 µUm! NBT (from a 75 mg/ml stock in 70% di-methyl formamide) and 3.5 µ,I/ml BCIP (from a 50 mg/ml stock, in 100% dimethyl formamide). The incubation was performed for 10-40 hr, and terminated, when the color reaction had developed satisfactorily, by fixing in 0.1 M MOPS, 2 mM EGTA, 1 mM MgS04 , and 3.7% formaldehyde for 1 hr at RT. Finally, sections were washed in PBS, dehydrated through grades of ethanol, and mounted in Permount.
Immunohistochemistry and photography was performed as described in Tole et al. (l 995).
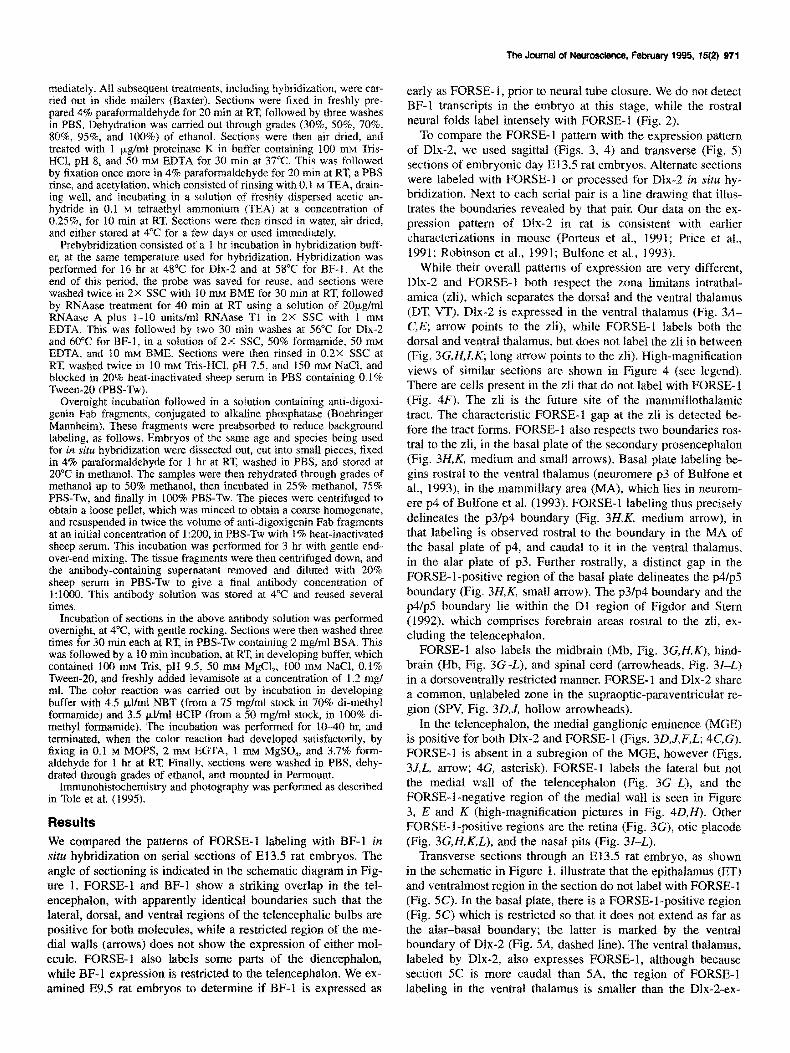
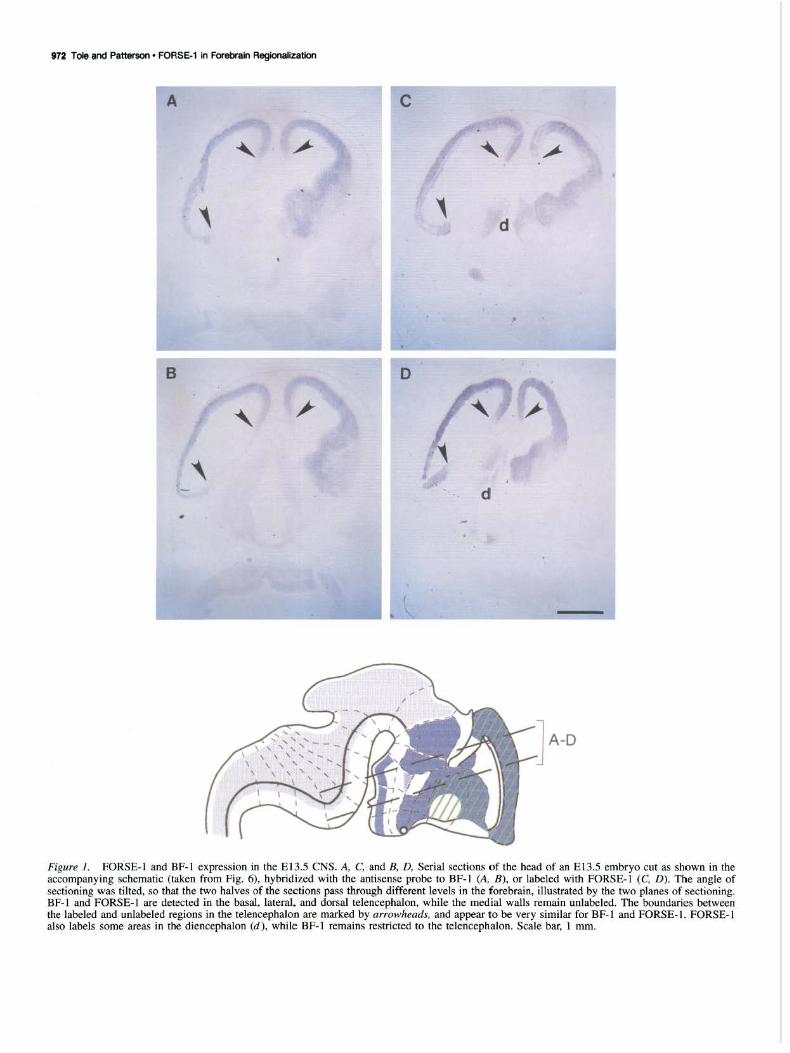
Results We compared the patterns of FORSE-1 labeling with BF-1 in situ hybridization on serial sections of El 3.5 rat embryos. The angle of sectioning is indicated in the schematic diagram in Figure 1. FORSE-1 and BF-1 show a striking overlap in the telencephalon, with apparently identical boundaries such that the lateral, dorsal, and ventral regions of the telencephalie bulbs are positive for both molecules, while a restricted region of the medial walls (arrows) does not show the expression of either molecule. FORSE-1 also labels some parts of the diencephalon, while BF-1 expression is restricted to the telencephalon. We examined E9.5 rat embryos to determine if BF-1 is expressed as
The Journal of Neuroscience, February 1995, 15(2) 971
early as FORSE-1, prior to neural tube closure. We do not detect BF- I transcripts in the embryo at this stage, while the rostral neural folds label intensely with FORSE-1 (Fig. 2).
To compare the FORSE-1 pattern with the expression pattern of Dlx-2, we used sagittal (Figs. 3, 4) and transverse (Fig. 5) sections of embryonic day E13.5 rat embryos. Alternate sections were labeled with FORSE-1 or processed for Dlx-2 in situ hybridization. Next to each serial pair is a line drawing that illustrates the boundaries revealed by that pair. Our data on the expression pattern of Dlx-2 in rat is consistent with earlier characterizations in mouse (Porteus et al., 1991; Price et al., 1991; Robinson et al., 1991; Bulfone et al., 1993).
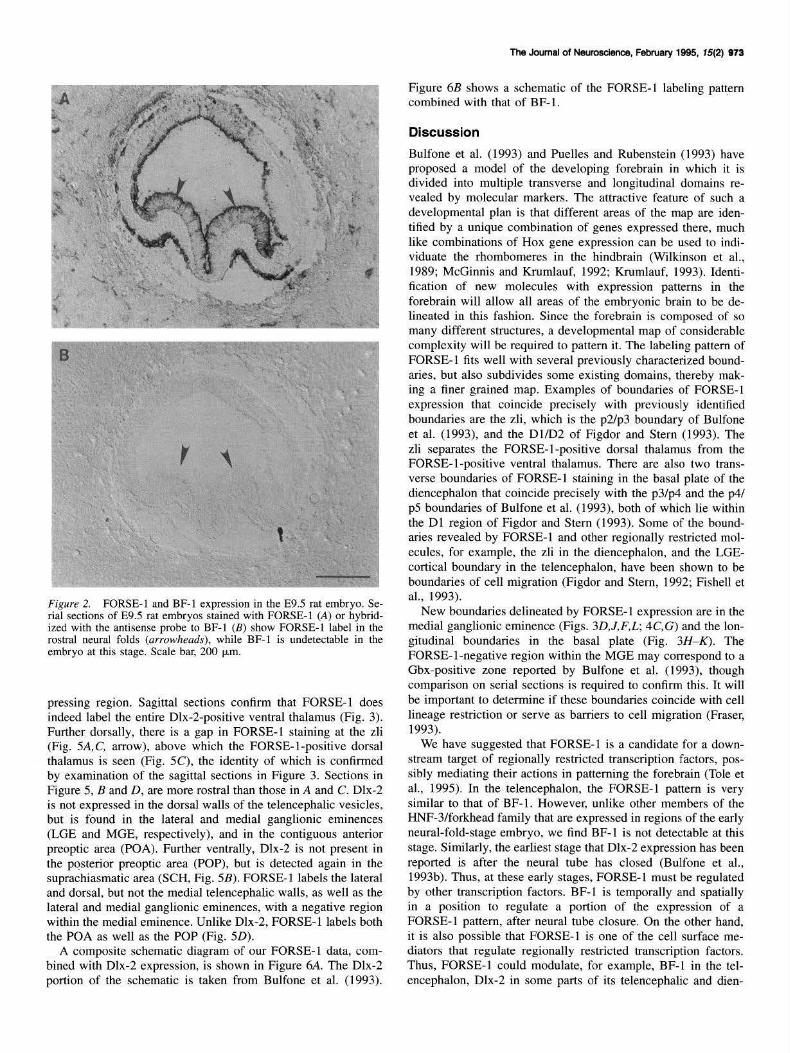
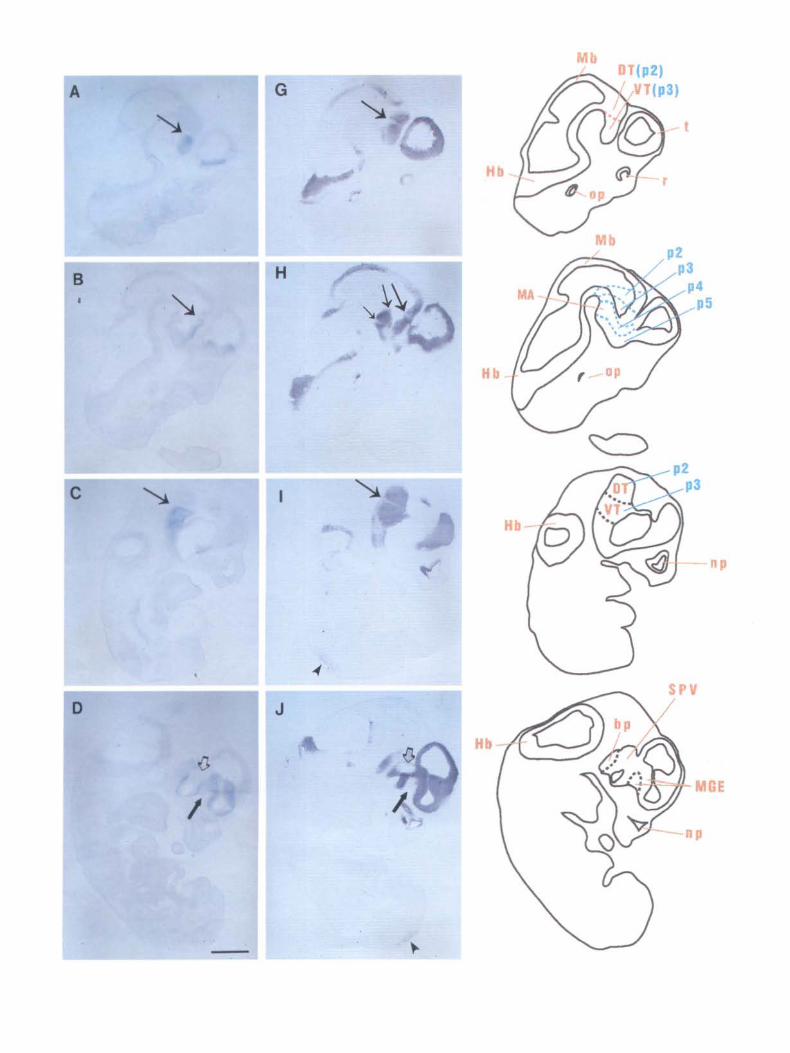
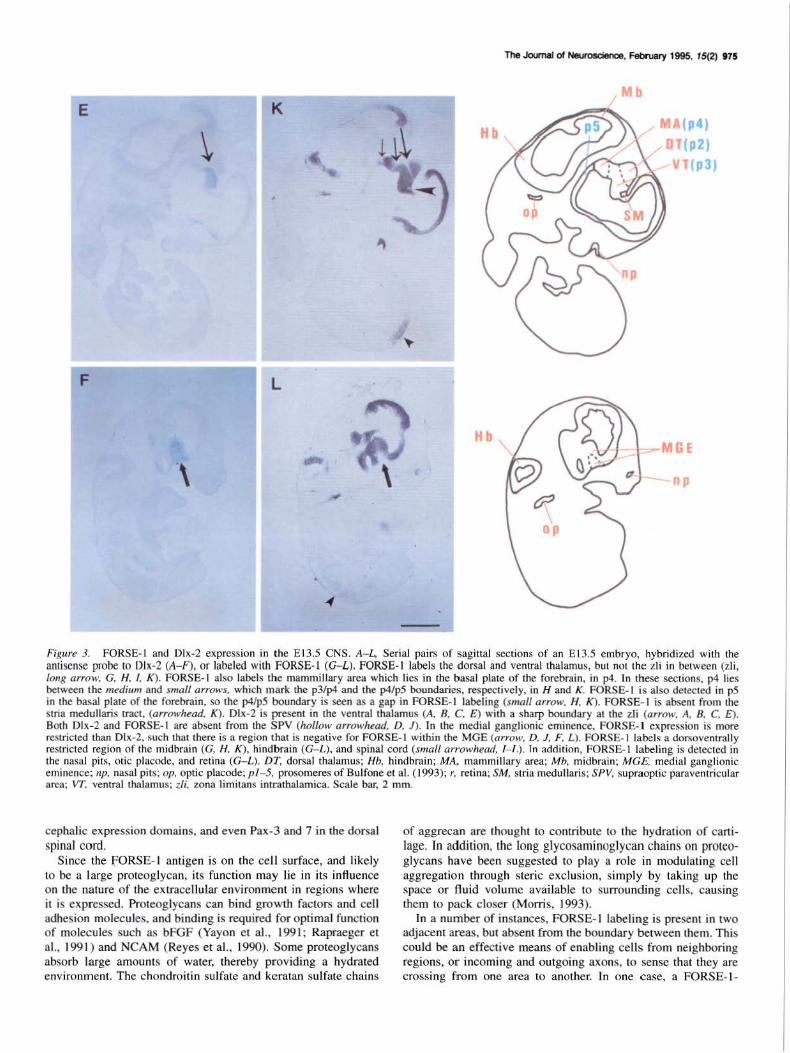
While their overall patterns of expression are very different, Dlx-2 and FORSE-1 both respect the zona limitans intrathalamica (zli), which separates the dorsal and the ventral thalamus (DT, VT). Dlx-2 is expressed in the ventral thalamus (Fig. 3AC,E; arrow points to the zli), while FORSE-1 labels both the dorsal and ventral thalamus, but does not label the zli in between (Fig. 3G,H,I,K; long arrow points to the zli). High-magnification views of similar sections are shown in Figure 4 (see legend). There are cells present in the zli that do not label with F'ORSE-1 (Fig. 4F). The zli is the future site of the mammillothalamic tract. The characteristic FORSE-1 gap at the zli is detected before the tract forms. FORSE-1 also respects two boundaries rostral to the zli, in the basal plate of the secondary prosencephalon (Fig. 3H,K, medium and small arrows). Basal plate labeling begins rostral to the ventral thalamus (neuromere p3 of Bulfone et al., 1993), in the mammillary area (MA), which lies in neuromere p4 of Bulfone et al. (1993). FORSE-1 labeling thus precisely delineates the p3/p4 boundary (Fig. 3H,K, medium arrow), in that labeling is observed rostral to the boundary in the MA of the basal plate of p4, and caudal to it in the ventral thalamus, in the alar plate of p3. Further rostrally, a distinct gap in the FORSE-1-positive region of the basal plate delineates the p4/p5 boundary (Fig. 3H,K, small arrow). The p3/p4 boundary and the p4/p5 boundary lie within the D l region of Figdor and Stern (1992), which comprises forebrain areas rostral to the zli, excluding the telencephalon.
FORSE-1 also labels the midbrain (Mb, Fig. 3G,H,K), hindbrain (Hb, Fig. 3G-L), and spinal cord (arrowheads, Fig. 3/-L) in a dorsoventrally restricted manner. FORSE-1 and Dlx-2 share a common, unlabeled zone in the supraoptic-paraventricular region (SPV, Fig. 3D,J, hollow arrowheads).
In the teleneephalon, the medial ganglionic eminence (MGE) is positive for both Dlx-2 and FORSE-1 (Figs. 3D,J,F,L; 4C,G). FORSE-1 is absent in a subregion of the MGE, however (Figs. 31,L, arrow; 4G, asterisk). FORSE-1 labels the lateral but not the medial wall of the telencephalon (Fig. 3G-L), and the FORSE-1-negative region of the medial wall is seen in Figure 3, E and K (high-magnification pictures in Fig. 4D,H). Other FORSE-1-positive regions are the retina (Fig. 3G), otic placode (Fig. 3G,H.K,L), and the nasal pits (Fig. 31-L).
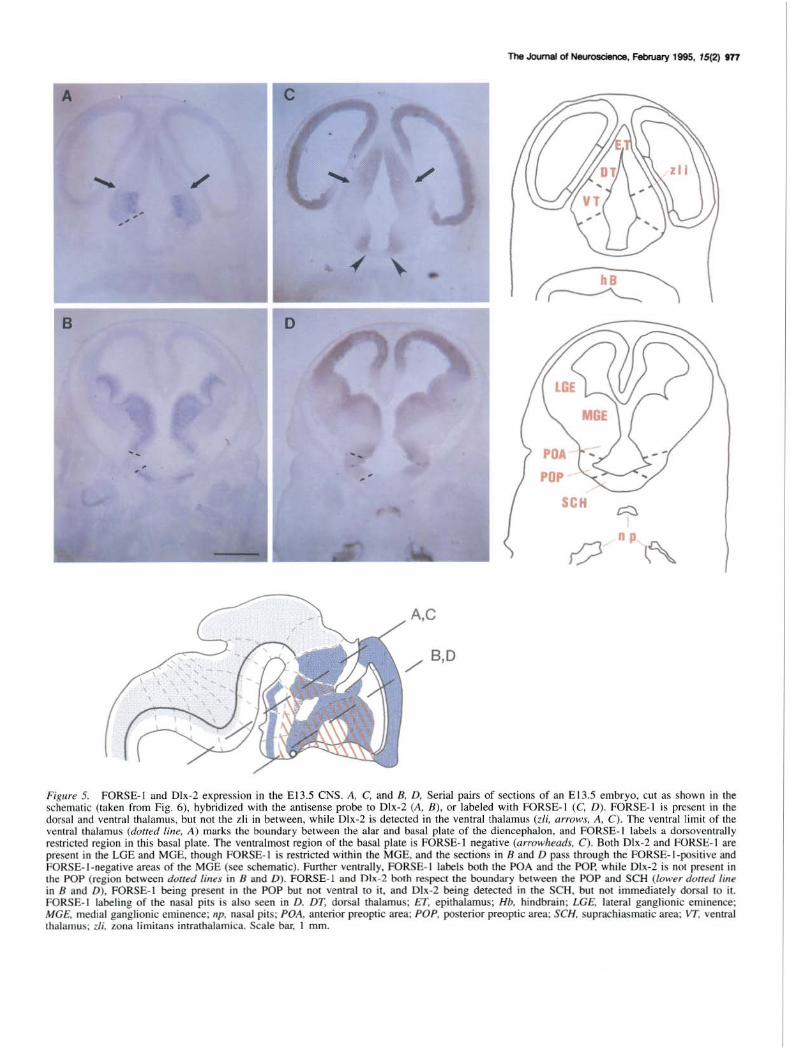
Transverse sections through an E13.5 rat embryo, as shown in the schematic in Figure 1, illustrate that the epithalamus (ET) and ventralmost region in the section do not label with FORSE-1 (Fig. 5C). In the basal plate, there is a FORSE-1-positive region (Fig. 5C) which is restricted so that it does not extend as far as the alar-basal boundary; the latter is marked by the ventral boundary of Dlx-2 (Fig. 5A, dashed line). The ventral thalamus, labeled by Dlx-2, also expresses FORSE-1, although because section 5C is more caudal than 5A, the region of FORSE-1 labeling in the ventral thalamus is smaller than the Dlx-2-ex-
972 T Qle 111l(l Patt$rSOO • FORSE-1 in Forebrain Regionalization
A c
d
B D
d
Figure 1. FORSE-1 and BF-1 expression in the El3.5 CNS. A, C, and B, D, Serial sections of the head of an El3.5 embryo cut as shown in the accompanying schematic (taken from Fig. 6), hybridized with the antisense probe to BF-1 (A, B), or labeled with FORSE-1 (C, D). The angle of sectioning was tilted, so that the two halves of the sections pass through different levels in the forebrain, illustrated by the two planes of sectioning. BF-1 and FORSE-1 are detected in the basal, lateral, and dorsal telencephalon, while the medial walls remain unlabeled. The boundaries between the labeled and unlabeled regions in the telencephalon are marked by arrowheads, and appear to be very similar for BF-1 and FORSE-1. FORSE-1 also labels some areas in the diencephalon (d), while BF-1 remains restricted to the telencephalon. Scale bar, I mm.
B
, '
Figure 2. FORSE-1 and BF-I expression in the E9.5 rat embryo. Serial sections of E9.5 rat embryos stained with FORSE-1 (A) or hybridized with the antisense probe to BF-1 (B) show FORSE-1 label in the rostral neural folds (arrowheads), while BF- I is undetectable in the embryo at this stage. Scale bar, 200 µm.
pressing region. Sagittal sections confirm that FORSE-1 does indeed label the entire Dlx-2-positive ventral thalamus (Fig. 3). Further dorsally, there is a gap in FORSE- 1 staining at the zli (Fig. SA,C, arrow), above which the FORSE-1-positive dorsal thalamus is seen (Fig. SC), the identity of which is confirmed by examination of the sagittal sections in Figure 3. Sections in Figure S, B and D, are more rostral than those in A and C. Dlx-2 is not expressed in the dorsal walls of the telencephalic vesicles, but is found in the lateral and medial ganglionic eminences (LGE and MGE, respectively), and in the contiguous anterior preoptic area (POA). Further ventrally, Dlx-2 is not present in the pqsterior preoptic area (POP), but is detected again in the suprachiasmatic area (SCH, Fig. SB). FORSE-1 labels the lateral and dorsal, but not the medial telencephalic walls, as well as the lateral and medial ganglionic eminences, with a negative region within the medial eminence. Unlike Dlx-2, FORSE-1 labels both the POA as well as the POP (Fig. SD).
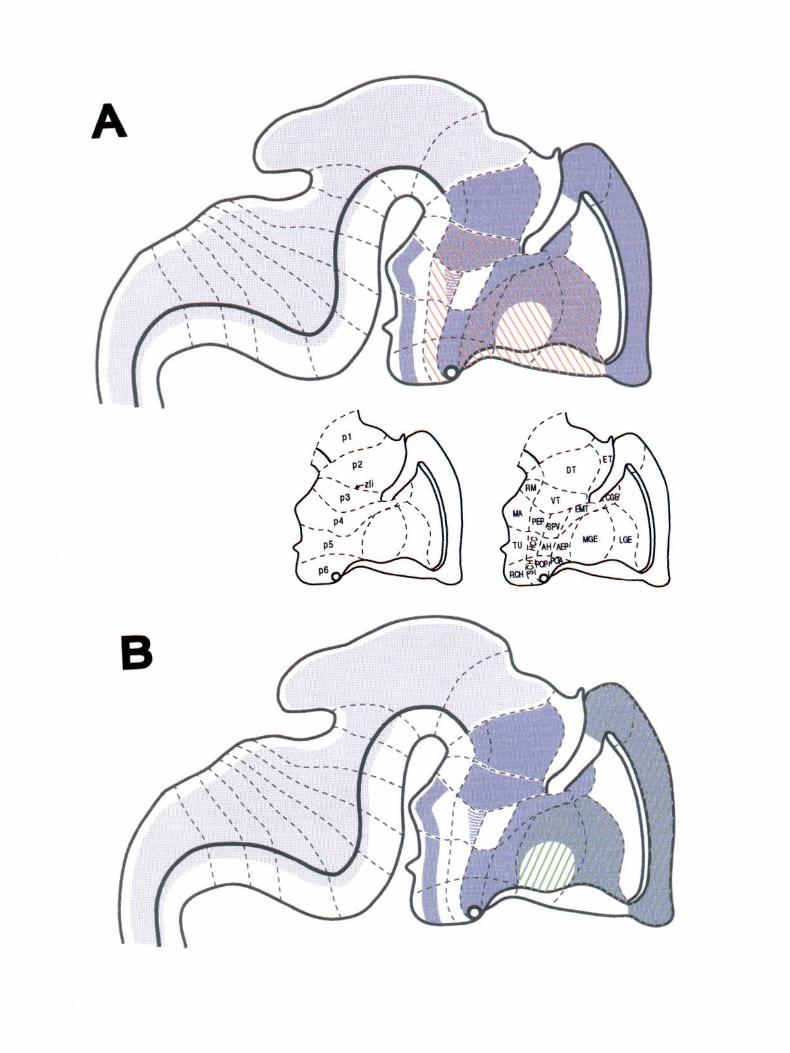
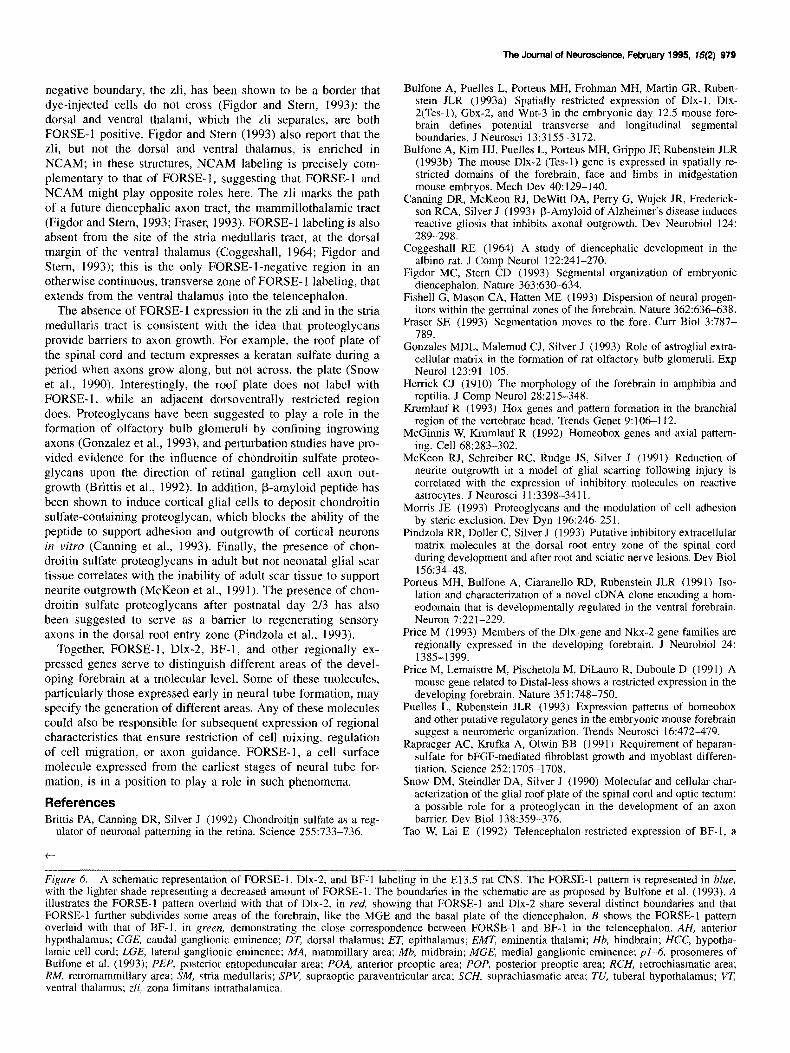
A composite schematic diagram of our FORSE-1 data, combined with Dlx-2 expression, is shown in Figure 6A. The Dlx-2 portion of the schematic is taken from Bulfone et al. (l 993).
The Journal of Neoroscience, February 1995, 15(2) 973
Figure 68 shows a schematic of the FORSE-1 labeling patt.ern combined with that of BF-1 .
Discussion
Bulfone et al. (l 993) and Puelles and Rubenstein (1993) have proposed a model of the developing forebrain in which it is divided into multiple transverse and longitudinal domains revealed by molecular markers. The attractive feature of such a developmental plan is that different areas of the map are identified by a unique combination of genes expressed there, much like combinations of Hox gene expression can be used to individuate the rhombomeres in the hindbrain (Wilkinson et al. , 1989; McGinnis and K.rumlauf, 1992; K.rumlauf, 1993). Identification of new molecules with expression patterns in the forebrain will allow all areas of the embryonic brain to be delineated in this fashion. Since the forebrai n is composed of so many different structures, a developmental map of considerable complexity will be required to pattern it. The labeling pattern of FORSE-1 fits well with several previously characterized boundaries, but also subdivides some existing domains, thereby making a finer grained map. Examples of boundaries of FORSE-1 expression that coincide precisely with previously identified boundaries are the zli, which is the p2/p3 boundary of Bulfone et al. (1993), and the Dl/02 of Figdor and Stern (1993). The zli separates the FORSE-I-positive dorsal thalamus from the FORSE-1-positive ventral thalamus. There are also two transverse boundaries of FORSE-1 staining in the basal plate of the diencephalon that coincide precisely with the p3/p4 and the p4/ p5 boundaries of Bulfone et al. ( 1993), both of which lie within the Dl region of Figdor and Stern (1993). Some of the boundaries revealed by FORSE-1 and other regionally restricted molecules, for example, the zli in the diencephalon, and the LGEcortical boundary in the telencephalon, have been shown to be boundaries of cell migration (Figdor and Stern, 1992; Fishell et al., 1993).
New boundaries delineated by FORSE-1 expression are in the medial ganglionic eminence (Figs. 3D,J,F,L; 4C,G) and the longitudinal boundaries in the basal plate (Fig. 3H-K). The FORSE-1-negative region within the MGE may correspond to a Gbx-positive zone reported by Bulfone et al. (1993), though comparison on serial sections is required to confirm this. It will be important to determine if these boundaries coincide with cell lineage restriction or serve as barriers to cell migration (Fraser, 1993).
We have suggested that FORSE-1 is a candidate for a downstream target of regionally restricted transcription factors, possibly mediating their actions in patterning the forebrain (Tole et al., 199S). In the telencepbalon, the FORSE-1 pattern is very similar to that of BF- l. However, unlike other members of the HNF-3/forkhead family that are expressed in regions of the early neural-fold-stage embryo, we find BF- I is not detectable at this stage. Similarly, the earliest stage that Dlx-2 expression has been reported is after the neural tube has closed (Bulfone et al., 1993b ). Thus, at these early stages, FORSE- 1 must be regulated by other transcription factors. BF-1 is temporally and spatially in a position to regulate a portion of the expression of a FORSE-1 pattern, after neural tube closure. On the other hand, it is also possible that FORSE-1 is one of the cell surface mediators that regulate regionally restricted transcription factors. Thus, FORSE-1 could modulate, for example, BF-1 in the telencephalon, Dlx-2 in some parts of its telencephalic and dien-
H
HI
H
H
,. 'p2) ''"" 13)
t
p2 ' 03
p4 ,p5
np
SPV '
GE
np
E K
H
F L
Hb .,
The Jc:x.mal of Neuroscience, February 1995, 15(2) 975
Mb
~d u "
MA(p4)
"ll(p2) VT(p3)
-MGE
np
Figure 3. FORSE-1 and Dlx-2 expression in the E 13.5 CNS. A- L, Serial pairs of sagittal sections of an E 13.5 embryo, hybridized with the amisense probe to Dlx-2 (A- F). or labeled with FORSE- 1 (G- L). FORSE-1 labels the dorsal and ventral thalamus, but not the zli in between (zli, long arrow, G, H. !, K) . FORSE- 1 also labels the mammillary area which lies in the basal plate of the forebrain, in p4. In these sections, p4 lies between the medium and small arrows, which mark the p3/p4 and the p4/p5 boundaries, respectively, in H and K. FORSE-1 is also detected in p5 in the basal plate of the forebrain, so the p4/p5 boundary is seen as a gap in FORSE-1 labeling (small arrow, H, K). FORSE-1 is absent from the slria medullaris trace, (arrowhead. K). Dlx-2 is present in the ventral thalamus (A, 8 , C, E) with a sharp boundary at the zli (arrow, A, 8 , C, E). Both Olx-2 and FORSE- 1 are absent from the SPV (hollow arrowhead, D, J). In the medial ganglionic eminence. FORSE-1 expression is more restricted than Dlx-2, such that there is a region that is negative for FORSE-1 within the MGE (arrow, D, J, F, L). FORSE-1 labels a dorsoventrally restricted region of the midbrain (G, H, K), hindbrain (G- l ), and spinal cord (small arrowhead, 1- /,). In addition, FORSE-1 labeling is detected in the nasal pits, otic placode, and retina (G-L). DT, dorsal thalamus; Hb, hindbrain; MA, mammillary area; Mb, midbrain; MGE. medial ganglionic eminence; np, nasal pits; op, optic placode; pl- 5, prosomeres of Bulfone et al. (1993); r, retina; SM, stria medullaris; SPY, supraoptic paraventricular area: VT, ventral thalamus; tli, zona limitans intrathalamica. Scale bar, 2 mm.
cephalic expression domains, and even Pax-3 and 7 in the dorsal spinal cord.
S ince the FORSE- 1 antigen is on the cell surface, and likely to be a large proteoglycan, its functi on may lie in its influence on the nature of the extracellular environment in regions where it is expressed. Proteoglycans can bind growth factors and cell adhesion molecules, and binding is required for optimal function of molecules such as bFGF (Yayon et al. , 1991; Rapraeger et al., 1991) and NCAM (Reyes et al., 1990). Some proteoglycans absorb large amounts of water, thereby providing a hydrated environment. The chondroitin sulfate and kc ratan sulfate chains
of aggrecan are thought to contribute to the hydration of carti lage. In addition, the long glycosaminoglycan chains on proteoglycans have been suggested to play a role in modulating cell aggregation through steric exclusion, simply by taking up the space or fluid volume available to surrounding cells, causing them to pack closer (Morris, 1993).
In a number of instances, FORSE- 1 labeling is present in two adjacent areas, but absent from the boundary between them. This could be an effec tive means of enabling cells from neighboring regions, or incoming and outgoing axons, to sense that they are crossing from one area to another. ln one case, a FORSE-1-
B H tv
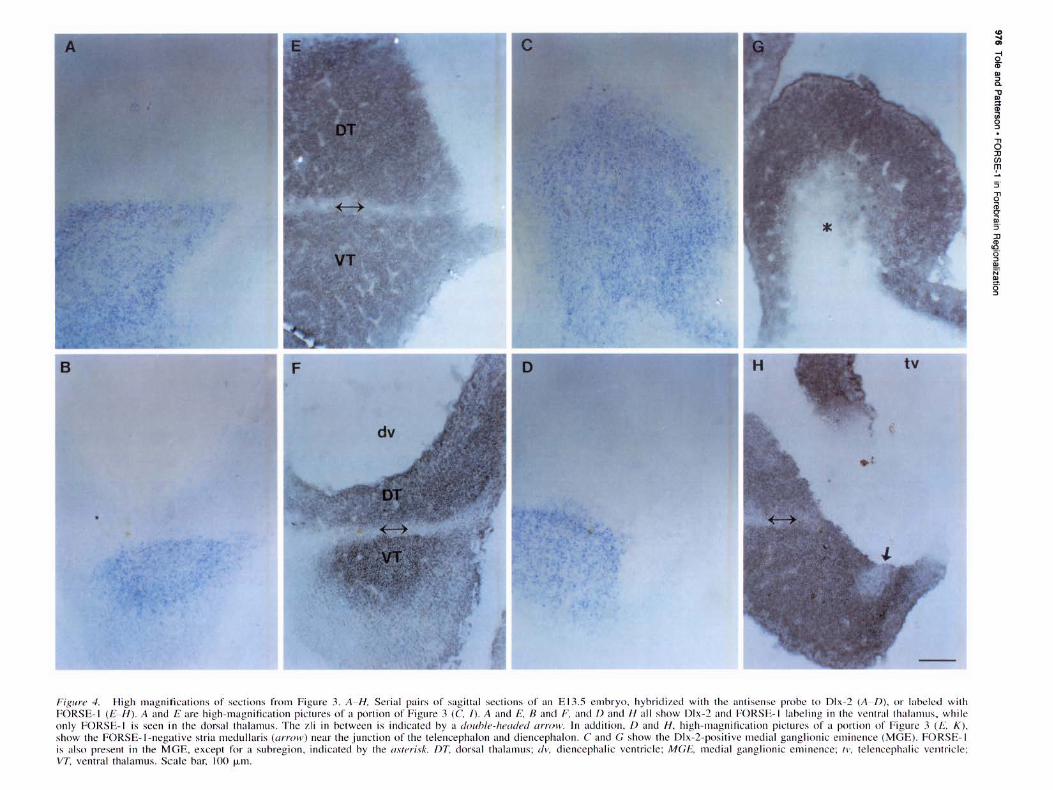
Fig11re 4. High magni fications of sections from Figure 3. A- H . Seria l pairs of sagittal sections of an E 13.5 embryo, hybridized with the antisense probe to Dlx-2 (A /)), or labeled w ith FORSE- 1 (£ - /-/). A an<.l E are high-magnification pictures of a portion of Figure 3 (C / ). A and £. 8 and F. and /)and H all show Dlx-2 and FORSE-1 labeling in the ventral thalamus. while only FORSE- 1 is seen in the dorsal thalamus. The 1.li in between is indicated by a do11/Jle -he11dnl arrow. In a<.l<.lition, D an<.l H, high-magnification pictures of a portion of Figure 3 (/~'. K ), show the FORSE- 1-negative stria medullaris (arrow) near the junction of the telencephalon and diencephalon. C and G show the Dlx-2-positive medial ganglionic eminence (MGE). FORSE- 1 is also present in the MGE, except for a subregion, indicated hy the asterisk. nT. dorsal thalamus; d v, diencephalic ventricle; MGE, medial ganglionic eminence; rv. telcncephalic ventricle; VT. ventral thalamus. Scale bar, 100 µm.
co .... O>
* ~ Q,
'U
"' :::
§ ..,., 0 :0 (f)
~ 5 ·
'(} <D CJ" Ql 5' :0 ~ 6' :> !!!. ;;;· !? g·
The Journal of Neuroscience, February 1995, 15(2) tn
A
.. B D
A,C
/ 8 ,D
Figure 5. FORSE-1 and Dlx-2 expression in the El3.5 CNS. A, C, and 8, D, Serial pairs of sections of an El3.5 embryo, cut as shown in the schematic (taken from Fig. 6), hybridized with the antisense probe to Dlx-2 (A, 8), or labeled with FORSE-1 (C, D). FORSE-1 is present in the dorsal and ventral thalamus, but not the zli in between, while Dlx-2 is detected in the ventral thalamus (z/i, arrows, A, C). The ventral limit of the ventral thalamus (dotted line, A) marks the boundary between the alar and basal plate of the diencephalon, and FORSE- 1 labels a dorsoventrally restricted region in this basal plate. The ventralmost region of the basal plate is FORSE-1 negative (arrowheads, C). Both Dlx-2 and FORSE- 1 are present in the LOE and MOE. though FORSE-1 is restricted within the MOE, and the sections in B and D pass through the FORSE-1-positive and FORSE- 1-negative areas of the MOE (see schematic). Further ventrally, FORSE-1 labels both the POA and the POP, while Dlx-2 is not present in the POP (region between dotted lines in 8 and D). FORSE-1 and Dlx-2 both respect the boundary between the POP and SCH (lower doued line in 8 and D). FORSE-1 being present in the POP but not ventral to it, and Dlx-2 being detected in the SCH, but not immediately dorsal to it. FORSE- 1 labeling of the nasal pits is also seen in D. DT, dorsal thalamus; ET, epithalamus; Hb, hindbrain; LG£, lateral ganglionic eminence; MG£. medial ganglionic eminence; np, nasal pits; POA, anterior preoptic area; POP, posterior preoptic area; SCH. suprachiasmatic area; VT, ventral thalamus; zli, zona limitans intrathalamica. Scale bar, l mm.
A
B
negative boundary, the zli, has been shown to be a border that dye-injected cells do not cross (Figdor and Stem, 1993); the dorsal and ventral thalami, which the zli separates, are both FORSE-1 positive. Figdor and Stern (1993) also report that the zli, but not the dorsal and ventral thalamus, is enriched in NCAM; in these structures, NCAM labeling is precisely complementary to that of FORSE-1, suggesting that FORSE-1 and NCAM might play opposite roles here. The zli marks the path of a future diencephalic axon tract, the mammillothalamic tract (Figdor and Stern, 1993; Fraser, 1993). FORSE-1 labeling is also absent from the site of the stria medullaris tract, at the dorsal margin of the ventral thalamus (Coggeshall, 1964; Figdor and Stern, 1993); this is the only FORSE-1-negative region in an otherwise continuous, transverse zone of FORSE-1 labeling, that extends from the ventral thalamus into the telencephalon.
The absence of FORSE-1 expression in the zli and in the stria medullaris tract is consistent with the idea that proteoglycans provide barriers to axon growth. For example, the roof plate of the spinal cord and tectum expresses a keratan sulfate during a period when axons grow along, but not across, the plate (Snow et al., 1990). Interestingly, the roof plate does not label with FORSE-1, while an adjacent dorsoventrally restricted region does. Proteoglycans have been suggested to play a role in the formation of olfactory bulb glomeruli by confining ingrowing axons (Gonzalez et al., 1993), and perturbation studies have provided evidence for the influence of chondroitin sulfate proteoglycans upon the direction of retinal ganglion cell axon outgrowth (Brittis et al., 1992). In addition, [3-amyloid peptide has been shown to induce cortical glial cells to deposit chondroitin sulfate-containing proteoglycan, which blocks the ability of the peptide to support adhesion and outgrowth of cortical neurons in vitro (Canning et al., 1993). Finally, the presence of chondroitin sulfate proteoglycans in adult but not neonatal glial scar tissue correlates with the inability of adult scar tissue to support neurite outgrowth (McKeon et al., 1991 ). The presence of chondroitin sulfate proteoglycans after postnatal day 2/3 has also been suggested to serve as a barrier to regenerating sensory axons in the dorsal root entry zone (Pindzola et al., 1993 ).
Together, FORSE-1, Dlx-2, BF-I, and other regionally expressed genes serve to distinguish different areas of the developing forebrain at a molecular level. Some of these molecules. particularly those expressed early in neural tube formation, may specify the generation of different areas. Any of these molecules could also be responsible for subsequent expression of regional characteristics that ensure restriction of cell mixing, regulation of cell migration, or axon guidance. FORSE-1, a cell surface molecule expressed from the earliest stages of neural tube formation, is in a position to play a role in such phenomena.
References Brittis PA, Canning DR, Silver J ( 1992) Chondroitin sulfate as a reg
ulator of neuronal patterning in the retina. Science 255:733-736.
The Journal of Neuroscience, February 1995, 15(2) 979
Bulfone A, Puelles L, Porteus MH, Frohman MH, Martin GR, Rubenstein JLR ( J 993a) Spatially restricted expression of Dix- I, Dlx-2(Tes-l), Gbx-2, and Wnt-3 in the embryonic day 12.5 mouse forebrain defines potential transverse and longitudinal segmental boundaries. J Neurosci 13:3155-3172.
Bulfone A, Kim HJ, Puelles L, Porteus MH, Grippo JF, Rubenstein JLR (1993b) The mouse Dlx-2 (Tes-I) gene is expressed in spatially restricted domains of the forebrain, face and limbs in midgestation mouse embryos. Mech Dev 40:129-140.
Canning DR, McKeon RJ, DeWitt DA, Perry G, Wujek JR, Frederickson RCA, Silver J (1993) 13-Amyloid of Alzheimer's disease induces reactive gliosis that inhibits axonal outgrowth. Dev Neurobiol 124: 289-298.
Coggeshall RE (1964) A study of diencephalic development in the albino rat. J Comp Neurol 122:241-270.
Figdor MC, Stern CD (1993) Segmental organization of embryonic diencephalon. Nature 363:630-634.
Fishell G, Mason CA, Hatten ME (1993) Dispersion of neural progenitors within the germinal zones of the forebrain. Nature 362:636-638.
Fraser SE (1993) Segmentation moves to the fore. Curr Biol 3:787-789.
Gonzales MDL, Malemud CJ, Silver J (1993) Role of astroglial extracellular matrix in the formation of rat olfactory bulb glomeruli. Exp Neurol 123:91-105.
Herrick CJ (1910) The morphology of the forebrain in amphibia and reptilia. J Comp Neurol 28:215-348.
Krumlauf R (1993) Hox genes and pattern formation in the branchial region of the vertebrate head. Trends Genet 9: 106-112.
McGinnis W, Krumlauf R (1992) Homeobox genes and axial patterning. Cell 68:283-302.
McKeon RJ, Schreiber RC, Rudge JS, Silver J (1991) Reduction of neurite outgrowth in a model of glial scarring following injury is correlated with the expression of inhibitory molecules on reactive astrocytes. J Neurosci 11 :3398-3411.
Morris JE (1993) Proteoglycans and the modulation of cell adhesion by steric exclusion. Dev Dyn 196:246-251.
Pindzola RR, Doller C, Silver J (1993) Putative inhibitory extracellular matrix molecules at the dorsal root entry zone of the spinal cord during development and after root and sciatic nerve lesions. Dev Biol 156:34-48.
Porteus MH, Bulfone A, Ciaranello RD, Rubenstein JLR (1991) Isolation and characterization of a novel cDNA clone encoding a homeodomain that is developmentally regulated in the ventral forebrain. Neuron 7:221-229.
Price M (1993) Members of the Dix-gene and Nkx-2 gene families are regionally expressed in the developing forebrain. J Neurobiol 24: 1385-1399.
Price M, Lemaistre M, Pischetola M, DiLauro R, Duboule D (1991) A mouse gene related to Distal-less shows a restricted expression in the developing forebrain. Nature 351:748-750.
Puelles L, Rubenstein JLR (1993) Expression patterns of homeobox and other putative regulatory genes in the embryonic mouse forebrain suggest a neuromeric organization. Trends Neurosci 16:472-479.
Rapraeger AC, Krufka A, Olwin BB (1991) Requirement of heparansulfate for bFGF-mediated fibroblast growth and myoblast differentiation. Science 252: 1705 1708.
Snow DM, Steindler DA, Silver J (1990) Molecular and cellular characterization of the glial roof plate of the spinal cord and optic tectum: a possible role for a proteoglycan in the development of an axon barrier. Dev Biol 138:359-376.
Tao W, Lai E (1992) Telencephalon-restricted expression of BF-I, a
Figure 6. A schematic representation of FORSE-1, Dlx-2, and BF~! labeling in the El3.5 rat CNS. The FORSE-1 pattern is represented in blue, with the lighter shade representing a decreased amount of FORSE-1. The boundaries in the schematic are as proposed by Bulfone et al. (1993). A illustrates the FORSE-1 pattern overlaid with that of Dlx-2, in red, showing that FORSE-1 and Dlx-2 share several distinct boundaries and that FORSE-1 further subdivides some areas of the forebrain, like the MGE and the basal plate of the diencephalon. B shows the FORSE-1 pattern overlaid with that of BF-1, in green, demonstrating the close correspondence between FORSE-1 and BF-1 in the telencephalon. AH, anterior hypothalamus; CGE, caudal ganglionic eminence; DT, dorsal thalamus; ET. epithalamus; EMT, eminentia thalami; Hb, hindbrain; HCC, hypothalamic cell cord; LGE, lateral ganglionic eminence; MA, mammillary area; Mb, midbrain; MGE, medial ganglionic eminence; pl-6, prosomeres of Bulfone et al. (1993); PEP, posterior entopeduncular area; POA, anterior preoptic area; POP, posterior preoptic area; RCH, retrochiasmatic area; RM, retromammillary area; SM, stria medullaris; SPV, supraoptic paraventricular area; SCH, suprachiasmatic area; TU, tuberal hypothalamus; VT, ventral thalamus; zli, zona limitans intrathalamica.
980 Tole and Patterson • FORSE-1 in Forebrain Regionalization
new member of the HNF-3/fork head gene family, in the developing rat brain. Neuron 8:957-966.
Tole S, Kaprielian Z, Ou SK-H, Patterson PH (1995) FORSE-1: a positionally regulated epitope in the developing rat central nervous system. J Neurosci 15:957-969.
Wilkinson DG, Bhatt S, Cook M, Boncinelli E, Krumlauf R (1989) Segmental expression of Hox-2 homeobox-containing genes in the developing mouse hindbrain. Nature 341 :405-409.
Wilson SW, Placzek M, Furley AJ (1993) Border disputes: do boundaries play a role in growth-cone guidance? Trends Neurosci 16:316-323.
Yayon A, Klagsbrun M, Esko JD, Leder P, Ornitz DM (1991) Cellsurface, heparin-like molecules are required for binding of basic fibroblast growth-factor to its high-affinity receptor. Cell 64:841-848.