Embed Size (px)
Citation preview
1
Kindly indicate source when quoting from this release.The advance release calendar may be consulted at www.nso.gov.mt
Issued by: Dissemination Unit, National Statistics Office, Lascaris, Valletta VLT 2000, Malta.T. +356 2599 7219 F. +356 2599 7205 E. [email protected]
17 September 2021 | 1100 hrs | 167/2021
In March 2021, registered full-time employment increased by 0.9 per cent while part-time employment as a primary job decreased by 0.6 per cent when compared to the corresponding month in 2020.
Registered Employment: January-March 2021
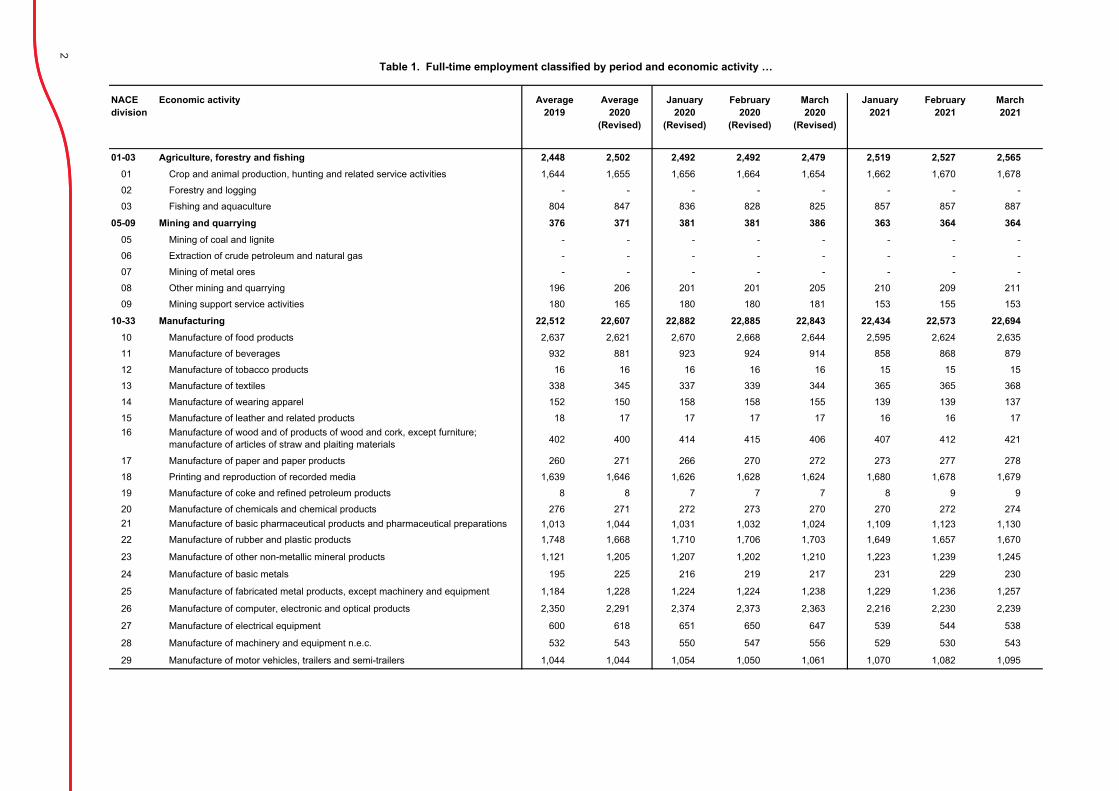
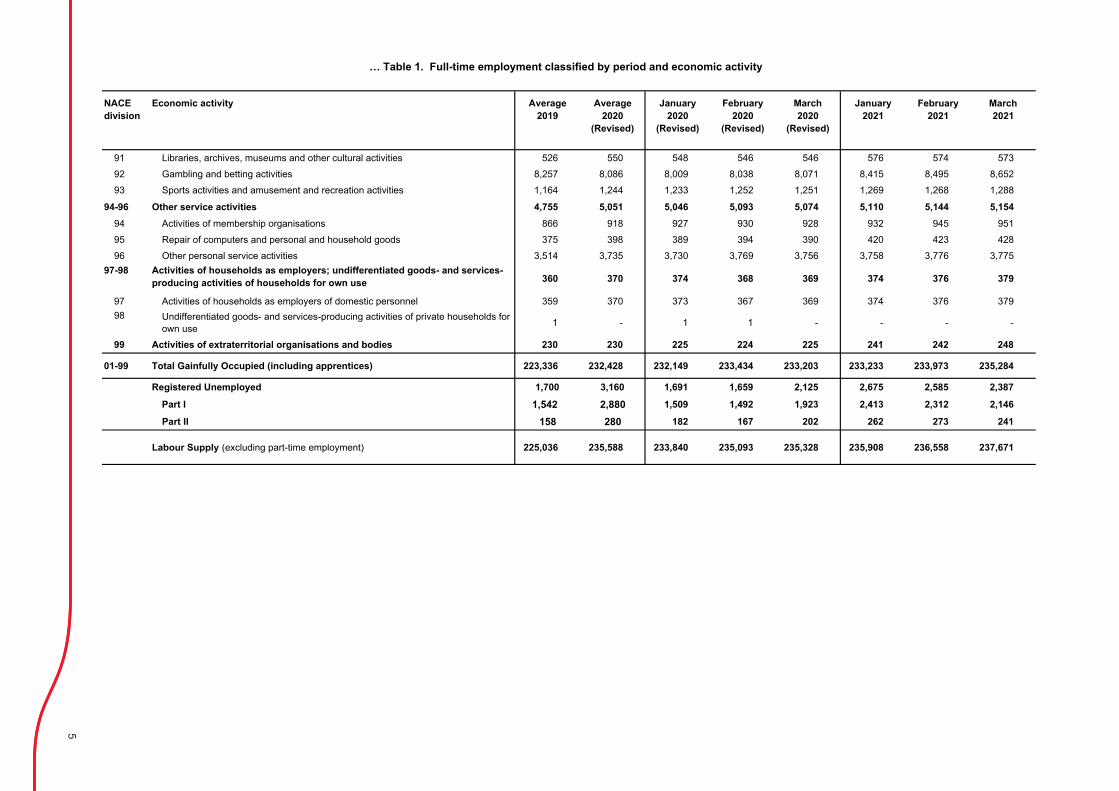
Administrative data provided by Jobsplus shows that, over a period of one year, the labour supply (excluding part-timers) in March 2021 increased by 1.0 per cent, reaching 237,671 (see methodological note 5). This was mainly attributed to a year-on-year increase in the full-time registered employment (2,081) and an increase in registered unemployment (262) (Table 1).
Registered full-time employment
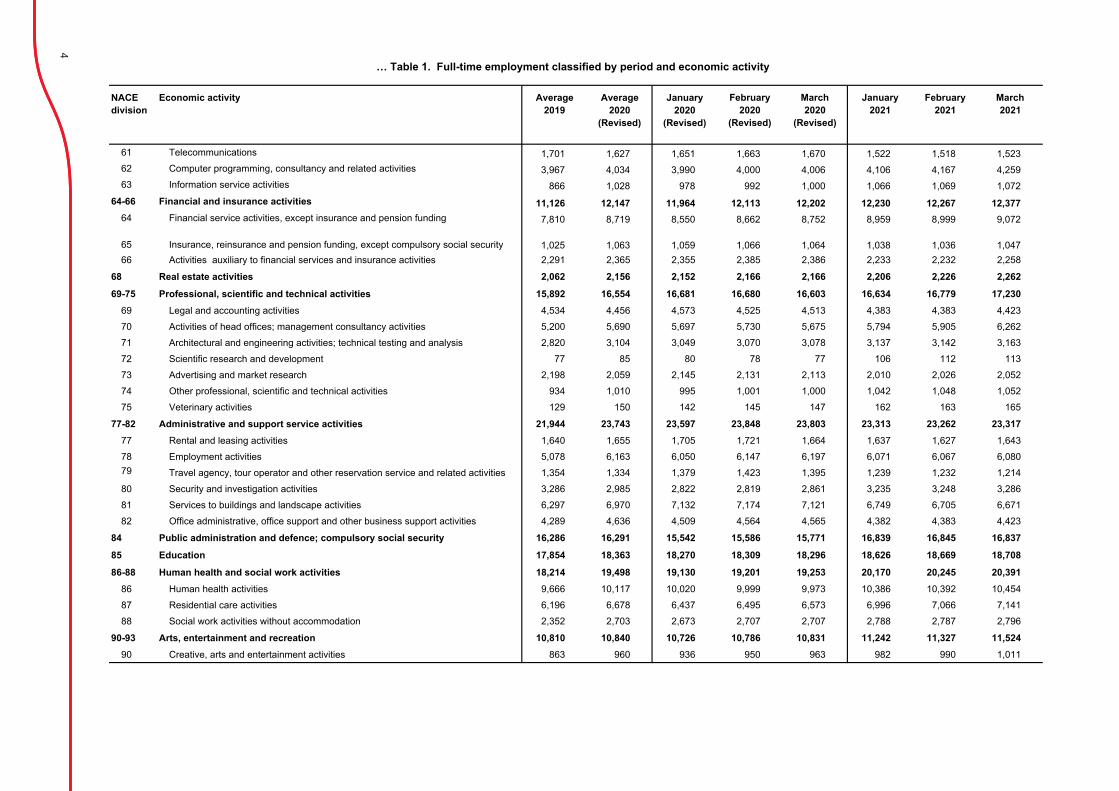
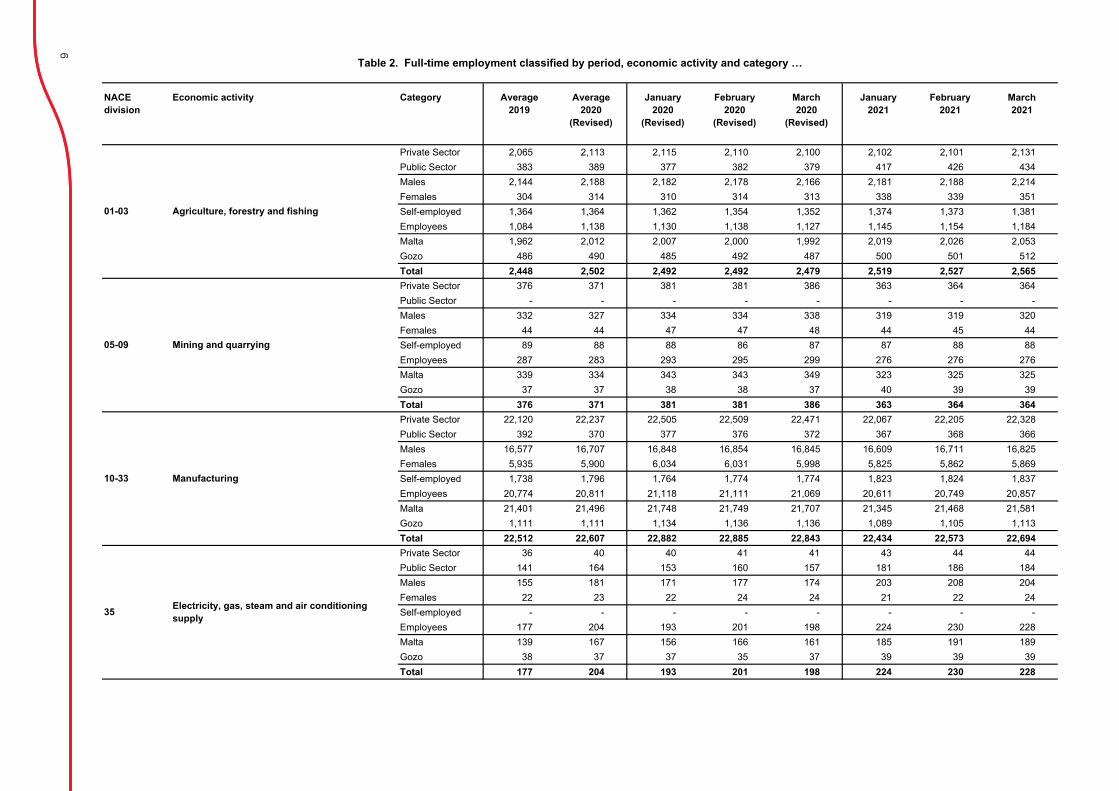
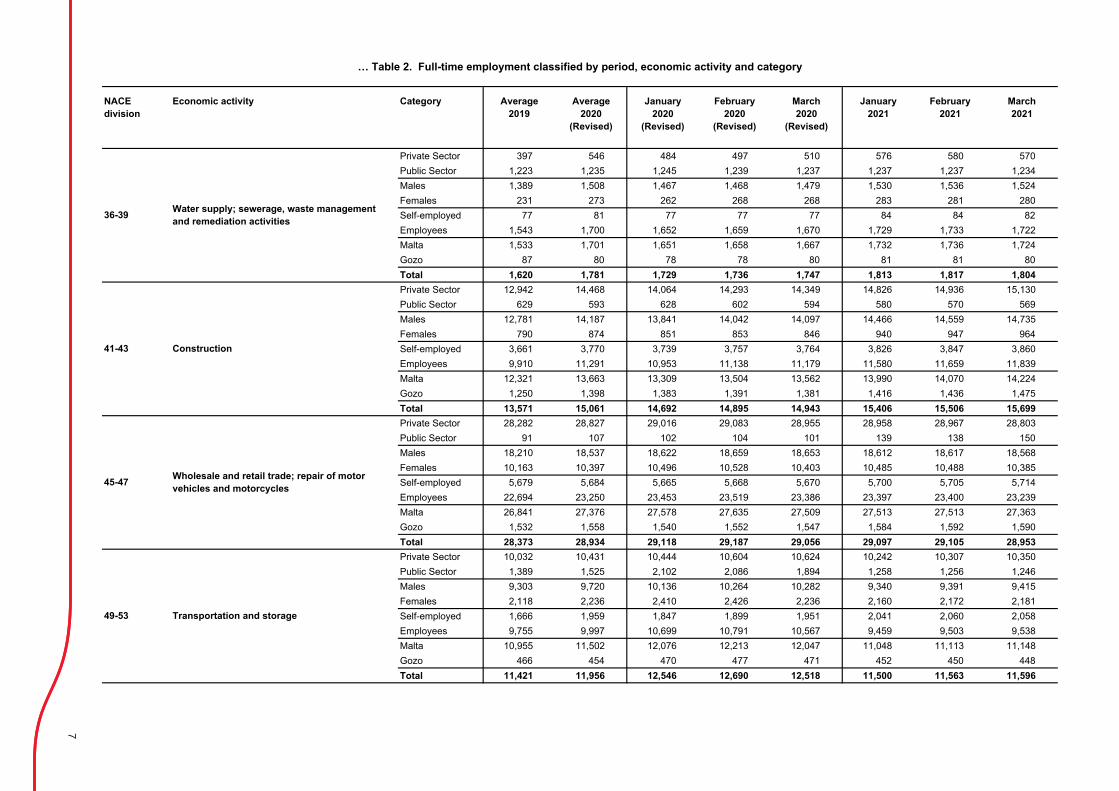
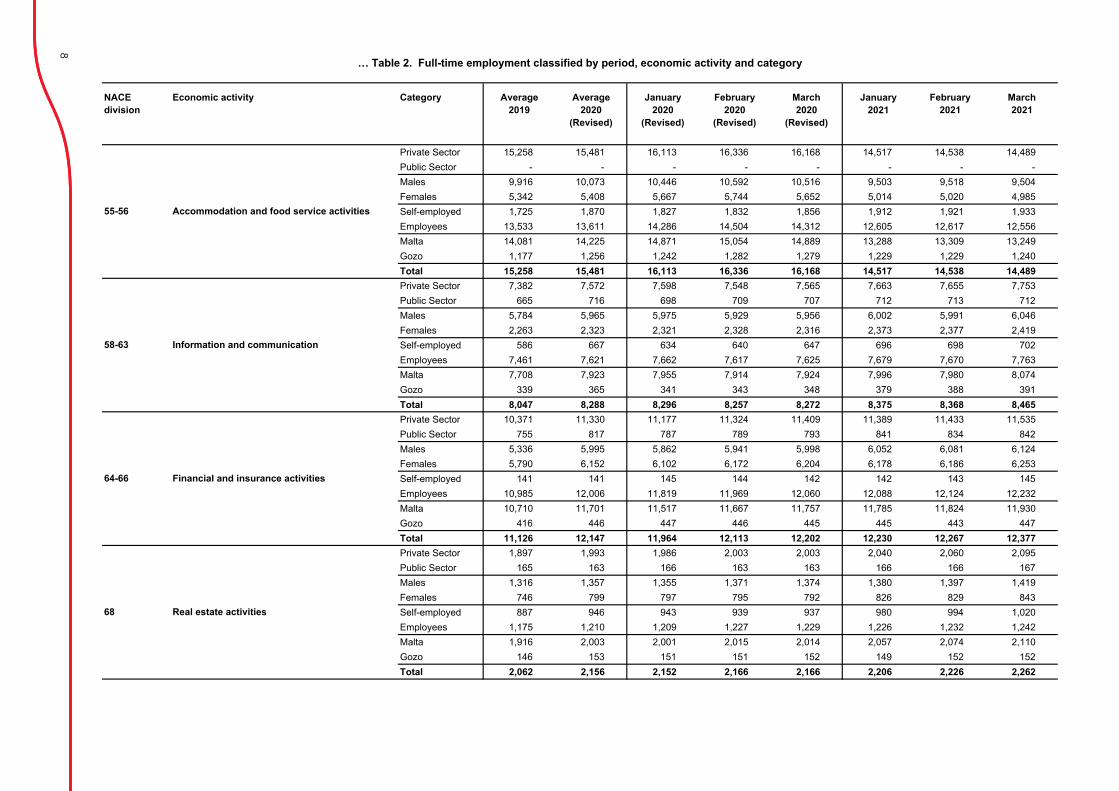
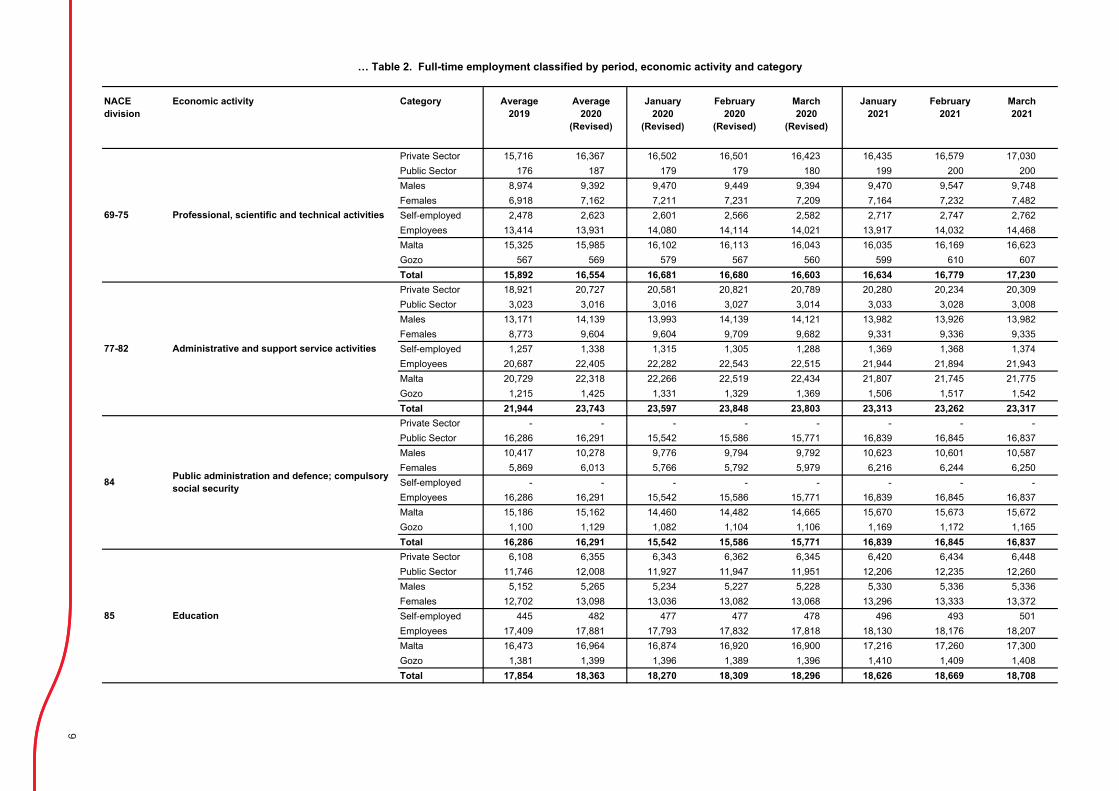
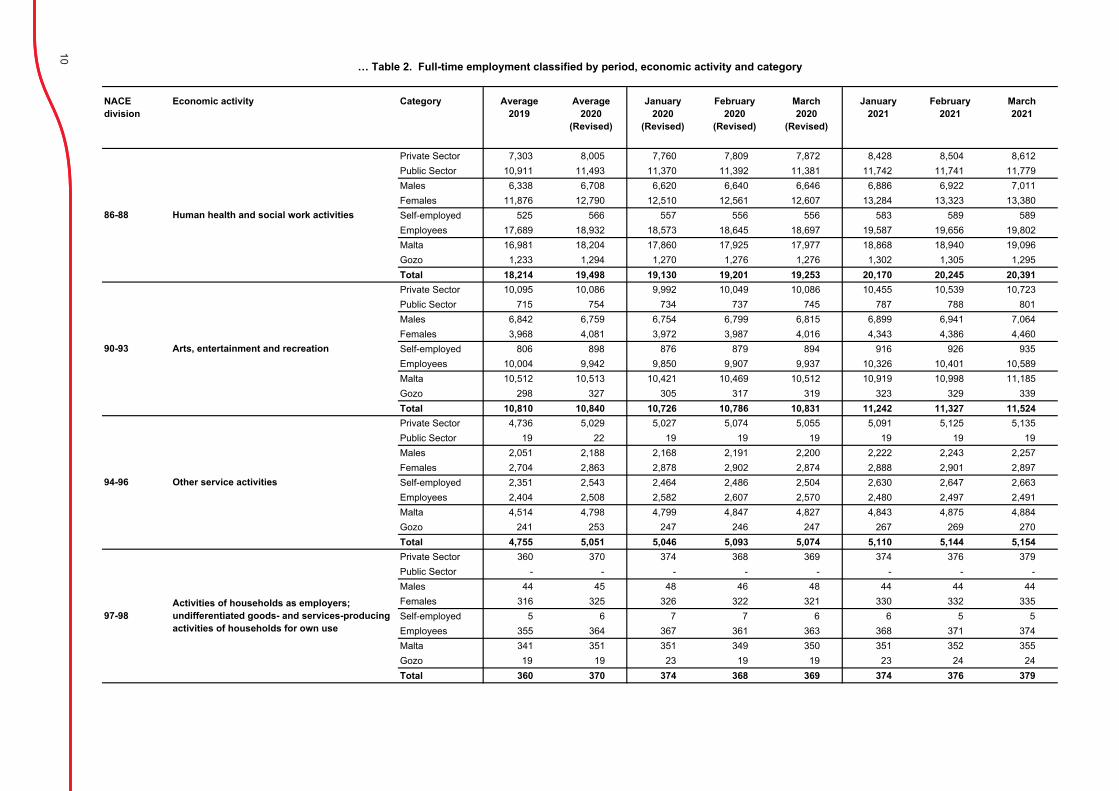
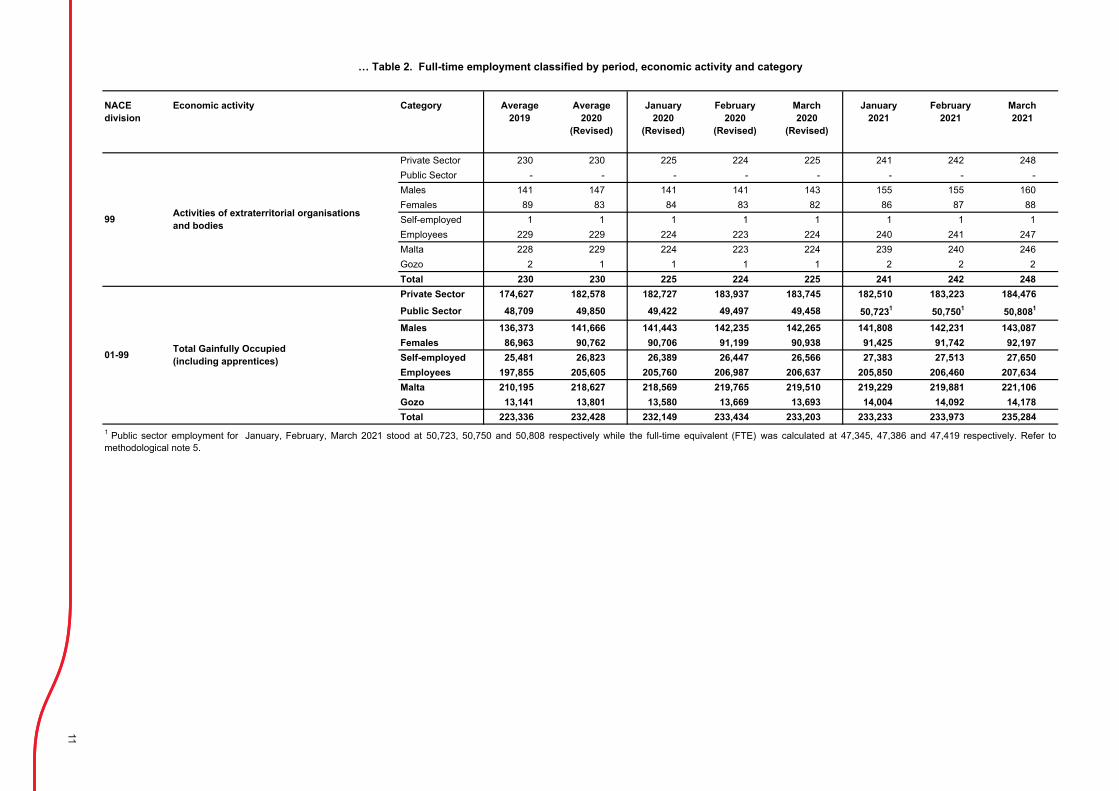
In March 2021, the highest increase in employment was brought about by human health and social work activities (NACE 86-88) and public administration and defence, compulsory social security (NACE 84), with 1,138 and 1,066 persons respectively, when compared to the same month last year (Table 1). Registered full-time employment in the private sector went up 731 persons to 184,476. Public sector full-time employment increased by 1,350 persons to 50,808 (Table 2).
The number of persons registered as full-time self-employed rose by 1,084 when compared to March 2020, while the number of persons registered as employees increased by 997. Full-time employment for males and females went up by 0.6 per cent and 1.4 per cent respectively over 2020 levels (Table 2).
Registered part-time employment
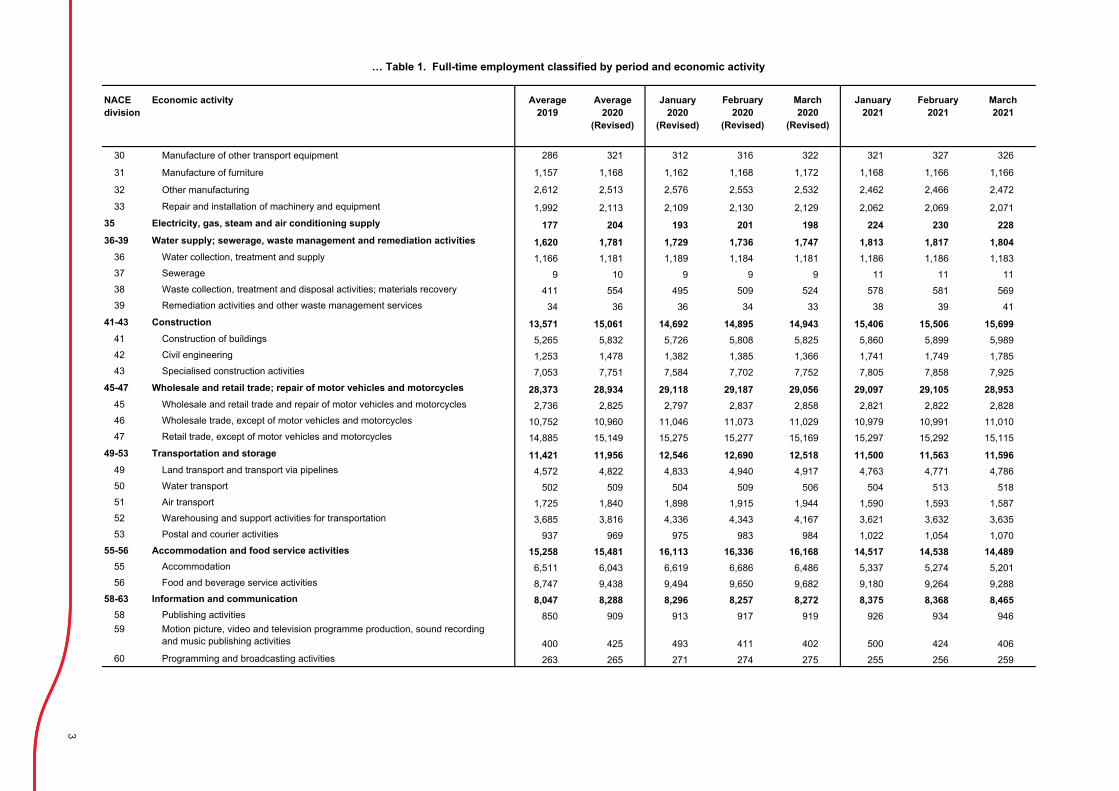
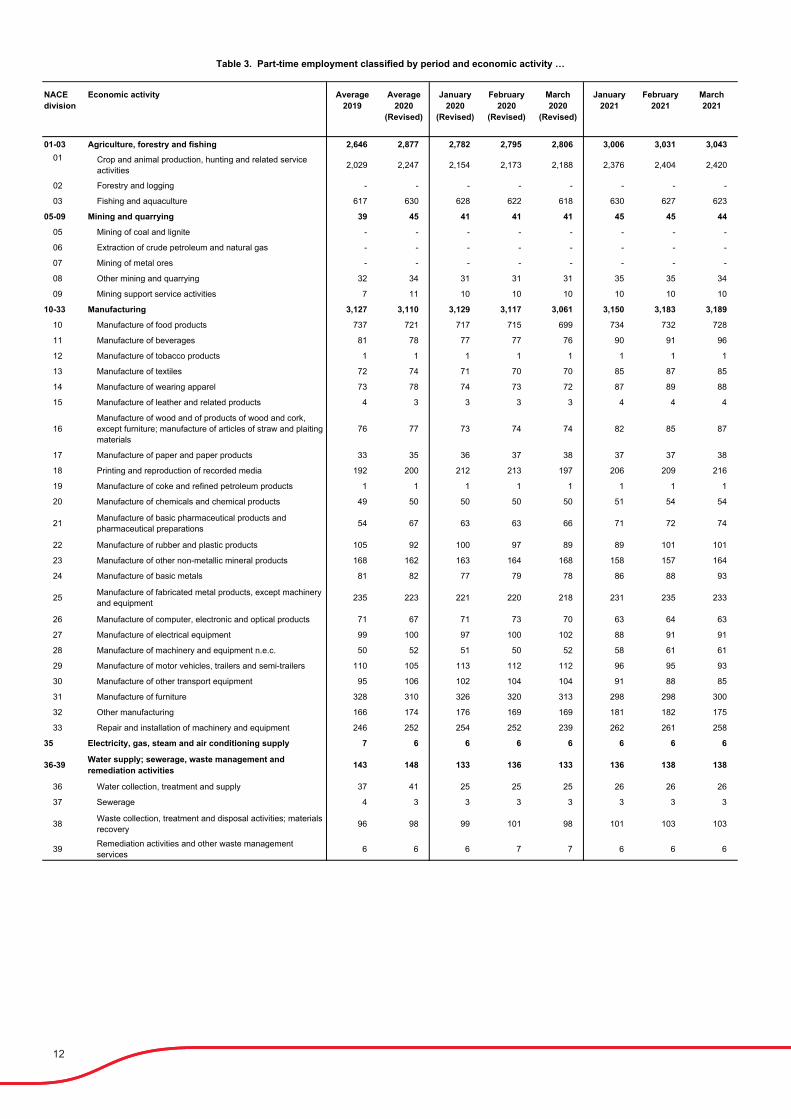
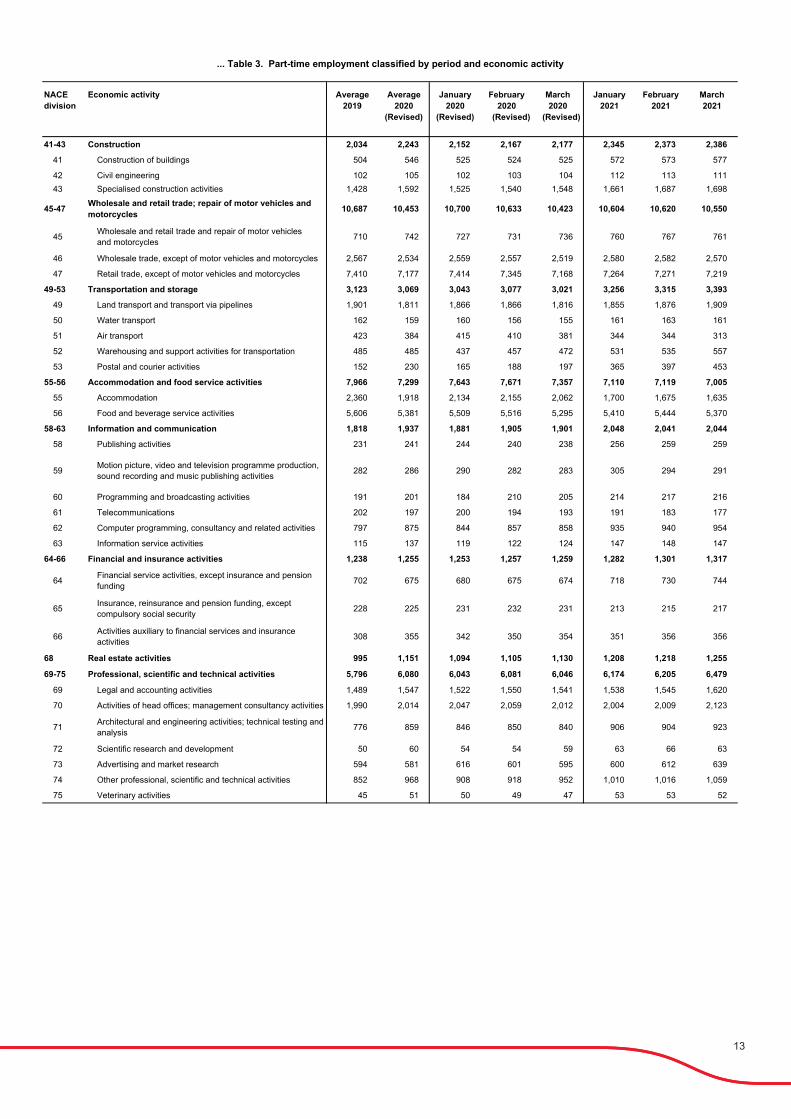
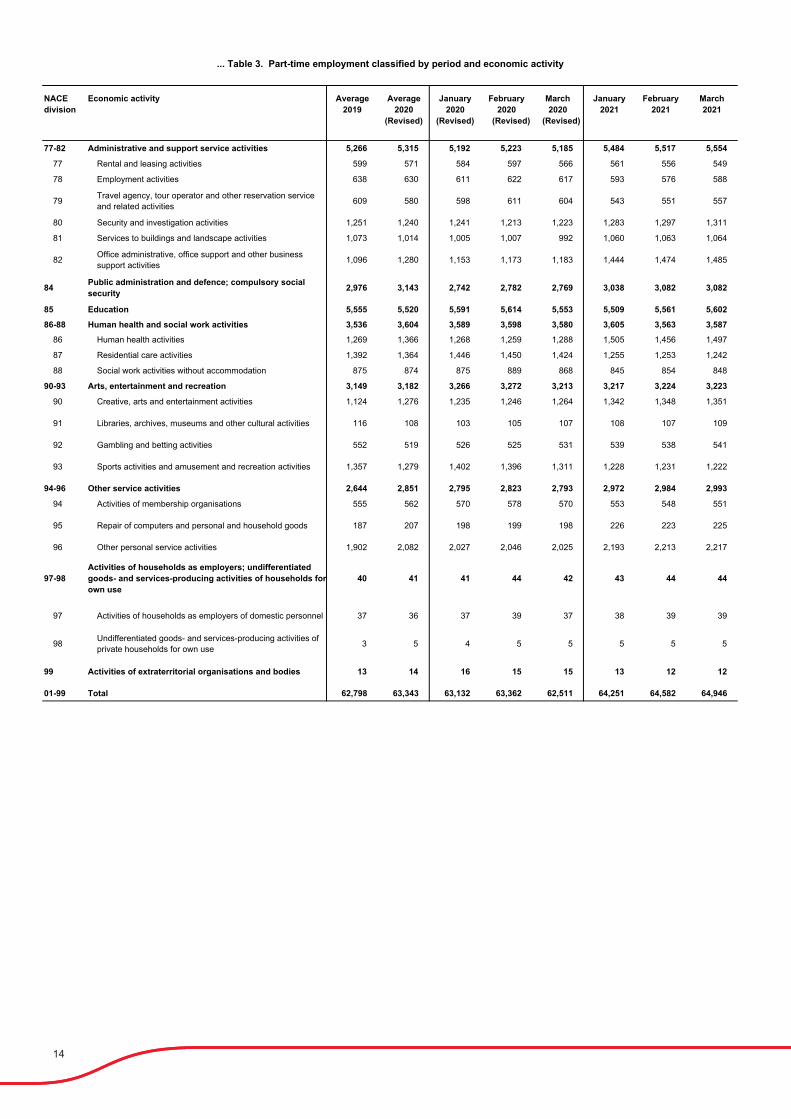
Registered part-time employment in March 2021 increased by 3.9 per cent when compared to the same month in 2020. Professional, scientific and technical activities (NACE 69-75) followed by transportation and storage (NACE 49-53) recorded the highest increases in part-time employment with 433 and 372 respectively. On the other hand, employment within the accommodation and food services activities (NACE 55-56) decreased by 352 when compared to March 2020 (Table 3).
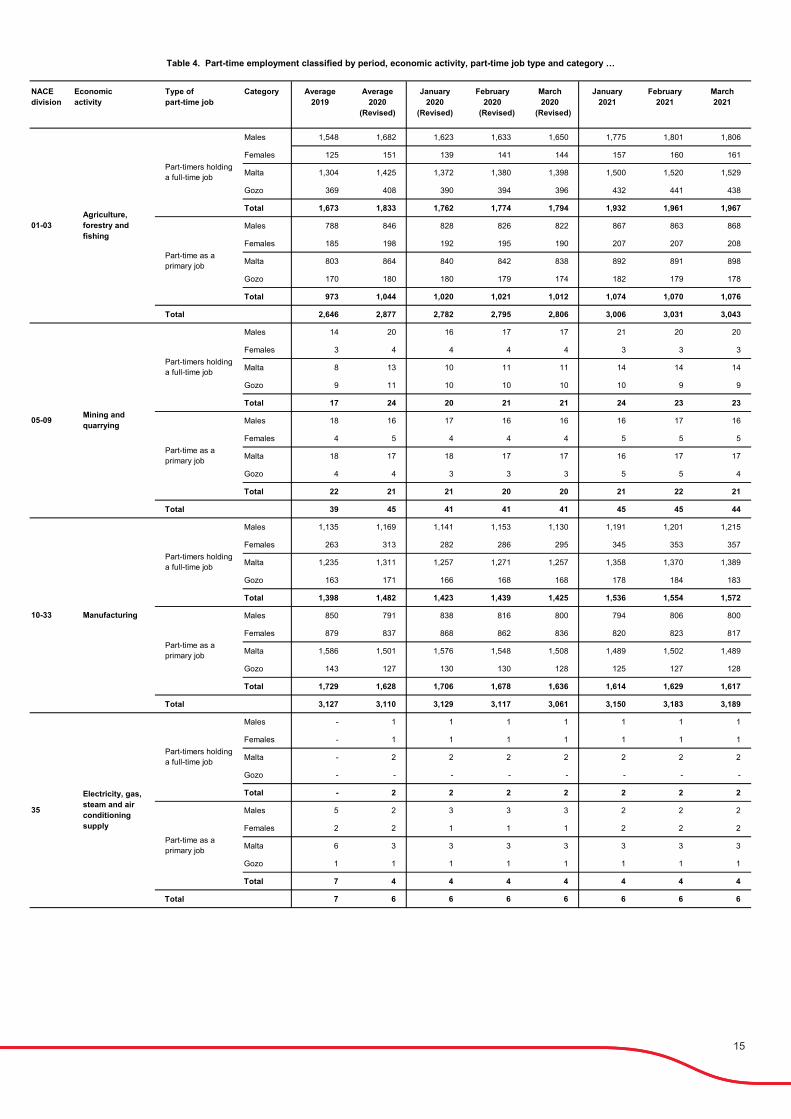
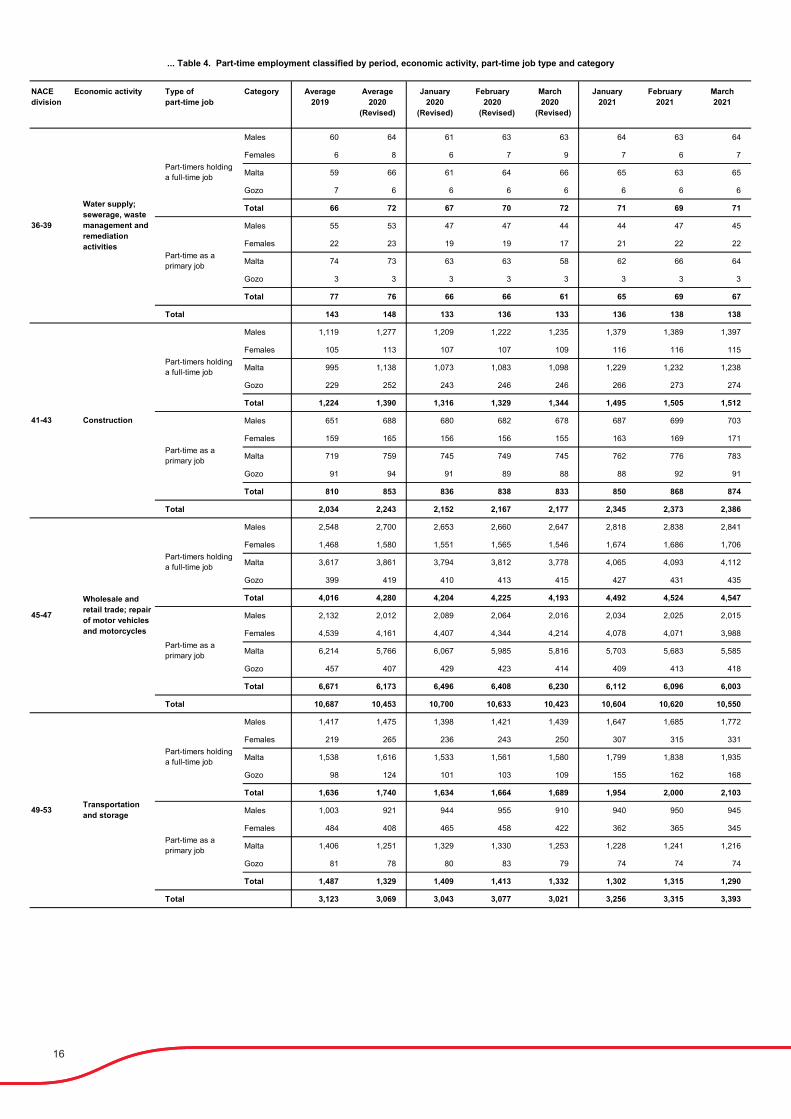
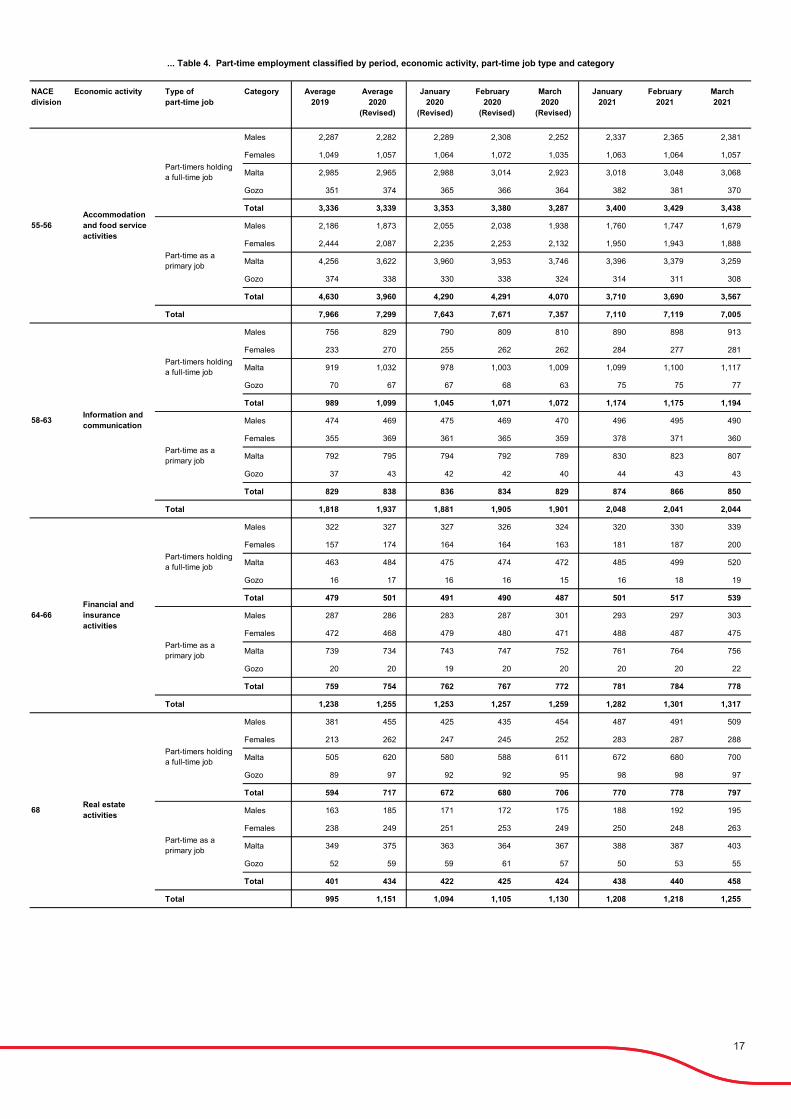
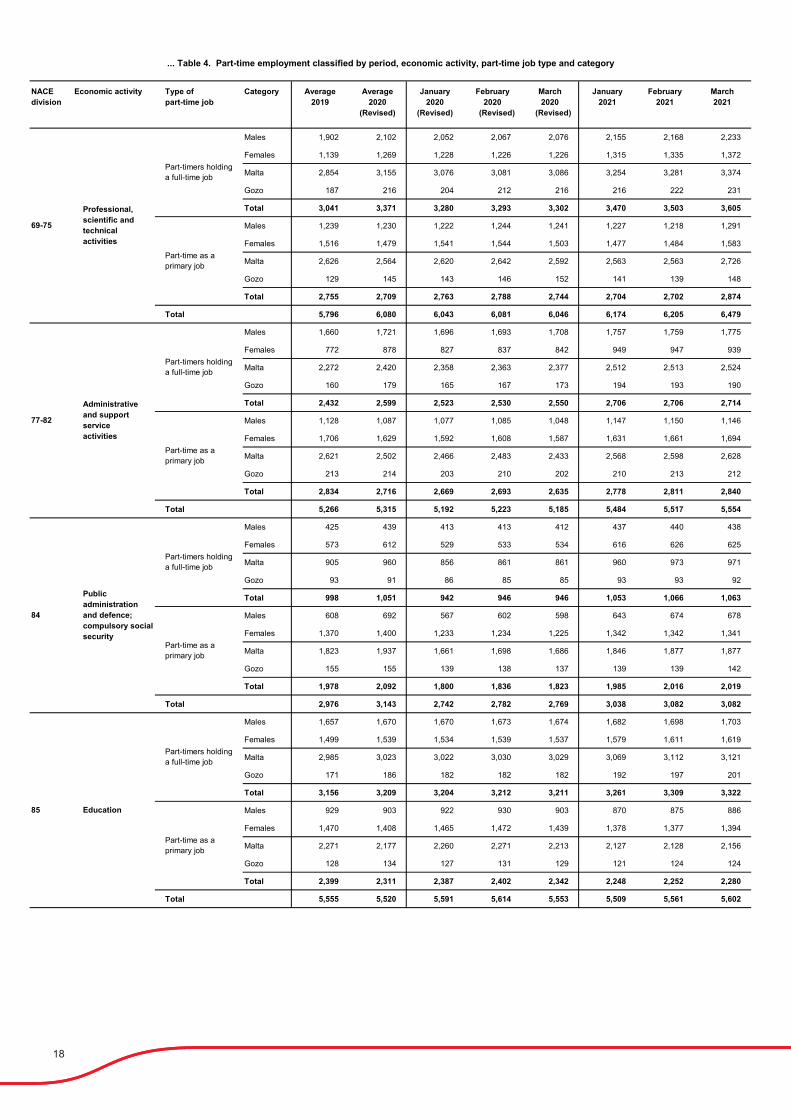
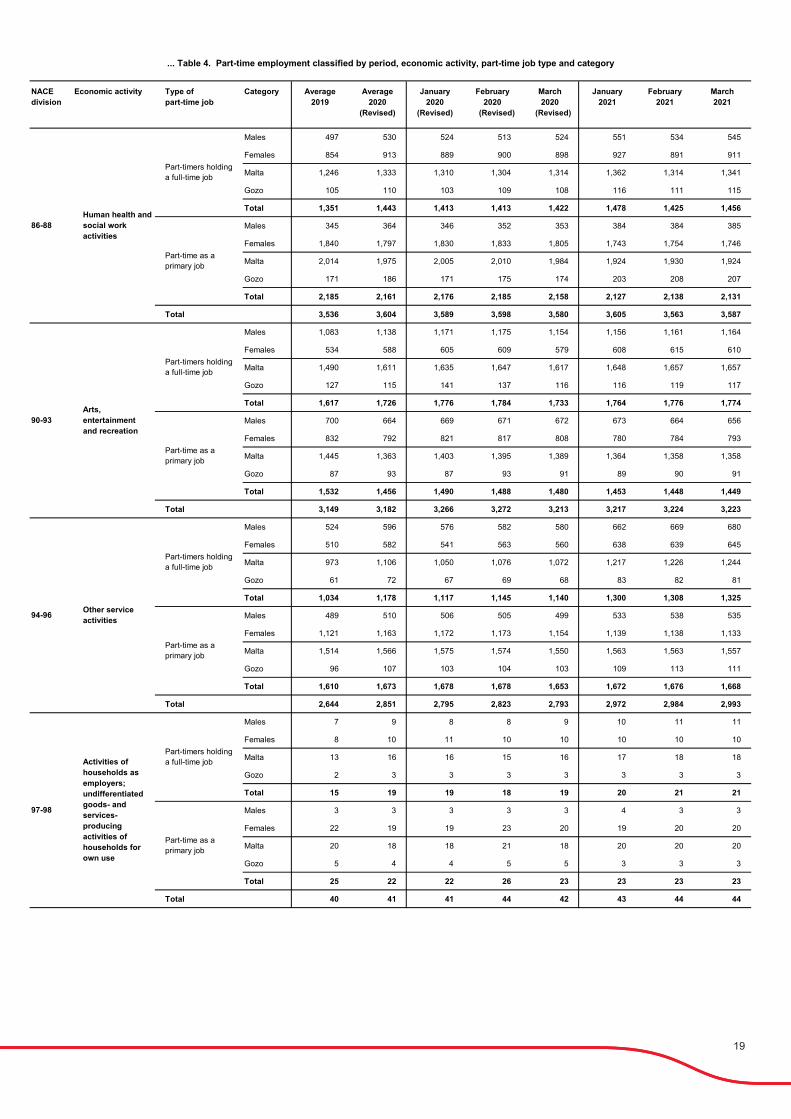
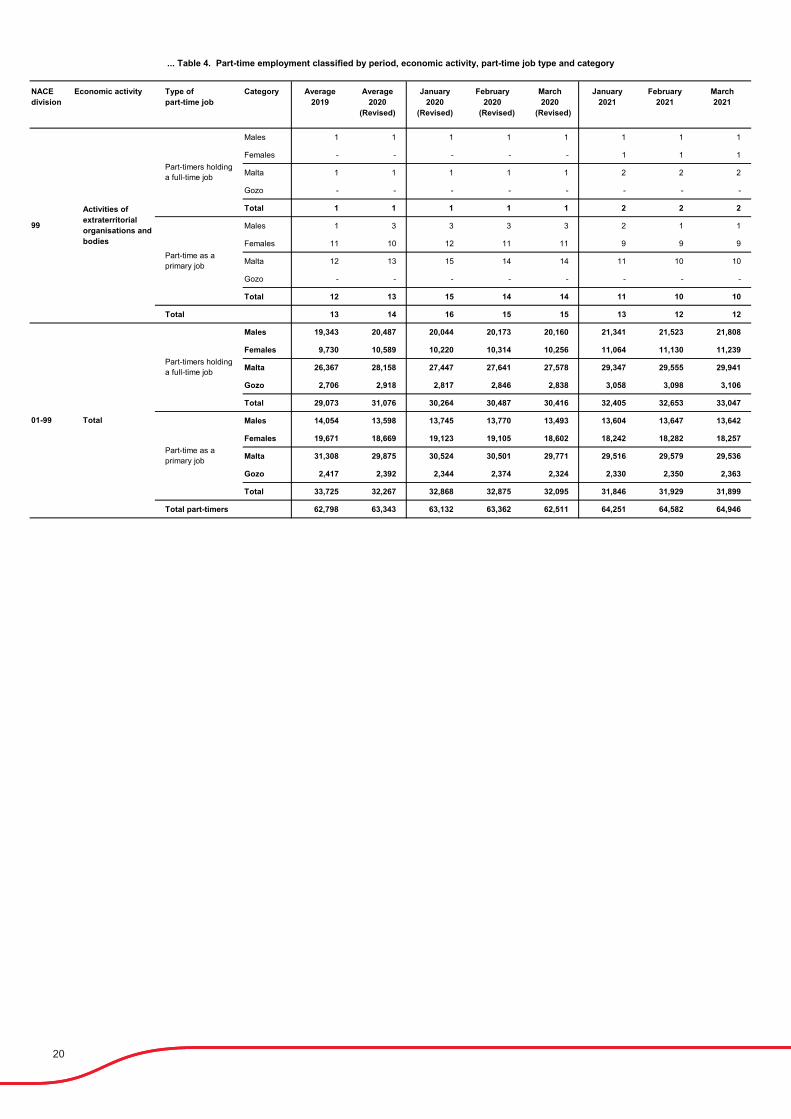
The number of part-timers who also held a full-time job amounted to 33,047 up by 8.7 per cent, when compared to the corresponding month in 2020. Employed persons whose part-time job was their primary occupation totalled 31,899, down by 0.6 per cent when compared to the same month in 2020 (Table 4) ■
https://twitter.com/NSOMALTA/ https://www.facebook.com/nsomalta/
Compiled by: Labour Market and Information Society Statistics Unit Contact us: National Statistics Office, Lascaris, Valletta VLT 2000 T. +356 25997219, E. [email protected]
Statistics in this News Release should be interpreted in the context of the COVID-19 situation.
2
NACE division
Economic activity
01-03 Agriculture, forestry and fishing 2,448 2,502 2,492 2,492 2,479 2,519 2,527 2,56501 Crop and animal production, hunting and related service activities 1,644 1,655 1,656 1,664 1,654 1,662 1,670 1,67802 Forestry and logging - - - - - - - -03 Fishing and aquaculture 804 847 836 828 825 857 857 887
05-09 Mining and quarrying 376 371 381 381 386 363 364 36405 Mining of coal and lignite - - - - - - - -06 Extraction of crude petroleum and natural gas - - - - - - - -07 Mining of metal ores - - - - - - - -08 Other mining and quarrying 196 206 201 201 205 210 209 21109 Mining support service activities 180 165 180 180 181 153 155 153
10-33 Manufacturing 22,512 22,607 22,882 22,885 22,843 22,434 22,573 22,69410 Manufacture of food products 2,637 2,621 2,670 2,668 2,644 2,595 2,624 2,63511 Manufacture of beverages 932 881 923 924 914 858 868 87912 Manufacture of tobacco products 16 16 16 16 16 15 15 1513 Manufacture of textiles 338 345 337 339 344 365 365 36814 Manufacture of wearing apparel 152 150 158 158 155 139 139 13715 Manufacture of leather and related products 18 17 17 17 17 16 16 1716 Manufacture of wood and of products of wood and cork, except furniture;
manufacture of articles of straw and plaiting materials 402 400 414 415 406 407 412 421
17 Manufacture of paper and paper products 260 271 266 270 272 273 277 27818 Printing and reproduction of recorded media 1,639 1,646 1,626 1,628 1,624 1,680 1,678 1,67919 Manufacture of coke and refined petroleum products 8 8 7 7 7 8 9 920 Manufacture of chemicals and chemical products 276 271 272 273 270 270 272 27421 Manufacture of basic pharmaceutical products and pharmaceutical preparations 1,013 1,044 1,031 1,032 1,024 1,109 1,123 1,13022 Manufacture of rubber and plastic products 1,748 1,668 1,710 1,706 1,703 1,649 1,657 1,670
23 Manufacture of other non-metallic mineral products 1,121 1,205 1,207 1,202 1,210 1,223 1,239 1,245
24 Manufacture of basic metals 195 225 216 219 217 231 229 230
25 Manufacture of fabricated metal products, except machinery and equipment 1,184 1,228 1,224 1,224 1,238 1,229 1,236 1,257
26 Manufacture of computer, electronic and optical products 2,350 2,291 2,374 2,373 2,363 2,216 2,230 2,239
27 Manufacture of electrical equipment 600 618 651 650 647 539 544 538
28 Manufacture of machinery and equipment n.e.c. 532 543 550 547 556 529 530 543
29 Manufacture of motor vehicles, trailers and semi-trailers 1,044 1,044 1,054 1,050 1,061 1,070 1,082 1,095
Table 1. Full-time employment classified by period and economic activity …
January 2021
Average 2019
January 2020
(Revised)
February 2021
Average 2020
(Revised)
February2020
(Revised)
March2020
(Revised)
March 2021
3
NACE division
Economic activity
30 Manufacture of other transport equipment 286 321 312 316 322 321 327 326
31 Manufacture of furniture 1,157 1,168 1,162 1,168 1,172 1,168 1,166 1,166
32 Other manufacturing 2,612 2,513 2,576 2,553 2,532 2,462 2,466 2,472
33 Repair and installation of machinery and equipment 1,992 2,113 2,109 2,130 2,129 2,062 2,069 2,07135 Electricity, gas, steam and air conditioning supply 177 204 193 201 198 224 230 22836-39 Water supply; sewerage, waste management and remediation activities 1,620 1,781 1,729 1,736 1,747 1,813 1,817 1,804
36 Water collection, treatment and supply 1,166 1,181 1,189 1,184 1,181 1,186 1,186 1,18337 Sewerage 9 10 9 9 9 11 11 1138 Waste collection, treatment and disposal activities; materials recovery 411 554 495 509 524 578 581 56939 Remediation activities and other waste management services 34 36 36 34 33 38 39 41
41-43 Construction 13,571 15,061 14,692 14,895 14,943 15,406 15,506 15,69941 Construction of buildings 5,265 5,832 5,726 5,808 5,825 5,860 5,899 5,98942 Civil engineering 1,253 1,478 1,382 1,385 1,366 1,741 1,749 1,78543 Specialised construction activities 7,053 7,751 7,584 7,702 7,752 7,805 7,858 7,925
45-47 Wholesale and retail trade; repair of motor vehicles and motorcycles 28,373 28,934 29,118 29,187 29,056 29,097 29,105 28,95345 Wholesale and retail trade and repair of motor vehicles and motorcycles 2,736 2,825 2,797 2,837 2,858 2,821 2,822 2,82846 Wholesale trade, except of motor vehicles and motorcycles 10,752 10,960 11,046 11,073 11,029 10,979 10,991 11,01047 Retail trade, except of motor vehicles and motorcycles 14,885 15,149 15,275 15,277 15,169 15,297 15,292 15,115
49-53 Transportation and storage 11,421 11,956 12,546 12,690 12,518 11,500 11,563 11,59649 Land transport and transport via pipelines 4,572 4,822 4,833 4,940 4,917 4,763 4,771 4,78650 Water transport 502 509 504 509 506 504 513 51851 Air transport 1,725 1,840 1,898 1,915 1,944 1,590 1,593 1,58752 Warehousing and support activities for transportation 3,685 3,816 4,336 4,343 4,167 3,621 3,632 3,63553 Postal and courier activities 937 969 975 983 984 1,022 1,054 1,070
55-56 Accommodation and food service activities 15,258 15,481 16,113 16,336 16,168 14,517 14,538 14,48955 Accommodation 6,511 6,043 6,619 6,686 6,486 5,337 5,274 5,20156 Food and beverage service activities 8,747 9,438 9,494 9,650 9,682 9,180 9,264 9,288
58-63 Information and communication 8,047 8,288 8,296 8,257 8,272 8,375 8,368 8,46558 Publishing activities 850 909 913 917 919 926 934 94659 Motion picture, video and television programme production, sound recording
and music publishing activities 400 425 493 411 402 500 424 40660 Programming and broadcasting activities 263 265 271 274 275 255 256 259
February2020
(Revised)
March2020
(Revised)
January 2021
February 2021
March 2021
Average 2020
(Revised)
… Table 1. Full-time employment classified by period and economic activity
January 2020
(Revised)
Average 2019
4
NACE division
Economic activity
61 Telecommunications 1,701 1,627 1,651 1,663 1,670 1,522 1,518 1,52362 Computer programming, consultancy and related activities 3,967 4,034 3,990 4,000 4,006 4,106 4,167 4,25963 Information service activities 866 1,028 978 992 1,000 1,066 1,069 1,072
64-66 Financial and insurance activities 11,126 12,147 11,964 12,113 12,202 12,230 12,267 12,37764 Financial service activities, except insurance and pension funding 7,810 8,719 8,550 8,662 8,752 8,959 8,999 9,072
65 Insurance, reinsurance and pension funding, except compulsory social security 1,025 1,063 1,059 1,066 1,064 1,038 1,036 1,04766 Activities auxiliary to financial services and insurance activities 2,291 2,365 2,355 2,385 2,386 2,233 2,232 2,258
68 Real estate activities 2,062 2,156 2,152 2,166 2,166 2,206 2,226 2,262
69-75 Professional, scientific and technical activities 15,892 16,554 16,681 16,680 16,603 16,634 16,779 17,23069 Legal and accounting activities 4,534 4,456 4,573 4,525 4,513 4,383 4,383 4,42370 Activities of head offices; management consultancy activities 5,200 5,690 5,697 5,730 5,675 5,794 5,905 6,26271 Architectural and engineering activities; technical testing and analysis 2,820 3,104 3,049 3,070 3,078 3,137 3,142 3,16372 Scientific research and development 77 85 80 78 77 106 112 11373 Advertising and market research 2,198 2,059 2,145 2,131 2,113 2,010 2,026 2,05274 Other professional, scientific and technical activities 934 1,010 995 1,001 1,000 1,042 1,048 1,05275 Veterinary activities 129 150 142 145 147 162 163 165
77-82 Administrative and support service activities 21,944 23,743 23,597 23,848 23,803 23,313 23,262 23,31777 Rental and leasing activities 1,640 1,655 1,705 1,721 1,664 1,637 1,627 1,64378 Employment activities 5,078 6,163 6,050 6,147 6,197 6,071 6,067 6,08079 Travel agency, tour operator and other reservation service and related activities 1,354 1,334 1,379 1,423 1,395 1,239 1,232 1,21480 Security and investigation activities 3,286 2,985 2,822 2,819 2,861 3,235 3,248 3,28681 Services to buildings and landscape activities 6,297 6,970 7,132 7,174 7,121 6,749 6,705 6,67182 Office administrative, office support and other business support activities 4,289 4,636 4,509 4,564 4,565 4,382 4,383 4,423
84 Public administration and defence; compulsory social security 16,286 16,291 15,542 15,586 15,771 16,839 16,845 16,837
85 Education 17,854 18,363 18,270 18,309 18,296 18,626 18,669 18,708
86-88 Human health and social work activities 18,214 19,498 19,130 19,201 19,253 20,170 20,245 20,39186 Human health activities 9,666 10,117 10,020 9,999 9,973 10,386 10,392 10,45487 Residential care activities 6,196 6,678 6,437 6,495 6,573 6,996 7,066 7,14188 Social work activities without accommodation 2,352 2,703 2,673 2,707 2,707 2,788 2,787 2,796
90-93 Arts, entertainment and recreation 10,810 10,840 10,726 10,786 10,831 11,242 11,327 11,52490 Creative, arts and entertainment activities 863 960 936 950 963 982 990 1,011
February2020
(Revised)
March2020
(Revised)
January 2021
February 2021
March 2021
Average 2020
(Revised)
January 2020
(Revised)
… Table 1. Full-time employment classified by period and economic activity
Average 2019
5
NACE division
Economic activity
91 Libraries, archives, museums and other cultural activities 526 550 548 546 546 576 574 57392 Gambling and betting activities 8,257 8,086 8,009 8,038 8,071 8,415 8,495 8,65293 Sports activities and amusement and recreation activities 1,164 1,244 1,233 1,252 1,251 1,269 1,268 1,288
94-96 Other service activities 4,755 5,051 5,046 5,093 5,074 5,110 5,144 5,15494 Activities of membership organisations 866 918 927 930 928 932 945 95195 Repair of computers and personal and household goods 375 398 389 394 390 420 423 42896 Other personal service activities 3,514 3,735 3,730 3,769 3,756 3,758 3,776 3,775
97-98 Activities of households as employers; undifferentiated goods- and services-producing activities of households for own use 360 370 374 368 369 374 376 379
97 Activities of households as employers of domestic personnel 359 370 373 367 369 374 376 37998 Undifferentiated goods- and services-producing activities of private households for
own use 1 - 1 1 - - - -
99 Activities of extraterritorial organisations and bodies 230 230 225 224 225 241 242 248
01-99 Total Gainfully Occupied (including apprentices) 223,336 232,428 232,149 233,434 233,203 233,233 233,973 235,284
Registered Unemployed 1,700 3,160 1,691 1,659 2,125 2,675 2,585 2,387
Part I 1,542 2,880 1,509 1,492 1,923 2,413 2,312 2,146
Part II 158 280 182 167 202 262 273 241
Labour Supply (excluding part-time employment) 225,036 235,588 233,840 235,093 235,328 235,908 236,558 237,671
February2020
(Revised)
March2020
(Revised)
January 2021
February 2021
March 2021
Average 2019
Average 2020
(Revised)
January 2020
(Revised)
… Table 1. Full-time employment classified by period and economic activity
6
NACE division
Economic activity Category
Private Sector 2,065 2,113 2,115 2,110 2,100 2,102 2,101 2,131 Public Sector 383 389 377 382 379 417 426 434 Males 2,144 2,188 2,182 2,178 2,166 2,181 2,188 2,214 Females 304 314 310 314 313 338 339 351 Self-employed 1,364 1,364 1,362 1,354 1,352 1,374 1,373 1,381 Employees 1,084 1,138 1,130 1,138 1,127 1,145 1,154 1,184 Malta 1,962 2,012 2,007 2,000 1,992 2,019 2,026 2,053 Gozo 486 490 485 492 487 500 501 512 Total 2,448 2,502 2,492 2,492 2,479 2,519 2,527 2,565 Private Sector 376 371 381 381 386 363 364 364 Public Sector - - - - - - - - Males 332 327 334 334 338 319 319 320 Females 44 44 47 47 48 44 45 44 Self-employed 89 88 88 86 87 87 88 88 Employees 287 283 293 295 299 276 276 276 Malta 339 334 343 343 349 323 325 325 Gozo 37 37 38 38 37 40 39 39 Total 376 371 381 381 386 363 364 364 Private Sector 22,120 22,237 22,505 22,509 22,471 22,067 22,205 22,328 Public Sector 392 370 377 376 372 367 368 366 Males 16,577 16,707 16,848 16,854 16,845 16,609 16,711 16,825 Females 5,935 5,900 6,034 6,031 5,998 5,825 5,862 5,869 Self-employed 1,738 1,796 1,764 1,774 1,774 1,823 1,824 1,837 Employees 20,774 20,811 21,118 21,111 21,069 20,611 20,749 20,857 Malta 21,401 21,496 21,748 21,749 21,707 21,345 21,468 21,581 Gozo 1,111 1,111 1,134 1,136 1,136 1,089 1,105 1,113 Total 22,512 22,607 22,882 22,885 22,843 22,434 22,573 22,694 Private Sector 36 40 40 41 41 43 44 44 Public Sector 141 164 153 160 157 181 186 184 Males 155 181 171 177 174 203 208 204 Females 22 23 22 24 24 21 22 24 Self-employed - - - - - - - - Employees 177 204 193 201 198 224 230 228 Malta 139 167 156 166 161 185 191 189 Gozo 38 37 37 35 37 39 39 39 Total 177 204 193 201 198 224 230 228
February2020
(Revised)
March2020
(Revised)
January 2021
February 2021
March 2021
Agriculture, forestry and fishing
05-09 Mining and quarrying
01-03
10-33 Manufacturing
35 Electricity, gas, steam and air conditioning supply
Table 2. Full-time employment classified by period, economic activity and category …
January 2020
(Revised)
Average 2020
(Revised)
Average 2019
7
NACE division
Economic activity Category
Private Sector 397 546 484 497 510 576 580 570 Public Sector 1,223 1,235 1,245 1,239 1,237 1,237 1,237 1,234 Males 1,389 1,508 1,467 1,468 1,479 1,530 1,536 1,524 Females 231 273 262 268 268 283 281 280 Self-employed 77 81 77 77 77 84 84 82 Employees 1,543 1,700 1,652 1,659 1,670 1,729 1,733 1,722 Malta 1,533 1,701 1,651 1,658 1,667 1,732 1,736 1,724 Gozo 87 80 78 78 80 81 81 80 Total 1,620 1,781 1,729 1,736 1,747 1,813 1,817 1,804 Private Sector 12,942 14,468 14,064 14,293 14,349 14,826 14,936 15,130 Public Sector 629 593 628 602 594 580 570 569 Males 12,781 14,187 13,841 14,042 14,097 14,466 14,559 14,735 Females 790 874 851 853 846 940 947 964 Self-employed 3,661 3,770 3,739 3,757 3,764 3,826 3,847 3,860 Employees 9,910 11,291 10,953 11,138 11,179 11,580 11,659 11,839 Malta 12,321 13,663 13,309 13,504 13,562 13,990 14,070 14,224 Gozo 1,250 1,398 1,383 1,391 1,381 1,416 1,436 1,475 Total 13,571 15,061 14,692 14,895 14,943 15,406 15,506 15,699 Private Sector 28,282 28,827 29,016 29,083 28,955 28,958 28,967 28,803 Public Sector 91 107 102 104 101 139 138 150 Males 18,210 18,537 18,622 18,659 18,653 18,612 18,617 18,568 Females 10,163 10,397 10,496 10,528 10,403 10,485 10,488 10,385 Self-employed 5,679 5,684 5,665 5,668 5,670 5,700 5,705 5,714 Employees 22,694 23,250 23,453 23,519 23,386 23,397 23,400 23,239 Malta 26,841 27,376 27,578 27,635 27,509 27,513 27,513 27,363 Gozo 1,532 1,558 1,540 1,552 1,547 1,584 1,592 1,590 Total 28,373 28,934 29,118 29,187 29,056 29,097 29,105 28,953 Private Sector 10,032 10,431 10,444 10,604 10,624 10,242 10,307 10,350 Public Sector 1,389 1,525 2,102 2,086 1,894 1,258 1,256 1,246 Males 9,303 9,720 10,136 10,264 10,282 9,340 9,391 9,415 Females 2,118 2,236 2,410 2,426 2,236 2,160 2,172 2,181 Self-employed 1,666 1,959 1,847 1,899 1,951 2,041 2,060 2,058 Employees 9,755 9,997 10,699 10,791 10,567 9,459 9,503 9,538 Malta 10,955 11,502 12,076 12,213 12,047 11,048 11,113 11,148 Gozo 466 454 470 477 471 452 450 448 Total 11,421 11,956 12,546 12,690 12,518 11,500 11,563 11,596
February2020
(Revised)
March2020
(Revised)
January 2021
February 2021
March 2021
Transportation and storage
January 2020
(Revised)
41-43 Construction
36-39 Water supply; sewerage, waste management and remediation activities
45-47
Average 2020
(Revised)
49-53
Wholesale and retail trade; repair of motor vehicles and motorcycles
Average 2019
… Table 2. Full-time employment classified by period, economic activity and category
8
NACE division
Economic activity Category
Private Sector 15,258 15,481 16,113 16,336 16,168 14,517 14,538 14,489 Public Sector - - - - - - - - Males 9,916 10,073 10,446 10,592 10,516 9,503 9,518 9,504 Females 5,342 5,408 5,667 5,744 5,652 5,014 5,020 4,985 Self-employed 1,725 1,870 1,827 1,832 1,856 1,912 1,921 1,933 Employees 13,533 13,611 14,286 14,504 14,312 12,605 12,617 12,556 Malta 14,081 14,225 14,871 15,054 14,889 13,288 13,309 13,249 Gozo 1,177 1,256 1,242 1,282 1,279 1,229 1,229 1,240 Total 15,258 15,481 16,113 16,336 16,168 14,517 14,538 14,489 Private Sector 7,382 7,572 7,598 7,548 7,565 7,663 7,655 7,753 Public Sector 665 716 698 709 707 712 713 712 Males 5,784 5,965 5,975 5,929 5,956 6,002 5,991 6,046 Females 2,263 2,323 2,321 2,328 2,316 2,373 2,377 2,419 Self-employed 586 667 634 640 647 696 698 702 Employees 7,461 7,621 7,662 7,617 7,625 7,679 7,670 7,763 Malta 7,708 7,923 7,955 7,914 7,924 7,996 7,980 8,074 Gozo 339 365 341 343 348 379 388 391 Total 8,047 8,288 8,296 8,257 8,272 8,375 8,368 8,465 Private Sector 10,371 11,330 11,177 11,324 11,409 11,389 11,433 11,535 Public Sector 755 817 787 789 793 841 834 842 Males 5,336 5,995 5,862 5,941 5,998 6,052 6,081 6,124 Females 5,790 6,152 6,102 6,172 6,204 6,178 6,186 6,253 Self-employed 141 141 145 144 142 142 143 145 Employees 10,985 12,006 11,819 11,969 12,060 12,088 12,124 12,232 Malta 10,710 11,701 11,517 11,667 11,757 11,785 11,824 11,930 Gozo 416 446 447 446 445 445 443 447 Total 11,126 12,147 11,964 12,113 12,202 12,230 12,267 12,377 Private Sector 1,897 1,993 1,986 2,003 2,003 2,040 2,060 2,095 Public Sector 165 163 166 163 163 166 166 167 Males 1,316 1,357 1,355 1,371 1,374 1,380 1,397 1,419 Females 746 799 797 795 792 826 829 843 Self-employed 887 946 943 939 937 980 994 1,020 Employees 1,175 1,210 1,209 1,227 1,229 1,226 1,232 1,242 Malta 1,916 2,003 2,001 2,015 2,014 2,057 2,074 2,110 Gozo 146 153 151 151 152 149 152 152 Total 2,062 2,156 2,152 2,166 2,166 2,206 2,226 2,262
March 2021
February 2021
February2020
(Revised)
March2020
(Revised)
January 2021
Financial and insurance activities
58-63 Information and communication
64-66
55-56
Average 2019
Accommodation and food service activities
Average 2020
(Revised)
Real estate activities
… Table 2. Full-time employment classified by period, economic activity and category
68
January 2020
(Revised)
9
NACE division
Economic activity Category
Private Sector 15,716 16,367 16,502 16,501 16,423 16,435 16,579 17,030 Public Sector 176 187 179 179 180 199 200 200 Males 8,974 9,392 9,470 9,449 9,394 9,470 9,547 9,748 Females 6,918 7,162 7,211 7,231 7,209 7,164 7,232 7,482 Self-employed 2,478 2,623 2,601 2,566 2,582 2,717 2,747 2,762 Employees 13,414 13,931 14,080 14,114 14,021 13,917 14,032 14,468 Malta 15,325 15,985 16,102 16,113 16,043 16,035 16,169 16,623 Gozo 567 569 579 567 560 599 610 607 Total 15,892 16,554 16,681 16,680 16,603 16,634 16,779 17,230 Private Sector 18,921 20,727 20,581 20,821 20,789 20,280 20,234 20,309 Public Sector 3,023 3,016 3,016 3,027 3,014 3,033 3,028 3,008 Males 13,171 14,139 13,993 14,139 14,121 13,982 13,926 13,982 Females 8,773 9,604 9,604 9,709 9,682 9,331 9,336 9,335 Self-employed 1,257 1,338 1,315 1,305 1,288 1,369 1,368 1,374 Employees 20,687 22,405 22,282 22,543 22,515 21,944 21,894 21,943 Malta 20,729 22,318 22,266 22,519 22,434 21,807 21,745 21,775 Gozo 1,215 1,425 1,331 1,329 1,369 1,506 1,517 1,542 Total 21,944 23,743 23,597 23,848 23,803 23,313 23,262 23,317 Private Sector - - - - - - - - Public Sector 16,286 16,291 15,542 15,586 15,771 16,839 16,845 16,837 Males 10,417 10,278 9,776 9,794 9,792 10,623 10,601 10,587 Females 5,869 6,013 5,766 5,792 5,979 6,216 6,244 6,250 Self-employed - - - - - - - - Employees 16,286 16,291 15,542 15,586 15,771 16,839 16,845 16,837 Malta 15,186 15,162 14,460 14,482 14,665 15,670 15,673 15,672 Gozo 1,100 1,129 1,082 1,104 1,106 1,169 1,172 1,165 Total 16,286 16,291 15,542 15,586 15,771 16,839 16,845 16,837 Private Sector 6,108 6,355 6,343 6,362 6,345 6,420 6,434 6,448 Public Sector 11,746 12,008 11,927 11,947 11,951 12,206 12,235 12,260 Males 5,152 5,265 5,234 5,227 5,228 5,330 5,336 5,336 Females 12,702 13,098 13,036 13,082 13,068 13,296 13,333 13,372 Self-employed 445 482 477 477 478 496 493 501 Employees 17,409 17,881 17,793 17,832 17,818 18,130 18,176 18,207 Malta 16,473 16,964 16,874 16,920 16,900 17,216 17,260 17,300 Gozo 1,381 1,399 1,396 1,389 1,396 1,410 1,409 1,408 Total 17,854 18,363 18,270 18,309 18,296 18,626 18,669 18,708
84
February2020
(Revised)
March2020
(Revised)
January 2021
January 2020
(Revised)
Average 2020
(Revised)
Average 2019
Professional, scientific and technical activities
85
February 2021
March 2021
Public administration and defence; compulsory social security
… Table 2. Full-time employment classified by period, economic activity and category
Education
Administrative and support service activities77-82
69-75
10
NACE division
Economic activity Category
Private Sector 7,303 8,005 7,760 7,809 7,872 8,428 8,504 8,612 Public Sector 10,911 11,493 11,370 11,392 11,381 11,742 11,741 11,779 Males 6,338 6,708 6,620 6,640 6,646 6,886 6,922 7,011 Females 11,876 12,790 12,510 12,561 12,607 13,284 13,323 13,380 Self-employed 525 566 557 556 556 583 589 589 Employees 17,689 18,932 18,573 18,645 18,697 19,587 19,656 19,802 Malta 16,981 18,204 17,860 17,925 17,977 18,868 18,940 19,096 Gozo 1,233 1,294 1,270 1,276 1,276 1,302 1,305 1,295 Total 18,214 19,498 19,130 19,201 19,253 20,170 20,245 20,391 Private Sector 10,095 10,086 9,992 10,049 10,086 10,455 10,539 10,723 Public Sector 715 754 734 737 745 787 788 801 Males 6,842 6,759 6,754 6,799 6,815 6,899 6,941 7,064 Females 3,968 4,081 3,972 3,987 4,016 4,343 4,386 4,460 Self-employed 806 898 876 879 894 916 926 935 Employees 10,004 9,942 9,850 9,907 9,937 10,326 10,401 10,589 Malta 10,512 10,513 10,421 10,469 10,512 10,919 10,998 11,185 Gozo 298 327 305 317 319 323 329 339 Total 10,810 10,840 10,726 10,786 10,831 11,242 11,327 11,524 Private Sector 4,736 5,029 5,027 5,074 5,055 5,091 5,125 5,135 Public Sector 19 22 19 19 19 19 19 19 Males 2,051 2,188 2,168 2,191 2,200 2,222 2,243 2,257 Females 2,704 2,863 2,878 2,902 2,874 2,888 2,901 2,897 Self-employed 2,351 2,543 2,464 2,486 2,504 2,630 2,647 2,663 Employees 2,404 2,508 2,582 2,607 2,570 2,480 2,497 2,491 Malta 4,514 4,798 4,799 4,847 4,827 4,843 4,875 4,884 Gozo 241 253 247 246 247 267 269 270 Total 4,755 5,051 5,046 5,093 5,074 5,110 5,144 5,154 Private Sector 360 370 374 368 369 374 376 379 Public Sector - - - - - - - - Males 44 45 48 46 48 44 44 44 Females 316 325 326 322 321 330 332 335 Self-employed 5 6 7 7 6 6 5 5 Employees 355 364 367 361 363 368 371 374 Malta 341 351 351 349 350 351 352 355 Gozo 19 19 23 19 19 23 24 24 Total 360 370 374 368 369 374 376 379
94-96 Other service activities
Activities of households as employers; undifferentiated goods- and services-producing activities of households for own use
February2020
(Revised)
March2020
(Revised)
February 2021
January 2021
January 2020
(Revised)
97-98
… Table 2. Full-time employment classified by period, economic activity and category
March 2021
86-88
90-93 Arts, entertainment and recreation
Human health and social work activities
Average 2020
(Revised)
Average 2019
11
NACE division
Economic activity Category
Private Sector 230 230 225 224 225 241 242 248 Public Sector - - - - - - - - Males 141 147 141 141 143 155 155 160 Females 89 83 84 83 82 86 87 88 Self-employed 1 1 1 1 1 1 1 1 Employees 229 229 224 223 224 240 241 247 Malta 228 229 224 223 224 239 240 246 Gozo 2 1 1 1 1 2 2 2 Total 230 230 225 224 225 241 242 248 Private Sector 174,627 182,578 182,727 183,937 183,745 182,510 183,223 184,476 Public Sector 48,709 49,850 49,422 49,497 49,458 50,7231 50,7501 50,8081
Males 136,373 141,666 141,443 142,235 142,265 141,808 142,231 143,087 Females 86,963 90,762 90,706 91,199 90,938 91,425 91,742 92,197 Self-employed 25,481 26,823 26,389 26,447 26,566 27,383 27,513 27,650 Employees 197,855 205,605 205,760 206,987 206,637 205,850 206,460 207,634 Malta 210,195 218,627 218,569 219,765 219,510 219,229 219,881 221,106 Gozo 13,141 13,801 13,580 13,669 13,693 14,004 14,092 14,178 Total 223,336 232,428 232,149 233,434 233,203 233,233 233,973 235,284
1 Public sector employment for January, February, March 2021 stood at 50,723, 50,750 and 50,808 respectively while the full-time equivalent (FTE) was calculated at 47,345, 47,386 and 47,419 respectively. Refer tomethodological note 5.
01-99 Total Gainfully Occupied (including apprentices)
99 Activities of extraterritorial organisations and bodies
March 2021
January 2021
… Table 2. Full-time employment classified by period, economic activity and category
March2020
(Revised)
February2020
(Revised)
January 2020
(Revised)
Average 2020
(Revised)
Average 2019
February 2021
12
NACE division
Economic activity
01-03 Agriculture, forestry and fishing 2,646 2,877 2,782 2,795 2,806 3,006 3,031 3,04301 Crop and animal production, hunting and related service
activities 2,029 2,247 2,154 2,173 2,188 2,376 2,404 2,420
02 Forestry and logging - - - - - - - -
03 Fishing and aquaculture 617 630 628 622 618 630 627 623
05-09 Mining and quarrying 39 45 41 41 41 45 45 44
05 Mining of coal and lignite - - - - - - - -
06 Extraction of crude petroleum and natural gas - - - - - - - -
07 Mining of metal ores - - - - - - - -
08 Other mining and quarrying 32 34 31 31 31 35 35 34
09 Mining support service activities 7 11 10 10 10 10 10 10
10-33 Manufacturing 3,127 3,110 3,129 3,117 3,061 3,150 3,183 3,189
10 Manufacture of food products 737 721 717 715 699 734 732 728
11 Manufacture of beverages 81 78 77 77 76 90 91 96
12 Manufacture of tobacco products 1 1 1 1 1 1 1 1
13 Manufacture of textiles 72 74 71 70 70 85 87 85
14 Manufacture of wearing apparel 73 78 74 73 72 87 89 88
15 Manufacture of leather and related products 4 3 3 3 3 4 4 4
16Manufacture of wood and of products of wood and cork, except furniture; manufacture of articles of straw and plaiting materials
76 77 73 74 74 82 85 87
17 Manufacture of paper and paper products 33 35 36 37 38 37 37 38
18 Printing and reproduction of recorded media 192 200 212 213 197 206 209 216
19 Manufacture of coke and refined petroleum products 1 1 1 1 1 1 1 1
20 Manufacture of chemicals and chemical products 49 50 50 50 50 51 54 54
21 Manufacture of basic pharmaceutical products and pharmaceutical preparations 54 67 63 63 66 71 72 74
22 Manufacture of rubber and plastic products 105 92 100 97 89 89 101 101
23 Manufacture of other non-metallic mineral products 168 162 163 164 168 158 157 164
24 Manufacture of basic metals 81 82 77 79 78 86 88 93
25 Manufacture of fabricated metal products, except machinery and equipment 235 223 221 220 218 231 235 233
26 Manufacture of computer, electronic and optical products 71 67 71 73 70 63 64 63
27 Manufacture of electrical equipment 99 100 97 100 102 88 91 91
28 Manufacture of machinery and equipment n.e.c. 50 52 51 50 52 58 61 61
29 Manufacture of motor vehicles, trailers and semi-trailers 110 105 113 112 112 96 95 93
30 Manufacture of other transport equipment 95 106 102 104 104 91 88 85
31 Manufacture of furniture 328 310 326 320 313 298 298 300
32 Other manufacturing 166 174 176 169 169 181 182 175
33 Repair and installation of machinery and equipment 246 252 254 252 239 262 261 258
35 Electricity, gas, steam and air conditioning supply 7 6 6 6 6 6 6 6
36-39 Water supply; sewerage, waste management and remediation activities 143 148 133 136 133 136 138 138
36 Water collection, treatment and supply 37 41 25 25 25 26 26 26
37 Sewerage 4 3 3 3 3 3 3 3
38 Waste collection, treatment and disposal activities; materials recovery 96 98 99 101 98 101 103 103
39 Remediation activities and other waste management services 6 6 6 7 7 6 6 6
February 2021
March 2021
Table 3. Part-time employment classified by period and economic activity …
Average 2020
(Revised)
January2020
(Revised)
Average 2019
February2020
(Revised)
March2020
(Revised)
January 2021
13
NACE division
Economic activity
41-43 Construction 2,034 2,243 2,152 2,167 2,177 2,345 2,373 2,386
41 Construction of buildings 504 546 525 524 525 572 573 577
42 Civil engineering 102 105 102 103 104 112 113 11143 Specialised construction activities 1,428 1,592 1,525 1,540 1,548 1,661 1,687 1,698
45-47 Wholesale and retail trade; repair of motor vehicles and motorcycles 10,687 10,453 10,700 10,633 10,423 10,604 10,620 10,550
45 Wholesale and retail trade and repair of motor vehicles and motorcycles 710 742 727 731 736 760 767 761
46 Wholesale trade, except of motor vehicles and motorcycles 2,567 2,534 2,559 2,557 2,519 2,580 2,582 2,570
47 Retail trade, except of motor vehicles and motorcycles 7,410 7,177 7,414 7,345 7,168 7,264 7,271 7,219
49-53 Transportation and storage 3,123 3,069 3,043 3,077 3,021 3,256 3,315 3,393
49 Land transport and transport via pipelines 1,901 1,811 1,866 1,866 1,816 1,855 1,876 1,909
50 Water transport 162 159 160 156 155 161 163 161
51 Air transport 423 384 415 410 381 344 344 313
52 Warehousing and support activities for transportation 485 485 437 457 472 531 535 557
53 Postal and courier activities 152 230 165 188 197 365 397 453
55-56 Accommodation and food service activities 7,966 7,299 7,643 7,671 7,357 7,110 7,119 7,005
55 Accommodation 2,360 1,918 2,134 2,155 2,062 1,700 1,675 1,635
56 Food and beverage service activities 5,606 5,381 5,509 5,516 5,295 5,410 5,444 5,370
58-63 Information and communication 1,818 1,937 1,881 1,905 1,901 2,048 2,041 2,044
58 Publishing activities 231 241 244 240 238 256 259 259
59 Motion picture, video and television programme production, sound recording and music publishing activities 282 286 290 282 283 305 294 291
60 Programming and broadcasting activities 191 201 184 210 205 214 217 216
61 Telecommunications 202 197 200 194 193 191 183 177
62 Computer programming, consultancy and related activities 797 875 844 857 858 935 940 954
63 Information service activities 115 137 119 122 124 147 148 147
64-66 Financial and insurance activities 1,238 1,255 1,253 1,257 1,259 1,282 1,301 1,317
64 Financial service activities, except insurance and pension funding 702 675 680 675 674 718 730 744
65 Insurance, reinsurance and pension funding, except compulsory social security 228 225 231 232 231 213 215 217
66 Activities auxiliary to financial services and insurance activities 308 355 342 350 354 351 356 356
68 Real estate activities 995 1,151 1,094 1,105 1,130 1,208 1,218 1,255
69-75 Professional, scientific and technical activities 5,796 6,080 6,043 6,081 6,046 6,174 6,205 6,479
69 Legal and accounting activities 1,489 1,547 1,522 1,550 1,541 1,538 1,545 1,620
70 Activities of head offices; management consultancy activities 1,990 2,014 2,047 2,059 2,012 2,004 2,009 2,123
71 Architectural and engineering activities; technical testing and analysis 776 859 846 850 840 906 904 923
72 Scientific research and development 50 60 54 54 59 63 66 63
73 Advertising and market research 594 581 616 601 595 600 612 639
74 Other professional, scientific and technical activities 852 968 908 918 952 1,010 1,016 1,059
75 Veterinary activities 45 51 50 49 47 53 53 52
February 2020
(Revised)
March 2020
(Revised)
January 2021
February 2021
March 2021
Average 2020
(Revised)
... Table 3. Part-time employment classified by period and economic activity
January 2020
(Revised)
Average 2019
14
NACE division
Economic activity
77-82 Administrative and support service activities 5,266 5,315 5,192 5,223 5,185 5,484 5,517 5,554
77 Rental and leasing activities 599 571 584 597 566 561 556 549
78 Employment activities 638 630 611 622 617 593 576 588
79 Travel agency, tour operator and other reservation service and related activities 609 580 598 611 604 543 551 557
80 Security and investigation activities 1,251 1,240 1,241 1,213 1,223 1,283 1,297 1,311
81 Services to buildings and landscape activities 1,073 1,014 1,005 1,007 992 1,060 1,063 1,064
82 Office administrative, office support and other business support activities 1,096 1,280 1,153 1,173 1,183 1,444 1,474 1,485
84 Public administration and defence; compulsory social security 2,976 3,143 2,742 2,782 2,769 3,038 3,082 3,082
85 Education 5,555 5,520 5,591 5,614 5,553 5,509 5,561 5,602
86-88 Human health and social work activities 3,536 3,604 3,589 3,598 3,580 3,605 3,563 3,58786 Human health activities 1,269 1,366 1,268 1,259 1,288 1,505 1,456 1,497
87 Residential care activities 1,392 1,364 1,446 1,450 1,424 1,255 1,253 1,242
88 Social work activities without accommodation 875 874 875 889 868 845 854 848
90-93 Arts, entertainment and recreation 3,149 3,182 3,266 3,272 3,213 3,217 3,224 3,223
90 Creative, arts and entertainment activities 1,124 1,276 1,235 1,246 1,264 1,342 1,348 1,351
91 Libraries, archives, museums and other cultural activities 116 108 103 105 107 108 107 109
92 Gambling and betting activities 552 519 526 525 531 539 538 541
93 Sports activities and amusement and recreation activities 1,357 1,279 1,402 1,396 1,311 1,228 1,231 1,222
94-96 Other service activities 2,644 2,851 2,795 2,823 2,793 2,972 2,984 2,993
94 Activities of membership organisations 555 562 570 578 570 553 548 551
95 Repair of computers and personal and household goods 187 207 198 199 198 226 223 225
96 Other personal service activities 1,902 2,082 2,027 2,046 2,025 2,193 2,213 2,217
97-98Activities of households as employers; undifferentiated goods- and services-producing activities of households forown use
40 41 41 44 42 43 44 44
97 Activities of households as employers of domestic personnel 37 36 37 39 37 38 39 39
98 Undifferentiated goods- and services-producing activities of private households for own use 3 5 4 5 5 5 5 5
99 Activities of extraterritorial organisations and bodies 13 14 16 15 15 13 12 12
01-99 Total 62,798 63,343 63,132 63,362 62,511 64,251 64,582 64,946
February 2020
(Revised)
March 2020
(Revised)
January 2021
February 2021
March 2021
Average 2019
Average 2020
(Revised)
January 2020
(Revised)
... Table 3. Part-time employment classified by period and economic activity
15
NACE division
Economicactivity
Type ofpart-time job
Category
Males 1,548 1,682 1,623 1,633 1,650 1,775 1,801 1,806
Females 125 151 139 141 144 157 160 161
Malta 1,304 1,425 1,372 1,380 1,398 1,500 1,520 1,529
Gozo 369 408 390 394 396 432 441 438
Total 1,673 1,833 1,762 1,774 1,794 1,932 1,961 1,967
Males 788 846 828 826 822 867 863 868
Females 185 198 192 195 190 207 207 208
Malta 803 864 840 842 838 892 891 898
Gozo 170 180 180 179 174 182 179 178
Total 973 1,044 1,020 1,021 1,012 1,074 1,070 1,076
Total 2,646 2,877 2,782 2,795 2,806 3,006 3,031 3,043
Males 14 20 16 17 17 21 20 20
Females 3 4 4 4 4 3 3 3
Malta 8 13 10 11 11 14 14 14
Gozo 9 11 10 10 10 10 9 9
Total 17 24 20 21 21 24 23 23
Males 18 16 17 16 16 16 17 16
Females 4 5 4 4 4 5 5 5
Malta 18 17 18 17 17 16 17 17
Gozo 4 4 3 3 3 5 5 4
Total 22 21 21 20 20 21 22 21
Total 39 45 41 41 41 45 45 44
Males 1,135 1,169 1,141 1,153 1,130 1,191 1,201 1,215
Females 263 313 282 286 295 345 353 357
Malta 1,235 1,311 1,257 1,271 1,257 1,358 1,370 1,389
Gozo 163 171 166 168 168 178 184 183
Total 1,398 1,482 1,423 1,439 1,425 1,536 1,554 1,572
Males 850 791 838 816 800 794 806 800
Females 879 837 868 862 836 820 823 817
Malta 1,586 1,501 1,576 1,548 1,508 1,489 1,502 1,489
Gozo 143 127 130 130 128 125 127 128
Total 1,729 1,628 1,706 1,678 1,636 1,614 1,629 1,617
Total 3,127 3,110 3,129 3,117 3,061 3,150 3,183 3,189
Males - 1 1 1 1 1 1 1
Females - 1 1 1 1 1 1 1
Malta - 2 2 2 2 2 2 2
Gozo - - - - - - - -
Total - 2 2 2 2 2 2 2
Males 5 2 3 3 3 2 2 2
Females 2 2 1 1 1 2 2 2
Malta 6 3 3 3 3 3 3 3
Gozo 1 1 1 1 1 1 1 1
Total 7 4 4 4 4 4 4 4
Total 7 6 6 6 6 6 6 6
Table 4. Part-time employment classified by period, economic activity, part-time job type and category …
January 2020
(Revised)
February 2021
05-09 Mining and quarrying
Part-timers holdinga full-time job
Part-time as a primary job
Average 2020
(Revised)
01-03
Average 2019
Agriculture, forestry and fishing
Part-timers holdinga full-time job
Part-time as a primary job
February 2020
(Revised)
March 2020
(Revised)
January 2021
March 2021
10-33 Manufacturing
Part-timers holdinga full-time job
Part-time as a primary job
35
Part-timers holdinga full-time job
Electricity, gas, steam and air conditioning supply
Part-time as a primary job
16
NACE division
Economic activity Type ofpart-time job
Category
Males 60 64 61 63 63 64 63 64
Females 6 8 6 7 9 7 6 7
Malta 59 66 61 64 66 65 63 65
Gozo 7 6 6 6 6 6 6 6
Total 66 72 67 70 72 71 69 71
Males 55 53 47 47 44 44 47 45
Females 22 23 19 19 17 21 22 22
Malta 74 73 63 63 58 62 66 64
Gozo 3 3 3 3 3 3 3 3
Total 77 76 66 66 61 65 69 67
Total 143 148 133 136 133 136 138 138
Males 1,119 1,277 1,209 1,222 1,235 1,379 1,389 1,397
Females 105 113 107 107 109 116 116 115
Malta 995 1,138 1,073 1,083 1,098 1,229 1,232 1,238
Gozo 229 252 243 246 246 266 273 274
Total 1,224 1,390 1,316 1,329 1,344 1,495 1,505 1,512
Males 651 688 680 682 678 687 699 703
Females 159 165 156 156 155 163 169 171
Malta 719 759 745 749 745 762 776 783
Gozo 91 94 91 89 88 88 92 91
Total 810 853 836 838 833 850 868 874
Total 2,034 2,243 2,152 2,167 2,177 2,345 2,373 2,386
Males 2,548 2,700 2,653 2,660 2,647 2,818 2,838 2,841
Females 1,468 1,580 1,551 1,565 1,546 1,674 1,686 1,706
Malta 3,617 3,861 3,794 3,812 3,778 4,065 4,093 4,112
Gozo 399 419 410 413 415 427 431 435
Total 4,016 4,280 4,204 4,225 4,193 4,492 4,524 4,547
Males 2,132 2,012 2,089 2,064 2,016 2,034 2,025 2,015
Females 4,539 4,161 4,407 4,344 4,214 4,078 4,071 3,988
Malta 6,214 5,766 6,067 5,985 5,816 5,703 5,683 5,585
Gozo 457 407 429 423 414 409 413 418
Total 6,671 6,173 6,496 6,408 6,230 6,112 6,096 6,003
Total 10,687 10,453 10,700 10,633 10,423 10,604 10,620 10,550
Males 1,417 1,475 1,398 1,421 1,439 1,647 1,685 1,772
Females 219 265 236 243 250 307 315 331
Malta 1,538 1,616 1,533 1,561 1,580 1,799 1,838 1,935
Gozo 98 124 101 103 109 155 162 168
Total 1,636 1,740 1,634 1,664 1,689 1,954 2,000 2,103
Males 1,003 921 944 955 910 940 950 945
Females 484 408 465 458 422 362 365 345
Malta 1,406 1,251 1,329 1,330 1,253 1,228 1,241 1,216
Gozo 81 78 80 83 79 74 74 74
Total 1,487 1,329 1,409 1,413 1,332 1,302 1,315 1,290
Total 3,123 3,069 3,043 3,077 3,021 3,256 3,315 3,393
Part-time as a primary job
Water supply; sewerage, waste management and remediation activities
Wholesale and retail trade; repair of motor vehicles and motorcycles
Construction
Part-time as a primary job
Transportation and storage
Part-timers holdinga full-time job
Part-time as a primary job
Average 2019
Average 2020
(Revised)
36-39
Part-timers holdinga full-time job
49-53
45-47
Part-time as a primary job
41-43
... Table 4. Part-time employment classified by period, economic activity, part-time job type and category
Part-timers holdinga full-time job
Part-timers holdinga full-time job
January 2020
(Revised)
February 2021
March 2021
February 2020
(Revised)
March 2020
(Revised)
January 2021
17
NACE division
Economic activity Type ofpart-time job
Category
Males 2,287 2,282 2,289 2,308 2,252 2,337 2,365 2,381
Females 1,049 1,057 1,064 1,072 1,035 1,063 1,064 1,057
Malta 2,985 2,965 2,988 3,014 2,923 3,018 3,048 3,068
Gozo 351 374 365 366 364 382 381 370
Total 3,336 3,339 3,353 3,380 3,287 3,400 3,429 3,438
Males 2,186 1,873 2,055 2,038 1,938 1,760 1,747 1,679
Females 2,444 2,087 2,235 2,253 2,132 1,950 1,943 1,888
Malta 4,256 3,622 3,960 3,953 3,746 3,396 3,379 3,259
Gozo 374 338 330 338 324 314 311 308
Total 4,630 3,960 4,290 4,291 4,070 3,710 3,690 3,567
Total 7,966 7,299 7,643 7,671 7,357 7,110 7,119 7,005
Males 756 829 790 809 810 890 898 913
Females 233 270 255 262 262 284 277 281
Malta 919 1,032 978 1,003 1,009 1,099 1,100 1,117
Gozo 70 67 67 68 63 75 75 77
Total 989 1,099 1,045 1,071 1,072 1,174 1,175 1,194
Males 474 469 475 469 470 496 495 490
Females 355 369 361 365 359 378 371 360
Malta 792 795 794 792 789 830 823 807
Gozo 37 43 42 42 40 44 43 43
Total 829 838 836 834 829 874 866 850
Total 1,818 1,937 1,881 1,905 1,901 2,048 2,041 2,044
Males 322 327 327 326 324 320 330 339
Females 157 174 164 164 163 181 187 200
Malta 463 484 475 474 472 485 499 520
Gozo 16 17 16 16 15 16 18 19
Total 479 501 491 490 487 501 517 539
Males 287 286 283 287 301 293 297 303
Females 472 468 479 480 471 488 487 475
Malta 739 734 743 747 752 761 764 756
Gozo 20 20 19 20 20 20 20 22
Total 759 754 762 767 772 781 784 778
Total 1,238 1,255 1,253 1,257 1,259 1,282 1,301 1,317
Males 381 455 425 435 454 487 491 509
Females 213 262 247 245 252 283 287 288
Malta 505 620 580 588 611 672 680 700
Gozo 89 97 92 92 95 98 98 97
Total 594 717 672 680 706 770 778 797
Males 163 185 171 172 175 188 192 195
Females 238 249 251 253 249 250 248 263
Malta 349 375 363 364 367 388 387 403
Gozo 52 59 59 61 57 50 53 55
Total 401 434 422 425 424 438 440 458
Total 995 1,151 1,094 1,105 1,130 1,208 1,218 1,255
January 2020
(Revised)
55-56
Part-timers holdinga full-time job
Part-time as a primary job
58-63 Information and communication
Part-timers holdinga full-time job
Part-time as a primary job
Accommodation and food service activities
Average 2019
Part-time as a primary job
64-66Financial and insurance activities
Part-timers holdinga full-time job
Part-time as a primary job
68 Real estate activities
Part-timers holdinga full-time job
... Table 4. Part-time employment classified by period, economic activity, part-time job type and category
Average 2020
(Revised)
February 2020
(Revised)
March 2020
(Revised)
January 2021
February 2021
March 2021
18
NACE division
Economic activity Type ofpart-time job
Category
Males 1,902 2,102 2,052 2,067 2,076 2,155 2,168 2,233
Females 1,139 1,269 1,228 1,226 1,226 1,315 1,335 1,372
Malta 2,854 3,155 3,076 3,081 3,086 3,254 3,281 3,374
Gozo 187 216 204 212 216 216 222 231
Total 3,041 3,371 3,280 3,293 3,302 3,470 3,503 3,605
Males 1,239 1,230 1,222 1,244 1,241 1,227 1,218 1,291
Females 1,516 1,479 1,541 1,544 1,503 1,477 1,484 1,583
Malta 2,626 2,564 2,620 2,642 2,592 2,563 2,563 2,726
Gozo 129 145 143 146 152 141 139 148
Total 2,755 2,709 2,763 2,788 2,744 2,704 2,702 2,874
Total 5,796 6,080 6,043 6,081 6,046 6,174 6,205 6,479
Males 1,660 1,721 1,696 1,693 1,708 1,757 1,759 1,775
Females 772 878 827 837 842 949 947 939
Malta 2,272 2,420 2,358 2,363 2,377 2,512 2,513 2,524
Gozo 160 179 165 167 173 194 193 190
Total 2,432 2,599 2,523 2,530 2,550 2,706 2,706 2,714
Males 1,128 1,087 1,077 1,085 1,048 1,147 1,150 1,146
Females 1,706 1,629 1,592 1,608 1,587 1,631 1,661 1,694
Malta 2,621 2,502 2,466 2,483 2,433 2,568 2,598 2,628
Gozo 213 214 203 210 202 210 213 212
Total 2,834 2,716 2,669 2,693 2,635 2,778 2,811 2,840
Total 5,266 5,315 5,192 5,223 5,185 5,484 5,517 5,554
Males 425 439 413 413 412 437 440 438
Females 573 612 529 533 534 616 626 625
Malta 905 960 856 861 861 960 973 971
Gozo 93 91 86 85 85 93 93 92
Total 998 1,051 942 946 946 1,053 1,066 1,063
Males 608 692 567 602 598 643 674 678
Females 1,370 1,400 1,233 1,234 1,225 1,342 1,342 1,341
Malta 1,823 1,937 1,661 1,698 1,686 1,846 1,877 1,877
Gozo 155 155 139 138 137 139 139 142
Total 1,978 2,092 1,800 1,836 1,823 1,985 2,016 2,019
Total 2,976 3,143 2,742 2,782 2,769 3,038 3,082 3,082
Males 1,657 1,670 1,670 1,673 1,674 1,682 1,698 1,703
Females 1,499 1,539 1,534 1,539 1,537 1,579 1,611 1,619
Malta 2,985 3,023 3,022 3,030 3,029 3,069 3,112 3,121
Gozo 171 186 182 182 182 192 197 201
Total 3,156 3,209 3,204 3,212 3,211 3,261 3,309 3,322
Males 929 903 922 930 903 870 875 886
Females 1,470 1,408 1,465 1,472 1,439 1,378 1,377 1,394
Malta 2,271 2,177 2,260 2,271 2,213 2,127 2,128 2,156
Gozo 128 134 127 131 129 121 124 124
Total 2,399 2,311 2,387 2,402 2,342 2,248 2,252 2,280
Total 5,555 5,520 5,591 5,614 5,553 5,509 5,561 5,602
Average 2019
February 2020
(Revised)
March 2020
(Revised)
January 2021
... Table 4. Part-time employment classified by period, economic activity, part-time job type and category
Public administration and defence; compulsory social security
84
Part-time as a primary job
Part-time as a primary job
Average 2020
(Revised)
January 2020
(Revised)
85
69-75
Professional, scientific and technical activities
77-82
Administrative and support service activities
Part-timers holdinga full-time job
Part-time as a primary job
Education
Part-timers holdinga full-time job
Part-timers holdinga full-time job
Part-timers holdinga full-time job
Part-time as a primary job
February 2021
March 2021
19
NACE division
Economic activity Type ofpart-time job
Category
Males 497 530 524 513 524 551 534 545
Females 854 913 889 900 898 927 891 911
Malta 1,246 1,333 1,310 1,304 1,314 1,362 1,314 1,341
Gozo 105 110 103 109 108 116 111 115
Total 1,351 1,443 1,413 1,413 1,422 1,478 1,425 1,456
Males 345 364 346 352 353 384 384 385
Females 1,840 1,797 1,830 1,833 1,805 1,743 1,754 1,746
Malta 2,014 1,975 2,005 2,010 1,984 1,924 1,930 1,924
Gozo 171 186 171 175 174 203 208 207
Total 2,185 2,161 2,176 2,185 2,158 2,127 2,138 2,131
Total 3,536 3,604 3,589 3,598 3,580 3,605 3,563 3,587
Males 1,083 1,138 1,171 1,175 1,154 1,156 1,161 1,164
Females 534 588 605 609 579 608 615 610
Malta 1,490 1,611 1,635 1,647 1,617 1,648 1,657 1,657
Gozo 127 115 141 137 116 116 119 117
Total 1,617 1,726 1,776 1,784 1,733 1,764 1,776 1,774
Males 700 664 669 671 672 673 664 656
Females 832 792 821 817 808 780 784 793
Malta 1,445 1,363 1,403 1,395 1,389 1,364 1,358 1,358
Gozo 87 93 87 93 91 89 90 91
Total 1,532 1,456 1,490 1,488 1,480 1,453 1,448 1,449
Total 3,149 3,182 3,266 3,272 3,213 3,217 3,224 3,223
Males 524 596 576 582 580 662 669 680
Females 510 582 541 563 560 638 639 645
Malta 973 1,106 1,050 1,076 1,072 1,217 1,226 1,244
Gozo 61 72 67 69 68 83 82 81
Total 1,034 1,178 1,117 1,145 1,140 1,300 1,308 1,325
Males 489 510 506 505 499 533 538 535
Females 1,121 1,163 1,172 1,173 1,154 1,139 1,138 1,133
Malta 1,514 1,566 1,575 1,574 1,550 1,563 1,563 1,557
Gozo 96 107 103 104 103 109 113 111
Total 1,610 1,673 1,678 1,678 1,653 1,672 1,676 1,668
Total 2,644 2,851 2,795 2,823 2,793 2,972 2,984 2,993
Males 7 9 8 8 9 10 11 11
Females 8 10 11 10 10 10 10 10
Malta 13 16 16 15 16 17 18 18
Gozo 2 3 3 3 3 3 3 3
Total 15 19 19 18 19 20 21 21
Males 3 3 3 3 3 4 3 3
Females 22 19 19 23 20 19 20 20
Malta 20 18 18 21 18 20 20 20
Gozo 5 4 4 5 5 3 3 3
Total 25 22 22 26 23 23 23 23
Total 40 41 41 44 42 43 44 44
January 2021
... Table 4. Part-time employment classified by period, economic activity, part-time job type and category
Average 2019
Part-time as a primary job
Part-timers holdinga full-time job
January 2020
(Revised)
February 2020
(Revised)
March 2020
(Revised)
Average 2020
(Revised)
Part-time as a primary job
Part-timers holdinga full-time job
Human health and social work activities
Part-timers holdinga full-time job
Part-time as a primary job
Arts, entertainment and recreation
Part-timers holdinga full-time job
Other service activities
Part-time as a primary job
86-88
97-98
90-93
94-96
Activities of households as employers; undifferentiated goods- and services-producing activities of households for own use
February 2021
March 2021
20
NACE division
Economic activity Type ofpart-time job
Category
Males 1 1 1 1 1 1 1 1
Females - - - - - 1 1 1
Malta 1 1 1 1 1 2 2 2
Gozo - - - - - - - -
Total 1 1 1 1 1 2 2 2
Males 1 3 3 3 3 2 1 1
Females 11 10 12 11 11 9 9 9
Malta 12 13 15 14 14 11 10 10
Gozo - - - - - - - -
Total 12 13 15 14 14 11 10 10
Total 13 14 16 15 15 13 12 12
Males 19,343 20,487 20,044 20,173 20,160 21,341 21,523 21,808
Females 9,730 10,589 10,220 10,314 10,256 11,064 11,130 11,239
Malta 26,367 28,158 27,447 27,641 27,578 29,347 29,555 29,941
Gozo 2,706 2,918 2,817 2,846 2,838 3,058 3,098 3,106
Total 29,073 31,076 30,264 30,487 30,416 32,405 32,653 33,047
Males 14,054 13,598 13,745 13,770 13,493 13,604 13,647 13,642
Females 19,671 18,669 19,123 19,105 18,602 18,242 18,282 18,257
Malta 31,308 29,875 30,524 30,501 29,771 29,516 29,579 29,536
Gozo 2,417 2,392 2,344 2,374 2,324 2,330 2,350 2,363
Total 33,725 32,267 32,868 32,875 32,095 31,846 31,929 31,899
Total part-timers 62,798 63,343 63,132 63,362 62,511 64,251 64,582 64,946
Average 2020
(Revised)
... Table 4. Part-time employment classified by period, economic activity, part-time job type and category
Average 2019
January 2020
(Revised)
01-99 Total
Part-timers holdinga full-time job
Part-time as a primary job
99
Activities of extraterritorial organisations and bodies
Part-timers holdinga full-time job
Part-time as a primary job
February 2020
(Revised)
March 2020
(Revised)
January 2021
February 2021
March 2021
21
1.
2.
3.
4.
5.
● Labour Supply: Full-time gainfully occupied population and the registered unemployed population.
● Apprentices, trainees and students: Includes apprentices, trainees, Junior College and University students in thesummer work-phase, undergraduate trainees and trainees with fixed contracts.
● Regional employment: Data on Malta/Gozo employment differs on the basis of economic sector. Accordingly, the data onprivate sector employment depends on employee residence, whereas data for public sector depends on employerinformation on the location of its employees.
● Full-time equivalent (FTE): Employment in full-time equivalent is a conversion method used to measure the number ofemployees according to the number of hours worked. When using FTE a full-time employee working a 40-hour week isequivalent to 1.0, whereas a person who works 20 hours per week is equivalent to 0.5. Table 2 of this release includespersons who work full-time, persons on a full-time with reduced hours basis and full-time employees who are on unpaidleave. When converting these figures into FTE, full-time employees are considered as 1 whereas persons working full-timewith reduced hours or who are on unpaid leave are considered according to the hours worked. FTE data is currentlyavailable in respect of public sector employment and is based on the administrative records of the People and StandardsDivision within the Office of the Prime Minister. FTE information for the private sector is not available.
● Part 1 of the unemployment register: Persons registering under Part 1 are either new job seekers who have left school,re-entrants into the labour market, or individuals who have been made redundant by their former employer.
● Part 2 of the unemployment register: Persons registering under Part 2 are either workers who have been dismissed fromwork due to disciplinary action, left work out of their own free will, refused work or training opportunities or were struck offthe register after an inspection by Law Enforcement personnel.
6.
Statistical concepts: https://metadata.nso.gov.mt/concepts.aspxClassifications: https://metadata.nso.gov.mt/classificationdetails.aspx?id=NACE%20Rev.%202
7. References to this news release are to be cited appropriately.
8. A detailed news release calendar is available on:https://nso.gov.mt/en/News_Releases/Release_Calendar/Pages/News-Release-Calendar.aspx
More information relating to this news release may be accessed at:
Methodological Notes
Definitions:
The data provided in this release, including the relevant classifications, is based on administrative records held at Jobsplus.The information contained in this release may be subject to revision.
The National Statistics Office publishes, on a quarterly basis, another set of statistics on employment and unemploymentbased on the Labour Force Survey (LFS). When compiling LFS statistics, the NSO adopts the International LabourOrganisation (ILO) definition, an internationally agreed definition on employment and unemployment. This definition has alsobeen adopted by Eurostat and is used by all EU Member States. More details regarding the methodology used for thecompilation of employment and unemployment statistics from the LFS may be found in quarterly LFS news releases.
Since Jobsplus records and LFS results measure two different facets of employment and unemployment, these are notcomparable. Users are therefore cautioned that these two sets of statistics should not be used interchangeably.
Full-time and part-time status is determined by the employer's declaration (or that made by a self-employed person) in theengagement form which is required to be sent to Jobsplus upon commencement of employment.
Apprentices are included under their respective economic activity.