Embed Size (px)
Citation preview

Perspectives on Psychological Science2016, Vol. 11(6) 917 –928© The Author(s) 2016Reprints and permissions: sagepub.com/journalsPermissions.navDOI: 10.1177/1745691616674458pps.sagepub.com
Could smiling make us happier? Does frowning make us sad? In their seminal article, Strack, Martin, and Stepper (1988; henceforth SMS) tested this facial feedback hypoth-esis: Are our affective responses guided, in part, by our own facial expressions? In two studies, they induced dif-ferent groups of participants to produce a facial expres-sion (i.e., smiling or pouting) usually associated with a particular emotional state (i.e., happiness or discontent). They then measured whether that induced facial
expression changed judgments in ways consistent with the associated emotional states.
674458 PPSXXX10.1177/1745691616674458Wagenmakers et al.RRR Facial Feedback Hypothesisresearch-article2016
Corresponding Author:E.-J. Wagenmakers, Department of Psychological Methods, Room G 0.29, University of Amsterdam, Nieuwe Achtergracht 129B, 1018 VZ Amsterdam, The Netherlands E-mail: [email protected]
Registered Replication Report: Strack, Martin, & Stepper (1988)
E.-J. Wagenmakers, Titia Beek, Laura Dijkhoff, and Quentin F. GronauDepartment of Psychological Methods, University of Amsterdam, The Netherlands
Contributing authors (alphabetical order): Acosta, A., Adams, R. B., Jr., Albohn, D. N., Allard, E. S., Benning, S. D., Blouin-Hudon, E.-M., Bulnes, L. C., Caldwell, T. L., Calin-Jageman, R. J., Capaldi, C. A., Carfagno, N. S., Chasten, K. T., Cleeremans, A., Connell, L., DeCicco, J. M., Dijkstra, K., Fischer, A. H., Foroni, F., Hess, U., Holmes, K. J., Jones, J. L. H., Klein, O., Koch, C., Korb, S., Lewinski, P., Liao, J. D., Lund, S., Lupiáñez, J., Lynott, D., Nance, C. N., Oosterwijk, S., Özdog ru, A. A., Pacheco-Unguetti, A. P., Pearson, B., Powis, C., Riding, S., Roberts, T.-A., Rumiati, R. I., Senden, M., Shea-Shumsky, N. B., Sobocko, K., Soto, J. A., Steiner, T. G., Talarico, J. M., van Allen, Z. M., Vandekerckhove, M., Wainwright, B., Wayand, J. F., Zeelenberg, R., Zetzer, E. E., Zwaan, R. A.
Protocol vetted by: Ursula Hess
Protocol edited by: Daniel J. Simons
Multilab direct replication of: Study 1 from Strack, F., Martin, L. L., & Stepper, S. (1988). Inhibiting and facilitating conditions of the human smile: A nonobtrusive test of the facial feedback hypothesis. Journal of Personality and Social Psychology, 54, 768-777.
Data and registered protocols: https://osf.io/pkd65/
Citation: Wagenmakers, E.-J., Beek, T., Dijkhoff, L., Gronau, Q. F., Acosta, A., Adams, R. B., Jr., . . . Zwaan, R. A. (2016). Registered Replication Report: Strack, Martin, & Stepper (1988). Perspectives on Psychological Science, 11, 917–928.
AbstractAccording to the facial feedback hypothesis, people’s affective responses can be influenced by their own facial expression (e.g., smiling, pouting), even when their expression did not result from their emotional experiences. For example, Strack, Martin, and Stepper (1988) instructed participants to rate the funniness of cartoons using a pen that they held in their mouth. In line with the facial feedback hypothesis, when participants held the pen with their teeth (inducing a “smile”), they rated the cartoons as funnier than when they held the pen with their lips (inducing a “pout”). This seminal study of the facial feedback hypothesis has not been replicated directly. This Registered Replication Report describes the results of 17 independent direct replications of Study 1 from Strack et al. (1988), all of which followed the same vetted protocol. A meta-analysis of these studies examined the difference in funniness ratings between the “smile” and “pout” conditions. The original Strack et al. (1988) study reported a rating difference of 0.82 units on a 10-point Likert scale. Our meta-analysis revealed a rating difference of 0.03 units with a 95% confidence interval ranging from −0.11 to 0.16.
Keywordsfacial feedback hypothesis, replication, many-labs, preregistration
by Jennifer Talarico on December 4, 2016pps.sagepub.comDownloaded from

918 Wagenmakers et al.
Specifically, Strack and colleagues had participants rate the funniness of cartoons using a pen that they held in their mouth, purportedly to investigate “people’s abil-ity to perform different tasks with parts of their body not normally used for those tasks, as injured or handicapped persons often have to do. Participants were then asked to perform a variety of tasks by holding a pen with their lips only, with their teeth only, or with their nondominant hand” (Strack et al., 1988, p. 770). As depicted in Figure 1, holding the pen with one’s teeth induces a smile and holding it with one’s lips induces a pout. In SMS Study 1, participants rated the cartoons as funnier in the teeth condition (5.14) than in the lips condition (4.32) on a 10-point Likert scale ranging from 0 (not at all funny) to 9 (very funny). These results were taken to support the facial feedback hypothesis.
SMS has been cited 1,370 times (according to Google Scholar as of May 26, 2016) and is commonly discussed in introductory psychology courses and textbooks. More-over, the facial feedback hypothesis is supported by a number of related studies (e.g., Kraft & Pressman, 2012; Larsen, Kasimatis, & Frey, 1992; Soussignan, 2002). How-ever, this seminal experiment has not been replicated directly using the same design and the same dependent variable. The enduring impact of SMS and the lack of direct replications together motivated this Registered Replication Report (RRR), in which 17 laboratories each conducted a direct replication study of Study 1 from SMS using a vetted protocol. By combining the results of these direct replications meta-analytically, we can provide a more precise estimate of the size of this important effect.
The RRR format provides an unbiased, objective, and transparent way to measure the reliability and size of an effect. Preregistration ensures the validity of statistical hypothesis tests (e.g., Chambers, 2013; De Groot, 1956/2014; Goldacre, 2009; Peirce, 1883; Wagenmakers, Wetzels, Borsboom, van der Maas, & Kievit, 2012). By including the results of all studies regardless of their out-come, the RRR format eliminates publication bias. By com-piling the results of many labs, the RRR process allows a measure of the reliability and consistency of the effect across different contexts and cultures. Moreover, the com-bined results from many labs provide a large sample that allows for an unprecedented degree of precision in esti-mating the effect. Finally, by seeking expert evaluation of the protocol prior to data collection, the RRR approach ensures that the studies are conducted accurately. During the protocol development phase, the editor solicited the input of the original author; Fritz Strack provided the origi-nal materials as well as valuable feedback and constructive suggestions during the early stages of protocol develop-ment by the lead lab. Although he declined to review the final protocol, he graciously suggested several expert reviewers who could review it in his place, and Ursula Hess provided meticulous and insightful feedback through-out the protocol vetting process.
The procedure followed in this RRR was specific, unbiased, and transparent. We created a detailed replica-tion protocol—complete with instructional videos and experimental materials—describing exactly how partici-pating laboratories should conduct the experiment. We designed a detailed analysis protocol and R scripts before
Fig. 1. Illustration of the two ways in which participants were instructed to position the pen for rating the funniness of cartoons. Left panel: the pen is held with the teeth, inducing a facial expression similar to smiling. Right panel: the pen is held with the lips, inducing a facial expression similar to pouting. Figure available at http://tinyurl.com/zm7p9l7 under CC license https://creativecommons.org/licenses/by/2.0/.
by Jennifer Talarico on December 4, 2016pps.sagepub.comDownloaded from

RRR Facial Feedback Hypothesis 919
viewing the data. Finally, the Introduction and Method sections of this article were written prior to analyzing the data. All of the materials, the protocol, and the analysis scripts are publicly available on the Open Science Frame-work (OSF).
The experiment itself deviated from the original SMS study in four notable ways. First, we selected and normed a new set of cartoons to ensure that those used in the study would be moderately funny, thereby avoiding ceiling or floor effects. Twenty-one cartoons from Gary Larson’s The Far Side were rated by 120 psychology students at the Uni-versity of Amsterdam on a scale from 0 (not at all funny) to 9 (very funny). We selected four cartoons that were judged to be “moderately funny.” Ratings for the complete set of cartoons are available on the OSF. Note that the original SMS Study 1 also featured cartoons from The Far Side.
Second, we minimized the interaction between experi-menter and participants in order to eliminate experimenter-expectancy effects (Barber, 1976). Instructions were provided by a video displayed on the computer monitor.
Third, a video camera recorded participants while they performed the task, and these recordings were reviewed to ensure that participants held the pen as instructed.
Fourth, for the ratings, we used the phrasing from SMS Study 2 rather than Study 1. In SMS Study 1, participants rated each cartoon on a 10-point scale ranging from 0 (not at all funny) to 9 (very funny). However, in SMS Study 2, the predicted effect held only for the emotional component of the humor response. We decided to maxi-mize the probability of observing a facial feedback effect by targeting this emotional component. Consequently, we used the SMS Study 2 phrasing: “What feeling was elicited in you by looking at the cartoons?” As in SMS Study 2, the 10-point response scale ranged from 0 (I felt not at all amused) to 9 (I felt very much amused).
Finally, we omitted the neutral “nondominant hand con-dition” from the design (as was done for Study 2 in SMS) in order to focus all statistical power on the comparison between the smile condition and the pout condition. Omit-ting this between-participants condition does not affect the primary prediction of the facial feedback hypothesis: Peo-ple in the smile condition should be more amused by the cartoons than people in the pout condition.
Method
The OSF page for this project contains all of the materi-als, protocols, and specifications for the study. We sum-marize the implementation below.
Design
The design has two between-subject conditions. In one condition, participants were instructed to hold the pen with
their teeth; in the other, participants were instructed to hold the pen with their lips (see Fig. 1 and https://osf.io/pkd65/). Participants were tested individually or in up to four sepa-rate cubicles (from which they could not see or hear each other). Participants were assigned to conditions in alternat-ing order. Given the prominence of the SMS study, we were careful to recruit participants who were relatively unlikely to be familiar with the facial feedback hypothesis (as outlined below, participants who guessed the goal of the study were excluded from the analysis). Participants were compensated with course credit or a small monetary reward.
Sample size
Participating laboratories committed to testing a mini-mum of 50 participants in each condition (after replacing participants who met the exclusion criteria outlined below). Each laboratory specified their recruiting meth-ods, target sample sizes, and stopping rules in advance of data collection on their OSF project page (links for each lab’s OSF page are provided in the appendix).
Materials
Participating laboratories were required to have access to (a) an individual testing station such as a cubicle; (b) a com-puter for presenting instruction videos; (c) printed informa-tion brochures describing the cover story; (d) a task booklet used to conduct the experiment (see below); (e) practice task sheets; (f) suitable pens such as the Stabilo Pen68 or the Sharpie; (g) boxes of paper tissues for the participant to remove excess saliva; (h) alcohol swabs for participants to clean the pen before use, should they wish to do so; and (i) a video camera recording system to verify that participants held the pen correctly throughout the study. Most written materials were made available on the OSF site in both Eng-lish and Dutch. Laboratories that conducted the study in languages other than English or Dutch first translated the materials to their language and then had a separate bilin-gual speaker independently translate them back to the orig-inal language to ensure the accuracy of the translations. Those labs posted the translated and back-translated materi-als on their OSF pages (listed in the Appendix). The three panels from Figure 2 show the setup used in the laboratory at the University of Amsterdam.
Procedure
A video of the complete 24-step procedure is available on the OSF site (https://osf.io/spf95/). Participants were given a new pen and shown to their cubicle. After read-ing the information brochure and completing the informed consent procedure, participants received task instructions presented as a video on a computer screen
by Jennifer Talarico on December 4, 2016pps.sagepub.comDownloaded from

920 Wagenmakers et al.
(without the experimenter present). Next, participants were given the task booklet. Before beginning the main tasks in the booklet, participants practiced the correct way to hold the pen, under direct supervision of the experimenter. As soon as participants successfully com-pleted the practice task (i.e., drawing a straight line between two points), the experimenter started the cam-era recording and left the cubicle.
Participants worked through the tasks in the task booklet while holding the pen in their mouth. The first task was to draw lines between a series of successive numbers and the second task was to underline vowels. The third and crucial task was to rate how amused they were by four cartoons. For each cartoon, participants answered the question “What feeling was elicited in you by looking at the cartoon?” by using a 10-point Likert scale ranging from 0 (I felt not at all amused) to 9 (I felt very much amused).
After these tasks, participants removed the pen from their mouths and completed an exit questionnaire that asked three questions: (a) “How successful were you in holding the pen in the correct position during the
entire experimental session?” (the answer was indi-cated on a 10-point Likert scale, as in SMS Study 2); (b) “Did you understand the cartoons?” (yes/no); and (c) “What do you think the purpose of this experiment is?” (open-ended).
Finally, participants provided their age, gender (male/female), status as a student (yes/no), and occupation or field of study.
Exclusion criteria
Exclusion criteria were deliberately strict. Data were excluded from participants whose average cartoon rating exceeded 2.5 standard deviations from the group mean in their condition. Data were excluded if, based on the exit questionnaire, participants correctly guessed the goal of the study (i.e., the position of the pen influences the funniness ratings for the cartoons). Data were also excluded if a participant answered “No” to the question “Did you understand the cartoons?”. Finally, data were excluded from participants who held the pen incorrectly for two or more of the cartoons (based on the video
Fig. 2. Setup of the facial feedback replication experiment at the University of Amsterdam. Left panel: state of the individual booth at the start of the experiment. Right top panel: Instructions are displayed on the computer monitor; alcohol swabs and tissues are provided. Right bottom panel: setup during the critical experimental stage, where the task booklet presents cartoons to be rated for funniness. Figure avail-able at http://tinyurl.com/h9e86pu under CC license https://creativecommons.org/licenses/by/2.0/.
by Jennifer Talarico on December 4, 2016pps.sagepub.comDownloaded from
RRR Facial Feedback Hypothesis 921
recordings). If participants held the pen incorrectly for just one cartoon, data from that cartoon rating were excluded from analyses.
Preregistered analysis plan
We preregistered our intended analyses and tested them on simulated studies (based on the original SMS results) before inspecting the data. The detailed preregistered analysis plan and associated R code are available on the OSF project webpage at https://osf.io/h2f98/. The pri-mary analysis focuses on the meta-analytic estimate of the raw difference between conditions across labs. For completeness, the materials on the OSF page include the same analysis for standardized effect sizes.
In addition to this primary analysis, we report two Bayes factor analyses for each study. The first compares the pre-dictive adequacy of the null hypothesis H0 and an alterna-tive that the effect size is positive (i.e., the cartoons are expected to be rated as more amusing in the smile condi-tion than in the pout condition). The specified alternative hypothesis assumes that the true effect is most likely to be small, although higher effect sizes are not excluded from consideration (defined statistically, under H1 the prior distri-bution on effect size is a folded Cauchy with a default scale parameter of r = 0.707; e.g., Ly, Verhagen, & Wagenmakers, in press; Morey & Rouder, 2015).
The second Bayes factor analysis compares the belief of a skeptic (i.e., the null hypothesis H0) to the idealized belief of a rational proponent (i.e., the proponent’s
hypothesis Hr; Verhagen & Wagenmakers, 2014). The rational proponent assumes that the null hypothesis is false and bases all knowledge on the posterior distribu-tion obtained from the original SMS experiment. The resulting Bayes factor contrasts the predictive adequacy of H0 to an alternative hypothesis with a prior distribu-tion on effect size that equals the posterior distribution from the SMS experiment.
Both Bayes factors provide a graded scale that quanti-fies the support that the data provide for and against the absence of an effect. The difference is that the first analy-sis specifies the alternative hypothesis by default, and the second analysis specifies it by using the information from the original SMS experiment.
Results: Confirmatory Analyses
Data analysis was carried out in accordance with the pre-registered analysis plan outlined above and available at https://osf.io/h2f98/.
Descriptives
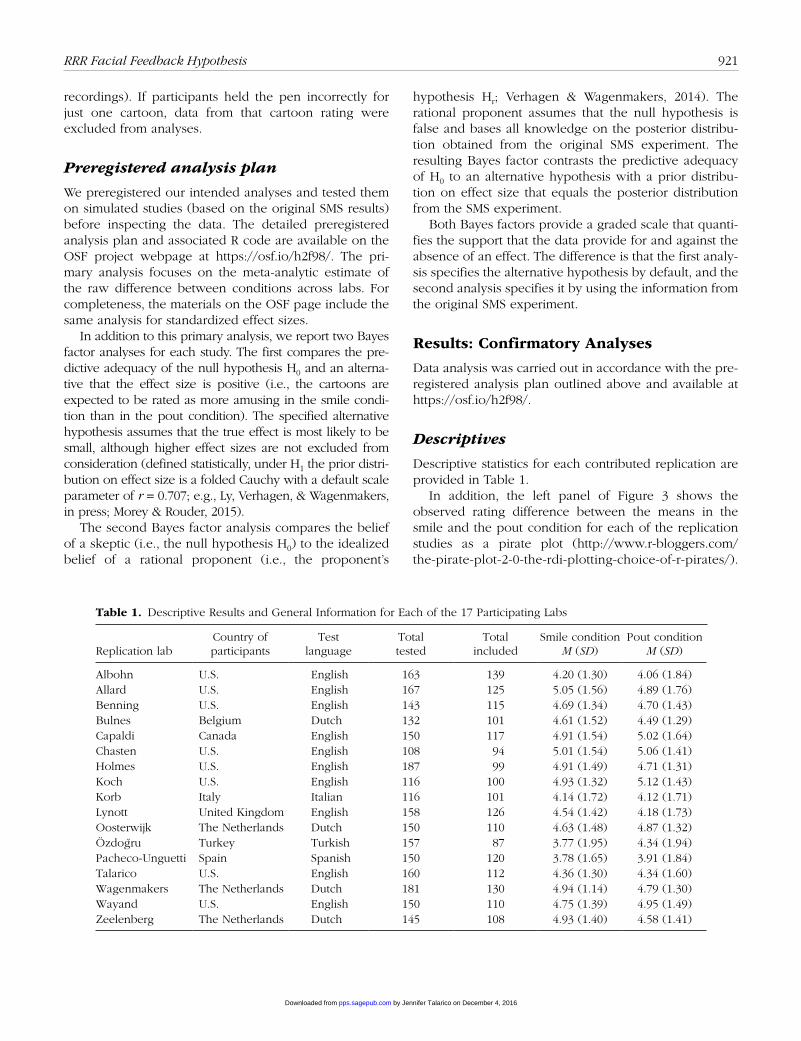
Descriptive statistics for each contributed replication are provided in Table 1.
In addition, the left panel of Figure 3 shows the observed rating difference between the means in the smile and the pout condition for each of the replication studies as a pirate plot (http://www.r-bloggers.com/ the-pirate-plot-2-0-the-rdi-plotting-choice-of-r-pirates/).
Table 1. Descriptive Results and General Information for Each of the 17 Participating Labs
Replication labCountry of participants
Test language
Total tested
Total included
Smile condition M (SD)
Pout condition M (SD)
Albohn U.S. English 163 139 4.20 (1.30) 4.06 (1.84)Allard U.S. English 167 125 5.05 (1.56) 4.89 (1.76)Benning U.S. English 143 115 4.69 (1.34) 4.70 (1.43)Bulnes Belgium Dutch 132 101 4.61 (1.52) 4.49 (1.29)Capaldi Canada English 150 117 4.91 (1.54) 5.02 (1.64)Chasten U.S. English 108 94 5.01 (1.54) 5.06 (1.41)Holmes U.S. English 187 99 4.91 (1.49) 4.71 (1.31)Koch U.S. English 116 100 4.93 (1.32) 5.12 (1.43)Korb Italy Italian 116 101 4.14 (1.72) 4.12 (1.71)Lynott United Kingdom English 158 126 4.54 (1.42) 4.18 (1.73)Oosterwijk The Netherlands Dutch 150 110 4.63 (1.48) 4.87 (1.32)Özdog ru Turkey Turkish 157 87 3.77 (1.95) 4.34 (1.94)Pacheco-Unguetti Spain Spanish 150 120 3.78 (1.65) 3.91 (1.84)Talarico U.S. English 160 112 4.36 (1.30) 4.34 (1.60)Wagenmakers The Netherlands Dutch 181 130 4.94 (1.14) 4.79 (1.30)Wayand U.S. English 150 110 4.75 (1.39) 4.95 (1.49)Zeelenberg The Netherlands Dutch 145 108 4.93 (1.40) 4.58 (1.41)
by Jennifer Talarico on December 4, 2016pps.sagepub.comDownloaded from

922 Wagenmakers et al.
The right panel of Figure 3 shows a scatterplot of the mean ratings in the pout condition versus those in the smile condition. The main diagonal indicates exact equiv-alence between the two conditions, and points above the diagonal indicate support in favor of the facial feedback hypothesis. As can be seen from Figure 3, 9 out of 17 outcomes (53%) were consistent with the facial feedback hypothesis. In the original SMS experiments, the mean Likert scores were higher in the smile condition than they were in the pout condition: The difference was 0.82 in SMS Study 1 and 1.03 in SMS Study 2. In this replication study, 0 out of 17 outcomes (0%) showed a difference in mean Likert scores (smile minus pout) that was at least as high as 0.82.
Primary result: Random-effects meta-analysis
Our primary analysis of interest takes the form of a forest plot of the raw effect sizes across labs and a meta- analytic effect size estimate. The forest plot is shown in Figure 4. For ease of comparison, Figure 4 also displays the results from SMS Study 1 (effect size of 0.82), but the original result does not contribute to the meta-analytic estimate for the RRR.
Figure 4 shows that the point-estimate for the meta-analytic effect, 0.03, was smaller than that of SMS Study 1. The 95% meta-analytic confidence interval ranges from −0.11 to 0.16, overlapping with zero.
In 17 out of 17 replication attempts, the 95% confi-dence interval was narrower than the one estimated for Study 1 from SMS. In 2 out of 17 replication attempts, the 95% confidence interval overlapped the mean effect size from SMS Study 1 (0.82); of the 15 out of 17 intervals that did not overlap the original effect size, 15 were smaller than the one reported in SMS Study 1. Finally, 0 out of 17 intervals were qualitatively consistent with the facial feedback hypothesis in that they were strictly positive.
Secondary result: Bayesian analyses for individual studies
In addition to the classical random-effects meta-analysis, we now report two Bayesian analyses that are applied to each replication attempt in isolation. References and statistical details are available in the OSF preregistered analysis plan. The results of both analyses are summarized in Table 2.
Analysis 1: One-sided default Bayes factor hypothesis tests
The one-sided default Bayes factor hypothesis test quanti-fies the relative predictive adequacy of two competing hypotheses: the null hypothesis H0, which states that the effect is absent, versus an order-constrained alternative hypothesis H1, which assigns effect size a positive-only prior distribution (i.e., a Cauchy distribution folded on zero with scale r = 0.707). The second column presents the results.
Fig. 3. Descriptive results. In the left panel, a pirate plot shows the rating difference between the smile and the pout condition for each separate study; the facial feedback hypothesis predicts the differences to be higher than zero. In the right panel, the rating for the pout condition is plotted against that of the smile condition; the facial feedback hypothesis predicts the values to lie above the main diagonal. Note that in Study 1 by SMS, the mean difference was 0.82. Figure available at http://tinyurl.com/zbh3z9v under CC license https://creativecommons.org/licenses/by/2.0/.
by Jennifer Talarico on December 4, 2016pps.sagepub.comDownloaded from

RRR Facial Feedback Hypothesis 923
Out of a total of 17 Bayes factors, 0 provide support against the null hypothesis, and 0 do this in a nonanecdotal manner (i.e., BF10 > 3). In contrast, 17 Bayes factors provide evi-dence in favor of the null hypothesis, and 13 do this in a nonanecdotal manner (i.e., BF10 < 1/3). Note that these Bayes factors may not be multiplied across studies, as they are not independent (i.e., they all provide information about a similar underlying effect size).
Analysis 2: Replication Bayes factor tests
The replication Bayes factor hypothesis test quantifies the relative predictive adequacy of two competing hypothe-ses: the skeptics’ null hypothesis H0, which states that the effect is absent, versus the proponents’ alternative hypothesis Hr, which assigns effect size a prior distribu-tion that equals the posterior distribution obtained from the original SMS Study 1.
The third column presents the results. Out of a total of 17 replication Bayes factors, 1 provides support against the skeptics’ null hypothesis, and 0 do this in a nonanec-dotal manner (i.e., BFr0 > 3). In contrast, 16 replication Bayes factors provide evidence in favor of the null
hypothesis, and 12 do this in a nonanecdotal manner (i.e., BFr0 < 1/3). As before, these Bayes factors are not independent and hence may not be multiplied.
Results: Exploratory Analyses
What people find amusing could differ across languages and cultures. If so, some studies might show a reduced dif-ference between the smile and pout conditions due to floor or ceiling effects in the ratings provided by participants. To explore the possible contribution of such effects, Figure 5 shows—separately for each study—the average rating against the raw effect size (i.e., the average difference between the ratings in the two conditions). If the obtained results were sensitive to floor and ceiling effects, Figure 5 should show the largest effect size for intermediate ratings, with reduced effects for labs with low (floor effect) or high (ceiling effect) average ratings.
As can be seen from Figure 5, the average ratings are relatively homogeneous across the 17 labs. No effects of floor or ceiling effects are apparent, and hence we decided to forego additional exploratory meta-analyses in which “average rating” is added as a covariate (i.e., meta-regression; Knapp & Hartung, 2003; Thompson &
Fig. 4. Forest plot of a random-effects meta-analysis of 17 replications of SMS. The plot is based on raw effect sizes (i.e., mean rating differences between the smile and the pout condition). The result of Study 1 by SMS is included on top. The confidence interval for the SMS study was obtained from the summary statistics under the assumption of homogeneous variance and homogeneous sample size across the experimental conditions. A forest plot based on standardized effect sizes is available on the project OSF page. Figure available at http://tinyurl.com/jluyjwh under CC license https://creativecommons.org/licenses/by/2.0/.
by Jennifer Talarico on December 4, 2016pps.sagepub.comDownloaded from

924 Wagenmakers et al.
Higgins, 2002). Results from additional exploratory analy-ses, including an examination of the effect for individual cartoons, are available on the OSF site at https://osf.io/h2f98/wiki/home/.
General Discussion
This RRR featured data from 17 laboratories with a com-bined total of 1,894 participants included in the analyses. The data were obtained according to a vetted design and analyzed according to a preregistered analysis plan. In order to ensure objective reporting of the results, the Introduction, Method, and Results sections (specifying wording for different possible outcomes) of this article were written without knowledge of the actual data. For that pre-data manuscript, we used simulated data to cre-ate mock-ups of the figures. The pre-data manuscript was reviewed by the contributing laboratories as well as the original reviewer of the protocol. We conducted the anal-yses of the actual data after finalizing this data-blind ver-sion of the analysis scripts and manuscript content.
Overall, the results were inconsistent with the original result reported in SMS. Whereas SMS reported a difference between conditions of 0.82 units on a 10-point rating scale,
the random effects meta-analysis of the RRR results esti-mated that difference to be 0.03 with a 95% confidence interval ranging from −0.11 to 0.16. All of the individual laboratories reported confidence intervals that overlapped with zero. Furthermore, out of 34 preregistered Bayes fac-tor analyses (i.e., two per laboratory), all but one provided evidence in favor of the null hypothesis.
This RRR did not replicate the SMS result and failed to do so in a statistically compelling fashion. Nevertheless, it should be stressed that the RRR results do not invali-date the more general facial feedback hypothesis. It is possible that the original SMS paradigm that we employed does not provide a strong test of the facial feedback hypothesis and that other procedures would provide more compelling evidence. It is also possible that some uncontrolled differences between the original study and the RRR studies explain the discrepancy in results, despite our efforts to ensure that the protocol accurately and pre-cisely tested the same hypothesis as the original study. Although it is always possible that some unexplained fac-tor accounts for the difference from the original study, given the compelling evidence from this RRR and the lack of heterogeneity across the 17 included studies, researchers should provide empirical evidence (ideally from a preregistered procedure like that used in the RRR) for the ability of any proposed moderator to change the observed effect before assuming that the difference is due to moderation. We also encourage researchers studying the facial feedback hypothesis using other tasks to adopt the same sorts of strict control used in this protocol: pretesting the stimulus materials, excluding
Table 2. Bayes Factors for Each of the 17 Replication Studies
Replication lab Default BF10 Replication BFr0
Albohn 0.281 0.297Allard 0.300 0.329Benning 0.189 0.190Bulnes 0.300 0.343Capaldi 0.150 0.149Chasten 0.191 0.199Holmes 0.401 0.499Koch 0.134 0.139Korb 0.219 0.232Lynott 0.713 0.993Oosterwijk 0.115 0.121Özdog ru 0.106 0.124Pacheco-Unguetti 0.146 0.144Talarico 0.215 0.222Wagenmakers 0.356 0.406Wayand 0.126 0.129Zeelenberg 0.773 1.136
Note: The second column shows the one-sided default Bayes factors (BF10), and the third column shows the replication Bayes factors (BFr0). Numbers lower than 1 indicate support in favor of the null hypothesis; for instance, a Bayes factor of 0.20 indicates that the data are 1/0.20 = 5 times more likely under the null hypothesis than under the alternative hypothesis. Numbers higher than 1 indicate support in favor of the alternative hypothesis; for instance, a Bayes factor of 9 indicates that the data are 9 times more likely under the alternative hypothesis than under the null hypothesis.
Fig. 5. Relation between average rating and raw effect size (i.e., the average difference between the ratings in the two conditions) across the 17 replications of SMS. If the results were sensitive to floor and ceil-ing effects, the largest effect size should be observed for average ratings in the intermediate range. Figure available at http://tinyurl.com/zyz ksg6 under CC license https://creativecommons.org/licenses/by/2.0/.
by Jennifer Talarico on December 4, 2016pps.sagepub.comDownloaded from

RRR Facial Feedback Hypothesis 925
interaction with the experimenter as much as possible, specifying and adopting strict exclusion criteria, and pre-registering an analysis plan.
Appendix A: Individual Lab Details
Lead LabE.-J. Wagenmakers, University of AmsterdamTitia Beek, University of AmsterdamLaura Dijkhoff, University of AmsterdamQuentin F. Gronau, University of Amsterdamhttps://osf.io/pkd65/A total of 130 participants were recruited at the University of Amsterdam (smile/teeth n = 65; pout/lips n = 65). All partici-pants received a €10 monetary reward. Psychology students were excluded from participation. We followed the official pro-tocol in all respects.
Contributing LabsDaniel N. Albohn, The Pennsylvania State UniversityTroy G. Steiner, The Pennsylvania State UniversityReginald B. Adams, Jr., The Pennsylvania State UniversityUrsula Hess, Humboldt-UniversitätJose A. Soto, The Pennsylvania State Universityhttps://osf.io/2sz38/A total of 139 students (smile/teeth n = 67; pout/lips n = 72) were recruited from the psychology subject pool at The Penn-sylvania State University. Participants were tested individually using the provided materials. Our study materials were pre-sented on a slightly raised desk so that a camera could record participants’ faces during the task, but we followed the official protocol in all other respects. Although our preregistered plan specified that we would collect physiological data from our participants, we were unable to collect this data due to time constraints. All other aspects of our preregistered plan were carried out as specified.
Eric S. Allard, Cleveland State UniversityEmily E. Zetzer, Cleveland State Universityhttps://osf.io/sutwj/A total of 167 students (smile/teeth n = 84; pout/lips n = 83) were recruited from the psychology subject pool at Cleveland State University. Participants were tested individually using the provided materials. In all respects, we followed the official pro-tocol. All participants were compensated with course credit.
Stephen D. Benning, University of Nevada, Las VegasChristin N. Nance, University of Nevada, Las VegasNicholas S. Carfagno, University of Nevada, Las Vegashttps://osf.io/6wh4a/A total of 143 students (smile/teeth n = 72; pout/lips n = 71) were recruited from the psychology subject pool at the Univer-sity of Nevada, Las Vegas. Participants were tested using the
provided materials, and minimal changes were made to the Informed Consent, as per the request of our local Institutional Review Board, to reduce the emphasis on the cover story. Any changes made to the Informed Consent are highlighted on our Implementation OSF page. Because we ran two participants on separate computers facing opposite walls of the lab (located 4.88 m across from each other), we required them to wear headphones to ensure that they would neither see the other participant's mouth pose nor overhear instructions given to the participant in the opposite condition. Other than this addition, the original protocol was followed in all other respects. We compensated participants with .5 Sona credit per half-hour. With our additional surveys (given only after the original proto-col was completed in its entirety), most students completed the study in under an hour.
Luis Carlo Bulnes, Vrije Universiteit BrusselMorgane Senden, Université Libre de BruxellesMarie Vandekerckhove, Vrije Universiteit BrusselOlivier Klein, Université Libre de BruxellesAxel Cleeremans, Université Libre de Bruxelleshttps://osf.io/gaj8c/A total of 132 students (smile/teeth n = 66; pout/lips n = 66) were recruited from the psychology subject pool at the Vrije Universiteit Brussel. Participants were tested individually using the provided materials in Dutch. As in our preregistered plan, 100 participants were initially scheduled, and 20 students were added after checking for exclusions. However, as we were still unable to meet our target sample size of a minimum of 50 par-ticipants per cell with that method, 12 extra participants took part in exchange for €5.
Colin A. Capaldi, Carleton UniversityKarin Sobocko, Carleton UniversityEve-Marie Blouin-Hudon, Carleton UniversityZack M. van Allen, Carleton Universityhttps://osf.io/5g2p4/A total of 150 students (smile/teeth n = 75; pout/lips n = 75) were recruited from the psychology subject pool at Carleton University. Participants were tested individually using the pro-vided materials. There were a few minor differences in how we ran the study from the main protocol. We had to modify the informed consent and debriefing forms to obtain approval from the research ethics board at our university. Moreover, the information brochure and informed consent form were merged into one document following recommendations from our ethics board. Our ethics board also required us to ask for participants’ consent to use their data after they were debriefed. Only 1 participant did not give us their consent to use their data. We also made two changes to the exit interview form at the end of the booklet: The 20 dollar/euro voucher line was deleted and a question asking participants whether they had previ-ously learned about the facial feedback hypothesis was added.
by Jennifer Talarico on December 4, 2016pps.sagepub.comDownloaded from

926 Wagenmakers et al.
All of these deviations from the main protocol were approved by the editor and preregistered before data was collected. Our revised materials can be viewed at https://osf.io/sar8j/. Applying the standardized exclusion rules reduced our sample size to 117 participants (smile/teeth n = 59; pout/lips n = 58). As part of our preregistration, our laboratory included an additional exclusion rule where participants would be excluded if they indicated that they had previously learned about the facial feedback hypoth-esis. Applying this additional exclusion rule reduced our sample size further to 106 participants, with an equal number of par-ticipants remaining in each condition. The overall meta-analysis used the data from the 117 participant sample.
Kelsie T. Chasten, Dominican UniversityRobert J. Calin-Jageman, Dominican UniversityTracy L. Caldwell, Dominican Universityhttps://osf.io/g4vw7/A total of 108 students (smile/teeth n = 54; pout/lips n = 54) were recruited from the psychology subject pool at Dominican University. After exclusions, a total of 94 students were included in data analysis (smile/teeth n = 47; pout/lips n = 47). Partici-pants were tested individually using the provided materials. We followed the official protocol. All participants were compen-sated with $5 in order to encourage students to participate in the study and to reach the target sample size.
Kevin J. Holmes, Colorado CollegeTomi-Ann Roberts, Colorado CollegeJulia D. Liao, Colorado CollegeJacob L. H. Jones, Colorado CollegeNoah B. Shea-Shumsky, Colorado Collegehttps://osf.io/6vmyn/A total of 187 undergraduate students (smile/teeth n = 93; pout/lips n = 94) were recruited at Colorado College, none of whom had taken a psychology class at the college level. Par-ticipants were tested individually using the provided materials and received $5 in compensation. We used the English versions of the study materials. In line with the requirements of our IRB, we made slight modifications to the Information Brochure to provide participants with more information regarding the risks, benefits, and voluntary nature of participation, as well as the confidentiality of their data (modified version: https://osf.io/mvd6n/?view_only=3e679a36686840338361dd54da30441d). We also added several items to the exit questionnaire to assess pos-sible moderators and confounds (modified version: https://osf .io/ks5cr/?view_only=3e679a36686840338361dd54da30441d). Our participants used the Pentel Sign Pen, an odorless fiber-tipped pen very similar to the Stabilo 68, to perform the tasks. In all other respects, we followed the official protocol. A total of 88 participants were excluded: 57 due to a video recording failure that left us unable to verify that they had held the pen correctly while completing the tasks, and 31 due to one or more of the standardized exclusion criteria. The final sample included
in the meta-analysis consisted of 99 participants (smile/teeth n = 49; pout/lips n = 50).
Christopher Koch, George Fox Universityhttps://osf.io/vzcwu/A total of 116 students (smile/teeth n = 56; pout/lips n = 60) were recruited from the psychology subject pool at George Fox University. Participants were tested individually according to the official protocol using the provided materials. Course credit was awarded for participation.
Sebastian Korb, International School for Advanced Studies (SISSA)Francesco Foroni, International School for Advanced Studies (SISSA)Raffaella I. Rumiati, International School for Advanced Studies (SISSA)https://osf.io/tmqbk/A total of 116 students (smile/teeth n = 62; pout/lips n = 54) were recruited from the student subject pool at the International School for Advanced Studies (SISSA) in Trieste, Italy. Only four participants were psychology students. Participants were tested individually using the provided materials. Our study materials were translated into Italian, but in all other respects, we followed the official protocol. Participants participated in exchange for €5.
Dermot Lynott, Lancaster UniversityLouise Connell, Lancaster UniversitySophie Lund, Lancaster UniversityBethany Pearson, Lancaster UniversityChristina Powis, Lancaster UniversitySarah Riding, Lancaster UniversityBethany Wainwright, Lancaster Universityhttps://osf.io/56d2z/A total of 158 students (smile/teeth n = 79; pout/lips n = 79) were recruited from Lancaster University and environs. Par-ticipants were tested individually using the provided materi-als. In all respects, we followed the official protocol, with the exception that participants also completed supplementary tasks following the completion of the replication component of the study. Although our preregistered plan specified that we would recruit a minimum of 200 participants, we were unable to reach this target due to the closure of the university in December 2015 because of flooding and loss of electricity in the region.
Suzanne Oosterwijk, University of AmsterdamAgneta H. Fischer, University of AmsterdamPeter Lewinski, Kozminski Universityhttps://osf.io/d9xeuA total of 150 students (smile/teeth n = 68; pout/lips n = 82) were recruited from the communication science and psychol-ogy subject pool at the University of Amsterdam. Participants were tested individually using the provided materials. Our study
by Jennifer Talarico on December 4, 2016pps.sagepub.comDownloaded from

RRR Facial Feedback Hypothesis 927
materials were translated into Dutch, but in all other respects, we followed the official protocol. Although our preregistered plan specified that participants would come only from com-munication science, we were unable to recruit enough people to meet our target sample size with that method, so we also allowed students from any program other than psychology to sign up for the study. Participants participated in exchange for €5 or a course credit.
Asil Ali Özdog ru, Üsküdar Universityhttps://osf.io/iuka6/A total of 157 students (smile/teeth n = 76; pout/lips n = 81) were recruited from the undergraduate programs in psychology and sociology at Üsküdar University. Participants were tested individually using the provided materials. Our study materials were translated into Turkish then back-translated into English for accuracy. Twenty-one of the translated cartoons were rated by 122 psychology students who did not participate in the main study. Based on the ratings, four cartoons were identified as moderately funny, of which only one cartoon differed from the four cartoons identified by the lead lab. We also administered a self-report sense of humor scale in the last step of the pro-cedure. In all other respects, we followed the official protocol. Participants were compensated with course credit.
Antonia Pilar Pacheco-Unguetti, Universidad de GranadaAlberto Acosta, Universidad de GranadaJuan Lupiáñez, Universidad de Granadahttps://osf.io/ch3zd/A total of 120 students (smile/teeth n = 61; pout/lips n = 59) were recruited from the psychology subject pool at University of Granada. Participants were tested individually using the provided materials. Our study materials were translated into Spanish, but we followed the official protocol in all other respects. Our pre-registered plan specified that participants would be compensated either with course credits or money for their participation. Only three participants participated in exchange of €5. All the material was translated from English into Spanish by one of the experi-menters, and the three experimenters checked and edited each document for accuracy. All materials were then back-translated from Spanish into English by a native bilingual speaker, and we found no discrepancy in the meanings of the original version and the English back-translation. After completing all of the required tasks in experimental session, participants moved to a different cubicle, and another experimenter administered two additional questionnaires: the State-Trait Cheerfulness Inventory (STCI-T; Carretero-Dios, Benítez, Delgado Rico, Ruch & López-Benítez, 2014) and the GELOPH <15> questionnaire of gelotophobia (Carretero-Dios, Proyer, Ruch & Rubio, 2010).
Jennifer M. Talarico, Lafayette CollegeJennifer M. DeCicco, Holy Family Universityhttps://osf.io/6yuxk/
A total of 160 students (smile/teeth n = 69; pout/lips n = 91) were recruited from the psychology subject pool at Lafayette College (M age = 19.49 years old (SD = 1.12)). They were com-pensated with extra credit in psychology courses. To meet the requirements of our local Institutional Review Board, minor changes to both consent and debriefing forms were required. Final versions of each can be found at our OSF site. Our pro-cedures followed the approved protocol as described and did not deviate from our preregistered plan. Of the 160 participants who completed the task, 48 were excluded (see the Lab Log for more information regarding exclusion criteria; https://osf.io/kdv36/). Of the remaining 112 participants, 57 were included in the smile condition and 55 in the pout condition.
Joseph F. Wayand, Walsh Universityhttps://osf.io/98hr3/A total of 154 students (smile/teeth n = 77; pout/lips n = 77) were recruited from the psychology participant pool at Walsh University in North Canton, OH. We followed our stopping rule (run 120 participants, check for 50 in each group after exclusions, then run 10 additional participants and check again, repeat as necessary) but ran 4 extra participants due to a miscommunication between research assistants. In all other respects, we followed the official protocol.
Rene Zeelenberg, Erasmus UniversityRolf A. Zwaan, Erasmus UniversityKatinka Dijkstra, Erasmus Universityhttps://osf.io/bw8fvA total of 105 students (smile/teeth n = 52; pout/lips n = 53) were recruited from the psychology subject pool at Erasmus University Rotterdam. Twenty-nine students (smile/teeth n = 18; pout/lips n = 11) were excluded, leaving 76 students (smile/teeth n = 34; pout/lips n = 42) in the sample. Participants were tested indi-vidually using the provided materials. Our study materials were based on the available materials in Dutch, and we followed the official protocol in all respects. Although our preregistered plan specified that participants would be compensated with course credit, we were unable to recruit enough people to meet our target sample size with that method. To meet this target, 40 par-ticipants (smile/teeth n = 21; pout/lips n = 19) participated in exchange for €3. Of these students, 8 (smile/teeth n = 5; pout/lips n = 3) were excluded, leaving 32 students (smile/teeth n = 16; pout/lips n = 16). Thus, the final sample consisted of 108 participants (smile/teeth n = 50; pout/lips n = 58).
Acknowledgments
The second and third author contributed equally and are listed in alphabetical order. We thank Ravi Selker for piloting the cartoons, Eva Specker and Gusta Marcus for acting in the instructional videos, and Gusta Marcus (again) for giving per-mission to use her image in Figure 1. We are also grateful to Ursula Hess for her extensive guidance during the review and
by Jennifer Talarico on December 4, 2016pps.sagepub.comDownloaded from

928 Wagenmakers et al.
vetting process and to Fritz Strack for providing materials. We thank Courtney Soderberg and the Center for Open Science for reviewing the R code and the Arnold Foundation and APS for providing funding support to participating laboratories. All of the participating researchers had the opportunity to review and suggest changes to a draft of the manuscript and analysis plan before the data analyses were conducted.
Declaration of Conflicting Interests
The authors declared that they had no conflicts of interest with respect to their authorship or the publication of this article.
Funding
This work was supported by ERC Grant #283876 from the Euro-pean Research Council.
References
Barber, T. X. (1976). Pitfalls in human research: Ten pivotal points. New York, NY: Pergamon Press.
Carretero-Dios, H., Benítez, I., Delgado-Rico, E., Ruch, W., & López-Benítez, R. (2014). Temperamental basis of sense of humor: The Spanish long form of the trait version of the State-Trait-Cheerfulness-Inventory. Personality and Individual Differences, 68, 77–82.
Carretero-Dios, H., Proyer, R. T., Ruch, W., & Rubio, V. J. (2010). The Spanish version of the GELOPH <15>: Properties of a questionnaire for the assessment of the fear of being laughed at. International Journal of Clinical and Health Psychology, 10, 345–357.
Chambers, C. D. (2013). Registered reports: A new publishing initiative at Cortex. Cortex, 49, 609–610.
De Groot, A. D. (2014). The meaning of “significance” for dif-ferent types of research [translated and annotated by Eric-Jan Wagenmakers, Denny Borsboom, Josine Verhagen, Rogier Kievit, Marjan Bakker, Angelique Cramer, Dora Matzke, Don Mellenbergh, and Han L. J. van der Maas]. Acta Psychologica, 148, 188–194. doi:10.1016/ j.actpsy.2014.02.001 (Original work published 1956)
Goldacre, B. (2009). Bad science. London, England: Fourth Estate.
Knapp, G., & Hartung, J. (2003). Improved tests for a random effects meta-regression with a single covariate. Statistics in Medicine, 22, 2693–2710.
Kraft, T. L., & Pressman, S. D. (2012). Grin and bear it: The influence of manipulated facial expression on the stress response. Psychological Science, 23, 1372–1378.
Larsen, R. J., Kasimatis, M., & Frey, K. (1992). Facilitating the furrowed brow: An unobtrusive test of the facial feed-back hypothesis applied to unpleasant affect. Cognition & Emotion, 6, 321–338.
Ly, A., Verhagen, A. J., & Wagenmakers, E.-J. (2016). Harold Jeffreys’s default Bayes factor hypothesis tests: Explanation, extension, and application in psychology. Journal of Mathematical Psychology, 72, 19–32.
Morey, R. D., & Rouder, J. N. (2015). BayesFactor 0.9.11-1 (with contributions from Tahira Jamil). Comprehensive R Archive Network. Retrieved from http://cran.r-project.org/web/packages/BayesFactor/index.html
Peirce, C. S. (1883). A theory of probable inference. In C. S. Peirce (Ed.), Studies in logic (pp. 126–181). Boston, MA: Little & Brown.
Soussignan, R. (2002). Duchenne smile, emotional experience, and autonomic reactivity: A test of the facial feedback hypothesis. Emotion, 2, 52–74.
Strack, F., Martin, L. L., & Stepper, S. (1988). Inhibiting and facilitating conditions of the human smile: A nonobtrusive test of the facial feedback hypothesis. Journal of Personality and Social Psychology, 54, 768–777.
Thompson, S. G., & Higgins, J. P. T. (2002). How should meta-regression analyses be undertaken and interpreted? Statistics in Medicine, 21, 1559–1573.
Verhagen, A. J., & Wagenmakers, E.-J. (2014). Bayesian tests to quantify the result of a replication attempt. Journal of Experimental Psychology: General, 143, 1457–1475.
Wagenmakers, E.-J., Wetzels, R., Borsboom, D., van der Maas, H. L. J., & Kievit, R. A. (2012). An agenda for purely con-firmatory research. Perspectives on Psychological Science, 7, 627–633.
by Jennifer Talarico on December 4, 2016pps.sagepub.comDownloaded from