Embed Size (px)
Citation preview
Regularities in Data from FactorialExperiments
XIANG LI,1 NANDAN SUDARSANAM,2 AND DANIEL D. FREY1,2
Massachusetts Institute of Technology, 1Department of Mechanical Engineering; and 2Engineering SystemsDivision, Cambridge, Massachusetts 02139
This paper was submitted as an invited paper resulting from the “Understanding Complex Systems”conference held at the University of Illinois–Urbana Champaign, May 2005
Received May 3, 2005; revised March 4, 2006; accepted March 6, 2006
This article documents a meta-analysis of 113 data sets from published factorial experiments. The studyquantifies regularities observed among factor effects and multifactor interactions. Such regularities are knownto be critical to efficient planning and analysis of experiments and to robust design of engineering systems. Threepreviously observed properties are analyzed: effect sparsity, hierarchy, and heredity. A new regularity isintroduced and shown to be statistically significant. It is shown that a preponderance of active two-factorinteraction effects are synergistic, meaning that when main effects are used to increase the system response, theinteraction provides an additional increase and that when main effects are used to decrease the response, theinteractions generally counteract the main effects. © 2006 Wiley Periodicals, Inc. Complexity 11: 32– 45, 2006
Key Words: design of experiments; robust design; response surface methodology
1. INTRODUCTION
R esearchers in the sciences of complexity seek to dis-
cover regularities arising in natural, artificial, and so-
cial systems and to identify their underlying mecha-
nisms. The authors have carried out meta-analysis of 113data sets from published experiments from a wide range ofscience and engineering disciplines. The goal was to identifyand quantify regularities in the experimental data regardingthe size of factor effects and interactions among factors.These regularities appear to arise from the interplay of thephysical behavior of the systems and the knowledge of theexperimenters. Therefore our results should be interestingto a broad range of investigators in complex systems includ-ing engineers, statisticians, physicists, cognitive scientists,and social scientists.
Corresponding author: Daniel D. Frey, Department of Me-chanical Engineering and Engineering Systems Division,Massachusetts Institute of Technology, 77 Massachusetts Av-enue, Cambridge, MA 02139 (e-mail: [email protected])
32 C O M P L E X I T Y © 2006 Wiley Periodicals, Inc., Vol. 11, No. 5DOI 10.1002/cplx.20123

This article is organized as follows: Section 2 presents themotivation for the study and provides some necessary back-ground in the Design of Experiments; Section 3 describesthe research methodology; Section 4 gives an example of theanalysis using one of our data sets; Section 5 presents theresults of the meta-analysis; Section 6 presents an investi-gation of nonlinear transformation of the responses and itsinfluence on the regularities; and Section 7 presents con-clusions and suggestions for future research.
2. MOTIVATION
2.1. What is Design of Experiments and Why Is ItImportant?Experimentation is an important activity in design of sys-tems. Most every existing engineering system was shaped bya process of experimentation including preliminary investi-gation of phenomena, subsystem prototyping, and systemverification tests. Major, complex systems typically requirethousands of experiments [1]. Consequently, experimenta-tion is a significant driver of development cost and time tomarket. There is pressure to drive down the resource re-quirements of experimentation, especially in commerciallycompetitive industries.
The mathematical and scientific discipline of Design ofExperiments (DOE) seeks to provide a theoretical basis forexperimentation across many domains of inquiry. Com-monly articulated goals of DOE include: making scientificinvestigation more effective and reliable [2]; efficient pro-cess and product optimization [3]; and improvement ofsystem robustness to variable or uncertain ambient condi-tions, internal degradation, manufacturing, or customer useprofiles [4 – 6]. The use of DOE in engineering appears to berising as it is frequently disseminated through industry “SixSigma” programs, corporate training courses, and universityengineering curricula.
This article relies on several concepts and terms fromDOE. To make the discussion clear to a broad audience ofinvestigators in complex systems, the following definitionsare provided:
● Response: An output of the system to be measured in anexperiment.
● Factor: A variable that is controlled by the experimenterto determine its effect on the response.
● Active factor: A factor that experiments reveal to have asignificant effect on the system response.
● Level: The discrete values a factor may take in an exper-iment.
● Full factorial experiment: An experiment in which everypossible combination of factor levels is tested. In a systemwith k factors, each having two levels, the full factorialexperiment is denoted as the 2k design.
● Main effect: The individual effects of each factor in an
experiment [7]. In the 2k design, the main effect of a factoris computed by averaging of all the responses at eachlevel of that factor and taking the difference.
● Interaction: The failure of a factor to produce the sameeffect at different levels of another factor [7]. An interac-tion that can be modeled as arising from the joint effect oftwo factors is called a two-factor interaction. Similarly,three-factor interactions and higher order interactionsmay be defined.
2.2. Why Are Regularities in Experimental DataImportant?Based on experience in planning and analyzing many ex-periments, practitioners and researchers in DOE have iden-tified regularities in the interrelationships among factor ef-fects and interactions. Such regularities are frequently usedto justify experimental design and analysis strategies [8].This section reviews three regularities noted in the DOEliterature describing their nature, origins, and influence ontheory and practice. These regularities are effect sparsity,hierarchical ordering, and effect heredity.
Effect sparsity refers to the observation that number ofrelatively important effects in a factorial experiment is gen-erally small [9]. This is sometimes called the Pareto Principlein Experimental Design, based on analogy with the obser-vations of the 19th century economist Vilfredo Pareto, whoargued that, in all countries and times, the distribution ofincome and wealth follows a logarithmic pattern resultingin the concentration of resources in the hands of a smallnumber of wealthy individuals.
Effect sparsity appears to be a phenomenon character-izing the knowledge of the experimenters more so than thephysical or logical behavior of the system under investiga-tion. Investigating an effect through experimentation re-quires an allocation of resources—to resolve more effectstypically requires more experiments. Therefore, effect spar-sity is in some sense an indication of wasted resources. Ifthe important factor effects could be identified during plan-ning, then those effects might be investigated exclusively,resources might be saved, and only significant effects wouldbe revealed in the analysis. But experimenters are not nor-mally able to do this. Effect sparsity is therefore usuallyevident, but only after the experiment is complete and thedata have been analyzed.
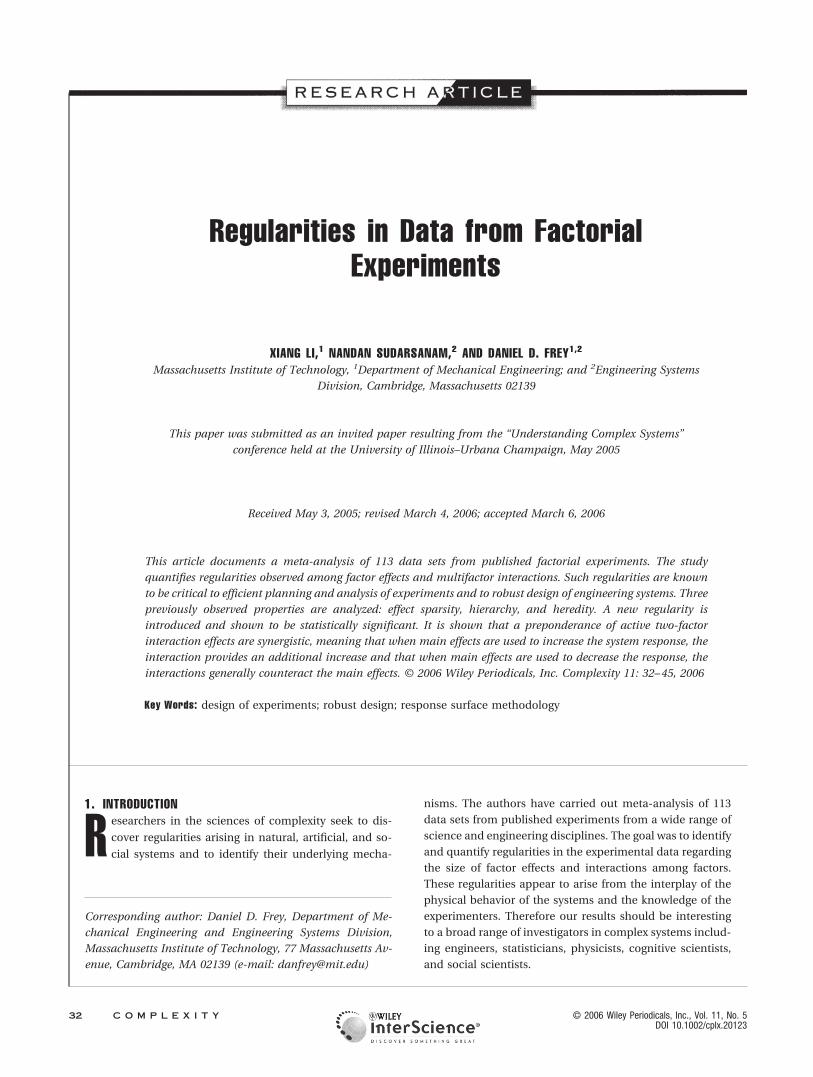
Researchers in DOE have devised means by which thesparsity of effects principle can be exploited to seek efficien-cies. Many experiments are designed to have projectiveproperties so that when dimensions of the experimentalspace are collapsed, the resulting experiment will have de-sired properties. For example, the fractional factorial 23�1
design may be used to estimate the main effects of threefactors A, B, and C. As Figure 1 illustrates, if any of the threedimensions associated with the factors is collapsed, theresulting design becomes a full factorial 22 experiment in
© 2006 Wiley Periodicals, Inc. C O M P L E X I T Y 33DOI 10.1002/cplx
the two remaining factors. Projection, in effect, removes afactor from the experimental design once it is known tohave an insignificant effect on the response. Projectiveproperties of fractional factorial experiments can enable aninvestigator to carry out a full factorial experiment in thefew critical factors in a long list of factors without knowinga priori which of the many factors are the critical few.Similarly, Latin Hypercube Sampling enables an experi-menter to sample an n-dimensional space so that, when n �
1 dimensions collapse, the resulting sampling is uniform in
the remaining dimension [10]. Latin Hypercube Samplinghas become popular for sampling computer simulations ofengineering systems, suggesting that its projective proper-ties provide substantial practical advantages for engineeringdesign. Although effect sparsity is widely accepted as auseful regularity, better quantification seems to be needed.Reliance on effect sparsity has led to strong claims aboutsingle array methods of robust design, but field investiga-tion have shown that crossed arrays give better results [11].Degrees of reliance on effect sparsity may be the root causeof some disagreements about methodology in robust de-sign.
Hierarchical ordering (sometimes referred to as simply“hierarchy”) is a term denoting the observation that maineffects tend to be larger on average than two-factor inter-actions, two-factor interactions tend to be larger on averagethan three-factor interactions, and so on [12]. Effect hierar-chy is illustrated in Figure 2 for a system with four factors A,B, C, and D. Figure 2 illustrates a case in which hierarchy isnot strict—for example, that some interactions (such as thetwo-factor interaction AC) are larger than some main effects(such as the main effect of B).
The phenomenon of hierarchical ordering is partly dueto the range over which experimenters typically explorefactors. In the limit that experimenters explore smallchanges in factors and to the degree that systems exhibitcontinuity of responses and their derivatives, linear effectsof factors tend to dominate. Therefore, to the extent thathierarchical ordering is common in experimentation, it isdue to the fact that many experiments are conducted for thepurpose of minor refinement rather than broad-scale explo-ration.
The phenomenon of hierarchical ordering is also partlydetermined by the ability of experimenters to transform theinputs and outputs of the system to obtain a parsimoniousdescription of system behavior [13]. For example, it is wellknown to aeronautical engineers that the lift and drag ofwings is more simply described as a function of wing areaand aspect ratio than by wing span and chord. Therefore,when conducting experiments to guide wing design, engi-neers are likely to use the product of span and chord (wingarea) and the ratio of span and chord (the aspect ratio) asthe independent variables. Therefore, one might say thatthe experimenters have performed a nonlinear transforma-tion of input variables (span and chord) before conductingthe experiments. In addition, after conducting the experi-ments, further transformations might be conducted on theresponse variable. In aeronautics, lift and drag are oftentransformed into a nondimensional lift and drag coeffi-cients by dividing the measured force by dynamic pressureand wing area. It is also common in statistical analysis ofdata to apply transformations such as a logarithm as part ofexploration of the data. A key aspect of hierarchical orderingis its dependence on the perspective and knowledge of the
FIGURE 1
The projective property of the fractional factorial 2III3�1 design of an
experiment.
34 C O M P L E X I T Y © 2006 Wiley Periodicals, Inc.DOI 10.1002/cplx

experimenter as well as conventions in reporting data. It isimportant in assessing regularities in published experimen-tal data that we do not alter the data as it was presented inany ways that affect its hierarchical structure. Section 4 willprovide some exploration of this issue.
Effect hierarchy has a substantial effect on the resourcerequirements for experimentation. A full factorial 2k exper-iment allows one to estimate every possible interaction in asystem with k two-level factors, but the resource require-ments grow exponentially as the number of factors rises. Asaturated, resolution III fractional factorial design allowsone to estimate main effects in a system with k two-levelfactors with only k � 1 experiments, but the analysis may beseriously compromised if there are large interaction effectsin the system. Better quantification of effect hierarchyseems to be needed to guide choice between these alterna-tives and the many other options for experimental planning.For example, the degree to which systems exhibit hierarchyhas been shown to strongly determine the effectiveness ofrobust design methodologies [14]. If such decisions amongrobust design methods can be based on empirical studies,further efficiencies may be possible.
Effect heredity (sometimes referred to as “inheritance”)implies that, in order for an interaction to be significant, atleast one of its parent factors should be significant [8]. Thisregularity can strongly influence sequential, iterative ap-proaches to experimentation. For example, in response sur-
face methodology, high-resolution experiments (e.g., cen-tral composite designs) are frequently used with a smallnumber of factors only after screening and gradient-basedsearch bring the response into the neighborhood whereinteractions among the active factors are likely. Effect he-redity can also provide advantages in analyzing data fromexperiments with complex aliasing patterns, enabling ex-perimenters to identify likely interactions without resortingto high-resolution designs [15].
The effect structures listed above have been identifiedthrough long experience by the DOE research communityand by practitioners who plan, conduct, and analyze exper-iments. The effect structures figure prominently in discus-sion of DOE methods, including their theoretical underpin-nings and practical advice on their use. However, effectstructures have not been quantified by formal empiricalmethods. Further, there has been little effort to search forother regularities that may exist in experimental data acrossmany domains. These gaps in the literature motivated theinvestigation described in the next sections.
3. RESEARCH METHODOLOGYThe present study was performed using a set of 46 pub-lished engineering experiments that includes 113 responsesin all. A General Linear Model was used to estimate factoreffects in each data set and the Lenth method was used toidentify active effects. Then, across the set of 113 responses,
FIGURE 2
The hierarchy and heredity among main effects and interactions in a system with four factors A, B, C, and D.
© 2006 Wiley Periodicals, Inc. C O M P L E X I T Y 35DOI 10.1002/cplx
the model parameters and the relevant conditional proba-bilities were analyzed. Details of the approach are given inthe following seven subsections.
3.1. The Set of Experimental DataWe assembled a set of 46 full factorial 2k experiments pub-lished in academic journals or textbooks [16 – 60]. The ex-periments come from a variety of fields including biology,chemistry, materials, mechanical engineering, and manu-facturing. The reason we used full factorial designs is thatwe did not want to assume the existence of any given effectstructure in this investigation, we want to test it and quan-tify it. Full factorial experiments allow all the interactions ina system to be estimated. The reason that we used two-levelexperiments is that they are much more common in theliterature than other full factorial experiments and wewanted a large sample size.
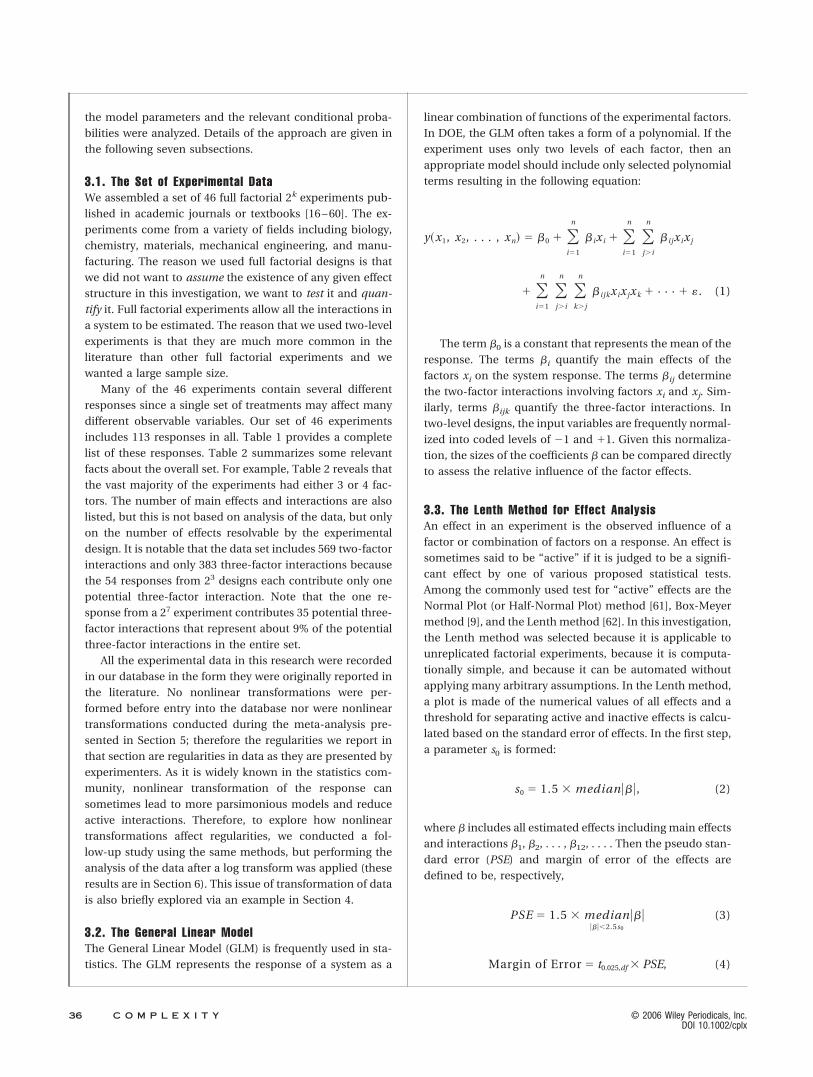
Many of the 46 experiments contain several differentresponses since a single set of treatments may affect manydifferent observable variables. Our set of 46 experimentsincludes 113 responses in all. Table 1 provides a completelist of these responses. Table 2 summarizes some relevantfacts about the overall set. For example, Table 2 reveals thatthe vast majority of the experiments had either 3 or 4 fac-tors. The number of main effects and interactions are alsolisted, but this is not based on analysis of the data, but onlyon the number of effects resolvable by the experimentaldesign. It is notable that the data set includes 569 two-factorinteractions and only 383 three-factor interactions becausethe 54 responses from 23 designs each contribute only onepotential three-factor interaction. Note that the one re-sponse from a 27 experiment contributes 35 potential three-factor interactions that represent about 9% of the potentialthree-factor interactions in the entire set.
All the experimental data in this research were recordedin our database in the form they were originally reported inthe literature. No nonlinear transformations were per-formed before entry into the database nor were nonlineartransformations conducted during the meta-analysis pre-sented in Section 5; therefore the regularities we report inthat section are regularities in data as they are presented byexperimenters. As it is widely known in the statistics com-munity, nonlinear transformation of the response cansometimes lead to more parsimonious models and reduceactive interactions. Therefore, to explore how nonlineartransformations affect regularities, we conducted a fol-low-up study using the same methods, but performing theanalysis of the data after a log transform was applied (theseresults are in Section 6). This issue of transformation of datais also briefly explored via an example in Section 4.
3.2. The General Linear ModelThe General Linear Model (GLM) is frequently used in sta-tistics. The GLM represents the response of a system as a
linear combination of functions of the experimental factors.In DOE, the GLM often takes a form of a polynomial. If theexperiment uses only two levels of each factor, then anappropriate model should include only selected polynomialterms resulting in the following equation:
y�x1, x2, . . . , xn� � �0 � �i�1
n
� ixi � �i�1
n �j�i
n
� ijxixj
� �i�1
n �j�i
n �k�j
n
� ijkxixjxk � · · · � �. (1)
The term �0 is a constant that represents the mean of theresponse. The terms �i quantify the main effects of thefactors xi on the system response. The terms �ij determinethe two-factor interactions involving factors xi and xj. Sim-ilarly, terms �ijk quantify the three-factor interactions. Intwo-level designs, the input variables are frequently normal-ized into coded levels of �1 and �1. Given this normaliza-tion, the sizes of the coefficients � can be compared directlyto assess the relative influence of the factor effects.
3.3. The Lenth Method for Effect AnalysisAn effect in an experiment is the observed influence of afactor or combination of factors on a response. An effect issometimes said to be “active” if it is judged to be a signifi-cant effect by one of various proposed statistical tests.Among the commonly used test for “active” effects are theNormal Plot (or Half-Normal Plot) method [61], Box-Meyermethod [9], and the Lenth method [62]. In this investigation,the Lenth method was selected because it is applicable tounreplicated factorial experiments, because it is computa-tionally simple, and because it can be automated withoutapplying many arbitrary assumptions. In the Lenth method,a plot is made of the numerical values of all effects and athreshold for separating active and inactive effects is calcu-lated based on the standard error of effects. In the first step,a parameter s0 is formed:
s0 � 1.5 � median �� �, (2)
where � includes all estimated effects including main effectsand interactions �1, �2, . . . , �12, . . . . Then the pseudo stan-dard error (PSE) and margin of error of the effects aredefined to be, respectively,
PSE � 1.5 � median�� ��2.5s0
�� � (3)
Margin of Error � t0.025,df � PSE, (4)
36 C O M P L E X I T Y © 2006 Wiley Periodicals, Inc.DOI 10.1002/cplx
TABLE 1
List of the Responses Subjected to Meta-analysis
Engineering System [Ref.] kn Response Engineering System [Ref.] kn Response
Remediating aqueous heavy metals [16] 24 Lead Finish turning [38] 25 Roughness24 pH Epitaxial layer growth [8] 24 Thickness24 Lead Limestone effects [39] 23 Surface area24 pH (alt. method) 23 Water demand
Processing of incandescent lamps [17] 24 Lumens fluct. 23 Init. setting time24 Power val. 23 Final setting time24 Lumens val. Cr toxicity and L. nimor [40] 23* RGR24 Life time 23* DFR24 Power fluct. 23* Cr in fronds24 Life fluct. Wood sanding oper. [41] 24* Cherry removal rate
Glass fiber composites [18] 23 Stiffness tans. 24* Maple removal rate23 Stiffness 24* Oak removal rate23 Strength 24* Pine removal rate23 Strength trans. 24* Cherry surface rough
Solvent extraction of cocaine [19] 23 % weight 24* Maple surface roughPlasma spraying of ZrO2 [20] 24 Velocity 24* Oak surface rough
24 Temp. 24* Pine surface rough24 Size Grinding of silicon wafers [42] 24 Displacement
Post-exp. bake in x-ray mask fab. [21] 24 Line width Concrete mix hot clim. [43] 24* Compressive strengthEDM of carbide composites [22] 23* Roughness Color-improved lamps [44] 24 Voltage
23* Tool wear 24 CCT23* MRR 24 CRI
Polymerization of microspheres [23] 23 Mn 24 Luminous flux23 Surf. density Machinability study [45] 24 Tool wear23 Diameter 24 Surface finish23 Mw Diffusion welding [46] 24 Failure load23 Mz Electrocoagulation [47] 24 Decolorization23 Surface density Fine grinding [48] 23 Max grinding force23 % pepi 23 Max motor current
Ball burnishing of an ANSI 1045 [24] 24 Roughness 23 Grinding cycle timeAbrasive wear of Zi-Al alloy [25] 23 Zinc 23 Surface roughness
23 Composite Leaching of manganese [49] 24 MnSurface morphology of films [26] 25 Roughness 24 Fe
25 Stress 24 AlMIG process [27] 24 Penetration Aqueous SO2 leaching [50] 24 Extraction Mn
24 Reinforce 24 Extraction Fe24 Width Ident. of radionuclide [51] 23 U238 extracted24 Reinforce Crystal growth [52] 24 Experimental scores
Pilot plant filtration rate [28] 24 Rate Yeast b-G [53] 23 Observed b-GFriction measurement machine [29] 23 Frict coeff val. Chl and tetracycline [54] 23* CTC
23 Frict coeff fluct. 23* TCDetonation spray process [30] 24 Hardness 23* pH
24 Roughness Erosion durability [55] 23* Nozzle pressure24 Porosity Antifungal antibiotic [56] 23* Antifungal antibio. act.
Production of surfactin [31] 24 Yield Xylitol production [57] 24 CRSteam-exp. laser-printed paper [32] 25 Brightness 24 LDPR
25 Opacity 24 Yp/s25 Light abs. 24 Qp25 Light scatter Thermal fatigue of PWBs [58] 23 Cycles
Hydrosilylation of polypropylene [33] 23 Silane Wire EDM process [59] 23 Roughness (�)23 Double 23 Waviness (�)
Solid polymer electrolyte cells [34] 23 Potential 23 Cut spd (�)Simulation of earth moving sys. [35] 26 Match factor 23 Roughness (�)
26 Production 23 Cut spd (�)Fractionation of rapeseed lecithin [36] 24 Enrichment 23 Waviness (�)
24 Yield Wet clutch pack [60] 27 Drag torqueDeter. of reinforced concrete [37] 23* Corros. rate
*This experiment was not a full factorial design, but contained a full factorial design as a subset. Only the full factorial settings were used in themeta-analysis.
© 2006 Wiley Periodicals, Inc. C O M P L E X I T Y 37DOI 10.1002/cplx

where t0.025,df is the 0.975th quantile of the t-distributionand df is the statistical degrees of freedom. Lenth [62] sug-gests that the degrees of freedom should be one third of thetotal number of effects.
The margin of error for effects is defined to provideapproximately 95% confidence. A more conservative mea-sure, the simultaneous margin of error (SME) is also definedas follows:
SME � t�,df � PSE (5)
where
� ��1 � 0.951/m�
2(6)
where m is the total number of effects. In the Lenth method,it is common to construct a bar graph showing all effectswith reference lines at both the margin of error and at thesimultaneous margin of error. In this article, we needed toselect one consistent criterion of demarcation between ac-tive and inactive effects. We judged it was more appropriateto use the margin of error as the criterion in study of fullfactorial experiments and that the alternative simultaneousmargin of error criterion is more appropriate for screeningexperiments.
3.4. Method for Quantifying Effect SparsityTo quantify effect sparsity in the set of data, we used thefollowing procedure:
1. For each experiment, estimate all the main effects andinteractions as described in Section 3.2.
2. Apply the Lenth method and label each effect as eitheractive or inactive as described in Section 3.3.
3. Categorize the effects into main effects, two-factor inter-actions, and three-factor interactions, etc. Calculate thepercentage of active effects within each category.
4. Calculate the confidence intervals ( � 0.05) for thepercentages of potential effects that are active. As someof the active numbers of interactions are very small, weconstruct exact two-sided confidence intervals based onthe binomial distribution.
3.5. Method for Quantifying HierarchyTo test and quantify effect hierarchy, we compared the sizeof main effects with that of two-factor interactions, and thesize of two-factor interactions with that of three-factor in-teractions. As the responses in different data sets are indifferent units, we need to normalize them in order to makecomparisons. We choose to make an affine transformationso that the minimum response and maximum response ineach experiment were each, respectively, 0 and 100. Thisnormalization was only required in our assessment of hier-archy and did not influence our assessment of other regu-larities discussed in this article. The following steps sum-marize the procedure we used to assess hierarchy:
1. Normalize the responses of each experiment by means ofan affine transformation so that they all range over thesame interval [0, 100].
2. For each experiment, estimate all the main effects andinteractions as described in Section 3.2.
3. Use conventional statistical tools such as box-plots toanalyze the absolute values of the main effects, two-factor interactions, and three-factor interactions.
4. Calculate the ratio between main effects and two-factorinteractions, two-factor interactions and three-factor in-teractions.
3.6. Method for Quantifying HeredityTo quantify heredity in the set of data, we analyzed proba-bilities and conditional probabilities of effects being active.Following the definitions and terminology of Chipman et al.[15], we define p as the probability that a main effect is
TABLE 2
A Summary of the Set of 113 Responses and the Potential Effects Therein
Factors Experiments ResponsesPotential
Main Effects
PotentialTwo-FactorInteractions
PotentialThree-FactorInteractions
3 20 (43%) 54 (48%) 162 (40%) 162 (28%) 54 (14%)4 22 (49%) 51 (45%) 204 (49%) 306 (54%) 204 (54%)5 2 (4%) 5 (4%) 25 (6%) 50 (9%) 50 (13%)6 1 (2%) 2 (2%) 12 (3%) 30 (5%) 40 (10%)7 1 (2%) 1 (1%) 7 (2%) 21 (4%) 35 (9%)Total 46 (100%) 113 (100%) 410 (100%) 569 (100%) 383 (100%)
38 C O M P L E X I T Y © 2006 Wiley Periodicals, Inc.DOI 10.1002/cplx
active and define a set of conditional probabilities for twofactor interactions:
p00 � Pr�AB is active�neither A nor B is active� (7)
p01 � Pr�AB is active�either A or B is active� (8)
p11 � Pr�AB is active�both A and B are active�. (9)
Extending the terminology of Chipman et al. [15], wedefined conditional probabilities for three-factor interac-tions as follows:
p000 � Pr�ABC is active�none of A, B, C are active� (10)
p001 � Pr�ABC is active�one of A, B, C is active� (11)
p011 � Pr�ABC is active�two of A, B, C are active� (12)
p111 � Pr�ABC is active�all of A, B, C are active�. (13)
On the basis of these definitions, we estimate the con-ditional probabilities as the frequencies observed in our setof 113 responses and associated factor effects.
3.7. Method for Quantifying Asymmetric SynergisticInteraction StructureWe use the term “asymmetric synergistic interaction struc-ture” (ASIS) to describe the degree to which the signs ofmain effects provide information about the likely signs ofinteraction effects. Given the GLM described in Section 2.2,a synergistic two-factor interaction will satisfy the inequality�i�j�ij � 0 and an antisynergistic two-factor interaction willsatisfy the inequality �i�j�ij � 0. To evaluate the null hy-pothesis that synergistic two-factor interactions and anti-synergistic two-factor interactions are equally likely, we fol-lowed these steps:
Step 1: For each response
1. Estimate the main effects and interactions for each re-sponse as described in Section 3.2.
2. Label each two-factor interaction as either synergistic orantisynergistic according to our definition.
Step 2: Carry out statistics on the set of 113 responses.
1. Calculate the percentage of all two-factor interactionsthat are synergistic and antisynergistic.
2. Use the Lenth method to discriminate between activeeffects and inactive effects.
3. Calculate the percentage of active two-factor interactionsthat are synergistic and antisynergistic.
4. Calculate the percentage of inactive two-factor interac-tions that are synergistic and antisynergistic.
5. Calculate 95% confidence intervals for the synergisticand antisynergistic percentages using the binomial dis-tribution.
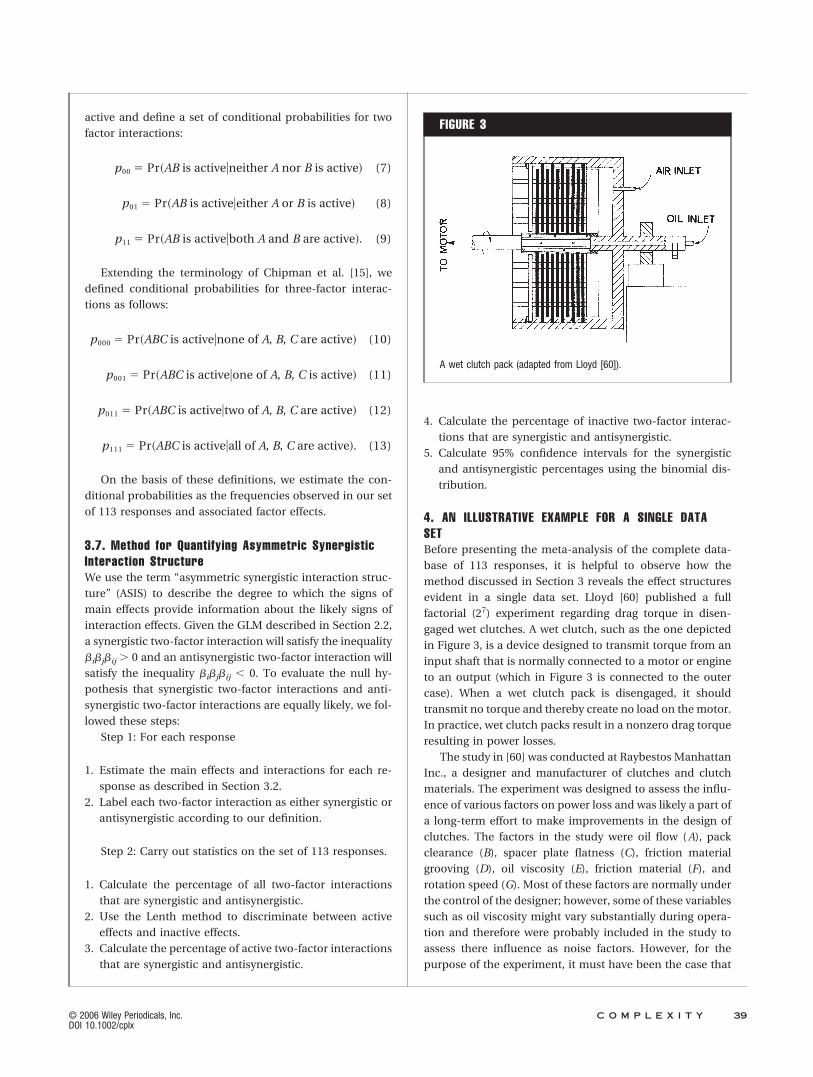
4. AN ILLUSTRATIVE EXAMPLE FOR A SINGLE DATASETBefore presenting the meta-analysis of the complete data-base of 113 responses, it is helpful to observe how themethod discussed in Section 3 reveals the effect structuresevident in a single data set. Lloyd [60] published a fullfactorial (27) experiment regarding drag torque in disen-gaged wet clutches. A wet clutch, such as the one depictedin Figure 3, is a device designed to transmit torque from aninput shaft that is normally connected to a motor or engineto an output (which in Figure 3 is connected to the outercase). When a wet clutch pack is disengaged, it shouldtransmit no torque and thereby create no load on the motor.In practice, wet clutch packs result in a nonzero drag torqueresulting in power losses.
The study in [60] was conducted at Raybestos ManhattanInc., a designer and manufacturer of clutches and clutchmaterials. The experiment was designed to assess the influ-ence of various factors on power loss and was likely a part ofa long-term effort to make improvements in the design ofclutches. The factors in the study were oil flow ( A), packclearance (B), spacer plate flatness (C), friction materialgrooving (D), oil viscosity (E), friction material (F), androtation speed (G). Most of these factors are normally underthe control of the designer; however, some of these variablessuch as oil viscosity might vary substantially during opera-tion and therefore were probably included in the study toassess there influence as noise factors. However, for thepurpose of the experiment, it must have been the case that
FIGURE 3
A wet clutch pack (adapted from Lloyd [60]).
© 2006 Wiley Periodicals, Inc. C O M P L E X I T Y 39DOI 10.1002/cplx
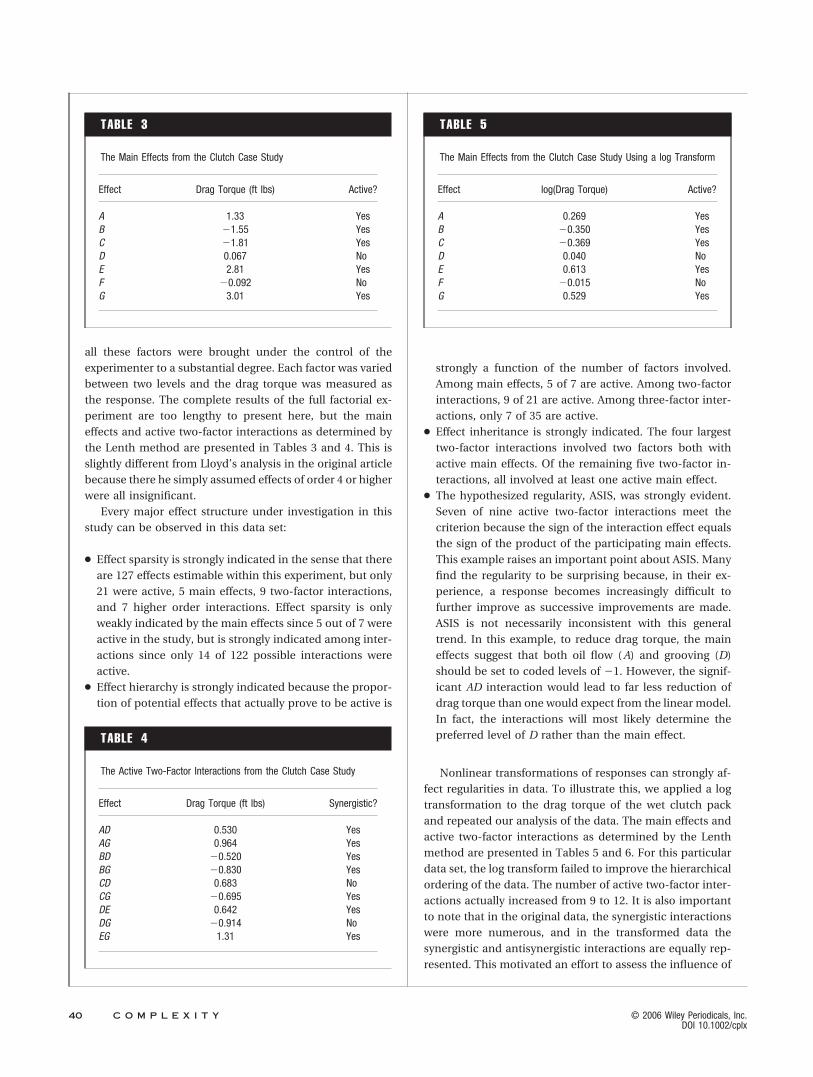
all these factors were brought under the control of theexperimenter to a substantial degree. Each factor was variedbetween two levels and the drag torque was measured asthe response. The complete results of the full factorial ex-periment are too lengthy to present here, but the maineffects and active two-factor interactions as determined bythe Lenth method are presented in Tables 3 and 4. This isslightly different from Lloyd’s analysis in the original articlebecause there he simply assumed effects of order 4 or higherwere all insignificant.
Every major effect structure under investigation in thisstudy can be observed in this data set:
● Effect sparsity is strongly indicated in the sense that thereare 127 effects estimable within this experiment, but only21 were active, 5 main effects, 9 two-factor interactions,and 7 higher order interactions. Effect sparsity is onlyweakly indicated by the main effects since 5 out of 7 wereactive in the study, but is strongly indicated among inter-actions since only 14 of 122 possible interactions wereactive.
● Effect hierarchy is strongly indicated because the propor-tion of potential effects that actually prove to be active is
strongly a function of the number of factors involved.Among main effects, 5 of 7 are active. Among two-factorinteractions, 9 of 21 are active. Among three-factor inter-actions, only 7 of 35 are active.
● Effect inheritance is strongly indicated. The four largesttwo-factor interactions involved two factors both withactive main effects. Of the remaining five two-factor in-teractions, all involved at least one active main effect.
● The hypothesized regularity, ASIS, was strongly evident.Seven of nine active two-factor interactions meet thecriterion because the sign of the interaction effect equalsthe sign of the product of the participating main effects.This example raises an important point about ASIS. Manyfind the regularity to be surprising because, in their ex-perience, a response becomes increasingly difficult tofurther improve as successive improvements are made.ASIS is not necessarily inconsistent with this generaltrend. In this example, to reduce drag torque, the maineffects suggest that both oil flow ( A) and grooving (D)should be set to coded levels of �1. However, the signif-icant AD interaction would lead to far less reduction ofdrag torque than one would expect from the linear model.In fact, the interactions will most likely determine thepreferred level of D rather than the main effect.
Nonlinear transformations of responses can strongly af-fect regularities in data. To illustrate this, we applied a logtransformation to the drag torque of the wet clutch packand repeated our analysis of the data. The main effects andactive two-factor interactions as determined by the Lenthmethod are presented in Tables 5 and 6. For this particulardata set, the log transform failed to improve the hierarchicalordering of the data. The number of active two-factor inter-actions actually increased from 9 to 12. It is also importantto note that in the original data, the synergistic interactionswere more numerous, and in the transformed data thesynergistic and antisynergistic interactions are equally rep-resented. This motivated an effort to assess the influence of
TABLE 3
The Main Effects from the Clutch Case Study
Effect Drag Torque (ft lbs) Active?
A 1.33 YesB �1.55 YesC �1.81 YesD 0.067 NoE 2.81 YesF �0.092 NoG 3.01 Yes
TABLE 4
The Active Two-Factor Interactions from the Clutch Case Study
Effect Drag Torque (ft lbs) Synergistic?
AD 0.530 YesAG 0.964 YesBD �0.520 YesBG �0.830 YesCD 0.683 NoCG �0.695 YesDE 0.642 YesDG �0.914 NoEG 1.31 Yes
TABLE 5
The Main Effects from the Clutch Case Study Using a log Transform
Effect log(Drag Torque) Active?
A 0.269 YesB �0.350 YesC �0.369 YesD 0.040 NoE 0.613 YesF �0.015 NoG 0.529 Yes
40 C O M P L E X I T Y © 2006 Wiley Periodicals, Inc.DOI 10.1002/cplx
transformations on ASIS through a second meta-analysisreported in Section 6.
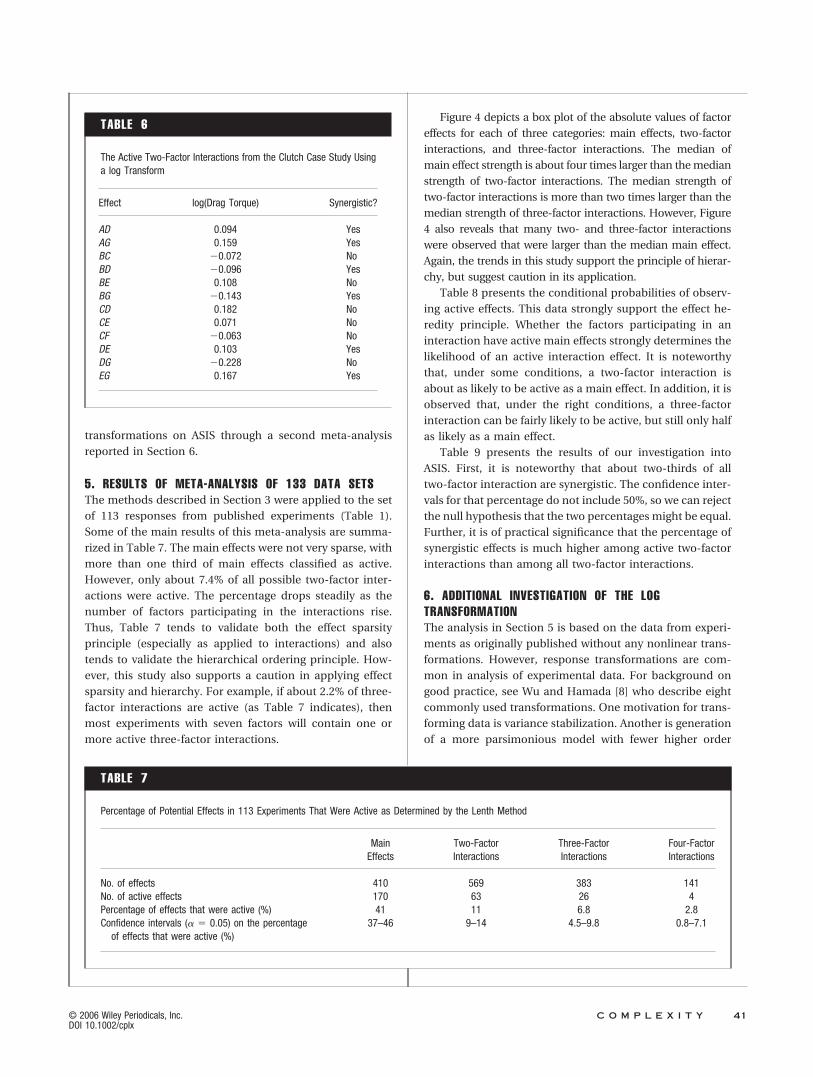
5. RESULTS OF META-ANALYSIS OF 133 DATA SETSThe methods described in Section 3 were applied to the setof 113 responses from published experiments (Table 1).Some of the main results of this meta-analysis are summa-rized in Table 7. The main effects were not very sparse, withmore than one third of main effects classified as active.However, only about 7.4% of all possible two-factor inter-actions were active. The percentage drops steadily as thenumber of factors participating in the interactions rise.Thus, Table 7 tends to validate both the effect sparsityprinciple (especially as applied to interactions) and alsotends to validate the hierarchical ordering principle. How-ever, this study also supports a caution in applying effectsparsity and hierarchy. For example, if about 2.2% of three-factor interactions are active (as Table 7 indicates), thenmost experiments with seven factors will contain one ormore active three-factor interactions.
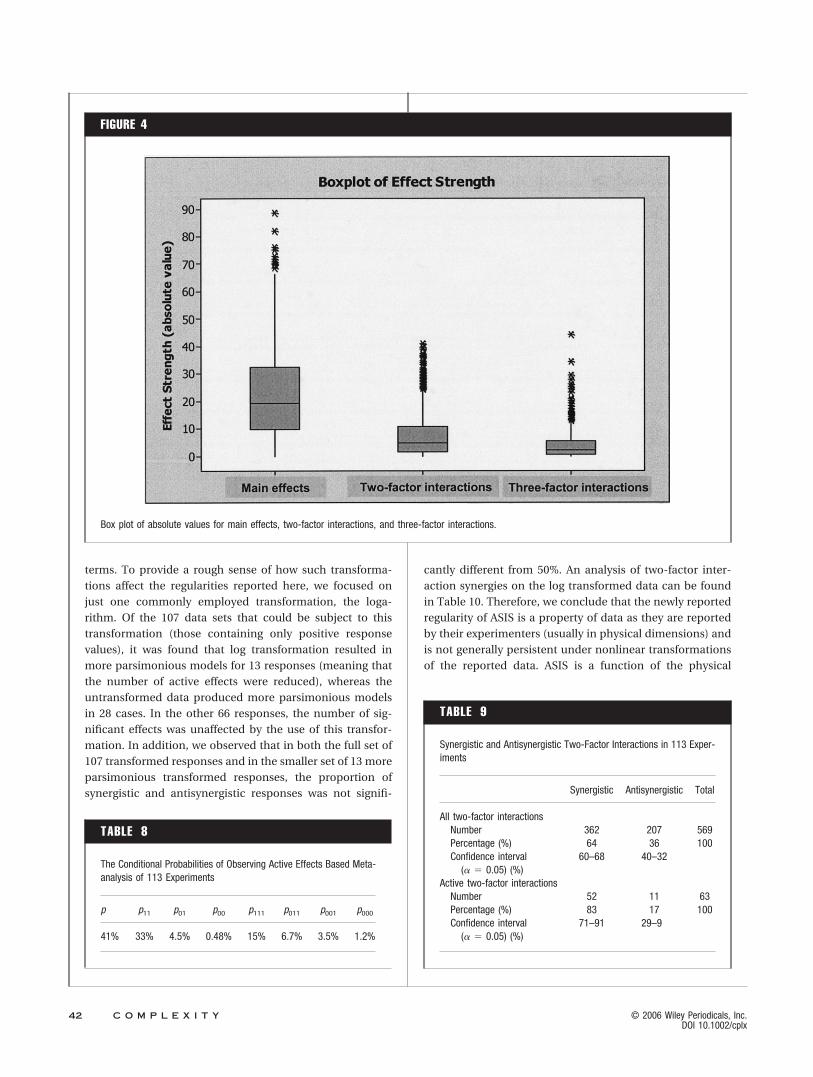
Figure 4 depicts a box plot of the absolute values of factoreffects for each of three categories: main effects, two-factorinteractions, and three-factor interactions. The median ofmain effect strength is about four times larger than the medianstrength of two-factor interactions. The median strength oftwo-factor interactions is more than two times larger than themedian strength of three-factor interactions. However, Figure4 also reveals that many two- and three-factor interactionswere observed that were larger than the median main effect.Again, the trends in this study support the principle of hierar-chy, but suggest caution in its application.
Table 8 presents the conditional probabilities of observ-ing active effects. This data strongly support the effect he-redity principle. Whether the factors participating in aninteraction have active main effects strongly determines thelikelihood of an active interaction effect. It is noteworthythat, under some conditions, a two-factor interaction isabout as likely to be active as a main effect. In addition, it isobserved that, under the right conditions, a three-factorinteraction can be fairly likely to be active, but still only halfas likely as a main effect.
Table 9 presents the results of our investigation intoASIS. First, it is noteworthy that about two-thirds of alltwo-factor interaction are synergistic. The confidence inter-vals for that percentage do not include 50%, so we can rejectthe null hypothesis that the two percentages might be equal.Further, it is of practical significance that the percentage ofsynergistic effects is much higher among active two-factorinteractions than among all two-factor interactions.
6. ADDITIONAL INVESTIGATION OF THE LOGTRANSFORMATIONThe analysis in Section 5 is based on the data from experi-ments as originally published without any nonlinear trans-formations. However, response transformations are com-mon in analysis of experimental data. For background ongood practice, see Wu and Hamada [8] who describe eightcommonly used transformations. One motivation for trans-forming data is variance stabilization. Another is generationof a more parsimonious model with fewer higher order
TABLE 6
The Active Two-Factor Interactions from the Clutch Case Study Usinga log Transform
Effect log(Drag Torque) Synergistic?
AD 0.094 YesAG 0.159 YesBC �0.072 NoBD �0.096 YesBE 0.108 NoBG �0.143 YesCD 0.182 NoCE 0.071 NoCF �0.063 NoDE 0.103 YesDG �0.228 NoEG 0.167 Yes
TABLE 7
Percentage of Potential Effects in 113 Experiments That Were Active as Determined by the Lenth Method
MainEffects
Two-FactorInteractions
Three-FactorInteractions
Four-FactorInteractions
No. of effects 410 569 383 141No. of active effects 170 63 26 4Percentage of effects that were active (%) 41 11 6.8 2.8Confidence intervals ( � 0.05) on the percentage
of effects that were active (%)37–46 9–14 4.5–9.8 0.8–7.1
© 2006 Wiley Periodicals, Inc. C O M P L E X I T Y 41DOI 10.1002/cplx
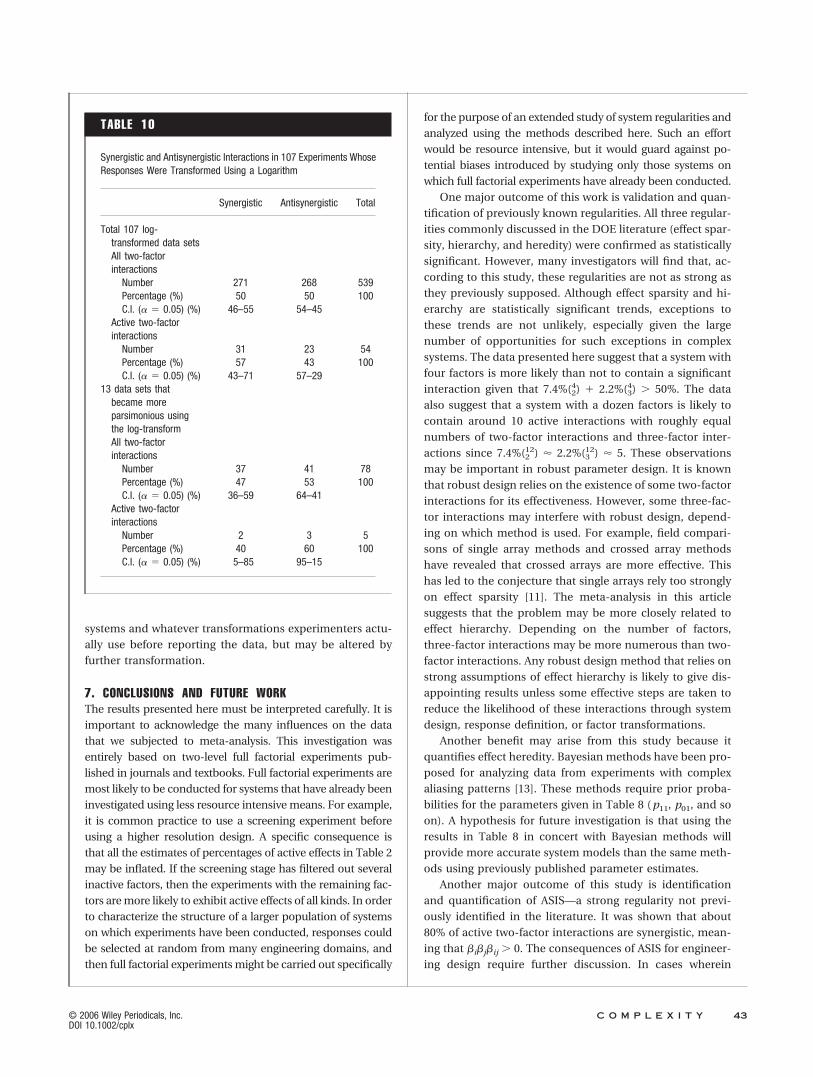
terms. To provide a rough sense of how such transforma-tions affect the regularities reported here, we focused onjust one commonly employed transformation, the loga-rithm. Of the 107 data sets that could be subject to thistransformation (those containing only positive responsevalues), it was found that log transformation resulted inmore parsimonious models for 13 responses (meaning thatthe number of active effects were reduced), whereas theuntransformed data produced more parsimonious modelsin 28 cases. In the other 66 responses, the number of sig-nificant effects was unaffected by the use of this transfor-mation. In addition, we observed that in both the full set of107 transformed responses and in the smaller set of 13 moreparsimonious transformed responses, the proportion ofsynergistic and antisynergistic responses was not signifi-
cantly different from 50%. An analysis of two-factor inter-action synergies on the log transformed data can be foundin Table 10. Therefore, we conclude that the newly reportedregularity of ASIS is a property of data as they are reportedby their experimenters (usually in physical dimensions) andis not generally persistent under nonlinear transformationsof the reported data. ASIS is a function of the physical
FIGURE 4
Box plot of absolute values for main effects, two-factor interactions, and three-factor interactions.
TABLE 8
The Conditional Probabilities of Observing Active Effects Based Meta-analysis of 113 Experiments
p p11 p01 p00 p111 p011 p001 p000
41% 33% 4.5% 0.48% 15% 6.7% 3.5% 1.2%
TABLE 9
Synergistic and Antisynergistic Two-Factor Interactions in 113 Exper-iments
Synergistic Antisynergistic Total
All two-factor interactionsNumber 362 207 569Percentage (%) 64 36 100Confidence interval
( � 0.05) (%)60–68 40–32
Active two-factor interactionsNumber 52 11 63Percentage (%) 83 17 100Confidence interval
( � 0.05) (%)71–91 29–9
42 C O M P L E X I T Y © 2006 Wiley Periodicals, Inc.DOI 10.1002/cplx
systems and whatever transformations experimenters actu-ally use before reporting the data, but may be altered byfurther transformation.
7. CONCLUSIONS AND FUTURE WORKThe results presented here must be interpreted carefully. It isimportant to acknowledge the many influences on the datathat we subjected to meta-analysis. This investigation wasentirely based on two-level full factorial experiments pub-lished in journals and textbooks. Full factorial experiments aremost likely to be conducted for systems that have already beeninvestigated using less resource intensive means. For example,it is common practice to use a screening experiment beforeusing a higher resolution design. A specific consequence isthat all the estimates of percentages of active effects in Table 2may be inflated. If the screening stage has filtered out severalinactive factors, then the experiments with the remaining fac-tors are more likely to exhibit active effects of all kinds. In orderto characterize the structure of a larger population of systemson which experiments have been conducted, responses couldbe selected at random from many engineering domains, andthen full factorial experiments might be carried out specifically
for the purpose of an extended study of system regularities andanalyzed using the methods described here. Such an effortwould be resource intensive, but it would guard against po-tential biases introduced by studying only those systems onwhich full factorial experiments have already been conducted.
One major outcome of this work is validation and quan-tification of previously known regularities. All three regular-ities commonly discussed in the DOE literature (effect spar-sity, hierarchy, and heredity) were confirmed as statisticallysignificant. However, many investigators will find that, ac-cording to this study, these regularities are not as strong asthey previously supposed. Although effect sparsity and hi-erarchy are statistically significant trends, exceptions tothese trends are not unlikely, especially given the largenumber of opportunities for such exceptions in complexsystems. The data presented here suggest that a system withfour factors is more likely than not to contain a significantinteraction given that 7.4%(2
4) � 2.2%(34) � 50%. The data
also suggest that a system with a dozen factors is likely tocontain around 10 active interactions with roughly equalnumbers of two-factor interactions and three-factor inter-actions since 7.4%(2
12) � 2.2%(312) � 5. These observations
may be important in robust parameter design. It is knownthat robust design relies on the existence of some two-factorinteractions for its effectiveness. However, some three-fac-tor interactions may interfere with robust design, depend-ing on which method is used. For example, field compari-sons of single array methods and crossed array methodshave revealed that crossed arrays are more effective. Thishas led to the conjecture that single arrays rely too stronglyon effect sparsity [11]. The meta-analysis in this articlesuggests that the problem may be more closely related toeffect hierarchy. Depending on the number of factors,three-factor interactions may be more numerous than two-factor interactions. Any robust design method that relies onstrong assumptions of effect hierarchy is likely to give dis-appointing results unless some effective steps are taken toreduce the likelihood of these interactions through systemdesign, response definition, or factor transformations.
Another benefit may arise from this study because itquantifies effect heredity. Bayesian methods have been pro-posed for analyzing data from experiments with complexaliasing patterns [13]. These methods require prior proba-bilities for the parameters given in Table 8 ( p11, p01, and soon). A hypothesis for future investigation is that using theresults in Table 8 in concert with Bayesian methods willprovide more accurate system models than the same meth-ods using previously published parameter estimates.
Another major outcome of this study is identificationand quantification of ASIS—a strong regularity not previ-ously identified in the literature. It was shown that about80% of active two-factor interactions are synergistic, mean-ing that �i�j�ij � 0. The consequences of ASIS for engineer-ing design require further discussion. In cases wherein
TABLE 10
Synergistic and Antisynergistic Interactions in 107 Experiments WhoseResponses Were Transformed Using a Logarithm
Synergistic Antisynergistic Total
Total 107 log-transformed data setsAll two-factorinteractions
Number 271 268 539Percentage (%) 50 50 100C.I. ( � 0.05) (%) 46–55 54–45
Active two-factorinteractions
Number 31 23 54Percentage (%) 57 43 100C.I. ( � 0.05) (%) 43–71 57–29
13 data sets thatbecame moreparsimonious usingthe log-transformAll two-factorinteractions
Number 37 41 78Percentage (%) 47 53 100C.I. ( � 0.05) (%) 36–59 64–41
Active two-factorinteractions
Number 2 3 5Percentage (%) 40 60 100C.I. ( � 0.05) (%) 5–85 95–15
© 2006 Wiley Periodicals, Inc. C O M P L E X I T Y 43DOI 10.1002/cplx
larger responses are preferred, procedures that exploit maineffects are likely to enjoy additional increases due to activetwo-factor interactions even if those interactions have notbeen located or estimated. By contrast, in cases whereinsmaller responses are preferred, procedures that exploitmain effects to reduce the response are likely to be penal-ized by increases due to active two-factor interactions. Thediscussion of ASIS and its relationship to improvement ef-forts raises the question of why ASIS was defined as it was inthis article. This definition was chosen because it revealedthe new, statistically significant regularity in the data set.Other relationships among main effects and interactionswere explored and found to be insignificant. However, anyregularities associated with improvements rather than in-creases raise practical and conceptual difficulties. Thisstudy was based on meta-analysis of published data sets. Ifthe authors of published data sets do not clearly statewhether larger or smaller responses are preferred, how canone define “improvement” for that data set? Further, even ifthe authors express a preference, might not a different ap-plication of the same physical phenomenon reverse thatpreference? By contrast, regularities associated with thepublished values reflect regularities in physical phenom-ena as observed and interpreted by the experimenters. Tothe extent that such regularities exist and can be con-firmed as stable and reliable, they can be helpful in in-terpreting data.
Some experienced practitioners will find ASIS surprising.It is common for experimenters to report that, if they useexperimentation to attain some increases in a response,then any further increase will be harder to attain. We agreethat this is the general trend in engineering quality improve-ments, but how our proposed synergy concept relates tothis issue is not so simple. When engineers seek to improvea system, they move toward regions of improvement untillocating local maxima or constraints. These maxima andconstraints make additional improvements difficult toachieve. Our results are based on meta-analysis of 2k exper-iments. It is an interesting question whether such experi-ments are typically conducted at local maxima or away fromthem. If 2k experiments are typically conducted away fromlocal maxima, there are at least two explanations: 1) themaximum has not yet been located, or 2) constraints on thedesign space are limiting the optimization of that engineer-ing system. Determining the underlying reasons for ASIS isan interesting subject for future research. It is odd that sucha strong regularity has not been discussed in either theoret-ical or practical discourse regarding DOE. The previouslyknown regularities of effect sparsity, hierarchy, and heredityare intellectual cornerstones of DOE and many popularmethods provide benefit by exploiting them. Perhaps futureresearch will give rise to new DOE methods that exploit ASISand thereby reduce resource demands and/or increase ef-fectiveness of engineering experimentation.
ACKNOWLEDGMENTSThe financial support of the National Science Foundation(award 0448972) and the support of the Ford/MIT Alliance aregreatly appreciated. The comments of an anonymous reviewerproved helpful in clarifying the presentation of this research.
REFERENCES1. Thomke, S. Enlightened experimentation: The new imperative for
innovation. Harvard Business Rev 2001, 67–75.2. Box, G.E.P.; Hunter, W.G.; Hunter, J.S. Statistics for experimenters:
An introduction to design, data analysis, and model building; JohnWiley & Sons: New York, 1978.
3. Box, G.E.P.; Draper, N.R. Empirical model-building and responsesurfaces; John Wiley & Sons: New York, 1987.
4. Taguchi, G.; translated by Tung, L.W. System of experimental design:Engineering methods to optimize quality and minimize costs. Quali-tyResources: A division of the Kraus Organization Limited: WhitePlains, NY, American Supplier Institute: Dearborn, MI, 1987.
5. Phadke, M.S. Quality engineering using robust design; PTR Prentice-Hall: Englewood Cliffs, NJ, 1989.
6. Logothetis, N.; Wynn, H.P. Quality through design: Experimentaldesign, off-line quality control and Taguchi’s contributions; ClarendonPress: Oxford, 1994.
7. Montgomery, D.C. Design and analysis of experiments; John Wiley &Sons: New York, 2004.
8. Wu, C.F.J.; Hamada, M. Experiments: Planning, design, and param-eter optimization; John Wiley & Sons: New York, 2000.
9. Box, G.E.P.; Meyer, R.D. An analysis for unreplicated fractional fac-torials. Technometrics 1986, 28, 11–18.
10. McKay, M.D.; Beckman, R.J.; Conover, W.J. Comparison of threemethods for selecting values of input variables in the analysis ofoutput from a computer code. Technometrics 2000, 42, 1, 55–61.
11. Kunert, J.A. Comparison of Taguchi’s product array and the combinedarray in robust-parameter-design. Spring Research Conference onStatistics in Industry and Technology, Gaithersburg, MD, 2004.
12. Hamada, M.; Wu, C.F.J. Analysis of designed experiments withcomplex aliasing. J Qual Technol 1992, 24, 130–137.
13. Box, G.E.P.; Liu, P.T.Y. Statistics as a catalyst to learning by scientificmethod. J Qual Technol 1999, 31-1, 1–29.
14. Frey, D.D.; Li, X. Validating robust parameter design methods. ASMEDesign Engineering Technical Conference 2004, DETC2004–57518,Salt Lake City, Utah.
15. Chipman, H.M.; Hamada, M.; Wu, C.F.J. Bayesian variable-selectionapproach for analyzing designed experiments with complex aliasing.Technometrics 1997, 39-4, 372–381.
16. Admassu, W.; Breese, T. Feasibility of using natural fishbone apatiteas a substitute for hydroxyapatite in remediating aqueous heavymetals. J Hazardous Mater 1999, B69, 187–196.
17. Bergman, R.S.; Cox, C.W.; DePriest, D.J.; Faltin, F.W. Effect ofprocess variations on incandescent lamp performance. J IlluminationEngng Soc 1990, 19-2, 132–141.
18. Bogoeva-Gaceva, G.; Mader, E.; Queck, H. Properties of glass fiberpolypropylene composites produced from split-warp-knit textile pre-forms. J Thermoplastic Composite Mater 2000, 13, 363–377.
19. Brachet, A.; Rudaz, S.; Mateus, L.; Christen, P.; Veuthey, J.L. Opti-mization of accelerated solvent extraction of cocaine and benzolecgo-nine from coca leaves. J Separation Sci 2001, 24, 865–873.
20. Friedman, M.; Savage, L.J. Planning experiments seeking maxima.Techniques Statistical Anal 1947, 365–372.
21. Grimm, J.; Chlebek, J.; Schulz, T.; Huber, H.L. The influence of post-exposurebake on line width control for the resist system RAY-PN (AZ PN 100) in x-raymask fabrication. J Vac Sci Technol 1991, B9–6, 3392–3398.
44 C O M P L E X I T Y © 2006 Wiley Periodicals, Inc.DOI 10.1002/cplx

22. Karthikeyan, R.; Lakshmi Narayanan, P.R.; Naagarazan, R.S. Mathe-matical modeling for electric discharge machining of aluminum-silicon carbide particulate composites. J Materi Processing Technol1999, 87, 59–63.
23. Laus, M.; Lelli, M.; Casagrande, A. Polyepichlorohydrine stabilizedcore shell microspheres by dispersion polymerization. J Polymer SciA Polymer Chem 1997, 35-4, 681–688.
24. Lee, S.S.G.; Tam, S.C.; Loh, N.H.; Miyazawa, S. An investigation intothe ball burnishing of an ANSI 1045 free-form surface. J MateriProcessing Technol 1992, 29, 203–211.
25. Modi, O.P.; Yadav, R.P.; Mondal, D.P.; Dasgupta, R.; Das, S.; Yeg-neswaran, A.H. Abrasive wear behavior of zinc-aluminum alloy—10% Al2O3 composite through factorial design of experiment. J MaterSci 2001, 36, 1601–1607.
26. Moskowitz, I.L.; Babu, S.V. Surface morphology and quality of a-Si:C:H films. Thin Solid Films 2001, 385, 45–54.
27. Murugan, N.; Parmar, R.S. Effects of MIG process parameters on thegeometry of the bead in the automatic surfacing of stainless steel. JMater Processing Technol 1994, 41-4, 381–398.
28. Myers, R.H.; Montgomery, D.C. Response surface methodology; JohnWiley & Sons: New York, 1995; p 105.
29. Olofsson, U.; Holmgren, M. Friction measurement at low sliding speedusing a servohydraulic tension-torsion machine. Exp Mechanics1994, 34-3, 202–207.
30. Saravanan, P.; Selvarajan, V.; Joshi, S.V.; Sundararajan, G. Experi-mental design and performance analysis of alumina coatings depos-ited by a detonation spray process. J Physics D Appl Phys 2001, 34,131–140.
31. Sen, R. Response surface optimization of the critical media compo-nents for the production of surfactin. J Chem Tech Biotechnol 1997,68, 263–270.
32. Sharma, A.K.; Forester, W.K.; Shriver, E.H. Physical and opticalproperties of steam-exploded laser-printed paper. TAPPI J 1996,79-5, 211–221.
33. Shearer, G.; Tzoganakis, C. Free radical hydrosilylation of polypro-pylene. J Appl Polymer Sci 1996, 65-3, 439–447.
34. Shulka, A.K.; Stevens, P.; Hamnett, A.; Goodenough, J.P. A nafion-bound platinized carbon electrode for oxygen reduction in solidpolymer electrolyte cells. J Appl Electrochem 1989, 19, 383–386.
35. Smith, S.D.; Osbourne, J.R.; Forde, M.C. Analysis of earth movingsystems using discrete event simulation. J Construction Engng Man-agement 1995, 121-4, 388–396.
36. Sosada, M. Optimal conditions for fractionation of rapeseed lecithinwith alcohols. JAOCS 1993, 70-4, 405–410.
37. Thompson, N.G.; Islam, M.; Lankard, D.A.; Virmani, Y.P. Environmen-tal factors in the deterioration of reinforced concrete. MaterialsPerformance 1995, 34-9, 43–47.
38. Wang, X.; Feng, C.X.; He, D.W. Regression analysis and neuralnetworks applied to surface roughness study in turning. IIE TransDesign Manuf 2002.
39. Vuk, T.; Tinta, V.; Gabrovsek, R.; Kaucic, V. The effect of limestoneaddition, clinker type and fineness on properties of Portland cement.Cement Concrete Res 2001, 31, 135–139.
40. Dirilgen, N. Effects of pH and chelator EDTA on Cr toxicity andaccumulation in lemna minor. Chemosphere 1998, 37-4, 771–783.
41. Taylor, J.B.; Carrano, A.L.; Lemaster, R.L. Quantification of processparameters in a wood sanding operation. Forest Products J 1999,49-5, 41–46.
42. Pei, Z.J.; Xin, X.J.; Liu, W. Finite element analysis for grinding ofwire-sawn silicon wafers: A designed experiment. Int J Machine ToolsManuf 2003, 43, 7–16.
43. Soudki, K.A.; El-Salakawy, E.F.; Elkum, N.B. Full factorial optimizationof concrete mix design for hot climates. J Materials Civil Engng 2001,Nov/Dec, 427–433.
44. Brabham, D.E. Designing color performance into color-improved HPSlamps. J Illuminating Engng Soc 1991, Winter, 50–55.
45. Rahman, M.; Ramakrishna, S.; Thoo, H.C. Machinability study ofcarbon/peek composites. Machining Sci Technol 1998, 3-1, 49–59.
46. Dini, J.W.; Kelley, W.K.; Cowden, W.C.; Lopez, E.M. Use of electrode-posited silver as an aid in diffusion welding. Welding Research Suppl1984, January, 26s–34s.
47. Gurses, A.; Yalcin, M.; Dogar, C. Electrocoagulation of some reactivedyes: A statistical investigation of some electrochemical variables.Waste Management 2002, 22, 491–499.
48. Pei, Z.J.; Strasbaugh, A. Fine grinding of silicon wafers: Designedexperiments. Int J Machine Tools Manuf 2002, 42, 395–404.
49. Sahoo, R.N.; Naik, P.K.; Das, S.C. Leaching of manganese fromlow-grade manganese ore using oxalic acid as reductant in sulphuricacid solution. Hydrometallurgy 2001, 62, 157–163.
50. Naik, P.K.; Sukla, L.B.; Das, S.C. Aqueous SO2 leaching studies onNishikhal manganese ore through factorial experiment. Hydrometal-lurgy 2000, 54, 217–228.
51. Schultz, M.K.; Inn, K.G.W.; Lin, Z.C.; Burnett, W.C.; Smith, G.; Bie-galski, S.R.; Filliben, J. Identification of radionuclide partitioning insoils and sediments: determination of optimum conditions for theexchangeable fraction of the NIST standard sequential extractionprotocol. Appl Radiat Isot 1998, 49(9–11), 1289–1293.
52. Carter, C.W., Jr.; Doublie, S.; Coleman, D.E. Quantitative analysis ofcrystal growth: Tryptophanyl-tRNA synthetase crystal polymorphismand its relationship to catalysis. J Mol Biol 1994, 238, 346–365.
53. Becerra, M.; Gonzalez Siso, M.I. Yeast b-galactosidase in solid-statefermentations. Enzyme Microbial Technol 1996, 19, 39–44.
54. Asanza Teruel, M.L.; Gontier, E.; Bienaime, C.; Nava Saucedo, J.E.;Barbotin, J.-N. Response surface analysis of chlortetracycline andtetracycline production with K-carrageenan immobilized streptomy-ces aureofaciens. Enzyme Microbial Technol 1997, 21, 314–320.
55. Trezona, R.I.; Pickles, M.J.; Hutchings, I.M. A full factorial investiga-tion of the erosion durability of automotive clearcoats. Tribology Int2000, 33, 559–571.
56. Gupte, M.; Kulkarni, P. A study of antifungal antibiotic production byThermomonospora sp MTCC 3340 using full factorial design. J ChemTechnol Biotechnol 2003, 78, 605–610.
57. Mussatto, S.I.; Roberto, I.C. Optimal experimental condition for hemi-cellulosic hydrolyzate treatment with activated charcoal for xylitolproduction. Biotechnol Prog 2004, 20, 134–139.
58. Pan, T.-Y.; Cooper, R.R.; Blair, H.D.; Whalen, T.J.; Nicholson, J.M.Experimental analysis of thermal cycling fatigue of four-layered FR4printed wiring boards. J Electronic Packaging 1994, 116, 76–78.
59. Spedding, T.A.; Wang, Z.Q. Study on modeling of wire EDM process.J Materials Processing Technol 1997, 69(1–3), 18–28.
60. Lloyd, F.A. Parameters contributing to power loss in disengaged wetclutches. Soc Automotive Engineers Trans 1974, 83, 2498–2507.
61. Daniel, C. Use of half-normal plots in interpreting factorial two-levelexperiments. Technometrics 1959, 1, 311–341.
62. Lenth, R.V. Quick and easy analysis of unreplicated factorials. Tech-nometrics 1989, 31-4, 469–473.
© 2006 Wiley Periodicals, Inc. C O M P L E X I T Y 45DOI 10.1002/cplx