Embed Size (px)
Citation preview

Regulation of Muscle
Glucose Uptake
David Wasserman
Light Hall Rm. 823
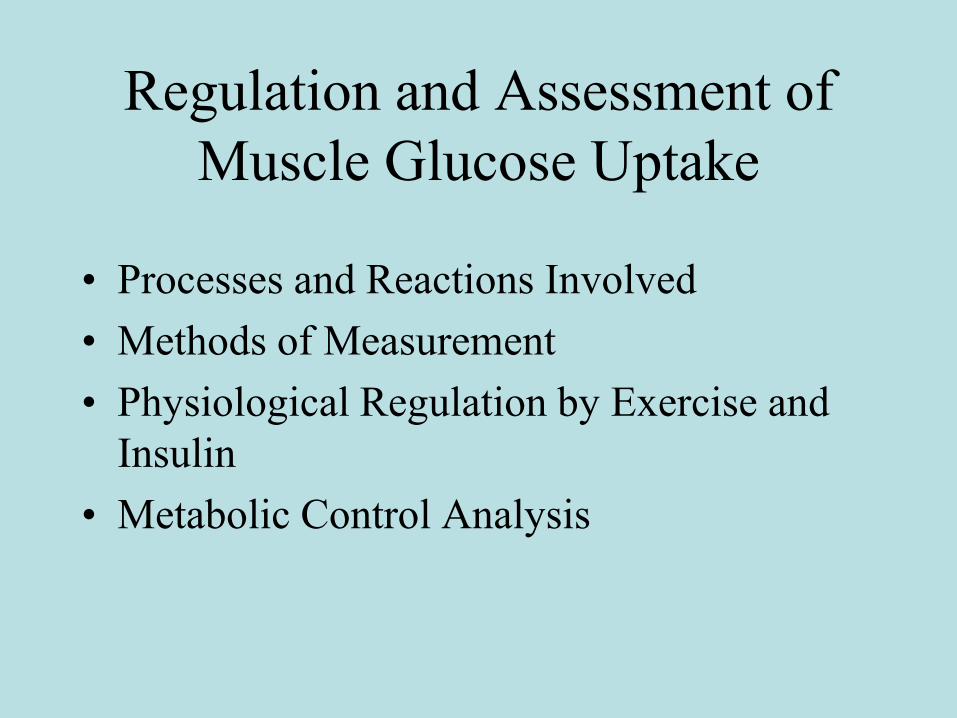
Regulation and Assessment of
Muscle Glucose Uptake
• Processes and Reactions Involved
• Methods of Measurement
• Physiological Regulation by Exercise and
Insulin
• Metabolic Control Analysis

To Understand Glucose Metabolism In Vivo,
One must Understand Regulation by Muscle
• Muscle is ~90% of insulin
sensitive tissue
• Muscle metabolism can
increase ~10x in response
to exercise
• Muscle is a major site of
insulin resistance in
diabetes
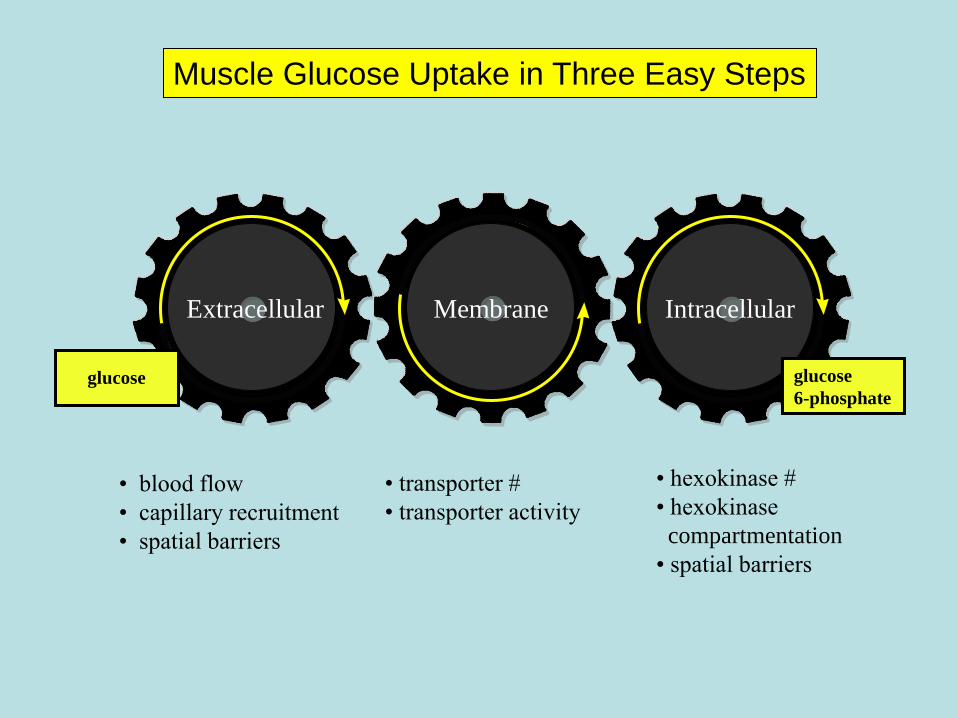
• blood flow
• capillary recruitment
• spatial barriers
Extracellular Membrane
• hexokinase #
• hexokinase
compartmentation
• spatial barriers
Intracellular
glucose
6-phosphateglucose
• transporter #
• transporter activity
Muscle Glucose Uptake in Three Easy Steps

InsideOutside
Glc 6-P
Glycogen
Synthesis
Glycolysis
GlcGlc
(-)
HK II
Glucose is not “officially” taken up by
muscle until it is phosphorylated. Glucose
phosphorylation traps carbons in the muscle
and primes it for metabolism.
GLUT4GLUT1

Feedback Inhibition of HK II by Glc 6-P
distributes Control of Muscle Glucose
Uptake to Glycogen Synthesis/Breakdown
and Glycolytic Pathways
d[Glc 6-P]/dt = FluxHK + FluxPhos
- FluxGS - FluxGly
Regulation and Assessment of
Muscle Glucose Uptake
• Processes and Reactions Involved
• Methods of Measurement
• Physiological Regulation by Exercise and
Insulin
• Metabolic Control Analysis
Tools for Studying Muscle
Glucose Uptake in vivo
• Why in vivo?
• Why conscious?
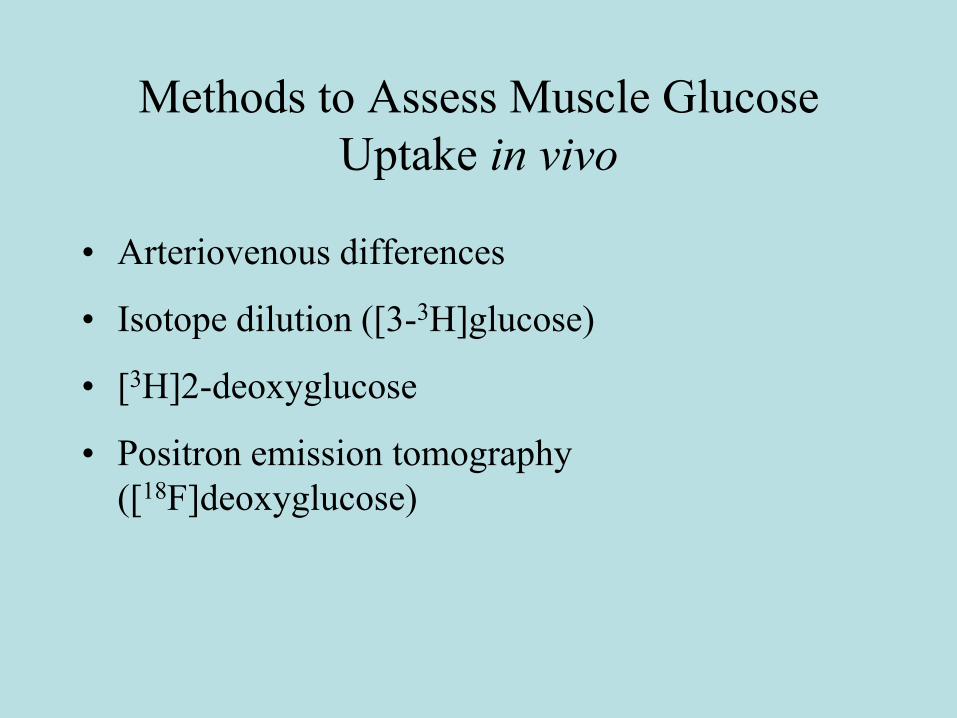
Methods to Assess Muscle Glucose
Uptake in vivo
• Arteriovenous differences
• Isotope dilution ([3-3H]glucose)
• [3H]2-deoxyglucose
• Positron emission tomography
([18F]deoxyglucose)

Arteriovenous Differences
• Multiple measurements over time
• Invasive, but applicable to human subjects
• Requires accurate blood flow measure
• Not applicable to small animals
• Sensitive analytical methods are needed to measure small arteriovenous difference

Isotope dilution ([3-3H]glucose)
• Minimal invasiveness
• Applicable to human subjects
• Applicable with 6,6[2H]glucose also
• Whole body measure; not muscle specific

[3H]2-deoxyglucose
• Sensitive
• Tissue specific
• 2-deoxyglucose metabolism may differ from that for glucose
• Usually single endpoint measure
• Generally not applied to people.
2DG2DG 2DG-P
Intracellular
WaterExtracellular
Water

Positron emission tomography
([18F]deoxyglucose)
• Minimal invasiveness
• Applicable to human subjects
• 2-deoxyglucose metabolism may differ from that for glucose
• Single point derived from curve fitting/compartmental analysis
• Requires expensive equipment
• ROI must be stationary (i.e. cannot study during exercise)

Regulation and Assessment of
Muscle Glucose Uptake
• Processes and Reactions Involved
• Methods of Measurement
• Physiological Regulation by Exercise and
Insulin
• Metabolic Control Analysis

You can‟t Study Muscle Glucose Metabolism
in vivo without a Sensitizing Test
Reason: In the fasted, non-exercising state
muscle glucose metabolism is too low.
Sensitizing Tests: Insulin clamp, Exercise
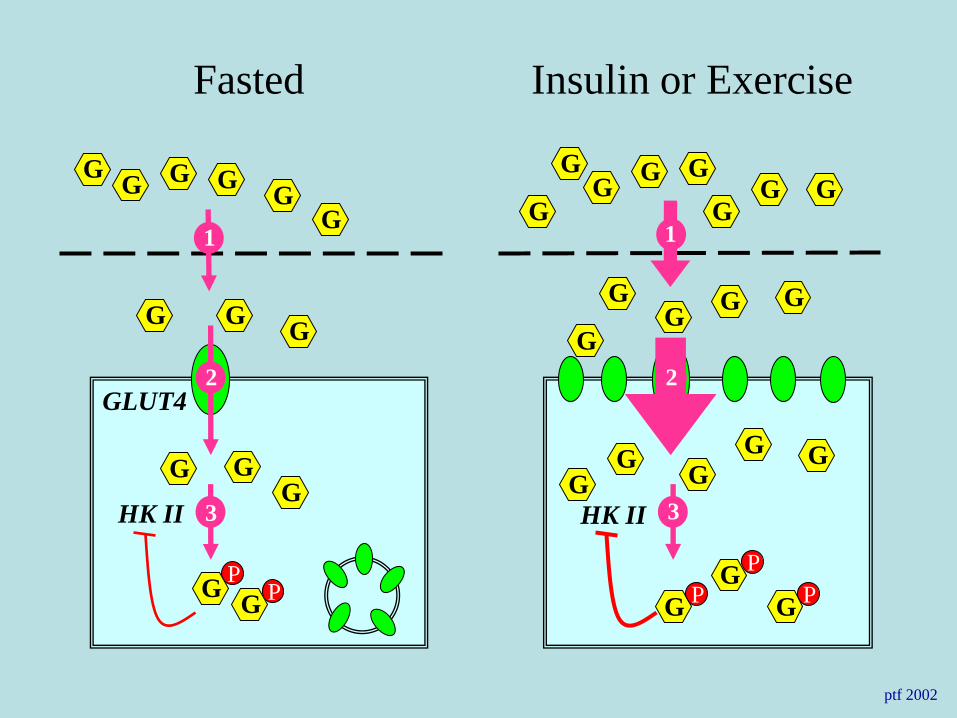
HK II 3
1
2
HK II
GLUT4
3
2
1
G
ptf 2002
Fasted Insulin or Exercise
G GG
G G
GG
G
GGG
PG P
G
GG G G
G G
G G
GG
G G
G
GG
G GG
PG
PG
PG

Basal Insulin Contractions Insulin +
Contractions
0
4
8
12
0
1
2
3
4
5
Soleus
Cell Surface
GLUT4 Content
pmol/(g wet wt)
µmol/(ml•hr)
From Lund et al. PNAS 92: 5817, 1995
Relationship of Muscle Cell Surface GLUT4
to Uptake of a Glucose Analog
Soleus
3-O-methylglucose
Uptake
Insulin signals the translocation
of GLUT4 to the cell membrane
by a series of protein
phosphorylation rxns

GLUT4
Translocation
Glucose Insulin-
stimulated
Muscle
I
IRS-1 P85 P110
PI3K
P
P PDK1
PIP2 PIP3
AKT
mTOR GSK3
stimulate
gly syn
stimulate
protein syn
P
P

Exercise and Insulin act through
Different Mechanisms
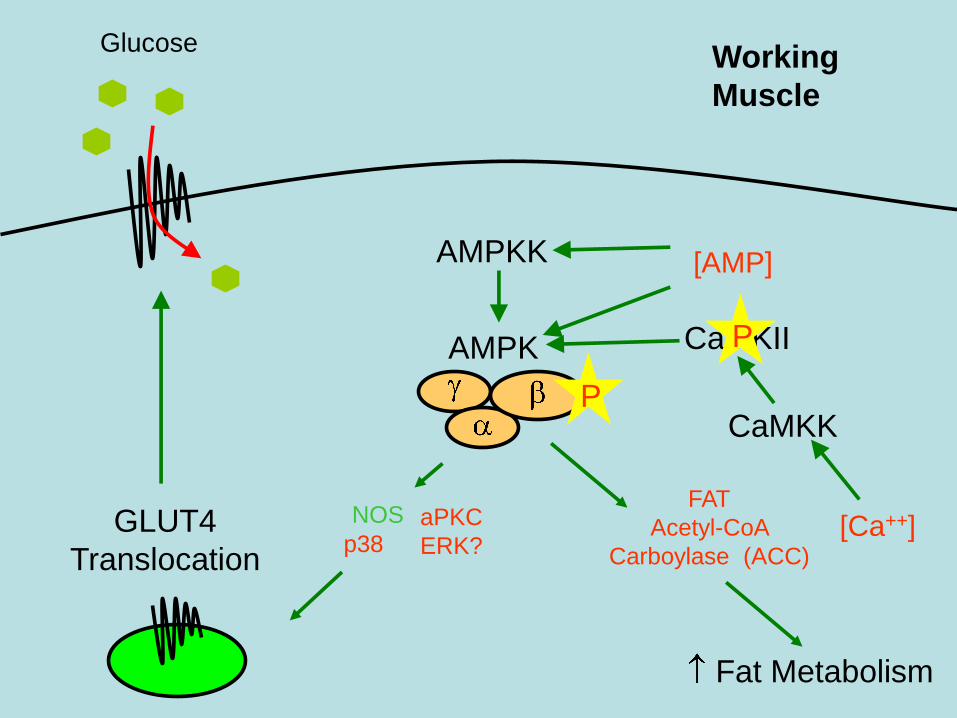
GLUT4
Translocation
Glucose
AMPKK
AMPK
Working
Muscle
NOS aPKC
ERK?p38
FAT
Acetyl-CoA
Carboylase (ACC)
Fat Metabolism
P
[AMP]
CaMKK
CaMKII
[Ca++]
P
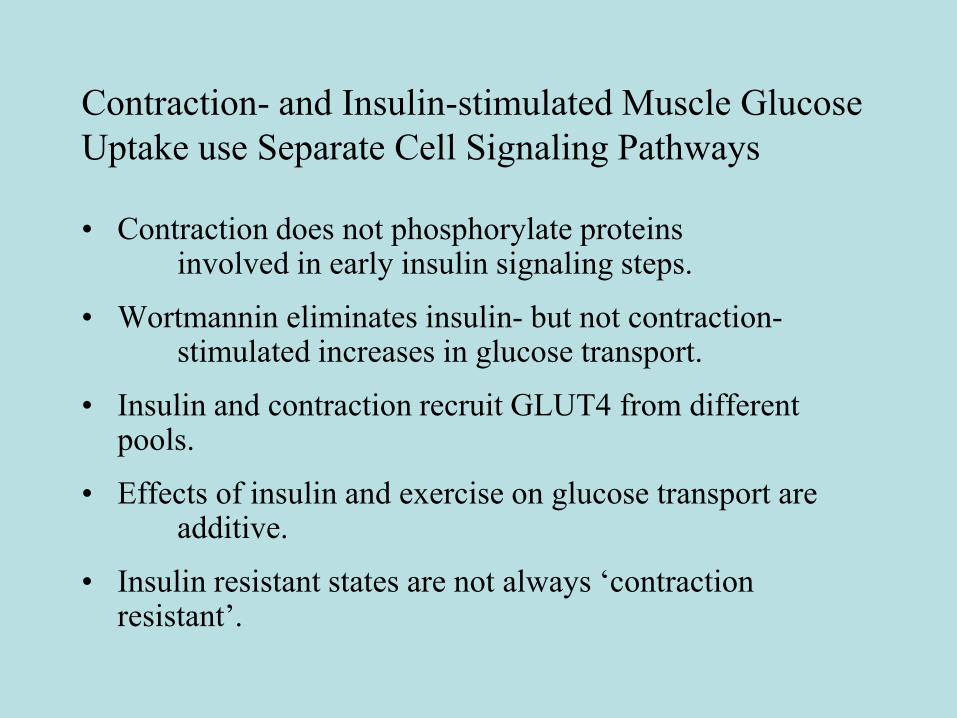
Contraction- and Insulin-stimulated Muscle Glucose
Uptake use Separate Cell Signaling Pathways
• Contraction does not phosphorylate proteins involved in early insulin signaling steps.
• Wortmannin eliminates insulin- but not contraction-stimulated increases in glucose transport.
• Insulin and contraction recruit GLUT4 from different pools.
• Effects of insulin and exercise on glucose transport are additive.
• Insulin resistant states are not always „contraction resistant‟.
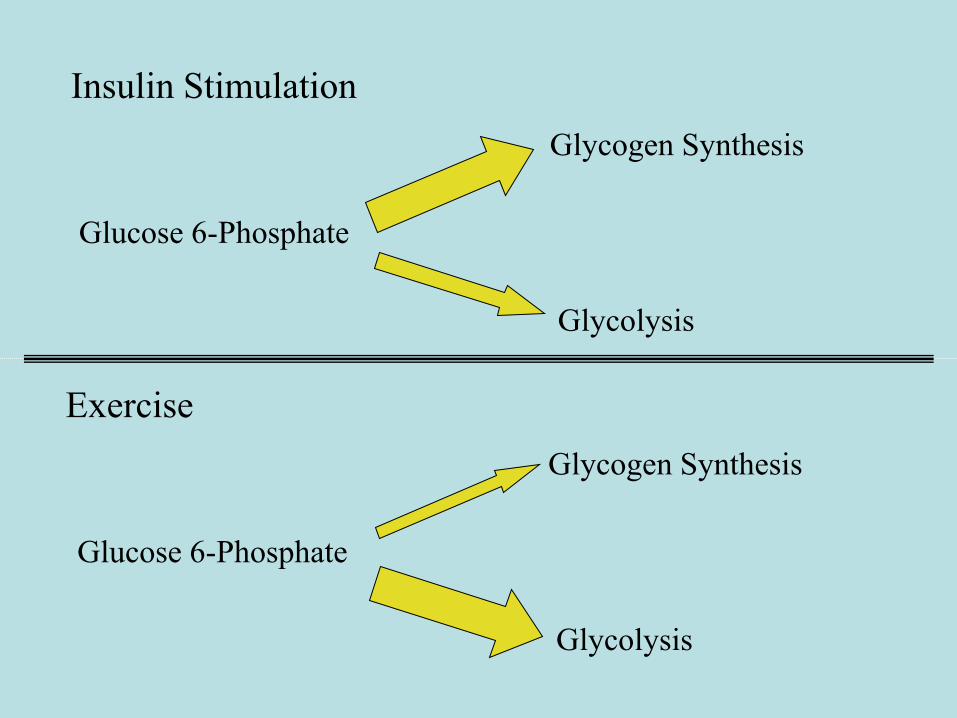
Glucose 6-Phosphate
Glycogen Synthesis
Glycolysis
Insulin Stimulation
Glucose 6-Phosphate
Glycogen Synthesis
Glycolysis
Exercise

Somatostatin (SRIF) infusion creates an insulin-free
environment
Basal Exercise
SRIF plusInsulin
SRIF minusInsulin
Control
Time (min) 10 30 60 90
10 ± 1 8 ± 1 7 ± 2 7 ± 1 6 ± 1
<2<2 <2<2<2
13 ± 1 10 ± 2 9 ± 1 9 ± 2 7 ± 1
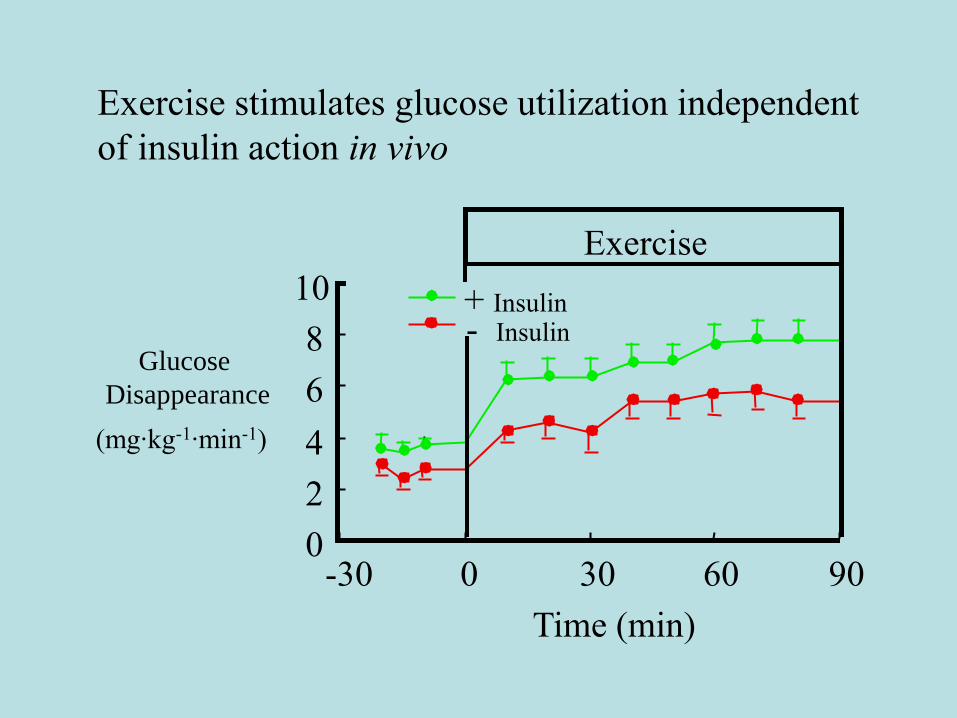
Exercise stimulates glucose utilization independent
of insulin action in vivo
0
2
4
6
8
10
-30 0 30 60 90
Time (min)
Glucose
Disappearance
(mg·kg-1·min-1)
+ Insulin- Insulin
Exercise
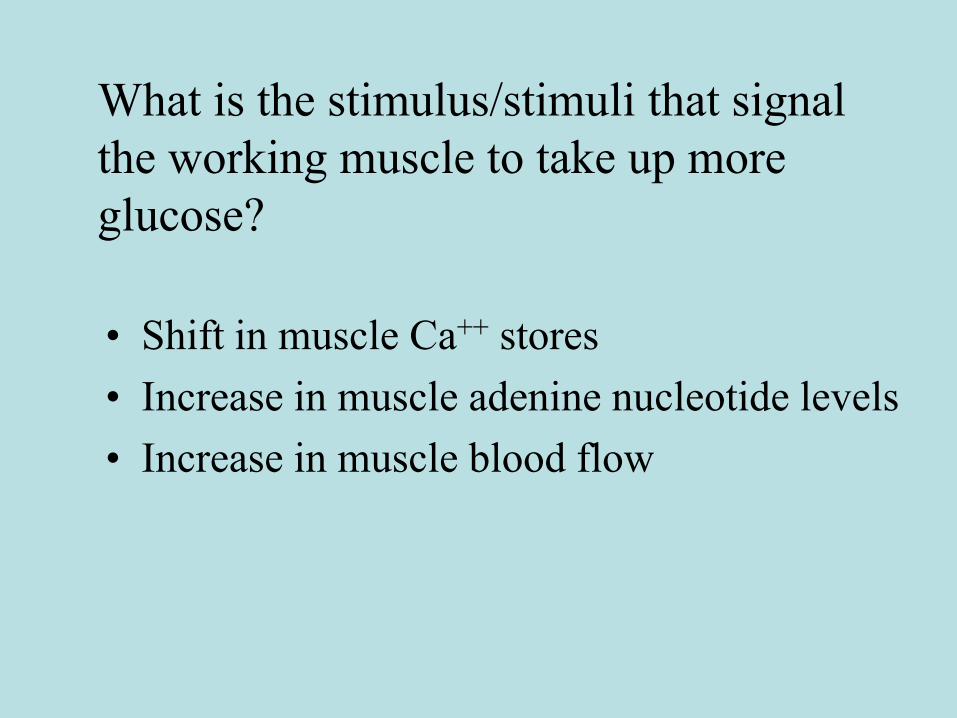
What is the stimulus/stimuli that signal
the working muscle to take up more
glucose?
• Shift in muscle Ca++ stores
• Increase in muscle adenine nucleotide levels
• Increase in muscle blood flow
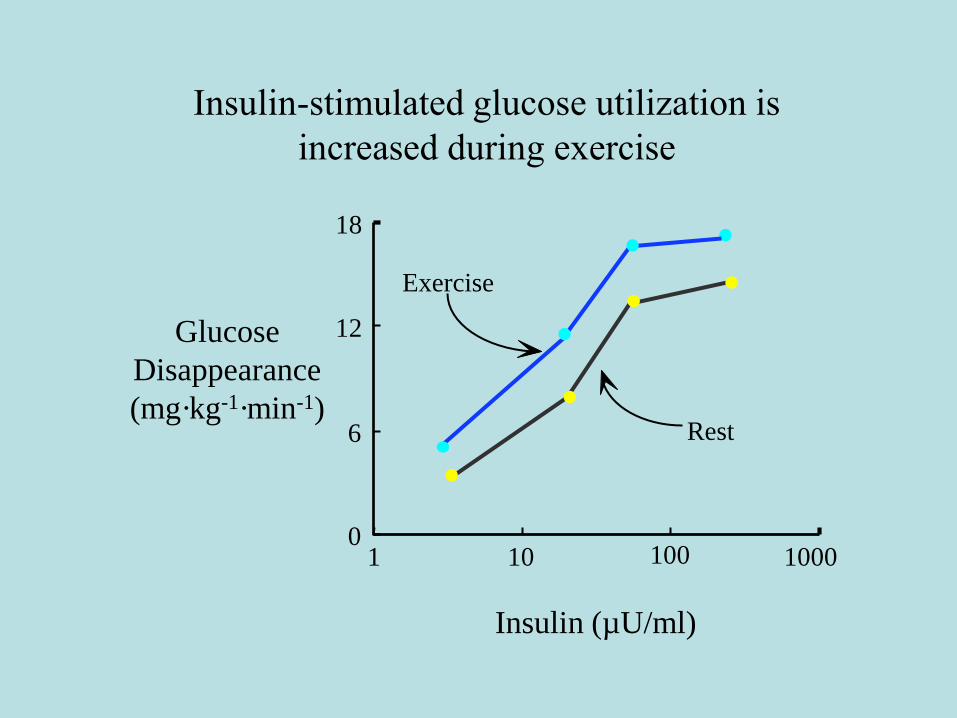
Insulin-stimulated glucose utilization is
increased during exercise
0
6
12
18
10 100 1000
Insulin (µU/ml)
Glucose
Disappearance
(mg·kg-1·min-1)Rest
1
Exercise

Proposed mechanisms by which acute exercise
enhances insulin sensitivity
• Increased muscle blood flow
• Increased capillary surface area
• Direct effect on working muscles
• Indirect effect mediated by insulin-induced suppression of FFA levels

Regulation and Assessment of
Muscle Glucose Uptake
• Processes and Reactions Involved
• Methods of Measurement
• Physiological Regulation by Exercise and
Insulin
• Metabolic Control Analysis

Muscle Glucose Uptake (MGU) Requires Three Steps
HK II
GLUT4Intracellular
Blood
Extracellular
3
2
1 Delivery
Phosphorylation
Transport
G GG
GP
GP
ptf 2002
G
G
GG GG G
G G GG
GG
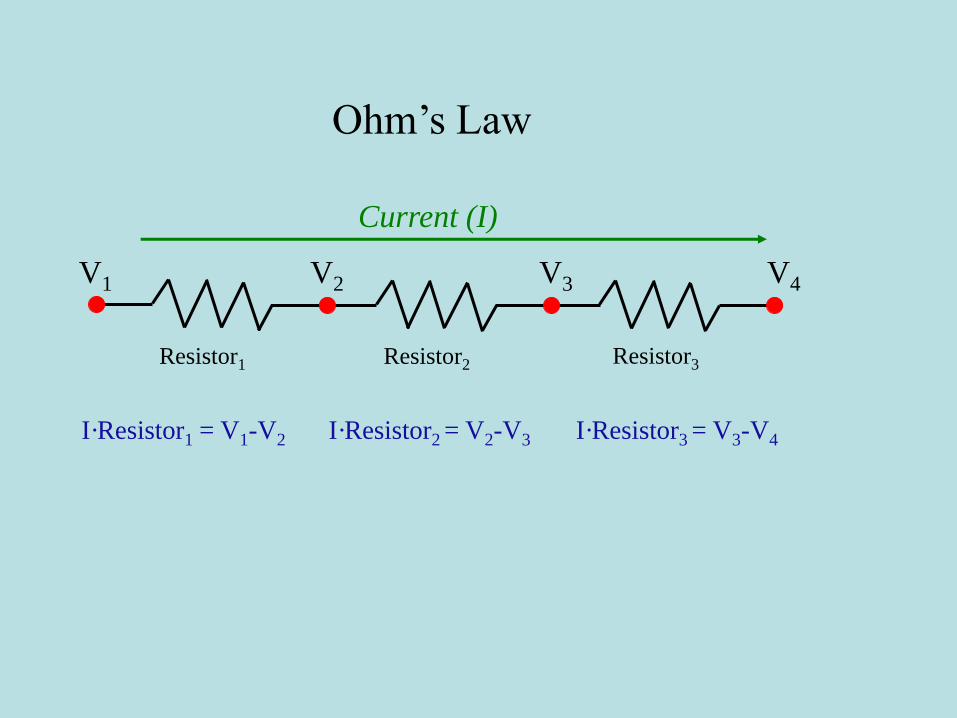
Ohm‟s Law
V1 V2 V3 V4
Resistor1 Resistor3Resistor2
Current (I)
I·Resistor1 = V1-V2 I·Resistor2 = V2-V3 I·Resistor3 = V3-V4
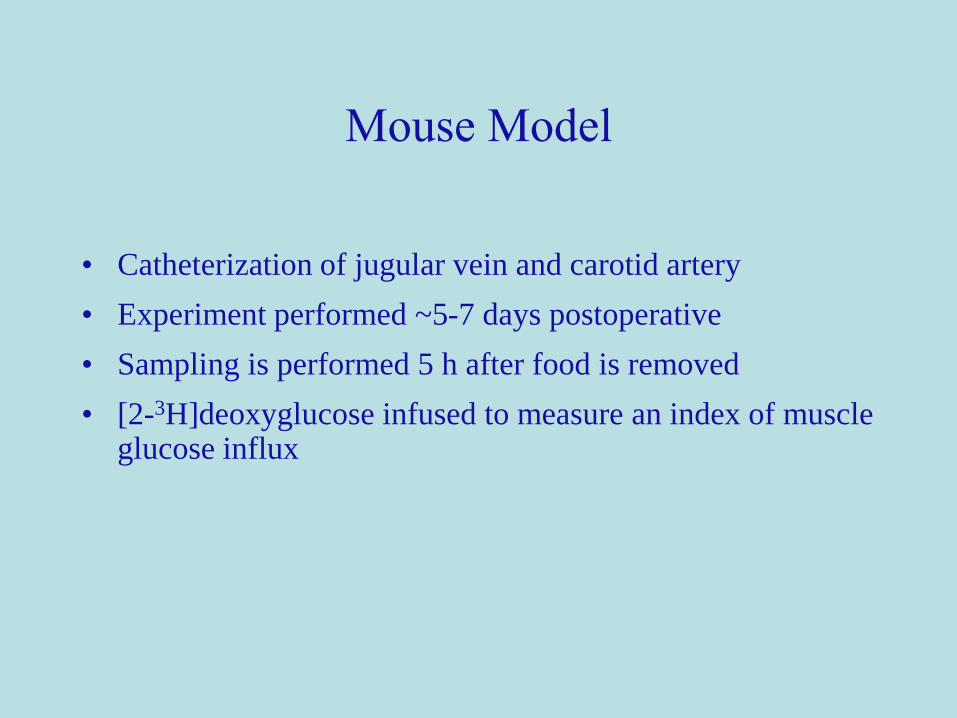
Mouse Model
• Catheterization of jugular vein and carotid artery
• Experiment performed ~5-7 days postoperative
• Sampling is performed 5 h after food is removed
• [2-3H]deoxyglucose infused to measure an index of muscle glucose influx

Excise
Tissues
Acclimation Insulin (0 or 4 mU·kg-1·min-1)
Euglycemic Clamp
[2-3H]DG
Bolus
-150 30 min0-90 5
Hyperinsulinemic Euglycemic Clamp
Mice are 5 h fasted at the time of the clamp

Ohm‟s Law
Ga Ge Gi 0
Glucose Influx
WT
GLUT4Tg
HKTg
GLUT4Tg
HKTg
Transgenics
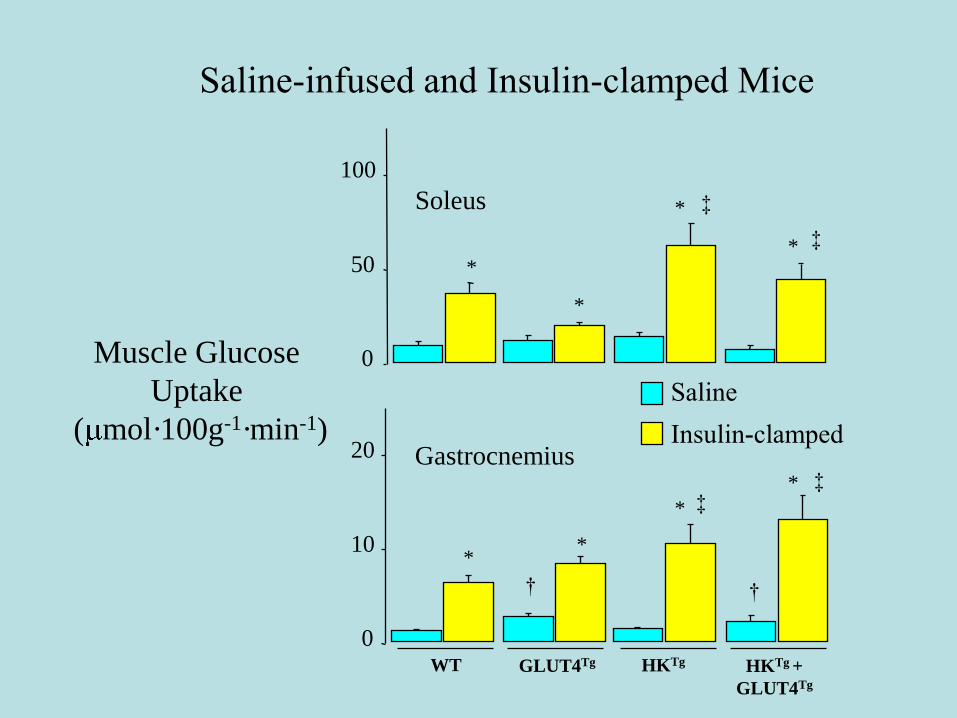
Saline-infused and Insulin-clamped Mice
Saline
Insulin-clamped
0
50
100
Soleus
0
10
20 Gastrocnemius
WT
*
*
GLUT4Tg
*
*
†
HKTg
*
* ‡
‡
HKTg +
GLUT4Tg
*
* ‡
‡
†
Muscle Glucose
Uptake
( mol·100g-1·min-1)
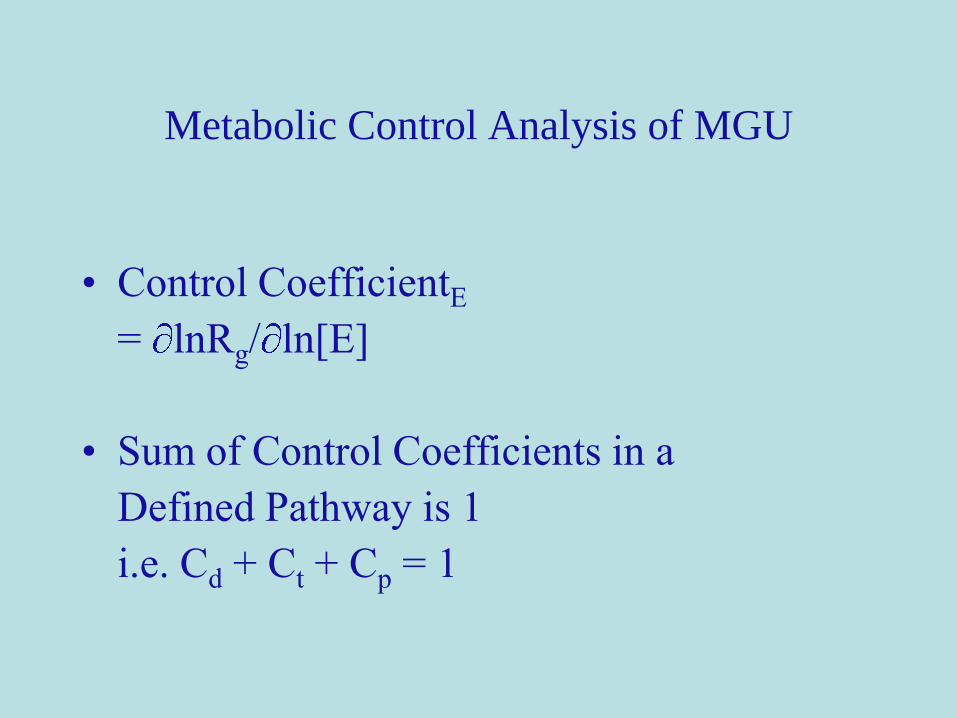
Metabolic Control Analysis of MGU
• Control CoefficientE
= lnRg/ ln[E]
• Sum of Control Coefficients in a
Defined Pathway is 1
i.e. Cd + Ct + Cp = 1

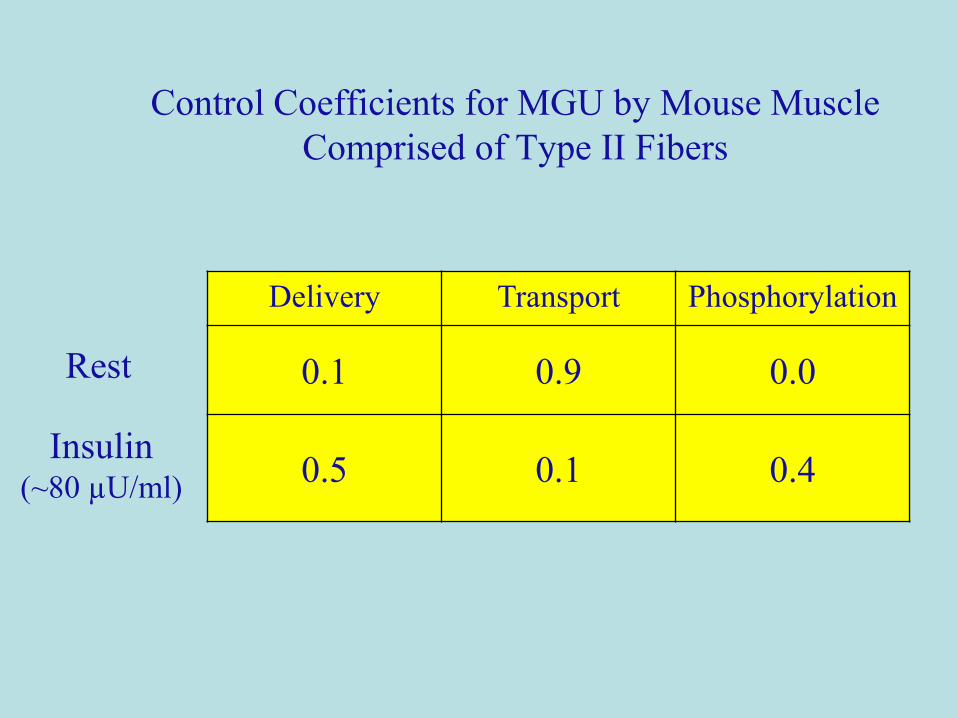
Control Coefficients for MGU by Mouse Muscle
Comprised of Type II Fibers
Delivery Transport Phosphorylation
0.1 0.9 0.0
0.5 0.1 0.4
Rest
Insulin(~80 µU/ml)
Control Coefficients for MGU by Mouse Muscle
Comprised of Type II Fibers
Delivery Transport Phosphorylation
0.1 0.9 0.0
0.5 0.1 0.4
Rest
Insulin(~80 µU/ml)

HK II 3
1
2
HK II
GLUT4
3
2
1
G
ptf 2002
Fasted Insulin
G GG
G G
GG
G
GGG
PG P
G
GG G G
G G
G G
GG
G G
G
GG
G GG
PG
PG
PG

Functional Barriers to
MGU during Exercise
Extracellular Membrane Intracellular
glucose
6-phosphateglucose
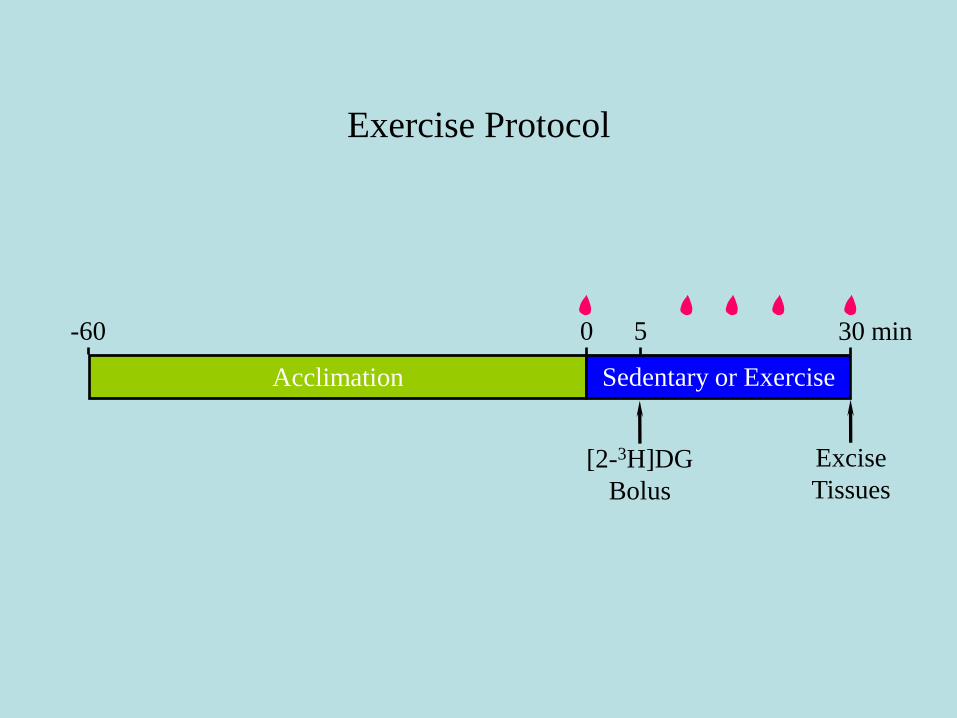
Exercise Protocol
Acclimation Sedentary or Exercise
-60 30 min50
[2-3H]DG
Bolus
Excise
Tissues

Sedentary and Exercising Mice
0
20
40
0
10
20
*
Muscle Glucose
Uptake
( mol·100g-1·min-1)
Sedentary
Exercise
SVL
Gastrocnemius
0
50
100Soleus
*
†
†
*
GLUT4Tg
*
WT
*
† *
† *
† *
HKTg
+ GLUT4Tg
HKTG
† *
† *
† *

Control Coefficients for MGU by Mouse Muscle
Comprised of Type II Fibers
Delivery Transport Phosphorylation
0.1 0.9 0.0
0.5 0.1 0.4
Rest
Insulin(~80 µU/ml)
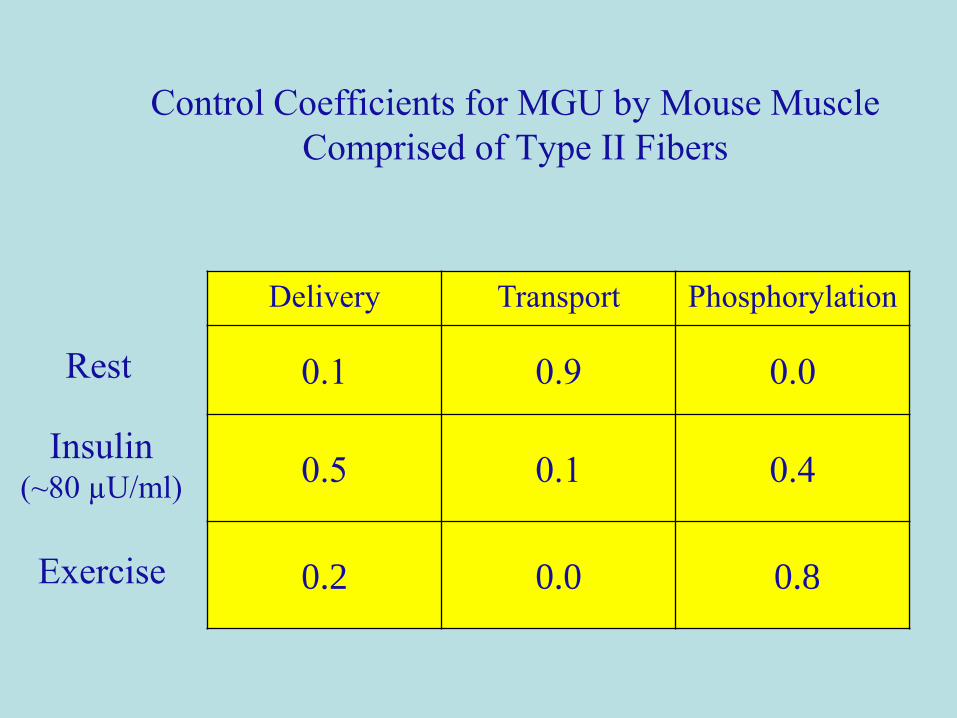
Control Coefficients for MGU by Mouse Muscle
Comprised of Type II Fibers
Delivery Transport Phosphorylation
0.1 0.9 0.0
0.5 0.1 0.4
0.2 0.0 0.8
Rest
Insulin(~80 µU/ml)
Exercise
HK II 3
1
2
HK II
GLUT4
3
2
1
G
ptf 2002
Sedentary Exercise
G GG
G G
GG
G
GGG
PG P
G
GG G G
GG
G G
GG
G G
G
GG
G GG
PG
PG
PG

Functional Barriers to
MGU in Dietary Insulin Resistance
Extracellular Membrane Intracellular
glucose
6-phosphateglucose

Saline-infused and Insulin-clamped Mice
Muscle Glucose Uptake
µmol·100g-1·min-1
Insulin -clamped
Saline-infused
Chow Fed
0
5
10
15
*
†*
0
5
10
15
*
†*
WT HKTg
SVL
Gastroc
High Fat Fed
*‡*
** ‡
WT HKTg
Fueger et al. Diabetes. 53:306-14, 2004..
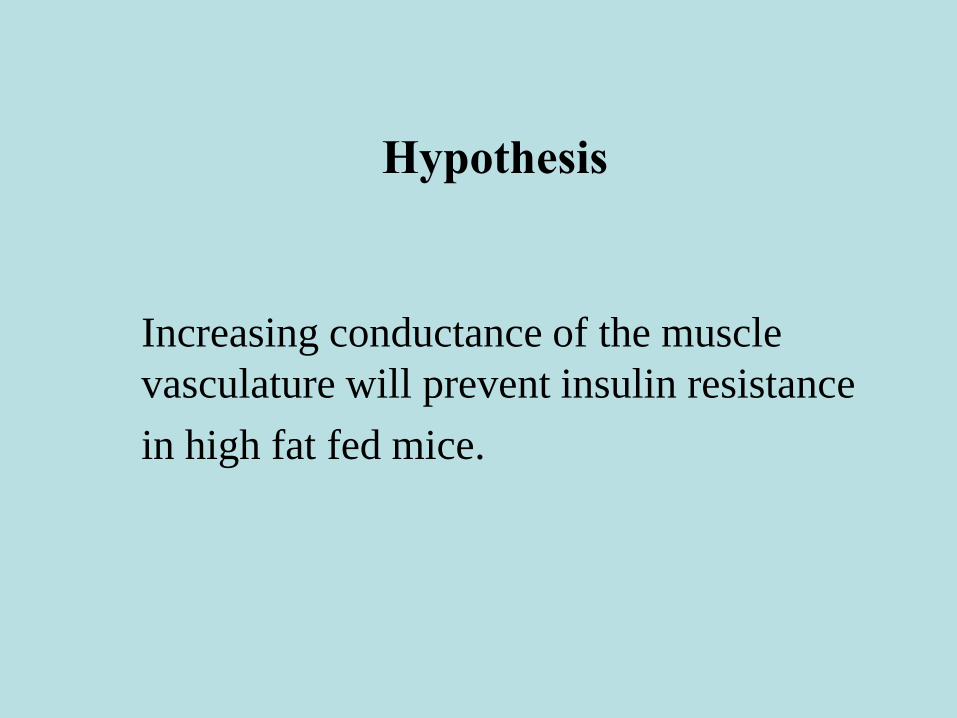
Increasing conductance of the muscle
vasculature will prevent insulin resistance
in high fat fed mice.
Hypothesis
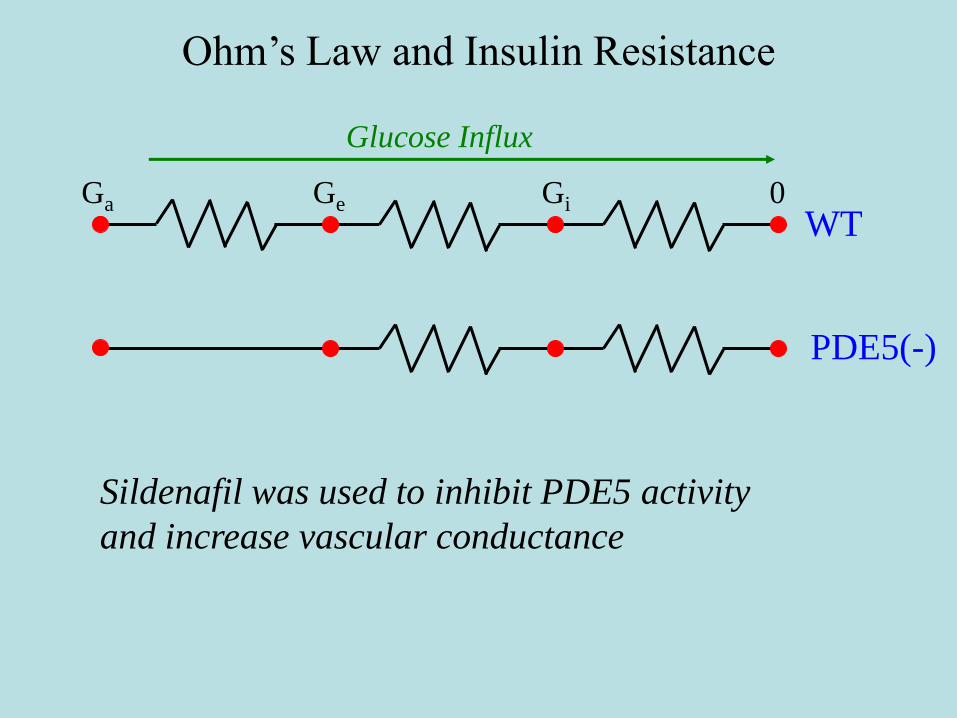
Ohm‟s Law and Insulin Resistance
Ga Ge Gi 0
Glucose Influx
WT
PDE5(-)
Sildenafil was used to inhibit PDE5 activity
and increase vascular conductance
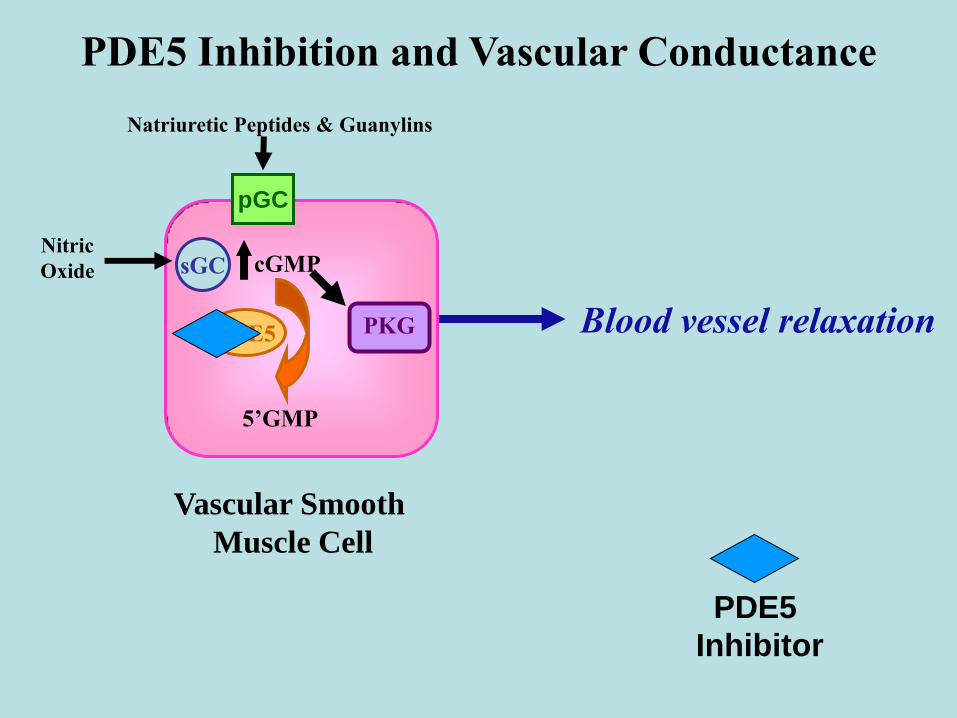
Blood vessel relaxation
PDE5 Inhibition and Vascular Conductance
Nitric
Oxide
PKG
cGMP
5’GMP
Natriuretic Peptides & Guanylins
sGC
pGC
PDE5
PDE5
Inhibitor
Vascular Smooth
Muscle Cell

Index of Glucose Uptake during an
Insulin Clamp in High Fat Fed Mice
Muscle Glucose
Uptake
µmol·100 g tissue-1·min-1
0
50
60
70
80
90
Soleus
10
Gastrocnemius SVL
Vehicle
Sildenafil/L-arginine
*
**
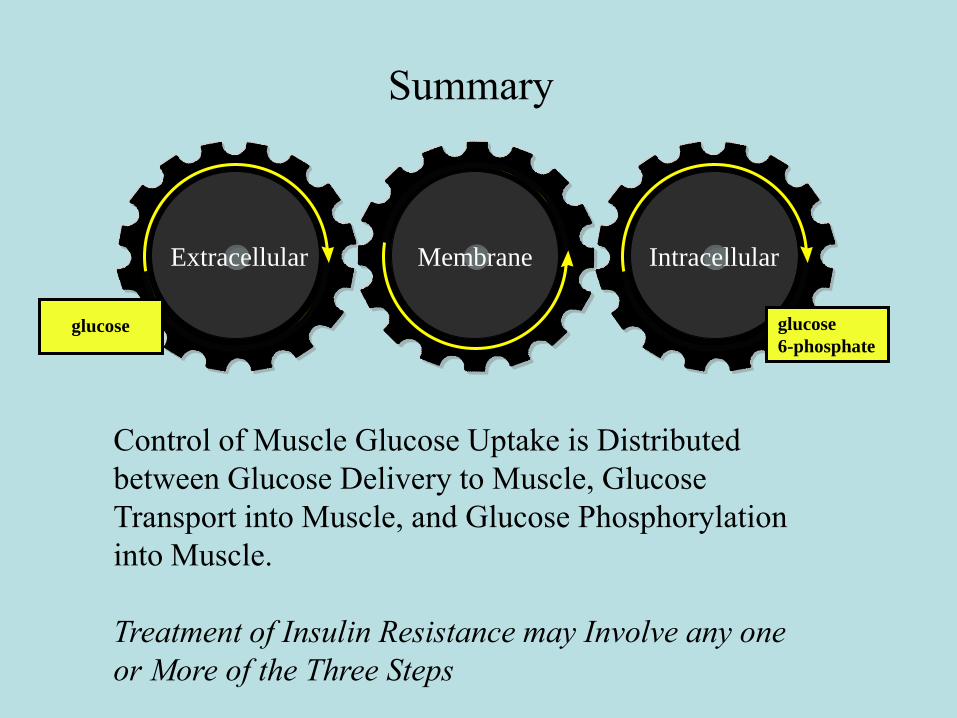
Summary
Extracellular Membrane Intracellular
glucose
6-phosphateglucose
Control of Muscle Glucose Uptake is Distributed
between Glucose Delivery to Muscle, Glucose
Transport into Muscle, and Glucose Phosphorylation
into Muscle.
Treatment of Insulin Resistance may Involve any one
or More of the Three Steps

Gastrocnemius Akt/PKB after an Insulin Clamp
in High Fat Fed Mice
Anti-Akt/PKB
Anti-phospho-
Akt/PKB
Anti-GAPDH
Sildenafil + L-Arginine
Vehicle
0
25
50
75
100
125
Sildenafil/L-arginine Control
Anti-phospho-
Akt/PKB
0
50
100
150
200
Anti-Akt/PKB

An Index of MGU (Rg) in vivo using 2-Deoxy-
[3H]glucose
102
103
104
0 5 10 15 20 25 30
Time (min)
Plasma
[2-3H]DG
(dpm· l-1)
Bolus
[2-3H]DGPtissue (t)
AUC [2-3H] DGplasma• Glucoseplasma
Rg =
ptf 2002
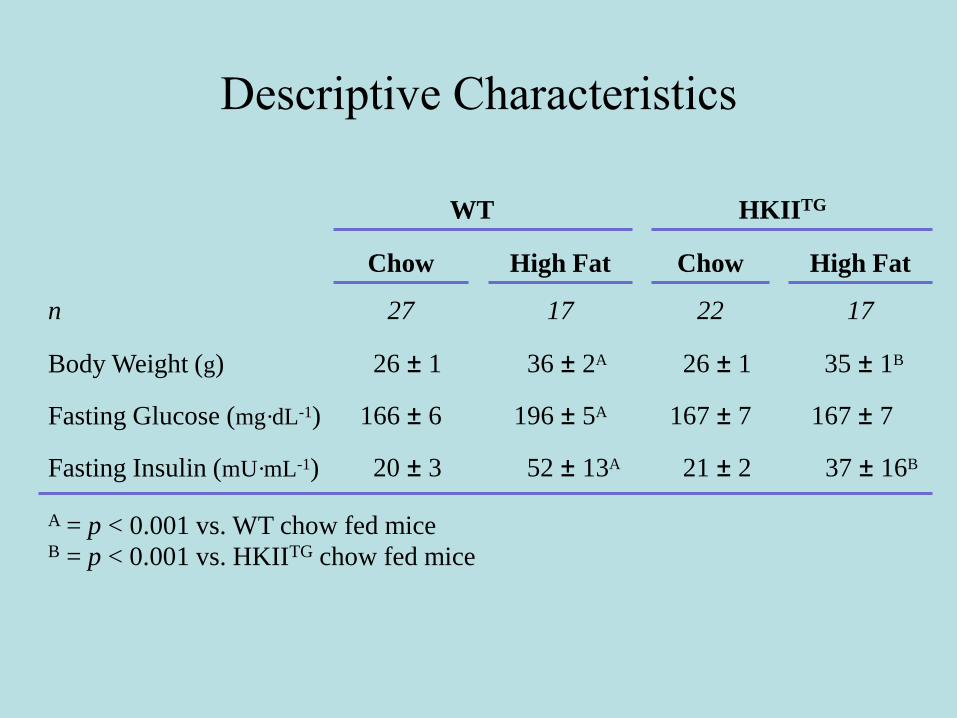
Descriptive Characteristics
B = p < 0.001 vs. HKIITG chow fed mice
A = p < 0.001 vs. WT chow fed mice
20 ± 3Fasting Insulin (mU·mL-1)
166 ± 6Fasting Glucose (mg·dL-1)
26 ± 1Body Weight (g)
27n
Chow
WT
52 ± 13A
196 ± 5A
36 ± 2A
17
High Fat
37 ± 16B
167 ± 7
35 ± 1B
17
High Fat
21 ± 2
167 ± 7
26 ± 1
22
Chow
HKIITG