Embed Size (px)
Citation preview
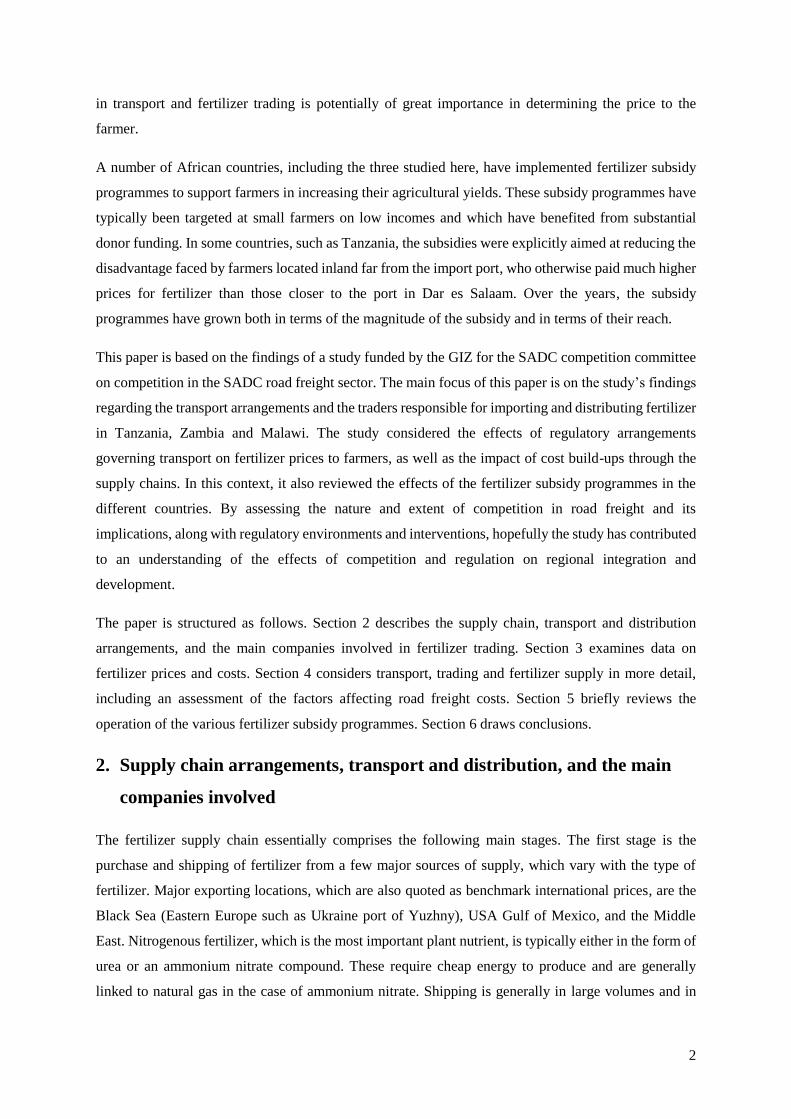
Regulation and rivalry in transport and fertilizer supply in
Malawi, Tanzania and Zambia1
Simon Roberts and Thando Vilakazi
Centre for Competition, Regulation and Economic Development – University of Johannesburg
1. Introduction
Fertilizer is a key input for commercial agriculture. However, there is generally low fertilizer usage in
Sub-Saharan Africa (Africa Fertilizer Organization, 2012: 5) and hardly any production of fertilizer in
countries in Southern and East Africa, aside from South Africa. Studies have emphasised the importance
of transport costs in the price of fertilizer paid by the farmer as well as the detrimental impact of lack
of competition in the trucking sector in increasing prices (see, for example, Gregory & Bumb, 2006).
Many reviews over the years have considered the various reasons for the high costs of road freight in
southern and East Africa, including regulations restricting participation and competition, the role of
national and regional transport associations, inefficient borders and poor roads, and lobbying and rent-
seeking by powerful local transport interests.2 In this paper, we consider the different reasons and their
changing impact over time.
The cost of fertilizer is largely determined by the costs of importing, including all the related transport
and distribution costs and the trader and agro-dealer margins. These will determine how much more a
grain farmer in an African country pays for fertilizer than those in Europe or North America, where
there are large fertilizer producers. Its importance and relatively high cost means that fertilizer has been
estimated to account for between 30% and 50% of the costs of grain and oilseed producers.3
Transport costs add substantially to the cost of fertilizer products, often accounting for 50% of the
delivered price to farmers when including all the related costs and margins, as we discuss below.4
Overland transport is obviously particularly important for landlocked countries such as Malawi and
Zambia, while much of the best arable land in Tanzania is also located inland. The nature of competition
1 This paper draws from a study funded by the GIZ for the SADC competition committee. The study is available at
http://www.competition.org.za/working-papers/. The views expressed here are those of the authors alone. The study
involved a review of desktop research, collation of publicly available data and interviews with key industry participants and
stakeholders. This included face-to-face interviews in Tanzania and Zambia. In addition, interviews were conducted with
international companies and regional transport bodies. Much of the information in the interviews was given under conditions
of confidentiality and, as such, individual interviewees are not always identified. 2 See, for example, Arvis et al. (2010), Ward & Barreto (2011), Raballand & Macchi (2008), Teravaninthorn & Raballand
(2009), and Argent & Milanovic (2014). 3 See, for example, Grain SA Fertilizer Report 2011, for South Africa. 4 Our estimates indicate that transport rates alone (aside from trading margins) from ports to landlocked countries such as
Zambia are as much as $253 per ton, which accounts for more than 30% of the price of fertilizer.
2
in transport and fertilizer trading is potentially of great importance in determining the price to the
farmer.
A number of African countries, including the three studied here, have implemented fertilizer subsidy
programmes to support farmers in increasing their agricultural yields. These subsidy programmes have
typically been targeted at small farmers on low incomes and which have benefited from substantial
donor funding. In some countries, such as Tanzania, the subsidies were explicitly aimed at reducing the
disadvantage faced by farmers located inland far from the import port, who otherwise paid much higher
prices for fertilizer than those closer to the port in Dar es Salaam. Over the years, the subsidy
programmes have grown both in terms of the magnitude of the subsidy and in terms of their reach.
This paper is based on the findings of a study funded by the GIZ for the SADC competition committee
on competition in the SADC road freight sector. The main focus of this paper is on the study’s findings
regarding the transport arrangements and the traders responsible for importing and distributing fertilizer
in Tanzania, Zambia and Malawi. The study considered the effects of regulatory arrangements
governing transport on fertilizer prices to farmers, as well as the impact of cost build-ups through the
supply chains. In this context, it also reviewed the effects of the fertilizer subsidy programmes in the
different countries. By assessing the nature and extent of competition in road freight and its
implications, along with regulatory environments and interventions, hopefully the study has contributed
to an understanding of the effects of competition and regulation on regional integration and
development.
The paper is structured as follows. Section 2 describes the supply chain, transport and distribution
arrangements, and the main companies involved in fertilizer trading. Section 3 examines data on
fertilizer prices and costs. Section 4 considers transport, trading and fertilizer supply in more detail,
including an assessment of the factors affecting road freight costs. Section 5 briefly reviews the
operation of the various fertilizer subsidy programmes. Section 6 draws conclusions.
2. Supply chain arrangements, transport and distribution, and the main
companies involved
The fertilizer supply chain essentially comprises the following main stages. The first stage is the
purchase and shipping of fertilizer from a few major sources of supply, which vary with the type of
fertilizer. Major exporting locations, which are also quoted as benchmark international prices, are the
Black Sea (Eastern Europe such as Ukraine port of Yuzhny), USA Gulf of Mexico, and the Middle
East. Nitrogenous fertilizer, which is the most important plant nutrient, is typically either in the form of
urea or an ammonium nitrate compound. These require cheap energy to produce and are generally
linked to natural gas in the case of ammonium nitrate. Shipping is generally in large volumes and in

3
2011 to 2014 sea freight to ports along the East African coast cost around $50/ton. Sasol and Omnia in
South Africa both produce ammonium nitrate based fertilizers from ammonia made by Sasol as part of
its liquid fuels production, which uses coal and natural gas from Mozambique as feedstock. In this case
the transport is from Secunda located around 100km from Johannesburg.
The second stage is the processing of the fertilizer at the port of entry, where it is transported from the
port into warehouses and packaged into 50kg bags at some point, either at the port or in a bagging
facility in the warehouse. Fertilizer can be imported already bagged, but shipping is cheaper in bulk
form. The third stage is when the fertilizer is transported from warehouses to agro-dealers, possibly
through depots and inland warehouses, and then sold to farmers. This happens almost via road freight.
The scale required for organising cost-effective shipments along with the financing means that a small
number of international traders typically control the importing of fertilizer. These traders then supply
through a local distribution network or sell on to local fertilizer distribution businesses.
It is important to note that traders may incorporate some of the transport, logistics and storage operations
in-house or they may sub-contract these services. Operating as an effective competitor at the trading
level requires the ability to undertake this bundle of functions cost-effectively.
In Tanzania, fertilizer for farmers is imported through the only major port in the country, Dar es Salaam.
This port is also used for some fertilizer that is transported to Malawi and Zambia. However, most of
the fertilizer for these two countries is shipped through Durban despite it being a longer overland
distance. (The distance from Lusaka to Dar es Salaam is 1951km compared with 2143km to Durban
and 1048km to Beira.)
This means that road transport costs from South Africa through Zimbabwe or Botswana to Zambia and
Malawi are critical for ensuring access to fertilizer at competitive prices. While investment in upgrading
the port of Beira in Mozambique has meant some fertilizer being shipped through it in 2013 and 2014,
to supply Malawi, the volumes have remained very small.
Transport and distribution: Road freight
The demand for road freight is closely linked to the performance of a country’s economy as measured
by economic growth and trade flows. Tanzania and Zambia have both recorded economic growth rates
of 6% to 10% in most years since the mid-2000s, while Malawi has had much lower and more volatile
economic growth peaking at around 9% in 2009 and dropping to 1.9% by 2012. The Southern and East
African region as a whole has seen rapidly increased volumes of trade in the decade from 2002 to 2012,
almost all by road, because of the poor overall rail infrastructure. Perhaps the most significant feature
of the trade data presented below is the growth of the DRC as a trade partner for both Zambia and
Tanzania, in terms of both exports and imports (Figure 1), albeit from a low base.

4
This high level of economic growth in Tanzania and Zambia is linked to an increase in the demand for
road transportation of goods. This is also associated with substantial increases in regional trade flows.
In Zambia, the growth in overall exports and demand for goods has attracted a large number of
companies (including foreign firms) to the market and truckers make decisions on the rates they will
charge on the basis of whether they will have a return load or not.
Tanzania has seen an increase in both imports and exports. Export figures show that demand for goods
by neighbours has increased (Figure 2), including for goods to transit through Tanzania (29% of port
traffic in Dar es Salaam is bound for landlocked countries). Zambia is a major user of the Dar es Salaam
port among land-linked countries as it contributes 47% to total transit traffic (TPA, 2013: 32).
Figure 1: Tanzania merchandise exports to neighbouring countries, 1995-2012
Source: UNCTAD
Zambia’s trade has increased dramatically over the ten years from 2005/6, including that with countries
in the region. Most notably the level of exports, particularly to neighbouring countries (e.g. DRC) has
increased substantially in the period from 2005/6 (Figure 2). Increased trade has been driven primarily
by the surge in exports to the DRC following the end of the civil war in that country, as well as the
recovery in the global copper demand and price, which affects the economies of both the DRC and
Zambia.
0
50
100
150
200
250
19
95
19
96
19
97
19
98
19
99
20
00
20
01
20
02
20
03
20
04
20
05
20
06
20
07
20
08
20
09
20
10
20
11
20
12
Exp
ort
s (
millio
ns o
f d
ollars
)
Burundi DRC Kenya Malawi
Mozambique Rwanda Uganda Zambia

5
While South Africa is not a direct neighbour, it has been the largest African export destination in most
years. This is significant as it means greatly increased freight along the major route from the DRC and
Zambia through Zimbabwe to and from South Africa (Johannesburg and Durban). Zambia’s exports to
Malawi and Zimbabwe have also increased significantly in recent years since 2008, both driven by
increases in the exports of food items and manufactured goods. The growth in regional imports to
Zambia has been mainly from South Africa, followed by large increases also from the DRC.
Figure 2: Zambia exports to neighbouring countries, 1995-2012
Source: UNCTAD
The sustained and very substantial increases in trade flows on the part of Tanzania and Zambia have
had a major impact on the volume of road freight. This has been greatest along the routes to, and
through, South Africa to Durban harbour. However, there have also been significant increases to Dar
es Salaam, Beira and Nacala. Greater volumes can mean increased investment in trucks, coupled with
more efficient and larger scale freight operations, along with more competition.
It is widely accepted that the price of road transportation in different regions in Africa is high relative
to other regions in the world (Gregory & Bumb, 2006; Raballand & Macchi, 2008: 4; Teravaninthorn
& Raballand, 2009). Road transport is the main mode of freight in intra-African trade (UNCTAD,
2009), however the average price of transport in Africa still represents 7.7 per cent of total export value,
which is twice the world average of 3.7 percent. (UNCTAD, 2013). These high costs have been assessed
0
100
200
300
400
500
600
700
199
5
199
6
199
7
199
8
199
9
200
0
200
1
200
2
200
3
200
4
200
5
200
6
200
7
200
8
200
9
201
0
201
1
201
2
Ex
po
rts (
mil
lio
ns
of
do
lla
rs)
Angola Botswana DRC
Malawi Mozambique Namibia
Zimbabwe South Africa Tanzania
6
as significant contributing factors towards low agricultural productivity (Guo et al, 2009; Adamopoulos,
2011) and as an obstacle to economic growth (Raballand & Macchi, 2008).
There is an important distinction between transport prices and transport costs (Raballand & Macchi,
2008). Transport costs can be defined as the costs that the transporter incurs when transporting cargo,
whereas transport prices are the rates charged by a transport company or forwarder to the shipper or
importer (Raballand & Macchi, 2008: 2). In this regard, transport costs are not abnormally high in Sub-
Saharan Africa, but transport prices are high on some corridors (Raballand & Macchi, 2008). Several
studies have tried to explain why the prices might be high compared to other regions in the world. One
reason offered by Raballand & Macchi (2008: 3) is that official and unofficial market regulation and
the structure of trucking services markets, especially in West and Central Africa, contribute to very high
prices. Similarly, Argent & Milanovic (2014) suggest that within the coastal countries of East Africa,
for instance Tanzania, there are powerful trucking lobbies that seek to maintain control over the
functions and rules governing the trucking industry.
One underlying reason for this rent-seeking behaviour is that it is a function of the small market size in
the case of landlocked countries compared to coastal countries (see Arvis et al, 2010). Importers have
low bargaining power in relation to powerful groups at ports and along transport routes to landlocked
countries, and are also susceptible to rent-seeking within their own borders where, for example,
authorities could exploit the limited opportunities to take advantage of importers. In the case of
fertilizer, we are considering importers among which are large multinational corporations. Along with
governance and rent-seeking behaviour, Ward & Barreto (2011) found that high costs are driven by
factors such as: industry structure and low levels of competition between service providers; low
productivity in the trucking industry due to infrastructure constraints; and, the regulation of regional
and international trade in transport services.
The main fertilizer importing and production companies
While there appear to be large numbers of suppliers, when the main traders were examined, it was found
that fertilizer trading in the region consists of a small number of multinational importers that operate in
more than one country, led by Yara and the Export Trading Group (ETG), along with a few significant
domestic importers in each country. Yara (formerly Norsk Hydro), based in Norway, is one of the
largest manufacturers and suppliers of fertilizer in the world. ETG started in 1967 in Kenya and operates
as a trader of agricultural commodities and inputs with operations across 30 African countries. It is
vertically integrated into transport, including trucking, and has a logistics arm – PHL Africa – which
transports fertilizer and agricultural produce. It has registered rapid growth in the past three years in
Tanzania, Zambia, Malawi and Rwanda, with a bulk blending plant in Zambia.
7
In Tanzania, ETG and Yara are considered to be the largest importers in a fertilizer market of roughly
400 000 tons in 2013. Estimates of their market shares vary, between 25% and 40% each, suggesting
that their collective share is around 60-70%. The higher estimates are shares of nitrogenous fertilizer,
which makes a difference in Tanzania as there is a local producer of phosphates, Minjingu. Other
suppliers of nitrogenous imported fertilizer include STACO, with around 10% share, the state-owned
Tanzania Fertilizer Company and Premium Agro Chem.
The Zambian market has historically been dominated by Omnia and Nyiombo, with collective shares
estimated to be around 70-80% in 2009 in a fertilizer market of roughly 540 000 tons.5 ETG and
Greenbelt have grown strongly in recent years, while Nyiombo has lost a substantial share. According
to one of the major fertilizer companies, estimated shares for commercial sales only (not subsidised
sales) in 2013/14 were: Omnia 30%; Greenbelt 30%; ETG 10%; Nyiombo 7%; Zambian Fertilizers 6%;
and others 17%.6 There has also been an increase in smaller firms, including those set up by ex-
employees of fertilizer companies. This may also be linked to the end of the cartel arrangements
between Omnia and Nyiombo, which were found by the Competition and Consumer Commission of
Zambia (CCPC) to have rigged government contracts for fertilizer supply between 2007 and 2011.7
The CCPC found Omnia Zambia Limited and Nyiombo Investments Limited to have rigged
government contracts for fertilizer supply between 2007 and 2011.8 The two firms were fined over $20
million for the conduct which was found to have largely affected the supply of fertilizer to farmers
under the government’s fertilizer subsidy programme, involving the allocation of geographic markets
and price fixing. Omnia and Nyiombo have in recent years also been linked to allegations of fraudulent
relations with the government agents that are in charge of facilitating the tender process in the Zambian
Public Procurement Authority and Ministry of Agriculture.9
In Malawi there have been a number of suppliers, with market positions changing according to the
companies which have been awarded volumes under the subsidy programme. Agricultural Resources
Ltd (ARL) is the sole distributor of Yara’s products in Malawi. ETG has grown it share. Omnia and
5 Competition and Consumer Protection Commission estimates in conjunction with the International Fertilizer Development
Centre (IFDC), based on the number of people surveyed that were using a particular brand of fertilizer and not the total volumes
of fertilizer sold in the country. 6 It is not clear how these shares were estimated so closely unless the fertilizer association is collecting sales data from market
participants. 7 http://www.zambia-weekly.com/media/zambia_weekly_2013_-_wk_38.pdf. Also see CCPC (2013). Both Tanzania and
Zambia have a fertilizer subsidy programme which provides roughly one third of fertilizer into the market. 8 http://www.zambia-weekly.com/media/zambia_weekly_2013_-_wk_38.pdf 9 See, for example, ‘Government broadens FISP tender process' (18 April 2012), at: http://www.postzambia.com/post-read_article.php?articleId=26958; and ‘Corruption deal backfires’ (18 December 2013), at: http://zambiadailynation.com/2013/12/18/corruption-deal-backfires/; and ‘PAC questions govt over Nyiombo Investments, Omnia’s contracts’ (25 March 2010), at: http://www.postzambia.com/Joomla/post-read_article.php?articleId=7395.

8
Nyiombo both have a presence. The Malawi Fertilizer Company, part of the Farmers World Group,
blends and supplies NPK compounds.
Overall, the structure of the market at the level of fertilizer traders has an important impact on the
outcomes at the road transportation level of the market. For instance, in cases where the fertilizer
company is vertically integrated with a transport operation (as with ETG), it is able to internalise the
margins typically earned by transport companies when the service is outsourced. On the other hand,
when fertilizer companies outsource road transport services they can play a significant role in
stimulating (or chilling) price competition between transport companies. For example, during the study,
one of the large fertilizer companies in Zambia stated that it will generally contract one large trucking
firm to facilitate its imports through Beira to Zambia (including clearing).
3. The pricing of fertilizer
This part of the chapter focuses on the prices of Urea and Calcium Ammonium Nitrate (CAN) for the
period May 2010 to April 2014, the period for which data was available for the study (Figures 3 and 4).
Urea and CAN were chosen as good products to compare across the countries due to the availability of
data and the usage of these products in each country. The pricing data reflect the national average prices
in each country derived from monthly agro-dealer/retailer-level surveys.10
Three general observations from the study can be made regarding average national prices of fertilizer
across the countries: First, throughout the period the prices of urea in the three countries were
substantially above the benchmark international price, reflecting each country’s position as an importer.
Prices were at least $200/ton higher from May 2010 to mid-2011, and then more than $400/ton higher
thereafter. While international prices decreased from mid-2011, prices in the countries studied
continued to increase, meaning that the gap between international and national prices widened. One
possible explanation for this could be that the costs of sea freight and insurance increased significantly
in this period as well. However, the Baltic Freight Index, which tracks prices in international shipping
costs over time, reflected decreasing costs from early 2010, albeit with some fluctuations.11
Second, the increases in urea prices in Zambia and Malawi were greater in the first half of 2011,
compared to increases in Tanzania at the end of that year. The same pattern is reflected in CAN prices
(Figure 4). This is consistent with higher transit costs as Zambia and Malawi are both landlocked
countries, with relatively long overland transit distances from the ports. While international fuel prices
10 AMITSA compiles the data by conducting surveys in the capital city as well as in towns in each of the key agricultural
production areas in a country. The data reflects the national average of the list prices obtained from this network of agro-
dealers who provide the information to AMITSA on a voluntary basis. Where there are gaps in the data, they reflect periods
when insufficient data inputs were received for those months. 11 See NAMC Markets and Economic Research Centre, Input Cost Monitoring February 2014; available:
http://www.namc.co.za/upload/Trends-in-selected-Agricultural-input-prices-February-2014.pdf [Accessed: May 2014]

9
did indeed increase by around one-third from early 2010 to early 2011, there are other possible
explanations, including domestic factors. These are explored in greater detail below.
Third, the Zambian prices of both urea and CAN recorded a significant change relative to the other
countries between 2010/11 and 2013. For both urea and CAN, the study revealed that Zambian prices
in 2010 were in line with those of its landlocked neighbour, Malawi, and substantially above the prices
in Tanzania, which has its own major port. However, in 2012 and 2013, the Zambian prices shifted to
be in line with prices in Tanzania. This is in contrast to the expectation that prices would be higher in
Zambia in a way that at least reflects the additional transport distance and thus the cost that is required
to take fertilizer from the ports to the Zambian end-user.
Figure 3: Urea monthly (national average delivered) prices, 2010-201412
Source: www.amitsa.org ; World Bank (MIDAS)
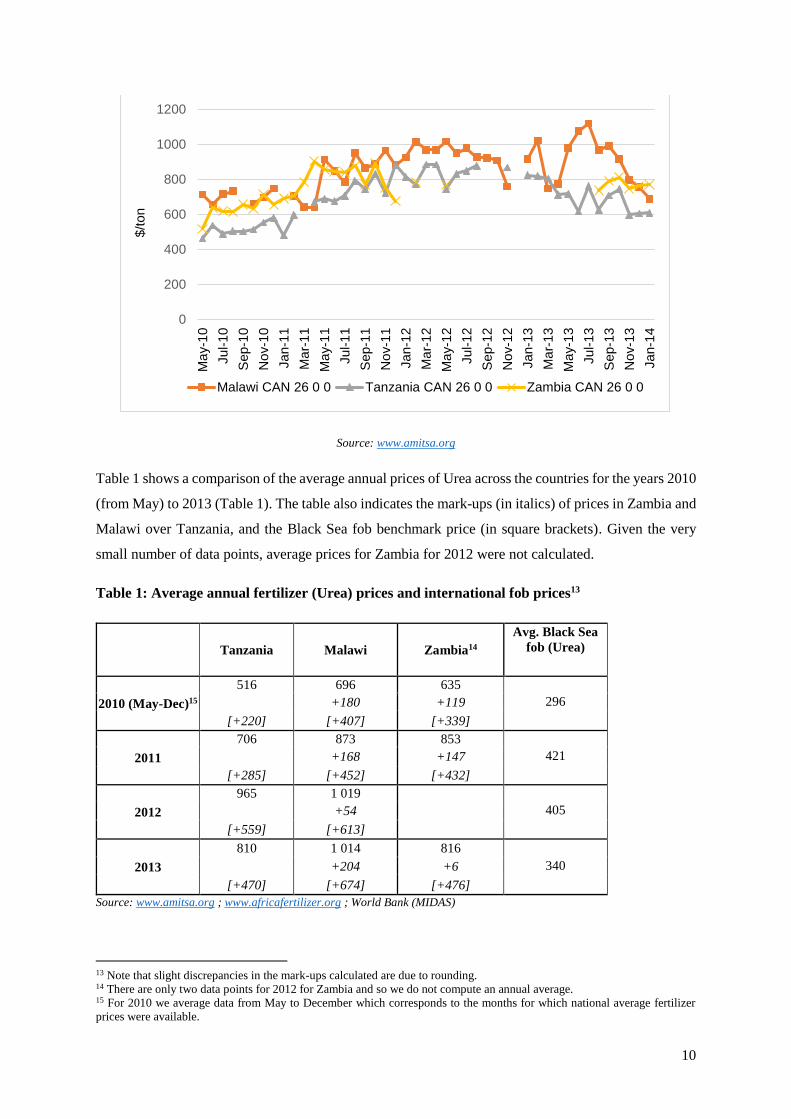
Figure 4: CAN monthly prices, 2010-2014
12 We have removed outliers in the data where the value is different by more than 50% (absolute value) from the value in the
previous or next month for which data is available. For example, Zambian Urea prices showed an outlier of $1702/ton in
January 2012, and another outlier of $1619/ton in June 2012 while Zambian CAN prices showed an outlier of $1477/ton in
January 2012, and another outlier of $1579/ton in June 2012.
0
200
400
600
800
1 000
1 200
1 400
Ma
y-1
0
Jul-1
0
Sep-1
0
No
v-1
0
Jan-1
1
Ma
r-1
1
Ma
y-1
1
Jul-1
1
Sep-1
1
No
v-1
1
Jan-1
2
Ma
r-1
2
Ma
y-1
2
Jul-1
2
Sep-1
2
No
v-1
2
Jan-1
3
Ma
r-1
3
Ma
y-1
3
Jul-1
3
Sep-1
3
No
v-1
3
Jan-1
4
Ma
r-1
4
$/ton
Malawi TanzaniaZambia E. Europe, bulk fobTanzania (own calc)
10
Source: www.amitsa.org
Table 1 shows a comparison of the average annual prices of Urea across the countries for the years 2010
(from May) to 2013 (Table 1). The table also indicates the mark-ups (in italics) of prices in Zambia and
Malawi over Tanzania, and the Black Sea fob benchmark price (in square brackets). Given the very
small number of data points, average prices for Zambia for 2012 were not calculated.
Table 1: Average annual fertilizer (Urea) prices and international fob prices13
Tanzania Malawi Zambia14
Avg. Black Sea
fob (Urea)
2010 (May-Dec)15
516 696 635
+180 +119 296
[+220] [+407] [+339]
2011
706 873 853
+168 +147 421
[+285] [+452] [+432]
2012
965 1 019
+54 405
[+559] [+613]
2013
810 1 014 816
+204 +6 340
[+470] [+674] [+476]
Source: www.amitsa.org ; www.africafertilizer.org ; World Bank (MIDAS)
13 Note that slight discrepancies in the mark-ups calculated are due to rounding. 14 There are only two data points for 2012 for Zambia and so we do not compute an annual average. 15 For 2010 we average data from May to December which corresponds to the months for which national average fertilizer
prices were available.
0
200
400
600
800
1000
1200
Ma
y-1
0
Jul-1
0
Sep-1
0
No
v-1
0
Jan-1
1
Ma
r-1
1
Ma
y-1
1
Jul-1
1
Sep-1
1
No
v-1
1
Jan-1
2
Ma
r-1
2
Ma
y-1
2
Jul-1
2
Sep-1
2
No
v-1
2
Jan-1
3
Ma
r-1
3
Ma
y-1
3
Jul-1
3
Sep-1
3
No
v-1
3
Jan-1
4
$/ton
Malawi CAN 26 0 0 Tanzania CAN 26 0 0 Zambia CAN 26 0 0

11
As illustrated above, the margin by which the average prices to farmers were above the international
benchmark increased over the period. However, the prices in Malawi increased by much more than in
Tanzania and Zambia. In the case of Zambia, one would expect prices to be higher than Tanzania
because of the inland location. While this was the case in 2011, in 2013 the average price in Zambia
was very close to that in Tanzania in 2013 (at just $6/ton difference) from margins of $119/ton over
Tanzania in 2010 and $147/ton in 2011.
Assuming the fob costs are the same for each country (as well as handling and port costs) then the
Tanzanian prices were relatively high. This could point to the costs of transportation within Tanzania
and/or anti-competitive practices in the fertilizer market. The Malawian prices also appear very high,
as the overland distances are similar to those in Zambia. Conversely, in Zambia, after increasing in
2011, in line with Tanzania and Malawi, prices dropped relative to its neighbours.
Factors that may have contributed to this include a number of important developments in Zambia, which
have opened up the market to greater rivalry at the levels of both road transport and fertilizer trading.
Zambia has also prosecuted a cartel in fertilizer trading, which lasted until 2011, as mentioned above.
The comparison to the international benchmark suggests a combination of improvements in Zambia on
the one hand, and a worsening situation in Tanzania and Malawi on the other, where prices increased
substantially from 2011 to 2012 relative to international prices.
Another part of the price component of the study involved imputing competitive prices for urea in 2013
against which to assess the mark-ups in Tanzania and Malawi. To do this, the average delivered price
for South Africa as a relatively competitive price in a country with a major port was used (Table 2). For
a landlocked country, the researchers added the transport rate from Johannesburg to Lusaka of
$110/ton.16 It is important to note that the South African price is an average price for sales to farmers
across the country and hence already includes local delivery transport within South Africa. This
calculation shows that average prices in Zambia were even lower in 2013 than the competitive prices
by $3/ton, suggesting that we have been conservative and the competitive benchmark should be lower
by at least this amount (Table 3). The exercise suggests that the prices in Tanzania were too high (by
around $100/ton against the South Africa price) and the Malawi prices were too high by $200/ton.
Table 2: Port and landlocked country price benchmarks, 2013
Competitive port country fertilizer price $709 per ton (South Africa)
Competitive transport rate $110 per ton (Johannesburg to Lusaka)
Competitive landlocked fertilizer price $819 per ton (Zambia)
Source: Own calculations based on interview data and average pricing data
16 Interview with Truck Company. This was the rate at which they stated that they could break-even on a trip from the
Copperbelt to Johannesburg.
12
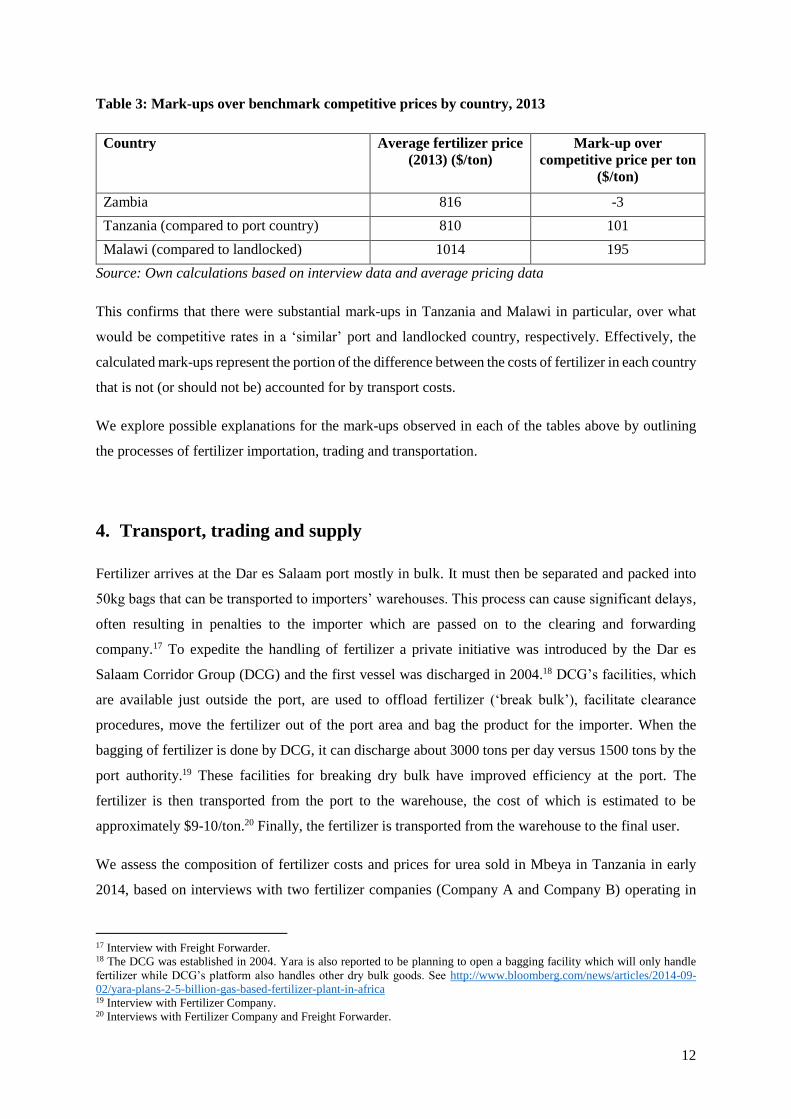
Table 3: Mark-ups over benchmark competitive prices by country, 2013
Country Average fertilizer price
(2013) ($/ton)
Mark-up over
competitive price per ton
($/ton)
Zambia 816 -3
Tanzania (compared to port country) 810 101
Malawi (compared to landlocked) 1014 195
Source: Own calculations based on interview data and average pricing data
This confirms that there were substantial mark-ups in Tanzania and Malawi in particular, over what
would be competitive rates in a ‘similar’ port and landlocked country, respectively. Effectively, the
calculated mark-ups represent the portion of the difference between the costs of fertilizer in each country
that is not (or should not be) accounted for by transport costs.
We explore possible explanations for the mark-ups observed in each of the tables above by outlining
the processes of fertilizer importation, trading and transportation.
4. Transport, trading and supply
Fertilizer arrives at the Dar es Salaam port mostly in bulk. It must then be separated and packed into
50kg bags that can be transported to importers’ warehouses. This process can cause significant delays,
often resulting in penalties to the importer which are passed on to the clearing and forwarding
company.17 To expedite the handling of fertilizer a private initiative was introduced by the Dar es
Salaam Corridor Group (DCG) and the first vessel was discharged in 2004.18 DCG’s facilities, which
are available just outside the port, are used to offload fertilizer (‘break bulk’), facilitate clearance
procedures, move the fertilizer out of the port area and bag the product for the importer. When the
bagging of fertilizer is done by DCG, it can discharge about 3000 tons per day versus 1500 tons by the
port authority.19 These facilities for breaking dry bulk have improved efficiency at the port. The
fertilizer is then transported from the port to the warehouse, the cost of which is estimated to be
approximately $9-10/ton.20 Finally, the fertilizer is transported from the warehouse to the final user.
We assess the composition of fertilizer costs and prices for urea sold in Mbeya in Tanzania in early
2014, based on interviews with two fertilizer companies (Company A and Company B) operating in
17 Interview with Freight Forwarder. 18 The DCG was established in 2004. Yara is also reported to be planning to open a bagging facility which will only handle
fertilizer while DCG’s platform also handles other dry bulk goods. See http://www.bloomberg.com/news/articles/2014-09-
02/yara-plans-2-5-billion-gas-based-fertilizer-plant-in-africa 19 Interview with Fertilizer Company. 20 Interviews with Fertilizer Company and Freight Forwarder.
13
Tanzania and a study by the Tanzania Fertilizer Regulatory Authority (TFRA) (Ngowi, 2013) (Table
4). Mbeya is an agriculturally-active region in southwest Tanzania 828km from Dar es Salaam where
maize, rice and wheat, among other crops, are grown and fertilizer is in high demand.
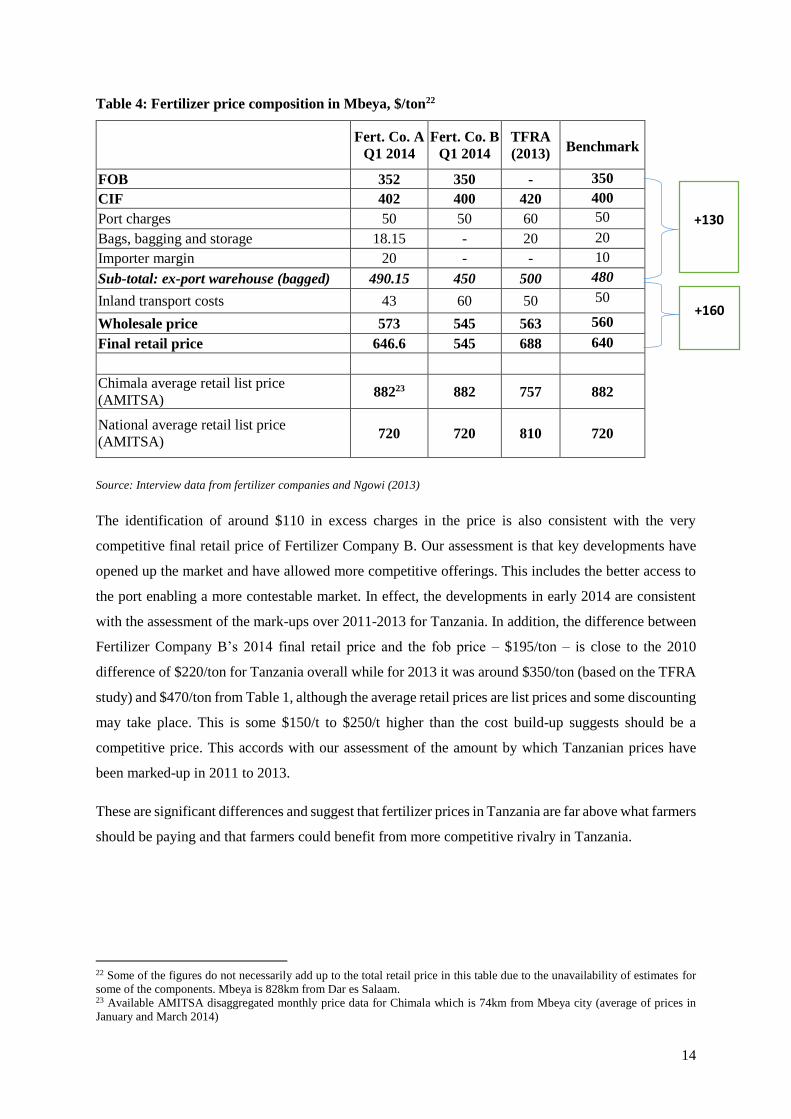
Not surprisingly, as the table shows, the estimates of the fob prices from the two fertilizer companies
and the TFRA are almost identical, as countries are price-takers in an international market. Sea freight
and related costs are around $50/ton, while port charges and bagging add further costs of around $50/ton
and $20/ton, respectively. Together all these costs from the import source (on an fob basis) through the
bagged product in a warehouse ready for local delivery adds around $130/ton, including a modest
allowance for a margin for the importer (not included by Fertilizer Company B, who also do their own
bagging).21 The TFRA data are for 2013, when there appears to have been slightly higher international
prices, although the cif estimated price may also include a TFRA margin.
By comparison, the local transport and trading activities add around $160/ton to get to a final (net) retail
price of around $640/ton at the fertilizer trader (Table 4). Note that the transport cost is just $50/ton,
and on some estimates (such as Fertilizer Company A) is even lower, while Fertilizer Company B has
its own trucking operation on which it can include an internal margin. This means that an additional
$110 is included in the trader and retailer costs and margin over and above the transport cost ex-
warehouse to the agro-dealer. The average retail list prices of the agro-dealer is substantially above this,
based on the prices recorded at a town, which is approximately 74km from Mbeya and on the average
recorded at agro-dealers across the country including those close to Dar es Salaam.
21 This also compares with $42/ton for the full cost of port handling at Dar es Salaam which includes off-loading, stevedoring,
bagging, de-stuffing containers, and clearing to the port gate (Interview with Fertilizer Company 1).
14
Table 4: Fertilizer price composition in Mbeya, $/ton22
Source: Interview data from fertilizer companies and Ngowi (2013)
The identification of around $110 in excess charges in the price is also consistent with the very
competitive final retail price of Fertilizer Company B. Our assessment is that key developments have
opened up the market and have allowed more competitive offerings. This includes the better access to
the port enabling a more contestable market. In effect, the developments in early 2014 are consistent
with the assessment of the mark-ups over 2011-2013 for Tanzania. In addition, the difference between
Fertilizer Company B’s 2014 final retail price and the fob price – $195/ton – is close to the 2010
difference of $220/ton for Tanzania overall while for 2013 it was around $350/ton (based on the TFRA
study) and $470/ton from Table 1, although the average retail prices are list prices and some discounting
may take place. This is some $150/t to $250/t higher than the cost build-up suggests should be a
competitive price. This accords with our assessment of the amount by which Tanzanian prices have
been marked-up in 2011 to 2013.
These are significant differences and suggest that fertilizer prices in Tanzania are far above what farmers
should be paying and that farmers could benefit from more competitive rivalry in Tanzania.
22 Some of the figures do not necessarily add up to the total retail price in this table due to the unavailability of estimates for
some of the components. Mbeya is 828km from Dar es Salaam. 23 Available AMITSA disaggregated monthly price data for Chimala which is 74km from Mbeya city (average of prices in
January and March 2014)
Fert. Co. A
Q1 2014
Fert. Co. B
Q1 2014
TFRA
(2013)
Benchmark
FOB 352 350 - 350
CIF 402 400 420 400
Port charges 50 50 60 50
Bags, bagging and storage 18.15 - 20 20
Importer margin 20 - - 10
Sub-total: ex-port warehouse (bagged) 490.15 450 500 480
Inland transport costs 43 60 50 50
Wholesale price 573 545 563 560
Final retail price 646.6 545 688 640
Chimala average retail list price
(AMITSA) 88223 882 757 882
National average retail list price
(AMITSA) 720 720 810 720
+130
+160
15
The margin by which we find that prices have been too high is split between inefficiencies, regulatory
issues, trader margins, and other rents that may be due to competition issues related to barriers to entry
and the level of contestability of the market.
Interviews with individual firms were not held in Malawi, where, however, the mark-ups appear even
higher. Part of this is associated with higher costs associated with transport and storage as regulatory
restrictions inhibit competition and benefit firms who apparently have the necessary approvals. We
discuss this further below.
The trucking industry in Zambia, Tanzania and Malawi
For both Zambia and Tanzania, there has been a sharp increase in the number of trucks and truck
operators in the country, while transporters in Malawi remained relatively constrained by regulatory
barriers amongst other factors. For example, in Tanzania between 2009 and 2013, the number of
licences issued for goods services vehicles almost doubled.24 In Zambia, the number of trucks increased
following the removal of import duties on second-hand trucks in 2008/9.25 Similarly, the number of
trucks in Tanzania increased after the removal of surcharges for the imports of trucks that are over 10
years’ old.
The road freight sector is also affected by the regulatory environment. The road freight industry – like
any other industry providing trade services – is governed by domestic, regional and international
regulations. These regulations work to enhance or to impede competition and market access in some
cases.
Each of the countries in the study applies a separate domestic regulation for road transport services. In
Tanzania, the Road Traffic Act of 1973 regulates vehicle mass on the roads and stipulates fees to be
charged for overloading, for example. There is also the Surface and Marine Transport Regulatory
Authority Act, which gives effect to SUMATRA, the authority responsible for licensing trucks, dealing
with consumer complaints, and generally promoting the interests of the trucking industry. In Zambia,
road transportation is governed by the Road Traffic Act No. 11 of 2002, in which there are specific
provisions pertaining to issuing road service licences or permits. Some of the quantitative restrictions
for obtaining a road transport operator licence were problematic under the regime as they directly
restricted competitive rivalry (Meeuws, 2004).
It appears as if increased volumes given the boom in trade has led to greater competition and falling
trucking rates along major routes. Where these volumes are associated with, for example, copper exports
to major ports there are further possibilities for backhaul for goods such as fertilizer being transported
24 Data obtained from SUMATRA. 25 Interviews with trucking companies.

16
in the opposite direction. Another reason for the increase in trucks in Tanzania is the relaxation of
government controls, which previously required that heavy loads be transported via rail.26
Working against seamless and lower cost trucking is the maintenance of rules inhibiting cross-border
trade in transport services (Ward & Barreto, 2011: 13). Important regulations widely applied in SADC
relate to cabotage, which prohibits foreign firms from transporting cargo between two points within a
foreign country, and the third-country rule, which prohibits an operator from transporting goods from
another country to a third without passing through its own country of origin. The rule against cabotage
has been highlighted in previous studies as an important determinant of competitive outcomes in
domestic road transport markets insofar as it affects the ability of foreign registered trucking companies
to compete in another country’s domestic market. However, the impact of these rules has been disputed.
For example, Argent & Milanovic (2014) argued with respect to Rwanda that removing the cabotage
regulation would not improve the competitive position of Rwanda’s industry.
In the case of Zambia, the introduction of a single permit system between Zambia, Zimbabwe and South
Africa in the early 2000s made a significant difference (Meeuws, 2004). This meant that Zimbabwean
and South African trucking companies could operate along the corridors alongside Zambian companies
such that Zambian truckers held only around a 40% market share on the main corridors, even while
restrictions on cabotage and the third country rule remained (Raballand et al, 2007). The influx of
competition from regional trucking companies into the Zambian market has over time reduced transport
costs to be on par with costs in South Africa. In effect, the main companies could run operations across
the countries with trucks registered in each and lifting cabotage and third country rules would probably
have a muted effect.
In the Zambian market, the copper mines appear also to have good bargaining power. The rates obtained
by the mines in 2013/14 averaged $116/ton from the copperbelt to Johannesburg, or around
$0.06/ton/km.27 The rates from Durban and Johannesburg to Lusaka were somewhat higher at between
$0.10 and $0.12 in 2014. Improved border processes and management have assisted here, although
there are still delays. Transporting goods through the Chirundu border (Zimbabwe - Zambia) is
apparently much faster than through Nakonde from Tanzania. There have been significant
improvements at Chirundu over time and the border has become far more efficient over the past twenty
years. From about 2009 it was already taking only two days to clear customs procedures, whereas
clearance used to take up to 21 days some years prior to this.28
Rates within the domestic market tend to be higher because even while there are no borders to cross,
trucking companies find it more difficult to secure return loads within Zambia i.e. along domestic routes
26 Interview with SUMATRA. 27 Interviews with Truck Companies. 28 Interview with Freight Forwarder.

17
relative to cross-border transit. Trucking company representatives commented that within Zambia, it is
often a challenge to transport goods such as fertilizer to agricultural regions because there are limited
opportunities for return loads if it is not harvest season. Transport rates were estimated for loads between
major domestic centres such as Ndola, Kitwe, Lundazi and Lusaka to be between $0.10/ton/km and
$0.16/ton/km.
In Tanzania the increase in the number of trucks has led to a decrease in the transport rates from Dar es
Salaam to the main local and transit destinations, to rates even below those in Zambia. For example,
the transport rates from Dar es Salaam to Mbeya decreased from $0.08 /ton/km in 2011 to $0.05/ton/km
in 2014, while the transport rates from Dar es Salaam to Lubumbashi in the DRC decreased from
$0.10/ton/km in 2008 to $0.07/ton/km in 2013.29 While there has been a clear decrease in the transport
rates for both local and transit routes, the transport rates for the transit routes are slightly higher. ETG
has its own fleet of trucks and typically factor in a cost of about $60/ton from Dar es Salaam to Mbeya
or $0.07/ton/km in 2014.
Transport costs do not appear to account for the reason why Tanzania’s fertilizer prices remained high
relative to those in Zambia in 2012 and 2013. However, there is a range of regulatory costs such as
licences and permits. In particular, these include the transit goods licence (C-28 form) from the TRA.
This licence can take several months to be issued. In one case, a truck owner’s licence took roughly
four months to be granted: he applied in November 2013 and the licence was issued in March 2014. It
reportedly takes the longest to be issued in Tanzania compared to other EAC countries (Kenya, Rwanda,
Uganda and Burundi) where it takes only a few hours. In addition, the transit licence is reportedly the
most expensive in Tanzania. The transit licence is a very important document because truck owners
cannot travel cross-border routes without it. As a result of the licensing delay issues, it has been very
difficult for non-Tanzanian truck companies to enter the market, thus limiting the number of new
entrants into the market.
New entry is thus largely limited to domestic firms. This is compounded by other regulatory
requirements, such as those pertaining to tri-axle heavy-load trucks, which means that firms such as
TruckAfrica cannot carry a backload from Tanzania and will have to factor this into the outbound rate.30
The effects of these regulations and logistical arrangements are that entry and competition may be
constrained, even while the number of trucks in operation increased. There is limited information to
suggest that new entry has been constrained by strategic behaviour on the part of powerful insiders such
as trucking associations although it is not possible to draw this conclusion from the available
information. Some market participants advised that rates were actually set by SUMATRA. However, it
appears that an ‘economic rate’ is calculated by SUMATRA as a benchmark to which they compare the
29 According to SUMATRA (2011), and interviews with trucking companies for 2014 rates. 30 Interview with TruckAfrica.

18
prevailing transport rates. This benchmark is based on the operating costs that would be incurred by a
brand new truck operating selected routes. SUMATRA has historically found that their benchmark rate
is higher than the prevailing rates in the market, which suggests to them that the market is competitive,
and as such they have not had to regulate prices in the market. The risk of using this methodology is
that the benchmark is based on new trucks, whereas many of the operators in the market use second-
hand and older vehicles, and that it does not take into account the efficiencies in operation that vigorous
competition can bring (including organising return loads).
Another issue that affects transport rates is the arrangement between the Tanzania Truck Owner’s
Association (TATOA) and the TRA, which dictates that in order to get a licence a truck owner must be
a member of the industry association. Despite this, our understanding from interviews is that TATOA
does not set transport rates in the market and does not wield very strong influence in the market although
it has a broad membership of approximately 900 companies. However, TATOA does have the powers
to have a truck owner’s license revoked by the TRA if certain TATOA regulations are breached,
indicating that TATOA does wield a certain level of influence in the Tanzanian trucking industry.
Malawi continues to have extensive regulation of road freight, which is compounded by additional
regulations that apply to the transport and storage of fertilizer. It still enforces the rules including
cabotage and the third country rule, as does Zambia. However, it is in the impact of the regulations that
the effect is felt and which reveals very different outcomes with Zambia for these two landlocked
countries. Zambia has improved the working of the regulations such that the market has effectively
become contested by regional trucking operators, with substantially lower resultant transport costs.
Overall, it is estimated that there are more than 20 to 30 transport companies that could be used by
fertilizer suppliers in Malawi, but the market is effectively dominated by a very few large players.31
This is the case for customers who would need large consignments of goods to be transported such as
sugar, tobacco or cement that need to deal with haulage companies with reliable and flexible service
(TAG, 2007: 18). Some estimates put the current combined share of the three largest road freight
operators, Combine Cargo, SDV Bolloré and Manica, at between 55% and 70%.32 SDV Bolloré is part
of the global Bolloré group, which does freight forwarding and has a large fleet of trucks operating
across southern and East Africa. Manica is a regional trucking group across Southern Africa and is part
of the South Africa Bidvest group. There are also forwarding companies that operate in the same space
with some of these clearing agents also having trucks. For example, Combine Cargo is a Malawian
company, which does not itself have a big fleet with only 10 to 15 trucks. Since the core of their business
is freight forwarding, they normally outsource transportation services.33
31 Interviews with STACO and Combine Cargo. 32 Interview with Combine Cargo. 33 Interview with Combine Cargo.

19
The Road Transport Owners’ Association (RTOA) is an important role-player in the domestic market.
While it is not compulsory to be a member of RTOA, the association does give an indication to the
market of what rates should be charged in the domestic market. This raises concerns about dampening
competition and providing a focal point around which domestic players can coordinate.
In addition, the Malawi government’s FISP programme identifies specific truckers, on an annual basis,
to transport subsidized fertilizer. Only truckers who have been appointed to provide transport for the
programme via a bid can do so. Ultimately, individual trucking companies place bids in a tender process,
with the most appropriate bids being awarded contracts. The issuing of these contracts may also have
an effect on the overall outcomes in the domestic freight transport market in Malawi, particularly in
scenarios where the price as set by government is seen as a pricing point on which other market
participants can base their prices.
Local rates are much higher than cross-border rates as reflected in a number of studies (see, for example,
IFDC, 2013b). This is likely to be a result of the factors identified, including the weak competition in
the domestic transport market and the impact of RTOA in setting recommended rates for the domestic
market. There are also higher costs such as for fuel and spare parts than in neighbouring countries, as
well as poor road conditions (IFDC, 2013b: 32).34 The likelihood of an empty return load is also much
higher when transporting goods within Malawi than across Malawi’s borders, while backhauls from
Malawi are also less likely than from other countries. Finally, domestic routes are generally much
shorter than international routes and have much lower average loads implying higher fixed and
transaction costs (AFDB, 2009: 53). These factors mean that only a few transport service providers
enter the market, charging disproportionately higher prices to cover fixed costs and maximise mark-ups
(Lall et al, 2009: 2).
Different estimates place the rate for international shipments to and from Malawi at $0.06-0.09/ton/km
(IFDC, 2013b) compared with an average rate for domestic transport estimated in 2008 at $1.63/ton/km
(AfDB, 2009). The Malawi rates for cross-border transport are not out of line with those for the other
countries. Although, it is noted that the price of transporting fertilizer depends on the season and also
on the availability of backhaul for the transporter (IFDC, 2013b: 31). And, while the local transport
rates in Malawi appear substantially higher, the rates offered by ADMARC for the domestic
transportation of fertilizer for the subsidy programme was K35 per ton per km, which is approximately
$0.10 per ton per kilometre, while transporters were demanding between K45 and K50 (between $0.13
and $0.14) in order to break-even.35 The Competition and Fair Trade Commission of Malawi (CFTC)
34 The RTOA is also reported to have requested government to consider a waiver on spare parts and equipment “so that they
compete favourably with their counterparts in the region”, The Nation (2013). 35 According to The Nation (2013b).
20
launched an inquiry in 2014 into the trucking industry due to high transport costs being a driver of high
trade costs in Malawi however at the time of writing the inquiry had yet to be finalised (Helema, 2014).
Port efficiency is an additional factor which could make a substantial difference for Malawi. The closest
port of Beira has a relatively low docking capacity, at between 10000 and 15000 tons, which means that
only a few vessels at a time can be offloaded, leading to congestion and delays (which in turn result in
demurrage charges being incurred) (IFDC, 2013b: 31). While Nacala has a higher docking capacity and
is the closest to Lilongwe, it is plagued by slow operations and a slow rail service. As noted above, after
2009, imports returned to being predominantly sourced from South Africa, which places Malawi on the
same footing as Zambia.
5. Fertilizer subsidy programmes
Fertilizer subsidy programmes account for substantial volumes of fertilizer supplied to farmers in each
of the countries as discussed below. However, the mechanisms used to implement programmes may
undermine their impact and the programme can be subject to manipulation. For example, the allocation
of volumes under the subsidy programme to certain suppliers can give them an advantage in the market
(as seems to have happened in Zambia, with cartel conduct having been uncovered between the two
main suppliers to the subsidy programme). In the case of Malawi, the subsidy is set so high it seems to
have set a price floor and had the effect of supporting higher overall prices, including for the substantial
proportions of fertilizer which are not subsidised.
The Tanzanian subsidy programmes have historically aimed to address the higher transport costs that
mean higher prices in rural areas further from Dar es Salaam. However, over time the amount of the
subsidy and the geographic reach have increased to cover effectively the whole country. At the same
time, there are questions as to whether it is having the desired effect of increasing fertilizer use. In all
countries it is also important to note that the subsidy programme operates alongside the substantial
commercial market supply with which we have been concerned.
Malawi
Given the importance placed on its agricultural sector, the Malawian government agreed (under the
auspices of the Malawi Growth & Development Strategy – MGDS II) to raise agricultural growth by
6% and to ensure that its budget allocation to the agricultural sector is at least 10%. In order to meet the
6% growth target by 2016 Malawi would need to increase consumption of fertilizer from 297 000 tons
to 600 000 tons annually by 2016 and the subsidy aims to support this through making it more affordable
(IFDC, 2013b: 37).
21
Over the years, Malawi has implemented numerous subsidy programmes:
From the mid-1970s to the early 1990s, there was a universal fertilizer subsidy. This subsidised
smallholder credit and controlled maize prices (Dorward & Chirwa, 2011: 234).
From 1998/99 to 1999/2000 there were free starter packs that were issued to all households.
From 2000/01 to 2004/05 free starter packs were given to smaller targeted households.
In 2005/06 the government of Malawi implemented a very large-scale input subsidy programme
(the Agricultural Input Subsidy Program, AISP, also known as the Farm Input Subsidy
Programme, FISP) because of the persistence of food security concerns despite earlier
programmes. This has been credited with significantly increasing fertilizer usage (IFDC,
2013b; Chirwa & Dorward, 2013).
The FISP is the latest subsidy programme to be implemented by Malawi. It is facilitated by the
Agricultural Development Marketing Corporation (ADMARC) and the Smallholder Farmers Fertilizer
Revolving Fund of Malawi (SFFRFM), which are state agencies tasked with distributing fertilizer for
this subsidy programme. Imported fertilizer is delivered to SFFRFM regional warehouses. The
SFFRFM issues out a competitive tender for the importation of fertilizer and for its transportation to
the ADMARC warehouses (IFDC, 2013b).
The FISP is administered in the following manner. The District Agricultural Development Officers
(DADOs) from the Ministry of Agriculture and Food Security (MoA & FS) select the farm families
who will be beneficiaries of the subsidy programme. The farm families receive fertilizer, maize and
legume seed vouchers. Farmers receive two vouchers each, one for 50kgs of Urea and another for 50kgs
of NPK. Farmers redeem the vouchers from the ADMARC/SFFRFM unit markets and farmers ‘top up’
with a payment of MK500 per bag (about $1.30) of fertilizer for both the Urea and the NPK. In 2012/13
the vouchers included security features to prevent the production and distribution of fake vouchers. In
2013/14, e-vouchers were introduced as a pilot programme in certain regions, albeit for seed only
(Logistics Unit 2013, 2014).
In 2012/13 to 2013/14 the target for FISP was around 150 thousand tons. The farmers’ contributions to
the purchase of subsidised fertilizer have, however, decreased dramatically since the inception of the
current programme in 2005/6. This is the amount that farmers need to pay to top-up, reflecting the
difference between the price and the value of the voucher (Chirwa & Dorward, 2014). In 2005/6, the
MK950 that farmers paid represented roughly 37% of the price of a bag of fertilizer and this has dropped
to approximately 3% in the 2012/13 season. Given that Malawi prices are some 20-25% above our
benchmarks for competitive prices, this means that the voucher value is substantially more than a
competitively priced bag of fertilizer. This implies that the high value of the voucher may act as a price
22
floor below which fertilizer is not sold, whether to farmers with vouchers or for commercial (non-
subsidised) sales. Even if there was increased competition in fertilizer trading or improvements in the
cost of road transportation, the potential pro-competitive effects in the market would be muted by the
price floor.
The FISP has been criticised for only meeting 47% of potential needs for increased crop production
(IFDC, 2013b: 19). The programme has also been criticised for a lack of transparency in the allocations
of beneficiaries at the district level and administrative problems in the distribution of paper vouchers
(Logistics Unit, 2013). In terms of transporters, there was reportedly a lax tender process for the
acquisition of transport services. Moreover, there was theft of fertilizers which is captured in the 3.2%
of unaccounted fertilizers (Logistics Unit, 2013).
Companies are likely to submit very competitive bids in terms of low transport rates, however this may
be at the expense of quality (see also Ward & Barreto, 2011). For example, some of the transporters did
not have enough vehicles while others were so un-roadworthy that they had to be used with no
speedometers or odometers. By regulating the number of truck companies the programme distorts the
process of competitive rivalry between these operators wherein less efficient and unreliable operators
would be marginalised or forced out of the market.
The effect of the price floor in fertilizer trading also means that there is no incentive for traders and
transporters to innovate, improve quality of service, and invest in strategies to reduce their costs and
thus pricing below this level. This has the effect of dampening competition in both of these levels of
the market. In this way, dynamics in the subsidy programme affect outcomes in fertilizer trading and
road freight.
Tanzania
Fertilizer usage is very low in Tanzania, with only 9% of farmers in Tanzania recorded to be regularly
using fertilizers in 2008 (Benson et al, 2012: 1). This has been attributed to a number of factors including
the cost of fertilizers, lack of sufficient knowledge about its proper use, and insufficient credit markets.
There has been a lot of emphasis on the fertilizer subsidy, as the government has made sustained efforts
to increase the usage of fertilizer particularly in rural areas and those where there is poor road
infrastructure which can sometimes be neglected by private importers.36 The government has
historically viewed agriculture as the backbone of the economy and the increased usage of agricultural
inputs as critical to increasing output and ensuring security in food supply. In order to achieve this the
36 According to the TFC.
23
government has concentrated its efforts on supplying fertilizer to the major agricultural districts such
as Mbeya, Iringa, Ruvuma and Rukwa, which together consume over 50% of fertilizer in Tanzania.37
There have been a number of fertilizer subsidy programmes in Tanzania dating back to the 1970s:
In the 1970s, the subsidy programme funded the difference between factory costs of locally-
produced fertilizer and its selling price.
In the 1980s, the subsidy covered the full cost of transport from the warehouse to the
wholesaler/retailer.
In 2003, the subsidy was provided to wholesalers to cover the transport costs to remote areas
and a portion of the final price. This policy, which stretched from 2003 to 2007, was intended
to ensure that the price of fertilizer was the same throughout the country, although this also
resulted in significant leakages of fertilizer to other countries.38 This programme was based on
an allocation system, whereby fertilizer companies were told that they should deliver fertilizer
to certain areas and at certain volumes, including price enforcement mechanisms to ensure
reduced fertilizer prices for farmers (Benson et al, 2012: 8). In that system, the government
would ask the traders how much fertilizer they had in order to place orders and include the firm
in the scheme, which created incentives for the companies to overstate their volumes (capacity)
in order to win contracts from the government.39
The current subsidy programme is known as the National Agriculture Input Voucher Scheme
(NAIVS) and was launched in 2008. This programme benefited from World Bank support from
2009 to 2012, which increased the number of vouchers and beneficiaries and allowed the
programme to be stretched to cover the whole country (except Dar es Salaam) with the same
budgetary input from government.40
The Tanzania subsidy schemes have generally been focused on subsidizing the cost of transport of
fertilizer to reduce the delivered price of fertilizer across the country. As with Malawi, the scheme has
expanded substantially over recent years while not apparently having the concomitant increase in
impact. In the case of Tanzania, the coverage has been widened to the whole country. Unlike the
previous subsidy scheme, the NAIVS is targeted directly at subsidizing farmers (only those with one
acre farms) rather than transportation or specific retailers. Farmers receive vouchers for two bags of
fertilizer – one for planting and one for top dressing – with the value of the voucher having been around
50% of the price of an input pack from any agro-dealer. The level of the subsidy (value of the voucher)
37 Interview with TFC. 38 Interview with Ministry of Agriculture in Tanzania. 39 Interview with TFC. 40 Interview with Ministry of Agriculture in Tanzania.

24
varies across the country such that in Mbeya the planting voucher carries a value of TSh50000 and top
dressing TSh40000 (about $26-27), while in Iringa and Mtwara (somewhat closer to Dar es Salaam) the
value of the voucher is TSh40000 and TSh30000, respectively. For planting, two types of fertilizer are
authorized, namely Minjingu Mazao and DAP, although currently the government recommends two
bags of Minjingu Mazao at TSh65000 instead of one bag of DAP because Minjingu Mazao is locally
produced. This apparently caused a reduction in the imports of CAN to Tanzania in recent years because
it was not recommended by the government41, which in itself distorts competitive market dynamics by
affecting demand in the market. For top dressing the government authorizes Urea.
There is no tender process for fertilizer companies that want to supply under the voucher system.
Instead, the government will issue a circular listing all of the firms that have applied (through the
Tanzania Fertilizer Regulatory Authority (TFRA)) and that will be allowed to participate in the
programme for that year. All firms can apply to be a supplier and the TFRA issues the rights to
participate on the basis of factors such as the ability to supply the products. These major companies
typically have agro-dealers and agents distributed throughout the country. Through these agents, the
current system requires fertilizer companies to go to the district office (one of 109 districts) in the local
area in which they want to participate and apply for approval to supply fertilizer to the subsidy
programme in that region. The district office can refuse access to a particular supplier if, for instance,
that supplier did not perform well in terms of reliability in the previous season. This places a significant
level of power in the hands of the leadership of each district particularly in significant farming areas.
Once the agro-dealers and agents are identified, government will disperse vouchers to regions and
districts through local officials to the farmers themselves. The agents and agro-dealers will then compete
for farmers to come to purchase fertilizer using the vouchers. The vouchers are then be redeemed by
the sellers through the banks, who forward them to government for payment. The redemption payment
is either made directly to the agents or to the main fertilizer company who then pays the agent depending
on the contractual arrangement. The nature of the system is such that it is not possible to redeem a
voucher which is designated for one district in another district meaning that a farmer cannot go and
purchase fertilizer in another region where it may be cheaper, for instance.
The volume of fertilizer covered by the subsidy scheme has ranged between 140 000 tons and 201 000
tons from 2009 to 2014. This appears to be a very substantial proportion of the fertilizer used (around
40%), given that import data from the Tanzania Revenue Authority which shows that in 2013 imports
of Urea for local use (after allowing for re-exports) were just 138 522 tons and total fertilizer imports
(including re-exports) were close to 400 000 tons. However, the government claims that subsidized
fertilizer is a relatively small proportion of total fertilizer used, at around 10-15% of the total market.42
41 Interview with TFC. 42 Interview with Ministry of Agriculture in Tanzania.

25
This would put the total market at a much larger size than recorded in the import data (and taking into
account Minjingu’s local production) suggesting that much fewer tons of fertilizer were actually being
purchased with vouchers than were being recorded.
Zambia
Fertilizer (commercial and subsidized) has been central to Zambia’s Comprehensive Africa Agricultural
Development Program (CAADP). To meet the agricultural growth targets under the CAADP, fertilizer
consumption in Zambia would have needed to increase by 248000 tons to 500000 tons (IFDC, 2013a).
However, outcomes in terms of the subsidy programme have been distorted by apparent cartel conduct
at the level of fertilizer trading.
The Zambian government has used 60% of the agricultural budget on two programmes for facilitating
the growth in fertilizer uptake (IFDC, 2013a):
a. Food Reserve Agency (FRA) – FRA purchases maize ‘at pan-territorial prices that are fixed
above prevailing market prices’. This programme purchased between 36% and 86% of all
marketed maize in Zambia between 2004 and 2010. By selling this maize to millers at
subsidized prices the expectation is that millers will, in turn, sell maize products to consumers
at favourable prices and thus cushion consumers from high prices. Unfortunately it seems this
programme largely benefited large farmers with surplus maize sales.
b. Fertilizer/Farmer Input Support Programme (FISP) – this programme distributes subsidized
fertilizer. By focusing solely on maize the FISP has encouraged an increase in the area under
maize at the expense of other crops. Large farmers with significant land resources have
benefited more than small farmers (IFDC, 2013a).
The FISP primarily distributes D-Compound and Urea and accounted for approximately 200000 tons
in 2013. The tender process to participate in this programme works in the following way:
The FISP Implementation Agency decides on the amount of the subsidy and asks for tenders
from importers. Bids are then selected based on criteria including prices. Firms are also
required to have some volumes of fertilizer available in inventory during the tender period
which has implications for storage costs. This stage of the process takes place between March
and August.
It will take importers three months to transport the product to Zambia (September-November).
Finally, it will take four to six weeks to distribute fertilizer around the country.
26
At the local level, the subsidy recipient pays for the discounted fertilizer price at the bank, gets a deposit
slip, and then goes to a local MACO (Ministry of Agriculture and Cooperatives) office to receive a
letter allowing them to collect fertilizer from the nearest importer warehouse or store.
Historically, Nyiombo and Omnia have dominated the fertilizer programme, although it appears that
they have done so due to tender bidding requirements that favoured incumbents and inhibited an open
and competitive process. The bidding requirements had stipulated that bidders should provide evidence
of having supplied fertilizer including quantities provided and proof of contracts previously awarded.43
This gave the incumbents a substantial advantage. Other requirements included a credible track record
and the capacity to the deliver on the order, along with the ability to store fertilizer around Zambia.
Omnia and Nyiombo have dominated supplies to the FISP, although we understand that some of the
other firms, including Zambian Fertilizers and Greenbelt, have sometimes also supplied the FISP over
the years since its inception.44 In the commercial market we note the CCPC findings in 2009 that market
shares for Omnia and Nyiombo were 40% and 34%, respectively, based on user surveys.
The Competition and Consumer Protection Commission (CCPC) of Zambia, however, found collusion
between Omnia and Nyiombo in the FISP tender on prices and dividing geographic markets.45 Omnia
and Nyiombo have in recent years also been linked to allegations of fraudulent relations with the
government agents that are in charge of facilitating the tender process in the Zambian Public
Procurement Authority and Ministry of Agriculture.46 The Permanent Secretary of Agriculture had to
intervene in the tender process for the 2012/13 period to change clauses of the tender bidding
requirements.47
The FISP fertilizer subsidy programme has a significant effect on the market for the transportation and
distribution of fertilizer in Zambia overall in so far as it drives a significant proportion of fertilizer
demand. In this regard, opening up the tender and identifying and sanctioning collusion in the tender
process, has reinforced the moves to open up road transportation. The change in relative prices in
Zambia and the fact that the market shares of the two largest firms have been eroded in recent years
suggests that there has been more meaningful competitive rivalry in the market from firms such as ETG
and more competitive outcomes.
43 See ‘Government broadens FISP tender process' (18 April 2012), at: http://www.postzambia.com/post-
read_article.php?articleId=26958 44 ‘Corruption deal backfires’ (18 December 2013), at: http://zambiadailynation.com/2013/12/18/corruption-deal-backfires/.
Losing bidders will sell under competitive commercial market conditions parallel to the subsidy programme. 45 See CCPC Competition and Consumer Protection News Issue 6, at http://www.ccpc.org.zm/?wpfb_dl=9, and
http://www.zambia-weekly.com/media/zambia_weekly_2013_-_wk_38.pdf. The case was still under appeal in 2015. 46 See, for example, ‘Government broadens FISP tender process' (18 April 2012), at: http://www.postzambia.com/post-
read_article.php?articleId=26958; and ‘Corruption deal backfires’ (18 December 2013), at:
http://zambiadailynation.com/2013/12/18/corruption-deal-backfires/; and ‘PAC questions govt over Nyiombo Investments,
Omnia’s contracts’ (25 March 2010), at: http://www.postzambia.com/Joomla/post-read_article.php?articleId=7395. 47 See ‘Government broadens FISP tender process' (18 April 2012), at: http://www.postzambia.com/post-
read_article.php?articleId=26958
27
Access to the FISP tender seems to be critical for farmers – where government does not meet import
quantities or when there are delays in delivery, farmers still prefer to wait for the subsidised fertilizer
to arrive before purchasing from the commercial market at higher prices (IFDC, 2013a). Transport to
the farms is provided by government through transporters who are hired through a bidding process
(IFDC, 2013a: 25).
6. Conclusions
To understand the economic importance of competitive and efficient transport and trading to users of
these services this chapter has examined road freight services with specific reference to the transport,
trading and supply of fertilizer products. This enabled the margins and costs involved in transport and
supply to be measured in terms of their effect on the final product price. It also recognises that the
arrangements may combine access to port and storage facilities with transport, distribution and supply
activities. For example, a company may have rights to terminals, warehousing and bagging facilities at
the port and also own its own trucks.
Prices paid by farmers for fertilizer are higher (when the subsidy programmes are not taken into account)
than in the sources of fertilizer such as the Middle East and Europe. For example, average prices over
2010 to 2013 have been as much as $339/ton to $559/ton higher in Zambia and Tanzania, than the Black
Sea benchmark for urea. These are 100% to 150% higher than the competitive international prices.
While reasonable sea freight, port charges and bagging costs can account for around $130/ton even after
subtracting these, the margins over international prices have been more $300-$400/ton for Tanzania,
Malawi and Zambia, meaning African commercial farmers pay around double for fertilizer than what
farmers do in other countries with competitive fertilizer supply.
In Tanzania and Malawi, the fertilizer prices were found to be relatively high, especially when compared
to that of Zambia and imputed competitive cost build-ups. Increased competition in the truck industry
in Tanzania led to a decrease in transport prices over time. However, inefficiencies and delays related
to the Dar es Salaam port had the effect of raising transport rates and thus fertilizer prices. The fact that
transport prices came down but mark-ups did not, and the benchmark exercise, indicate that it is the
market structure in the fertilizer industry which should explain the apparently high margins embodied
in local fertilizer prices.
In contrast, Zambian fertilizer prices started off much higher than those in Tanzania but gradually
moved to approximately on $6 per ton above those in Tanzania. A number of factors explain why the
Zambian fertilizer price became much more competitive. First, there was increased investment in
trucking services largely in response to domestic and regional growth. This increase in participation in

28
the trucking sector brought transport rates down. Second, increased mining activities provided
significant backhaul opportunities for transporters of fertilizer and other goods. In effect, the transport
cost is shared between the importation of fertilizer (or other goods) and the exportation of copper. This
reduced the transport rate that would have otherwise been paid by the importer without the backhaul.
Third, the single-permit system for Zambia, South Africa and Zimbabwe has made it much easier to
operate across the countries. These increased efficiencies drive down transport costs such as border
delays and in turn can be translated to lower transport prices.
In spite of all these improvements, the rates of transport costs did not come down to below those quoted
in neighbouring countries. What appears more important is that opening up trucking and trading meant
greater rivalry in fertilizer supply. There was an increase in the participation of new fertilizer traders in
the Zambian market and anti-competitive conduct was addressed by the CCPC. This has been reflected
in the substantial decline in the market shares of the main players, with the entry and growth of ETG,
which is integrated into transport and logistics. The interviews in 2014 suggest that the growth of
regional rivals was spilling over into cheaper prices in Tanzania.
In Malawi a combination of regulatory restrictions, low volumes, and a very tight knit group of traders
and transporters have together conspired to mean prices high above its neighbours. This has a very
negative effect on the costs of farmers, who rely on the commercial market for fertilizer. The higher
fertilizer prices also has a direct effect on the cost of the fertilizer subsidy programme, given the size of
the subsidy that has been provided. Indeed, far from exerting downward pressure on prices the
programme appears to have under-pinned higher prices for imported fertilizer. Taken together these
factors mean a lot rides on the subsidy programme, while its sustainability is questionable.
There are similar questions around the subsidy programmes in Tanzania and Zambia. Rather than
supporting more competitive prices for fertilizer in general, and a wide impact in terms of improved
agricultural yields, the value of the subsidy has increased for those farmers able to access it. This raises
the incentives to manipulate the programme, making monitoring and appropriate targeting to those
farmers who would otherwise not be able to afford fertilizer even more important. In general terms,
regulations and support need to open up markets to increased participation, while cross-border
cooperation is needed to improve supplies and to monitor possible anti-competitive conduct by large
international suppliers.
29
7. References
Adamopoulos, T. (2011) ‘Transportation Costs, Agricultural Productivity, and Cross-country Income
Differences’; in International Economic Review, Vol. 52, No. 2 (May, 2011), p. 489-521.
Africa Fertilizer Organisation, (2012). Training manual on fertilizer statistics in Africa.
African Development Bank (AfDB). (2009). Malawi Country Economic Memorandum. Seizing
opportunities for growth through regional integration for trade. AfDB Report No. 47969-MW
Argent, J. & Milanovic, M. (2014). Rwanda’s Road Freight Industry Competitiveness Study. Trade
Mark East Africa, 17 March 2014
Arvis, J., Raballand, G. & Marteau, J. (2010). The Cost of Being Landlocked: Logistics Costs and
Supply Chain Reliability. World Bank.
Benson, T., Kirama, S. L., & Selejio, O. (2012). The supply of inorganic fertilizers to smallholder
farmers in Tanzania. IFPRI Discussion Paper No. 01230.
Chirwa, E. & Dorward, A. (2014). Agricultural Input Subsidies: The recent Malawi experience. Oxford.
Oxford University Press
Chirwa, E. & Dorward, A. (2014). The implementation of the 2012/13 Farm Input Subsidy Programme:
FISP Policy Brief 2014/2.
Competition and Consumer Protection Commission (CCPC) of Zambia. Competition and Consumer
Protection News, April-June 2013, Issue No. 6.
Dorward, A. & Chirwa, E. (2011). The Malawi agricultural input subsidy programme: 2005/06 to
2008/09. International Journal of Agricultural Sustainability, 9(1): 232-247
Gregory, D. I. & Bumb, B. L. (2006). Factors Affecting Supply of Fertilizer in Sub-Saharan Africa;
World Bank Agriculture and Rural Development Discussion Paper 24.
Guo, Z., Koo, J. & Wood, S. Fertilizer Profitability in East Africa: A Spatially Explicit Policy Analysis;
Prepared for International Association of Agricultural Economists Conference, Beijing, China 16-22
August 2009.
Helema, I. (2014). High transportation costs push CFTC to conduct study. The Nation. 6 May. [Online].
Available: http://mwnation.com/high-transportation-costs-push-cftc-conduct-study/ [Accessed: 13
May 2014]
International Fertilizer Development Centre (IFDC). (2013a). Zambia Fertilizer Assessment.
30
International Fertilizer Development Centre (IFDC). (2013b). Malawi Fertilizer Assessment. IFDC
Research Paper
Lall, S. V., Wang, H. & Munthali, T. (2009). Explaining high transport costs within Malawi: Bad roads
or lack of trucking competition? World Bank Policy Research Working Paper No. 5133
Logistics Unit (2013). Final implementation report of the Agricultural Inputs Subsidy Programme
(2012-13). Logistics Unit report
Logistics Unit (2014). Final implementation report of the Agricultural Inputs Subsidy Programme
(2013-14). Logistics Unit report
Meeuws, R. (2004). Zambia – Trade and Transport Facilitation Audit; submitted to World Bank; by
NEA Transport Research and Training.
Ngowi, H. P. (2013). Impacts of removal of fertilizer value added tax (VAT) on fertilizer use and
productivity in Tanzania. Presented at the Tanzania Soil Health Policy Action Node Stakeholders
Conference, Dar es Salaam, 28-29 November 2013
Nyirongo, E. (2014). ‘Borrowed equipment costs MEC K9m’ (12 May 2014). The Nation. 12 May.
Available: http://mwnation.com/borrowed-equipment-costs-mec-k9m/ [Accessed: 13 May 2014]
Raballand, G. & Macchi, P. (2008). Transport Prices and Costs: The Need to Revisit Donors’ Policies
in Transport in Africa.
Raballand, G., Kunaka, C., & Giersing, B. (2007). The Impact of Regional Liberalization and
Harmonization in Road Transport Services: A Focus on Zambia and Lessons for Landlocked Countries.
World Bank Africa Transport Department Policy Working Paper no. 4482.
Republic of Tanzania (2001a). Road Traffic Act: The Road Traffic Regulations, 2001
Republic of Tanzania (2001b). Surface and Marine Transport Regulatory Authority Act
SADC Protocol on Transport, Communications and Meteorology (1996).
Shippers Council of Eastern Africa (2013). East Africa Logistics Performance Survey 2012: Cost, time
and complexity of the East African Logistics Chain. Annual Publication of the Shippers Council of
Eastern Africa, 2nd edition. Available:
http://www.trademarksa.org/sites/default/files/publications/2012%20EA%20Logistics%20Performanc
e%20Survey.pdf [Accessed: May 2014]
Surface and Marine Transport Regulatory Authority (SUMATRA) (2011). Report on truck freight rate
charges.
31
Tanzania Ports Authority (2012). Annual report and accounts for the year ended 30 June 2012.
Teravaninthorn, S., Raballand, G. (2009). Transport Prices and Costs in Africa: A Review of the
International Corridors. Washington, DC: World Bank
The Nation (2013a). ‘Transporters want spare parts waiver’ (13 March 2013). The Nation. Available:
http://mwnation.com/transporters-want-spare-parts-waiver [Accessed: 13 May 2014]
The Nation (2013b). ‘Transport costs choke Admarc’ (6 March 2013). The Nation. Available:
http://mwnation.com/transport-costs-choke-admarc/ [Accessed: 13 May 2014]
UNCTAD (2009). Economic Development in Africa Report 2009. Strengthening Regional Economic
Integration for Africa’s Development. United Nations publication. Sales No. E.09.II.D.7. New York
and Geneva.
UNCTAD (2013). Economic Development in Africa Report 2013. Intra-African Trade: Unlocking
Private Sector Dynamism. United Nations publication. Sales No. E.13.II.D.2. New York and Geneva.
United Nations Comtrade (2013). Commodity trade statistics, Malawi country report 2012.
United Nations Comtrade (2013). Commodity trade statistics, Tanzania country report, 2012.
United Nations Comtrade (2014). Commodity trade statistics, Zambia country report, 2013
Ward, N. & Barreto, E. (2011). Technical Report: Road Freight Transport Services Diagnostic Study
for USAID Southern African Trade Hub.