Embed Size (px)
Citation preview

REGULATION OF GRANULOMA FORMATION IN MURINE MODELS OF TUBERCULOSIS
by
Holly Marie Scott
Bachelors of Science, Mount Union College, 1998
Submitted to the Graduate Faculty of
School of Medicine in partial fulfillment
of the requirements for the degree of
Doctor of Philosophy
University of Pittsburgh
2003

UNIVERSITY OF PITTSBURGH
SCHOOL OF MEDICINE
This dissertation was presented
by
Holly Marie Scott
It was defended on
December 8th, 2003
and approved by
Per Basse
Robert Hendricks
Paul Kinchington
Todd Reinhart
JoAnne L. Flynn Dissertation Director
ii

Copyright Permission was granted for the use of parts of:
1. Scott, H.M., and J.L. Flynn. 2002. Mycobacterium tuberculosis in chemokine receptor 2-deficient mice: influence of dose on disease progression. Infection & Immunity. 70:5946-5954. 2. Scott, H.M., J. Chan, and J.F. Flynn. 2003. Chemokines and tuberculosis. Cytokines and Growth Factors Reviews 14:467-477. The letters, indicating that the publishers granted permission, are on file with Holly M. Scott.
iii

REGULATION OF GRANULOMA FORMATION IN MURINE MODELS OF
TUBERCULOSIS Holly M. Scott, PhD
University of Pittsburgh, 2003
Abstract
Tuberculosis is a major cause of mortality worldwide. Elucidation of the host resistance
against Mycobacterium tuberculosis infection and the pathogenesis of tuberculosis is a priority.
The host response to M. tuberculosis in the lungs includes the formation of granulomas, focal
accumulations of mononuclear cells coming together to fight infection. The signals required for
the migration of cells into the lungs and those required for the formation of granulomas have not
been well defined. In this thesis, we will describe the advances we have made in understanding
chemokine expression and cell migration to the lungs in response to M. tuberculosis. We have
determined that Tumor Necrosis Factor (TNF) partially controls cell migration by modulating
chemokine expression by macrophages in vitro and CD11b+ cells in vivo. In addition, we have
taken the subset of chemokines that are affected by TNF and addressed their functions in vivo
through knockout and neutralization models. Specifically, we have used an aerosol model of
tuberculosis in the mouse to address the roles of CXCL9 (MIG), CXCL10 (IP-10), chemokine
receptor–5 (CCR5) and chemokine receptor–2 (CCR2). In our studies, there was no apparent,
strong phenotype in mice without functional CXCL9 or CXCL10. CCR5-/- mice had altered
pathology and increased inflammation in response to M. tuberculosis infection, but they were
able to control the infection. The CCR5 -/- mice may be hyper-responsive due to higher antigen
load in the lymph nodes in conjunction with increased dendritic cell migration and more primed
lymphocytes. CCR2-/- mice had a clear defect in macrophage migration and a delay in T cell
iv

migration, and the course of the disease was governed by the initial dose. Specifically, when a
low dose aerosol infection route was used, CCR2-/- mice were able to control infection with the
reduced number of cells migrating into the lungs; however with a higher dose, the mice
succumbed to infection. Our findings are relevant to understanding the immune response and
granuloma formation during aerosol M. tuberculosis infection, and will contribute to an
appreciation of the potential effects of anti-inflammatory or anti-chemokine therapies on
infections.
v

Acknowledgements
The work you will read about in this thesis could not have been carried out without the hard work and support of many important people. My mentor, JoAnne Flynn, has been a great scientific advisor. JoAnne has acted as a mentor with just the right balance of patience, knowledge, persistence and support. I am grateful to Amy Myers for excellent technical assistance. Amy puts in many hours to help all of us get our work done more efficiently. I thank all the members of the Flynn lab for they have become some of my best friends. I am grateful to all of my committee members, Dr. Basse, Dr. Hendricks, Dr. Kinchington, and Dr. Reinhart. I appreciate all the time and effort they have put into my education. Their guidance has been a strong asset to this research. I would also like to thank the Chan (Albert Einstein College of Medicine) and Nau laboratories for helpful discussions and I am extremely grateful for the Reinhart lab’s technical assistance on the ISH protocol, particularly the guidance of Craig Fuller. The graduate program and the department’s administrative staff are the best, trying to keep our lives less stressful. In addition, I could not imagine having a more supportive dean than Dean Stephen Phillips. Thank you! The love and support my family and friends have shown me over the past 5 years has been tremendous. Mom and Dad always cared enough to try to understand the research and its implications. They have taught me the value of balance, education and hard work. I thank my siblings for their love. My brother’s jokes always keep me smiling. I thank my sister and brother in law for bringing me 3 wonderful nieces into this world that I might get a good laugh and a reality check every once and awhile. I will be eternally grateful to my husband, David, for his love and support. David has always supported my goals and been unbelievably patient with me when I have been at my wits end. David motivates me to do my best and because of him I believe that I can balance my life (achieving while still appreciating every beautiful moment God has given us). This work was supported by National Institutes of Health HL71241 (J.C., J.L.F), American Lung Association CI-016-N, Western Pennsylvania Lung Association Dissertation Grant (H.M.S.) and T32 Molecular Microbial Persistence and Pathogenesis AI49820 (H.M.S).
vi

TABLE OF CONTENTS Abstract .......................................................................................................................................... iv Acknowledgements........................................................................................................................ vi 1.0 Introduction............................................................................................................................... 1
1.1 Global Impact of Tuberculosis.............................................................................................. 1 1.2 Potential Outcomes to infection............................................................................................ 3 1.3 Influence of external factors ................................................................................................. 5
2.0 Animal Models of Tuberculosis................................................................................................ 7 2.1 Monkey ................................................................................................................................. 7 2.2 Rabbit.................................................................................................................................... 8 2.3 Guinea Pig............................................................................................................................. 8 2.4 Mouse.................................................................................................................................... 9
3.0 Initiation of Infection .............................................................................................................. 12 4.0 Acquired Immune Response ................................................................................................... 15
4.1 Granuloma Formation......................................................................................................... 16 4.2 Cellular Interactions during the protective immune response ............................................ 19
4.21 Dendritic Cells .............................................................................................................. 19 4.22 Macrophages................................................................................................................. 21 4.23 CD4+ T lymphocytes .................................................................................................... 22 4.24 CD8+ T lymphocytes .................................................................................................... 23 4.25 B lymphocytes ............................................................................................................... 24
4.3 Cytokine mediated actions.................................................................................................. 25 4.4 Cytokines and cells involved in granuloma formation ....................................................... 28
5.0 Chemokines............................................................................................................................. 30 5.1 Chemokines and M. tuberculosis ........................................................................................ 33 5.2 Induction of chemokine expression by M. tuberculosis ..................................................... 34 5.3 Difficulties in studying chemokines and infectious disease ............................................... 37
6.0 Statement of the problem........................................................................................................ 39 7.0 Chapter 1 TNF-alpha influences chemokine expression of macrophages in vitro and CD11b+ cells in vivo during M. tuberculosis infection, affecting cell migration and granuloma formation....................................................................................................................................................... 40
7.1 Introduction........................................................................................................................ 40 7.2 Materials and Methods....................................................................................................... 41 7.3 Results................................................................................................................................ 49 7.4 Discussion .......................................................................................................................... 77
8.0 Chapter 2 CXCL9 and CXCL10 are not required for granuloma formation and control of M. tuberculosis infection.................................................................................................................... 84
8.1 Introduction......................................................................................................................... 84 8.2 Materials and Methods........................................................................................................ 86 8.3 Results................................................................................................................................. 90
vii

8.4 Discussion ........................................................................................................................... 98 9.0 Chapter 3 Enhanced dendritic cell migration and T cell priming in lymph nodes result in increased pulmonary lymphocytic infiltration in chemokine receptor 5 (CCR5)-deficient mice following Mycobacterium tuberculosis infection. ...................................................................... 101
9.1 Introduction....................................................................................................................... 101 9.2 Materials and Methods...................................................................................................... 102 9.3 Results............................................................................................................................... 109 9.4 Discussion. ........................................................................................................................ 124
10.0 Chapter 4 Mycobacterium tuberculosis in chemokine receptor 2 (CCR2) deficient mice: the influence of dose on disease progression.................................................................................... 128
10.1 Introduction..................................................................................................................... 128 10.2 Methods and Materials.................................................................................................... 130 10.3 Results............................................................................................................................. 133 10.4 Discussion ....................................................................................................................... 144
11.0 Summary ............................................................................................................................. 150 APPENDIX A............................................................................................................................. 157 A.0 IL-10 expression during aerosol M. tuberculosis infection is a result of increased bacterial burden and does not lead to immunosuppression ....................................................................... 157
A.1 Introduction...................................................................................................................... 157 A.2 Materials and Methods..................................................................................................... 158 A.3 Results.............................................................................................................................. 161 A.4 Discussion ........................................................................................................................ 165
APPENDIX B ............................................................................................................................. 167 B.0 Anti-TNF treatment in the presence of antibiotics............................................................... 167 APPENDIX C ............................................................................................................................. 173 C.0 mRNA expression of extracellular matrix proteins and adhesion molecules during M. tuberculosis infection.................................................................................................................. 173
C.1 Introduction. .................................................................................................................... 173 C.2 Materials and Methods. ................................................................................................... 174 C.3 Results and Discussion.................................................................................................... 176
BIBLIOGRAPHY....................................................................................................................... 180
viii

LIST OF TABLES
Table 1. Susceptibility chart on transgenic knockout mice infected with M. tuberculosis. ........ 16 Table 2. Chemokine Nomenclature. ............................................................................................ 34 Table 3. Primers and Probes used in the Taqman Real time RT-PCR assay............................... 46 Table 4. Gene Expression by Laser Capture Microscopy (LCM) in granulomas isolated through
Laser Capture Microscopy.................................................................................................... 67 Table 5. MACs column isolation of CD11b+ cells. .................................................................... 68 Table 6. Algorithm used for ISH analysis. .................................................................................. 73 Table 7. Summary of the effects of anti-TNF Ab on the expression chemokines in M.
tuberculosis infected macrophages. ..................................................................................... 81 Table 8. Cell migration in chronic infection in CCR5-/- and wild type mice (6 months post-
infection). ............................................................................................................................ 112 Table 9. Numbers of immune cells within the lungs 3 weeks post infection. ........................... 138 Table 10. Cell migration to the lung following challenge of memory mice with aerosol M.
tuberculosis. ........................................................................................................................ 144 Table 11. Cellular infiltrate differences in chemokine or chemokine receptor deficient mice.. 152 Table 12. IL-10 gene expression in the lungs of M. tuberculosis infected mice. ..................... 162
ix

LIST OF FIGURES
Figure 1. Potential Outcomes of exposure to the M. tuberculosis bacillus.................................... 4 Figure 2. Bacterial burden in the lungs of wild type C57Bl/6 mice. ........................................... 10 Figure 3. Granuloma formation in the lungs of M. tuberculosis infected mice........................... 17 Figure 4. Cell mediated immune response to M. tuberculosis..................................................... 25 Figure 5. Deficiencies in TNF signaling led to rapid disease progression. ................................. 50 Figure 6. Lung pathology in M. tuberculosis infected TNFRp55-/- mice and wild type mice. .. 52Figure 7. Immune cells migrate into the lungs in TNFRp55-/- mice........................................... 53 Figure 8. As bacterial burdens increased in MP6XT-22 treated mice, the numbers of cells
migrating into the lung increased significantly..................................................................... 54 Figure 9. Neutralization of TNF in chronically infected mice leads to severe lung pathology. .. 55Figure 10. Macrophage expression of chemokines is partially dependent on TNF..................... 58 Figure 11. Control macrophage experiment. ............................................................................... 59 Figure 12. Macrophage expression of chemokines is partially dependent on TNF..................... 60 Figure 13. Chemokine protein expression in M. tuberculosis infected macrophages was affected
by anti-TNF Ab treatment..................................................................................................... 62 Figure 14. Chemokine RNA expression in the whole lung of TNFRp55-/- mice and wild type
mice after M. tuberculosis infection. .................................................................................... 64 Figure 15. Chemokine expression in the lungs of chronically infected mice.............................. 66 Figure 16. Chemokine expression in CD11b+ cells isolated from low dose infection of TNFR
and WT mice......................................................................................................................... 69 Figure 17. RNA expression of CCR5 ligands and CXCR3 ligands is transiently reduced in
CD11b+ cells of TNFRp55-/- mice infected with a high dose of M. tuberculosis............... 70 Figure 18. In chronically infected, MP6XT22 treated mice, chemokine RNA expression was
transiently reduced in CD11b+ cells isolated ex vivo from the lungs. ................................. 71 Figure 19. Sense and anti-sense in situ hybridizations to detect CXCL9, CXCL10 and CCL5 in
lung tissue infected with M. tuberculosis. ............................................................................ 72 Figure 20. The number of cellular infiltrates, whether classified as category 2 or 3, was not
different between anti-TNF Ab treated and IgG treated mice. ............................................. 74 Figure 21. Expression of CXCL9 and CXCL10 are reduced in MP6XT-22 treated mice during
acute aerosol.......................................................................................................................... 76 Figure 22. Mice control M. tuberculosis infection in the absence of functional CXCL9 and
CXCL10................................................................................................................................ 92 Figure 23. T lymphocytes migrate to the lungs of CXCL10-/- and anti-CXCL9/anti-CXCL10
treated mice........................................................................................................................... 93 Figure 24. T lymphocytes in the lung are activated in CXCL10-/- and anti-CXCL9/anti-
CXCL10 treated mice. .......................................................................................................... 94 Figure 25. Cell migration to the lymph nodes was delayed in anti-CXCL9/anti-CXCL10 treated
mice....................................................................................................................................... 95 Figure 26. IFNγ production in the absence of functional CXCL9 and CXCL10. ....................... 96 Figure 27. Cytotoxic activity and proliferative ability of T lymphocytes from CXCL10-/- mice.
............................................................................................................................................... 97Figure 28. Expression of CCR5 ligands increased in M. tuberculosis-infected bone marrow
derived macrophages and in the lungs of aerosol M. tuberculosis-infected mice. ............. 110
x

Figure 29. CCR5-/- mice control aerosol and intravenous M. tuberculosis infection. .............. 111 Figure 30. Infection of CCR5-/- mice led to greater numbers of lymphocytes in the lungs
compared to wild type mice................................................................................................ 113 Figure 31. CCR5-/- mice formed granulomas with greater lymphocytic infiltrate. .................. 115 Figure 32. CCR1 mRNA expression in the lungs of M. tuberculosis infected, wild type and
CCR5-/- mice. ..................................................................................................................... 116 Figure 33. CCR5-/- mice had altered chemokine expression late in infection. ........................ 117 Figure 34. T helper 1 inflammatory cytokines increased to significantly higher levels in CCR5-/-
mice compared to C57Bl/6 mice......................................................................................... 119 Figure 35. CCR5-/- mice did not have a decrease in apoptosis. ................................................ 120 Figure 36. CCR5-/- mice do not have fewer CD4+CD45RBloCD25+ cells than wild type mice,
but rather have significantly more cells of this phenotype. ................................................ 121 Figure 37. CCR5-/- mice had more dendritic cells and more primed lymphocytes within the lung
draining lymph nodes.......................................................................................................... 123 Figure 38. Expression of CCR2 ligands, CCL2, CCL7 and CCL12 increases following M.
tuberculosis infection.......................................................................................................... 134 Figure 39. CCR2 deficient mice control low dose infection with M. tuberculosis. .................. 136 Figure 40. Macrophages are present in fewer numbers throughout M. tuberculosis infection in
the CCR2 deficient mice..................................................................................................... 139 Figure 41. Migration of T lymphocytes to the lung is delayed following low dose aerosol M.
tuberculosis infection.......................................................................................................... 140 Figure 42. Granulomas form in the lungs with delayed kinetics in CCR2 deficient mice. ....... 142 Figure 43. Expression of IFN-γ and inducible nitric oxide synthase (NOS2) is delayed in the
lungs of CCR2-/- mice infected with a low dose of M. tuberculosis H37Rv via aerosols. 143 Figure 44. Chemokine expression and cell migration in the absence of TNF........................... 156 Figure 45. Colony forming units in the lungs of M. tuberculosis infected mice. ...................... 163 Figure 46. TNF neutralization leads to increased disorganized pulmonary infiltrate in IL-10-/-
and wild type mice. ............................................................................................................. 164 Figure 47. Colony Forming Units in the Lung following antibiotic treatment and antibody
treatment in chronically infected mice................................................................................ 168 Figure 48. Histological Images of chronically infected mice treated with antibiotics and anti-
TNF Ab. .............................................................................................................................. 170 Figure 49. Cellular infiltrate in the lungs of chronically infected mice treated with antibiotics.
............................................................................................................................................. 171Figure 50. Cell Adhesion Molecules (Ig Superfamily, Cadherins and Catenins, Selectins). .... 176 Figure 51. Cell adhesion Molecules (Integrins)........................................................................ 177 Figure 52. Matrix Metalloproteinases........................................................................................ 178
xi
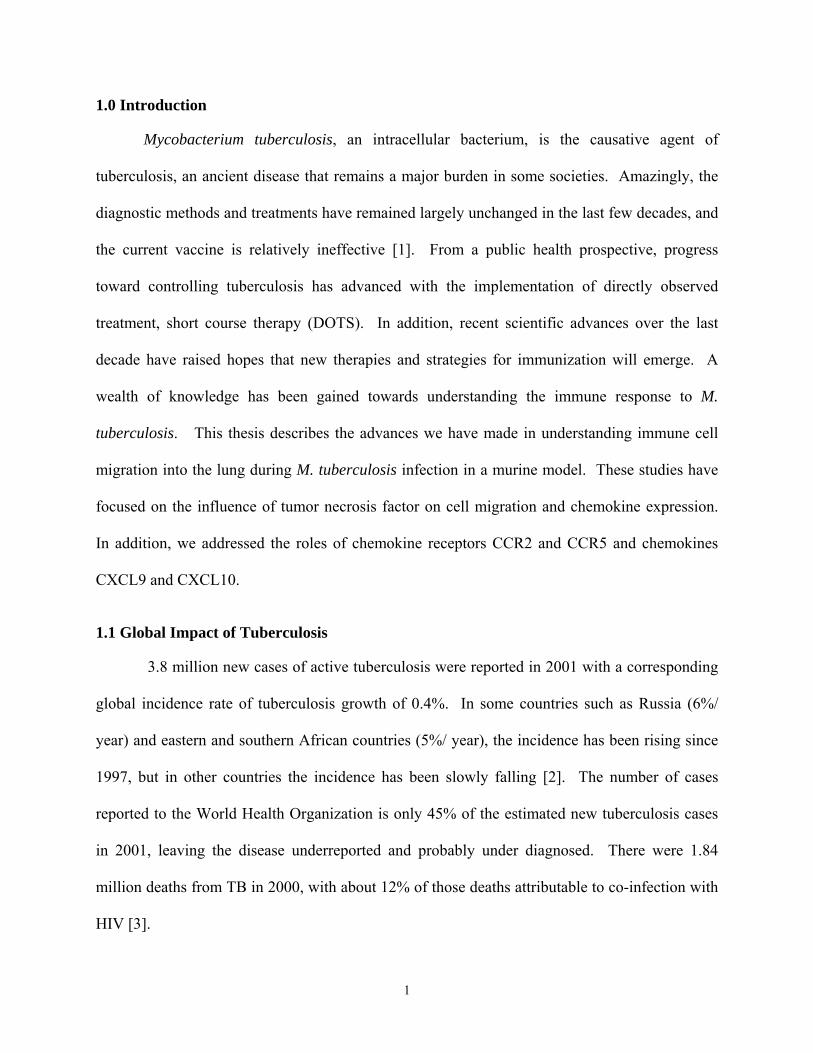
1.0 Introduction
Mycobacterium tuberculosis, an intracellular bacterium, is the causative agent of
tuberculosis, an ancient disease that remains a major burden in some societies. Amazingly, the
diagnostic methods and treatments have remained largely unchanged in the last few decades, and
the current vaccine is relatively ineffective [1]. From a public health prospective, progress
toward controlling tuberculosis has advanced with the implementation of directly observed
treatment, short course therapy (DOTS). In addition, recent scientific advances over the last
decade have raised hopes that new therapies and strategies for immunization will emerge. A
wealth of knowledge has been gained towards understanding the immune response to M.
tuberculosis. This thesis describes the advances we have made in understanding immune cell
migration into the lung during M. tuberculosis infection in a murine model. These studies have
focused on the influence of tumor necrosis factor on cell migration and chemokine expression.
In addition, we addressed the roles of chemokine receptors CCR2 and CCR5 and chemokines
CXCL9 and CXCL10.
1.1 Global Impact of Tuberculosis
3.8 million new cases of active tuberculosis were reported in 2001 with a corresponding
global incidence rate of tuberculosis growth of 0.4%. In some countries such as Russia (6%/
year) and eastern and southern African countries (5%/ year), the incidence has been rising since
1997, but in other countries the incidence has been slowly falling [2]. The number of cases
reported to the World Health Organization is only 45% of the estimated new tuberculosis cases
in 2001, leaving the disease underreported and probably under diagnosed. There were 1.84
million deaths from TB in 2000, with about 12% of those deaths attributable to co-infection with
HIV [3].
1

In the United States, there has been a decline in tuberculosis cases every year since the
resurgence of tuberculosis cases in 1992. The CDC has described a plan to eliminate
tuberculosis in the United States (defined as <1 case per 1,000,000) by the year 2010. In 2002,
there were approximately 15,000 new cases reported to the CDC, representing a 5.7% decline
from 2001. Despite the decline in the percentage of cases, the rate of tuberculosis incidence
remains higher than the country’s target goal in its plan towards tuberculosis elimination. On a
positive note, there was also a decrease in the proportion of multidrug-resistant (MDR)
tuberculosis (from 2.7 to 1.3% in 10 years) [4].
Tuberculosis is in principle, a curable and preventable disease. Its continuing global
impact highlights the disparity between the developing world and the industrialized nations. In
the early 20th century, industrialized nations made improvements on their populations’ nutrition,
sanitation, and economy, leading to declines in the incidences of many infectious diseases, but
today some developing countries are still struggling in these areas. In the 1940s, treatment for
tuberculosis improved with the advent of anti-mycobacterial drugs such as isoniazid,
streptomycin and para-amino salicylic acid (PAS). Since that time, more anti-mycobacterial
drugs have been developed including pyrazinamide, ethambutol and rifampicin, but no new
specific antimycobacterial drugs have been approved over the last 40 years. The current vaccine
for tuberculosis (BCG) is in use in most of the world has shown its effectiveness primarily in
preventing disseminated forms of tuberculosis in young children, but has shown little protection
against pulmonary tuberculosis in adults [reviewed in [1]].
With the initiation the DOTS strategy in 1995, many more countries have started to
address this global health problem. Under the DOTS program, each country adopts the
program’s 5 Pillars: government commitment, diagnosis by smear microscopy, multi-drug
2

chemotherapy treatment for at least 2 months, reliable supply of anti-TB drugs, and outcome
evaluation and records of every patient. The number of countries implementing DOTS has
increased each year since 1995, with 7 countries newly implemented DOTS in 2001 [2],
increasing the number of countries currently implementing DOTS to 155. The percentage of the
world’s population that is consequently covered under DOTS is 61%, and the overall treatment
success rate in DOTS areas is 82%.
1.2 Potential Outcomes to infection
Transmission of M. tuberculosis is principally human-to-human through contaminated
aerosol droplets that enter the alveolar spaces. Therefore, the most common site of infection is
the lung. Although the infection is initiated in the lung, infection can spread throughout the
body, including lymph nodes, central nervous system, pericardium, skin, bone, kidneys, and
larynx. Exposure to M. tuberculosis can lead to three potential outcomes (Figure 1). In ~ 90%
of exposed individuals, a strong cell mediated immune response is mounted by 4-5 weeks after
exposure and results in a subclinical form of the infection, defined as latent tuberculosis. Latent
tuberculosis refers to M. tuberculosis infection without clinical signs of disease [5]; a person can
remain infected for life without developing active tuberculosis, and not be infectious. The
second potential outcome is active clinical tuberculosis. About 5% of exposed persons will
develop active tuberculosis within 2 years of exposure. A final possibility, although it is not
clear how often this occurs, is exposure without successful infection also referred to as clearance
[reviewed in [6]].
3

Exposure to Aerosoled Droplets
Clearance(?)
Control(>90%)
Latency(1/3 World’s Population)
Active Disease(5%- 8 million/year)
Reactivation(5-10%)
Death(2million/year)
Treatment
Figure 1. Potential Outcomes of exposure to the M. tuberculosis bacillus.
Following exposure to M. tuberculosis bacillus there are three potential outcomes. In some cases the bacillus may be cleared without detection by the immune system. In a majority of cases the infection is controlled through the cell mediated immune response and leads to clinical latency. About 5% of individuals exposed to M. tuberculosis will develop active disease in the first 1-2 years after exposure. In addition, it is possible for latent disease to become active. Reactivation of disease can result from immunosuppression.
Typical diagnosis of M. tuberculosis infection in the United States can be achieved
through a delayed type hypersensitivity skin test to purified protein derivatives (PPD) of
mycobacteria. A positive PPD test does not indicate a person has active infection, but rather that
he was exposed and initiated an immune response to M. tuberculosis. Consequently, in the
United States, a PPD positive individual without disease is often treated with isoniazid for 6
months, to reduce the risk of reactivation. In countries where BCG vaccination against
tuberculosis is practiced, transmission of M. tuberculosis is not easy to assess, since BCG results
in PPD positivity for a number of years. Persons with active tuberculosis are treated with multi-
drug therapy (4 different antibiotics for 2 months and an additional 4-10 months of 2 antibiotics)
to prevent drug resistant strains from emerging. Active tuberculosis can be accompanied by
4

night sweats and intermittent fever, weight loss and anorexia, fatigue, and coughing. Active
infection is confirmed through a positive smear test, where the sputum is stained for acid-fast
bacilli, and by culture of the sputum sample. Due to the presence of inflammatory lesions,
granulomata, a chest radiograph can also be a diagnostic tool during or after the infection.
1.3 Influence of external factors
Many factors influence the success rate of tuberculosis control. In Russia, the increased
rates of tuberculosis are related to the destruction of the health care infrastructure, the emergence
of MDR strains, and the lack of monies to treat tuberculosis cases. In the United States,
tuberculosis is most common among immunocompromised individuals, such as the elderly or
HIV+ persons. HIV infection leads to a decline in the numbers of CD4+ lymphocytes, leaving
HIV+ individuals severely immunocompromised. In the absence of CD4+ lymphocytes, M.
tuberculosis cannot be controlled [7-10]. Immunocompromise induced by steroids, anti-
inflammatory therapies, alcohol, or malnourishment causes increased risk of tuberculosis.
An estimated 10.7 million people were coinfected with M. tuberculosis and HIV in 1997
[reviewed in [11, 12]]. From those 10.7 million coinfected individuals, approximately 640,000
will develop tuberculosis disease. A majority of the tuberculosis/HIV coinfected patients are
found in sub-Saharan Africa and southeast Asia. An estimated 60,000 reside in North America.
Treating HIV in the presence of M. tuberculosis infection can be somewhat complicated due to
significant interactions between the rifamycins and the antiretroviral protease inhibitors and non-
nucleoside reverse transcriptase inhibitors. In addition HIV infection can change the progression
of tuberculosis disease. Extrapulmonary tuberculosis, particularly in the lymph node is more
common in HIV-positive individual than HIV-negative individuals. Although analysis of chest
radiographs do not indicate any abnormalities in HIV-positive individuals with >200 CD4+
5

cells/µl, HIV-positive individuals with < 200 CD4+ cells/µl do having increased mediastinal
adenopathy (which is also common in children with primary tuberculosis). M.tuberculosis
infection also appears to change the progression of HIV infection because M. tuberculosis
infection leads to induction of proinflammatory cytokines, including TNF. TNF can upregulate
intracellular retroviral replication enhancing HIV infection.
6

2.0 Animal Models of Tuberculosis
Current animal models used to study M. tuberculosis include mouse, guinea pig, rabbit,
and nonhuman primate models. All of these models have some features in common with human
tuberculosis, including infection by depositing a few virulent bacilli directly into the lung,
development of a granuloma (inflammatory lesion), and onset of a strong cell mediated immune
response. However, there are differences in each animal species’ ability to control infection,
limit dissemination, and develop persistent infection.
The use of these animal models could not have been possible without the development of
microbiology and engineering techniques to work with M. tuberculosis. These include growth of
M. tuberculosis in liquid media, the improved methods for storing the bacillus and the ability to
enumerate bacilli on solid media. Aerosol exposure chambers allow reproducible low dose
infection via the physiologically relevant respiratory route.
2.1 Monkey
Nonhuman primates have been used as models for tuberculosis infection for years. In the
1970s these animals were used to address the efficacy of BCG vaccination, ideal route of
administration, and the differences between strains of BCG [13-15]. The nonhuman primate
model also served as a good model for testing new drugs as they became available, serving as a
good intermediate step between testing drugs in the mouse model and in man [16]. The model
was used to evaluate single and multiple drug regiments using antituberculosis drugs including
isoniazid, streptomycin, p-amino-salicylic acid, cycloserine, ethambutol and others. Following
these studies the use of nonhuman primates declined due to the high cost and space required for
the studies. More recently, interest in using the primates has reemerged as the research has
7

indicated that infection of nonhuman primates leads to disease that closely resembles human
disease [17]. Both primary and latent disease can be modeled in macaques, and there is an
extensive array of reagents for immunologic studies in monkeys [17]. Difficulties in the use of
these animals for tuberculosis research include the requirement for BSL3 primate space, out bred
populations, and cost.
2.2 Rabbit
The rabbit is one of the few animal models able to form liquefied necrotic or cavitary
granulomas in response to M. tuberculosis. Cavitation occasionally occurs in human
tuberculosis and leads to the release of massive numbers of bacilli for dissemination.
Interestingly, rabbits are much more susceptive to M. bovis than to M. tuberculosis. A
disadvantage of rabbit models of tuberculosis is that the cost is relatively high and they require
more biosafety level 3 (BSL3) space than guinea pig or mouse models. Another disadvantage is
that there are limited reagents available for the immunological studies.
2.3 Guinea Pig
In contrast to mice and humans, the guinea pig is highly susceptible to M. tuberculosis
infection and develops progressive pulmonary infection [18]. Even a single virulent tubercle
bacillus can lead to progressive infection and death. In this model, there is extremely high
extrapulmonary dissemination. These animals can be protected to some degree from
tuberculosis with BCG vaccination, and they do develop granulomas similar to humans (except
for the lack of cavitation). A drawback of this model for immunologic research is the scarcity of
immunological reagents. Current efforts are being made in cloning and developing cytokine and
chemokine reagents for use in this model [19-22].
8

2.4 Mouse
Immunological and microbiologic studies of M. tuberculosis have advanced most
dramatically in the mouse models of tuberculosis, but as with all models, they have limitations
[reviewed in [18, 23]]. The mouse models of tuberculosis are cost and space efficient. Similar
to humans, the mouse is capable of generating a strong adaptive immune response to M.
tuberculosis and can control low dose inocula. The mouse model of tuberculosis was used by
Robert Koch to test his famous set of postulates on field mice inoculated with M. tuberculosis
[24]. Over the last century, the model has evolved and played a key role in the discovery of
streptomycin and other anti-mycobacterial drugs. Following drug discoveries, the mouse
became a model of vaccine study with BCG immunization. Furthermore, it was the mouse
model that generated data indicating a cell mediated immune response is initiated in response to
M. tuberculosis and that control was not primarily mediated by the humoral immune response.
Another advantage of the mouse model is the availability of immunological reagents. Genetic
manipulation has revolutionized the use of the mouse as a model for disease. Both transgenic
knockout and over-expression systems allow for in depth analyses of mechanisms by which the
mouse controls M. tuberculosis infection. The use of monoclonal antibodies to measure cytokine
production, block functioning proteins, and characterize the cell populations in response to M.
tuberculosis infection has been instrumental in advances made in immunological research.
There are a variety of strains available for analysis of M. tuberculosis infection in mice.
The most commonly used is the C57Bl/6 strain, which is often described as being relatively
resistant to tuberculosis [mean survival time(MST)=315d] [25]. Other strains, such as the
BALB/c mouse, are also considered resistant to infection administered via aerosols (MST, 245d).
On the other hand, more susceptible mouse strains include the CBA, C3H, and DBA/2J strains
(MST, 110d).
9

A clear disadvantage of the mouse model is the relatively high bacterial burden in the
lungs. The bacterial burden in mice rises almost uninhibited during the first 3 weeks after
infection, and the number of bacilli then reaches a plateau between 105 and 106 (Figure 2).
Despite the magnitude of the bacterial burden, the mice survive for approximately a year.
Immunocompromising conditions or age can spark reactivation with a rise in bacterial burden. A
typical life-ending burden in the mouse is >108 CFU/lung, but can reach 109 CFU/lung. Our
studies, some of which will be described in this thesis, indicate that the peak of the immune
response in C57Bl/6 mice is actually more robust than necessary to control infection. Another
disadvantage is that although mononuclear infiltrates form in the lungs of infected mice, they
rarely develop necrotic or caseous granulomas, and the structure only slightly resembles that of a
human pulmonary granuloma [26].
Bacterial Burden in the Lung
0 50 100 150 200100
101
102
103
104
105
106
107
108
C57BL/6 mice
Days Post Infection
Col
ony
Form
ing
Uni
ts/ L
ung
Figure 2. Bacterial burden in the lungs of wild type C57Bl/6 mice.
C57Bl/6 mice infected with 50-100 colony forming units through aerosols can control bacterial burden by approximately 4 weeks post infection. At this time point the mycobacterial burden reaches a plateau at about 106 colony forming units. (These data were generated in our laboratory, unpublished).
10

The mouse model has been modified to study latent tuberculosis. The definition of
murine latency and human latency are the same, but there are differences in latency in these two
species [reviewed in [27]]. Latency can be defined as a stable M. tuberculosis burden in the
lungs without clinical signs or histological changes. In the human, the bacterial numbers are
believed to be very low or almost undetectable during latency, whereas, the infection stabilizes at
~106 CFU/lung in the mouse. Therefore, the “latent murine model” has also been referred to as
“chronic persistent tuberculosis”, for there is clearly an active immune response employed to
maintain control of the bacteria, resulting in a chronic infection.
Other models have been developed in mice to more closely resemble the human disease,
at least in terms of bacterial numbers, such as the Cornell model [28-30]. This model relies on
the use of anti-mycobacterial drugs to control the initial infection. Unfortunately, there is no
standard protocol for this model. When this model was first described in the 1950s, the
chemotherapy was initiated just 20 minutes post inoculum. Since that time, the dose and strain
of M. tuberculosis, the time of initiation of chemotherapy, and the length, type, and dose of
chemotherapy have varied from experiment to experiment. For immunological studies the
Cornell model has proven to be inconsistent, and if chemotherapy is initiated early after
infection, the antibiotics rather than the immune response is primarily responsible for controlling
infection. Despite the difficulties establishing a latent tuberculosis murine model, studies of
chronic persistent infection in mice have generated insights to immune responses during this
stage of infection [6].
11
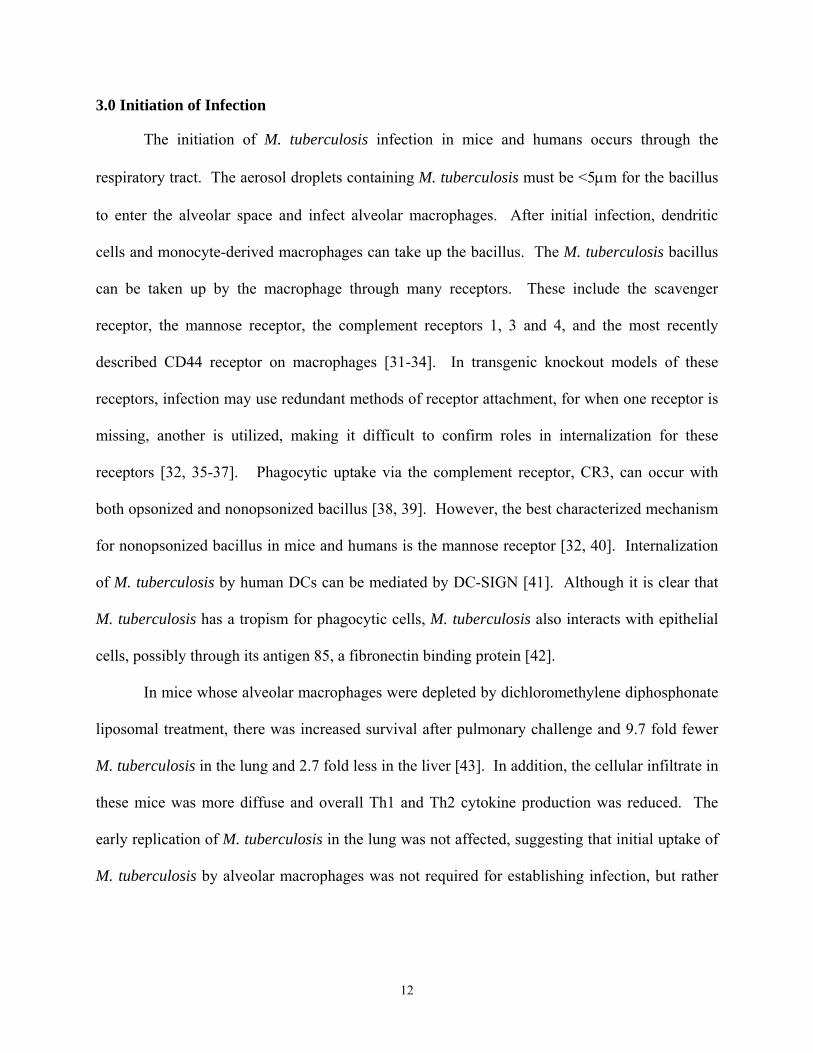
3.0 Initiation of Infection
The initiation of M. tuberculosis infection in mice and humans occurs through the
respiratory tract. The aerosol droplets containing M. tuberculosis must be <5µm for the bacillus
to enter the alveolar space and infect alveolar macrophages. After initial infection, dendritic
cells and monocyte-derived macrophages can take up the bacillus. The M. tuberculosis bacillus
can be taken up by the macrophage through many receptors. These include the scavenger
receptor, the mannose receptor, the complement receptors 1, 3 and 4, and the most recently
described CD44 receptor on macrophages [31-34]. In transgenic knockout models of these
receptors, infection may use redundant methods of receptor attachment, for when one receptor is
missing, another is utilized, making it difficult to confirm roles in internalization for these
receptors [32, 35-37]. Phagocytic uptake via the complement receptor, CR3, can occur with
both opsonized and nonopsonized bacillus [38, 39]. However, the best characterized mechanism
for nonopsonized bacillus in mice and humans is the mannose receptor [32, 40]. Internalization
of M. tuberculosis by human DCs can be mediated by DC-SIGN [41]. Although it is clear that
M. tuberculosis has a tropism for phagocytic cells, M. tuberculosis also interacts with epithelial
cells, possibly through its antigen 85, a fibronectin binding protein [42].
In mice whose alveolar macrophages were depleted by dichloromethylene diphosphonate
liposomal treatment, there was increased survival after pulmonary challenge and 9.7 fold fewer
M. tuberculosis in the lung and 2.7 fold less in the liver [43]. In addition, the cellular infiltrate in
these mice was more diffuse and overall Th1 and Th2 cytokine production was reduced. The
early replication of M. tuberculosis in the lung was not affected, suggesting that initial uptake of
M. tuberculosis by alveolar macrophages was not required for establishing infection, but rather
12

that later in the infection the alveolar macrophages may play a role in the maintaining a
pulmonary infection.
Initial uptake can lead to killing of M. tuberculosis through phagolysosomal fusion and
acidification, but this process is dependent on the microenvironment of the macrophage. The
live bacillus can inhibit phagolysosomal fusion by recruiting a host tryptophan aspartate
containing coat protein (TACO), which prevents maturation of the phagosome [44]. TACO is
released during normal phagosome maturation into lysosomes. With retention of TACO on the
phagosome, the M. tuberculosis can survive and replicate. In addition to retention of TACO, the
M. tuberculosis containing phagosome possibly accumulates Rab5 and excludes Rab7 indicating
that the phagosome is arrested at the early endosomal stage [reviewed in [45]].
M. tuberculosis does not completely go under the immune radar prior to the cell mediated
immune response. There is an innate immune response to the bacillus. M. tuberculosis and
other bacteria have pathogen associated molecular patterns (PAMPs) that can be recognized by
various receptors, initiating immune responses. The M. tuberculosis bacillus is recognized by
toll-like receptors (TLRs), the mannose receptor, complement receptors, and the
lipopolysaccaride (LPS) receptor. Both viable and dead M. tuberculosis can activate murine
macrophages expressing TLR2 and TLR4 [reviewed in [46, 47]]. The LPS receptor, CD14,
enhances the macrophage’s ability to respond to lipoarabinomannan (LAM), a mycobacterial cell
surface molecule [48]. There is evidence that mycobacterial lipoproteins, such as 19kDa protein,
are recognized by TLR2. The 19kDa protein can inhibit MHC Class II expression and processing
of soluble antigens through TLR-2 signaling [49-51]. In addition, the 19kDa protein can induce
macrophage apoptosis through TLR2 [52]. Interaction of the bacillus with TLR2 also leads to
production of IL-12, IL-8, IL-23 and TNF [47, 53-55], cytokines essential for control of
13
infection, while TLR4 ligation supported the production of IL-12 and CXCL10. Whether TLR2
and TLR4 are required for control of infection, or if their roles are redundant was addressed in
transgenic knockout models. TLR2 and TLR4 deficient mice controlled acute infection similar
to wild type mice, when a low dose aerosol route was utilized [56]. When the dose was
increased 20-fold, these knockout mice both exhibit increased susceptibility to infection. In
addition, during chronic infection TLR4 -/- mice succumbed to low dose aerosol infection by 5-7
months post infection exhibiting impaired macrophage recruitment and proinflammatory
cytokine responses [57]. These data suggest a role for TLR4 in the adaptive immune response
during chronic infection, which is somewhat surprising considering the general belief that toll-
like receptors’ major role is the initiation of the immune response.
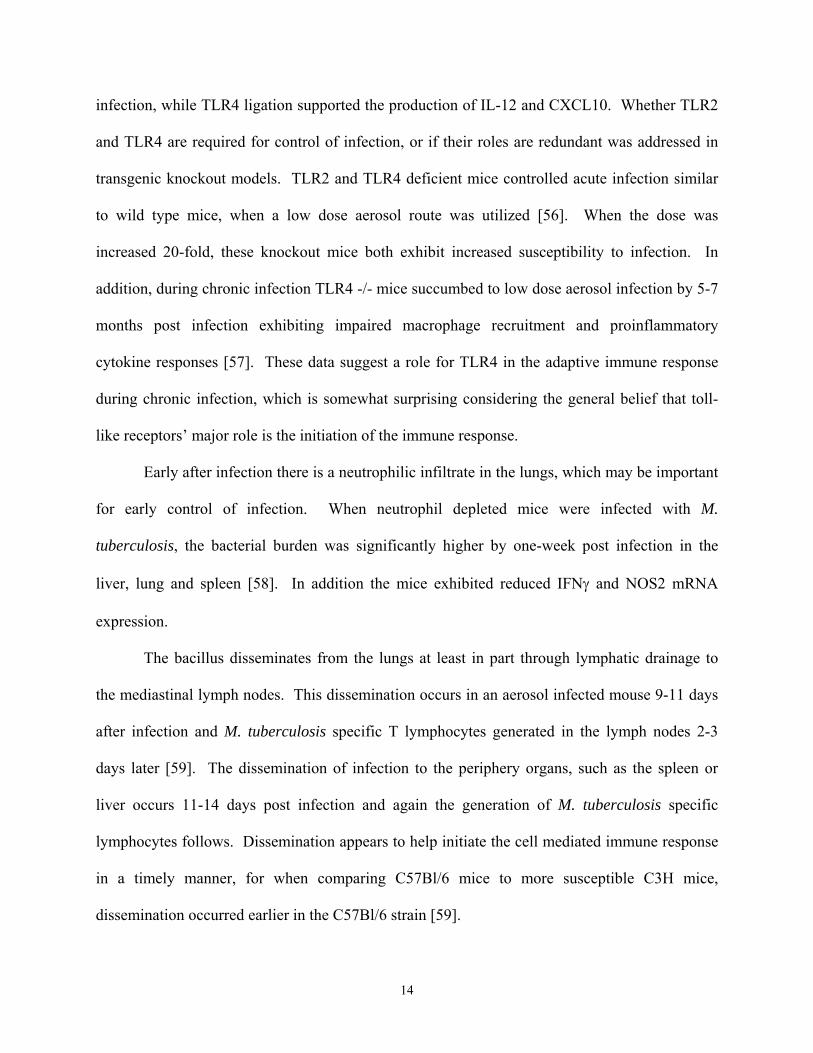
Early after infection there is a neutrophilic infiltrate in the lungs, which may be important
for early control of infection. When neutrophil depleted mice were infected with M.
tuberculosis, the bacterial burden was significantly higher by one-week post infection in the
liver, lung and spleen [58]. In addition the mice exhibited reduced IFNγ and NOS2 mRNA
expression.
The bacillus disseminates from the lungs at least in part through lymphatic drainage to
the mediastinal lymph nodes. This dissemination occurs in an aerosol infected mouse 9-11 days
after infection and M. tuberculosis specific T lymphocytes generated in the lymph nodes 2-3
days later [59]. The dissemination of infection to the periphery organs, such as the spleen or
liver occurs 11-14 days post infection and again the generation of M. tuberculosis specific
lymphocytes follows. Dissemination appears to help initiate the cell mediated immune response
in a timely manner, for when comparing C57Bl/6 mice to more susceptible C3H mice,
dissemination occurred earlier in the C57Bl/6 strain [59].
14

4.0 Acquired Immune Response
M. tuberculosis infection is controlled primarily through the cell mediated immune (CMI)
response. T cells are primed and activated within the lymphatics and the protective response is
mediated within the lungs in the granuloma. This response involves many cell types including
dendritic cells, macrophages, CD4+ and CD8+ T lymphocytes, and B lymphocytes [26, 60].
Although each of these cell types clearly is induced in response to infection, their functions
during M. tuberculosis infection are still being defined. The chart below illustrates susceptibility
of many transgenic knockout mice with M. tuberculosis infection. In addition it summarizes the
cellular infiltrates found in the mice, since we have demonstrated that even resistant mice can
have altered cell infiltration compared to wild type mice.
15
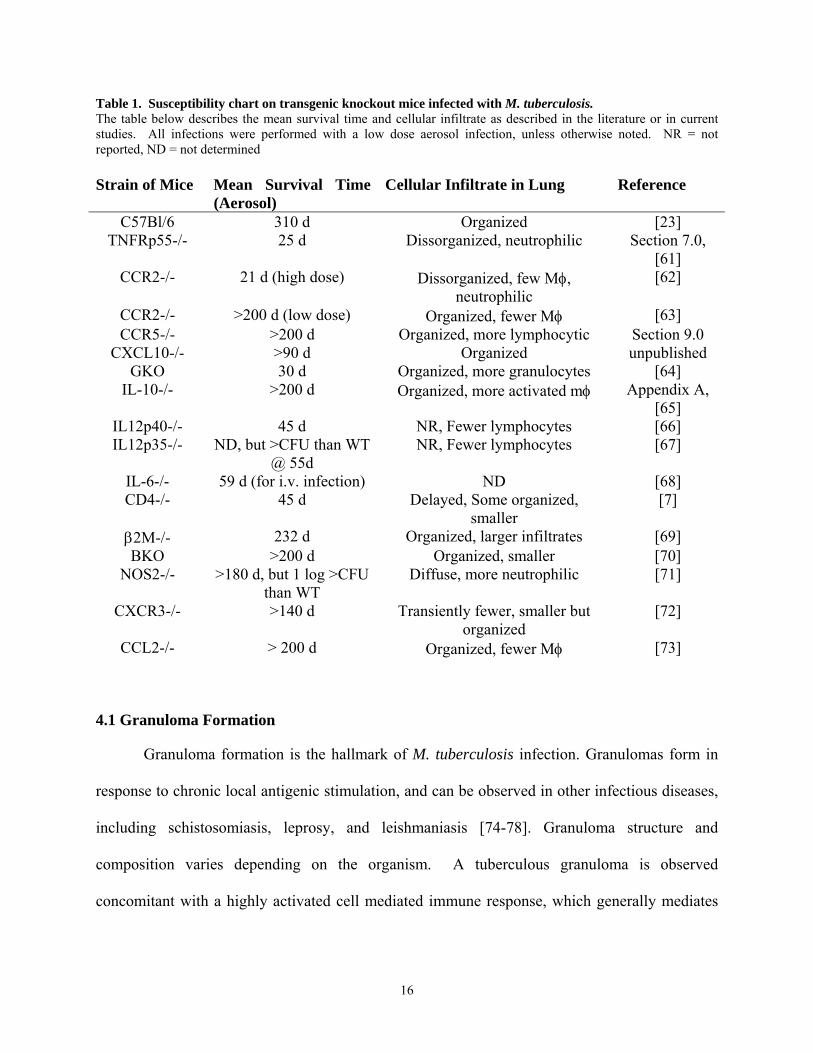
Table 1. Susceptibility chart on transgenic knockout mice infected with M. tuberculosis. The table below describes the mean survival time and cellular infiltrate as described in the literature or in current studies. All infections were performed with a low dose aerosol infection, unless otherwise noted. NR = not reported, ND = not determined Strain of Mice Mean Survival Time
(Aerosol) Cellular Infiltrate in Lung Reference
C57Bl/6 310 d Organized [23] TNFRp55-/- 25 d Dissorganized, neutrophilic Section 7.0,
[61] CCR2-/- 21 d (high dose) Dissorganized, few Mφ,
neutrophilic [62]
CCR2-/- >200 d (low dose) Organized, fewer Mφ [63] CCR5-/- >200 d Organized, more lymphocytic Section 9.0
CXCL10-/- >90 d Organized unpublished GKO 30 d Organized, more granulocytes [64]
IL-10-/- >200 d Organized, more activated mφ Appendix A, [65]
IL12p40-/- 45 d NR, Fewer lymphocytes [66] IL12p35-/- ND, but >CFU than WT
@ 55d NR, Fewer lymphocytes [67]
IL-6-/- 59 d (for i.v. infection) ND [68] CD4-/- 45 d Delayed, Some organized,
smaller [7]
β2M-/- 232 d Organized, larger infiltrates [69] BKO >200 d Organized, smaller [70]
NOS2-/- >180 d, but 1 log >CFU than WT
Diffuse, more neutrophilic [71]
CXCR3-/- >140 d Transiently fewer, smaller but organized
[72]
CCL2-/- > 200 d Organized, fewer Mφ [73]
4.1 Granuloma Formation
Granuloma formation is the hallmark of M. tuberculosis infection. Granulomas form in
response to chronic local antigenic stimulation, and can be observed in other infectious diseases,
including schistosomiasis, leprosy, and leishmaniasis [74-78]. Granuloma structure and
composition varies depending on the organism. A tuberculous granuloma is observed
concomitant with a highly activated cell mediated immune response, which generally mediates
16

control of mycobacterial numbers in the lungs. This is an attempt by the host to contain the
infection, however the resulting pathology can cause complications for the host.
The granuloma functions to control M. tuberculosis infection by orchestrating
communication between immune cells (Figure 3). It creates a local environment for the cells to
interact leading to an effective immune response where cytokine production, macrophage
activation and CD8 T cell effector functions lead to killing of M. tuberculosis. The granuloma
also physically contains the bacilli, walling off and preventing spread of the infection. These
actions lead to inhibition of growth or death of M. tuberculosis, in part by enhancing macrophage
activation and creating an oxygen and nutrient deprived environment.
Figure 3. Granuloma formation in the lungs of M. tuberculosis infected mice.
This model of granuloma formation was created based on the literature and our studies. Macrophages after infection with M. tuberculosis produce TNF and many chemokines. These chemokines are from both the C-C and C-X-C chemokine families of inducible chemokines. The receptors for these chemokines include CCR2, CCR5, CXCR3, among others, which are present on many of the immune cells that migrated to the lungs during M. tuberculosis infection and ultimately play a role in the granuloma.
17
The granuloma is composed of many different cells, including macrophages, dendritic
cells, CD4 and CD8 T lymphocytes, and B lymphocytes [26, 60]. The macrophages in human
infection can differentiate into multinucleated giant cells. Occasionally, such giant cells can be
observed in murine granulomas, but usually under conditions of severe inflammation. In human
granulomas, the macrophages are centrally located with the lymphocytes surrounding and
infiltrating the macrophage area. Some of the macrophages are infected and many have an
activated appearance. Necrosis can occur in granulomas, beginning in the center of the structure,
which may progress to caseous or necrosis in human tissue. The caseous material is usually
solid, but if the infection is not controlled, can liquify and support extracellular replication of M.
tuberculosis. Caseous granulomas can progress to form cavities within the lung, leading to
erosion of the granuloma into a bronchus, and the subsequent release of bacteria into the airways.
Solid granulomas without obvious necrosis are also observed. These granulomas may be
controlling or clearing the infection, or may be simply observed prior to undergoing necrosis.
Fibrosis of a granuloma seems to occur as the granuloma controls the infection and the
inflammatory process is limited. In a latently infected person, one or more granulomas
controlling the infection can sometimes be observed; these granulomas can also be calcified.
In murine models of tuberculosis, the granuloma is arranged differently but performs the
same functions of limiting bacterial replication and spread of infection, as well as localizing the
inflammatory and immune response to the site of infection within the lung. Rather than the
macrophages being centrally located, they are arranged in sheets in the lungs, adjacent to loose
aggregates of lymphocytes. As infection progresses, many macrophages appear foamy, an
indication of activation. Lymphocytic infiltrate is observed around perivascular spaces early
after aerosol infection; these cells migrate further into the lung parenchyma as the infection
18

progresses. The aggregates of T lymphocytes with macrophages (i.e. granuloma formation)
begin to form by 2-3 weeks post infection, but are larger and more organized by 4 to 5 weeks
post infection. CD4, CD8 and γδ T cells are present in these aggregates. B lymphocytes also
migrate to the lung at a similar time. The aggregates of B cells form tighter clusters as the
infection progresses, and can be distinguished from the T lymphocytes because the cells are
more tightly packed. There is also an influx of neutrophils in the lung early after infection,
which peaks ~2 to 3 weeks post-infection in mice that control infection and then decreases to
very low levels. The total numbers of T and B cells stabilize by 5 to 6 weeks post infection and
granulomas are well established. If bacterial numbers are not controlled by the immune response,
infiltration of cells continues and the cellular aggregates increase, resulting in much of the lung
filled with inflammatory cells, limiting airway space. If mice are immunocompromised (e.g.
IFN-γ deficient mice) and progress to high bacterial burdens, necrosis of the granulomas is often
observed, with extensive neutrophil infiltration. Necrosis in granulomas of mice is almost always
associated with high M. tuberculosis numbers; necrosis is rarely observed in wild type mice that
are controlling the infection, even in long-term infections. This may be a different situation than
that of humans, where it is believed that the immune response contributes to necrosis within the
granuloma.
4.2 Cellular Interactions during the protective immune response
4.21 Dendritic Cells
Dendritic cells are a key link between innate and adaptive immunity. As potent antigen
presenting cells and potent responders to PAMPS, dendritic cells often influence the strength and
type of adaptive immune response [79]. M. tuberculosis infection of bone marrow derived
dendritic cells results in the upregulation of cell surface molecules, such as ICAM, B7.1, and
19

B7.2. In addition, infection of murine DCs leads to increased expression of inflammatory
cytokines, IL-12, TNF, IL-1β, and IL-1α [80-82]. These cytokines initiate Th1 responses in T
lymphocytes, stimulating the production of IFNγ and other cytokines. In addition, infected
human dendritic cells produce chemokines, such as CCL3, CCL4, CXCL9 and CXCL10 [83],
which appear to recruit activated NK and T lymphocytes. Beyond initiation of the immune
response, the DCs may play a role in adaptive immunity, especially in chronic infections such as
M. tuberculosis. Although murine DCs do produce reactive nitrogen intermediates (RNI) and
reactive oxygen intermediates, they do not actively kill the M. tuberculosis bacillus (K. Bodnar
and J.L.Flynn, unpublished). Rather, they produce more peroxynitrite (K. Bodnar, unpublished),
a form of RNI, which is nontoxic to pathogenic mycobacterium [84]. In addition, a bacillus-
containing phagosome (or vesicle) within activated DCs is structurally different than a
phagosome containing M. tuberculosis in an activated macrophage (K. Bodnar, unpublished).
Within the activated macrophage, some of the vesicles containing M. tuberculosis form multiple
membranes around the bacillus. Studies in human DCs support the findings in the murine
system [85]. The mycobacterial vacuoles of infected human DCs neither acidify nor fuse with
lysosomes, explaining why the mycobacteria are not killed. In addition the lack of
communication between these vacuoles and the normal host cell recycling machinery may
indicate why the bacteria also do not multiply. M. tuberculosis survival within the dendritic
cell, possibly in a non-replicating state, may be beneficial for the immune response, providing a
long term source of antigen for presentation to lymphocytes. Dendritic cells have been described
in the lung and within granulomas of both mice and humans [60, 86]. In the mouse model the
CD11c+ dendritic cells in the lungs of infected mice appear to be of mixed phenotype, some
mature, while most immature [60].
20

4.22 Macrophages
The role of macrophages in the CMI response is no less complicated. With many
different states of macrophages (activated and unactivated), and types of macrophages
(residential, alveolar and newly recruited monocytes), it can be difficult to clearly define
different macrophage responses to M. tuberculosis infection. Macrophages, as described earlier,
are a first line of defense against infection, but their role in the CMI response is a key to control
of infection. Macrophages can be activated by stimulation with inflammatory cytokines, such as
IFNγ, but IFNγ alone cannot stimulate a macrophage to produce RNIs and ROIs. Another signal
such as TNF or LPS or another bacterial product is required. Activated macrophages are capable
of bacteriocidal activity on M. tuberculosis, presumably within the phagolysosome, where the
acidic vesicle contains hydrolases, ROI, and RNI. The importance of RNI to control of infection
is a highly debated point. In the murine system, RNI appears essential for control of infection
[87]. On the other hand, in the human system, a role has not clearly been defined. Immature
macrophages, or newly recruited monocytes, appear to be less effective as antimicrobial forces,
and may serve as a preferred host for the M. tuberculosis bacillus. Macrophage
antimycobacterial function may also be stimulated by GM-CSF and IL12. On the other hand,
IL-6 and IL-1 do not appear to have a significant affect on the mycobacterial growth. Recent
evidence indicates that this may be due to a block in the IL-6 signaling via the 19Ka M.
tuberculosis protein [49, 88].
The role of macrophages in control does not lie solely within the phagosome, but also in
the context of macrophage- T cell interaction. Macrophages, like dendritic cells, also present
antigen in the context of major histocompatibility class I (MHC), class II, and non classical
molecules to T lymphocytes. But recent data has shown that macrophages are not as effective as
21

dendritic cells in priming naïve T cells to develop a Th1 phenotype. The inability of
macrophages to prime Th1 cells has been attributed to the production of IL-10 by macrophages
and minimal IL-12 production [80]. The presentation of antigen by macrophages in the context
of MHC I may be a major factor in the ability of CD8+ lymphocytes to contribute to host defense
through CTL activity.
4.23 CD4+ T lymphocytes
The continual interaction between T lymphocytes and antigen presenting cells allows for
surveillance and containment of infection (Figure 4). In an oversimplified model, the
macrophage produces stimulatory cytokines and presents antigen to activate the T lymphocytes,
and T lymphocytes produce IFNγ and TNFα to activate the macrophages. CD4 T lymphocytes
play a key role in IFNγ production and control of M. tuberculosis. CD4-/- mice are unable to
control M. tuberculosis infection. Interestingly, eventually the CD8 T lymphocytes in the CD4-/-
mice produce enough IFNγ to make up for the deficiency in CD4 lymphocytes, but the mice still
succumb to infection [7]. Therefore, CD4 lymphocytes may perform an additional function in
the CMI response that cannot be compensated for by other cells. This was also evident in
chronic studies where CD4+ T lymphocytes were depleted through antibody administration. The
CD4 T cell-depleted mice were unable to control infection, despite having similar levels of IFNγ
compared to control mice [8].
There is increasing evidence that CD1 restricted CD4 lymphocytes may play a role in
lipid antigen specific responses during infection [89]. In healthy human subjects with previous
exposure to M. tuberculosis, CD1-restricted M. tuberculosis specific T cells comprise a
significant portion of their circulating CD4+ blood. Interestingly, patients with active TB had
22

low CD1 specific proliferative responses until after two weeks of chemotherapy when their lipid
specific proliferative responses increased significantly.
CD4 cells may be very important for stimulation of dendritic cells and cross priming of
CD8 lymphocytes, as evidenced in many viral models. Studies addressing this hypothesis are
underway. CD4 cells also can be cytolytic, acting on infected cells through the Fas – FasL
interaction. Antibody blockade of CD95- CD95L interaction of CD4+ cells from healthy
tuberculin skin test-positive persons with autologous monocytes decreased cytotoxicity by 25%
[90]. Mice deficient in CD95 signaling were able to control acute infection similar to wild type
mice, but entering the chronic stage of infection, the CD95L-/- and CD95-/- mice were gradually
unable to control the bacterial burden [91].
4.24 CD8+ T lymphocytes
There is growing support for a role for CD8 lymphocytes in the CMI response to M.
tuberculosis. MHC Class I molecule appears to be important for the control of M. tuberculosis,
for mice deficient in beta-2-microglobulin (β2M-/-) are more susceptible to M. tuberculosis
infection [69]. Use of this model to study CD8 T cell responses does not rule out the possibility
that the increased susceptibility was due to a lack of non-classical MHC Class Ib, but the
additional finding that TAP deficient mice [92], which also lack CD8+ lymphocytes, exhibited
increased susceptibility to infection supports the idea that MHC Class I restricted CD8
lymphocytes are required to control infection. Vγ9/Vδ2 T cell lines generated from the
peripheral blood mononuclear cells (PBMCs) of PPD+ healthy individuals can kill M.
tuberculosis infected macrophages both by a perforin and granulysin dependent mechanisms
[93]. More recently it has been shown that CD8 lymphocyte precursors can be found in the lungs
and lymph nodes of M. tuberculosis infected mice. These precursors increase in frequency
23

during the first 4 weeks post aerosol infection and then their frequency wanes (V. Lazarevic,
unpublished). In support of CD8 lymphocytes acting as cytotoxic cells, perforin can be detected
in cells and tissues of M. tuberculosis infected mice [94] and T lymphocytes, isolated from
infected mice and cultured short term with M. tuberculosis infected dendritic cells, can lyse
target M. tuberculosis infected cells and produce IFNγ [95].
4.25 B lymphocytes
Following M. tuberculosis infection there is a considerable B lymphocyte infiltration in
the lungs and the cells are located within the granuloma (unpublished, Flynn). Low – dose
aerosol infection of B cell knockout mice (BKO) with M. tuberculosis led to altered
dissemination and granuloma formation. The BKO mice had similar numbers of bacteria in their
lungs, but the dissemination to peripheral organs was delayed and the pulmonary lesions were
less severe. These differences have been linked to absence of the cells in the mice, not due to
lack of antibody response [70]. During chronic infection, the absence of B lymphocytes did not
appear to affect the M. tuberculosis infection [96] further indicating that these cells may be
present as a reaction to the inflammation, but their presence is neither an advantage nor
disadvantage for the host. On the other hand, when BKO mice were infected i.v. with a high
dose of virulent H37Rv M. tuberculosis, the mice exhibited increased bacterial load in their lungs
by 4-6 weeks post infection compared to wild type mice [97].
24

Figure 4. Cell mediated immune response to M. tuberculosis.
M. tuberculosis (red circles) infection of macrophages and dendritic cells (APC) leads to the presentation of antigen in the context of MHC-Class I and –Class II (MHC). Subsequently in the lymph nodes both CD4+ and CD8+ cells are primed and activated through ligation of their T cell receptors (TCR) interacting with MHC presenting M. tuberculosis antigens. These cells then migrate to the lungs where they are activated. They produce cytokines (IFN, TNF) and interact through macrophages (Mφ) to initiate expression of reactive nitrogen intermediates (including NO), resulting in the killing of the bacillus. In addition CD8 lymphocytes act as cytotoxic T lymphocytes (CTL) by lysing the macrophages harboring the bacillus or by direct killing mechanisms, such as granulysin.
4.3 Cytokine mediated actions
It is evident that the communication between immune cells is not only through cell-cell
interaction, but also through cytokine signaling. In this section, the roles of both pro-
inflammatory and anti-inflammatory cytokines will be addressed in more detail.
It has been demonstrated both experimentally and clinically that IFNγ is an essential
cytokine for the development of protective immunity against M. tuberculosis infection. IFNγ
deficient mice (GKO) exhibit increased susceptibility to disease [Table 1,[64, 98]]. Infection of
GKO mice led to florid bacterial growth and tissue destruction. Furthermore, patients with
defective receptors for IFNγ and IL-12 are more susceptible to M. tuberculosis and other less
25

pathogenic mycobacteria [99]. GKO mice do generate antigen-specific T lymphocytes, but lack
the ability to induce NOS2 in macrophages [100]. The cellular infiltrate in the lungs following
aerogenic infection consisted of >50% granulocytes with many neutrophils and even eosinophils
[100].
IL-12 is a key cytokine involved in differentiation of T cell responses and initiation of
Th1 cytokine responses. The IL-12p70 molecule is a heterodimer, consisting of a p40 and p35
subunit acting through the IL-12R. IL-12 can also form a homodimer of p40 subunits that
appears to act as an antagonist to IL-12p70. More recently the p40 subunit was found to have
some IL-12 like activities. When IL-12p40-/- mice and IL-12p35-/- mice were infected with M.
tuberculosis, p40-/- mice were more susceptible to disease than p35-/- mice (which were still
more susceptible to disease than control, wild type mice) [Table 1,[67]]. The p35-/- mice were
able to generate antigen specific responses. This finding indicates that the p40 subunit, which is
also a subunit for IL-23, has functions that are independent of p35.
Another targeted cytokine deletion that leads to profound susceptibility in mice when
infected with M. tuberculosis is disruption of the TNF gene or its p55 subunit receptor [101-
103]. When infected via aerosol or intravenous routes, TNF deficient mice succumb to infection
with a mean survival time of approximately 28 days. TNF deficient mice lack granuloma
structure and have a large influx of neutrophils as the bacterial burdens increase. These mice are
unable to activate macrophages and the production of NOS2 is reduced. Clearly, TNF’s effects
on tissue can be both beneficial and detrimental, and TNF’s involvement in the host response is
on many levels. The roles of TNF on the host response are described in more detail in chapter 1.
Recently, therapies have been developed that inhibit TNF signaling, in an effort to reduce
inflammation during such chronic diseases as rheumatoid arthritis or Crohn’s disease. Both a
26
humanized anti-TNF neutralizing antibody (Infliximab) and an antibody – TNF receptor fusion
protein (Etanercept) have been implemented for this purpose. Unfortunately, use of these drugs
increased the risk of reactivation of tuberculosis in latently infected (PPD+) individuals [104].
The incidence of tuberculosis was higher in patients prescribed Infliximab than Etanercept [105].
The stronger correlation between Infliximab and tuberculosis may be due the use of this
treatment in Europe (where a higher percentage of the population has latent tuberculosis), or it
may be a reflection of the different binding capability of the drugs. Infliximab strongly binds
monomeric, trimeric and transmembrane forms of TNF, whereas Etanercept binds strongly to
trimeric forms and weakly to monomeric and transmembrane forms of TNF. There is also
evidence that Infliximab treatment induces drug-mediated apoptosis and monocytopenia.
The patient population receiving Infliximab treatment not only had a higher incidence of
tuberculosis then the general population, but they also had a higher incidence of extrapulmonary
and disseminated disease. Studies in our murine model of tuberculosis have recapitulated these
findings [106]. Although the mechanisms underlying the TNF dependent control of acute and
latent tuberculosis has not been clearly elucidated, TNF appears to modulate cell migration in the
lungs. A major focus of this thesis is the role of TNF in chemokine expression and granuloma
formation (described in Section 7.0 Chapter 1 TNF-alpha influences chemokine expression of
macrophages in vitro and CD11b+ cells in vivo during M. tuberculosis infection, affecting cell
migration and granuloma formation).
In addition to inflammatory cytokine production as a result of M. tuberculosis infection,
expression of anti-inflammatory cytokines such as IL-10 or TGF-β increases in some infected
populations of humans and mice. Expression of IL-10 can be detrimental depending on when it
is expressed and how much is expressed. In the case of IL-10 transgenic mice, overexpression of
27

IL-10 can induce reactivation in chronically infected mice and can lead to increased
susceptibility to acute infection with BCG [107, 108]. IL-10 -/- mice were reported to have
increased resistance to mycobacterial infection with M. avium and BCG [109, 110]. However, in
the case of M. tuberculosis infection, published results indicate that either there are no
differences in control of bacterial growth or the differences are seen early after infection and
over time the IL-10-/- mice have similar disease progression [Table 1,[65, 109]]. The interactive
role of IL-10 and TNF in granuloma formation will be discussed in further detail in the appendix
of this thesis (see Appendix A.0 IL-10 expression during aerosol M. tuberculosis infection is a
result of increased bacterial burden and does not lead to immunosuppression).
4.4 Cytokines and cells involved in granuloma formation
Genetically engineered knockout mice have provided clues to the roles of immune cells
in granuloma formation. CD4 T cell-deficient mice, which are susceptible to M. tuberculosis
infection, experience a delay in the formation of the granulomas compared to wild type mice [7],
and both disorganized and organized granulomas can be found in their lungs. Mice deficient in
CD8 T cells also form granulomas in the lungs, but do not control infection as well as wild type
mice [69, 111]. Interestingly, data generated using γδ T cell deficient (δ-/-) mice suggest that
these T cells may play a role in granuloma formation [112]. The δ-/- mice had larger, more
diffuse granulomas in the lungs following low dose aerosol infection, compared to wild type
mice, but with high dose aerosol infection the δ-/- mice had a largely neutrophilic infiltrate.
Severe combined immunodeficient (SCID) mice when infected with an avirulent M. bovis
vaccine strain, BCG, do form epithelioid macrophage aggregates in the liver and spleen, but less
so in the lung [113]. B-cell deficient mice have smaller, more diffuse granulomas than wild-type
mice following aerosol infection, but successfully control infection in the lung [70, 96].
28

However, in the absence of B cells, the pathology of the lungs is altered significantly, and may
point to a role for these cells in granuloma formation or maintenance, as discussed above.
Interestingly, spread of the infection from the lungs to the spleen is reduced in B cell-deficient
mice [70]. IFN-γ has been mentioned as being important in granuloma formation, however
immune cells migrate to the lungs and aggregate to form granulomas in IFN-γ-/- mice following
M. tuberculosis infection [64, 98]. Due to the lack of IFN-γ and subsequent poor macrophage
activation, these granulomas do not function to control the infection, and quickly become
necrotic. In murine models of infection where TNF is absent granuloma formation is
substantially impaired, pointing to an important role for this cytokine in the signals that direct
granuloma formation [101, 103]. This will be addressed to a greater extent later in the thesis.
29

5.0 Chemokines
Cellular trafficking and recirculation is a multi-step process including rolling, adhesion,
and migration across endothelium into tissues [reviewed in [114]]. Once inside tissues, the cells
continue to migrate through more locally directed mechanisms. These processes are directed by
adhesin molecules, both integrins and selectins, and chemokines and chemokine receptors.
Chemokines are small 8-10 kDa chemotactic cytokines, which bind to pertussis toxin-sensitive
G-protein coupled receptors, inducing actin dependent processes such as membrane ruffling,
pseudopod formation and assembly of adhesion complexes. Chemokines are a diverse class of
molecules acting both as constitutive signals functioning to form secondary lymphoid tissues,
and as inducible signals in response to physiological stress, such as inflammatory stimuli
including infection.
The pattern of chemokine receptor expression dictates, to some extent, the localization of
cells participating in the immune system. Many immune cells switch from constitutively
expressed receptors to inflammatory receptors as a consequence of cell activation and
polarization. For example, immature dendritic cells residing within tissues express CCR5 and
CCR1[115]. Upon uptake of antigen and maturation, dendritic cells downregulate CCR5 and
CCR1, and upregulate CXCR4 and CCR7, causing migration of these antigen presenting cells to
the lymphoid tissues, such as lymph nodes, where they can encounter and prime naive T cells.
The chemokines that bind to CXCR4 and CCR7, CXCL12 (SDF-1α/β), CCL19 (MIP3β) and
CCL21 (SLC), are expressed primarily in lymphoid tissues [reviewed in [115]]. Naïve T
lymphocytes express a different repertoire of receptors (CXCR4, CCR7) than activated T
lymphocytes (CCR1, CCR2, CCR5 and CXCR3); the chemokine receptor profile influences
where the cells reside or migrate within lymphoid or non-lymphoid tissue. Activated T cells will
30

generally migrate to sites of inflammation or infection rather than back into the lymphoid tissue.
Memory cells also have different chemokine receptors, which likely play a role in where various
subsets of memory cells reside following resolution of infection [116, 117].
Characterization of chemokine expression has been performed by conventional
techniques such as RNA expression analysis to assess gene expression and ELISA to detect
protein. Due to high homology between chemokines in many species, it has been difficult to
develop useful monoclonal antibodies for studies, particularly in the murine model. Polyclonal
antibodies exist, but very few monoclonal antibodies are available for flow cytometric analysis in
murine models, limiting the studies that can be performed in situ or ex vivo. There is a larger
collection of monoclonal antibodies available for human or nonhuman primate studies. Cell
migration assays using transwell inserts or Bowden chambers have also allowed basic migration
properties to be evaluated, but these systems are simplistic compared to the multi-factorial
processes occurring in vivo, and cell lines, rather than primary cells from different tissues, are
usually used for these studies.
The number of chemokines identified has been expanding at a rapid rate in the past few
years. There appears to be redundancy in the expression of both chemokines and their receptors,
since most receptors bind multiple chemokines, and specific chemokines can bind to more than
one receptor. Often, more than one ligand for a chemokine receptor can be expressed at the site
of infection, suggesting that both chemokines have a function, or that signals such as infection or
inflammation induce a number of different chemokines. A particular chemokine receptor can be
found on many different types of cells. For example, T lymphocytes, monocytes, macrophages,
basophils and immature dendritic cells express CCR2 [118]. In addition, expression of inducible
chemokines from a number of different cell types can be observed. Monocytes, endothelial cells,
31

epithelial cells, fibroblasts and keratinocytes can produce CXCL10, an IFN-γ-inducible
chemokine [119]. The various signals for induction of chemokine production by different types
of cells are still being determined. The true extent of redundancy in vivo, and the possible
reasons for such apparent duplication of function, remains to be determined; it may simply be
that our current understanding of the roles or induction of expression of each chemokine in a
complex and interactive system is incomplete. However, results from CXCL9-/- mice, in which
an IFN-γ inducible chemokine that recruits activated T cells via CXCR3 was not present,
indicated that the absence of this chemokine had no discernible effect on control of a number of
different bacterial and viral pathogens, despite the requirement for IFN-γ in control of these
pathogens [120]. One can speculate that CXCR3 is not important for directing activated T cells
to the site of infection, that another CXCR3 ligand [such as CXCL10 (IP-10)] is also expressed
at the site of infection (which is often the case), or that other chemokine receptors can also direct
activated T cells equally well to infected tissues. Surprising results from this same study were
that CXCL9 was important for antibody responses to Francisella tularensis, and that activated B
cells expressed CXCR3 [120]. Genetically engineered mouse models are likely to enlighten us
about the roles these chemokines and receptors can play in induction of immune responses and
control of infection.
The expression of chemokines is highly regulated. Studies are underway addressing
signals required for post-transcriptional processing and secretion of the small molecular weight
proteins. Several genes encoding chemokines are controlled by NF-κB, NF-IL6, activator
protein 1 (AP-1) and Sp1 [reviewed in [121]]. Hydrogen peroxide (H2O2) not only gives rise to
NF-kB signaling pathways, it also appears to production of mRNA encoding MIP1a and IL-8 in
human cell lines [122]. In addition studies in the murine macrophage cell line B10R indicate
32

that H2O2 increases expression of CCL3, CCL4, CXCL2 and CCL2 [123]. H2O2 dependent
induction of chemokines is dependent on both ERK and cAMP-dependent pathways. H2O2
dependent upregulation of CCL3, CCL4 and CXCL2 is at the level of gene transcription
activation, but the expression of CCL2 is increased through both gene transcription activation
and mRNA stabilization, indicating that there is differential post-transcriptional regulation of
chemokines expression. Another type of post-transcriptional regulation that has been uncovered
is regulation of the secretion of the chemokines. CCL5 secretion from memory T cells appears
to be dependent on TCR stimulation [124]. These CD8+ memory T cells carry high levels of
CCL5 mRNA but do not contain or secrete the protein unless the cells undergo TCR
engagement.
5.1 Chemokines and M. tuberculosis
There have been a variety of studies aimed at characterizing expression of chemokines in
response to M. tuberculosis in vitro and in vivo, in human and murine systems. However,
synthesizing an understanding of cell infiltration and granuloma formation using results from
these descriptive studies has proved difficult. This is in part due to lack of appropriate reagents
for study, but also to the complexity of the system for migration of cells into tissues in response
to infection. In addition chemokines also play roles in other activities of cells, such as induction
of apoptosis or proliferation [reviewed in [114]]. Table 2 lists the major chemokines that will be
discussed in this thesis (Table 2).
33

Table 2. Chemokine Nomenclature.
Systematic Name Mouse Ligand Receptor
CCL2 JE, MCP-1 CCR2
CCL3 MIP-1α CCR1, CCR5
CCL4 MIP-1β CCR5
CCL5 RANTES CCR1, CCR3, CCR5
CCL7 MCP 3 (Human), MARC CCR1, CCR2, CCR3
CCL8 MCP-2 CCR3
CCL11 Eotaxin CCR3
CCL12 MCP-5 CCR2
CXCL1 GRO-α CXCR2
CXCL2 MIP-2 CXCR2, CXCL1
CXCL8 IL-8 CXCR1, CXCR2
CXCL9 MIG CXCR3
CXCL10 CRG-2, IP-10 CXCR3
CXCL11 I-TAC CXCR3
5.2 Induction of chemokine expression by M. tuberculosis
M. tuberculosis is a strong inducer of chemokine expression. Studies to date have
primarily focused on the pattern of expression of inducible chemokines following M.
tuberculosis infection of macrophages in vitro. M. tuberculosis induces a rapid expression of
many chemokines in murine macrophages, detectable as early as 2 hours post infection. In vitro,
expression usually peaks 12 to 30 hours post-infection [125]. Human macrophages produced
34

chemokines CCL2, CCL3, CCL4, and CCL5 in response to virulent strains of M. tuberculosis
[126, 127]. Responses were attenuated with infection using an avirulent strain of M. tuberculosis
(H37Ra) for CCL3, but not CCL4 or CCL5 [127], indicating that the PAMPs or antigens that
stimulate the production of these chemokines may be different. Lymph node tissue and CD14+
blood monocytes isolated from tuberculosis patients expressed more CCL2 than those from
control subjects [128]. In addition human alveolar macrophages produced significantly more
CCL3, CCL2 and CCL5 than blood monocytes upon infection with M. tuberculosis [126]. These
results suggest that the chemokines interacting with CCR1, CCR2, and CCR5 might play a role
in the trafficking of cells bearing these receptors to the site of infection. However, direct
evidence for such a role for all these chemokines in tuberculosis remains elusive.
Expression of CCL2, CCL3, CCL7, CCL12, CXCL2, and CXCL10 in response to M.
tuberculosis infection of mice has been reported [62, 63, 125]. CCL4, CCL5, and CXCL9 are
also expressed by murine macrophages following infection with virulent Erdman strain of M.
tuberculosis (see Section 7.0). These results support that M. tuberculosis is a strong inducer of
chemokines. The cell wall components of mycobacteria may be crucial to this induction, as it
was reported that infection of murine macrophages with delipidated M. tuberculosis strain
Erdman significantly reduced production of CCL3 [129]. In addition, different strains of M.
tuberculosis can induce different levels of chemokines in the tissues of infected mice[125],
although in this study, the control of infection was similar for the strains tested.
Macrophages are not the only cells in the lungs responding to M. tuberculosis by
producing chemokines. Expression of CXCL8 and CCL2 mRNA, but not CCL3, CCL4, or
CCL5 was detected in human alveolar epithelial cell line A549 in response to virulent strains of
M. tuberculosis [128]. M. avium and heat-killed M. tuberculosis could not elicit the same
35

responses in these cells. Murine pleural mesothelial cells stimulated with BCG and rIFNγ
induced CCL4 and CCL2 expression in a dose dependent manner [130]. This production could
be inhibited by IL-4. Granulocytes from the blood of patients with active tuberculosis produced
CXCL8 and CXCL1 in response to LAM from M. tuberculosis. Human bronchial epithelial cells
produce the CXCR3 ligands (CXCL9, 10 and 11) [131] and this expression is upregulated by
IFN-γ. CXCL10 was expressed at higher levels in the bronchial epithelium of tuberculosis
patients, compared to control subjects [132]. These studies imply that cells other than
macrophages or monocytes participate in recruiting cells by producing chemokines in response
to mycobacteria.
The expression of chemokines in vivo has been characterized to a limited degree. Studies
performed using bronchoalveolar lavage (BAL) fluid indicate that there are elevated levels of
CCL2, CCL5, CCL7, CCL12, CXCL8 and CXCL10 in tuberculosis patients compared to
uninfected controls [126, 133, 134]. Increased expression of CCL5 correlated with higher
numbers of cells in BAL fluid [134]. Although the production of many chemokines has not been
examined, CCL11 (Eotaxin) [133] and CCL3 [126] were not detected in human BAL fluid.
With the emergence of HIV/M. tuberculosis co-infection, a number of studies have
addressed the ability of M. tuberculosis to enhance HIV infection. PBMC from HIV+ patients
with tuberculosis produced more HIV than those from patients without tuberculosis, even with
similar numbers of CD4+ lymphocytes [135]. The increase of CCR5 and CXCR4 (HIV co-
receptors) expression on monocytes in response to M. tuberculosis was hypothesized to result in
increased productivity of HIV infection. Stimulation of whole blood with M. tuberculosis LAM
upregulated expression of CCR5 and CXCR4 [136]. In addition, HIV infection reduced
36

production of CCL3 and CCL5 from PBMC [135], freeing up more receptors for HIV to bind
and possibly interfering with recruitment of cells to fight infection.
5.3 Difficulties in studying chemokines and infectious disease
The M. tuberculosis infection studies performed on genetically engineered mice suggest
that redundancy in the chemokine system may be real. In CCR2-/- mice the number of
macrophages migrating to the lung after 3 weeks of infection increased significantly compared to
two weeks post-infection. At the 3 week time point, a number of chemokines are expressed in
response to both higher M. tuberculosis burden and expression of inflammatory cytokines. At
this time, other chemokines signaling through CCR1 or CCR5 (or other receptors) may stimulate
the migration of monocytes to the lungs. In the absence of CCR2 or CCR5, many immune cells
still migrate to the lungs and form granulomas [62, 63], and data not shown). These results may
indicate that these receptors are not essential for migration of cells to the lungs or within the
lungs (e.g., for granuloma formation), or that other signals and interactions with adhesins may be
more important. The breadth of the chemokine response induced following M. tuberculosis
makes it difficult to pinpoint which subset is important at which time during infection.
Many cytokines and infectious disease products regulate chemokines. There is evidence
that IFN-γ, TNF and M. tuberculosis itself induces expression of chemokines in vitro and in
vivo. In models of infection when bacterial burdens are different (such as when comparing
immunodeficient mice with wild type mice), drawing conclusions about chemokine expression
can be very difficult. Higher expression of chemokines could be due to increased numbers of M.
tuberculosis bacilli, instead of resulting from a specific immunodeficiency (for example, in a
cytokine knockout mouse). Alternatively, higher chemokine levels could alter the anti-
mycobacterial response, resulting in higher bacterial burdens.
37

Interpreting differential chemokine expression in M. tuberculosis infection, particularly
in vivo, is challenging. Because chemokines act in a gradient, higher chemokine expression does
not necessarily mean that more cells will migrate in response to that signal. Too much
chemokine can saturate a receptor and desensitize the cell to the migration signal. Specifically
with studies on chemokines in M. tuberculosis infection, the expression of chemokines is likely
very different within the granuloma compared to the whole lung, if chemokines participate in the
formation and maintenance of the granuloma. Indeed, in our studies designed to procure pure
granulomatous tissues for the analysis of host gene expression using an approach that
incorporates laser capture microdissection and real-time PCR technology, results showed that the
relative levels of expression of certain immunologic genes (including chemokines and
chemokine receptor genes) determined using microdissected tissue-derived RNA may differ
significantly from that obtained when total lung RNA was used for analysis [137]. These data
suggest the conventional use of whole infected lungs to study granuloma-specific gene
expression can yield data that may not genuinely reflect intra-lesional events. In addition, BAL
fluid as a source of cells or chemokines is unlikely to reflect the site of infection within the
lungs. Therefore, such studies need to be interpreted cautiously.
38

6.0 Statement of the problem
The goal of this study was to address the hypothesis that TNF influences chemokine
expression in the lung during tuberculosis, thereby playing a major role in orchestrating
granuloma formation. The signals required for the complex process of granuloma formation in
response to M. tuberculosis infection are not well understood, although this structure is important
in containing the infection in the tissues. Although tumor necrosis factor–alpha (TNF) is required
for control of M. tuberculosis, the mechanisms underlying its requirement have not been well
defined. In models of chronic or latent tuberculosis, TNF was required for maintenance of
macrophage activation, granuloma formation and ultimately, control of disease. One mechanism
of TNF control could be its regulation of chemokine expression. Chemokines, or chemotactic
cytokines, are compelling candidates for influencing cell migration and granuloma formation in
tuberculosis. As part of our work on TNF and granuloma formation, we characterized
chemokine expression in the lungs following M. tuberculosis infection and evaluated the
immune response and granuloma formation in the absence of select groups of chemokines or
chemokine receptors.
39

7.0 Chapter 1 TNF-alpha influences chemokine expression of macrophages in vitro and CD11b+ cells in vivo during M. tuberculosis infection, affecting cell migration and granuloma formation
This chapter has been submitted to Journal of Immunology. The chapter in this form is more inclusive that the submitted paper and includes additional data that was not shown in the submitted paper.
7.1 Introduction
Tuberculosis in immunocompromised hosts elucidated the protective immune responses
to M. tuberculosis. In recent years, the use of anti-inflammatory drugs targeting tumor necrosis
factor alpha (TNF), such as Infliximab (Remicade) and Enbrel (Etanercept), for treatment of
chronic inflammatory diseases, has highlighted the importance of TNF in controlling M.
tuberculosis, since there is an increased risk of reactivation tuberculosis in patients treated with
these drugs [104, 105].
TNF has many potential effects within the lungs of an infected individual. In vitro, TNF
has been reported to affect apoptosis of infected macrophages [138, 139], secondary signaling to
macrophages for nitric oxide production [reviewed in [140]], and regulate activity of other
inflammatory cytokines (such as IL-12) [141]. In vivo, pathology, control of bacterial numbers,
and chemokine expression (in the liver) have been shown to be affected by TNF [142]. The role
of TNF within the lungs in chemokine expression following M. tuberculosis infection has not
been explored.
Antibody mediated neutralization of TNF in chronically infected mice led to severe
pathology with the loss of granuloma structure [106]. Bacterial loads in the TNF-neutralized,
chronically infected mice increased initially, but stabilized at a level below that generally
considered fatal in C57BL/6 mice. Nonetheless, TNF-neutralized mice succumbed quickly.
Granuloma structural deficiencies and uncontrolled infection in mice lacking TNF have been
reported by our group and others, in both acute and chronic infection [101, 103, 106, 142],
40

however the mechanisms by which TNF controls granuloma development and maintenance have
yet to be elucidated. Studies in the liver of M. smegmatis and M. tuberculosis intravenously
infected mice showed that gene expression of a subset of chemokines was reduced in TNF
deficient mice [143], but these studies do not reveal the localized chemokine expression patterns
in the lungs- the primary site of M. tuberculosis infection and control.
We hypothesized that TNF influences macrophage chemokine expression and these
localized differences in expression lead to changes in granuloma formation. Our results
described here demonstrate for the first time that TNF affects chemokine gene and protein
expression by M. tuberculosis-infected macrophages, both in vivo and in vitro. We also
demonstrate that during the early phases of acute infection TNF deficient mice have similar
numbers and types of immune cells migrating to the lungs, indicating that the lack of granuloma
formation is a result of a migration defect within the lung tissue, rather than a defect in the
migration of cells to the lungs. These data support that TNF affects the expression of many
chemokines at the level of macrophage gene expression, suggesting that differences in localized
chemokine gradients may result in disorganized cellular infiltrate within the lungs.
7.2 Materials and Methods
Animals. C57BL/6 female mice (Charles River, Rockland, Mass.) and TNFRp55-/- (breeding
pairs from Dr. Tak Mak, [144] 8-14 weeks old were used in all experiments. TNFRp55-/- mice
were bred in an SPF facility at the University of Pittsburgh and transferred to the Biosafety Level
3 animal facility at 7-8 weeks of age. All infected mice were maintained in the BSL3 animal
laboratories and routinely monitored for murine pathogens by means of serological and
histological examinations. The University Institutional Animal Care and Use Committee
approved all animal protocols employed in this study.
41

Chemicals, antibodies and reagents. All chemicals were purchased from Sigma Chemical Co.
(St. Louis, MO.) unless otherwise noted. Middlebrook 7H9 liquid medium and 7H10 agar were
obtained from Difco Laboratories (Detroit, MI). Antibodies used in flow cytometric analyses
were obtained from Pharmingen (San Diego, CA). The cell lines, MP6XT-22 (anti-TNF) and
was obtained from DNAX and used to generate ascites (Harlan Bioproducts, Indianapolis,IN).
Antibodies were purified endotoxin free from ascites fluid as previously described [106] and
mice were treated with antibody intravenously every three days (0.5mg/dose) starting 4 months
post infection. Control mice received normal rat IgG (Jackson Immunoresearch Laboratories
Inc.,West Grove, PA) with the same dosing regiment.
Mycobacteria and infection of mice. To prepare bacterial stock, M. tuberculosis strain Erdman
(Trudeau Institute, Saranac Lake, N.Y.) was used to infect mice, and then bacteria were
harvested from their lungs, expanded in 7H9 liquid medium and stored in aliquots at -80°C.
Mice were infected via the aerosol route using a nose-only exposure unit (InTox Products,
Albuquerque, N.M.), and exposed to M. tuberculosis (1 x 10⁷ CFU/ml in the nebulizer chamber)
for 20 minutes, followed by 5 minutes of air. This resulted in reproducible delivery of 50-100
viable CFU of M. tuberculosis as described previously [94], which was confirmed by CFU
determination on the lungs of 2-3 mice 1 day post-infection. In acute experiments where a
higher inoculum was used, the concentration of M. tuberculosis in the nebulizer was increased,
and day 1 CFU were determined in the lungs. The tissue bacillary load was quantified by plating
serial dilutions of the lung, liver, and spleen homogenates onto 7H10 agar as described
previously [30].
Bone marrow derived macrophages. Macrophages were derived from C57Bl/6 bone marrow
based on adherence. The mice were euthanized and bone marrow was flushed out of the femur
42

and tibia bones with DMEM as previously described [82]. The bone marrow suspension was
washed twice with 2% FBS in PBS and the cells were counted. 2x10⁶ cells were plated on non-
tissue culture treated petri dishes (Labtek) in 25 ml macrophage media (25% L cell supernatant,
20% FBS, 1% L-glutamine, 1% sodium pyruvate, and 1% nonessential amino acids). After 4
days in culture the cells were fed with 10 ml fresh macrophage media. On day 6 macrophages
were infected with M. tuberculosis (MOI of 4). Four hours post infection the supernatant was
removed, cells were washed and fresh media was added.
Flow cytometric analysis of lung cells. To determine cellular infiltrate in the lung, at 10-day
intervals lungs were removed for flow cytometric analysis. Lungs were subjected to a short
period (20 minutes) of digestion with 1 mg/ml collagenase A and 25 Units/ml DNAse (both from
Boehringer Mannheim, Mannheim, Germany) at 37°C. The suspension was pushed through a
cell strainer as previously described [63]. Red blood cells were lysed with red blood cell lysis
buffer (NH4Cl/Tris Solution) and the single cell suspension was counted. The samples were
stained with 0.2 µg anti-CD4, anti-CD8, anti-CD69, or 0.15 µg anti-Gr1 and 0.2 µg anti-CD11b
in FACS buffer (0.1% NaAzide, 0.1% BSA, 20% mouse serum). Following washes, the cells
were fixed in 4% PFA for 1 hour and collected on a FACS Caliber (Beckon Dickinson).
Analysis was performed on Cell Quest software (BD-Pharmingen, San Diego, CA).
Histopathology. Tissue samples for histological studies were fixed in 10% normal buffered
formalin followed by paraffin embedment. For histopathological studies 5- to 6- µm sections
were stained with Harris’ hematoxylin and eosin.
Ex vivo CD11b+ isolation. To isolate CD11b+ cells from the lungs of C57Bl/6 mice, a
Magnetic Cell Sorting (MACS) column isolation protocol (Miltenyi Biotech, Auburn, CA) was
followed. The lungs were removed, rinsed in T cell media and pushed through a 70µm cell
43

strainer (Fisher, Pittsburgh, PA) using the end of a 5 ml syringe. Following red blood cell lysis
and washing, the cells were labeled with CD11b Microbeads in MACs buffer (2mM EDTA and
0.5% SDS in PBS) for 15 minutes at 8°C. The cells were washed with MACS buffer and then
resuspended in 0.5ml of buffer. The cells were poured over a 40µm cell strainer and then
applied to a prewashed MS+ column. After initial flow through, the column was washed 3 times
with 0.5ml buffer. The column was then removed from the magnet and the CD11b+ cells were
eluted from the column with 1 ml of buffer. The cells were spun down and resuspended in 1ml
of TRIZOL and the RNA was isolated.
RNA Isolation. RNA was isolated from the lung or cells using the TRIZOL isolation protocol
with slight modifications. The lung was homogenized in 3ml (cells were lysed in 1ml TRIZOL/
2x10⁶ cells) of TRIZOL reagent and then two chloroform extractions were performed.
Following an isopropanol precipitation, the RNA was washed with 70% ethanol and treated with
RNase Inhibitor (Applied Biosystems, Foster City, CA) for 45 minutes. Following complete
resuspension of the RNA at 65° C for 15 minutes the RNA was cleaned and DNase digested
using the Qiagen RNA isolation kit, as directed by the manufacturer (Qiagen Inc., Valencia,
CA).
RNA expression of chemokines in lung granulomas isolated by Laser Capture Microdissection Histologically distinct cell populations were procured for subsequent gene expression analysis in
a precise and reliable manner using the Laser Capture Microdissection (LCM) [145]. Lung
tissue for LCM was fixed in 10% normal buffered-formalin for 8 hours at room temperature,
transferred to 70% ethanol overnight at 4ºC and paraffin-embedded the next day. Tissue sections
(8 µm) were de-paraffinized, rehydrated, stained and dehydrated by serially immersion in xylene,
100% ethanol, 95% ethanol, 70% ethanol, Mayer’s hematoxylin (Sigma, St. Louis, MO), eosin
44

(Sigma, St. Louis, MO), 70% ethanol, 95% ethanol, 100% ethanol, xylene and then placed in a
vacuum oven with dessicant for 15 minutes. Using the Pix-Cell II (Arcturus, Mountain View,
CA), cells from microscopically visualized granulomas were transferred onto a thermoplastic cap
via laser beam (30 µm beam at 40mW power). Four to six tissue sections were used for LCM
per animal to yield approximately one to two caps full of tissue. RNA extraction was performed
using Proteinase K and Trizol (Invitrogen, Carlsbad, CA) by methods previously described
[137]. The RNA pellet was further purified with a RNAse free DNAse kit (Qiagen, Valencia,
CA) using the manufacturer’s instructions. RNA samples were stored at -80ºC until cDNA
synthesis.
Real time RT-PCR. The RNA was reverse transcribed using Superscript II enzyme, as directed
by the manufacturer (Invitrogen, Carlsbad, CA). For Real time RT-PCR we used the
comparative Ct method [146]. HPRT served as the endogenous control, and uninfected lung or
macrophages as the calibrator. Each primer and probe set was tested for efficiency (results
efficient >97% for all primer/probe sets). All samples were run in triplicate and with “no reverse
transcriptase” controls on an ABI Prism Sequence Detector 7700. Relative gene expression was
calculated as 2 ^-∆∆Ct, where ∆Ct = Ct (gene of interest)- Ct (endogenous control) and the
∆∆Ct= ∆Ct (sample) - ∆Ct (calibrator). Results are expressed as relative gene expression to
uninfected samples. The primer and probe concentrations were used as suggested by Applied
Biosystems (Foster City, CA) with the final concentration of each primer at 400nM and probe at
250nM. The primers (Gibco BRL, Grand Island, NY) and probes (Applied Biosystems) used in
this assay were designed using Applied Biosystems Primer Express Software and the sequences
are in Table 3.
45

Table 3. Primers and Probes used in the Taqman Real time RT-PCR assay.
Primers are probes were designed using the Primer Express Software. Sequences used for primer and probe synthesis are found in the table.
Gene Forward Primer (5’ to 3’)
Reverse Primer (5’ to 3’)
Taqman Probe (5’ 6-FAM, 3’ TAMRA labeled)
CXCL9 TGG AGC AGT GTG GAG TTC GA
TCG GCT GGT GCT GAT GC
CCC TAG TGA TAA GGA ATG CAC GAT GCT CC
CXCL10 AGA GCA GCA CTT GGG TTC
ACG GCA GCA CTT GGG TTC
CGG AAG CCT CCC CAT CAG CAC C
CXCL11 GGG CGC TGT CTT TGC ATC
AAG CTT TCT CGA TCT CTG CCA T
CCC CGG GAT GAA AGC CGT CAA
CCL2 CTT CCT CCA CCA CCA TGC A
CCA GCC GGC AAC TGT GA
CCC TGT CAT GCT TCT GGG CCT GC
CCL3 ACC AAG TCT TCT CAG CGC CAT
TTC CGG CTG TAG GAG AAG CA
TGG AGC TGA CAC CCC GAC TGC C
CCL4 CCC GAG CAA CAC CAT GAA G
AGA AGG CAG CCA CGA GCA
TCT GCG TGT CTG CCC TCT CTC TCC TC
CCL5 CTG CAG CCG CCC TCT G GAC TGC AAG ATT GGA GCA CTT G
CTC CCT GCT CGT TTG CCT ACC TCT CC
CCL12 GGA GGA TCA CAA GCA GCC AGT
TCA GCA CAG ATC TCC TTA TCC AGT AT
TCC CCG GGA AGC TGT GAT CTT CAG
HPRT TTA CCT CAC TGC TTT CCG GAG
AAA AGC GGT CTG AGG AGG AAG
TAG CAC CTC CTC CGC C
TNF TGA TCC GAG ACG TGG AA
ACC GCC TGG AGT TCT GGA A
TGG CAG AAG AGG CAC TCC CCC AA
Protein Determination.
Immunoassay. The quantity of CXCL9 and CXCL10 in the macrophage culture supernatants
was determined with the Quantikine mouse CXCL9 and CXCL10 immunoassays (R&D
Systems, Minneapolis, MN). These kits were used exactly as suggested by the manufacturer.
The readout was performed using the Emax precision microplate reader (Molecular Devices,
Sunnydale, CA).
SearchLight Proteome Arrays. To determine the protein concentration of TNF, IL-10, CCL2,
CCL3, CCL5, CCL12, CXCL2, a multiplex sample testing service was utilized. Supernatants
from uninfected and infected macrophages were filter sterilized and sent to Pierce Biotechnology
(Boston, MA) for quantitative measurement using multiplexed sandwich ELISAs.
In situ hybridization.
Cloning. The pGEM-T Easy Vector System (Promega, Madison, WI) was used to clone CCL5,
CXCL9, and CXCL10 PCR products. Primers were designed to amplify CCL5, CXCL9 and
46

CXCL10 with restriction enzyme sites specific for the pGEM-T vector cloning sites. These
primers were used to amplify murine cDNA using the Applied Biosystems Thermocycler.
Following amplification, the product was purified using QIAquick Nucleotide Removal Kit
(Qiagen, Valencia, CA). The ends were digested and the product was ligated to prepared pGEM-
T vectors. Competent E. coli (JM109) was transformed with the ligation reactions, using the
suggested protocol (Promega). Transformed bacteria were selected based on resistance to
ampicillin and interruption of the LacZ promoter, and the selected colonies were grown up in
LB+AMP liquid media. The plasmid DNA was purified from this culture by the Qiagen
Midiprep protocol (Qiagen). Following verification of the insert, the plasmids were linearized
and used to generate probes.
Probe generation. Labeled RNA probes were synthesized by in vitro transcription of DNA
cloned downstream of T7 or SP6 RNA polymerase in the pGEM-T vector using 35S-UTP as
substrate. The MAXIscript In vitro Transcription Kit (Ambion, Austin, TX) was used for this
protocol, with slight modification. In short, linearized plasmid was incubated with the reaction
mix (buffer, dATP, dCTP, dGTP 35S-UTP)+ either T7 or SP6 polymerase. The reaction was
incubated at 37°C for 3 h, 1µl DNase was added for an additional 20 minutes at 37°C.
Following a 5 minute incubation at 65°C, the probes were brought up to 50µl and purified using
the ‘mini Quick Spin RNA Column’ as directed by the manufacturer (Roche, Indianapolis, IN).
Probes were stored at -80°C.
Tissue and slide preparation. Lungs were fixed in 4% paraformaldehyde at 40°C for 5 hours,
washed in two overnight incubations of PBS followed by treatment in a sucrose gradient and
then snap frozen and stored at -80°C. 14µm cryosections were cut and the slides were post fixed
in 4% paraformaldehyde for 20 minutes, dehydrated in an ethanol gradient (70% EtOH 20
47

minutes, 80% EtOH 5 minutes, then 95% EtOH 5 minutes). After air drying the slides, antigen
retrieval was performed in 0.01M sodium citrate with warming in the microwave. After the
slides were cooled, the tissues were acetylated twice in 0.25% acetic anhydride- 0.1M
Triethanolamine solution. Following treatment in another EtOH dehydration gradient, the slides
were air dried and ready for hybridization.
Hybridization and washes. Tissue was hybridized to the 35S-labelled probes as previously
described [147]. In short, 5x10⁴ cpm/µl sense or anti sense probe was hybridized to the tissue
under siliconized coverslips (5x10⁴ cpm/µl sense or anti sense probe in 1x hybridization buffer
containing 10% dextran sulfate formamide, 0.6M NaCl, yeast tRNA [100µg/ml], and 0.4M DTT)
overnight at 50°C. Coverslips were removed and slides were washed in a series of SSC buffers:
5XSSC+0.1mM DDT 42°C for 30 minutes; 2XSSC/50% formamide+0.1mM DTT 60°C for 20
minutes; ribowash solution (0.1M Tris, 0.05M EDTA, 0.4M NaCl) 37°C for 10 minutes;
ribowash solution at 37°C for 10 minutes; ribowash solution+ 6.25U of an RNAse A+T1 mix
37°C for 30 minutes; ribowash solution 37°C for 10 minutes; 2xSSC 37°C for 10 minutes;
0.2XSSC 37°C for 10 minutes. Slides were then dehydrated in 0.3M ammonium acetate+ EtOH
gradient. After the slides were completely dried, they were dipped in prewarmed radiography
emulsion (Kodak) and dried. Slides were wrapped in a dark box for one week. Development
was in D19 developer followed by fixation in Rapid Fix. Slides were counterstained in
hematoxylin.
Statistical Analysis. 3-4 mice per group per time point were used for all studies. Statistical
analysis was performed on the data utilizing Prism Software for an unpaired t-test. For bacterial
numbers and cell numbers, log transformation was performed prior to statistical analysis to
normalize the data. P values <0.05 were considered significant.
48

7.3 Results
Susceptibility to tuberculosis without TNF It is well established that mice deficient in TNF have increased susceptibility to M.
tuberculosis infection [reviewed in [6]]. Following acute low dose aerosol infection, TNFRp55-
/- mice and TNF- neutralized mice (MP6-XT22 treated) had significantly higher bacterial
burdens than control mice by 18-21 days post infection (Figure 5A and data not shown). The
mice succumbed by 28 days post infection.
Following TNF neutralization of chronically infected mice, the bacterial burden increased
by 8 days post antibody treatment (Figure 5B), but was not significantly different until 18 days
post antibody treatment. We previously reported that the mean survival time for chronically
infected TNF-neutralized mice was 44 days, when infection was initiated by intravenous
infection with moderate doses of M. tuberculosis [106]. However, using low dose inoculum
delivered via aerosol to set up the chronic infection, neutralization of TNF resulted in faster
progression of disease with a mean survival time of 22 days after initiation of antibody treatment
(Figure 5C). In the following experiments, we analyzed the effects of TNF deficiency in acute
and chronic models of infection, using aerosol delivery for all studies.
49
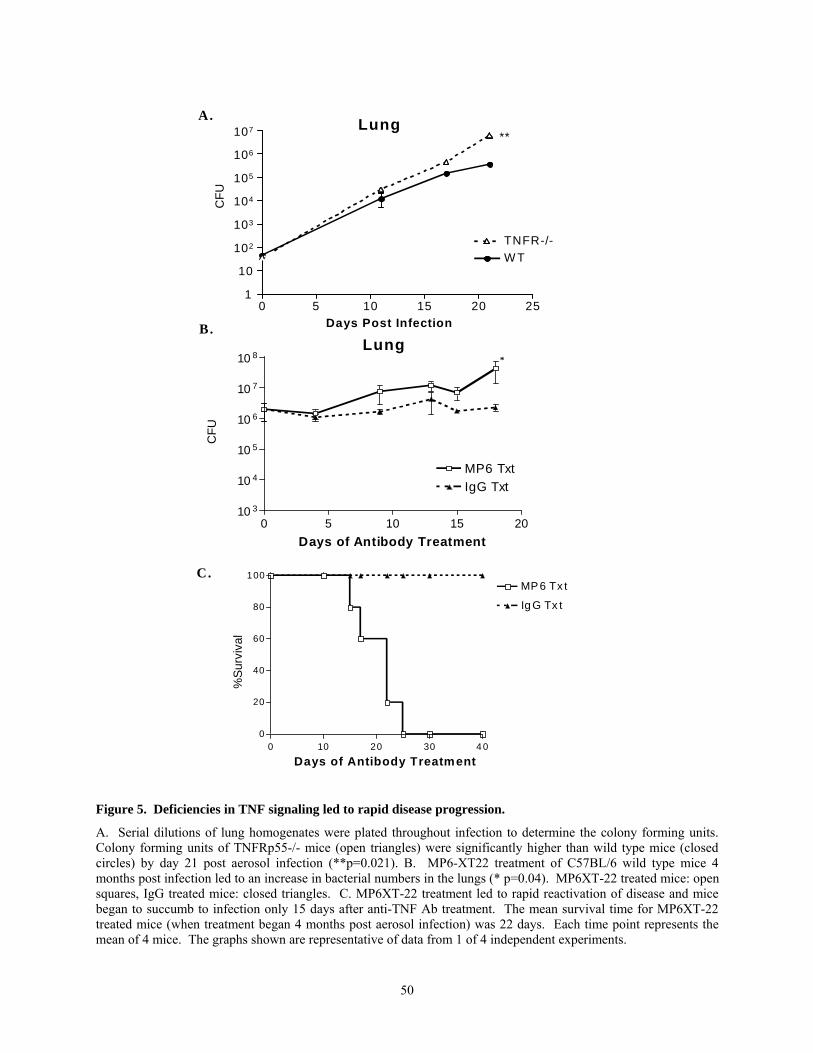
0 10 20 30 4 00
20
40
60
80
100MP 6 Tx t
Ig G Tx t
%Su
rviv
al
Days of Antibody Treatment
Lung
0 5 10 15 20 251
10
TNFR-/-W T
Days Post Infection
102
103
104
105
106
107
CFU
**
A.
C.
B.
CFU
0 5 10 15 2010 3
10 4
10 5
10 6
10 7
10 8
MP6 TxtIgG Txt
Days of Antibody Treatment
*Lung
Figure 5. Deficiencies in TNF signaling led to rapid disease progression.
A. Serial dilutions of lung homogenates were plated throughout infection to determine the colony forming units. Colony forming units of TNFRp55-/- mice (open triangles) were significantly higher than wild type mice (closed circles) by day 21 post aerosol infection (**p=0.021). B. MP6-XT22 treatment of C57BL/6 wild type mice 4 months post infection led to an increase in bacterial numbers in the lungs (* p=0.04). MP6XT-22 treated mice: open squares, IgG treated mice: closed triangles. C. MP6XT-22 treatment led to rapid reactivation of disease and mice began to succumb to infection only 15 days after anti-TNF Ab treatment. The mean survival time for MP6XT-22 treated mice (when treatment began 4 months post aerosol infection) was 22 days. Each time point represents the mean of 4 mice. The graphs shown are representative of data from 1 of 4 independent experiments.
50

Cell infiltration during acute infection
During acute mycobacterial infections TNF deficient mice do not form proper
granulomas [101-103]. The cell populations migrating into the lungs were assessed by flow
cytometry. No defects in appearance of T lymphocytes and macrophages in the lungs early after
infection were observed in TNF deficient mice compared to controls (Figure 7). By 21 days post
infection, when bacterial burdens were already significantly higher in TNFRp55-/- mice, the
number of CD8+ T lymphocytes was reduced and the number of neutrophils was significantly
higher. The increased neutrophilic infiltrate was likely a result of the increased mycobacterial
burden in these mice.
Histological analysis of the lung infiltrate indicated that although the cells were migrating
into the lungs, they were not forming an organized granuloma structure, as previously reported
[[101, 103], and Figure 6]. These data indicate that TNF is not required for migration of cells
into the lung following infection, but rather may influence migration within the lung.
51

Figure 6. Lung pathology in M. tuberculosis infected TNFRp55-/- mice and wild type mice.
Following low dose aerosol infection, mice were sacrificed at indicated time points and a lobe of their lung was fixed in 10% formalin and then embedded, sectioned and H & E stained. TNFRp55-/- mice do have cellular migration into the lungs, but the cellular infiltrates are not organized and have higher granulocyte numbers by 20 days post infection.
52

25
Total Macrophages
0 5 10 15 200
5
10
15
Days Post Infection
# C
ells
/ Lun
g (x
104 )
Total CD8+ Lymphocytes
0 5 10 15 20 250
2.5
5.0
7.5
Days Post Infection
# C
ells
/ Lun
g (1
05)
Total CD4+ Lymphocytes
0 5 10 15 20 250
2.5
5.0
7.5
Days Post Infection
# C
ells
/ Lun
g (1
05)
TNFR-/-
WT
Total Neutrophils
0 5 10 15 20 250
10
20
30
40
50
Days Post Infection
# C
ells
/ Lun
g (x
104 )
Figure 7. Immune cells migrate into the lungs in TNFRp55-/- mice.
Flow cytometric analysis of the lung was used to quantify the numbers of CD4+ and CD8+ lymphocytes, macrophages (CD11b+ Gr1-) and neutrophils (CD11b+ Gr1+) present in the lungs post aerosol infection. There were similar numbers of CD4+ lymphocytes and CD8+ lymphocytes in the lungs up to 16 days post infection. At 21 days post infection the number of CD8+ lymphocytes decreased. The number of macrophages migrating into the lungs of the TNFRp55-/- mice was similar to WT mice throughout the length of the experiment. The number of neutrophils increased in the TNFRp55-/- mice when bacterial burdens increased. Each time point represents 3-4 mice. These graphs are representative of 3 independent experiments.
Cell populations in the lung following anti-TNF treatment in chronically infected mice The cell populations in the lungs of anti-TNF Ab treated and IgG control mice were not
significantly different until the bacterial burdens significantly increased in the anti-TNF Ab-
treated mice (Figure 8). There was variability among the mice during the chronic stage of
infection (see error bars for day 0 time points, Figure 8), and mice in the TNF-neutralized group
53

succumbed to reactivation over the course of 10 days, beginning at day 12. Histological changes
in the granuloma structure were observed as early as 9 days post anti-TNF Ab treatment
(representative sections at 12 days shown in Figure 9). By 18 days of antibody treatment all
surviving anti-TNF treated mice had diffuse cellular infiltrates in their lungs accompanied by
edema within alveolar spaces.
These data indicate that TNF plays either a direct or indirect role in controlling migration
of immune cells within the lungs and maintaining granuloma structure. A possible mechanism
for control of migration of cells is through effects on chemokine expression.
MP6 TxtIgG Txt
CD4 Cell numbers
0 5 10 15 200
1
2
3
4
5
Days of Antibody Txt
Num
ber o
f cel
ls (x
106 )
/ Lun
g
CD8 Cell numbers
0 5 10 15 200
1
2
3
4
Days of Antibody Txt
Num
ber o
f cel
ls (x
106 )
/ Lun
g
Macrophages
0 5 10 15 200.0
2.5
5.0
7.5
10.0
Days of Antibody Txt
Num
ber o
f cel
ls (x
105 )
/ Lun
g
Neutrophils
0 5 10 15 20Days of Antibody Txt
0.0
2.5
5.0
7.5
10.0
Num
ber o
f cel
ls (x
105 )
/ Lun
g
Figure 8. As bacterial burdens increased in MP6XT-22 treated mice, the numbers of cells migrating into the lung increased significantly.
MP6XT22 treatment began 4 months post aerosol infection. Following the initiation of MP6XT22 treatment, flow cytometric analysis of cellular infiltrate to the lungs revealed that as disease progressed the numbers of CD4+ and
54

CD8+ lymphocytes and macrophages increased, but the numbers of these cells in the IgG treated mice were stable. The number of neutrophils in the lungs of MP6 and IgG treated mice did not significantly change after antibody treatment began. Each time point represents 4 mice/group. This experiment was repeated twice with similar results.
MP6 IgGDay
0
12
20
28
Figure 9. Neutralization of TNF in chronically infected mice leads to severe lung pathology.
MP6XT-22 treatment of mice led to disorganized cellular infiltration and fluid in the alveolar spaces of the lungs by 12 days post antibody treatment (middle panel). IgG treated mice (right panel) at day 12 post antibody treatment still exhibited organized granuloma formation, with clusters of lymphocytes and macrophages. (100x magnification). Sections shown here are representative of 4 mice/ group. This experiment was repeated with similar results 4 times.
55

TNF affects chemokine expression in M. tuberculosis infected macrophages
Effects of TNF on M. tuberculosis-induced chemokine expression by macrophages were
first examined in vitro. Bone marrow derived macrophages were infected with M. tuberculosis.
Following infection the macrophage expression of many inducible C-C and C-X-C chemokines
increased relative to uninfected macrophages, and mRNA levels peaked between 4 and 12 hours
post-infection depending on the gene (Figure 10). Expression of CXCL10, CCL12, CCL2 and
CCL4 peaked at 4 hours, whereas expression of CXCL9, CXCL11, CCL3, and CCL5 did not
peak until 12 hours post infection. Although expression decreased rapidly after 12 hours of
infection, the levels remained elevated compared to uninfected macrophages.
These data were generated using a real time RT-PCR assay, which evaluates expression
on a population basis relative to the chosen calibrator (in this study, uninfected macrophages).
The value, ∆Ct, or the change in cycle threshold between the endogenous control (HPRT) and
the gene of interest (a chemokine), allows examination of constitutive expression of chemokines.
Constitutive expression in macrophages (highest to lowest) was:
CCL4>CCL12>TNF>CXCL10>CCL2>CCL5>CCL3>CXCL9>CXCL11
Following M. tuberculosis infection of the macrophages, the relative RNA induction (normalized
to the HPRT gene and relative to uninfected macrophages) of CCL5 and CXCL9 was highest in
the panel of chemokines examined, followed by induction of CXCL10 and CCL3. Relative
expression of CCL4 (Figure 10) and CCL12 was very low compared to other chemokines.
Interestingly, these two chemokines also had the highest constitutive expression. In most cases
after the reduction in expression after 12 hours, the expression of chemokines remained stable
between 24 and 48 hours post infection; by 72 hours the macrophages began to die in culture.
56

In the first set of experiments anti-TNF Ab was added to the cell culture at the time of
infection. As early as 4 hours post infection, TNF expression was induced (Figure 10). Anti-TNF
Ab treatment at the time of infection reduced expression of many chemokines (Figure 10),
indicating that optimal expression of these chemokines was dependent on TNF. Expression of
some chemokines, such as CCL5, was sustained at a higher level as infection progressed in vitro,
and in the presence of anti-TNF Ab the expression of CCL5 was reduced 30-70%. CCL2
expression was reduced by TNF neutralization only at the 4 hr time point (Figure 10). TNF
neutralization modestly reduced CCL3 expression early in infection, but high levels of CCL3
mRNA were sustained in the anti-TNF Ab treated, but not control macrophage cultures (Figure
10). CCL12 also had reduced expression in TNF-neutralized cultures early after infection, but
then was upregulated in the presence of anti-TNF Ab by 24 hours post infection and back down
by 48 hours (Figure 10).
57

CXCL10
0 10 20 30 40 50 600
250
WT+MP6WT
500
1000
1500
Hours Post Infection
CCL3
0 10 20 30 40 50 600
250
WT+MP6WT
500
1000
1500
2000
Hours Post Infection
CCL12
0 10 20 30 40 50 600
25
50
75WT+MP6WT
Hours Post Infection
CCL4
0 10 20 30 40 50 600
25
50
75
100WT+MP6WT
Hours Post Infection
Rel
ativ
e U
nits
CXCL11
0 10 20 30 40 50 600
500
WT+MP6WT
10000
20000
30000
Hours Post Infection
Rel
ativ
e U
nits
CXCL9
0 10 20 30 40 50 600
1000
2000
3000
4000
5000WT+MP6WT
Hours Post Infection
Rel
ativ
e U
nits
Rel
ativ
e U
nits
Rel
ativ
e U
nits
CCL5
0 10 20 30 40 50 600
1000
2000
3000
4000
5000WT+MP6WT
Hours Post Infection
Rel
ativ
e U
nits
Rel
ativ
e U
nits
CCL2
0 10 20 30 40 50 600
500
1000
1500WT+MP6WT
Hours Post Infection
Rel
ativ
e U
nits
Figure 10. Macrophage expression of chemokines is partially dependent on TNF.
Real time RT-PCR was performed on RNA isolated from macrophages infected with M. tuberculosis at 0, 4, 8, 12, 24, and 48 hours post infection, with or without addition of anti-TNF Ab. Expression of CXCR3 ligands CXCL9 and CXCL10, CCR5 ligands CCL3, CCL4 and CCL5, and CCR2 ligands CCL2 and CCL12 were determined. Expression levels reported are relative to uninfected macrophages. This experiment was performed twice with similar results.
In a separate set of experiments, macrophages were infected with M. tuberculosis, and
anti-TNF Ab was added 4 hours after infection (when unincorporated bacteria were removed
58

from the culture); expression of chemokines was examined 24 and 48 h after infection. The
mRNA levels of CCL5, CXCL10, and CXCL11 were still significantly reduced at 24 and 48
hours post-infection (60%, 58%, and 84%, respectively, Figure 12). The expression of CCL12
was significantly increased (Figure 12). Treatment of infected macrophages with isotype control
antibody did not alter the chemokine expression (Figure 11). Chemokines were still induced
upon infection in anti-TNF Ab treated cultures, indicating that TNF was only partially
responsible for controlling the expression of these chemokines. Addition of recombinant TNF to
the infected macrophage cultures did not lead to additional chemokine expression (Figure 11),
suggesting that the TNF induced by M. tuberculosis infection was sufficient to affect expression
of the chemokine genes. These data indicated that TNF induced expression of CCL5, CXCL9,
CXCL10 and CXCL11, but downregulated expression of CCL12.
IN V IT RO C HE M 0 K IN E E X P R E S S IO N
No Txt. rTNF MP6 Mtb Mtb+rTNFMtb+MP60
10
20
CXCL10
CXCL9
CCL3
CCL4
CCL12
CCL525
50
75
100100150200250
Macrophages
Rel
ativ
e U
nits
Figure 11. Control macrophage experiment.
Treating uninfected bone marrow derived macrophages with anti-TNF Ab or murine rTNF, did not significantly change expression of chemokine mRNAs. Addition of murine rTNF to infected macrophages did not increase expression of chemokine mRNAs to levels above those of untreated infected macrophages.
59

CXCR3 Ligands
Uninfected Infected MP6 txt+infected0
100
200
300CXCL9CXCL10CXCL11
**
Macrophage Txt.
**Rel
ativ
e U
nits
to U
ninf
ecte
d
Chemokine protein expressionin macrophages
Uninfected Infected Infected + MP60
100
200
CCL2CCL5CCL12CCL32500
5000
**
***
CCL2 **p=0.011CCL12 p = 0.10CCL5 ***p =0.004CCL3 p = 0.07CXCL10 ***p=0.003
CXCL10***
Macrophages
A.CC R5 Ligands
Uninfected Infected MP6 txt+infected0
10 CCL3
CCL4CCL5
100200300400500600
**
Macrophages Txt
Rel
ativ
e U
nits
to U
ninf
ecte
d
B.
CCR2 Ligands
Uninfected Infected MP6 txt+infected0
5
10
15
CCL12CCL2
**
Macrophage Txt
Rel
ativ
e U
nits
to U
ninf
ecte
d
C. D.
Figure 12. Macrophage expression of chemokines is partially dependent on TNF. Real time rt PCR was performed on RNA isolated from macrophages infected with M. tuberculosis for 24 hours. A. Expression of CXCR3 ligands, CXCL10 and CXCL11, was significantly reduced by anti- TNF treatment of macrophages. B. Expression of CCR2 ligand, CCL2 was unaffected by anti-TNF treatment, but CCL12 expression increased. C. Expression of CCR5 ligand, CCL5 was also significantly reduced following anti-TNF treatment. D. Proteins were isolated from the supernatants of macrophages infected for 48 hours to look at protein expression following anti-TNF treatment of macrophages. Consistent with RNA results, CCL5 and CXCL10 expression was significantly reduced. Contrary to RNA results, expression of CCL2 was significantly reduced and expression of CCL12 was unaffected. (Protein expression of CXCL11 was not addressed.) Chemokine protein production in M. tuberculosis infected macrophages.
There are little data regarding post-transcriptional regulation of chemokine expression
[148, 149]. To confirm the gene expression results, we used two different immunoassays to
quantify protein production. Supernatants were collected from uninfected and infected
macrophages at time 0, 4h, 8h, 12h, 24h and 48 hours post infection (from the cultures used to
make RNA in Figure 10). The supernatants were used in the immunoassay for CXCL9 and
60

CXCL10 in our laboratory, and used for multiplex sample testing to quantify CCL2, CCL3,
CCL5, CCL12, CXCL8 and TNF.
Uninfected macrophages do make small quantities of chemokines in cell culture.
Constitutive protein expression from highest to lowest was:
CCL2>CCL12>CCL3>CXCL10>CXCL8>CCL5>TNF>CXCL9.
Many of the chemokines examined had reduced levels of protein present in the supernatant in
the presence of anti-TNF Ab. The protein levels, especially in the wild type mice, either
increased throughout the time course (e.g., CCL5) or increased during the first 12 hours of
infection and then stabilized (Figure 13). Expression of CXCL9 was reduced 30-70% in the
presence of anti-TNF Ab compared to control macrophages, depending on the time point.
Expression of CXCL10 was reduced 20-30%, CCL5 was reduced 50-90%, CCL3 was reduced
10-90%, and CXCL8 was reduced 25%-70% (data not shown). Expression of CCL2 and CCL12
(data not shown) followed a similar pattern where in the presence of anti-TNF Ab, expression
was reduced initially, then increased, but by 48 hours post infection there was clearly a reduction
in the amount of protein present.
61
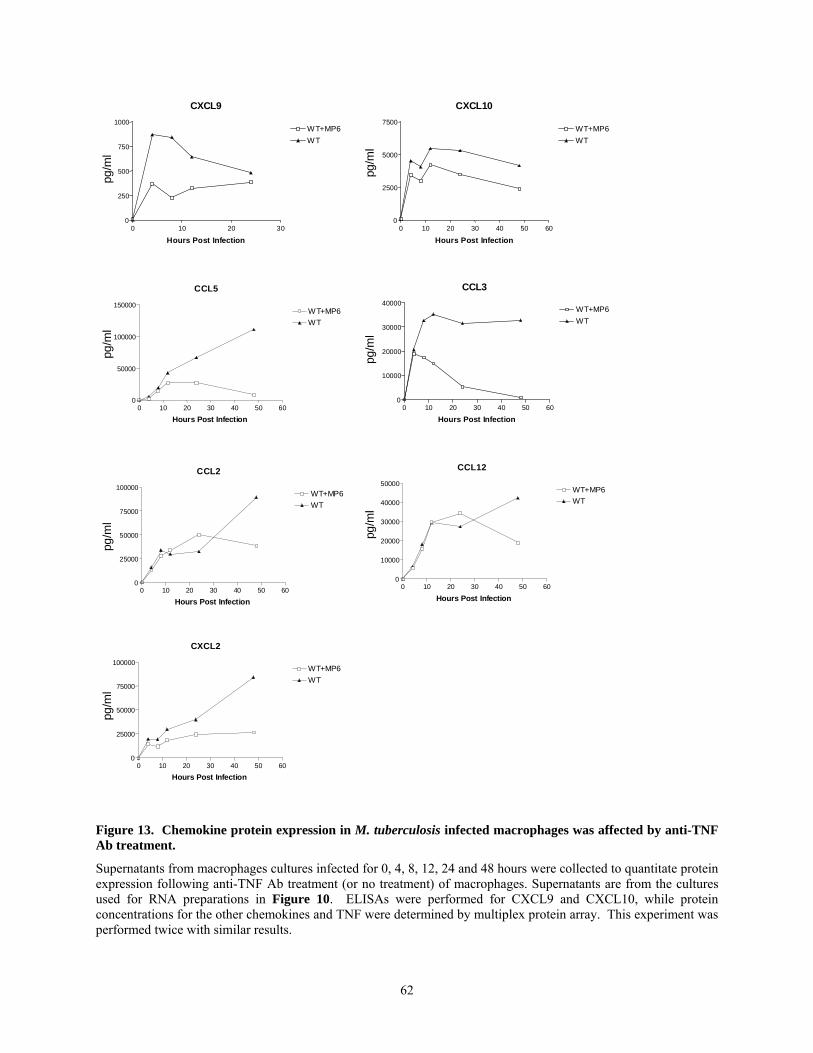
CXCL9
0 10 20 300
250
500
750
1000WT+MP6WT
Hours Post Infection
pg/m
l
CCL5
0 10 20 30 40 50 600
50000
100000
150000WT+MP6WT
Hours Post Infection
pg/m
l
CCL2
0 10 20 30 40 50 600
25000
50000
75000
100000WT+MP6WT
Hours Post Infection
pg/m
lCXCL10
0 10 20 30 40 50 600
2500
5000
7500WT+MP6WT
Hours Post Infection
pg/m
l
CCL3
0 10 20 30 40 50 600
10000
20000
30000
40000WT+MP6WT
Hours Post Infection
pg/m
l
CCL12
0 10 20 30 40 50 600
10000
20000
30000
40000
50000WT+MP6WT
Hours Post Infection
pg/m
l
CXCL2
0 10 20 30 40 50 600
25000
50000
75000
100000WT+MP6WT
Hours Post Infection
pg/m
l
Figure 13. Chemokine protein expression in M. tuberculosis infected macrophages was affected by anti-TNF Ab treatment.
Supernatants from macrophages cultures infected for 0, 4, 8, 12, 24 and 48 hours were collected to quantitate protein expression following anti-TNF Ab treatment (or no treatment) of macrophages. Supernatants are from the cultures used for RNA preparations in Figure 10. ELISAs were performed for CXCL9 and CXCL10, while protein concentrations for the other chemokines and TNF were determined by multiplex protein array. This experiment was performed twice with similar results.
62
Protein analysis of supernatants from cultures where anti-TNF Ab was added at 4 hours
post infection confirmed the macrophage mRNA data in that CCL2, CCL5, CCL12, CXCL9, and
CXCL10 were induced by M. tuberculosis infection, and that CXCL9, CXCL10 and CCL5 were
downregulated in the presence of anti-TNF Ab (Figure 12). On the other hand, although there
was no difference in the expression of CCL2 mRNA in anti-TNF-treated macrophages, there was
a significant reduction in the amount of the protein (p=0.011).
Chemokine expression in the whole lung of M. tuberculosis infected mice.
Based on the results from the macrophages and the findings in the spleen and liver of
infected mice from a published study [150], we addressed the expression of chemokines in the
whole infected lung by both RNase protection assay and real time RT-PCR. We expected to
observe differences similar to our findings in the in vitro macrophage experiments, but following
low dose aerosol infection, the induction of chemokines over uninfected lung was not detectable
until 10-12 day post infection.
In anti-TNF Ab-treated mice, lower expression of a number of chemokines in the lungs
was observed at the early times post infection using RNase protection assay and real time RT-
PCR, especially at day 9 post infection, but these differences, although consistent, were not
significant (Figure 14). By 15 days post infection the TNFRp55-/- or MP6-treated mice had
significantly higher expression (compared to their controls) of CCL3, CCL4, CCL5, CXCL9 and
CXCL10, but significantly less CCL12.
63

CXCL10
0 5 10 15 20012345
10
40
70
100
Days Post infection
Rel
ativ
e U
nits
CCL3
8 9 10 11 12 13 14 15 160
1
2
3
4
Days Post infection
Rel
ativ
e U
nits
CCL2
8 9 10 11 12 13 14 15 160.0
2.5
5.0
7.5
Days Post infection
Rel
ativ
e U
nits
CXCL9
0 5 10 15 200
5
10
15
203080
130180230
Days Post infection
Rel
ativ
e U
nits
CCL4
8 9 10 11 12 13 14 15 160.0
2.5
5.0
7.5
Days Post infection
Rel
ativ
e U
nits
CCL12
0 5 10 15 200
10
20
30
Days Post infection
Rel
ativ
e U
nits
TNFα
0 5 10 15 200.0
2.5
5.0
7.5
Days Post infection
Rel
ativ
e U
nits
IFNγ
0 5 10 15 200
25
50
75
TNFRp55-/-TNFRp55+/+
Days Post infection
Rel
ativ
e U
nits
Figure 14. Chemokine RNA expression in the whole lung of TNFRp55-/- mice and wild type mice after M. tuberculosis infection.
Real time rtPCR was used to examine mRNA expression of chemokines in the whole lungs of mice after aerosol M. tuberculosis infection. Relative units represents a measure of the RNA relative to the endogenous control, HPRT, and the calibrated sample of uninfected lung. Expression above uninfected, or constitutive levels would be >1. Levels are not detected >1 until 9 or 10 days post infection.
64

We have observed repeatedly that increases in chemokine expression in the lungs
correlate with increases in bacterial burden; since TNF-deficient mice have higher bacterial
burdens than control mice by 10-12 days post-infection, differences in chemokine expression at
these later time points were more likely due to bacterial numbers than to direct effects of TNF on
gene expression. Therefore, focusing on early time points before bacterial burdens are different
was essential in deciphering differences in chemokine expression due the absence of TNF
independently of the effects of increased bacterial numbers. Most likely, chemokine induction
was not detectable early after infection because the aerosol infection model used delivers 50-100
CFU, and only a small percentage of macrophages are infected. There is very little time between
the detectable induction of expression in the whole lung and increasing bacterial growth in the
TNF-deficient mice, complicating analysis of the role of TNF in control of chemokine
expression.
In the chronic model of tuberculosis, TNF neutralization also resulted in increased
bacterial burden in the mice relatively early after antibody treatment (within 12 days). When
focusing on chemokine expression at early time points post-antibody treatment, using real time
RT- PCR and RNase protection assay, there were no significant differences in the chemokine
levels between anti-TNF Ab-treated and control mice; as before, chemokine expression increased
in parallel with bacterial burden (Figure 15). It is important to note that granuloma
disorganization was observed in the lungs of TNF-neutralized mice prior to bacterial numbers
increasing, indicating that early time points were important for differentiating the effects of TNF
from the effects of increased bacterial burden. In addition the increasing bacterial burden in the
TNF deficient mice may result in higher numbers of cells migrating to the lungs in response to
the inflammatory stimulus, complicating the analysis. (We attempted to control for bacterial
65

growth during chronic infection in mice by treating mice with pyrazinamide in conjunction with
the anti-TNF or IgG treatment- these data represented in APPENDIX B).
CCL5
0 5 10 15 200
1
2
3
4 MP6IgG
Days of Antibody
CCL8
0 5 10 15 200.0
0.1
0.2
Days Of Antibody
Rat
io to
L32
Rat
io to
L32
CCL3
0 5 10 15 200.0
0.1
0.2
0.3
0.4
0.5
Days Of Antibody
Rat
io to
L32
CCL4
0 5 10 15 200.00
0.05
0.10
0.15
Days Of Antibody
Rat
io to
L32
CXCL10
0 5 10 15 200.0
0.5
1.0
1.5
Days Of Antibody
Rat
io to
L32
CCL2
0 5 10 15 200.0
0.1
0.2
Days of Antibody
Rat
io to
L32
Figure 15. Chemokine expression in the lungs of chronically infected mice.
RNase protection assay was performed on pulmonary RNA isolated from whole lung. Expression is relative to the housekeeping gene L32. Mice were either treated with anti-TNF Ab (MP6- solid lines) or IgG (perforated lines).
66

Relative Chemokine Expression of Lung Granuloma by Laser Capture Microdissection.
The local nature of the immune response to M. tuberculosis, as characterized by a
granuloma, suggests that gene expression measured in whole lung tissue might not accurately
reflect the relevant gene expression within the granuloma [137]. For this reason, chemokine
expression was measured from RNA obtained specifically from granulomatous tissue procured
by LCM. Lung sections from early time points after MP6 or IgG treatment were chosen to
assess the effects of TNF neutralization during a time where bacterial numbers remained similar
in both groups. Relative expression of CXCL9, CXCL10 and CCL5 was measured by real-time
RT-PCR at 0, 4 and 6 days post antibody treatment (Table 4). No significant differences in
CXCL9, CXCL10 or CCL5 expression were detected between MP6 treated and control groups of
mice. The variability within the groups was very high, indicating that the disease state or
bacterial replication at the level of the granuloma varied widely within an individual mouse and
between mice in chronic infection.
Table 4. Gene Expression by Laser Capture Microscopy (LCM) in granulomas isolated through Laser Capture Microscopy.
Granulomas were procured from fixed, embedded tissue and RNA was isolated to examine RNA expression of CXCL9, CXCL10 and CCL5 through real time RT-PCR. The values in the table represent relative units of expression. Each sample’s analysis included comparing the expression of the chemokine to the expression of the endogenous control (HPRT) and comparing the expression relative to the calibrator (in this case uninfected lung). Tissue sections from 4 mice per time point were used to prepare RNA.
Day 0 Day 4 Day 6
IgG MP6 IgG MP6
CXCL9 498.8 ± 276.8 333.7 ± 71.9 287.4 ± 122.1 249.4 ± 119.2 258.0 ± 300.9
CXCL10 85.6 ± 46.0 52.7 ± 32.2 41.3 ± 28.0 36.0 ± 22.5 49.3 ± 44.2
CCL5 5.0 ± 5.6 5.1 ± 2.8 2.9 ± 1.6 4.3 ±1.4 3.9 ± 1.5
67

Ex vivo macrophage isolation Macrophages are a major reservoir for M. tuberculosis, and play a key role in
orchestrating granuloma formation. Due to the low level of macrophage infection early after
aerosol infection, gene expression of infected macrophages may have been diluted in the whole
lung gene expression analysis. A more sensitive technique for assessing the effect of TNF on
macrophage chemokine expression in vivo was needed. We enriched for macrophages by
isolating CD11b+ cells from the lungs of acutely infected TNFRp55-/- and WT mice at various
time points after low dose (50-100 CFU) aerosol infection. RNA was isolated from the CD11b+
population and real time RT-PCR was performed. At day 10 post infection, the CD11b+
population of cells was 50% F4/80+ and 46% Gr1+ following MACs column isolation,
indicating that this technique purified both macrophages and neutrophils from the lungs (Table
5). Using this method, induction of chemokines in CD11b+ cells was still difficult to detect prior
to 9 days post infection; at this time point there was reduced relative expression of chemokines in
the TNF deficient mice compared to wild type, but the expression was very low (Figure 16). Just
three days later (day 12) chemokine expression rose dramatically and the TNF deficient mice had
higher expression of CCL5 and CCL12 chemokines (Figure 16).
Table 5. MACs column isolation of CD11b+ cells.
Flow cytometric analysis results from the MACs column isolation. These data represent the results of one sample from 3 pooled mice. CD3+ B220+ F4/80+ Gr1+ - selection 48% 34% 3% 15% + selection 1% 3% 50% 46%
68

Day 9 Ex vivo macrophages
CXCL10 CXCL9 CCL5 CCL3 CCL4 CCL120
1
2
3
4
5
TNFRW T
Chemokine
Rel
ativ
e U
nits
A.Day 12 Ex vivo macrophages
CXCL10CXCL9 CCL5 CCL3 CCL4 CCL120
10
20
30
TNFRWT
Chemokine
Rel
ativ
e U
nits
B.
Figure 16. Chemokine expression in CD11b+ cells isolated from low dose infection of TNFR and WT mice.
A. At Day 9 chemokine expression was reduced in TNFR-/- mice in many of the chemokines tested. B. At day 12 expression of the chemokines was more highly induced. Each bar represents the combined sample of 3 mice. This experiment was repeated 3 times with similar results.
When we increased our aerosol dose 20-fold to increase the number of macrophages
initially infected in the lungs, we detected induction of chemokines in the macrophage
population as early as 4 days post infection. There were differences between TNFRp55-/- and
wild type mice in the expression of CXCL9, CXCL10, CCL3, CCL4, CCL5 and CCL12 (Figure
17). By 7 days post infection the bacterial burdens in the TNFRp55-/- mice were significantly
higher at this dose (Figure 17). There were still reduced levels of expression of CXCL9,
CXCL10 and CCL4, and but now increased expression of CCL5 and CCL12 in TNFRp55-/-
mice compared to wild type mice (Figure 17). By day 10 the expression was 10-fold higher than
at day 7, and the differences between the mouse strains were no longer observed (Figure 17).
69

Day 4
CXCL10 CXCL9 CCL5 CCL3 CCL4 CCL120 .0
2 .5
5 .0
7 .5TNFR
W T
C hemokine
Rel
ativ
e U
nits
Day 7
CXCL10 CXCL9 CCL5 CCL3 CCL4 CCL120
1
2
3
4TNFR
W T
C hemokine
Rel
ativ
e U
nits
D a y 1 0
CXCL10 CXCL9 CCL5 CCL3 CCL4 CCL120
2 5
5 0
7 5
1 0 0TN F R
W T
C h e m o k in e
Rel
ativ
e U
nits
Figure 17. RNA expression of CCR5 ligands and CXCR3 ligands is transiently reduced in CD11b+ cells of TNFRp55-/- mice infected with a high dose of M. tuberculosis.
Ex vivo isolation of CD11b+ cells was performed on the lungs of TNFRp55-/- mice and wild type mice following high dose (300 CFU) aerosol M. tuberculosis infection. Real time RT-PCR performed on the RNA from those cells revealed that chemokine expression was transiently reduced in the lungs of the TNFRp55-/- mice compared to wild type mice. By day 7 post infection when bacterial burdens were higher in TNFRp55-/- mice reduced levels of expression were still observed. CD11b+ cells from 4-5 mice per time point were pooled to prepare RNA. Relative Units is used to represent the induction of chemokine expression compared to uninfected CD11b+ cells isolated from the lung (represented by line).
To follow the effect of TNF neutralization at the level of macrophages in vivo in the
chronic model of tuberculosis, CD11b+ cells were isolated ex vivo from the lungs of M.
tuberculosis chronically infected mice (treated with IgG or anti-TNF Ab) and real time RT-PCR
was performed on isolated RNA. The expression of CCL3, CCL4, CCL5, CXCL9, and CXCL10
were transiently reduced in CD11b+ cells isolated from chronically infected MP6 treated mice
(Figure 18). The expression of these genes increased as bacterial burdens increased and by 12
70
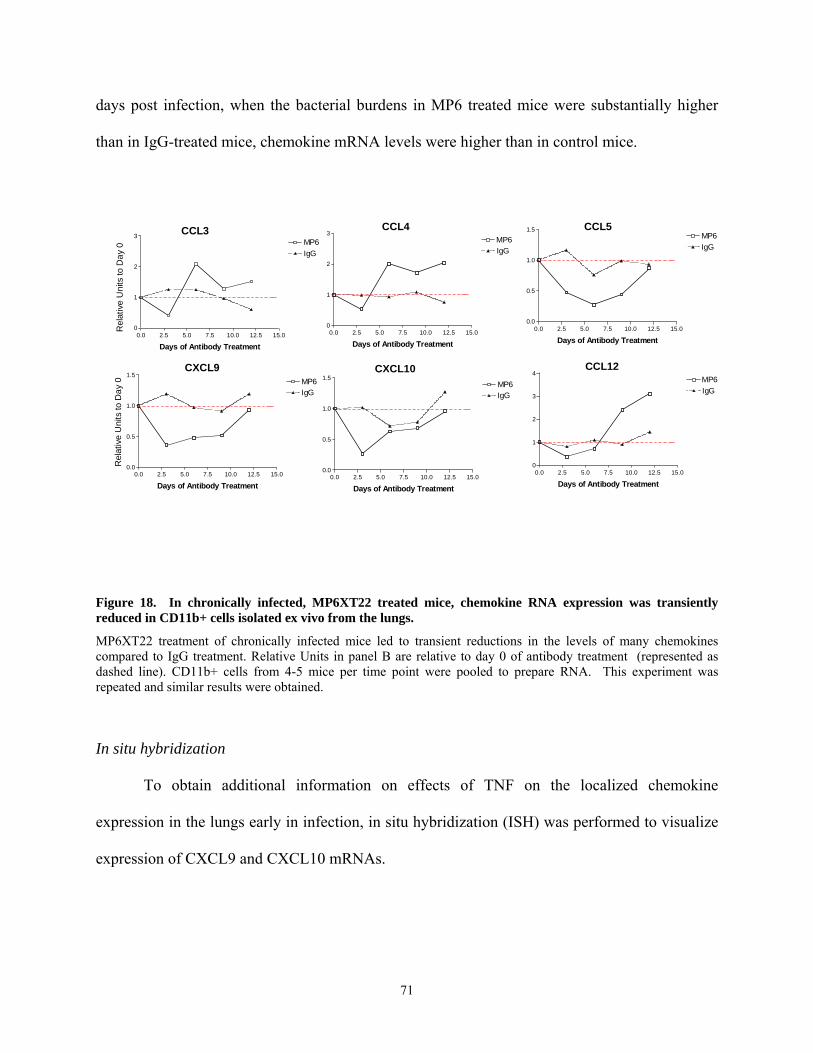
days post infection, when the bacterial burdens in MP6 treated mice were substantially higher
than in IgG-treated mice, chemokine mRNA levels were higher than in control mice. R
elat
ive
Uni
ts to
Day
0
0.0 2.5 5.0 7.5 10.0 12.5 15.00.0
0.5
1.0
1.5MP6IgG
Days of Antibody Treatment
CXCL10
0.0 2.5 5.0 7.5 10.0 12.5 15.00.0
0.5
1.0
1.5MP6IgG
Days of Antibody Treatment
CXCL9
0.0 2.5 5.0 7.5 10.0 12.5 15.00
1
2
3
4MP6IgG
Days of Antibody Treatment
CCL12
0.0 2.5 5.0 7.5 10.0 12.5 15.00
1
2
3MP6IgG
Days of Antibody Treatment
CCL3
0.0 2.5 5.0 7.5 10.0 12.5 15.00
1
2
3MP6IgG
Days of Antibody Treatment
CCL4
Rel
ativ
e U
nits
to D
ay 0
0.0 2.5 5.0 7.5 10.0 12.5 15.00.0
0.5
1.0
1.5MP6IgG
Days of Antibody Treatment
CCL5
Figure 18. In chronically infected, MP6XT22 treated mice, chemokine RNA expression was transiently reduced in CD11b+ cells isolated ex vivo from the lungs.
MP6XT22 treatment of chronically infected mice led to transient reductions in the levels of many chemokines compared to IgG treatment. Relative Units in panel B are relative to day 0 of antibody treatment (represented as dashed line). CD11b+ cells from 4-5 mice per time point were pooled to prepare RNA. This experiment was repeated and similar results were obtained.
In situ hybridization
To obtain additional information on effects of TNF on the localized chemokine
expression in the lungs early in infection, in situ hybridization (ISH) was performed to visualize
expression of CXCL9 and CXCL10 mRNAs.
71

CXC
L9 (M
ig)
ANTI-SENSE SENSEC
XCL1
0 (IP
10)
CC
L5
(RA
NTE
S)
Figure 19. Sense and anti-sense in situ hybridizations to detect CXCL9, CXCL10 and CCL5 in lung tissue infected with M. tuberculosis.
In situ hybridization was performed using 35S-labelled sense and anti-sense riboprobes. Exposures were for 7 days in all cases. The images on the left and in the middle were photographed at 20X. The images on the right were photographed at 60x.
An algorithm was designed to accurately assess two aspects of this study. First the
number and size of the cellular infiltrates was studied. Second, the location and quantity of gene
72

expression with respect to pathology within the lung was evaluated (Table 6). Single cells or
non-clustered cells (<20 cells together) that expressed the gene of interest were classified as
Category 1. Infiltrating clusters of cells were classified as Category 2 or Category 3, on the basis
of histology and regardless of gene expression. Category 2 infiltrates were clusters or infiltrates
of 20-100 cells, whereas Category 3 infiltrates were defined as clusters of >100 cells. After
classifying the infiltrates, the ISH signal for a gene was analyzed in each infiltrate. If no signal
was detected, the infiltrate was designated -. If <50% of the cells within a cellular aggregation
were positive for expression, the infiltrate was designated +, but if >50% of the cells within a
cellular cluster were signaling for expression, the infiltrate was considered ++. Therefore each
category 2 or 3 infiltrate could be either -, +, or ++.
Table 6. Algorithm used for ISH analysis.
Twenty 20X fields were counted for all analyses. All cellular infiltrates were counted and classified into a category based on their size. In addition, all signals for CXCL9 and CXCL10 were also counted and classified based on the cellular infiltrate expressing them.
Category ISH signal Description 1 - Individual cells or a group of <20 cells negative for gene expression (normal tissue) 1 + Individual cells or a group of <20 cells positive for gene expression 2 - Clusters of 20-100 cells, negative for gene expression 2 + Clusters of 20-100 cells, <50% of cells positive for gene expression 2 ++ Clusters of 20-100 cells, >50% of cells positive for gene expression 3 - Clusters of >100 cells, negative for gene expression 3 + Clusters of >100 cells, <50% of cells positive for gene expression 3 ++ Clusters of >100 cells, >50% of cells positive for gene expression
The number of category 1 areas expressing CXCL9 or CXCL10 was counted in twenty
20X fields. Category 1 (normal tissue) expression of CXCL10 was detected as early as 3 days
post infection, and the expression increased gradually as infection progressed. By 12 days post
infection the number of category 1 areas expressing CXCL10 (in the 20 fields counted) increased
to an average of 8 (+2) in the IgG treated mice and 4 (+1) in the anti-TNF Ab treated mice (per
20 fields). Expression of CXCL9 was not detected until day 6 but at this time point it was not
73
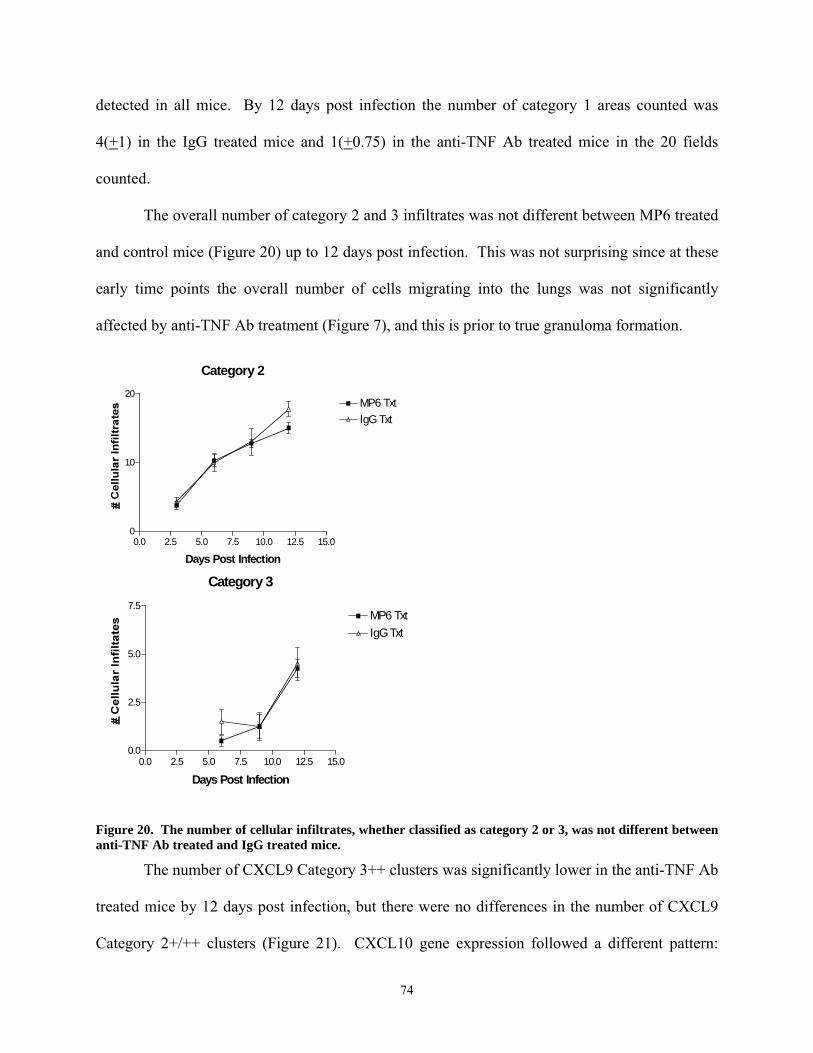
detected in all mice. By 12 days post infection the number of category 1 areas counted was
4(+1) in the IgG treated mice and 1(+0.75) in the anti-TNF Ab treated mice in the 20 fields
counted.
The overall number of category 2 and 3 infiltrates was not different between MP6 treated
and control mice (Figure 20) up to 12 days post infection. This was not surprising since at these
early time points the overall number of cells migrating into the lungs was not significantly
affected by anti-TNF Ab treatment (Figure 7), and this is prior to true granuloma formation.
Category 3
0.0 2.5 5.0 7.5 10.0 12.5 15.00.0
2.5
5.0
7.5MP6 TxtIgG Txt
Days Post Infection
Category 2
0.0 2.5 5.0 7.5 10.0 12.5 15.00
10
20MP6 TxtIgG Txt
Days Post Infection
Figure 20. The number of cellular infiltrates, whether classified as category 2 or 3, was not different between anti-TNF Ab treated and IgG treated mice.
The number of CXCL9 Category 3++ clusters was significantly lower in the anti-TNF Ab
treated mice by 12 days post infection, but there were no differences in the number of CXCL9
Category 2+/++ clusters (Figure 21). CXCL10 gene expression followed a different pattern:
74

there were significantly fewer CXCL10 Category 2+ clusters in MP6-treated mice, but no
differences in the number of CXCL10 Category 3+/++ clusters (Figure 21). These data confirm
that TNF neutralization affects the expression of a subset of chemokines in the lung, and that
effects on timing of chemokine expression may be important in granuloma formation.
Expression of CCL5 was addressed in the tissue of MP6 and IgG treated through in situ
hybridization, but the analysis was more complicated than analysis of CXCL9 and CXCL10.
Due to higher background expression of CCL5 it was near impossible to apply the algorithm to
CCL5 expression. There was specific expression within the inflammatory cellular infiltrates, but
there is also evidence of many endothelial and epithelial cells expressing the CCL5 mRNAs.
75

MP6 Txt- CXCL10IgG Txt- CXCL10MP6 Txt- CXCL9IgG Txt- CXCL9
Category 2+
0.0 2.5 5.0 7.5 10.0 12.5 15.00
10
20
30
40
50
Days Post Infection
p=0.001
% o
f Cat
egor
y 2
infil
trat
es
that
are
2+
Category 2++
0.0 2.5 5.0 7.5 10.0 12.5 15.00
10
20
30
40
50
p=0.058
Days Post Infection
% o
f Cat
egor
y 2
infil
trat
es
that
are
2++
C ategory 3+
0.0 2.5 5.0 7.5 10.0 12.5 15.00
25
50
75
D ays P o st In fect io n
% o
f Cat
egor
y 3
infil
trat
es
that
are
3+
Category 3++
0.0 2.5 5.0 7.5 10.0 12.5 15.00
25
50
75
**p= 0.0081
Days Post Infection
% o
f Cat
egor
y 3
infil
trat
es
that
are
3++
Category 1+ Category 2+ Category 3++
Figure 21. Expression of CXCL9 and CXCL10 are reduced in MP6XT-22 treated mice during acute aerosol
In situ hybridizations were performed on fixed frozen sections of lung tissue. Expression of CXCL10 was reduced in infiltrates of intermediate size (Category 2) in MP6XT-22 treated mice. Expression of CXCL9 was reduced in larger category 3, infiltrates in the MP6XT-22 treated mice compared to the wild type mice. Each panel represents an example of the categorization used in the algorithm, where category 1 + cells were either single positive cells or a cluster of less than <20 cells that were positive. Category 2 infiltrates were clusters of cells with 20-100 cells contained within the cluster. If <50% of the cells were positive in the cluster than the infiltrate was classified as 2+, If > 50% of the cells in the infiltrate were positive the infiltrates was classified as 2++. Category 3 infiltrates were classified as clusters of >100 cells. Again, percent % cells was used to classify the infiltrates as -, +, or ++. 20, 20X fields were counted for the analysis.
76
7.4 Discussion
TNF is required for granuloma formation and the absence of TNF affects the expression
of many inducible chemokines in the acute and chronic models of tuberculosis. In the absence of
TNF, the cell-mediated immune response fails to control infection and the bacterial burden
increases. Interestingly, in the chronic model of infection, the mice succumb to infection before
the bacterial burdens rise to moribund levels, indicating that lung pathology is presumably
leading to a decrease in lung function and death [106]. Deciphering the difference between the
influences of TNF and bacterial burden on chemokine expression, in a model where TNF affects
bacterial burden, was technically challenging. Focusing attention at early time points in the
experimental models allowed us to diminish the impact of higher bacterial burdens in TNF
deficient mice. In addition, we focused on macrophage chemokine expression since this cell is a
major M. tuberculosis reservoir and is responsive to TNF. This enabled detection of the effects
of anti-TNF Ab on chemokine expression prior to changes in pathology, granuloma formation,
and increased bacterial burden. Following increased bacterial burdens, the chemokine gradients
were even more dramatically altered. The initial changes in chemokine expression may lead to a
cascade of inappropriate cellular communication, impaired cell migration within the lung, and
loss of cell mediated immune response.
Control of cell migration is a complex process involving not only chemokines and
receptors, but also adhesion molecules. The complexity of this process has been illustrated in
this study. We also examined expression of adhesion molecules, using gene expression filter
arrays (GEArray Q Series SuperArray Bioscience Corporation), but no striking differences were
observed after anti-TNF Ab treatment (APPENDIX C). Clearly changes in pathology are
compounded by the other roles that TNF plays in control of M. tuberculosis infection and the
effects on chemokine expression are probably not solely responsible for the severe pathology
77

observed in TNF-deficient mice. Studies on low dose aerosol M. tuberculosis infection in CCR2
and CCR5 chemokine receptor transgenic knockout mice [[63] and Section 9.3 Results.], and in
vivo models of CXCL9 and CXCL10 neutralization [[72] and Section 8.3 Results.] have
revealed some differences in cell migration. But even in these models, the pathology does not
mirror the destructive pathology observed in the absence of TNF, where signaling by some of the
same chemokines that were affected by TNF neutralization is diminished. CCR2-/- mice have
fewer macrophages throughout infection, but have sufficient numbers to control low dose
infection, although the mice are quite susceptible to high dose infection [62, 63], see Section
10.0. CCR5-/- mice had a greater lymphocytic infiltrate in their lungs, but controlled infection
(See Section 9.0). CXCL10-/- and mice treated with both anti-CXCL9 and anti-CXCL10
antibodies controlled infection with no apparent lymphocyte migration deficiencies (See Section
8.0) to the lung but a slight delay in lymphocyte migration to the lymph nodes.
A recently published study provided data that anti-CXCL9 Ab treatment in M.
tuberculosis infected mice did not affect control of infection, but the mice had smaller, although
still organized, granulomas [72]. These authors suggested that CXCL9 was produced by
neutrophils and played a key role in granuloma formation. However, the differences we
observed in pathology and granuloma formation in TNF-deficient mice was not reflected in the
anti-CXCL9 Ab treated mice. Therefore, TNF-mediated control of CXCL9 expression may be
only one factor in the influence this cytokine has on granuloma formation.
Our studies on whole lung chemokine RNA expression consistently revealed differences
in gene expression at early time points post infection and after antibody treatment when
comparing control and TNF deficient mice. Although these differences were consistent (in 3
experiments), they were not significant. The laser capture microscopy technique was employed
78

to examine more localized gene expression patterns in granulomas. To isolate enough RNA
from fixed, embedded tissue to perform real time RT PCR on the LCM samples, multiple
granulomas had to be isolated from each mouse. Although the granulomas isolated were from
the same lobe of the lung, there was still high variability among mice and probably between
granulomas, since granuloma size and the number of bacteria in each granuloma can be variable.
Although the LCM data revealed that the chemokine expression was higher within the
granuloma compared to the whole lung, the pattern of expression was similar to whole lung
chemokine expression.
We next focused our in vivo studies on the CD11b+ population of cells, enriching for
macrophages. The technique used removed epithelial cells and lymphocytes from the lung
homogenates, but the neutrophils (which are CD11b+) were not removed. We have focused on
the macrophages, since direct effects of TNF on chemokine production by this population was
observed in vitro. However, TNF may also affect chemokine production by neutrophils. The
number of neutrophils at early time points post infection and after antibody treatment in
chronically infected mice was similar to the number of macrophages present in the lungs [[63],
Figure 7 and 7]. There were 3-5x10⁴ macrophages and 3-5x10⁴ neutrophils 6 days post infection
and 4x10⁵ of each cell type at 4 days after initiation of antibody treatment in the chronic model.
Recently, there has been published evidence of TNF affecting chemokine levels in the
liver during intravenous M. smegmatis and M. tuberculosis infection [142, 143]. Our study has
gone beyond these by focusing on the localized chemokine expression in the lungs following
aerosol infection, and by addressing chemokines that have not previously been studied. We also
carefully controlled for the confounding effects of bacterial numbers on chemokine expression
by studying very early time points in the infection or neutralization. We demonstrated that the
79

chemokine deficiency in the absence of TNF was at the macrophage level, using in vivo and in
vitro studies. The macrophage likely plays a key role in granuloma formation as an initial site of
infection, a reservoir for M. tuberculosis, and a potent producer of both TNF and chemokines.
The chemokines affected by TNF are known to influence the migration of cell types
found within the lung during M. tuberculosis infection. CCL5, produced in the lung and by
macrophages at high levels, induces migration of T lymphocytes, monocytes, and immature
dendritic cells through CCR1 and CCR5. Disruption in the CCL5 gradient, seen in TNF
deficient mice, likely affects the migration of these cells within the lung. T lymphocyte
migration in the lungs could also be affected by the reduction in CXCL9, CXCL10, CCL3 and
CCL4. Monocyte and macrophage migration may be affected by similar chemokines including
CCL3 and CCL4 through CCR5, and CCL2 and CCL12 through CCR2. The increased
expression of these chemokines following increased bacterial load also likely leads to increased
cell migration to the lungs. Therefore, we propose that the initial reduction in chemokines in the
absence of TNF leads to localized changes in the gradients, decreased cell responsiveness and
disorganized cellular infiltrate. As a result the cells do not interact with each other in a
coordinated manner, thus reducing the cell mediated response [106]. The reduced cell mediated
response leads to increased bacterial burden, increased chemokine expression and an increase in
cells migrating into the lungs, including neutrophils.
80

Table 7. Summary of the effects of anti-TNF Ab on the expression chemokines in M. tuberculosis infected macrophages.
A down arrow (↓) indicates that expression was reduced in the presence of anti-TNF Ab (when added at the time of infection). The symbol (←→) indicates that there was no difference in the expression of this gene. ND= not determined. *When anti-TNF Ab was administered 4 hours after infection, expression of CCL12 increased.
CHEMOKINE RNA PROTEIN
CXCL9 (CXCR3 ligand) ↓ ↓
CXCL10 (CXCR3 ligand) ↓ ↓
CXCL11 (CXCR3 ligand) ↓ ND
CCL3 (CCR5 ligand) ↑ ↓
CCL4 (CCR5 ligand) ←→ ND
CCL5 (CCR5 ligand) ↓ ↓
CCL2 (CCR2 ligand) ←→ ↓
CCL12* (CCR2 ligand) ↓ ↓↑
The chemokine expression studies performed in vitro advance our understanding of the
role of TNF in chemokine expression and in post-transcriptional regulation of chemokines. The
RNA analysis serves as a snapshot of the RNA at that moment in the cell, whereas collecting
supernatant from cell culture was a representation of the accumulated proteins in the media.
Gene expression of most chemokines tested diminished by 48 hours post infection (except
CCL5); this may indicate that there was a negative feedback loop for gene expression. CCL3
expression was interesting because although mRNA expression peaked at a similar point in the
anti-TNF Ab treated and control macrophages, the mRNA levels remained higher in the TNF-
neutralized cultures. However, the protein level peaked at a lower point, and was reduced in the
81

TNF-neutralized cultures. The anti-TNF Ab treated macrophages may continue to express the
gene in these cultures because the protein has not accumulated to a level to turn down
transcription. In addition the expression of CCL2 was only reduced very early after infection in
the presence of anti-TNF Ab, but the protein expression was reduced as late as 48 hours post
infection. This suggests that CCL2 and CCL3 post-transcriptional regulation may be affected by
TNF.
The in situ hybridization analysis of CXCL9 and CXCL10 expression highlighted the
extensive variability between different stages of cellular infiltrates, granuloma formation, and
their chemokine expression. First, analyzing the number and size of the infiltrates confirmed that
at early time points, the cellular infiltration in the lungs was not different in the anti-TNF Ab
treated mice compared to control mice. As infection progressed, the control mice developed
organized granulomas, while the TNF-deficient mice did not. Early patterns of chemokine
expression presumably affect this organization of the cellular infiltrate. The size of the
collection of cellular infiltrate in the lungs can reasonably be attributed to the time of formation:
as the infiltrate grows and collects more cells, the granuloma forms. Expression of CXCL10 in
smaller (early) infiltrates (Category 2) was affected by TNF, but CXCL9 expression was only
influenced by TNF in larger infiltrates (Category 3). This may suggest a differential timing of
chemokine expression in granuloma formation, or that expression of these chemokines is
sensitive to different levels of TNF. Alternatively, in the larger infiltrates, there are more cellular
interactions, and possibly more cytokines to signal CXCL10 expression, overcoming a
deficiency in TNF. Comparing this to our findings in the macrophages, it was similarly observed
that CXCL9 was more dramatically affected by the anti-TNF Ab treatment than was CXCL10.
The kinetics of chemokine expression is clearly complex in the lungs, and the dynamics of
82

granuloma formation may depend on TNF signaling expression of different chemokines at
specific times.
In summary, this in depth study of localized chemokine expression patterns during acute
and chronic M. tuberculosis infection presents evidence for TNF playing a direct role in
chemokine expression and granuloma formation. We demonstrated that macrophages in vitro
and CD11b+ cells in vivo, are partially dependent on TNF for expression of many inducible
chemokines following M. tuberculosis infection. Our findings are relevant to understanding the
immune response and granuloma formation during aerosol M. tuberculosis infection, and will
contribute to an appreciation of the potential effects of anti-inflammatory or anti-chemokine
therapies on infections.
83

8.0 Chapter 2 CXCL9 and CXCL10 are not required for granuloma formation and control of M. tuberculosis infection
8.1 Introduction
A Th1 cell mediated immune response is required for control of M. tuberculosis. Th1
associated responses include both CD4 and CD8 lymphocytes and expression of inflammatory
cytokines such as IL-12, TNF, IFNγ, and IL-1. The migration of T lymphocytes to the lungs
during M. tuberculosis infection begins about one week post infection and as bacterial burdens
increase, the numbers of T lymphocytes migrating to the lungs also increases in a similar pattern.
The signals required for T lymphocyte migration to the lungs have been studied to a limited
degree. Presumably the cells migrate through a cascade of events including rolling, adherence,
transmigration and response to chemotactic gradients.
It has been reported that CXCR3, a chemokine receptor, is expressed on Th1
lymphocytes, circulating CD4 and CD8 lymphocytes, NK cells, plasmacytoid and myeloid
dendritic cells and leukemic B cells. This receptor is more promiscuous than initially thought,
but the highest expression appears to be on Th1 lymphocytes. The ligands for CXCR3 in the
mouse include CXCL9 (Mig), CXCL10 (IP10), CXCL11 (ITAC) and CCL21 (SLC) [151]. The
CXCR3 ligands were originally described as IFNγ-inducible proteins, but other signals, such as
LPS or high antigenic stimulation, have also been shown to induce expression of these
chemokines [119]. We observed induced expression of CXC chemokines, CXCL9, CXCL10,
CXCL11, in bone marrow derived macrophages following M. tuberculosis infection (Figure 10
and 10). The expression of CXCL9 and CXCL10 increased in the lungs following aerosol M.
tuberculosis infection. Until recently it was believed that CXCR3 was the only receptor for
CXCL10, but there is new evidence of a receptor for CXCL10 on epithelial cells and possibly
endothelial cells which may induce antiangiogenic properties [152]. The expression level of
84
CXCL10 appears to correlate with T lymphocyte infiltration during Th1 inflammatory responses,
such as multiple sclerosis [153] and inflammatory bowel disease (unpublished, Grimm, MC, St
George Clinical School, University of New South Wales).
Although CXCL9, 10 and 11 share a common receptor, there is some evidence that their
functions may not be redundant [151]. Transgenic knockout models and neutralizing antibody
for CXCL9 and CXCL10 have been utilized to study lymphocyte migration and effector function
in various infectious disease models. Studies in a murine viral hepatitis model show that anti-
CXCL10 treatment led to increased mortality and delayed viral clearance during the chronic
stage of infection [154]. On the other hand, treatment with anti-CXCL9 antibody did not lead to
a change in the course of disease. These data indicate that in vivo the biological function of
CXCL9 and CXCL10 may be different. Treating Toxoplasma gondii infected mice with anti-
CXCL10 antibody increased susceptibility [155] with a greater than 1000 fold increase in
parasite burden. In addition CXCL10-/- mice infected with mouse hepatitis virus were unable to
control viral replication in the brain. These mice exhibited decreased antigen specific
lymphocyte migration to the brain and decreased IFNγ responses compared to wild type
littermates [154]. However, no significant differences were found in mortality in CXCL9-/- mice
infected with Listeria monocytogenes, Salmonella typhimurium, Francisella tularensis, M.
avium, T. gondii, vaccinia virus, ectromelia virus, Herpes Simplex Virus type 1, Histoplasma
capsulatum, or Cryptococcus neoformans [120]. The CXCL9-/- mice infected with F. tularensis
did have lower antibody responses than control mice, suggesting that CXCL9 may play a role in
the T lymphocyte/APC/B lymphocyte interaction [120].
The available data support that the primary role of CXCR3 and its ligands is in
recruitment of effector T lymphocytes, especially Th1 subsets during inflammatory responses.
85

Given that M. tuberculosis induces a Th1 response and requires T lymphocytes to migrate to the
lungs during infection, we hypothesized that CXCL9 and/or CXCL10 may be necessary for
migration of these cells to the lungs during infection. To test this hypothesis, we used both a
knockout model and an antibody neutralization model of infection. CXCL10-/- mice and their
CXCL10+/+ littermates, and wild type mice treated with anti-CXCL10 and anti-CXCL9 along
with control wild type mice were infected with M. tuberculosis via aerosol. Our results indicated
that with or without bioactive CXCL9 and CXCL10, mice controlled M. tuberculosis infection,
formed granulomas and mounted a Th1 response in the lungs.
8.2 Materials and Methods.
Mice.
B6/129 CXCL10-/- mice, their wild type littermates, 129 CXCL10-/- mice and their wild type
littermates were provided by Andrew Luster (Harvard University School of Medicine).
Following quarantine these mice were transferred to the BSL3 facility. Mice were 5-7 months
old when infected. C57BL/6 female mice (Charles River, Rockland, MA) (8-14 weeks old) were
used in chemokine neutralization experiments. All infected mice were maintained in the BSL3
animal laboratories and routinely monitored for murine pathogens. The University Institutional
Animal Care and Use Committee approved all animal protocols employed in this study.
Antibodies and chemicals.
Anti-CXCL10 and anti-CXCL9 were provided by Andrew Luster (Harvard University School of
Medicine). These antibodies were administered at 100µg/ i.p. every other day. Control mice
received a non-specific rat IgG (Jackson ImmunoLabs). All chemicals were purchased from
Sigma Chemical Co. (St. Louis, MO.) unless otherwise noted. Middlebrook 7H9 liquid medium
and 7H10 agar were obtained from Difco Laboratories (Detroit, MI). Antibodies used in flow
86

cytometry were obtained from Pharmingen (San Diego, CA).
Bacteria and infections.
To prepare bacterial stock, M. tuberculosis strain Erdman (Trudeau Institute, Saranac Lake,
N.Y.) was used to infect mice, and then bacteria were harvested from their lungs, expanded in
7H9 liquid medium and stored in aliquots at -80°C. Mice were infected via the aerosol route
using a nose-only exposure unit (InTox Products, Albuquerque, N.M.), and exposed to M.
tuberculosis (1 x 10⁷ CFU/ml in the nebulizer chamber) for 20 minutes, followed by 5 minutes of
air. This resulted in reproducible delivery of 50-100 viable CFU of M. tuberculosis, which was
confirmed by CFU determination on the lungs of 2-3 infected mice 1 day post-infection. The
tissue bacillary load was quantified by plating serial dilutions of the lung homogenates in 0.05%
PBS/Tween 80 onto 7H10 agar. Total colony forming units were calculated.
Culture and infection of DCs.
Dendritic cells are derived from the C57Bl/6 mice bone marrow. The bone marrow was obtained
as previously described [82]. After the cells were washed and counted, the cells were
resuspended in two non-tissue culture treated deep dish petri dishes in 20 ml DC media/ plate
(10% FBS, 1% sodium pyruvate, 1% L-glutamate) overnight. The following day, the
nonadherent and semi-adherent cells were removed from the plates, spun down and cultured at
1x10⁶ cells/ ml in DC media with 20ng/ml of GM-CSF and 20ng/ml of IL-4 (PeproTech Inc.,
Rocky Hill, NJ) in p75 filter flasks. On day 3 of culture the cells were fed with and additional
5ml DC media and 100ng of GM-CSF and IL-4. Dendritic cells were infected with M.
tuberculosis on day 6 of culture (MOI 4) in the presence of GM-CSF. M. tuberculosis culture
from day 5 or 6 was centrifuged at 4000 RPM for 10 minutes and then resuspended in DC media.
The M. tuberculosis suspension was then sonicated twice in a closed cup-horn sonicator at a
87

power of 5 for 10 seconds each time. Following sonication the bacillus was added to the DC
culture at a multiplicity of infection of 4. Cells were infected for 14-20 hours. Extracellular
bacteria were separated from the cells by low speed centrifugation. Infected and uninfected DCs
were used for stimulation assays.
FACS analyses of Cell Surface Markers.
To determine cellular infiltrate in the lung, at 10-day intervals lungs were removed for flow
cytometric analysis. Lungs were subjected to a short period (20 min.) of digestion with 1mg/ml
collagenase A and 25 Units/ml DNAse (Boehringer Mannheim, Mannheim, Germany) at 37°C.
The suspension was then pushed through a cell strainer as previously described [63]. Red blood
cells were lysed with lysis buffer (0.14M NH4Cl/ 0.017Mtris pH= 7.65) and the single cell
suspension was counted. The samples were stained with 0.2 µg anti-CD4 (clone H129.19), anti-
CD8 (clone 53-6.7), and anti-CD69 (clone H1.2F3) in FACS buffer (0.1% NaAzide, 0.1% BSA,
20% mouse serum). Following washes, the cells were fixed in 4% PFA for 1 hour and collected
on a FACSCaliber (Beckon Dickinson). Cells were gated on the lymphocyte population by size
and granularity. Analysis was performed on Cell Quest software (BD-Pharmingen, San Diego,
CA).
Intracellular Cytokine Staining.
Single cell suspensions of the lung were prepared as described above. The lung cells were then
cultured at 0.5x10⁶ cells/ml in the presence of 2µM monensin and with or without anti-CD3
(0.1µg/ml) and anti-CD28 (1µg/ml) for 4 hours (37°C and 5%CO) in 24 well plates. Following
stimulation, the cells were collected, spun down and stained for T lymphocyte surface markers as
described above, following fixation with 100µl 4% PFA, the cells were transferred to a 96 well
plate, washed 2 times with permeablization buffer (FACS buffer + 0.1% saponin), stained with
88

anti-IFNγ (2µl neat) for 20 minutes at 4°C, and then washed 2 times with permeablization buffer
and once with FACs buffer. The cells were then resuspended in 4% PFA and collected on the
FACS Caliber (Beckon Dickinson).
T cell proliferation Assay.
DCs uninfected and infected at a MOI of 4 for 18 hours were plated in triplicate in a 96-well U-
bottom plate (Corning Incorporated, Corning, NY) at different concentrations of DC: T cell
ratios (1:25, 1:50 and 1:100) in T cell media (DMEM containing 10% certified FBS, 10mM
sodium pyruvate, 2mM L-glutamine, 25mM HEPES (Gibco, Gaithersburg, MD) and 50µM 2-
ME. As a source of T lymphocytes, splenocytes were obtained from CXCL10-/- and WT mice
by crushing the spleens in cell strainers. Red blood cells were lysed as described above and
macrophages were depleted by adherence on plastic petri dishes for 2 hours at 37°C/5% CO2.
Cells suspensions were added at 2x10⁵cells/ well (in a final volume of 100µl) and cultured in
media alone (negative control), 5µg/ml ConA (a positive control), uninfected, or infected DCs
for 3 days. Cells were pulsed for the final 18 hours of culture with 1µCi/well [3H] thymidine
(Amersham Life Sciences, Inc., Arlington Heights, IL) and the incorporation of radioactivity was
measured by counting cell lysates on filters in a scintillation counter. The simulation index was
determined by (CPM T Cells+infected DCs)/(CPM Tcells+uninfected DCs).
Culture of lung cells.
Lung cells from CXCL10-/- and WT mice infected for 4 weeks were obtained as described
above and plated in 96-well U-bottom plates in T cell media supplemented with 30µg/ml
gentamicin (Gibco, Gaithersburg, MD), 15-20 U/ml rIL-2 (Boehringer Mannheim, Indianapolis,
IN), and 1mM aminoguanidine at 2x10⁵ cells/well. MHC Class II DCs were infected for 20
hours as described above and were added to the cell cultures at 6x10³ cells/well. After 2-3 days
89

of culture 100µl of media were removed from each well and replaced with fresh media
containing IL-2. Cells were cultured for an additional 3-4 days prior to the CTL assay.
Cytotoxicity Assay.
Lymphocytes harvested from 5-7 day stimulation cultures were tested in a 4-h 51Cr release assay.
Bone marrow derived macrophages were prepared (as described in Section 7.2 Materials and
Methods) and used as targets (uninfected or infected at MOI 3). 2x10⁶ macrophages were
labeled with 100ul Na51CrO4 (Amersham) in Teflon jars (Savillex, Minnetonka, MN) for 1 hour
at 37°C. Macrophages were washed 3 times and then added to 96-well U-bottom plates at 4x10³
cells/ well. Cultured T cells were added at various effector: target ratios (1:12, 1:25, 1:50) in a
total volume of 100µl in T cell media. After 4 hours, 85µl of supernatant was removed from
each well and 100ml of undiluted vesphene was mixed with the supernatant. This mixture was
counted in a gamma counter. Spontaneous release was determined by culturing target cells in
medium along and total release was calculated by lysing target labeled macrophages with 0.1%
Triton-X. Percent specific lysis was calculated using the formula: 100x[(experimental CPM-
spontaneous CPM)/ (total CPM-spontaneous CPM)].
Statistics.
Statistical analysis was performed comparing CXCL10-/- vs. wild type littermates and
comparing anti-CXCL10/anti-CXCL9 to their controls. Student t-test was preformed using
GraphPad Prism3 software for the analyses.
8.3 Results.
In the absence of CXCL10 and CXCL9, mice control M. tuberculosis infection. CXCL10 deficient mice (CXCL10-/-), wild type littermates, C57Bl/6 mice treated with
anti-CXCL10 and anti-CXCL9 antibodies, and C57Bl/6 control mice were aerosol infected with
90

approximately 100 colony forming units of Erdman M. tuberculosis. One group of CXCL10-/-
mice was from a pure 129 background, while the second group was B6/129 mixed background.
These mice were matched with their wild type littermates. In all experiments performed, the
data between these two groups were very similar. Data from the B6/129 mixed litters will be
presented here. CXCL10-/- mice controlled M. tuberculosis infection as well as their wild type
littermates (Figure 22). As seen in wild type C57Bl/6 mice, the bacterial burdens increased
rapidly after infection, and by 3-4 weeks post infection the number of bacteria in the lungs
reached a plateau. The anti-CXCL10/anti-CXCL9 treated mice also controlled infection as well
as their controls (Figure 22). No mice succumbed to infection during the course of the
experiment. Therefore CXCL10 and CXCL9 may not be necessary for control of mycobacterial
growth.
91
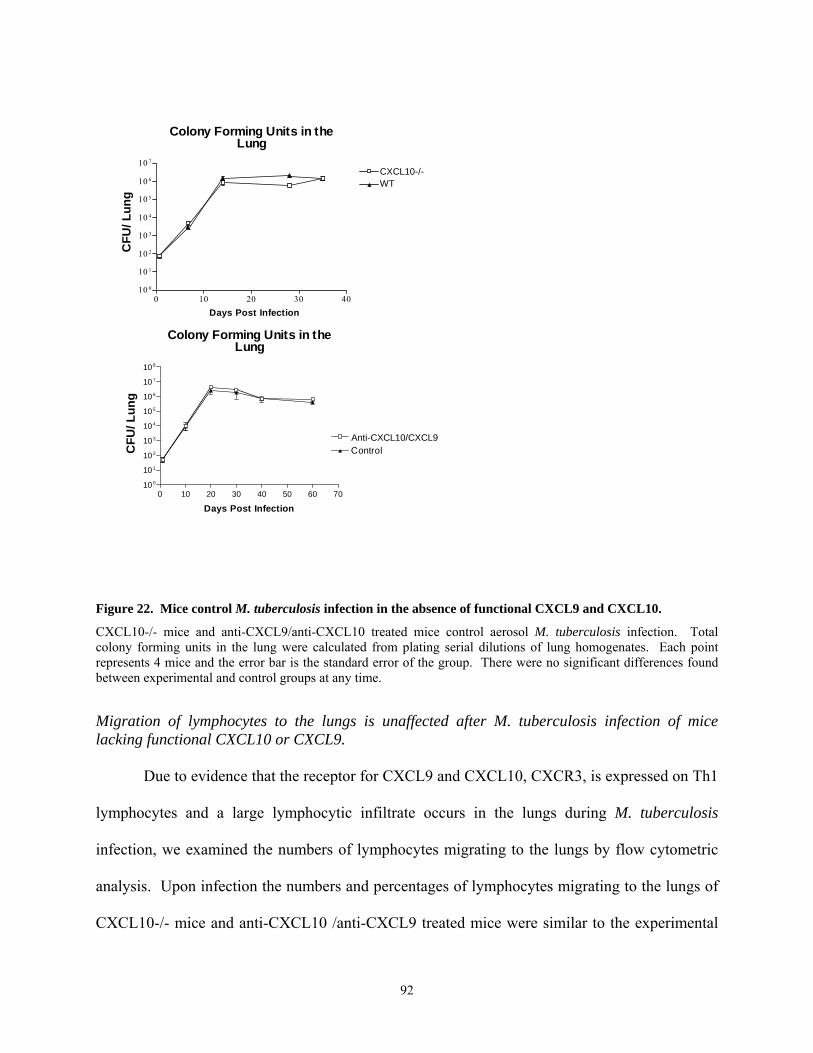
Colony Forming Units in theLung
0 10 20 30 4010 0
10 1
10 2
10 3
10 4
10 5
10 6
10 7
CXCL10-/-WT
Days Post Infection
CFU
/ Lun
g
0 10 20 30 40 50 60 7010 0
10 1
10 2
10 3
10 4
10 5
10 6
10 7
10 8
Control
Days Post Infection
CFU
/ Lun
g
Anti-CXCL10/CXCL9
Colony Forming Units in theLung
Figure 22. Mice control M. tuberculosis infection in the absence of functional CXCL9 and CXCL10.
CXCL10-/- mice and anti-CXCL9/anti-CXCL10 treated mice control aerosol M. tuberculosis infection. Total colony forming units in the lung were calculated from plating serial dilutions of lung homogenates. Each point represents 4 mice and the error bar is the standard error of the group. There were no significant differences found between experimental and control groups at any time.
Migration of lymphocytes to the lungs is unaffected after M. tuberculosis infection of mice lacking functional CXCL10 or CXCL9.
Due to evidence that the receptor for CXCL9 and CXCL10, CXCR3, is expressed on Th1
lymphocytes and a large lymphocytic infiltrate occurs in the lungs during M. tuberculosis
infection, we examined the numbers of lymphocytes migrating to the lungs by flow cytometric
analysis. Upon infection the numbers and percentages of lymphocytes migrating to the lungs of
CXCL10-/- mice and anti-CXCL10 /anti-CXCL9 treated mice were similar to the experimental
92
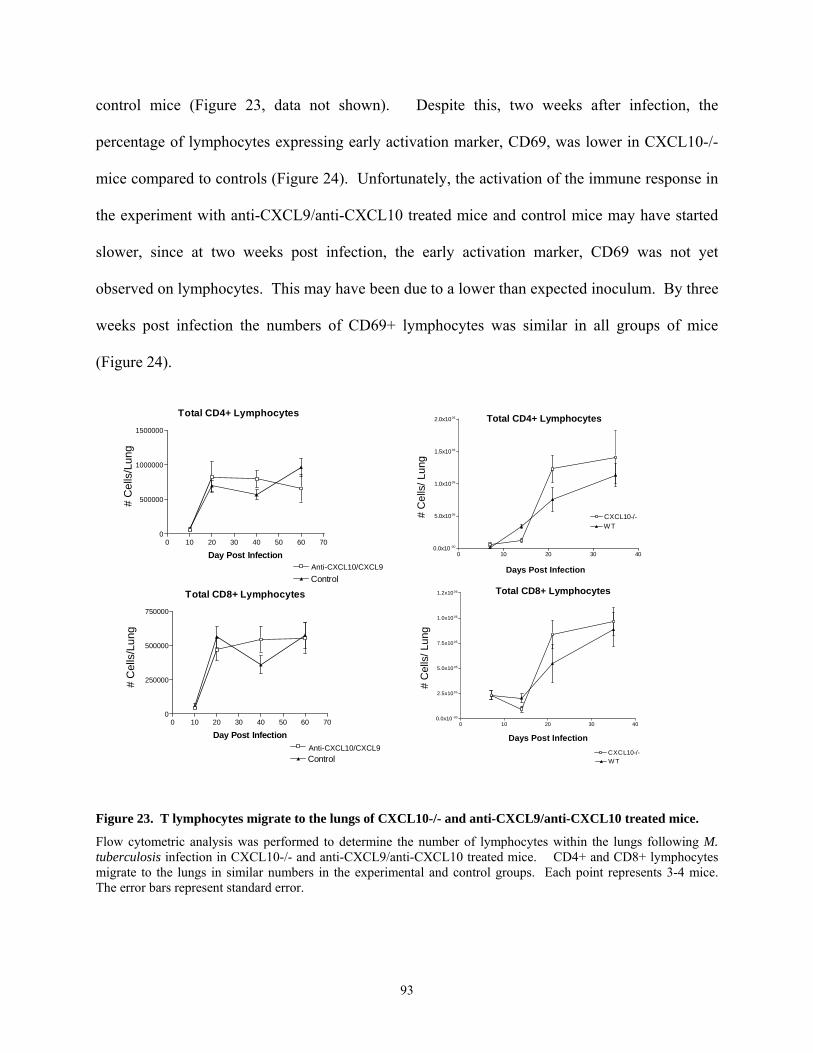
control mice (Figure 23, data not shown). Despite this, two weeks after infection, the
percentage of lymphocytes expressing early activation marker, CD69, was lower in CXCL10-/-
mice compared to controls (Figure 24). Unfortunately, the activation of the immune response in
the experiment with anti-CXCL9/anti-CXCL10 treated mice and control mice may have started
slower, since at two weeks post infection, the early activation marker, CD69 was not yet
observed on lymphocytes. This may have been due to a lower than expected inoculum. By three
weeks post infection the numbers of CD69+ lymphocytes was similar in all groups of mice
(Figure 24).
Control
Total CD8+ Lymphocytes
0 10 20 30 40 50 60 700
250000
500000
750000
Control
Day Post Infection
Anti-CXCL10/CXCL9
Anti-CXCL10/CXCL9
# C
ells
/Lun
g
Total CD4+ Lymphocytes
0 10 20 30 40 50 60 700
500000
1000000
1500000
Day Post Infection
# C
ells
/Lun
g
0 10 20 30 400.0x10 -00
2.5x1005
5.0x1005
7.5x1005
1.0x1006
1.2x1006
CXCL10-/-W T
# C
ells
/ Lun
g
Days Post Infection
Total CD8+ Lymphocytes
0 10 20 30 400.0x10-00
5.0x1005
1.0x1006
1.5x1006
2.0x1006
WTCXCL10-/-#
Cel
ls/ L
ung
Days Post Infection
Total CD4+ Lymphocytes
Figure 23. T lymphocytes migrate to the lungs of CXCL10-/- and anti-CXCL9/anti-CXCL10 treated mice.
Flow cytometric analysis was performed to determine the number of lymphocytes within the lungs following M. tuberculosis infection in CXCL10-/- and anti-CXCL9/anti-CXCL10 treated mice. CD4+ and CD8+ lymphocytes migrate to the lungs in similar numbers in the experimental and control groups. Each point represents 3-4 mice. The error bars represent standard error.
93

0 10 20 30 40 50 60 700
100000
200000
300000
400000
500000
0 10 20 30 40 50 60 700
100000
200000
300000
400000
500000
Anti-CXCL10/CXCL9
Control
# C
ells
/ Lun
g#
Cel
ls/ L
ung
Total CD4+CD69+ lymphocytes
Days Post Infection
Days Post Infection
Total CD8+CD69+ lymphocytes
CXCL10-/-WT
0 10 20 30 400
10
20
30
40
50 CD4 Gate
% C
D69
+
Days Post Infection
0 10 20 30 400
25
50
75 CD8 Gate
% C
D69
+Days Post Infection
Figure 24. T lymphocytes in the lung are activated in CXCL10-/- and anti-CXCL9/anti-CXCL10 treated mice.
The number and percentage of CD69+ cells in the CXCL10-/- and anti-CXCL9/anti-CXCL10-/- is similar to control mice by 3 weeks post infection. In the CXCL10-/- mice the percentage of CD69+ lymphocytes is lower at 2 weeks post infection, but the reduction is transient. Each point represents 3-4 mice. The error bar represents the standard error.
Cell migration to the lymph nodes. The lymph nodes serve as a priming and activation site for antigen specific lymphocytes.
Naïve cells migrate to the lymph nodes, where they are primed and expanded to generate effector
lymphocytes. In the anti-CXCL9 and anti-CXCL10 treated mice, we examined the numbers of
cells and the number of activated cells in the lymph nodes after infection. There was either a
delay in migration, activation or expansion of CD4 and CD8 lymphocytes in the antibody treated
mice. Clearly the number of lymphocytes and the number of activated lymphocytes present in
the lung draining lymph nodes was lower in the antibody treated mice early after infection
94

(Figure 25). By two months post infection, the numbers of cells in the antibody treated mice was
higher than in controls, but the number of activated lymphocytes was similar.
CD4+ Lymphocytes
0 10 20 30 40 50 60 700
2500000
5000000
7500000
Control
Day Post Infection Anti-CXCL10/CXCL9
CD8+ Lymphocytes
0 10 20 30 40 50 60 700
1000000
2000000
3000000
4000000
5000000
Control
Day Post InfectionAnti-CXCL10/CXCL9
*
**
Tota
l Cel
ls/ L
NTo
tal C
ells
/ LN
ControlAnti-CXCL10/CXCL9
Total CD69+CD4+
0 10 20 30 40 50 60 700
500000
1000000
1500000
Day Post Infection
**
Tota
l Cel
ls/ L
N
Total CD69+CD8+
0 10 20 30 40 50 60 700
100000
200000
300000
400000
500000
Day Post Infection
**
Tota
l Cel
ls/ L
N
Figure 25. Cell migration to the lymph nodes was delayed in anti-CXCL9/anti-CXCL10 treated mice.
Flow cytometric analysis was performed to determine the number of lymphocytes and activated lymphocytes present in the lung draining lymph nodes of anti-CXCL9/anti-CXCL10 treated and control mice. Each point represents 3-4 mice. The error bar represents the standard error. * p<0.05, **p<0.005
IFNγ production in the absence of functional CXCL9 and CXCL10. IFNγ production is essential for control of M. tuberculosis infection [64, 98]. There is
increasing evidence that the signaling of chemokines not only leads to migration of cells, but can
also lead to activation. Intracellular cytokine staining was performed to determine whether the
lymphocytes in the lungs were activated and capable of producing IFNγ. By three weeks post
infection (the earliest we examined IFNγ production in this experiment), the lymphocytes from
CXCL10-/- and anti-CXCL9/anti-CXCL10 mice produced levels of IFNγ similar to that
95

produced by wild type and control mice (Figure 26). There were slightly higher levels of IFNγ
present in the wild type or control mice, but the differences were not significant. ELIspot
analysis performed on the anti-CXCL9/anti-CXCL10 mice confirmed that there were similar
amounts of IFNγ being produced in the experimental and control groups (data not shown).
IFNg+CD4+
0 10 20 30 40 50 60 700.0
2.5
5.0
7.5
Control
Day Post Infection
IFNg+CD8 +
0 10 20 30 40 50 60 700
1
2
3
4
Day Post Infection
Anti-CXCL10/CXCL9
% w
ithin
lym
phoc
yte
gate
% w
ithin
lym
phoc
yte
gate
Figure 26. IFNγ production in the absence of functional CXCL9 and CXCL10.
Intracellular cytokine staining was performed on lymphocytes following a short ex vivo stimulation with anti-CD3 and anti-CD28. Each point represents 3-4 mice. The error bars represent standard error.
Lymphocytes from CXCL10-/- mice can serve as cytotoxic lymphocytes and proliferate. To determine whether lymphocytes in the lungs were responsive to M. tuberculosis, we
tested the cells for cytotoxicity and ability to proliferate. Following expansion of CD8
lymphocytes, a cytotoxic T cell lysis assay was performed. The lymphocytes from the lungs of
CXCL10-/- or wild type mice were equally capable of lysing infected macrophage targets with
96

very little nonspecific lysis of uninfected macrophages. In addition the lymphocytes when
stimulated with infected DCs at various ratios, proliferated in the presence of antigen. This
proliferation increased as the ratio of DC: T cells decreased and the probability of interaction
with antigen presenting cells increased. (Figure 27)
Proliferation to Infected DCs
1:25 1:50 1:1000
10
20
30
CXCL10-/-W T
Ratio of DC:Tcells
4w k L ung
0 1 2 3 40
10
20
30
40
50
Un. CXC L10 -/-Un. W T
Inf. C XCL10-/-Inf. W T
Ratio Target:Effector1= 1:6
2= 1:123= 1: 25
Chromium Release Assay
% L
ysis
Stim
ulat
ion
Inde
x
Figure 27. Cytotoxic activity and proliferative ability of T lymphocytes from CXCL10-/- mice.
A. A Cytotoxic Lysis Assay (CTL) was performed on lymphocytes isolated from the lungs at 4 weeks post infection. Targets were either infected or uninfected macrophages. The graph represents the % specific lysis for each of these targets. B. At 4 weeks post infection the ability of the lymphocytes to proliferate in response to antigen was tested in a [3-H] thymidine incorporation assay. The error bar represents 4 mice at each ratio of lymphocyte to antigen presenting cell.
97

8.4 Discussion
The signaling behind migration of cells to the lung and the formation of the granuloma
appears to be a very intricate, complicated system. There has been evidence for the role of
CXCL9 and CXCL10 in migration of T lymphocytes both in vitro and in vivo. The evidence for
their roles in migration of cells to the lungs during an inflammatory response has been less
defined, although in T. gondii infection there is evidence that CXCL10 is required for the
recruitment of CXCR3+ cells to the lung. Our data indicates that CXCL9 and CXCL10 are not
necessary for migration of effector lymphocytes to the lung and for control of M. tuberculosis
infection. The CXCL10-/- mice showed no signs of exacerbated disease. In addition the
CXCL10-/- lymphocytes migrated to the lung and were activated. The T lymphocytes produced
IFNγ, proliferated and had cytolytic potential. Even when both CXCL9 and CXCL10 were
neutralized with antibodies, the mice had a similar pattern of disease as control mice. The
experiment utilizing the monoclonal antibody administration also addressed the migration of
lymphocytes to the lymph nodes, and although there appeared to be early differences in the
numbers of lymphocytes present in the lung draining lymph nodes, the mice controlled infection.
Early migration of T lymphocytes into the lung draining lymph node was affected by
neutralization of CXCL9 and CXCL10, but enough T lymphocytes were primed and activated in
the lymph node to travel to the lung and control infection in this model. The ability of mice to
overcome deficiencies in chemokines and chemokine receptors is not a novel phenomenon. In
CCR2-/- mice, the immune response was more robust than necessary to control infection (see
Section 10.4 Discussion). In this case there were no differences in the numbers of cells in the
lungs, even though there are fewer cells in the lymph nodes. This raises a number of questions.
Where are the cells coming from in the anti-CXCL9/anti-CXCL10 treated mice? In wild type
98

mice, are the excess cells in the lymph nodes migrating to an organ other than the lung? Or is
there more cell death in the wild type lymph nodes or lungs?
We did not test the effectiveness of the administration of the antibodies. This regimen
was effective in the T. gondii model, where the mice were susceptible to infection following
infection with a lymphocytic migration deficiency [155]. Whether redundancy exists in vivo
truly is a difficult question to ask. Another CXCR3 ligand does exist, CXCL11 (I-TAC);
although there was induction of this chemokine following in vitro infection of macrophages, we
have been unable to find reagents to address its function in vivo.
Interestingly the experiments that drove us to study CXCR3 ligands were rooted in the
regulation of chemokine expression by TNF. In the absence of TNF, there is a down regulation
in the expression of CXCL10 and CXCL9 as described in Chapter 1 (Section 7.0). Although
CXCL9 and CXCL10 are not the only chemokines affected by the loss of TNF, the loss of
CXCL9 and CXCL10 did not recapitulate the pathology seen in the absence of TNF.
The role of CXCL10 in the immune response to T. gondii may be very different than the
role of this chemokine in M. tuberculosis response for many reasons. Although both infections
are controlled through a strong cell-mediated immune response, control of T. gondii also was
very dependent on the innate immune response. Infection with T. gondii led to very early (day 3)
detectible induction of CXCL10 in the spleen and liver by RNase protection assay, whereas
during M. tuberculosis infection in mice, induction of CXCL10 was not detected in the lungs
until at least day 9 post infection. In addition, the peak of CXCL10 expression during T. gondii
infection was as early as day 7, on the other hand during M. tuberculosis infection of mice the
expression of CXCL10 reached a plateau between 3-4 weeks. This implies that CXCL10 is
necessary during acute infection of T. gondii- even at a time point where CXCL10 was difficult
99

to detect in M. tuberculosis infection. Another possible explanation for the differences observed
is that M. tuberculosis itself can induce expression of other chemokines, which can signal
lymphocyte migration. This induction could occur through the presence of PAMPs signaling
through toll-like receptors or other pattern recognition molecules. The induction of these
chemokines may override the necessity for IFNγ dependent induction of chemokines such as
CXCL10, as in T. gondii infection. Another difference could purely be due to basic differences
in the model. Replication of the M. tuberculosis bacillus is slower than replication of T. gondii,
therefore initially the antigenic load is not as high and the immune response may have more time
to develop after M. tuberculosis infection.
A recent study demonstrated that CXCR3-/- mice infected with M. tuberculosis exhibited
delayed granuloma formation [72]. Surprisingly, the lymphocyte migration was not affected in
these mice, but anti-CXCL9 Ab treated and PMN depleted mice had similar pathology. In short,
they describe PMNs as a major producer of CXCL9 and important for early granuloma
formation. Despite the differences in pathology, these mice (CXCR3-/-, anti-CXCL9 Ab treated
and PMN depleted mice) are all capable of developing pulmonary granulomas and there were no
differences observed in the survival or mycobacterial burden. On one hand, this study attempts
to argue that early granuloma formation is not necessary for control of infection. Although there
were fewer granulomas and the size of the granulomas was smaller, the granulomas that form in
PMN- depleted or CXCR3-/- mice are organized. We can argue that within these granulomas the
cell mediated immune response is effective in controlling the low dose aerosol infection.
100

9.0 Chapter 3 Enhanced dendritic cell migration and T cell priming in lymph nodes result in increased pulmonary lymphocytic infiltration in chemokine receptor 5 (CCR5)-deficient mice following Mycobacterium tuberculosis infection.
This chapter has been submitted to Journal of Immunology. The chapter in this form is more inclusive that the submitted paper and includes additional data that was not shown in the submitted paper.
9.1 Introduction
In this study, we addressed the role of CCR5 in murine M. tuberculosis infection. M.
tuberculosis infection causes an increase in the expression of β- chemokines, CCL3, CCL4 and
CCL5 and their receptors, including CCR5, in the lungs. CCR5 is a co-receptor for HIV [156],
and as a result, interest has emerged in the role of CCR5 in infectious diseases and as a target for
HIV therapy. CCR5 is expressed on granulocytes, macrophages, immature DCs, CD8+
lymphocytes and at a high level on T helper 1 lymphocytes [157, 158]. Studies in infectious
disease models illustrate the variety of functions of CCR5 in the immune response. In CCR5-/-
mice infected with Leishmania donovani, the boundaries of the granulomas were difficult to
demarcate, yet the mice had fewer parasites than wild type mice [159]. On the other hand,
CCR5-/- mice were more susceptible to influenza A virus, Cryptococcus neoformans, Listeria
monocytogenes, and Toxoplasma gondii [160-163]. CCR5 was associated with elimination of
extracellular polysaccharide during C. neoformans infection [160], induction of IL-12 during T.
gondii infection [161], and trafficking of cells to sites of infection [162, 163]. An understanding
the use of CCR5 by the immune system will benefit the development of anti-microbial drugs and
vaccines.
The data presented here support a role for CCR5 in dendritic cell migration. In this study
we demonstrate that CCR5 transgenic knockout mice were capable of recruiting immune cells to
the lung to form granulomas. CCR5-/- mice controlled M. tuberculosis growth in the lungs,
spleen and liver, but had higher bacterial loads in the lung-draining lymph nodes. Substantially
101

higher numbers of T lymphocytes were found in the lungs of CCR5-/- mice, compared to
controls. Our data are consistent with the hypotheses that higher bacterial loads in the lymph
nodes are due to more dendritic cells carrying M. tuberculosis from the lungs to the lymph nodes
or that there is retention of dendritic cells in the lymph nodes presenting antigen, resulting in
more priming of lymphocytes in the lymph nodes. These primed/ activated lymphocytes then
migrate to the site of infection (the lungs). These results suggest that CCR5 may be important
for the migration to and retention of dendritic cells in lymph nodes during infection.
9.2 Materials and Methods.
Mice.
C57BL/6 female mice (Charles River, Rockland, MA) and CCR5-/- (Cmkbr5) male and female
mice (8-14 weeks old) were used in all experiments. CCR5-/- mice (Jackson Laboratory, Bar
Harbor, ME) were bred at the University of Pittsburgh in specific pathogen-free facilities. All
infected mice were maintained in the BSL3 animal laboratories and routinely monitored for
murine pathogens. The University Institutional Animal Care and Use Committee approved all
animal protocols employed in this study.
Chemical and reagents. All chemicals were purchased from Sigma Chemical Co. (St. Louis,
MO.) unless otherwise noted. Middlebrook 7H9 liquid medium and 7H10 agar were obtained
from Difco Laboratories (Detroit, MI). Antibodies used in flow cytometry were obtained from
Pharmingen (San Diego, CA).
Mycobacteria and infection of mice.
To prepare bacterial stock, M. tuberculosis strain Erdman (Trudeau Institute, Saranac Lake,
N.Y.) was used to infect mice, and then bacteria were harvested from their lungs, expanded in
7H9 liquid medium and stored in aliquots at -80°C. Mice were infected via the aerosol route
102

using a nose-only exposure unit (InTox Products, Albuquerque, N.M.), and exposed to M.
tuberculosis (1 x 10⁷ CFU/ml in the nebulizer chamber) for 20 minutes, followed by 5 minutes of
air. This resulted in reproducible delivery of 50-100 viable CFU of M. tuberculosis, which was
confirmed by CFU determination on the lungs of 2-3 infected mice 1 day post-infection. Mice
were infected i.v. via tail vein with 1x10⁴ CFU in 100 µl PBS/0.05% Tween 80. The tissue
bacillary load was quantified by plating serial dilutions of the lung homogenates in 0.05%
PBS/Tween 80 onto 7H10 agar. Total colony forming units were calculated.
Bone marrow derived macrophages.
Macrophages were derived from the C57BL/6 mice bone marrow based on adherence. The mice
were euthanized and bone marrow was flushed out of the femur and tibia bones with DMEM as
previously described [82]. The bone marrow suspension was washed twice with 2% FBS in PBS
and the cells were counted. 2x10⁶ cells were plated on non-tissue culture treated petri dishes
(Labtek) in 25ml macrophage media (25% L cell supernatant, 20% FBS, 1% L-glutamine, 1%
sodium pyruvate, and 1% nonessential amino acids). After 4 days in culture the cells were fed
with 10 ml fresh macrophage media. On Day 6 macrophages were infected with M. tuberculosis
(MOI 4). Four hours post infection the supernatant was removed, cells were washed and fresh
media added.
DC preparation.
Dendritic cells are derived from the C57Bl/6 mice bone marrow. The bone marrow was obtained
as described as above. After the cells were washed and counted, the cells were resuspended in
two non-tissue culture treated deep dish petri dishes in 20 ml DC media/ plate (10% FBS, 1%
Sodium pyruvate, 1% L-glutamate) overnight. The following day, the nonadherent and semi-
adherent cells were removed from the plates, spun down and cultured at 1x10⁶ cells/ ml in DC
103

media with 20ng/ml of GM-CSF and 20ng/ml of IL-4 (PeproTech Inc., Rocky Hill, NJ) in p75
filter flasks. On day 3 of culture the cells were fed with and additional 5ml DC media and 100ng
of GM-CSF and IL-4. Dendritic cells were infected with M. tuberculosis on day 6 of culture
(MOI 4) as previously described [82].
Flow cytometric analysis of lung cells.
To determine cellular infiltrate in the lung, at 10-day intervals lungs were removed for flow
cytometric analysis. Lungs were subjected to a short period (25 min.) of digestion with 1mg/ml
collagenase A and 25 Units/ml DNAse (Boehringer Mannheim, Mannheim, Germany) at 37°C.
The suspension was then pushed through a cell strainer as previously described [164]. Red blood
cells were lysed with lysis buffer (0.144M NH4Cl/ 0.017Mtris pH= 7.65) and the single cell
suspension was counted. The samples were stained with 0.2 µg anti-CD4, anti-CD8, and anti-
CD69, or 0.15 µg anti-Gr1 and 0.2 µg anti-CD11b in FACS buffer (0.1% NaAzide, 0.1% BSA,
20% mouse serum). Following washes, the cells were fixed in 4% PFA for 1 hour and collected
on a FACSCaliber (Beckon Dickinson). Analysis was performed on Cell Quest software (BD-
Pharmingen, San Diego, CA).
Intracellular Cytokine Staining.
Single cell suspensions of the lung were prepared as described above. The lung cells were then
cultured at 0.5x10⁶ cells/ml in the presence of 2µM monensin and with or without anti-CD3
(0.1µg/ml) and anti-CD28 (1µg/ml) for 4 hours (37°C and 5%CO) in 24 well plates. Following
stimulation, the cells were collected, spun down as stained for T lymphocyte surface markers as
described above, following fixation with 100µl 4% PFA, the cells were transferred to a 96 well
plate, washed 2 times with permeablization buffer (FACS buffer + 0.1% saponin) stained with
anti-IFNγ (2µl neat) for 20 minutes at 4°C, and then washed 2 times with permeablization buffer
104

and once with FACs buffer. The cells were then resuspended in 4% PFA and collected on the
FACS Caliber (Beckon Dickinson).
Histopathology.
Tissue samples for histological studies were fixed in 10% normal buffered formalin followed by
paraffin embedment. For histopathological studies 5- to 6- µm sections were stained with
Harris’ hematoxylin and eosin.
Immunohistochemistry.
5- to 6- µm sections of formalin fixed paraffin embedded lung were stained for CCL5, using
anti-CCL5 (RANTES) antibody (Santa Cruz Biotechnology, Santa Cruz, CA).
Immunohistochemistry was performed as recommended by manufacturer the goat ABC Staining
System (Vector Laborabories, Inc., Burlingame, CA). The slides were deparaffinized and
hydrated using a xylene, EtOH, water gradient. Antigen unmasking was performed with citrate
buffer by microwaving the slides for 5 minutes x2. Following a wash in PBS and blocking with
2% donkey serum, the slides were stained with anti-CCL5 or goat anti-mouse IgG (at 1:50 in 2%
donkey serum) overnight at 4°C. The slides were washed, and the secondary donkey anti-goat
IgG- biotin (1:200) applied for 30 minutes at room temperature. Following additional washes
the sections were incubated with AB enzyme reagent for 30 minutes. Following additional
washes the sections were developed in peroxidase substrate (AEC substrate with 20ml N,N
dimethlyformamide in 0.02M Na Acetate Buffer + 200ul H2O2) for 4 minutes. The sections
were then washed with deionized H2O and counterstained by dipping aqueous hemotoxylin.
After rinsing the sections they were brightened in PBS and air dried. Crystal mount was applied
overnight and then the sections were coverslipped.
105

Apoptosis Staining.
TUNEL staining was performed on formalin fixed paraffin embedded lung sections. The
procedure was followed exactly as described by the ApopTag Manual using the ApopTag
Peroxidase In Situ Apoptosis Detection Kit (Intergen Co, New York).
Apoptosis staining on lung cells was also performed using Annexin V and 7-Amino-actinomycin
D (7-AAD) in conjuction with surface staining for lymphocytic markers. In short, after surface
staining as described above, 1x10⁶ cells were washed in 100µl binding buffer (BD-Pharmingen,
San Diego, CA) resuspended in 50µl of binding buffer and stained with Annexin V and 7-AAD
(3µl each neat) for 15 minutes at room temperature. The cells were then washed with binding
buffer and fixed in a 1:2 solution of 4%PFA:binding buffer. Cells were collected on the FACS
Caliber within 1 hour of staining.
RNase Protection Assay (RPA).
A multiprobe RNase protection assay system (Pharmingen, San Diego, Ca) was used to
determine the levels of mRNA for genes of interest at 10 day intervals post-aerosol infection in
murine lung or infected macrophages in vitro. At the time of harvest, the lungs were snap frozen
in liquid nitrogen and stored at -80°C. Total RNA was extracted using Trizol reagent (Life
Technology, Grand Island, N. Y.) followed by treatment with RNase free-DNase (Roche,
Indianapolis, IN) and RNase Inhibitor (Roche). Macrophage RNA was obtained from bone
marrow derived macrophages by treating ~4 x 10⁶ adherent cells with 1ml Trizol reagent. The
RNA was subjected to RPA according to Pharmingen’s protocol. In short, mRNA from
macrophages or the lungs was hybridized overnight to [32P]-UTP-labeled probes. The protected
106

[32P]-UTP-labeled RNA probes were resolved on a 6% polyacrylamide gel and analyzed by
autoradiography. Cytokine analysis was performed using a custom-made template set specific
for NOS2, IL-4, IL-12p40, TNF, IL-1β, IL-1α, and IFN-γ. Chemokine analysis was performed
using mCK5 multiprobe template set (Pharmingen). The expression of specific genes was
quantified on a densitometer (ImageQuant Software, Molecular Dynamics, Sunnyvale, CA),
relative to the abundance of housekeeping gene, L32. We also performed phosphorimaging
quantification on some samples but found results identical to densitometry; therefore, only
densitometry quantifications are shown.
Real time RT-PCR.
RNA was isolated from the lung using the TRIZOL isolation protocol with slight modifications.
The lung was homogenized in 3ml of TRIZOL reagent and then two chloroform extractions were
performed. Following an isopropanol precipitation, the RNA was washed with 70% ethanol and
treated with RNase Inhibitor (Applied Biosystems, Foster City, CA) for 45 minutes. Following
treatment at 65° C for 15 minutes the RNA was cleaned and DNase digested using the Qiagen
RNA isolation kit, as directed by the manufacturer (Qiagen Inc., Valencia, CA). The RNA was
reverse transcribed using Superscript II enzyme, as directed by the manufacturer (Invitrogen,
Carlsbad, CA). For Real time RT-PCR we used the relative gene expression method [165].
HPRT served as the endogenous control, and uninfected lung or macrophages as the calibrator.
Each primer and probe set was tested for efficiency (results efficient >97% for all primer/probe
sets). All samples were run in triplicate and with “no reverse transcriptase” controls on an ABI
Prism Sequence Detector 7700. Relative gene expression was calculated as 2 ^-∆∆Ct, where
∆Ct = Ct (gene of interest)- Ct (endogenous control) and the ∆∆Ct= ∆Ct (sample) - ∆Ct
(calibrator). Results are expressed as relative gene expression to uninfected samples. The primer
107

and probe concentrations were used as suggested by Applied Biosystems with the final
concentration of each primer at 400nM and probe at 250nM.
ELIspot analysis for IFNγ.
The ELIspot plates (96-well filtration plates Millipore MultiScreen MAIPS4510, Millipore Co.,
Bedford, MA) were pretreated with 95% EtOH and then washed three times with sterile PBS.
The rat anti-IFNγ capture antibody (clone R4-6A2 BD Pharmingen, San Diego, CA) was added
to the wells overnight at a concentration of 10µg/ml. The capture antibody was washed off (all
washes PBS/0.1%Tween 20) and the plate blocked with T cell media containing 20% FBS for 2
hours. Single cell suspensions were prepared from the lung by pushing the lung sections through
a cell strainer (Fisher, Pittsburgh, PA) using the plunger of a 5ml syringe. The cells were treated
with red blood cell lysis buffer, washed twice in 2% fetal bovine serum in PBS and counted.
150,000 cells per well were incubated for 40-48 hours in the presence of 20U/ml IL-2 and either
with media alone, uninfected bone marrow derived dendritic cells, M. tuberculosis infected
dendritic cells (MOI = 3-4), or 10µg/ml Con A. Following the incubation at 37°C in 5% CO2,
the cells were washed off, the biotinylated anti-IFN-γ detection antibody (clone XMG1.2 BD
Pharmingen) added for 2 hours at 37°C at 5µg/ml, followed by more washes and the addition of
streptavidin – peroxidase for 1 hour at room temperature in a humidified chamber (Vectastain
ABC Kit, Vector Laboratories, Burlingame, CA). After additional washing the plate was
developed using the AEC substrate kit as directed by the manufacturer. ELIspot plates were read
on the ImmunospotTM CTL plate reader (Cellular Technology LTD, Cleveland, OH)
Statistical Analysis.
108

3-4 mice per group per time point were used for all studies. Statistical analysis was performed
on the data utilizing GraphPad Prism Software for an unpaired t-test. For bacterial numbers and
cell numbers, log transformation was performed prior to statistical analysis to normalize the data.
9.3 Results.
Expression of CCR5 and its ligands following M. tuberculosis aerosol infection.
CCR5 and its ligands are associated with the migration of Th1 cells and macrophages,
two cell types important in a protective immune response to M. tuberculosis. Infection of bone
marrow derived macrophages with M. tuberculosis induced CCL3, CCL4 and CCL5 expression
(Figure 28A). Next we examined in vivo expression of these chemokines as well as CCR5
following M. tuberculosis infection. RNA from the lungs of C57BL/6 mice infected with M.
tuberculosis via aerosol was isolated and real-time RT-PCR was performed on the RNA (Figure
28B). The expression of all known CCR5 ligands increased within the first two weeks of
infection. CCL4 had the lowest relative expression of the CCR5 ligands. The expression of
CCL5, when compared with other CC- chemokines was very high. Through
immunohistochemical staining for CCL5 on granulomatous lung sections, we observed CCL5
protein expressed locally in both macrophage and lymphocytic areas of the granuloma (Figure
28C). CCR5 mRNA levels also increased in the mice following infection (data not shown).
Whether this is an upregulation of CCR5 or merely a reflection of cells expressing CCR5
migrating into the lungs cannot be determined by this assay, and an appropriate anti-CCR5
antibody for use in flow cytometry is not available.
109
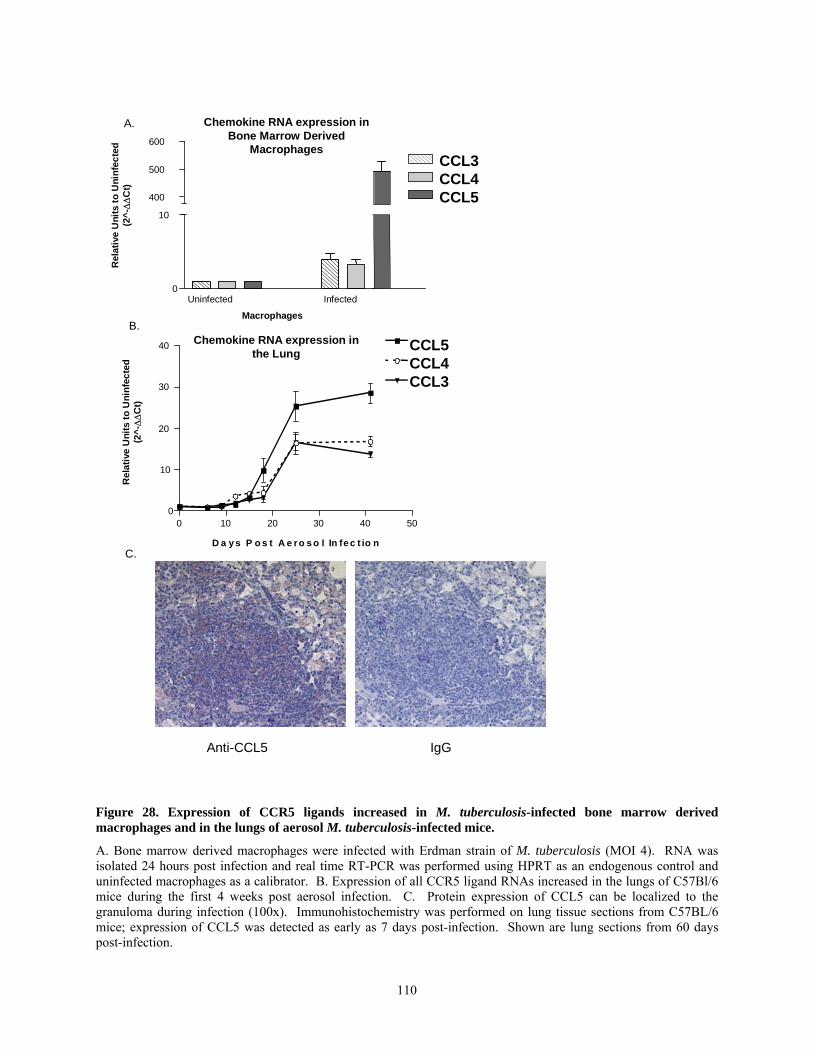
C.
Anti-CCL5 IgG
CCL3CCL4CCL5
A.
Uninfected Infected0
10
400
500
600
Chemokine RNA expression in Bone Marrow Derived
Macrophages
Rel
ativ
e U
nits
to U
ninf
ecte
d (2
^-∆
∆C
t)
Macrophages
Chemokine RNA expression in the Lung
B.
0 10 20 30 40 500
10
20
30
40
D a y s P o s t A e ro s o l In fe c t io n
Rel
ativ
e U
nits
to U
ninf
ecte
d (2
^-∆
∆C
t)
CCL5CCL4CCL3
Figure 28. Expression of CCR5 ligands increased in M. tuberculosis-infected bone marrow derived macrophages and in the lungs of aerosol M. tuberculosis-infected mice.
A. Bone marrow derived macrophages were infected with Erdman strain of M. tuberculosis (MOI 4). RNA was isolated 24 hours post infection and real time RT-PCR was performed using HPRT as an endogenous control and uninfected macrophages as a calibrator. B. Expression of all CCR5 ligand RNAs increased in the lungs of C57Bl/6 mice during the first 4 weeks post aerosol infection. C. Protein expression of CCL5 can be localized to the granuloma during infection (100x). Immunohistochemistry was performed on lung tissue sections from C57BL/6 mice; expression of CCL5 was detected as early as 7 days post-infection. Shown are lung sections from 60 days post-infection.
110

M. tuberculosis infection in CCR5-/- mice.
To determine whether CCR5 plays a role in control of M. tuberculosis infection, C57Bl/6
and CCR5-/- mice were infected via the aerosol route with ~50 colony forming units (CFU).
The survival of CCR5-/- mice was unaffected by M. tuberculosis infection. The mice survived
>180 days, at which point experiments were terminated. There was no difference in bacterial
loads, as determined by CFU, in the lungs (Figure 29A), liver or spleen (Figure 29D and E).
Intravenous infection of CCR5-/- mice with 2x10⁵ CFU delivered via the tail vein, showed
similar results (Figure 29B). In contrast, by 8 weeks post-aerosol infection, there were
significantly higher bacterial loads in the lymph nodes of CCR5-/- mice (Figure 29C).
B.
0 10 20 30 40 50
108
107
106
105
104
103
102
101
Lung CFU
Days Post Intravenous Infection
A.
0 10 20 30 40 50
108
107
106
105
104
103
102
101
Lung CFU
Days Post Aerosol Infection
CCR5-/-CCR5+/+
C.
Weeks Post Aerosol Infection
CFU
/LN
0.0 2.5 5.0 7.5 10.0 12.5102
103
104
105
106
* **
Lymph node CFU
CFU in SpleenAerosol Infection
0 10 20 30 40 50103
104
105
106
Day s Post Infection
CFU in LiverAerosol Infection
0 10 20 30 40 50103
104
105
106
Days Post Infection
E.
D.
Figure 29. CCR5-/- mice control aerosol and intravenous M. tuberculosis infection.
A. Aerosol infection of C57Bl/6 and CCR5-/- mice led to increasing bacillary loads during the first 4 weeks post infection and then the number of colony forming units levels off as infection is controlled. Each point represents 4 mice and similar results were obtained in 3 independent experiments. B. Intravenous infection showed a similar pattern of M. tuberculosis growth in the lungs of the C57Bl/6 and CCR5-/- mice. C. The colony forming units in the lymph nodes of CCR5-/- mice was significantly higher by 7.5 weeks post infection (at week 5 p=0.01, week 8 p=0.03, and at week 10 p=0.008). Each point represents 3-4 mice. Similar results were obtained in 2 independent experiments.
111

Cell migration to the lungs and granuloma formation during M. tuberculosis infection in CCR5-/- mice.
Since CCR5 plays a role in migration of T cells and macrophages, we examined the
cellular infiltrate in the lungs following infection. At predetermined time points, the lungs were
removed, the total number of cells was calculated, and flow cytometric analysis was performed
to determine cell populations. The single cell suspension was stained for T cell markers (CD4,
CD8 and activation marker CD69) and macrophage and neutrophil differentiating markers
(CD11b and Gr1). During initial infection the number of cells in the lungs was not significantly
different between CCR5-/- mice and wild type mice. However, by 6 weeks post infection the
numbers of CD4 and CD8 lymphocytes were significantly higher in CCR5-/- mice (Figure 30A
and B). The number of macrophages and neutrophils increased in the CCR5-/- mice and the
differences were significant at later time points (Figure 30C and D). The increased lymphocytic
infiltrate in CCR5-/- mice was still evident at 6 months post infection (Table 8). The colony
forming units in the lungs were not statistically different at this or any time point between CCR5-
/- and wild type mice (Table 8).
Table 8. Cell migration in chronic infection in CCR5-/- and wild type mice (6 months post-infection).
The increased cellular infiltrate observed in CCR5-/- mice by 2 months post infection was also evident during the chronic stages of infection. CFU remained similar between the two groups of mice. (* p =0.047). For CD8 T cells, p = 0.072.
Cells (x105) Macrophages Neutrophils CD4+ Cells* CD8+ Cells CFU (log)
CCR5-/- 1.12+0.04 1.28+1.44 7.37+1.59 7.97+3.25 6.39+0.25
CCR5+/+ 0.88+0.02 0.49+0.08 4.62+0.68 4.26+0.68 6.13+0.01
The engagement of CCR5, especially by CCL5, plays a role in T lymphocyte activation in some
infection diseases [166]. Therefore the expression of early activation marker, CD69, on the
lymphocytes in the lungs was examined. There was no difference in the expression of the early
112

activation marker on CD4+ lymphocytes until 6 weeks post infection, when the CD4+
lymphocyte numbers were significantly higher in the CCR5-/- mice, 1.2x10⁶+0.08x10⁶ v.
0.57x10⁶+0.05x10⁶, but the percentage of CD69+ lymphocytes was continuously similar. On the
other hand there was a significantly greater percentage of CD8+ lymphocytes expressing CD69
present in the lungs of the CCR5-/- mice compared to WT mice (58+2.8% vs. 41+0.5%,
p=0.004).
CCR5+/+CCR5-/-
CCR5-/-CCR5+/+
A.
Tota
l # c
ells
/ lu
ng (
x10
6 )
CD4+ Lymphocytes
0 10 20 30 40 500.0
0.5
1.0
1.5
2.0
**p=0.004
Days Post Infection
Tota
l # c
ells
/ lu
ng (
x10
6 )
B.CD8+ Lymphocytes
Days Post Infection0 10 20 30 40 50
0.0
0.5
1.0
1.5
2.0
*p=0.01
N e ut ro p h ils
0 10 20 30 40 500.0
5.0
1.0
1.5
DD 40 p=0.02
30 p=0.07
Day s Post Infection
*
Tota
l # c
ells
/ lu
ng (
x10
6 )
M a c ro p ha ge s
0 10 20 30 40 500.0
0.5
1.0
1.5
2.0
Day s Post Infection
Tota
l # c
ells
/ lu
ng (
x10
6 )
C.
D.
Figure 30. Infection of CCR5-/- mice led to greater numbers of lymphocytes in the lungs compared to wild type mice.
Flow cytometric analysis was performed on single cell suspensions from the lungs. The total number of CD4+ (A) and CD8 (B) lymphocytes increased to a significantly higher number in the CCR5-/- mice compared to wild type mice (**p=0.004, *p=0.01). Each point represents 3-4 mice. Similar results were obtained in three independent experiments and with intravenous infection.
113

Histology.
Histological analysis of the lung revealed that organized granulomas did form in CCR5-/-
mice. These granulomas were similar to wild type mice granulomas at early time points. By 5
weeks post infection, the increased lymphocytic infiltrate in the lungs of CCR5-/- mice compared
to lungs of wild type mice demonstrated by flow cytometry was evident in the histologic sections
(Figure 31). The increased lymphocytic infiltrate is even more evident at 10 weeks post
infection (Figure 31).
114

2 W
ks5
Wks
10 W
ks
Figure 31. CCR5-/- mice formed granulomas with greater lymphocytic infiltrate.
Sections of the lung were stained with hemotoxylin and eosin (100x). Early after infection (2 weeks post infection), CCR5-/- mice and C57Bl/6 mice had similar cellular infiltrate in the lungs, but by 5 weeks post infection the greater lymphocytic infiltrate in the lung was apparent in the CCR5-/- tissue sections and granulomas.
Chemokine expression in CCR5-/- mice.
The results above indicated that CCR5-/- mice had no deficiency in cell migration to the
lung, but rather have more cells migrating to the lung in response to infection. To address
115

potential compensatory mechanisms that could account for increased cell migration in the
absence of CCR5, we looked for increased expression of CCR5 ligands and their alternative
receptors, CCR1 and CCR3. Real time RT-PCR was used to determine whether there was
increased expression of CCL3, CCL4, or CCL5 in the lungs of CCR5-/- mice (Figure 33).
There was significantly greater CCL3 expression in CCR5-/- mice by day 41 post aerosol
infection (p=0.03); although there was a trend toward greater expression of other inflammatory
chemokines, such as CXCL10 and CCL2, these differences were not significant. Through
RNase protection assays on lung RNA, no differences in the expression of CCR1 and no
expression of CCR3 was detected in the CCR5-/- or C57Bl/6 mice (Figure 32).
CCR1
9.0 21.0 32.0 41.00.00
0.25
0.50
0.75CCR5-/-CCR5+/+
Days Post Infection
Rel
ativ
e U
nits
Figure 32. CCR1 mRNA expression in the lungs of M. tuberculosis infected, wild type and CCR5-/- mice.
RNase protection assay was used to determine the expression of CCR1 in the lungs of aerosol infected mice. Expression is measured relative to L32. There were no significant differences in the level of expression.
116

Day 25
CCR5-/- WT0
50
100
150CCL3CCL4CCL5CXCL10CCL12CCL2
Mouse Background
Rel
ativ
e U
nits
Day 41
CCR5-/- WT0
50
100
150CCL3CCL4CCL5
CCL3 *p=0.04
CXCL10CCL12CCL2
*
Mouse Background
Rel
ativ
e U
nits
Figure 33. CCR5-/- mice had altered chemokine expression late in infection.
Real time rt PCR was performed on RNA isolated from the lungs of CCR5-/- and wild type mice. The relative units represented here are relative to uninfected wild type lung expression of these genes. There was a trend toward greater expression of chemokines in the CCR5-/- mice but only the difference in expression of CCL3 was significantly different. This could be a reason for increased cellular infiltrate to the lungs, but it could also be a result of a greater number of cells in the lungs.
117
Cytokine expression.
Control of M. tuberculosis infection depends on the activation of macrophages by IFNγ
and TNF, leading to the induction of inducible nitric oxide synthase (NOS2) and production of
reactive nitrogen intermediates, such as nitric oxide. To determine whether these components of
the immune response were affected by CCR5 deficiency, RNase protection assay was performed
on total lung RNA (Figure 34A). Early after infection the expression of TNF, IFNγ and NOS2
was similar in CCR5-/- and wild type mice, but by day 36 the CCR5-/- mice had higher
expression of many inflammatory cytokines. There were significant differences in expression of
NOS2 and TNF at day 36, but variability at day 45 resulted in differences that did not reach
statistical significance. Relative units in the RNase protection assay is standardized to L32, a
housekeeping gene, therefore the expression is relative on a per cell basis. Even though there
were not significant differences per cell at later time points, since there were significantly more
lymphocytes in the CCR5-/- mice, there was clearly higher expression of lymphocytic genes,
such as IFNγ and TNF overall. The IFNγ gene expression differences were verified by
intracellular cytokine staining (Figure 34B), and through these studies it is evident that the
increased expression of IFNγ was due to an increase in the percentage of CD8+IFNγ+
lymphocytes in the lungs of CCR5-/- mice.
118

IF N -γ
0 10 20 30 4 0 5 00
1
2
3
4
Days Post Infection
IL -1 2
0 10 20 30 40 500.0
0.5
1.0
1.5
2.0
Days Post Infection
*
A . B .
N O S 2
0 10 20 30 40 500
5
10
15
20
* *
D ay s Po s t In fect io n
Rel
ativ
e U
nits
to L
32
0 10 2 0 3 0 400.0
2.5
5.0
7.5
1 0.0
D a y s P o s t In fe c tio n
% in
lym
phoc
yte
gate
C D 4 + IF N γ +
0 10 20 30 400.0
2.5
5.0
7.5
1 0.0
D a y s P o s t In fec tio n
% in
lym
phoc
yte
gate
C D 8 + IF N γ +
Rel
ativ
e U
nits
to L
32R
elat
ive
Uni
ts to
L32
C C R 5 -/-C C R 5 + /+
**
Figure 34. T helper 1 inflammatory cytokines increased to significantly higher levels in CCR5-/- mice compared to C57Bl/6 mice.
A. RNase protection assay was performed on whole lung RNA from CCR5-/- and wild type mice at predetermined time points. Expression of IFNγ, NOS2 and IL-12 is shown relative to L32 housekeeping gene. Each point represents 3-4 mice. Similar results were obtained in 2 independent experiments. *p<0.05. B. Intracellular cytokine staining for IFNγ using anti-CD3/anti-CD28 as non-specific stimulus revealed that a similar percentage of CD4+IFNγ + cells were present in the lungs, while there were a greater percentage of CD8+IFNγ + cells in the CCR5-/- mice, compared to wild type mice. **p<0.01
Immune regulation in CCR5-/- mice.
There were a number of possible explanations for the higher numbers of lymphocytes in
the lungs of CCR5-/- mice in response to M. tuberculosis infection. We hypothesized that there
was less apoptosis in the CCR5-/- mice, therefore the cells were accumulating in the lungs
instead of undergoing normal turnover. Using both TUNEL staining for apoptotic bodies and
flow cytometric analysis for 7-AAD and Annexin V, there was no difference in the percentage of
apoptotic cells between the CCR5-/- mice and wild type mice (data not shown), but due to the
119

increase in lymphocytes present in the lungs, there were actually significantly more apoptotic
lymphocytes in the CCR5-/- mice (Figure 35).
CCR5-/- CCR5+/+
5 w
eeks
pos
t inf
ectio
n
A.
B.
C.
Apoptotic-CD8
0.0 2.5 5.0 7.5 10.0 12.50.0x10-00
2.5x1005
5.0x1005
7.5x1005
1.0x1006
CCR5-/-CCR5+/+
Weeks Post Infection
Tota
l # C
D8+
7AAD
+Ann
exin
V+
Apoptotic-CD4
0.0 2.5 5.0 7.5 10.0 12.50.0x10-00
2.5x1005
5.0x1005
7.5x1005
CCR5-/-CCR5+/+
Weeks Post Infection
Tota
l # C
D4+
7AAD
+Ann
exin
V+
Figure 35. CCR5-/- mice did not have a decrease in apoptosis.
A. and B. Through FACS, the number of apoptotic lymphocytes was actually higher in the CCR5-/- mice. Therefore, the increase in cellular infiltrate in the CCR5-/- mice was not due to lack of apoptosis. C. Through TUNEL staining of sections of lung, it was evident that the CCR5-/- mice have similar levels of apoptotic cells present.
We also hypothesized that CCR5 was required to recruit regulatory T lymphocytes to the
lungs during M. tuberculosis infection in mice, and that this absence could interfere with normal
immune regulation in the lungs. Using CD4+ CD25+CD45RBlo as markers for a regulatory T
120

cell population [167], flow cytometric analysis of lung cells demonstrated that significantly
greater numbers of these cells infiltrated the CCR5-/- mice by 6 weeks post infection, indicating
that CCR5 was not required for their recruitment to the lung (Figure 36).
CCR5-/-CCR5+/+
Regulatory T cellsLung
0.0 2.5 5.0 7.5 10.0 12.50.0x10-00
1.0x1005
2.0x1005
3.0x1005
4.0x1005
5.0x1005
Weeks Post Infection
***
Tota
l # C
D4+
CD
45R
BloC
D25
+
Regulatory T cellsLymph node
0.0 2.5 5.0 7.5 10.0 12.50.0x10-00
1.0x1006
2.0x1006
3.0x1006
Weeks Post Infection
**
Tota
l # C
D4+
CD
45R
BloC
D25
+
Figure 36. CCR5-/- mice do not have fewer CD4+CD45RBloCD25+ cells than wild type mice, but rather have significantly more cells of this phenotype.
This analysis was done using flow cytometric analysis on single cell suspensions from the lungs and lymph nodes of aerosol M. tuberculosis infected mice. Each time point represents 4 mice. ***p<0.005 **p<0.001.
Priming in the lymph nodes.
The lung-draining lymph nodes of CCR5-/- mice contained more M. tuberculosis bacilli
than C57Bl/6 mice (Figure 29C). We hypothesized that this was due to greater numbers of
dendritic cells migrating from the lungs to the lymph nodes carrying M. tuberculosis. As a result
more T lymphocytes were being primed in the lymph node and then migrating to the lungs. To
121

explore this hypothesis, flow cytometric analysis was performed on the mediastinal lymph nodes
of CCR5-/- mice following M. tuberculosis infection.
The overall total cell numbers of the lymph nodes of CCR5-/- and C57Bl/6 mice were
similar, but at 5 weeks post infection there were statistically significant differences in the number
of dendritic cells (defined as CD11c+CD11bhi (or lo) B7.2+ cells) in the CCR5-/- mice (Figure
37A). ELIspot analysis confirmed that significantly more lymphocytes from lymph nodes of
CCR5-/- mice were primed to produce IFNγ when stimulated by either ConA or M. tuberculosis-
infected dendritic cells (Figure 37B).
122

E li s p o t 1 0 w e e k s - L N
0
1 0 0
2 0 0
3 0 0
C C R5 - / -
C C R 5 + /+
* *
S t im u la t io n
# IF
Ng p
rodu
cing
cel
ls /
150,
000
lym
ph n
ode
cells
Med
ia a
lone
Uninf
ecte
d DC
Infe
cted
DC
Con A
B .
0.0 2.5 5.0 7 .5 10.0 12.50.0
0.5
1.0
1.5
2.0
W e e k s P o s t In fe c t io n
Tota
l # c
ells
( C
D11
c+
CD
11b
lo
B7.
2+) (
x10
4 )
*
D e n d ritic C e l ls L N
A .
0.0 2.5 5.0 7.5 10.0 12.50.0
2.5
5.0
7.5
1 0
W e e k s P o s t In fe c t io n
Tota
l # c
ells
( C
D11
c+
CD
11b
hi
B7.
2+) (
x10
4 )
* *
D e n d rit ic C e lls L N
C C R 5 -/-C C R 5 + /+
Figure 37. CCR5-/- mice had more dendritic cells and more primed lymphocytes within the lung draining lymph nodes.
The number of DCs was determined by flow cytometric analysis. A. There were significantly more CD11c+CD11bhi (or lo) B7.2+ cells in the lymph nodes of CCR5-/- mice at 5 weeks post infection (CD11bhi **p=0.003, CD11blo *p=0.01). B. ELIspot analysis for IFNγ was performed on single cells suspensions from the lymph nodes. By 10 weeks post infection, the number of IFNγ producing cells in the lymph nodes was significantly greater when the cells were simulated with M. tuberculosis infected DCs (*p=0.013) or ConA (*p=0.011). Each bar represents 4 mice.
Intravenous infection.
In CCR2-/- mice, the requirement for CCR2 in control of M. tuberculosis infection was
dose dependent. These mice were unable to control M. tuberculosis when it is administered at a
standard dose of 2.5x10⁵ CFU delivered intravenously, but could control lower dose aerosol or
123

i.v. infection [63]. We investigated whether the ability of CCR5-/- mice to control infection was
route or dose dependent. CCR5-/- mice infected i.v. (2 x 10⁵ CFU/mouse) controlled M.
tuberculosis growth and the cell migration pattern were similar to that of CCR5-/- mice infected
via the aerosol route (data not shown). The CCR5-/- mice again had strikingly high cell
infiltration to their lungs, but with no apparent long-term detrimental effects of this increased
infiltration.
9.4 Discussion.
CCR5 is expressed on many immune cells that are present in the lung following M.
tuberculosis aerosol infection in mice, and the ligands for this receptor are induced in the lung by
this infection. Whether the CCR5 is required for the migration of these cells to the lungs and
subsequent control of infection was unknown. The results of this study provide evidence that
CCR5 is not required for migration of immune cells to the lungs during M. tuberculosis
infection, but may influence the retention of DCs in the lungs and migration to the lymph nodes.
CCR5-/- mice had more bacilli in the lung-draining lymph nodes, as well as more dendritic cells.
This coincided with enhanced priming of M. tuberculosis-specific T cells in the lymph nodes.
Such increased priming likely accounts for the substantially increased numbers of T lymphocytes
migrating to the lungs of CCR5-/- mice following M. tuberculosis infection.
Although CCR5 is known to be present on many immune cells, CCR5 function may be
compensated for by other chemokine receptors and chemokines expressed in the lungs during
infection. Although CCL4 and CCL5 can also signal through CCR1, the immune cells express
many other chemokine receptors that may be responsible for the migration of these cells to the
lung. These include CXCR3, CCR2, CCR1 and CXCR2. There is no reported increase in
susceptibility to tuberculosis in humans carrying a deletion in the CCR5 gene (CCR5delta32).
124
The finding that CCR5-/- mice had more inflammation in their lungs was intriguing and
unexpected. Recent data in other systems support an immunoregulatory role for CCR5. CCR5-/-
mice had enhanced delayed-type hypersensitivity and humoral responses to T cell- dependent
antigenic challenge [162]. When infected with influenza A virus, CCR5-/- mice had a
hyperinflammatory response resulting in increased pulmonary inflammation and a decrease in
survival [163]. In a murine model of colitis utilizing dextran sodium sulfate, CCR5 deficient
mice had increased infiltration of CD4+ and NK1.1+ lymphocytes, along with a decrease in Th1
and an increase in Th2 cytokine expression [168].
We explored several possibilities for the increased numbers of lymphocytes in the lungs
of the M. tuberculosis-infected CCR5-/- mice. There was increased expression of other
chemokines (such as MIP1α) in the lungs of the CCR5-/- mice compared to wild type. Such
increased expression/circulation of chemokines signaling through receptors other than CCR5 in
the lungs could have resulted in the influx of immune cells. However, the increased expression
may also have been a reaction to the numbers of cells in the lungs.
An alternative hypothesis was that there was less turnover of cells in the lungs of CCR5-
/- mice. Recent studies have suggested that CCR5 signaling induces apoptosis in some
situations. The HIV protein, Env, can activate CCR5 to induce the Fas and caspase-8 pathway
resulting in CD4+ cell death [169]. However, in our studies there were equal or greater numbers
of apoptotic cells in the CCR5-/- mice detected by two different methods, discounting this
hypothesis in our system.
We also assessed whether CCR5 was important for migration of regulatory T
lymphocytes to the lungs and the down regulation of Th1 responses, which could account for the
observed increased inflammation in the absence of CCR5. Using the best markers known for
125

regulatory T cells [167] there were actually significantly more cells of this phenotype in the
lungs of CCR5-/- mice. Therefore, CCR5 does not appear to be playing a role in regulatory T
cell migration, but rather the increased migration may be a response to the increased
inflammation, or simply related to the overall increase in cell numbers in the lungs of these mice.
A final hypothesis was that CCR5 is required for normal dendritic cell migration. We
observed greater bacterial numbers in the mediastinal lymph nodes of CCR5-/- mice. Dendritic
cells infected in the lungs are likely migrating and carrying M. tuberculosis bacilli to the lymph
nodes. Previous studies demonstrated that infection of dendritic cells with M. tuberculosis
matures the cells [26, 82, 170, 171], and mature dendritic cells migrate to the lymph nodes [172-
174] where they prime naive T cells. At 5 weeks post infection there were more dendritic cells in
the lymph nodes of CCR5-/- mice. The increased antigen dose (i.e. bacterial numbers) in
conjunction with increased numbers of dendritic cells within the lymph nodes likely leads to
enhanced priming of lymphocytes, as seen in the ELIspot assays. More primed T lymphocytes
then are available to migrate to the site of infection in the lungs, resulting in the higher T
lymphocyte numbers observed in the CCR5-/- mice.
Upon maturation, dendritic cells are believed to down regulate expression of CCR5 and
CCR6 while they upregulate other receptors such as CXCR4 and CCR7, targeting these cells to
the lymph nodes [reviewed in [175]]. We observed increased numbers of dendritic cells in the
lymph nodes following infection in CCR5-/- mice, suggesting that during M. tuberculosis
infection the expression of β-chemokines such as CCL3, CCL4 and CCL5 may normally retain
CCR5+ dendritic cells in the lungs or recruit the dendritic cells out of the lymph nodes to the
lungs. The absence of CCR5 apparently results in either increased migration from the lungs to
the lymph nodes, or retention of dendritic cells in the lymph nodes.
126

This study further supports our previous finding that although there may not be striking
differences in bacterial loads in the lungs of some transgenic mouse models, these models are
very useful for studying the immune response [63, 176]. Addressing the function of molecules
in the immune response requires careful experimental design and execution, and interpretation of
experimental results. Roles may exist for molecules in the immune response even if the mouse is
controlling infection at the level of bacterial burden. The immune response in the C57BL/6
mice, although not sufficient to eliminate bacterial numbers in the lungs, does control the
infection. In this study, as well as other models (IL-10-/-, for example, H.M.S., J. Chan, and
J.L.F, unpublished data), enhancing the Type 1 T cell response or the ability of T lymphocytes to
enter the lungs over the wild type level, does not have an obvious beneficial effect on control of
the infection. These data indicate that there are additional factors that must be induced or
enhanced for increasing the ability of the host to eliminate M. tuberculosis infection.
In summary, our study supports a role for CCR5 in controlling dendritic cell migration to
the lymph nodes, possibly by maintaining these cells in infected lungs. Thus, the absence of
CCR5 resulted in increased numbers of both dendritic cells and M. tuberculosis bacilli in lymph
nodes; we assume that the bacteria were carried from the lungs in dendritic cells. The result of
the increased numbers of dendritic cells and antigens was enhanced T lymphocyte priming,
leading to increased inflammation in the lungs.
127

10.0 Chapter 4 Mycobacterium tuberculosis in chemokine receptor 2 (CCR2) deficient mice: the influence of dose on disease progression.
This chapter has been modified from the published paper Scott, et. al. [63]. Copyright permission is on file.
10.1 Introduction
As described in the introduction to the thesis, the hallmark of Mycobacterium tuberculosis
infection is granuloma formation. Following infection of alveolar and resident macrophages or
dendritic cells in the lungs, monocytes and mycobacteria-specific lymphocytes migrate from the
blood to the lungs and form granulomas. Within the localized environment of the granuloma, the
immune cells control the bacterial replication and limit the spread of infection within the lung
and to other organs. In M. tuberculosis-infected hosts, CD4+ and CD8+ T lymphocytes produce
IFN-γ and TNF, cytokines which aid in control of infection and macrophage activation [64, 98,
103, 177]. Activated macrophages also produce TNF and reactive oxygen and nitrogen
intermediates, which have anti-mycobacterial properties [177, 178]. Identifying factors involved
in migration of cells to the lungs and granuloma formation is a key to understanding the immune
response to M. tuberculosis.
There have been studies on the contribution of various chemokines to granuloma
formation. Using “bead” instillation (PPD or schistosomal egg antigen beads) or injection of
schistosomal eggs to induce granulomas in lungs of mice, roles for CCR1 and CCR2, as well as
CCL5 and CCL2 in granuloma formation were demonstrated [179-182]. CCR2 is present on
monocytes, macrophages and dendritic cells, as well as activated T cells. This chemokine
receptor is a logical candidate for monocyte/macrophage recruitment to the lungs because
macrophages and monocytes are chemotactic towards CCR2 ligands, macrophage chemotactic
protein CCL2, CCL7 (MCP-3) and CCL12 (MCP-5). Studies in CCR2-/- mice have indicated
that this receptor plays a major role in mediating monocyte/macrophage recruitment in response
128
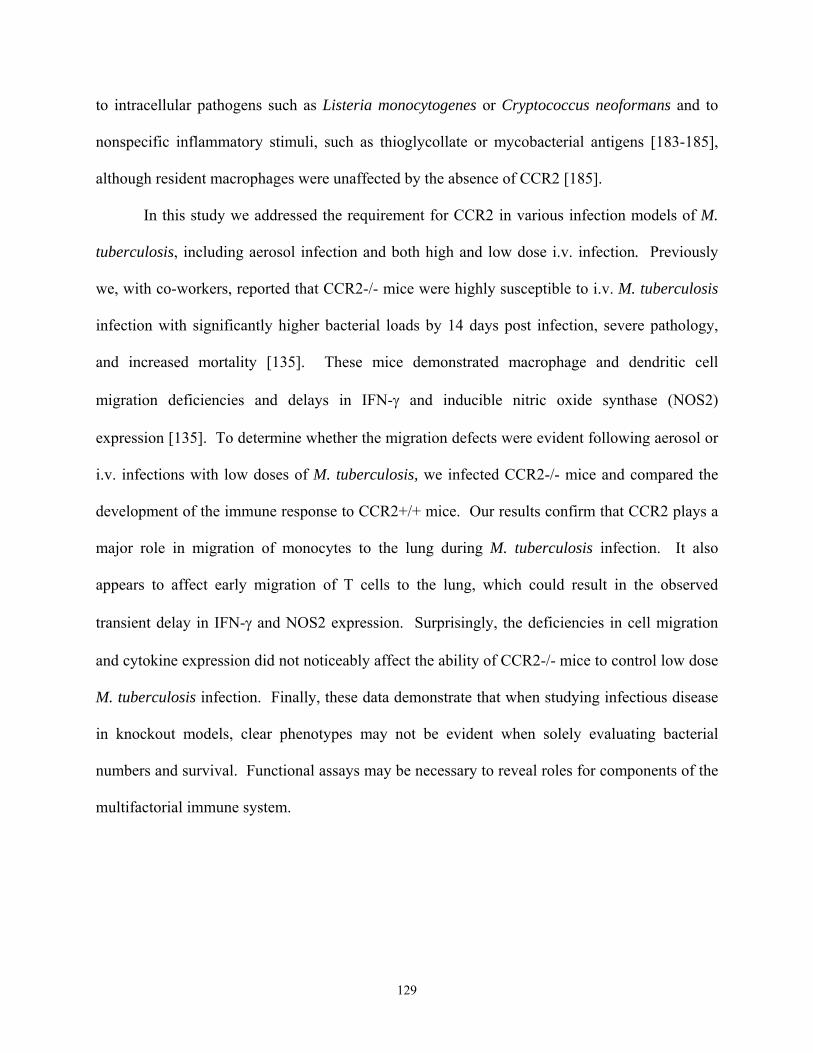
to intracellular pathogens such as Listeria monocytogenes or Cryptococcus neoformans and to
nonspecific inflammatory stimuli, such as thioglycollate or mycobacterial antigens [183-185],
although resident macrophages were unaffected by the absence of CCR2 [185].
In this study we addressed the requirement for CCR2 in various infection models of M.
tuberculosis, including aerosol infection and both high and low dose i.v. infection. Previously
we, with co-workers, reported that CCR2-/- mice were highly susceptible to i.v. M. tuberculosis
infection with significantly higher bacterial loads by 14 days post infection, severe pathology,
and increased mortality [135]. These mice demonstrated macrophage and dendritic cell
migration deficiencies and delays in IFN-γ and inducible nitric oxide synthase (NOS2)
expression [135]. To determine whether the migration defects were evident following aerosol or
i.v. infections with low doses of M. tuberculosis, we infected CCR2-/- mice and compared the
development of the immune response to CCR2+/+ mice. Our results confirm that CCR2 plays a
major role in migration of monocytes to the lung during M. tuberculosis infection. It also
appears to affect early migration of T cells to the lung, which could result in the observed
transient delay in IFN-γ and NOS2 expression. Surprisingly, the deficiencies in cell migration
and cytokine expression did not noticeably affect the ability of CCR2-/- mice to control low dose
M. tuberculosis infection. Finally, these data demonstrate that when studying infectious disease
in knockout models, clear phenotypes may not be evident when solely evaluating bacterial
numbers and survival. Functional assays may be necessary to reveal roles for components of the
multifactorial immune system.
129

10.2 Methods and Materials
Mice.
C57BL/6 female mice (Charles River, Rockland, Mass.) and CCR2-/- [184] (8-14 weeks old)
were used in all experiments. CCR2 +/- or -/- mice (heterozygous breeding pair provided by Dr.
I. Charo, University of California, San Francisco) were bred and genotyped by PCR on tail DNA
and maintained under specific pathogen-free conditions at the University of Pittsburgh
Biotechnology Center. Only CCR2-/- mice were used. Mice were transferred to the Biomedical
Science Tower Biosafety Level 3 animal facility at 7-8 weeks of age. All infected mice were
maintained in the BSL3 animal laboratories and routinely monitored for murine pathogens by
means of serological and histological examinations. The University Institutional Animal Care
and Use Committee approved all animal protocols employed in this study.
Chemical and reagents.
All chemicals were purchased from Sigma Chemical Co. (St. Louis, MO.) unless otherwise
noted. Middlebrook 7H9 liquid medium and 7H10 agar were obtained from Difco Laboratories
(Detroit, MI). Antibodies used in flow cytometric analyses were obtained from Pharmingen (San
Diego, CA). Pyrazinamide was purchased from Acros.
Mycobacteria and infection of mice.
To prepare bacterial stock, M. tuberculosis strain Erdman (Trudeau Institute, Saranac Lake,
N.Y.) or H37Rv (Dr. John Belisle, Colorado State University, Fort Collins, Colorado) was used
to infect mice, and then bacteria were harvested from their lungs, expanded in 7H9 liquid
medium and stored in aliquots at -80°C. Mice were infected via the aerosol route using a nose-
only exposure unit, as described in [94], which was confirmed by CFU determination on the
lungs of 2-3 infected mice 1 day post-infection. High dose aerosol infection using 2x10⁸ or
130

1x10⁸ CFU in the nebulizer resulted in delivery of 1500 or 4000 viable CFU, respectively, of
H37Rv M. tuberculosis in two different experiments, and was confirmed by day 1 CFU in the
lungs. Mice were infected i.v. via tail vein with either 1x10⁴ (low dose) or 2x10⁵ (high dose)
CFU in 100 µl PBS/0.05% Tween 80. The tissue bacillary load was quantified by plating serial
dilutions of the lung, liver, and spleen homogenates onto 7H10 agar as described previously [64].
Bone marrow derived macrophages.
Macrophages were derived from C57Bl/6 bone marrow based on adherence. The mice were
euthanized and their bone marrow was flushed out of the femur and tibia bones with DMEM as
previously described [82]. The bone marrow suspension was then washed twice with 2% FBS in
PBS and the cells were counted. 2x10⁶ cells were plated on non-tissue culture treated petri
dishes (Labtek) in 25ml macrophage media (25% L cell supernatant, 20% FBS, 1% L-glutamine,
1% sodium pyruvate, and 1% nonessential amino acids). After 4 days in culture the cells were
fed with 10 ml fresh macrophage media. On Day 6 macrophages were infected with M.
tuberculosis at an MOI of 4. Four hours post infection the supernatant was removed, cells were
washed and fresh media was added.
Flow cytometric analysis of lung cells.
To determine cellular infiltrate in the lung, at 10-day intervals lungs were removed for flow
cytometric analysis. Lungs were subjected to a short period (25 min.) of digestion with 1mg/ml
collagenase A and 25 Units/ml DNAse (both from Boehringer Mannheim, Mannheim, Germany)
at 37°C. The suspension was then pushed through a cell strainer as previously described [164].
Red blood cells were lysed with red blood cell lysis buffer (NH4Cl/Tris Solution) and the single
cell suspension was counted. The samples were stained with 0.2 µg anti-CD4, anti-CD8, anti-
CD69, or 0.15 µg anti-Gr1 and 0.2 µg anti-CD11b in FACS buffer (0.1% NaAzide, 0.1% BSA,
131

20% mouse serum). Following washes, the cells were fixed in 4% PFA for 1 hour and collected
on a FACSCaliber (Beckon Dickinson). Analysis was performed on Cell Quest software (BD-
Pharmingen, San Diego, CA).
Histopathology.
Tissue samples for histological studies were fixed in 10% normal buffered formalin followed by
paraffin embedment. For histopathological studies 5- to 6- µm sections were stained with
Harris’ hematoxylin and eosin.
RNase Protection Assay (RPA).
A multiprobe RNase protection assay system (Pharmingen, San Diego, CA) was used to
determine the levels of mRNA for genes of interest at 10-day intervals post-aerosol infection in
murine lung or infected macrophages in vitro. At the time of harvest, the lungs were snap frozen
in liquid nitrogen and stored at -80°C. Total RNA was extracted using Trizol reagent (Life
Technology, Grand Island, N. Y.) followed by treatment with RNase free-DNase (Roche,
Indianapolis, IN) and RNase Inhibitor (Roche). Macrophage RNA was obtained from bone
marrow derived macrophages by treating ~4 x 10⁶ adherent cells with 1ml Trizol reagent. The
RNA was subjected to RPA according to Pharmingen’s protocol. In short, mRNA from
macrophages or the lungs was hybridized overnight to [32P]-UTP-labeled probes. The protected
[32P]-UTP-labeled RNA probes were resolved on a 6% polyacrylamide gel and analyzed by
autoradiography. Cytokine analysis was performed using a custom-made template set specific
for NOS2, IL-4, IL-12p40, TNF, IL-1β, IL-1α, and IFN-γ. Chemokine analysis was performed
using either a custom-template set specific for CCL2, CCL7, CCL12, CCR2, CCL19 (MIP-3β)
and CXCL10 (Pharmingen, provided by Joel Ernst, UCSF) or mCK5 multiprobe template set
(Pharmingen). The expression of specific genes was quantified on a densitometer (ImageQuant
132

Software, Molecular Dynamics, Sunnyvale, CA), relative to the abundance of housekeeping
gene, L32. We also performed phosphorimaging quantification on some samples but found
results identical to densitometry; therefore, only densitometry quantifications are shown.
Statistical Analysis.
3-4 mice per group per time point were used for all studies. Statistical analysis was performed
on the data utilizing Prism Software for an unpaired t-test. For bacterial numbers and cell
numbers, log transformation was performed prior to statistical analysis.
10.3 Results
Expression of CCR2 ligands, CCL2, CCL7 and CCL12, increases following infection.
To determine whether expression of CCR2 ligands was enhanced following M.
tuberculosis infection, RNase protection assays were performed on infected bone marrow
derived macrophages and the lungs of infected C57Bl/6 mice. The expression of three major
CCR2 ligands and CCR2 increased upon in vitro infection of macrophages (Figure 38A). There
was also enhanced expression of genes for CCL3, CCL4 (MIP-1β), CCL5, CXCL2, and
CXCL10 in macrophages (data not shown). In the lungs, expression of the macrophage
chemotactic proteins (CCL2, 7, 12) increased following aerosol M. tuberculosis infection (Figure
38B). The pattern of expression was similar to that of a number of other chemokines following
infection in the lung, including CCL3, CCL4, CCL5, and CXCL10 (as described in previous
chapters).
133

CCL12 CCL7 CCL2 CCR20.00
0.25
0.50
0.75UninfectedInfected
Macrophage Gene Expression
A.
CCR2 Ligand Expression
0 5 10 15 20 250.00
0.25
0.50
0.75
CCL2
CCL12CCL7
Days post infection
B.
Figure 38. Expression of CCR2 ligands, CCL2, CCL7 and CCL12 increases following M. tuberculosis infection.
RNase protection assay on mRNA isolated from bone marrow derived macrophages (A) or C57Bl/6 mice (B) reveals enhanced expression of CCL2, CCL7 and CCL12 following M. tuberculosis infection. Representative samples from the lung RNase protection assay are shown (C).
CCR2-/- mice control low dose infection with M. tuberculosis. Mice were infected via the aerosol route (~50 CFU) with M. tuberculosis, and sacrificed
to determine bacillary burdens in the lung, liver and spleen at various time points post-infection
(Figure 39A). The bacterial numbers in the lungs of CCR2-/- and wild type mice were not
significantly different at any time post infection. There was no significant difference in bacterial
dissemination to the spleen or liver between the mouse strains, although the initial growth of M.
tuberculosis in the spleens of CCR2-/- was impaired compared to wild type mice (p=0.0019).
However, at late time points (70 days) there were ~10-fold more CFU in the CCR2-/- spleens
compared to wild type. No differences in the bacterial growth in the liver were observed (data
134

not shown). No CCR2-/- mice succumbed to the aerosol infection during the course of the
experiment; mice were maintained up to 5 months. At 5 months post infection the CCR2-/- mice
had similar bacterial loads in the lungs (data not shown). The low dose aerosol infections were
performed using M. tuberculosis strains H37Rv (twice) and Erdman (twice) with similar results.
These results were in sharp contrast to the published results on CCR2-/- mice infected i.v.
with 4-10 x105 CFU [135], where a majority of mice did not survive beyond 23 days. We
repeated these studies with our standard i.v. dose of 2 x 10⁵ CFU using strain H37Rv. This dose
does not cause mortality in C57BL/6 mice in our hands. As reported previously [62], the CCR2-
/- mice infected with a relatively high dose of M. tuberculosis had 5-fold higher bacterial
numbers than wild type mice by 10 days post-infection, and 100-fold more CFU by 20 days post-
infection (Figure 39B). The CCR2-/- mice infected with 2 x 10⁵ CFU i.v. did not survive past 23
days post-infection.
The decreased susceptibility of CCR2-/- mice to the aerosol infection could have been
due to either the route used to infect the mice, or the substantially lower dose that is delivered to
the lungs by aerosol (compared to i.v.) infection. To distinguish between these possibilities, we
infected CCR2-/- mice with a lower dose i.v., using 1 x 10⁴ CFU H37Rv. This delivers <100
CFU to the lungs [7, 186] which is similar to the dose delivered directly to the lung by our
aerosol infection. CCR2-/- and wild type mice infected i.v. with the lower dose were equally
capable of controlling the infection, similar to aerosol-infected mice (Figure 39C). When a high
dose of M. tuberculosis strain H37Rv was administered via aerosol (4000 CFU or 1500 CFU),
the CCR2-/- mice had significantly higher bacterial loads in their lungs than wild type mice by 3
weeks post infection (data not shown), yet both strains of mice succumbed by 4 weeks post-
infection to these high doses of M. tuberculosis. Thus, the susceptibility of CCR2-/- mice is
135

dependent on dose, rather than route of infection.
B. C.
0 10 20 30 40 50 60 70 80Days Post Infection
106
107
108
109
105
104
103
102
101
0 10 20 30 40 50 60 70 80Days Post Infection
*
*106
107
108
109
105
104
103
102
101
A.
0 5 10 15 20 25
***
Days Post infection
106
107
108
109
105
104
103
102
101
CCR2-/-CCR2+/+
CFU
/Lun
g
101
108
107
106
105
104
103
102
109
0 10 20 30 40 50
CCR2-/- ErdmanCCR2+/+ ErdmanCCR2-/- H37RvCCR2+/+ H37Rv
Days Post Infection
Figure 39. CCR2 deficient mice control low dose infection with M. tuberculosis.
CCR2-/- mice and wild type C57BL/6 mice were infected via aerosol route with ~50 CFU M. tuberculosis H37Rv (circles) (A), intravenously with 2x 10⁵ CFU M. tuberculosis H37Rv (B), intravenously with 1x10⁴ CFU M. tuberculosis Erdman (triangles) or H37Rv (C). CCR2-/- mice (open symbols) controlled growth of M. tuberculosis similar to wild type (closed symbols) mice in the two lower dose models (A, C), but had much higher bacterial numbers in the higher dose model (B). For (A) both lung and spleen CFU are shown; for (B, C) lung CFU only are shown. Each time point represents 3-4 mice and the bars represent standard error. The aerosol route experiment was performed twice with H37Rv and twice with Erdman strain with similar results. The i.v. route experiments were performed twice.
Monocyte/macrophage migration deficiencies were observed even in low dose infection. Murine macrophages express CCR2 and show chemotactic ability to CCR2 ligands,
CCL2, CCL7, and CCL12. Monocyte/macrophage migration deficiencies have been observed in
inflammatory models in CCR2-/- mice [135, 182-185, 187-189]. Since the CCR2-/- mice were
capable of controlling low dose M. tuberculosis infection, we examined whether the lungs of the
136

CCR2-/- mice were also deficient in macrophages following low dose M. tuberculosis infection.
Antibody staining followed by flow cytometric analysis was performed on single cell lung
homogenates. A substantial macrophage deficiency was observed in the CCR2-/- mice infected
with a low dose of M. tuberculosis. There was a 10-fold increase in macrophages by 32 days post
infection, but the number of macrophages in the CCR2-/- mice remained much lower than in
wild type mice (Figure 40A), even up to 5 months post-infection (data not shown). In the low
dose i.v. model of M. tuberculosis infection (1x10⁴ CFU), the CCR2-/- also exhibited at least 2-
fold fewer macrophages in the lungs (Table 9).
These data and those previously reported [135] demonstrate that CCR2 plays an essential
role in macrophage migration to the lung during M. tuberculosis infection, regardless of dose,
route or strain of M. tuberculosis used for infection. In high dose i.v. and aerosol infection
models, the numbers of neutrophils increased to greater than 50% of the total lung homogenate
[190]. An increase in neutrophils was evident in low dose models of infection in CCR2-/- mice,
but by 4 weeks post infection the percentage of neutrophils was greatly reduced (Figure 40B and
Table 9).
137

Table 9. Numbers of immune cells within the lungs 3 weeks post infection.
Numbers of macrophages, neutrophils, CD4+ lymphocytes and CD8+ lymphocytes are represented from low dose aerosol infection, low dose i.v. infection and high dose i.v. infection. Each value represents the mean of 3-4 mice and the standard error of the mean is in parentheses. *p<0.05, **p<0.005, and ***p<0.001 Numbers of immune cells within the lungs 3 weeks post infection. Numbers of macrophages, neutrophils, CD4+ lymphocytes and CD8+ lymphocytes are represented from low dose aerosol infection, low dose i.v. infection and high dose i.v. infection. Each value represents the mean of 3-4 mice and the standard error of the mean is in parentheses. *p<0.05, **p<0.005, and ***p<0.001
Cellular
Infiltrate
(x105)(3wks)
WT
(aerosol)
CCR2-/-
(aerosol)
WT
(low dose iv)
CCR2-/-
(low dose iv)
WT
(high dose iv)
CCR2-/-
(high dose i.v.)
Macrophages 0.81 (+0.06) 0.28 (+0.06) 0.64 (+0.10) 0.36 (+0.05) 5.06 (+0.50) 0.7 (+0.16)
Neutrophils 1.57 (+0.24) 2.35 (+0.29) 0.65 (+0.29) 1.70 (+0.45) 2.16 (+0.26) 24.54 (+7.15)
CD4 T cells 6.01 (+0.88) 3.72 (+0.62) 5.04 (+1.11) 3.58 (+0.66) 30.42 (+5.31) 16.81 (+0.53)
CD8 T cells 3.84 (+0.46) 4.28 (+0.28) 3.25 (+0.64) 2.50 (+0.36) 16.46 (+3.21) 8.7 (+0.53)
138

CCR2+/+ Day 21
CCR2-/- Day 21
16%
5%
24%
49%
# C
ells
/ Lun
g(x
105 )
***
**
**
**
Macrophages
0 10 20 30 40 50 60 70 800
.5
1
2
3
4
Days Post Infection
# C
ells
/ Lun
g(x
105 )
Neutrophils
0 10 20 30 40 50 60 70 800
1
2
3
Days Post Infection CCR2-/-CCR2+/+
Figure 40. Macrophages are present in fewer numbers throughout M. tuberculosis infection in the CCR2 deficient mice.
Migration of macrophages (A) and neutrophils (B) to the lung following aerosol infection (50 CFU) with M. tuberculosis H37Rv in CCR2-/- mice (open squares) and CCR2+/+ mice (closed triangles). Flow cytometric analysis was performed on single cell suspensions of the lung. Within the macrophage/granulocyte gate (determined by SSC v FSC), macrophages were defined as CD11b+Gr1- and neutrophils were CD11b+ Gr1+. Each data point represents 3 to 4 mice and the bars represent standard error. *p<0.05, **p<0.005, and ***p<0.001. This experiment was repeated twice with similar results.
Lymphocyte migration to the lung following aerosol infection is affected.
Because CD4+ and CD8+ lymphocytes play important roles in M. tuberculosis infection
[reviewed in [23]] and can express CCR2, the migration of these cells to the lung following M.
tuberculosis infection was evaluated by flow cytometry. The percentage of CD4+ T cells was
significantly less in the CCR2 deficient mice compared to wild type mice up to 50 days post-
infection (Figure 41A). There was a more modest delay in CD8+ lymphocyte migration to the
139
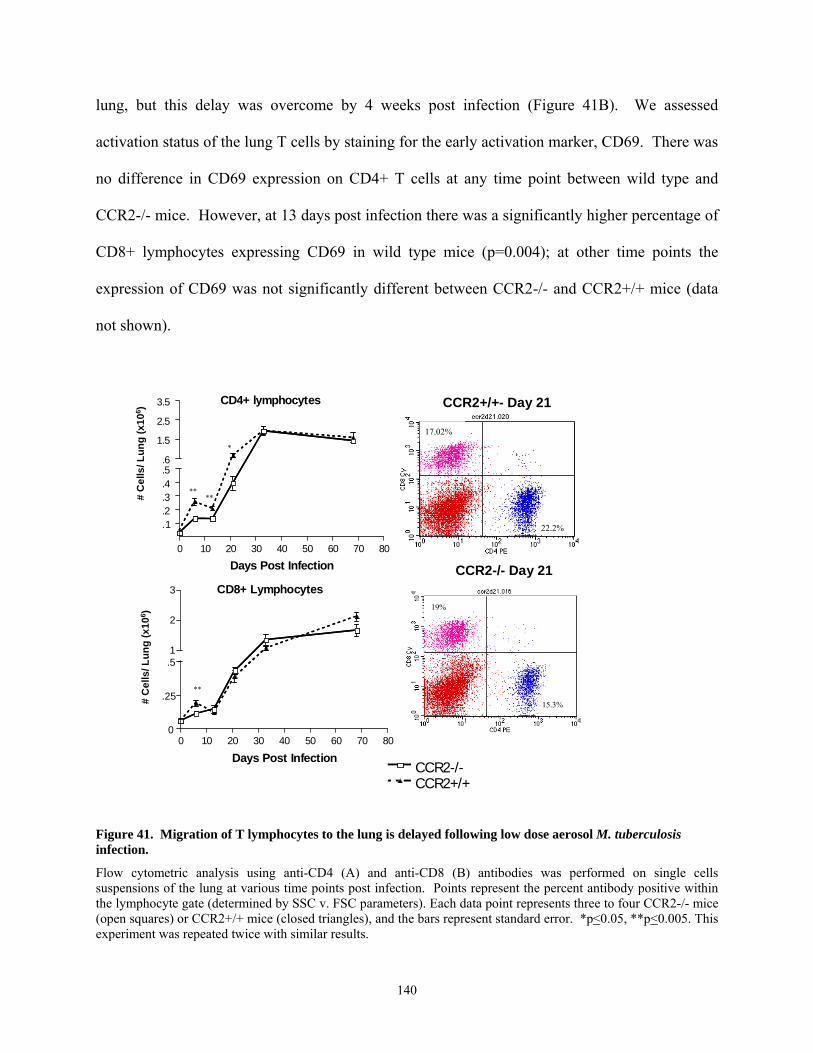
lung, but this delay was overcome by 4 weeks post infection (Figure 41B). We assessed
activation status of the lung T cells by staining for the early activation marker, CD69. There was
no difference in CD69 expression on CD4+ T cells at any time point between wild type and
CCR2-/- mice. However, at 13 days post infection there was a significantly higher percentage of
CD8+ lymphocytes expressing CD69 in wild type mice (p=0.004); at other time points the
expression of CD69 was not significantly different between CCR2-/- and CCR2+/+ mice (data
not shown).
CD4+ lymphocytes
0 10 20 30 40 50 60 70 80
1..2.3.4.5.6
1.5
2.5
3.5
Days Post Infection
CD8+ Lymphocytes
0 10 20 30 40 50 60 70 800
.25
.51
2
3
Days Post Infection
CCR2+/+- Day 21
CCR2-/- Day 21
19%
15.3%
17.02%
22.2%
# C
ells
/ Lun
g (x
106 )
# C
ells
/ Lun
g (x
106 )
****
*
**
CCR2-/-CCR2+/+
Figure 41. Migration of T lymphocytes to the lung is delayed following low dose aerosol M. tuberculosis infection.
Flow cytometric analysis using anti-CD4 (A) and anti-CD8 (B) antibodies was performed on single cells suspensions of the lung at various time points post infection. Points represent the percent antibody positive within the lymphocyte gate (determined by SSC v. FSC parameters). Each data point represents three to four CCR2-/- mice (open squares) or CCR2+/+ mice (closed triangles), and the bars represent standard error. *p<0.05, **p<0.005. This experiment was repeated twice with similar results.
140

Histological analysis of CCR2 deficient mice.
Granuloma formation parallels development of cell mediated immunity in murine models
of tuberculosis. This occurs in the M. tuberculosis-infected lung 3-4 weeks post-infection. The
granuloma consists primarily of clusters of macrophages, including epithelioid macrophages, and
lymphocytes. In human tuberculous granulomas, typically the lymphocytes surround the
macrophages, which may fuse to form multinucleated giant cells. Following aerosol infection,
the CCR2-/- mice did form granulomas in the lungs, but the formation was delayed and the
reduction in macrophages could clearly be observed in the overall granuloma structure and
pathology of the lungs (Figure 42). By 13 days post infection, perivascular and peribronchial
lymphocytic infiltrate was evident in wild type mice but to a lesser extent in CCR2 deficient
mice. This correlates with the delay in lymphocytic and macrophage infiltration evident in the
flow cytometric analysis of the lung (Figure 40 and Figure 41). By 21 days post infection the
perivascular and peribronchial infiltrate was more noticeable in the CCR2 deficient mice, but in
the wild type mice the lymphocytes were infiltrating deeper into the parenchymal space. By 33
days post-infection granulomas were evident in both groups of mice, but were more organized in
wild type mice with tighter lymphocytic clusters. By day 48 the granulomas were organized in
the CCR2 deficient mice, but as a result of fewer macrophages in the lungs, the granulomas
consisted of lymphocytic cuffs surrounding epithelioid macrophages, rather than the lymphocytic
aggregates within sheets of epithelioid macrophages as previously described in wild type mice
[26]. Thus, granuloma formation in the lungs was delayed and ultimately the granulomas
appeared to contain fewer macrophages in CCR2-/- mice compared to wild type mice.
141

CCR2-/- CCR2+/+D
ay 1
3D
ay 4
8
Figure 42. Granulomas form in the lungs with delayed kinetics in CCR2 deficient mice.
Hematoxylin and Eosin staining was performed on 5-6µm formalin-fixed lung tissue sections at each time point, post infection. Panels from day 13, 21, and 33 are 40X while panels from day 48 are 100x magnification. Infiltration is delayed in CCR2-/- mice, but granulomas do form, although they are histologically different from those found in CCR2+/+ mice.
IFN-γ and NOS2 production is delayed in CCR2 deficient mice.
Mice deficient in CCR2 have transient delays in IFN-γ production [159, 188, 191]. Since
IFN−γ is required for control of M. tuberculosis [64, 98, 192] and the CCR2-/- mice control
infection in the low dose models, we examined whether the defect in IFN-γ production reported
in the high-dose infected mice [62] was evident in the aerosol model. Using RNase protection
assays on whole lung RNA preparations, there was a substantial delay in the IFN-γ gene
expression (Figure 43). Concomitant with the delay in IFN-γ there was a delay in mRNA levels
142

of the gene for inducible nitric oxide synthase (NOS2). RNA from the lungs of uninfected mice
was also used in RNase protection assays; the genes of interest were below the level of detection
with this RNA (data not shown). The delayed NOS2 gene expression was confirmed at the
protein level by immunostaining of lung tissue from the mice at each time point post-infection
(data not shown). Expression of a number of other cytokines was addressed through RNase
Protection Assay, and no significant difference in the mRNA expression of IL-12, TNF, or IL-1
in CCR2-/- compared to wild type mice was observed (data not shown).
IFN-γ
0 10 20 30 40 50 60 70 800.0
0.1
0.2
0.3
0.4
CCR2-/-
CCR2+/+
Days Post Infection
NOS2
0 10 20 30 40 50 60 70 800
1
2
3
Days Post Infection
***
*
**
*
Figure 43. Expression of IFN-γ and inducible nitric oxide synthase (NOS2) is delayed in the lungs of CCR2-/- mice infected with a low dose of M. tuberculosis H37Rv via aerosols.
RNase Protection Assays were performed on whole lung RNA preparations, as described. Each data point represents three to four CCR2-/- mice (open squares) or CCR2+/+ mice (closed triangles), and the bars represent standard error. *p<0.05, **p<0.005, and ***p<0.001. This experiment was repeated once with similar results.
143
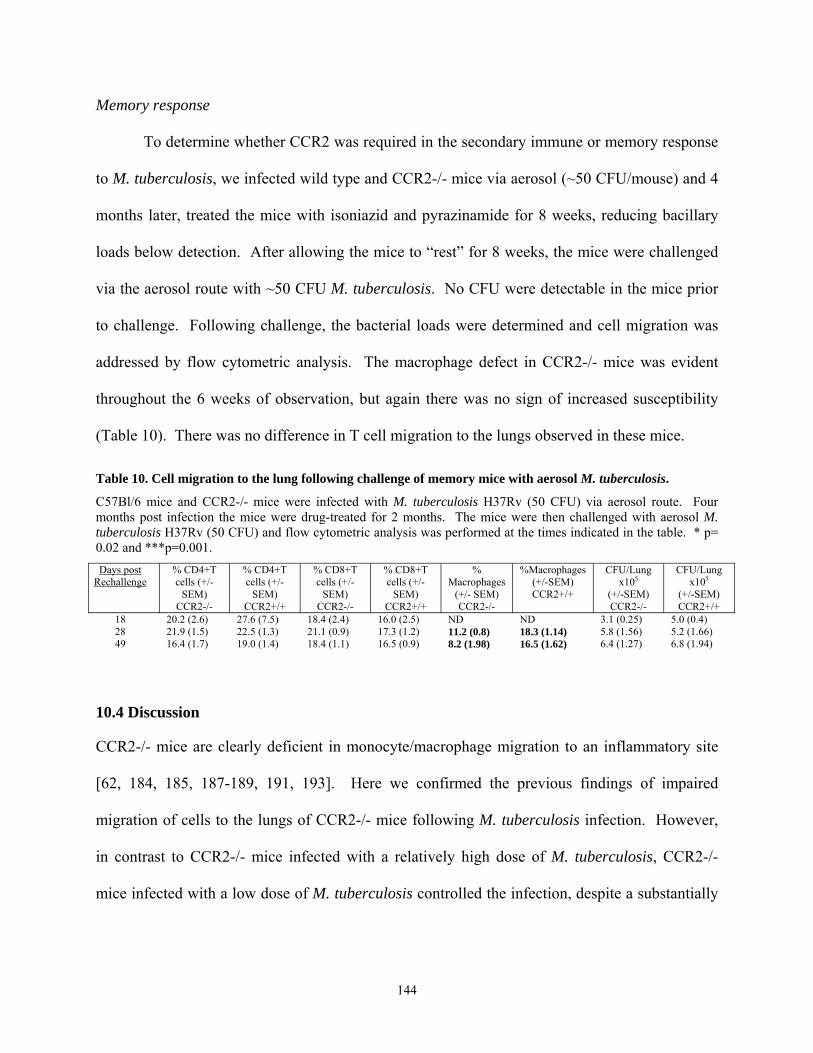
Memory response
To determine whether CCR2 was required in the secondary immune or memory response
to M. tuberculosis, we infected wild type and CCR2-/- mice via aerosol (~50 CFU/mouse) and 4
months later, treated the mice with isoniazid and pyrazinamide for 8 weeks, reducing bacillary
loads below detection. After allowing the mice to “rest” for 8 weeks, the mice were challenged
via the aerosol route with ~50 CFU M. tuberculosis. No CFU were detectable in the mice prior
to challenge. Following challenge, the bacterial loads were determined and cell migration was
addressed by flow cytometric analysis. The macrophage defect in CCR2-/- mice was evident
throughout the 6 weeks of observation, but again there was no sign of increased susceptibility
(Table 10). There was no difference in T cell migration to the lungs observed in these mice.
Table 10. Cell migration to the lung following challenge of memory mice with aerosol M. tuberculosis.
C57Bl/6 mice and CCR2-/- mice were infected with M. tuberculosis H37Rv (50 CFU) via aerosol route. Four months post infection the mice were drug-treated for 2 months. The mice were then challenged with aerosol M. tuberculosis H37Rv (50 CFU) and flow cytometric analysis was performed at the times indicated in the table. * p= 0.02 and ***p=0.001. Days post
Rechallenge% CD4+T cells (+/-
SEM) CCR2-/-
% CD4+T cells (+/-
SEM) CCR2+/+
% CD8+T cells (+/-
SEM) CCR2-/-
% CD8+T cells (+/-
SEM) CCR2+/+
% Macrophages
(+/- SEM) CCR2-/-
%Macrophages (+/-SEM) CCR2+/+
CFU/Lung x105
(+/-SEM) CCR2-/-
CFU/Lung x105
(+/-SEM) CCR2+/+
18 20.2 (2.6) 27.6 (7.5) 18.4 (2.4) 16.0 (2.5) ND ND 3.1 (0.25) 5.0 (0.4) 28 21.9 (1.5) 22.5 (1.3) 21.1 (0.9) 17.3 (1.2) 11.2 (0.8) 18.3 (1.14) 5.8 (1.56) 5.2 (1.66) 49 16.4 (1.7) 19.0 (1.4) 18.4 (1.1) 16.5 (0.9) 8.2 (1.98) 16.5 (1.62) 6.4 (1.27) 6.8 (1.94)
10.4 Discussion
CCR2-/- mice are clearly deficient in monocyte/macrophage migration to an inflammatory site
[62, 184, 185, 187-189, 191, 193]. Here we confirmed the previous findings of impaired
migration of cells to the lungs of CCR2-/- mice following M. tuberculosis infection. However,
in contrast to CCR2-/- mice infected with a relatively high dose of M. tuberculosis, CCR2-/-
mice infected with a low dose of M. tuberculosis controlled the infection, despite a substantially
144

reduced macrophage population in the lungs. Thus, in a low dose infection, a delayed or
deficient immune response does not necessarily lead to higher bacterial numbers in the lungs.
The absence of CCR2 resulted in prolonged macrophage deficiency in the lungs in the
low dose model of infection. There was 2-5 fold fewer macrophages in the CCR2-/- lungs
compared to wild type lungs. There was also a less pronounced but definite defect in macrophage
migration to the lungs following challenge of previously infected and drug-treated (i.e. immune)
mice. However, the level of macrophages was apparently sufficient to control the primary or
secondary infection, suggesting that the macrophage response in wild type mice to M.
tuberculosis is more robust than necessary to control a low dose infection. However, even a very
robust response is insufficient to clear the infection in mice.
T cell migration, particularly CD4 T cells, was also deficient in CCR2-/- mice during the
early stages of the infection. This may be a direct effect of the absence of CCR2, since this
receptor is found on activated T cells and may be important in T cell trafficking to the lungs from
the bloodstream. However, the delay in T cell migration could also be an indirect effect of
CCR2 deficiency. Macrophages produce additional chemokines that signal T cell migration, and
the reduction in macrophages in the lungs may result in altered chemokine levels contributing to
reduced T cell migration. Alternatively, priming of T cells by dendritic cells in the lymph nodes
could also be affected by the absence of CCR2, and this would result in a delay in T cell
responses in the lungs. The T cell migration delay was not observed in the memory response to
challenge in the lungs, suggesting that chemokine responses for memory cells may differ from
those required for a primary response, or that priming of T cell response by dendritic cells may
be the cause of the delay in the primary response.
145

A significant delay in IFN-γ gene expression was also observed in the lungs. This may
be due to the delayed T cell migration to the lungs, or to reduced stimulation of the T cells that
are present in the lungs because of macrophage deficiencies. Regardless of the mechanism
responsible, the finding that a substantial delay in IFN-γ production does not necessarily lead to
increased bacterial numbers is surprising. IFN-γ is an essential cytokine for control of M.
tuberculosis infection, regardless of dose or route of challenge [64, 98]. Nonetheless, it appears
that IFN-γ levels substantially reduced from wild type levels are sufficient to control low dose
infection, at least in the early stages of infection. This again implies that the immune response in
the lungs is more robust than necessary for bacterial control. The delayed IFN-γ levels may be
responsible for the reduced NOS2 gene expression, or this may also result from the deficiency of
macrophages, the cells that produce NOS2, in the lungs. In any event, the control of bacterial
growth in the lungs of CCR2-/- mice following low dose infection suggests that the level of
NOS2 production is sufficient; however, at higher doses, this level of macrophage activation was
apparently not adequate to control bacterial growth.
One striking difference between the low dose and high dose infection in CCR2-/- mice
was the neutrophilic infiltration to the lungs. The increased neutrophilic infiltration as a result of
CCR2 deficiency was previously observed [62]; the results in the low dose infected mice suggest
that the continued infiltration of neutrophils may be due to uncontrolled bacterial replication in
the high dose model rather than a direct result of CCR2 deficiency. It is possible that the
presence of large numbers of neutrophils in the lungs is damaging to the tissue, and affects the
ability of the macrophages to control infection. In the low dose mice, the neutrophil infiltration
is not significantly different at any time point, although there is a trend toward higher numbers of
neutrophils in the CCR2-/- lungs. Coincident with the induction of cell-mediated immunity and
146

control of bacterial growth in the lungs (at 3-4 weeks post-infection), the numbers of neutrophils
decreased.
More recently, a more detailed study demonstrated that CCL2-/- mice have very similar
infection profile to CCR2-/- mice following low dose aerosol infection [73]. In these studies the
authors report fewer macrophages migrating to the lung and a very small transient increase in
bacterial burden in the CCL2-/- mice compared to wild type mice. In addition the CCL2-/- mice
had a transient reduction in IFNγ production. These data indicate that CCL2 ligation of CCR2 is
required for macrophage migration and early lymphocyte focusing in the lung.
In summary, these studies confirm that CCR2 is an important chemokine receptor in the
trafficking of macrophages to the lungs during M. tuberculosis infection. However, for low dose
infection, the prolonged paucity of macrophages and transient delay in T cell recruitment and
IFN-γ expression did not noticeably impair control of the infection in the lungs. These results
imply that the wild type immune response to M. tuberculosis in the lungs is more vigorous than
necessary. Clearly, CCR2 is important for macrophage infiltration into the lungs following M.
tuberculosis infection, and there is not a molecule that can replace CCR2 in this function. This
striking phenotype was observed regardless of infection dose, route or strain of M. tuberculosis.
The importance of macrophages to control of M. tuberculosis is well established. The ability of
mice to control a low dose, but not a relatively high dose M. tuberculosis infection with a
substantial deficiency in macrophage numbers in the lungs does not imply that CCR2 is not
playing a role in the immune response to this pathogen. Instead, the ability of mice to control a
low dose infection with a minimal inflammatory response in the lungs, with respect to
macrophages and T cells early in infection, can be observed in these studies. A higher dose
infection clearly overwhelms this reduced response, and the reduced subsequent IFN-γ and
147

macrophage infiltration is not sufficient to gain control of the infection. The induction of T cell
response in the lungs in the high dose mice at ~2-3 weeks post-infection coincides with very high
bacterial numbers, and thus cannot contribute to the reduction of the bacterial load. This has
been observed in other systems as well, including mice deficient in CD4 T cells [7]. However,
as with many immunologically deficient mice and tuberculosis, CD4 T cell deficient mice cannot
control even low dose aerosol infections [194]. In contrast, in the low dose infection, the
minimal innate and inflammatory response that occurs in the absence of CCR2 is sufficient to
control the infection until cell mediated immunity is fully induced.
These studies have provided insight into the use of immunologic knockout mice to study
M. tuberculosis. The use of CFU as the primary measure of the contribution of a specific
immune component in the response to this infection can be misleading. In studies designed to
unravel a complex system, such as cell migration and granuloma formation, the choice of model
can be crucial to the outcome and interpretation of the results. The use of models, in vitro or in
vivo, that are deficient in one component enables the assessment of a possible role for that
component in cell migration or control of infection. However, the presence of a multitude of
components can complicate the interpretation of the data, particularly in in vivo studies. An
increase in bacterial numbers in a knockout mouse, compared to wild type, has been a standard
for determining whether a particular component is essential in the immune response to M.
tuberculosis. The infiltration of cells to the lungs and subsequent granuloma formation is clearly
a complex process requiring a network of molecules and receptors. Nonetheless, although our
data confirmed that CCR2 is clearly important in migration of macrophages to the lungs
following infection, under certain infection conditions this deficiency does not impair control of
bacterial growth in the lungs. Our interpretation of these data is that comparison of bacterial
148

numbers is only one measure of the function of certain molecules. The data provided here
demonstrate that CCR2 is an important molecule in monocyte/macrophage migration, and also
affects, perhaps indirectly, T cell migration and IFN-γ expression. In the low dose infection
model, other immune components are sufficient to control the infection, whereas when a higher
dose is administered to the mice, the absence of CCR2 results in lethal infection. Thus, there is a
critical dose that can overwhelm the ability of macrophage-deficient lungs to control infection.
149

11.0 Summary
My evaluation of cell migration and chemokine expression during M. tuberculosis
infection has provided novel information that will aid in understanding the cascade of events in
response to infection. I have also made important contributions to our general understanding of
the immune responses to M. tuberculosis and the utility of the mouse model. This study began
with a broad focus, which we narrowed to evaluate a specific subset of inducible chemokines.
Early analysis of anti-TNF Ab treated mice revealed granuloma deficiency after M. tuberculosis
infection [106], and one set of logical candidates for control of granuloma formation was
chemokines. Therefore, after defining a subset of chemokines that were affected by anti-TNF
Ab treatment in vitro, we designed experiments focusing on the expression of those chemokines
in vivo and in vitro during M. tuberculosis infection. The chemokine functions analyzed fell
mainly into three groups based on their receptors: ligands for CXCR3 (CXCL9, 10 and 11),
ligands for CCR5 (CCL3, CCL4, CCL5), and ligands for CCR2 (CCL2 and CCL12).
Many cell types are required for an effective, controlled immune response to be initiated
and maintained in the lungs during M. tuberculosis infection. These cells include CD4
lymphocytes, CD8 lymphocytes, and macrophages. In addition, B lymphocytes and neutrophils
are involved in the immune response, but their roles are less defined. In a healthy lung very few
immune cells are present, rather the tissue is comprised of airways with walls of ciliated
epithelium with some alveolar macrophages and immature dendritic cells present. After
infection, cell migration to the lungs begins and the immune system sets up its defense. The
organization of the immune system requires many different cells communicating through many
different signals. The granuloma structure in the lungs serves as a site for this cascade of
communication. Although the granuloma is also a sign of chronic antigenic stimulation and
leads to some pathology, it is clearly required for control of infection. The bacterial burdens in
150

mice plateau at the time when granulomas form and the cell mediated immune response has been
initiated. It is at this critical juncture that TNF- deficient mice are unable to form granulomas
and control infection. Therefore these studies, focusing on the signals required for granuloma
formation and cell migration into the lungs, are very important for understanding the initiation
and maintenance of a successful cell mediated immune response to M. tuberculosis in the lungs.
Chemokines, or chemotactic cytokines, are responsible for cell migration into and out of
lymphatics, the blood and tissue. We demonstrated that many inducible chemokines, both of the
C-C and C-X-C classes, are upregulated with M. tuberculosis infection.
Differences in the organization of cellular infiltrates found in many chemokine deficient
mice, such as CCR2-/- mice, CXCR3-/- mice, CCL2-/- mice or CCR5-/- mice (Table 1) did not
result in differences in overall control of tuberculosis infection. This is very different from a
situation in TNF-deficient mice. In the TNF-deficient mice, even though there are as many cells
migrating into the lungs, the infiltrates are not organized. As a general point it appears that early
cell migration can be delayed (such as in CCR2-/- mice), but the bacterial burdens must be
controlled by 3 or 4 weeks post infection, or an effective cell mediated immune response may
not be initiated.
Another important point that can be taken from these studies is that although there may
not be differences in the bacterial burden or survival, lessons can be learned about the intricacies
of immune system. The table below briefly describes the differences found in the cellular
infiltrates during infection of chemokine knockout mice. Not all of these mice illustrate
differences in bacterial burden or in survival, but they do show distinct significant differences in
the cellular infiltrate to the lungs or the lymph nodes. Therefore CCR2 is required for
macrophage migration to the lungs and lymph nodes. CCR5 is required for normal dendritic cell
151

migration/ retention in the lymph nodes and lung early, influencing T lymphocyte migration late.
CXCL10 appears play a role in early lymphocyte migration to the lymph nodes.
Table 11. Cellular infiltrate differences in chemokine or chemokine receptor deficient mice.
Mouse Strain Cell infiltrate differences
observed
When differences
observed
Reference
CCR2-/- Macrophages (Lung, Lymph
nodes)
Throughout
infection
[63]
CCR5-/- Dendritic cells (Lymph nodes),
T lymphocytes (Lung)
Early, late Section
9.0
CXCL10-/- T lymphocytes (Lymph nodes) Early Section
8.0
CXCR3-/- Neutrophils, T lymphocytes
(Lung)
Early [72]
We detected increased expression of CCL2, CCL7 and CCL12, ligands for CCR2, in the
mouse after M. tuberculosis infection in the lung and in vitro in macrophages. We hypothesized
that CCR2 would be required for macrophage migration to the lung. We expected the mice to be
susceptible to tuberculosis with a macrophage deficiency. During acute inflammatory responses
in CCR2-/- mice there were obvious deficiencies in macrophage and dendritic cell migration.
Our studies have demonstrated dose dependent control of M. tuberculosis infection in CCR2-/-
mice.
Based on our findings that CCR5 ligands were affected by TNF and that CCR5 is on
macrophages, dendritic cells and T lymphocytes we hypothesized that the immune response to in
CCR5 deficient mice would be impaired due to reduced migration of these cells to the lungs.
Our hypothesis was not supported. Our studies suggest that CCR5 has either a direct or indirect
152

role in dendritic cell migration from the lung to the lymph node. There does not appear to be a
direct effect on macrophages or lymphocytes. This may be the consequence of several reasons.
CCR5 may not be involved in lymphocyte migration, or the ligands for CCR5, CCL4 and CCL5,
could be signaling through CCR1 to induce migration of lymphocytes and macrophages. In
addition, other chemokines may be compensating for the loss of CCR5 signaling.
In an effort to recapitulate the pathology observed in the anti-TNF Ab treated mice, these
neutralization and receptor knockout models were utilized. We were unable to recreate the
pathology observed in the absence of TNF. This is likely due to the number of chemokines
influenced, at least in part, by TNF, and it is impossible to recreate a knockout or an effective
neutralization model, that could modulate all these chemokines. The effects of TNF may also be
temporal, and several chemokines could be modulated at different time points in the infection.
The effect TNF has on the immune response is not limited to chemokine expression, and
includes such important roles as macrophage activation and modulation of cytokine expression.
In addition, chemokines are not solely responsible for cell migration, adhesion molecules play a
role in these processes and other factors such as matrix metalloproteinases can be involved in
tissue pathology and granuloma formation.
Matrix metalloproteinases (MMPs) are implicated in tissue remodeling processes and
chronic inflammatory conditions. In addition, recent evidence indicates that transendothelial
migration of lymphocytes is affected by MMPs [195]. MMP-1 (52kDa collagenase) and MMP-
9 (92kDa collagenase) are induced in vitro following M. tuberculosis infection in THP-1 cells
[196], and neutralization of TNF reduced MMP production in response to mycobacteria [197].
These data indicate that chemokine gradient changes may not be solely responsible in the lung
pathology observed with anti-TNF Ab treatment in vivo. We performed some gene expression
153
(array) studies of MMP expression in the lungs of anti-TNF treated mice, and observed no
obvious differences between these mice and control mice, but this avenue is complicated by the
fact that there is extensive post transcriptional processing of MMPs making interpretation of the
data difficult (APPENDIX C).
Through this research we have contributed to generalized concepts of the immune
response to M. tuberculosis. Through studies on TNF we have learned that the localized gene
and protein expression with in the site of a granuloma is very different from expression and
activity in the whole lung. Through studies on CCR5-/- mice, we learned that the immune
response can be more robust than necessary, but a stronger Th1 response does not lead to
increased clearance of the mycobacteria. Through studies in CCR2-/- mice we learned that dose
can have a strong influence on survival in immunocompromised mice, and that the immune
response can be delayed or reduced without long term detrimental effects to the host, as long as
the inoculum is reasonable. Both these studies support the contention that the immune response
to M. tuberculosis in the lungs of mice is much stronger than necessary, and suggest that there
must be some regulation of this response to avoid excessive immunopathology. Overall these
studies will have a major impact on the future design of experiments. In many experiments
performed for this thesis, there were no differences in mycobacterial burden or survival in gene-
deficient mice, yet there were still definable roles and mechanisms of action for a particular
factor. In other words, the immune response is a very intricate system and knocking out or
blocking essential elements may lead to very obvious or very subtle changes in the response
without increased bacterial loads or decreased survival. Therefore, the experiments need to be
designed in a way to address mechanisms of action, in addition to outcome of infection in order
154

to understand the immune response. We have approached this by not simply following bacterial
numbers, but also surveying the immune response at many points throughout the infection.
Our studies on cell migration and chemokine expression have deepened the tuberculosis
field’s understanding of the immune response in the lungs. These studies have shown the
importance of very localized controlled chemokine expression. The macrophage appears to
orchestrate granuloma formation and maintenance in the lungs, at least in part through the
cascade of expression of TNF and chemokines (Figure 44).
155

Figure 44. Chemokine expression and cell migration in the absence of TNF.
Chemokines are both down regulated (CCL2, CCL3, CCL4, CCL5, CXCL9, CXCL10) and upregulated (CCL12) in the absence of TNF. In addition granuloma formation is absent and although the cells migrate to the lungs, they do not form organized granulomas.
156

APPENDIX A
A.0 IL-10 expression during aerosol M. tuberculosis infection is a result of increased bacterial burden and does not lead to immunosuppression
Abstract This study addresses possible interactions between IL-10 and TNF in maintaining a M.
tuberculosis granulomatous response. The results indicate that IL-10 production seen in TNF
neutralized mice was a reaction to the inflammation, rather than contributing to the inflammation
through immunosuppressive activity. This response was also observed in other mice that had
substantial inflammation or high bacterial numbers in the lungs.
A.1 Introduction
Recent studies indicate that overproduction of IL-10 results in poor immune responses to
mycobacterial infections [107, 108]. In vivo production of IL-10 under the control of the IL-2
promoter lead to reactivation of pulmonary tuberculosis in mice [107]. IL-10 and other Th2
cytokines are correlated with impaired control of some intracellular pathogens, such as
Mycobacterium leprae, M. bovis and Leishmania major [108, 198-200].
Additional studies have examined the response of IL-10-/- mice to mycobacterial
infections. These studies do not collectively define a role for IL-10 in control of mycobacterial
infections. When IL-10-/- mice were infected intravenously with BCG, an avirulent M. bovis
strain, they maintained lower bacterial burdens than C57BL/6 mice, had larger granulomas and
higher expression of ICAM, MHC II, TNF and NOS2 [201, 202]. On the other hand, when IL-
10-/- mice were infected via aerosol with BCG, there was no significant difference in disease
157

progression [203]. M. avium infected mice, when treated with neutralizing antibody to IL-10, had
increased resistance to disease [204, 205]. There was no difference in bacterial numbers in the
organs of IL-10-/- mice within the first 3 months of infection with M. tuberculosis [65]. In
another study, infection of IL-10-/- mice with M. tuberculosis led to transient increases in IFNγ
production and initially better control of M. tuberculosis than wild type mice, but by 8 weeks
post infection, these differences no longer were apparent [109].
IL-10 is an anti-inflammatory cytokine primarily associated with Th2 responses
[reviewed in [206, 207]]. IL-10 enhances activation, proliferation and chemotaxis of CD8+
lymphocytes [208], antibody dependent cytotoxicity, B lymphocyte proliferation, differentiation
and antibody production. Furthermore, IL-10 can inhibit LPS inducible genes, IFNγ inducible
genes, reactive oxygen and nitrogen intermediates [reviewed in [209]].
In this study we sought to determine whether IL-10 and TNF interact in maintaining
granuloma structure. When TNF was neutralized in the murine model of chronic persistent
tuberculosis, IL-10 mRNA levels increased in the lungs of anti-TNF treated mice, but not in
control mice [106]. These mice had substantial lung pathology, as described in the Introduction
and Chapter 1 of this thesis. IL-10 transgenic mice were more susceptible to reactivation of
chronic M. tuberculosis infection and acute BCG infection[67, 108]. These studies suggested
that inappropriate regulation of IL-10 may lead to exacerbation of disease.
A.2 Materials and Methods
Animals.
C57BL/6 female mice (Charles River, Rockland, Mass.) and IL10-/- (8-14 weeks old) were used
in all experiments. Mice were transferred to the Biomedical Science Tower Biosafety Level 3
animal facility at 7-8 weeks of age. All infected mice were maintained in the BSL3 animal
158

laboratories and routinely monitored for murine pathogens by means of serological and
histological examinations. The University Institutional Animal Care and Use Committee
approved all animal protocols employed in this study.
Chemical and reagents.
All chemicals were purchased from Sigma Chemical Co. (St. Louis, MO.) unless otherwise
noted. Middlebrook 7H9 liquid medium and 7H10 agar were obtained from Difco Laboratories
(Detroit, MI). Antibodies used in flow cytometric analyses were obtained from Pharmingen (San
Diego, CA). Pyrazinamide was purchased from Acros. The cell lines, MP6XT-22 (anti-TNF)
and JES5-2A5 (anti-IL10), were obtained from DNAX and used to generate ascites (Harlan
Bioproducts, Indianapolis,IN). Antibodies were purified endotoxin free from ascites fluid as
previously described [106] and mice were treated with antibody intravenously every three days
(0.5mg/dose) starting 4 months post infection. Control mice received normal rat IgG (Jackson
Immunoresearch Laboratories Inc.,West Grove, PA) with the same dosing regiment.
Mycobacteria and infection of mice.
To prepare bacterial stock, M. tuberculosis strain Erdman (Trudeau Institute, Saranac Lake,
N.Y.) was used to infect mice, and then bacteria were harvested from their lungs, expanded in
7H9 liquid medium and stored in aliquots at -80°C. Mice were infected via the aerosol route
using a nose-only exposure unit (In Tox Products, Albuquerque, N.M.), and exposed to M.
tuberculosis (1 x 10⁷ CFU/ml in the nebulizer chamber) for 20 minutes, followed by 5 minutes of
air. This resulted in reproducible delivery of 50-100 viable CFU of M. tuberculosis as described
previously [94], which was confirmed by CFU determination on the lungs of 2-3 infected mice 1
day post-infection. The tissue bacillary load was quantified by plating serial dilutions of the
lung, liver, and spleen homogenates onto 7H10 agar as described previously [30].
159

Flow cytometric analysis of lung cells. To determine cellular infiltrate in the lung, at 10-day intervals lungs were removed for flow
cytometric analysis. Lungs were subjected to a short period (20 minutes) of digestion with
1mg/ml collagenase A and 25 Units/ml DNAse (both from Boehringer Mannheim, Mannheim,
Germany) at 37°C. The suspension was pushed through a cell strainer as previously described
[63]. Red blood cells were lysed with red blood cell lysis buffer (NH4Cl/Tris Solution) and the
single cell suspension was counted. The samples were stained with 0.2 µg anti-CD4, anti-CD8,
anti-CD69, anti-CD25 or 0.2 µg anti-B7.1, anti-B7.2, and 0.15 µg anti-Gr1 and 0.2 µg anti-
CD11b in FACS buffer (0.1% NaAzide, 0.1% BSA, 20% mouse serum). Following washes, the
cells were fixed in 4% PFA for 1 hour and collected on a FACS Caliber (Beckon Dickinson).
Analysis was performed on Cell Quest software (BD-Pharmingen, San Diego, CA).
Histopathology. Tissue samples for histological studies were fixed in 10% normal buffered formalin followed by
paraffin embedment. For histopathological studies 5- to 6- µm sections were stained with
Harris’ hematoxylin and eosin.
RNase Protection Assay (RPA).
A multiprobe RNase protection assay system (Pharmingen, San Diego, Ca) was used to
determine the levels of mRNA for genes of interest at 10 day intervals post-aerosol infection in
murine lung or infected macrophages in vitro. At the time of harvest, the lungs were snap frozen
in liquid nitrogen and stored at -80°C. Total RNA was extracted using Trizol reagent (Life
Technology, Grand Island, N. Y.) followed by treatment with RNase free-DNase (Roche,
Indianapolis, IN) and RNase Inhibitor (Roche). The RNA was subjected to RPA according to
Pharmingen’s protocol. In short, mRNA from macrophages or the lungs was hybridized
160

overnight to [32P]-UTP-labeled probes. The protected [32P]-UTP-labeled RNA probes were
resolved on a 6% polyacrylamide gel and analyzed by autoradiography. Cytokine analysis was
performed using a custom-made template set specific for NOS2, IL-4, IL-12p40, TNF, IL-1β,
IL-1α, and IFN-γ. The expression of specific genes was quantified on a densitometer
(ImageQuant Software, Molecular Dynamics, Sunnyvale, CA), relative to the abundance of
housekeeping gene, L32. We also performed phosphorimaging quantification on some samples
but found results identical to densitometry; therefore, only densitometry quantifications are
shown.
A.3 Results
We followed up our previous work to address the expression and role of IL-10 in M.
tuberculosis infection. Aerosol infection was performed using a nose only exposure unit to
deliver 50-100 CFU to the lungs of IL-10-/- or wild type (C57BL/6) mice. IL-10 was neutralized
by administering JES antibody (i.p. 500µg/ mouse every three days) and TNF was neutralized
with MP6-XT22 antibody (i.p. 500µg/ mouse every three days).
We have previously reported that IL-10 was expressed at low or undetectable levels in
lungs of M. tuberculosis aerosol-infected C57Bl/6 mice, as determined by RNase protection
assay [106]. On the other hand, when bacterial burdens were high in immunocompromised
mice, such as CCR2-/- (high dose i.v.infection), TNFRp55-/-, anti-TNF treated, CD40-/-, or
CD4-/- mice, IL-10 expression in the lungs was increased (Table 12) especially when bacterial
burdens increased to levels above 1x10⁷ CFU. A good example of the IL-10 expression in mice
with high bacterial burdens is in CD40-/- mice where at 3 weeks post infection only some of the
mice have high bacterial burdens. The subset of CD40-/- mice with pulmonary bacterial
161

numbers similar to wild type mice also had wild type (low) IL-10 mRNA expression levels.
However, IL-10 expression was 4-5x higher in the lungs of sick CD40-/- mice (Table 12),
Table 12. IL-10 gene expression in the lungs of M. tuberculosis infected mice.
Expression of IL-10 was increased in aerosol infected gene-deficient mice that were impaired in the ability to control M. tuberculosis infection, compared to wild type C57BL/6 mice. 1Ratio is the ratio of the intensity of the IL-10 gene over the L32 housekeeping gene. The results are the average of two mice at each time point. This experiment was performed a minimum of twice for each group of mice with similar results.
Strain “N” Days Post Infection Average CFU Ratio (IL10/L32) TNFR 3 25 4x10⁷ 0.036 TNFR 3 14 1x10⁵ 0.002 CD4 -/- 3 44 2x10⁷ 0.027 CD4-/- 3 21 2x10⁶ 0.007 CD40-/- 3 21 4x10⁶ 0.005 CD40-/- 2 21 9x10⁷ 0.023 CD40-/- 3 14 2x10⁶ 0.001 CCR2-/- 4 18 1x10⁸ 0.011 CCR2-/- 3 12 8x10⁵ 0.001 GKO 3 28 9x10⁷ 0.014 GKO 3 21 7x10⁶ 0.005 WT 4 21 1x10⁵ 0.002 MP6 txt 3 18 1x10⁷ 0.029 IgG txt 3 18 1x10⁶ 0.001
Acute M. tuberculosis infection in IL-10-/- mice
As previously reported [65], IL-10-/- mice controlled aerosol infection with M.
tuberculosis similar to wild type mice (Figure 45A). Histologically the granuloma structures
were well organized. The macrophages appeared larger and more activated in the IL-10 -/-
mice, but RNase Protection Assays on lung RNA revealed no significant differences in the
expression of IL-1, IL-15 or IL-12 compared to C57BL/6 mice (data not shown). Based on our
previous experience detecting cytokines from the macrophage population, it is possible that our
technique was not sensitive enough to detect differences. IFNγ expression was measured at 4, 8,
14, 18, and 22 weeks post infection. While there was a tread towards higher IFNγ expression in
the IL-10-/- mice, the differences were only significant at 4 and 14 weeks postinfection.
162

Therefore, during acute infection, the course of infection in C57BL/6 mice and IL-10-/- was
relatively similar.
L u n g
0 50 100 150 2001 0 0
1 0 1
1 0 2
1 0 3
1 0 4
1 0 5
1 0 6
1 0 7
1 0 8
IL - 1 0 -/ -
IL - 1 0+/+
D a y s P o s t In f e c tio n
CFU
/Lun
g
L u n g
0 5 10 15 20 2510 3
10 4
10 5
10 6
10 7
10 8
I L -1 0 - /-
I L -1 0+ /+
D a ys o f M P 6 Tr ea tm e nt
CFU
/Lun
g
A.
B.
L u n g
0 10 20 30 40 50 60 70 8010 3
10 4
10 5
10 6
10 7
10 8
10 9
10 10
IgG
D a ys of Ant ibod y Tr eatment
CFU
/Lun
g
C.
Anti-IL10
Anti-IL10
Anti-TNF
Anti-TNF/
Figure 45. Colony forming units in the lungs of M. tuberculosis infected mice.
A. IL-10-/- mice controlled M. tuberculosis infection in the lung, spleen, and liver (data not shown). The course of infection in IL-10-/- mice was similar to wild type mice. B. When TNF was neutralized in chronically infected IL-10-/- mice, through MP6 treatment, the IL-10-/- mice maintained better control of the pulmonary bacterial burden. C. IL-10 neutralization alone in chronically infected wild type mice did not alter the course of infection. On the other hand when TNF was neutralized, alone or in conjunction with IL-10, the bacterial burdens in the lungs rose. TNF neutralization alone led to uncontrolled infection and death by 20 days post infection. Dual neutralization of TNF and IL-10 delayed mortality, but only temporarily.
163

The role of IL-10 during anti-TNF induced reactivation
To address the contribution of IL-10 to the pathology observed during anti-TNF Ab induced
reactivation of tuberculosis [106], we treated chronically infected (4-5 months post-infection) IL-
10-/- and C57BL/6 mice with anti-TNF antibody. The IL-10-/- mice exhibited reduced bacterial
burdens in their lungs, livers and spleens compared to C57BL/6 mice treated with anti-TNF, but
that did not influence the survival of the mice (Figure 45B). Both IL-10-/- and wild type mice
succumbed to infection by 25 days post anti-TNF antibody treatment. In addition both IL-10-/-
and wild type mice developed severe disorganization of the cellular infiltrate in the lungs by 14
days after anti-TNF treatment began (Figure 46).
IL-10-/-
IgG MP6 txt.
IL-10+/+
Figure 46. TNF neutralization leads to increased disorganized pulmonary infiltrate in IL-10-/- and wild type mice.
164

Granuloma formation in IL-10-/- and wild type mice was similar throughout infection (here shown at 4 months post infection). By 14 days post MP6 treatment, cellular infiltrate increased in both groups of mice and granuloma becomes disorganized
When IL-10 was neutralized in conjunction with TNF neutralization in a chronic mouse
model, the mean survival time was 8 days longer (m.s.t 24 days (anti-TNF) v. m.s.t. = 32 days
(anti-TNF/anti-IL10), but there was no overall difference seen in the histology. These data
indicate that IL-10 was probably making a very subtle difference in the immune response. At 10
days post antibody treatment there was a reduction in the mean fluorescence intensity of
costimulatory molecules B7.1 (MFI = 240 v. 310: Anti-IL10, anti TNF Abs vs anti-TNF Ab
alone) and B7.2 (MFI = 389 v. 592) in the dual neutralized mice compared to the anti-TNF
treated mice, but no difference in the percentage of cells expressing these molecules. In addition,
the percentage of CD25+ lymphocytes was increased in the dual neutralized mice (31% v. 15%
CD25+ in CD8+gate and 39% v. 20% in the CD4+ gate). This suggests that IL-10 may down
regulate CD25 expression on lymphocytes, or that a population of proliferating (CD25+) T cells
is down-regulated by IL-10. IL-10 neutralization alone resulted in no differences in the course of
infection (data not shown).
A.4 Discussion
Recent data suggest that IL-10 overproduction in vivo can reactivate chronic pulmonary
tuberculosis in C57BL/6 mice [107]. Although this is evident in the transgenic system, C57BL/6
mice do appear to produce amounts of IL-10 capable of producing detrimental
immunosuppressive effects during M. tuberculosis infection. IL-10 -/- mice controlled infection
slightly longer in the face of TNF neutralization, compared to wild type mice. Clearly, the
quantity and timing of IL-10 production influences the effects the cytokine can have on the
immune response and control of the infection. In the case of TNF neutralization in wild type
165

mice, the expression of IL-10 may be slightly detrimental to the induced reactivation. Therefore,
the results of our study indicate that IL-10 production in TNF neutralized mice was a reaction to
the inflammation in TNF neutralized mice, and although it may contribute to the pathology, it
was not responsible for the induction of inflammation observed after TNF neutralization. The
data in table 11 also supports this. IL-10 is not expressed in mice where bacterial burdens are
below 1x10⁷ CFU. Most of these mice succumb to infection and have severe inflammation due
to impaired cell mediated immune responses not due to IL-10 production.
166

APPENDIX B
B.0 Anti-TNF treatment in the presence of antibiotics.
Anti-TNF treatment quickly results in loss of control of M. tuberculosis granulomas and
the bacterial burdens increase. The anti-TNF treated mice succumb to infection despite the fact
that the number of colony forming units in the lung is not >108 (a level where wild type C57Bl/6
usually become moribund). The log increase in CFU observed in the anti-TNF treated mice is
enough to increase chemokine levels complicating our experimental models by created two
variables, no TNF and higher CFU, rather than just no TNF.
To attempt to eliminate the second variable in our experimental model, we treated both
the anti-TNF treated and the IgG treated mice with antibiotics 4 months post infection. The
treatment led to a reduction in the colony forming units, although the mice treated with MP6XT-
22 had a slower reduction, as seen at day 14 (Figure 47). By day 42, M. tuberculosis was no
longer detected in the lung (limit of detection <40 CFU). As a result no experimental or control
mice succumbed due to anti-TNF treatment. The experiment was sustained for 70 days to
observe the cellular infiltrate, pathology and colony forming units.
167

MP6 TxtNo Txt
Lung
0 10 20 30 40 5010 0
10 1
10 2
10 3
10 4
10 5
10 6
Days of AB Txt/ Drug Txt
By Day 42 ZERO
Figure 47. Colony Forming Units in the Lung following antibiotic treatment and antibody treatment in chronically infected mice.
With the antibiotic treatment, we never observed reactivation of disease in either group of
mice. Histological samples of the lungs were stained at each time point (Figure 48). Fourteen
168

days after antibody and antibiotic treatment began, disorganization was observed in the lungs of
anti-TNF treated mice. But even when bacterial levels were below detection, the granulomas
were still present in the lungs at later time point. The granulomas were still organized even in
the anti-TNF treated mice, and the size and number of granulomas was decreased by 42 days
post antibody treatment. These data suggest that the bacteria are required to drive the chemokine
gradients for granuloma formation. In addition, as described earlier, anti-TNF treatment of
macrophages did not abolish, but rather altered chemokine expression in macrophages (Figure
18). The antibiotic treated/ anti-TNF Ab treated mice have very low bacterial burdens compared
to anti-TNF Ab treated (without antimycobacterials) mice. If these mice have reduced levels of
chemokine similar to observations made in anti-TNF Ab treated mice (See section 7.0), the
existing chemokine expression may be enough to control the infection at the later time points.
169

MP6 Txt IgG TxtD
ay 0
Day
14
Day
42
Day
70
Figure 48. Histological Images of chronically infected mice treated with antibiotics and anti-TNF Ab.
The flow cytometric analysis performed on the lungs of the mice confirmed the
observations in the histology. The numbers of cells in the lungs of the mice gradually decreased
170

as the bacterial burdens reduced (Figure 49). Thirty days post antibody/ antibiotic treatment, the
total number of cells in the lungs of anti-TNF treated mice was significantly lower than the IgG
treated mice. Two weeks later the number of cells in the IgG treated mice was also much lower
and by 70 days after treatment began, the total number of cells in the lungs of both groups was
significantly reduced compared to the first day of treatment.
CD8
0 10 20 30 40 50 60 70 800.0x10 -00
2.5x10 05
5.0x10 05
7.5x10 05
1.0x10 06
Days of AB TxtMP6 Txt
No Txt
C D4
0 10 20 30 40 50 60 7 0 800 .0x10 -00
5 .0 x10 05
1 .0 x10 06
1 .5 x10 06
D ays of AB T xt
C D 3
0 1 0 2 0 3 0 4 0 5 0 6 0 7 0 8 00 .0x10 -00
1 .0x 1 0 0 6
2 .0x 1 0 0 6
3 .0x 1 0 0 6
D ays o f AB T xt
B 2 20 +
0 1 0 2 0 3 0 4 0 5 0 6 0 7 0 8 00 .0 x 10 -00
5 .0 x 1 0 05
1 .0 x 1 0 06
1 .5 x 1 0 06
D ays of AB T xt
M a c s
0 10 20 30 40 50 60 70 800 .0 x10 -0 0
1 .0x10 0 5
2 .0x10 0 5
3 .0x10 0 5
D ays o f AB Txt
Neutro phils
0 10 2 0 3 0 40 5 0 6 0 70 8 00.0x10 - 0 0
1 .0 x10 0 5
2 .0 x10 0 5
3 .0 x10 0 5
D ays of AB Txt
Figure 49. Cellular infiltrate in the lungs of chronically infected mice treated with antibiotics.
171

Antibiotic treatment reduced the bacterial burdens in the anti-TNF Ab treatment group
and the IgG treatment group, eliminating the morbidity of the anti-TNF Ab treated mice.
Unfortunately due to the reduced bacterial burden and the decreasing cellular infiltrate in the
lungs, the pathological changes usually observed with antibiotic/anti-TNF Ab treatment were
transient and not as profound. The antibiotic/anti-TNF treated mice cleared the bacteria more
slowly than the antibiotic/IgG treated mice therefore there were still differences in bacterial
burden at 14 days post infection. Therefore using this method did not eliminate the variable of
bacterial burden differences.
172

APPENDIX C
C.0 mRNA expression of extracellular matrix proteins and adhesion molecules during M. tuberculosis infection.
C.1 Introduction.
TNF is clearly required for granuloma formation and control of tuberculosis infection.
This study was performed to address other molecules and processes in granuloma formation and
cell migration that might be influenced by TNF during infection. The two major groups of
molecules that were addressed include adhesion molecules and matrix metalloproteinases.
The process of cell migration and cellular infiltration is mediated in part through the
interaction of cells with cellular adhesion molecules. As leukocytes migrate through blood
vessels they are only slightly tethered to the vessel walls. This interaction is through a group of
molecules called selectins, which bind to carbohydrate moieties on the leukocytes. Subsequently
firm adhesion and transmigration is mediated through another group of molecules, cellular
adhesion molecules (such as VCAM, ICAM, or PECAM). Another critical component to cell
transmigration is chemokine expression and gradient formation. The gradient can directly
influence cell migration by inducing cytoskeletal changes and upregulate the adhesion
expression, avidity and affinity inducing firm adhesion.
Cell infiltration and tissue reconstruction can be influenced my matrix
metalloproteinases. There is some evidence that TNF may affect the expression of MMP-2 and
MMP-9.
173

C.2 Materials and Methods.
Animals. C57BL/6 female mice (Charles River, Rockland, Mass.) 8-14 weeks old were used in
all experiments. All infected mice were maintained in the BSL3 animal laboratories and
routinely monitored for murine pathogens by means of serological and histological examinations.
The University Institutional Animal Care and Use Committee approved all animal protocols
employed in this study.
Chemicals, antibodies and reagents. All chemicals were purchased from Sigma Chemical Co.
(St. Louis, MO.) unless otherwise noted. Middlebrook 7H9 liquid medium and 7H10 agar were
obtained from Difco Laboratories (Detroit, MI). The cell lines, MP6XT-22 (anti-TNF) and was
obtained from DNAX and used to generate ascites (Harlan Bioproducts, Indianapolis,IN).
Antibodies were purified endotoxin free from ascites fluid as previously described [106] and
mice were treated with antibody intravenously every three days (0.5mg/dose) starting 4 months
post infection. Control mice received normal rat IgG (Jackson Immunoresearch Laboratories
Inc.,West Grove, PA) with the same dosing regiment.
Mycobacteria and infection of mice. To prepare bacterial stock, M. tuberculosis strain Erdman
(Trudeau Institute, Saranac Lake, N.Y.) was used to infect mice, and then bacteria were
harvested from their lungs, expanded in 7H9 liquid medium and stored in aliquots at -80°C.
Mice were infected via the aerosol route using a nose-only exposure unit (InTox Products,
Albuquerque, N.M.), and exposed to M. tuberculosis (1 x 10⁷ CFU/ml in the nebulizer chamber)
for 20 minutes, followed by 5 minutes of air. This resulted in reproducible delivery of 50-100
viable CFU of M. tuberculosis as described previously [94], which was confirmed by CFU
determination on the lungs of 2-3 mice 1 day post-infection. In acute experiments where a
higher inoculum was used, the concentration of M. tuberculosis in the nebulizer was increased,
and day 1 CFU were determined in the lungs. The tissue bacillary load was quantified by plating
174

serial dilutions of the lung, liver, and spleen homogenates onto 7H10 agar as described
previously [30].
RNA Isolation. RNA was isolated from the lung or cells using the TRIZOL isolation protocol
with slight modifications. The lung was homogenized in 3ml (cells were lysed in 1ml TRIZOL/
2x10⁶ cells) of TRIZOL reagent and then two chloroform extractions were performed.
Following an isopropanol precipitation, the RNA was washed with 70% ethanol and treated with
RNase Inhibitor (Applied Biosystems, Foster City, CA) for 45 minutes. Following complete
resuspension of the RNA at 65° C for 15 minutes the RNA was cleaned and DNase digested
using the Qiagen RNA isolation kit, as directed by the manufacturer (Qiagen Inc., Valencia,
CA).
GEArray Q series KIT. Total RNA was used as the template for 32-P labeled cDNA probe
synthesis using the following procedure. 5µg of RNA was combined with the GEAprimer Mix
(Buffer A, SuperArray, Bethesda, MD) and heated to 70C for 3 minutes and then transferred to
42C for 2 minutes. The labeling mix( GEA labeling buffer, 3µCi 32P dCTP, RNase Inhibitor,
Reverse Transcriptase, RNase-free H20) was prepared as described by the manufacturer. The
mRNA was reverse transcribed and labeled for 25 minutes at 42C. The reaction was stopped
through addition of Buffer C and then the probe was denatured. The labeled cDNA was added to
hybridization mix and exposed to a prehybridized filter array O/N with continuous agitation at
60C, as described by the manufacturer. The filters were then washed in multiple changes of
wash solution (2X SCC, 1% SDS). The filters were then exposed to X-ray film for 24 hours and
48 hours. Analysis was performed using the manufacturer’s instructions. In short, the X-ray
film was scanned and then a raw data file extracted using the suggested software (Scanalyze by
Michael Eisen).
175

C.3 Results and Discussion.
Chronically infected mice were treated with either anti-TNF Ab or IgG at 4 months post
infection. At 3, 6, 9, and 12 days after antibody treatments began, RNA was isolated from the
lungs and used in the GEArray, filter array technology by SuperArray Inc. This array allowed us
to address the mRNA expression through use of a cDNA radiolabelled probe. The results of the
array are presented in Figure 50,Figure 51, and Figure 52. Figure 50 shows the graphs on the
immunoglobulin superfamily, cadherin and catenin adhesion molecules. Figure 51 shows the
graphs of the integrin adhesion molecules. Figure 52 shows the data generated on the matrix
metalloproteinase expression.
Catna 2
Day 0 Day 3 Day 6 Day 9 Day 12-1
0
1
2
3
4
5MP6IgG
Catna 2
Rat
io in
fect
ed/u
ninf
ecte
d
Catnal 1
Day 0 Day 3 Day 6 Day 9 Day 120
1
2
3
4
5MP6IgG
Catnal 1
Rat
io in
fect
ed/u
ninf
ecte
d
CD44
Day 0 Day 3 Day 6 Day 9 Day 120.0
0.5
1.0
1.5MP6IgG
CD44
Rat
io in
fect
ed/u
ninf
ecte
d
E-Cadherin
Day 0 Day 3 Day 6 Day 9 Day 120.0
2.5
5.0
7.5MP6IgG
E-Cadherin
Rat
io in
fect
ed/u
ninf
ecte
d
Cadherin 2
Day 0 Day3 Day 6 Day 9 Day 12-2.5
0.0
2.5
5.0
7.5MP6IgG
Cadherin 2
Rat
io in
fect
ed/u
ninf
ecte
d
Cadherin 3
Day 0 Day 3 Day 6 Day 9 Day 12-5
0
5
10MP6IgG
Cadherin 3
Rat
io in
fect
ed/u
ninf
ecte
d
Ncam2
Day 0 Day 3 Day 6 Day 9 Day 120
1
2
3
4MP6IgG
Ncam2
Rat
io in
fect
ed/u
ninf
ecte
d
Lselectin
Day 0 Day 3 Day 6 Day 9 Day 120
1
2
3
4
5MP6IgG
L Selectin
Rat
io in
fect
ed/u
ninf
ecte
d
P Selectin
Day 0 Day 3 Day 6 Day 9 Day 120
1
2MP6IgG
P Selectin
Rat
io in
fect
ed/u
ninf
ecte
d
Figure 50. Cell Adhesion Molecules (Ig Superfamily, Cadherins and Catenins, Selectins).
176

Expression of cell adhesion molecule mRNAs was determined using the GEArray Mouse Extracellular Matrix and Adhesion Molecule Gene Array. The graph represents the ratio of the expression of the sample of interest over uninfected.
CD61
Day 0 Day 3 Day 6 Day 9 Day 12-1
0
1
2
3
4
5MP6IgG
CD61
Rat
io in
fect
ed/u
ninf
ecte
d
Int beta 4
Day 0 Day 3 Day 6 Day 9 Day 120.0
0.5
1.0
1.5MP6IgG
Int beta 4
Rat
io in
fect
ed/u
ninf
ecte
d
int beta 5
Day 0 Day 3 Day 6 Day 9 Day 120
1
2
3MP6IgG
int beta 5
Rat
io in
fect
ed/u
ninf
ecte
dIntegrin β1
int alpha 2b
Day 0 Day 3 Day 6 Day 9 Day 120
1
2MP6IgG
Int alpha 2b
Rat
io in
fect
ed/u
ninf
ecte
d
int alpha 3
Day 0 Day 3 Day 6 Day 9 Day 120
10
20
30
40MP6IgG
Int alpha 3
Rat
io in
fect
ed/u
ninf
ecte
d
Int alpha 5
Day 0 Day 3 Day 6 Day 9 Day 12-1
0
1
2
3
4
5MP6IgG
Int alpha 5
Rat
io in
fect
ed/u
ninf
ecte
d
int alpha 7
Day 0 Day 3 Day 6 Day 9 Day 120
1
2
3
4
5MP6IgG
Int alpha 7
Rat
io in
fect
ed/u
ninf
ecte
d
Int alpha V
Day 0 Day 3 Day 6 Day 9 Day 12-2.5
0.0
2.5
5.0
7.5MP6IgG
Int alpha V
Rat
io in
fect
ed/u
ninf
ecte
d
Figure 51. Cell adhesion Molecules (Integrins).
Expression of cell adhesion molecule mRNAs was determined using the GEArray Mouse Extracellular Matrix and Adhesion Molecule Gene Array. The graph represents the ratio of the expression of the sample of interest over uninfected.
177

Adamst8
Day 0 Day3 Day 6 Day 9 Day 12-7.5
-5.0
-2.5
0.0
2.5
5.0MP6IgG
Adamst8
Rat
io in
fect
ed/u
ninf
ecte
d MMP23
Day 0 Day 3 Day 6 Day 9 Day 120
1
2
3
4MP6IgG
Rat
io in
fect
ed/u
ninf
ecte
d
MMP7
Day 0 Day 3 Day 6 Day 9 Day 120
1
2MP6IgG
MMP7
Rat
io in
fect
ed/u
ninf
ecte
d
MMP 15
Day 0 Day 3 Day 6 Day 9 Day 12-1
0
1
2
3
4
5MP6IgG
MMP 15
Rat
io in
fect
ed/u
ninf
ecte
d
MMP 16
Day 0 Day 3 Day 6 Day 9 Day 12-1
0
1
2MP6IgG
MMP 16
Rat
io in
fect
ed/u
ninf
ecte
d
Gelatinase A
Day 0 Day 3 Day 6 Day 9 Day 12-5
0
5
10MP6IgG
Gelatinase A
Rat
io in
fect
ed/u
ninf
ecte
d (MMP2)
MT1-MMP
Day 0 Day 3 Day 6 Day 9 Day 12-2.5
0.0
2.5
5.0MP6IgG
MT1-MMP
Rat
io in
fect
ed/u
ninf
ecte
d
Figure 52. Matrix Metalloproteinases.
Expression of cell adhesion molecule mRNAs was determined using the GEArray Mouse Extracellular Matrix and Adhesion Molecule Gene Array. The graph represents the ratio of the expression of the sample of interest over uninfected.
Expression of many adhesion molecules was different between the MP6 treated and IgG
treated mice. Unfortunately within a chronic infection, especially within the IgG treated mice,
we did not expect to see such variation. This variability indicates that the assay may be fairly
sensitive, but the data analysis procedure must be considered carefully because if both a gene has
expression less than background in both the uninfected sample and in the true sample, a false
positive value will be generated. In addition, the mRNA analysis performed here can only be a
first step when addressing whether these changes in mRNA expression translate to changes in
178

protein production, and consequently have functional consequences. In addition matrix
metalloproteinases are highly post transcriptionally regulated.
In conclusion, our analysis of extracellular matrix and adhesion molecules did not
revealed any stricking differences between MP6 treated and IgG treated mice. Even when
differences were detected between the groups of mice, there was often increased or decreased
expression in the IgG treated mice compared to other time points. Further analysis to address the
protein expression of the proteins is necessary to draw any conclusion as to how TNF affects the
expression of these molecules.
179

BIBLIOGRAPHY 1. Agger, E.M. and P. Andersen, A novel TB vaccine; towards a strategy based on our
understanding of BCG failure. Vaccine., 2002. 21(1-2): p. 7-14. 2. World Health Organization, Global Tuberculosis Control: Surveillance, Planning,
Financing. WHO Report 2003. 2003, World Health Organization: Geneva, Switzerland. 3. Corbett, E.L., et al., The growing burden of tuberculosis: global trends and interactions
with the HIV epidemic. Archives of Internal Medicine., 2003. 163(9): p. 1009-21. 4. Center for Disease Control, Trends in Tuberculosis Morbidity ---United States, 1992--
2002. Morbidity and Mortality Weekly Report. 2003, Center for Disease Control: Atlanta. p. 217-222.
5. Styblo, K., Recent advances in epidemiological research in tuberculosis. Advances in Tuberculosis Research., 1980. 20: p. 1-63.
6. Tufariello, J.M., J. Chan, and J.L. Flynn, Latent tuberculosis: mechanisms of host and bacillus that contribute to persistent infection. The Lancet Infectious Diseases., 2003. 3(9): p. 578-90.
7. Caruso, A.M., et al., Mice deficient in CD4 T cells have only transiently diminished levels of IFN-gamma, yet succumb to tuberculosis. Journal of Immunology., 1999. 162(9): p. 5407-16.
8. Scanga, C.A., et al., Depletion of CD4(+) T cells causes reactivation of murine persistent tuberculosis despite continued expression of interferon gamma and nitric oxide synthase 2. Journal of Experimental Medicine., 2000. 192(3): p. 347-58.
9. Saunders, B.M., et al., CD4 is required for the development of a protective granulomatous response to pulmonary tuberculosis. Cellular Immunology., 2002. 216(1-2): p. 65-72.
10. Serbina, N.V., V. Lazarevic, and J.L. Flynn, CD4(+) T cells are required for the development of cytotoxic CD8(+) T cells during Mycobacterium tuberculosis infection. Journal of Immunology, 2001. 167(12): p. 6991-7000.
11. Barnes, P.F., D.L. Lakey, and W.J. Burman, Tuberculosis in Patients with HIV Infection. Infectious Disease Clinics of North America, 2002. 16(1): p. 353-362.
12. Wagner, K.R. and W.R. Bishai, Issues in the treatment of M. tuberculosis in patients with human immunodeficiency virus infection. AIDS, 2001. 15(suppl 5): p. S203-S212.
13. Janicki, B.W., et al., Immune responses in rhesus monkeys after bacillus Calmette-Guerin vaccination and aerosol challenge with Mycobacterium tuberculosis. American Review of Respiratory Disease., 1973. 107(3): p. 359-66.
14. Chaparas, S.D., R.C. Good, and B.W. Janicki, Tuberculin-induced lymphocyte transformation and skin reactivity in monkeys vaccinated or not vaccinated with Bacille Calmette-Guerin, then challenged with virulent Mycobacterium tuberculosis. American Review of Respiratory Disease., 1975. 112(1): p. 43-7.
15. Barclay, W.R., et al., Protection of monkeys against airborne tuberculosis by aerosol vaccination with bacillus Calmette-Guerin. American Review of Respiratory Disease., 1973. 107(3): p. 351-8.
180

16. Good, R.C., Diseases in Nonhuman Primates, in The Mycobacteria: a Sourcebook. 1984, Wayne Kubica. p. 903-921.
17. Capuano III, S.V., et al., Experimental Mycobacterium tuberculosis infection of cynomolgus macaques closely resembles the various manifestations of human M. tuberculosis infection. Infect. Immun., 2003. in press.
18. McMurray, D.N., Disease model: pulmonary tuberculosis. Trends in Molecular Medicine., 2001. 7(3): p. 135-7.
19. Allen, S.S. and D.N. McMurray, Coordinate cytokine gene expression in vivo following induction of tuberculous pleurisy in guinea pigs. Infection & Immunity., 2003. 71(8): p. 4271-7.
20. Jeevan, A., et al., Effect of Mycobacterium bovis BCG vaccination on interleukin-1 beta and RANTES mRNA expression in guinea pig cells exposed to attenuated and virulent mycobacteria. Infection & Immunity., 2002. 70(3): p. 1245-53.
21. Jeevan, A., et al., Differential expression of gamma interferon mRNA induced by attenuated and virulent Mycobacterium tuberculosis in guinea pig cells after Mycobacterium bovis BCG vaccination. Infection & Immunity., 2003. 71(1): p. 354-64.
22. Lyons, M.J., T. Yoshimura, and D.N. McMurray, Mycobacterium bovis BCG vaccination augments interleukin-8 mRNA expression and protein production in guinea pig alveolar macrophages infected with Mycobacterium tuberculosis. Infection & Immunity., 2002. 70(10): p. 5471-8.
23. Flynn, J.L. and J. Chan, Immunology of tuberculosis. Annual Review of Immunology., 2001. 19: p. 93-129.
24. Collins, F.M., Immunolgy of Tuberculosis. American Review of Respiratory Disease., 1982. 125: p. S42-S49.
25. Medina, E. and R. North, Genetic susceptible mice remain proportionally more susceptible to tuberculosis after vaccination. Immunology, 1999. 96: p. 16-21.
26. Gonzalez-Juarrero, M., et al., Temporal and spatial arrangement of lymphocytes within lung granulomas induced by aerosol infection with Mycobacterium tuberculosis. Infection & Immunity., 2001. 69(3): p. 1722-8.
27. Flynn, J.L. and J. Chan, Tuberculosis: latency and reactivation. Infection & Immunity., 2001. 69(7): p. 4195-201.
28. McCune, R.M., F.M. Feldmann, and W. McDermott, Microbial persistence. II. Characteristics of the sterile state of tubercle bacilli. Journal of Experimental Medicine., 1966. 123(3): p. 469-86.
29. McCune, R.M., et al., Microbial persistence. I. The capacity of tubercle bacilli to survive sterilization in mouse tissues. Journal of Experimental Medicine., 1966. 123(3): p. 445-68.
30. Scanga, C.A., et al., Reactivation of latent tuberculosis: variations on the Cornell murine model. Infection & Immunity., 1999. 67(9): p. 4531-8.
31. Ernst, J.D., Macrophage receptors for Mycobacterium tuberculosis. Infection & Immunity., 1998. 66(4): p. 1277-81.
32. Aderem, A. and D.M. Underhill, Mechanisms of phagocytosis in macrophages. Annual Review of Immunology., 1999. 17: p. 593-623.
33. Kang, B.K. and L.S. Schlesinger, Characterization of mannose receptor-dependent phagocytosis mediated by Mycobacterium tuberculosis lipoarabinomannan. Infection & Immunity., 1998. 66(6): p. 2769-77.
181

34. Leemans, J.C., et al., CD44 is a macrophage binding site for Mycobacterium tuberculosis that mediates macrophage recruitment and protective immunity against tuberculosis. Journal of Clinical Investigation., 2003. 111(5): p. 681-9.
35. Melo, M.D., et al., Utilization of CD11b knockout mice to characterize the role of complement receptor 3 (CR3, CD11b/CD18) in the growth of Mycobacterium tuberculosis in macrophages. Cellular Immunology., 2000. 205(1): p. 13-23.
36. Hu, C., et al., Mycobacterium tuberculosis infection in complement receptor 3-deficient mice. Journal of Immunology., 2000. 165(5): p. 2596-602.
37. Zimmerli, S., S. Edwards, and J.D. Ernst, Selective receptor blockade during phagocytosis does not alter the survival and growth of Mycobacterium tuberculosis in human macrophages. American Journal of Respiratory Cell & Molecular Biology., 1996. 15(6): p. 760-70.
38. Velasco-Velazquez, M.A., et al., Macrophage--Mycobacterium tuberculosis interactions: role of complement receptor 3. Microbial Pathogenesis., 2003. 35(3): p. 125-31.
39. Stokes, R.W., et al., Mycobacteria-macrophage interactions. Macrophage phenotype determines the nonopsonic binding of Mycobacterium tuberculosis to murine macrophages. Journal of Immunology., 1993. 151(12): p. 7067-76.
40. Schlesinger, L.S., et al., Differences in mannose receptor-mediated uptake of lipoarabinomannan from virulent and attenuated strains of Mycobacterium tuberculosis by human macrophages. Journal of Immunology., 1996. 157(10): p. 4568-75.
41. Tailleux, L., et al., DC-SIGN is the major Mycobacterium tuberculosis receptor on human dendritic cells.[comment]. Journal of Experimental Medicine., 2003. 197(1): p. 121-7.
42. Reddy, V.M. and D.A. Hayworth, Interaction of Mycobacterium tuberculosis with human respiratory epithelial cells (HEp-2). Tuberculosis., 2002. 82(1): p. 31-6.
43. Leemans, J.C., et al., Depletion of alveolar macrophages exerts protective effects in pulmonary tuberculosis in mice. Journal of Immunology., 2001. 166(7): p. 4604-11.
44. Ferrari, G., et al., A coat protein on phagosomes involved in the intracellular survival of mycobacteria. Cell., 1999. 97(4): p. 435-47.
45. Deretic, V. and R.A. Fratti, Mycobacterium tuberculosis phagosome. Molecular Microbiology., 1999. 31(6): p. 1603-9.
46. Stenger, S., et al., Differential effects of cytolytic T cell subsets on intracellular infection. Science., 1997. 276(5319): p. 1684-7.
47. Heldwein, K.A. and M.J. Fenton, The role of Toll-like receptors in immunity against mycobacterial infection. Microbes & Infection., 2002. 4(9): p. 937-44.
48. Medvedev, A.E., et al., Induction of tolerance to lipopolysaccharide and mycobacterial components in Chinese hamster ovary/CD14 cells is not affected by overexpression of Toll-like receptors 2 or 4. Journal of Immunology., 2001. 167(4): p. 2257-67.
49. Gehring, A.J., et al., The Mycobacterium tuberculosis 19-kilodalton lipoprotein inhibits gamma interferon-regulated HLA-DR and Fc gamma R1 on human macrophages through Toll-like receptor 2. Infection & Immunity., 2003. 71(8): p. 4487-97.
50. Noss, E.H., et al., Toll-like receptor 2-dependent inhibition of macrophage class II MHC expression and antigen processing by 19-kDa lipoprotein of Mycobacterium tuberculosis. Journal of Immunology., 2001. 167(2): p. 910-8.
182

51. Pai, R.K., et al., Inhibition of IFN-gamma-induced class II transactivator expression by a 19-kDa lipoprotein from Mycobacterium tuberculosis: a potential mechanism for immune evasion. Journal of Immunology., 2003. 171(1): p. 175-84.
52. Lopez, M., et al., The 19-kDa Mycobacterium tuberculosis protein induces macrophage apoptosis through Toll-like receptor-2. Journal of Immunology., 2003. 170(5): p. 2409-16.
53. Means, T.K., et al., Differential effects of a Toll-like receptor antagonist on Mycobacterium tuberculosis-induced macrophage responses. Journal of Immunology., 2001. 166(6): p. 4074-82.
54. Underhill, D.M., et al., Toll-like receptor-2 mediates mycobacteria-induced proinflammatory signaling in macrophages. Proceedings of the National Academy of Sciences of the United States of America., 1999. 96(25): p. 14459-63.
55. Brightbill, H.D., et al., Host defense mechanisms triggered by microbial lipoproteins through toll-like receptors. Science., 1999. 285(5428): p. 732-6.
56. Reiling, N., et al., Cutting edge: Toll-like receptor (TLR)2- and TLR4-mediated pathogen recognition in resistance to airborne infection with Mycobacterium tuberculosis. Journal of Immunology., 2002. 169(7): p. 3480-4.
57. Abel, B., et al., Toll-like receptor 4 expression is required to control chronic Mycobacterium tuberculosis infection in mice. Journal of Immunology., 2002. 169(6): p. 3155-62.
58. Pedrosa, J., et al., Neutrophils play a protective nonphagocytic role in systemic Mycobacterium tuberculosis infection of mice. Infection & Immunity, 2000. 68(2): p. 577-83.
59. Chackerian, A.A., et al., Dissemination of Mycobacterium tuberculosis is influenced by host factors and precedes the initiation of T-cell immunity. Infection & Immunity., 2002. 70(8): p. 4501-9.
60. Gonzalez-Juarrero, M. and I.M. Orme, Characterization of murine lung dendritic cells infected with Mycobacterium tuberculosis. Infection & Immunity., 2001. 69(2): p. 1127-33.
61. Ehlers, S., et al., Lethal granuloma disintegration in mycobacteria-infected TNFRp55-/- mice is dependent on T cells and IL-12. Journal of Immunology, 2000. 165(1): p. 483-92.
62. Peters, W., et al., Chemokine receptor 2 serves an early and essential role in resistance to Mycobacterium tuberculosis. Proceedings of the National Academy of Sciences of the United States of America., 2001. 98(14): p. 7958-63.
63. Scott, H.M. and J.L. Flynn, Mycobacterium tuberculosis in chemokine receptor 2-deficient mice: influence of dose on disease progression. Infection & Immunity., 2002. 70(11): p. 5946-54.
64. Flynn, J.L., et al., An essential role for interferon gamma in resistance to Mycobacterium tuberculosis infection. Journal of Experimental Medicine, 1993. 178(6): p. 2249-54.
65. North, R.J., Mice incapable of making IL-4 or IL-10 display normal resistance to infection with Mycobacterium tuberculosis. Clinical & Experimental Immunology., 1998. 113(1): p. 55-8.
66. Cooper, A.M., et al., Interleukin 12 (IL-12) is crucial to the development of protective immunity in mice intravenously infected with mycobacterium tuberculosis. Journal of Experimental Medicine., 1997. 186(1): p. 39-45.
183

67. Cooper, A.M., et al., Mice lacking bioactive IL-12 can generate protective, antigen-specific cellular responses to mycobacterial infection only if the IL-12 p40 subunit is present. Journal of Immunology., 2002. 168(3): p. 1322-7.
68. Ladel, C.H., et al., Lethal tuberculosis in interleukin-6-deficient mutant mice. Infection & Immunity., 1997. 65(11): p. 4843-9.
69. Flynn, J.L., et al., Major histocompatibility complex class I-restricted T cells are required for resistance to Mycobacterium tuberculosis infection. Proceedings of the National Academy of Sciences of the United States of America., 1992. 89(24): p. 12013-7.
70. Bosio, C.M., D. Gardner, and K.L. Elkins, Infection of B cell-deficient mice with CDC 1551, a clinical isolate of Mycobacterium tuberculosis: delay in dissemination and development of lung pathology. Journal of Immunology., 2000. 164(12): p. 6417-25.
71. Cooper, A.M., et al., Expression of the nitric oxide synthase 2 gene is not essential for early control of Mycobacterium tuberculosis in the murine lung. Infection & Immunity, 2000. 68(12): p. 6879-82.
72. Seiler, P., et al., Early granuloma formation after aerosol Mycobacterium tuberculosis infection is regulated by neutrophils via CXCR3-signaling chemokines. European Journal of Immunology, 2003. 33(10): p. 2676-86.
73. Kipnis, A., et al., Role of chemokine ligand 2 in the protective response to early murine pulmonary tuberculosis. Immunology., 2003. 109(4): p. 547-51.
74. Boros, D.L., T helper cell populations, cytokine dynamics, and pathology of the schistosome egg granuloma. Microbes & Infection., 1999. 1(7): p. 511-6.
75. Palma, G.I. and N.G. Saravia, In situ characterization of the human host response to Leishmania panamensis. American Journal of Dermatopathology., 1997. 19(6): p. 585-90.
76. Reyes-Flores, O., Granulomas induced by living agents. International Journal of Dermatology., 1986. 25(3): p. 158-65.
77. Rumbley, C.A. and S.M. Phillips, The schistosome granuloma: an immunoregulatory organelle. Microbes & Infection., 1999. 1(7): p. 499-504.
78. Modlin, R.L., et al., Learning from lesions: patterns of tissue inflammation in leprosy. Proceedings of the National Academy of Sciences of the United States of America., 1988. 85(4): p. 1213-7.
79. Pulendran, B., K. Palucka, and J. Banchereau, Sensing pathogens and tuning immune responses. Science., 2001. 293(5528): p. 253-6.
80. Hickman, S.P., J. Chan, and P. Salgame, Mycobacterium tuberculosis induces differential cytokine production from dendritic cells and macrophages with divergent effects on naive T cell polarization. Journal of Immunology., 2002. 168(9): p. 4636-42.
81. Tascon, R.E., et al., Protection against Mycobacterium tuberculosis infection by CD8+ T cells requires the production of gamma interferon. Infection & Immunity., 1998. 66(2): p. 830-4.
82. Bodnar, K.A., N.V. Serbina, and J.L. Flynn, Fate of Mycobacterium tuberculosis within murine dendritic cells. Infection & Immunity., 2001. 69(2): p. 800-9.
83. Lande, R., et al., IFN-alpha beta released by Mycobacterium tuberculosis-infected human dendritic cells induces the expression of CXCL10: selective recruitment of NK and activated T cells. Journal of Immunology., 2003. 170(3): p. 1174-82.
184
84. Yu, K., et al., Toxicity of nitrogen oxides and related oxidants on mycobacteria: M. tuberculosis is resistant to peroxynitrite anion. Tubercle & Lung Disease, 1999. 79(4): p. 191-8.
85. Tailleux, L., et al., Constrained intracellular survival of Mycobacterium tuberculosis in human dendritic cells. Journal of Immunology., 2003. 170(4): p. 1939-48.
86. Uehira, K., et al., Dendritic cells are decreased in blood and accumulated in granuloma in tuberculosis. Clinical Immunology., 2002. 105(3): p. 296-303.
87. Scanga, C.A., et al., The inducible nitric oxide synthase locus confers protection against aerogenic challenge of both clinical and laboratory strains of Mycobacterium tuberculosis in mice. Infection & Immunity, 2001. 69(12): p. 7711-7.
88. Nagabhushanam, V., et al., Innate Inhibition of Adaptive Immunity: Mycobacterium tuberculosis- Induced IL-6 Inhibits Macrophage Responses to IFN-gamma. Journal of Immunology, 2003. 171: p. 4750-4757.
89. Ulrichs, T., et al., T-cell responses to CD1-presented lipid antigens in humans with Mycobacterium tuberculosis infection. Infection & Immunity., 2003. 71(6): p. 3076-87.
90. Canaday, D.H., et al., CD4(+) and CD8(+) T cells kill intracellular Mycobacterium tuberculosis by a perforin and Fas/Fas ligand-independent mechanism. Journal of Immunology., 2001. 167(5): p. 2734-42.
91. Turner, J., et al., CD8- and CD95/95L-dependent mechanisms of resistance in mice with chronic pulmonary tuberculosis. American Journal of Respiratory Cell & Molecular Biology., 2001. 24(2): p. 203-9.
92. Behar, S.M., et al., Susceptibility of mice deficient in CD1D or TAP1 to infection with Mycobacterium tuberculosis. Journal of Experimental Medicine., 1999. 189(12): p. 1973-80.
93. Dieli, F., et al., Granulysin-dependent killing of intracellular and extracellular Mycobacterium tuberculosis by Vgamma9/Vdelta2 T lymphocytes. Journal of Infectious Diseases., 2001. 184(8): p. 1082-5.
94. Serbina, N.V., et al., CD8+ CTL from lungs of Mycobacterium tuberculosis-infected mice express perforin in vivo and lyse infected macrophages. Journal of Immunology., 2000. 165(1): p. 353-63.
95. Serbina, N.V. and J.L. Flynn, Early emergence of CD8(+) T cells primed for production of type 1 cytokines in the lungs of Mycobacterium tuberculosis-infected mice. Infection & Immunity., 1999. 67(8): p. 3980-8.
96. Turner, J., et al., The progression of chronic tuberculosis in the mouse does not require the participation of B lymphocytes or interleukin-4. Experimental Gerontology., 2001. 36(3): p. 537-45.
97. Vordermeier, H.M., et al., Increase of tuberculous infection in the organs of B cell-deficient mice. Clinical & Experimental Immunology., 1996. 106(2): p. 312-6.
98. Cooper, A.M., et al., Disseminated tuberculosis in interferon gamma gene-disrupted mice. Journal of Experimental Medicine, 1993. 178(6): p. 2243-7.
99. Ottenhof, T.H., D. Kumararatne, J. L. Casanova, Novel human immunodeficiencies reveal the essential role of type-1 cytokines in immunity to intracellular bacteria. Immunol. Today, 1998. 19: p. 491-4.
100. Pearl, J.E., et al., Inflammation and lymphocyte activation during mycobacterial infection in the interferon-gamma-deficient mouse. Cellular Immunology, 2001. 211(1): p. 43-50.
185
101. Flynn, J.L., et al., Tumor necrosis factor-alpha is required in the protective immune response against Mycobacterium tuberculosis in mice. Immunity, 1995. 2(6): p. 561-72.
102. Ehlers, S., et al., Fatal granuloma necrosis without exacerbated mycobacterial growth in tumor necrosis factor receptor p55 gene-deficient mice intravenously infected with Mycobacterium avium. Infection & Immunity, 1999. 67(7): p. 3571-9.
103. Bean, A.G., et al., Structural deficiencies in granuloma formation in TNF gene-targeted mice underlie the heightened susceptibility to aerosol Mycobacterium tuberculosis infection, which is not compensated for by lymphotoxin. Journal of Immunology, 1999. 162(6): p. 3504-11.
104. Keane, J., et al., Tuberculosis associated with infliximab, a tumor necrosis factor alpha-neutralizing agent. New England Journal of Medicine, 2001. 345(15): p. 1098-104.
105. Gardam, M.A., et al., Anti-tumour necrosis factor agents and tuberculosis risk: mechanisms of action and clinical management.[comment]. The Lancet Infectious Diseases., 2003. 3(3): p. 148-55.
106. Mohan, V.P., et al., Effects of tumor necrosis factor alpha on host immune response in chronic persistent tuberculosis: possible role for limiting pathology. Infection & Immunity, 2001. 69(3): p. 1847-55.
107. Turner, J., et al., In vivo IL-10 production reactivates chronic pulmonary tuberculosis in C57BL/6 mice. Journal of Immunology., 2002. 169(11): p. 6343-51.
108. Murray, P.J., et al., T cell-derived IL-10 antagonizes macrophage function in mycobacterial infection. Journal of Immunology., 1997. 158(1): p. 315-21.
109. Roach, D.R., et al., Endogenous inhibition of antimycobacterial immunity by IL-10 varies between mycobacterial species. Scandinavian Journal of Immunology., 2001. 54(1-2): p. 163-70.
110. Jacobs, M., et al., Enhanced immune response in Mycobacterium bovis bacille calmette guerin (BCG)-infected IL-10-deficient mice. Clinical Chemistry & Laboratory Medicine., 2002. 40(9): p. 893-902.
111. Rolph, M.S., et al., MHC class Ia-restricted T cells partially account for beta2-microglobulin-dependent resistance to Mycobacterium tuberculosis. European Journal of Immunology., 2001. 31(6): p. 1944-9.
112. D'Souza, C.D., et al., An anti-inflammatory role for gamma delta T lymphocytes in acquired immunity to Mycobacterium tuberculosis. Journal of Immunology., 1997. 158(3): p. 1217-21.
113. North, R.J. and A.A. Izzo, Granuloma formation in severe combined immunodeficient (SCID) mice in response to progressive BCG infection. Tendency not to form granulomas in the lung is associated with faster bacterial growth in this organ. American Journal of Pathology., 1993. 142(6): p. 1959-66.
114. Gutierrex-Ramos, J.C., et al., Non-redundant functional groups of chemokines operate in a coordinate manner during the inflammatory response in the lung. Immunological Reviews., 2000. 177: p. 31-42.
115. Allavena, P., et al., The chemokine receptor switch paradigm and dendritic cell migration: its significance in tumor tissues. Immunological Reviews., 2000. 177: p. 141-9.
116. Sallusto, F., C.R. Mackay, and A. Lanzavecchia, The role of chemokine receptors in primary, effector, and memory immune responses. Annual Review of Immunology., 2000. 18: p. 593-620.
186
117. Sallusto, F., et al., Functional subsets of memory T cells identified by CCR7 expression. Current Topics in Microbiology & Immunology., 2000. 251: p. 167-71.
118. Kurihara, T. and R. Bravo, Cloning and functional expression of mCCR2, a murine receptor for the C-C chemokines JE and FIC. Journal of Biological Chemistry, 1996. 271(20): p. 11603-7.
119. Farber, J.M., Mig and IP-10: CXC chemokines that target lymphocytes. Journal of Leukocyte Biology., 1997. 61(3): p. 246-57.
120. Park, M.K., et al., The CXC chemokine murine monokine induced by IFN-gamma (CXC chemokine ligand 9) is made by APCs, targets lymphocytes including activated B cells, and supports antibody responses to a bacterial pathogen in vivo. Journal of Immunology., 2002. 169(3): p. 1433-43.
121. Rossi, D. and A. Zlotnik, The biology of chemokines and their receptors. Annual Review of Immunology, 2000. 18(217-242).
122. Josse, C., et al., Importance of post-transcriptional regulation of chemokine genes by oxidative stress. Biochemistry Journal, 2001. 360: p. 321-333.
123. Jaramillo, M. and M. Olivier, Hydrogen Peroxide Induces Murine Macrophage Chemokine Gene Transcription Via Extracellular Signal -Regulated Kinase and Cyclic Adenosine 5'- Monophosphate (cAMP)-Dependent Pathways: Involvement of NFkB, Activator Protein 1 and cAMP Response Element Binding Protein. Journal of Immunology, 2002. 169: p. 7026-7038.
124. Swanson, B.J., et al., RANTES production by Memory Phenotype T Cells Is Controlled by a Posttranscriptional, TCR-Dependent Process. Immunity, 2002. 17: p. 605-615.
125. Rhoades, E.R., A.M. Cooper, and I.M. Orme, Chemokine response in mice infected with Mycobacterium tuberculosis. Infection & Immunity., 1995. 63(10): p. 3871-7.
126. Sadek, M.I., et al., Chemokines induced by infection of mononuclear phagocytes with mycobacteria and present in lung alveoli during active pulmonary tuberculosis. American Journal of Respiratory Cell & Molecular Biology., 1998. 19(3): p. 513-21.
127. Saukkonen, J.J., et al., Beta-chemokines are induced by Mycobacterium tuberculosis and inhibit its growth. Infection & Immunity., 2002. 70(4): p. 1684-93.
128. Lin, Y., M. Zhang, and P.F. Barnes, Chemokine production by a human alveolar epithelial cell line in response to Mycobacterium tuberculosis. Infection & Immunity., 1998. 66(3): p. 1121-6.
129. Indrigo, J., R.L. Hunter, Jr., and J.K. Actor, Influence of trehalose 6,6'-dimycolate (TDM) during mycobacterial infection of bone marrow macrophages. Microbiology., 2002. 148(Pt 7): p. 1991-8.
130. Mohammed, K.A., et al., Mycobacterium-mediated chemokine expression in pleural mesothelial cells: role of C-C chemokines in tuberculous pleurisy. Journal of Infectious Diseases., 1998. 178(5): p. 1450-6.
131. Riedel, D.D. and S.H. Kaufmann, Chemokine secretion by human polymorphonuclear granulocytes after stimulation with Mycobacterium tuberculosis and lipoarabinomannan. Infection & Immunity., 1997. 65(11): p. 4620-3.
132. Sauty, A., et al., The T cell-specific CXC chemokines IP-10, Mig, and I-TAC are expressed by activated human bronchial epithelial cells. Journal of Immunology., 1999. 162(6): p. 3549-58.
187

133. Miotto, D., et al., Expression of IFN-gamma-inducible protein; monocyte chemotactic proteins 1, 3, and 4; and eotaxin in TH1- and TH2-mediated lung diseases. Journal of Allergy & Clinical Immunology., 2001. 107(4): p. 664-70.
134. Kurashima, K., et al., Elevated chemokine levels in bronchoalveolar lavage fluid of tuberculosis patients. American Journal of Respiratory & Critical Care Medicine., 1997. 155(4): p. 1474-7.
135. Mayanja-Kizza, H., et al., Activation of beta-chemokines and CCR5 in persons infected with human immunodeficiency virus type 1 and tuberculosis. Journal of Infectious Diseases., 2001. 183(12): p. 1801-4.
136. Juffermans, N.P., et al., Up-regulation of HIV coreceptors CXCR4 and CCR5 on CD4(+) T cells during human endotoxemia and after stimulation with (myco)bacterial antigens: the role of cytokines. Blood., 2000. 96(8): p. 2649-54.
137. Zhu, G., et al., Gene expression in the tuberculous granuloma: analysis by laser capture microdissection and real-time PCR. Cellular Microbiology., 2003. 5(7): p. 445-53.
138. Rojas, M., et al., TNF-alpha and IL-10 modulate the induction of apoptosis by virulent Mycobacterium tuberculosis in murine macrophages. Journal of Immunology., 1999. 162(10): p. 6122-31.
139. Balcewicz-Sablinska, M.K., et al., Pathogenic Mycobacterium tuberculosis evades apoptosis of host macrophages by release of TNF-R2, resulting in inactivation of TNF-alpha. Journal of Immunology., 1998. 161(5): p. 2636-41.
140. Gordon, S., Alternative activation of macrophages. Nature Reviews. Immunology., 2003. 3(1): p. 23-35.
141. Hodge-Dufour, J., et al., Inhibition of interferon gamma induced interleukin 12 production: a potential mechanism for the anti-inflammatory activities of tumor necrosis factor. Proceedings of the National Academy of Sciences of the United States of America., 1998. 95(23): p. 13806-11.
142. Botha, T. and B. Ryffel, Reactivation of latent tuberculosis infection in TNF-deficient mice. Journal of Immunology, 2003. 171(6): p. 3110-8.
143. Roach, D.R., et al., TNF regulates chemokine induction essential for cell recruitment, granuloma formation, and clearance of mycobacterial infection. Journal of Immunology., 2002. 168(9): p. 4620-7.
144. Pfeffer, K., et al., Mice deficient for the 55 kd tumor necrosis factor receptor are resistant to endotoxic shock, yet succumb to L. monocytogenes infection. Cell., 1993. 73(3): p. 457-67.
145. Curran, S., et al., Laser capture microscopy. Molecular Pathology., 2000. 53(2): p. 64-8. 146. Bermudez, L.E., et al., The efficiency of the translocation of Mycobacterium tuberculosis
across a bilayer of epithelial and endothelial cells as a model of the alveolar wall is a consequence of transport within mononuclear phagocytes and invasion of alveolar epithelial cells. Infection & Immunity., 2002. 70(1): p. 140-6.
147. Fuller, C.L., J. Flynn, and T.A. Reinhart, Abundant expression of pro-inflammatory chemokines and cytokines in pulmonary granulomas developing in cynomolgus macaques experimentally infected with Mycobacterium tuberculosis: an in situ study. Infect. Immun., 2003. in press.
148. Proost, P., et al., Amino-terminal truncation of CXCR3 agonists impairs receptor signaling and lymphocyte chemotaxis, while preserving antiangiogenic properties. Blood., 2001. 98(13): p. 3554-61.
188

149. Lambeir, A.M., et al., Kinetic investigation of chemokine truncation by CD26/dipeptidyl peptidase IV reveals a striking selectivity within the chemokine family. Journal of Biological Chemistry., 2001. 276(32): p. 29839-45.
150. Roach, T.I., et al., Macrophage activation: lipoarabinomannan from avirulent and virulent strains of Mycobacterium tuberculosis differentially induces the early genes c-fos, KC, JE, and tumor necrosis factor-alpha. Journal of Immunology, 1993. 150(5): p. 1886-96.
151. Lu, B., et al., Structure and function of the murine chemokine receptor CXCR3. European Journal of Immunology., 1999. 29(11): p. 3804-12.
152. Soejima, K. and B.J. Rollins, A functional IFN-gamma-inducible protein-10/CXCL10-specific receptor expressed by epithelial and endothelial cells that is neither CXCR3 nor glycosaminoglycan. Journal of Immunology., 2001. 167(11): p. 6576-82.
153. Balashov, K.E., et al., CCR5(+) and CXCR3(+) T cells are increased in multiple sclerosis and their ligands MIP-1alpha and IP-10 are expressed in demyelinating brain lesions. Proceedings of the National Academy of Sciences of the United States of America., 1999. 96(12): p. 6873-8.
154. Dufour, J.H., et al., IFN-gamma-inducible protein 10 (IP-10; CXCL10)-deficient mice reveal a role for IP-10 in effector T cell generation and trafficking. Journal of Immunology., 2002. 168(7): p. 3195-204.
155. Khan, I.A., et al., IP-10 is critical for effector T cell trafficking and host survival in Toxoplasma gondii infection. Immunity., 2000. 12(5): p. 483-94.
156. Wu, L., et al., Interaction of chemokine receptor CCR5 with its ligands: multiple domains for HIV-1 gp120 binding and a single domain for chemokine binding. Journal of Experimental Medicine, 1997. 186(8): p. 1373-81.
157. Mack, M., et al., Expression and characterization of the chemokine receptors CCR2 and CCR5 in mice. Journal of Immunology, 2001. 166(7): p. 4697-704.
158. Fraziano, M., et al., Expression of CCR5 is increased in human monocyte-derived macrophages and alveolar macrophages in the course of in vivo and in vitro Mycobacterium tuberculosis infection. AIDS Research & Human Retroviruses., 1999. 15(10): p. 869-74.
159. Sato, N., et al., Defects in the generation of IFN-gamma are overcome to control infection with Leishmania donovani in CC chemokine receptor (CCR) 5-, macrophage inflammatory protein-1 alpha-, or CCR2-deficient mice. Journal of Immunology., 1999. 163(10): p. 5519-25.
160. Huffnagle, G.B., et al., Cutting Edge: Role of C-C Chemokine Receptor 5 in Organ-Specific and Innate Immunity to Cryptococcus neoformans. J Immunology, 1999. 163: p. 4642-4646.
161. Aliberti, J., et al., CCR5 provides a signal for microbial induced production of IL-12 by CD8 alpha+ dendritic cells. Nature Immunology, 2000. 1(1): p. 83-7.
162. Zhou, Y., et al., Imparied macrophage function an enhanced T cell-dependent immune response in mice lacking CCR5, the mouse homologue of the major HIV-1 coreceptor. J Immunology, 1998. 160(8): p. 4018-4025.
163. Dawson, T.C., et al., Contrasting effects of CCR5 and CCR2 deficiency in the pulmonary inflammatory response to influenza A virus. American Journal of Pathology., 2000. 156(6): p. 1951-9.
189

164. Olszewski, M.A., et al., Regulatory effects of macrophage inflammatory protein 1alpha/CCL3 on the development of immunity to Cryptococcus neoformans depend on expression of early inflammatory cytokines. Infection & Immunity, 2001. 69(10): p. 6256-63.
165. Liu, W. and D.A. Saint, A new quantitative method of real time reverse transcription polymerase chain reaction assay based on simulation of polymerase chain reaction kinetics. Analytical Biochemistry., 2002. 302(1): p. 52-9.
166. Luther, S.A. and J.G. Cyster, Chemokines as regulators of T cell differentiation. Nature Immunology, 2001. 2(2): p. 102-7.
167. Shevach, E.M., CD4+ CD25+ suppressor T cells: more questions than answers. Nature Reviews. Immunology., 2002. 2(6): p. 389-400.
168. Andres, P.G., et al., Mice with a selective deletion of the CC chemokine receptors 5 or 2 are protected from dextran sodium sulfate-mediated colitis: lack of CC chemokine receptor 5 expression results in a NK1.1+ lymphocyte-associated Th2-type immune response in the intestine. Journal of Immunology., 2000. 164(12): p. 6303-12.
169. Algeciras-Schimnich, A., et al., CCR5 mediates Fas- and caspase-8 dependent apoptosis of both uninfected and HIV infected primary human CD4 T cells. Aids., 2002. 16(11): p. 1467-78.
170. Henderson, R.A., S.C. Watkins, and J.L. Flynn, Activation of human dendritic cells following infection with Mycobacterium tuberculosis. Journal of Immunology., 1997. 159(2): p. 635-43.
171. Tascon, R.E., et al., Mycobacterium tuberculosis-activated dendritic cells induce protective immunity in mice. Immunology., 2000. 99(3): p. 473-80.
172. Legge, K.L. and T.J. Braciale, Accelerated migration of respiratory dendritic cells to the regional lymph nodes is limited to the early phase of pulmonary infection. Immunity., 2003. 18(2): p. 265-77.
173. Bozza, S., et al., Dendritic cells transport conidia and hyphae of Aspergillus fumigatus from the airways to the draining lymph nodes and initiate disparate Th responses to the fungus. Journal of Immunology., 2002. 168(3): p. 1362-71.
174. Vermaelen, K.Y., et al., Specific migratory dendritic cells rapidly transport antigen from the airways to the thoracic lymph nodes. Journal of Experimental Medicine., 2001. 193(1): p. 51-60.
175. Caux, C., et al., Regulation of dendritic cell recruitment by chemokines. Transplantation., 2002. 73(1 Suppl): p. S7-11.
176. Scott, H.M., J. Chan, and J.F. Flynn, Chemokines and tuberculosis. Cytokines and Growth Factors Reviews, 2003. 14(6): p. 467-477.
177. Chan, J., et al., Effects of nitric oxide synthase inhibitors on murine infection with Mycobacterium tuberculosis. Infection & Immunity, 1995. 63(2): p. 736-40.
178. Chan, J., et al., Killing of virulent Mycobacterium tuberculosis by reactive nitrogen intermediates produced by activated murine macrophages. Journal of Experimental Medicine, 1992. 175(4): p. 1111-22.
179. Shang, X., et al., Chemokine receptor 1 knockout abrogates natural killer cell recruitment and impairs type-1 cytokines in lymphoid tissue during pulmonary granuloma formation. American Journal of Pathology, 2000. 157(6): p. 2055-63.
190

180. Qiu, B., et al., Chemokine expression dynamics in mycobacterial (type-1) and schistosomal (type-2) antigen-elicited pulmonary granuloma formation. American Journal of Pathology, 2001. 158(4): p. 1503-15.
181. Chensue, S.W., et al., Role of monocyte chemoattractant protein-1 (MCP-1) in Th1 (mycobacterial) and Th2 (schistosomal) antigen-induced granuloma formation: relationship to local inflammation, Th cell expression, and IL-12 production. Journal of Immunology, 1996. 157(10): p. 4602-8.
182. Chensue, S.W., et al., Mycobacterial and schistosomal antigen-elicited granuloma formation in IFN-gamma and IL-4 knockout mice: analysis of local and regional cytokine and chemokine networks. Journal of Immunology, 1997. 159(7): p. 3565-73.
183. Huffnagle, G.B., et al., Leukocyte recruitment during pulmonary Cryptococcus neoformans infection. Immunopharmacology, 2000. 48(3): p. 231-6.
184. Boring, L., et al., Impaired monocyte migration and reduced type 1 (Th1) cytokine responses in C-C chemokine receptor 2 knockout mice. Journal of Clinical Investigation, 1997. 100(10): p. 2552-61.
185. Kurihara, T., et al., Defects in macrophage recruitment and host defense in mice lacking the CCR2 chemokine receptor. Journal of Experimental Medicine, 1997. 186(10): p. 1757-62.
186. Orme, I.M. and F.M. Collins, Mouse Model of Tuberculosis, in Tuberculosis: Pathogenesis, Protection, and Control, B.R. Bloom, Editor. 1994, ASM Press: Washington DC. p. 113-134.
187. Kuziel, W.A., et al., Severe reduction in leukocyte adhesion and monocyte extravasation in mice deficient in CC chemokine receptor 2. Proceedings of the National Academy of Sciences of the United States of America, 1997. 94(22): p. 12053-8.
188. Peters, W., M. Dupuis, and I.F. Charo, A mechanism for the impaired IFN-gamma production in C-C chemokine receptor 2 (CCR2) knockout mice: role of CCR2 in linking the innate and adaptive immune responses. Journal of Immunology, 2000. 165(12): p. 7072-7.
189. Fife, B.T., et al., CC chemokine receptor 2 is critical for induction of experimental autoimmune encephalomyelitis. Journal of Experimental Medicine, 2000. 192(6): p. 899-905.
190. Peters, W. and I.F. Charo, Involvement of chemokine receptor 2 and its ligand, monocyte chemoattractant protein-1, in the development of atherosclerosis: lessons from knockout mice. Current Opinion in Lipidology, 2001. 12(2): p. 175-80.
191. Traynor, T.R., et al., CCR2 expression determines T1 versus T2 polarization during pulmonary Cryptococcus neoformans infection. Journal of Immunology, 2000. 164(4): p. 2021-7.
192. Jouanguy, E., et al., A human IFNGR1 small deletion hotspot associated with dominant susceptibility to mycobacterial infection. Nature Genetics, 1999. 21(4): p. 370-8.
193. Warmington, K.S., et al., Effect of C-C chemokine receptor 2 (CCR2) knockout on type-2 (schistosomal antigen-elicited) pulmonary granuloma formation: analysis of cellular recruitment and cytokine responses. American Journal of Pathology, 1999. 154(5): p. 1407-16.
194. Serbina, N.V. and J.L. Flynn, CD8(+) T cells participate in the memory immune response to Mycobacterium tuberculosis. Infection & Immunity, 2001. 69(7): p. 4320-8.
191

195. Faveeuw, C., G. Preece, and A. Ager, Transendothelial migration of lymphocytes across high endothelial venules into lymph nodes is affected by metalloproteinases. Blood., 2001. 98(3): p. 688-95.
196. Friedland, J.S., et al., Differential regulation of MMP-1/9 and TIMP-1 secretion in human monocytic cells in response to Mycobacterium tuberculosis. Matrix Biology., 2002. 21(1): p. 103-10.
197. Quiding-Jarbrink, M., D.A. Smith, and G.J. Bancroft, Production of matrix metalloproteinases in response to mycobacterial infection. Infection & Immunity., 2001. 69(9): p. 5661-70.
198. Lima, M.C., et al., Immunological cytokine correlates of protective immunity and pathogenesis in leprosy. Scandinavian Journal of Immunology., 2000. 51(4): p. 419-28.
199. Wangoo, A., et al., Contribution of Th1 and Th2 cells to protection and pathology in experimental models of granulomatous lung disease. Journal of Immunology., 2001. 166(5): p. 3432-9.
200. Belkaid, Y., et al., The role of interleukin (IL)-10 in the persistence of Leishmania major in the skin after healing and the therapeutic potential of anti-IL-10 receptor antibody for sterile cure. Journal of Experimental Medicine., 2001. 194(10): p. 1497-506.
201. Jacobs, M., et al., Increased resistance to mycobacterial infection in the absence of interleukin-10. Immunology., 2000. 100(4): p. 494-501.
202. Murray, P.J. and R.A. Young, Increased antimycobacterial immunity in interleukin-10-deficient mice. Infection & Immunity., 1999. 67(6): p. 3087-95.
203. Erb, K.J., et al., IL-4, IL-5 and IL-10 are not required for the control of M. bovis-BCG infection in mice. Immunology & Cell Biology., 1998. 76(1): p. 41-6.
204. Denis, M. and E. Ghadirian, IL-10 neutralization augments mouse resistance to systemic Mycobacterium avium infections. Journal of Immunology., 1993. 151(10): p. 5425-30.
205. Bermudez, L.E. and J. Champsi, Infection with Mycobacterium avium induces production of interleukin-10 (IL-10), and administration of anti-IL-10 antibody is associated with enhanced resistance to infection in mice. Infection & Immunity., 1993. 61(7): p. 3093-7.
206. Opal, S.M., J.C. Wherry, and P. Grint, Interleukin-10: potential benefits and possible risks in clinical infectious diseases. Clinical Infectious Diseases., 1998. 27(6): p. 1497-507.
207. Lalani, I., K. Bhol, and A.R. Ahmed, Interleukin-10: biology, role in inflammation and autoimmunity.[erratum appears in Ann Allergy Asthma Immunol 1998 Mar;80(3):A-6]. Annals of Allergy, Asthma, & Immunology., 1997. 79(6): p. 469-83.
208. Groux, H., et al., Inhibitory and stimulatory effects of IL-10 on human CD8+ T cells. Journal of Immunology., 1998. 160(7): p. 3188-93.
209. Bogdan, C. and C. Nathan, Modulation of macrophage function by transforming growth factor beta, interleukin-4, and interleukin-10. Annals of the New York Academy of Sciences., 1993. 685: p. 713-39.
192