Embed Size (px)
Citation preview
Regulatory Toxicology and Pharmacology 69 (2014) 55–70
Contents lists available at ScienceDirect
Regulatory Toxicology and Pharmacology
journal homepage: www.elsevier .com/locate /yr tph
Human health risk evaluation of selected VOC, SVOC and particulateemissions from scented candles
http://dx.doi.org/10.1016/j.yrtph.2014.02.0100273-2300/� 2014 Elsevier Inc. All rights reserved.
⇑ Corresponding author. Address: ToxMinds BVBA, Product Safety & RegulatoryAffairs, Avenue de Broqueville 116, 1200 Brussels, Belgium. Fax: +32 (0)2 762 9146.
E-mail address: [email protected] (T. Petry).1 Current address: Symrise AG, Holzminden, Germany.
Thomas Petry a,⇑, Danielle Vitale b, Fred J. Joachim c, Ben Smith d, Lynn Cruse e, Reuben Mascarenhas f,1,Scott Schneider g, Madhuri Singal b
a ToxMinds BVBA, Product Safety & Regulatory Affairs, Brussels, Belgiumb Research Institute for Fragrance Materials Inc., Woodcliff Lake, NJ, United Statesc SC Johnson & Son, Racine, WI, United Statesd Firmenich SA, Geneva, Switzerlande Procter & Gamble, Cincinnati, OH, United Statesf Reckitt-Benckiser, Hull, United Kingdomg Firmenich SA, Princeton, NJ, United States
a r t i c l e i n f o
Article history:Received 19 July 2013Available online 26 February 2014
Keywords:Candle emissionsChamber emission studiesConsumer exposure modelingHuman health assessment
a b s t r a c t
Airborne compounds in the indoor environment arise from a wide variety of sources such as environmen-tal tobacco smoke, heating and cooking, construction materials as well as outdoor sources. To understandthe contribution of scented candles to the indoor load of airborne substances and particulate matter, can-dle emission testing was undertaken in environmentally controlled small and large emission chambers.Candle emission rates, calculated on the basis of measured chamber concentrations of volatile and semi-volatile organic compounds (VOC, SVOC) and particulate matter (PM), were used to predict their respec-tive indoor air concentrations in a standard EU-based dwelling using 2 models: the widely acceptedConsExpo 1-box inhalation model and the recently developed RIFM 2-box indoor air dispersion model.The output from both models has been used to estimate more realistic consumer exposure concentra-tions of specific chemicals and PM in candle emissions. Potential consumer health risks associated withthe candle emissions were characterized by comparing the exposure concentrations with existing indooror ambient air quality guidelines or, where not existent, to established toxicity thresholds. On the basis ofthis investigation it was concluded that under normal conditions of use scented candles do not poseknown health risks to the consumer.
� 2014 Elsevier Inc. All rights reserved.
1. Introduction
People spent up to 90% of their time indoors (EU, 2005). Conse-quently, factors impacting the indoor air quality such as dampness,presence of molds and chemical exposures can have a considerableinfluence on human health. Concerns about possible health effectsof indoor pollution with regard to carcinogenic and non-carcino-genic effects like asthma, allergies or non-specific symptoms fromeyes, upper airways and facial skin are increasing. Such non-specificsymptoms are occasionally referred to as ‘sick building syndrome’(SBS) (Sahlberg, 2012). Most indoor pollutants consist of chemicalsstemming from various sources including outdoor, indoor combus-
tion sources such as tobacco smoke, heating or cooking, and burningof candles. Other sources may include emissions from furniture andconstruction materials, the use of cleaning products, air fresheners,indoor pesticides, and other consumer products. In addition, micro-biological contaminants which may induce allergies and asthmarequire careful consideration as potential indoor air pollutants(SCHER, 2007).
Although there is general acceptance that fragranced productscan play an important role in enhancing the odor quality of theindoor environment, the increased use of scented candle use hasalso raised queries about the exposure to candle emissions and theirpossible impact on indoor air quality. Fragranced candles, however,are only one source of volatile organic compounds (VOCs), semi-vol-atile organic compounds (SVOCs) or particulate matter (PM) in theindoor environment. In fact VOCs, SVOCs and PM are ubiquitousin indoor air and their presence is due to a multitude of sources, bothanthropogenic and natural (e.g., EU, 2005; HEI, 2005, 2007; SCHER,

56 T. Petry et al. / Regulatory Toxicology and Pharmacology 69 (2014) 55–70
2007; Kotzias et al., 2009; Massolo et al., 2010; Geiss et al., 2011;Sarigiannis et al., 2011; Isaacs et al., 2013).
To date, few studies have been undertaken that investigated thecandle emissions of both intentionally added fragrance materialsas well as VOCs and/or SVOCs resulting from incomplete candlecombustion (e.g., short chain aldehydes, benzene, polycyclicaromatic hydrocarbons (PAH), polychlorinated dibenzodioxinsPCDD and polychlorinated dibenzofurans PCDF) (Schwind andHosseinpour, 1994; Lau et al., 1997; Oekometric GmbH, 1997,1999; VITO, 2006). Even fewer studies have examined the particu-late matter (PM) emissions using various analytical techniques todetermine different particulate size fractions (i.e., PM2.5, PM10)emitted by candles (Fine et al., 1999; Guo et al., 2000; Krauseet al., 1999). However, as no validated standardized protocol forthe measurement of candle emissions is available, the aforementioned analytical investigations differ in conditions and testset-up, making it difficult to compare and estimate consumerexposure on the basis of the presented data (Petry et al., 2013).
Only Lau et al. (1997), VITO (2006, 2008) and Petry et al. (2013)have attempted to estimate actual human exposure to candleemissions and characterize the associated human health risks.Using a simple inhalation uptake model, Lau et al. (1997) com-pared estimated human indoor exposures to formaldehyde, acetal-dehyde, acrolein, benzo(a)pyrene and PCDD/PCDF to existingGerman Maximum Workplace Concentrations (MAK-value) andTechnical Guidance Concentrations (TRK value). VITO (2006,2008) estimated consumer indoor exposure to volatile short-chainaldehydes, benzene, naphthalene or xylenes, and particulate mat-ter (i.e., PM2.5, PM10) released from unscented and scented candlesusing the modified CONTAM model. The CONTAM model takes intoaccount chemical specific candle emission rates, indoor VOC depo-sition and adsorption rates, size and building characteristics, venti-lation rates as well as actual consumer candle use practices andtime-activity patterns. Modeled VOC and particulate exposureswere compared to existing short term and long term indoor airquality guideline values. Petry et al. (2013) calculated consumertime-weighted average exposures to candle emissions of benzeneand formaldehyde using the ConsExpo 1-box model2 and comparedthose to existing indoor/outdoor guideline values. All three investi-gators concluded that on the basis of their investigations, emissionsfrom candles are unlikely to pose long term health effects to people.VITO (2008) pointed out that short term peak exposures may triggeror aggravate symptoms in sensitive individuals.
Understanding the release and subsequent exposure to VOCs,SVOCs and PM emitted from scented candles is crucial to assessingpotential consumer health risks. The overall objective of this paperis to present an approach in evaluating consumers’ health risk fromexposure to chemicals released from candles used in the indoorenvironment. Against the background of the afore mentionedobstacles of differing candle emission testing protocols and relateduncertainties in interpreting the results, the aim of this investiga-tion is to first report the results of a comprehensive set of studiesconducted to measure the emissions of VOC, SVOC and PM fromscented candles in a comparable manner under environmentallycontrolled conditions and thereby to substantially increase theunderstanding of candle emissions. Analytical data obtained inthe form of chamber concentrations were back-calculated to can-dle emission rates on which basic consumer exposures were esti-mated for different candle use scenarios using a default 1-box aswell as a newly developed higher tiered 2-box computational mod-el. The health risks associated with consumer exposure estimateswere assessed by comparison to existing or proposed regulatoryair guideline values or, where not existent, to ‘derived no effect
2 http://www.rivm.nl/en/Topics/Topics/C/ConsExpo.
levels’ (DNELs) for longer term exposure, as required under theEuropean REACH Regulation (EC) No. 1907/2006.
2. Materials and methods
Volatile and semi-volatile organic compounds as well as partic-ulate emissions of candles were investigated in a total of 3 indepen-dent studies. A first screening study, conducted at the laboratories ofTNO Quality of Life, the Netherlands, aimed at establishing a candleemission testing protocol in a small emission test chamber with avolume of 2.2 m3 (‘‘small chamber study’’). Two subsequent studieswere conducted at the laboratory of Air Quality Sciences (AQS), anISO 9001:2000 registered Indoor Air Quality Laboratory, in normalroom size emission chambers with a volume of approximately26 m3. The first study at AQS (‘LCS1’) investigated the same com-pounds emitted from candles in the ‘small chamber study’ (‘SCS’)allowing a direct comparison of the results obtained. The secondstudy at AQS (‘LCS2’) investigated different VOCs including semi-volatile PAH, PCDD and PCDF. The large chamber investigations alsodetermined candle emissions of particulates characterized as PM10
and PM2.5. The contract laboratories were chosen on the basis oftheir substantial experience with the measurement of VOC, SVOCand PM in chamber emission studies using existing ISO- and ASTMstandards (ISO, 2006, ASTM, 2001). The methodology to measurecandle emissions largely followed the frame protocol described la-ter by Petry et al. (2013) with regard to the experimental set-up,study protocol, meteorological conditions with regard to chambertemperature and relative humidity at candle ignition and analyticalmethods used to measure VOC emissions from candles according toexisting ISO- and/or ASTM standards.
2.1. Determination of candle emissions: chamber emission studies
2.1.1. Small chamber study2.1.1.1. Test products. Six fragranced jar candles (i.e., FC1, FC2, FC3,FC4, FC5, FC6), consisting of paraffin wax, a non-lead wick, as wellas a fragrance mix, and one unfragranced (i.e., UFC1) jar candlewere evaluated in the small chamber experiments. The individualtotal candle weight contained in the glass jar was approximately113 g. In the case of the fragranced candles, the fragrance loadwas approximately 6% of total candle weight. The candles were re-ceived as packaged and shipped by the manufacturer. Upon receiptat the laboratories, the candles were visually inspected and storedin an environmentally controlled space, immediately followingsample check-in until the moment of testing.
2.1.1.2. Study design. The VOC emissions from burning candleswere investigated in two 2.2 m3 stainless steel chambers with steelframed glass doors. The chambers were process-controlled andequipped with a continuous data acquisition system that verifiedoperating conditions of airflow, temperature and humidity. Duringeach candle test, the air supply to the chamber was maintained at atemperature of 23 �C ± 2 �C and the relative humidity was kept at50% ± 5%. The air exchange rate was set at 0.5 air changes/h.
The VOC background concentrations in the testing chamberswere below the detection limit of total carbon using a flame ioni-zation detector with a detection limit of 0.2 ppm based on propane.At study initiation, the candles were lit using a gas lighter outsideand subsequently placed into the chamber. Candles were allowedto burn for 4–6 h, after which they were extinguished using a re-motely controlled small jet of water, thereby allowing the chamberto remain closed throughout the whole experiment. While thisprocedure may have led to some dampening of the PM emissions,it was not expected to impact the VOC measurements. Particulatematter emissions were not investigated in the SCS study.
T. Petry et al. / Regulatory Toxicology and Pharmacology 69 (2014) 55–70 57
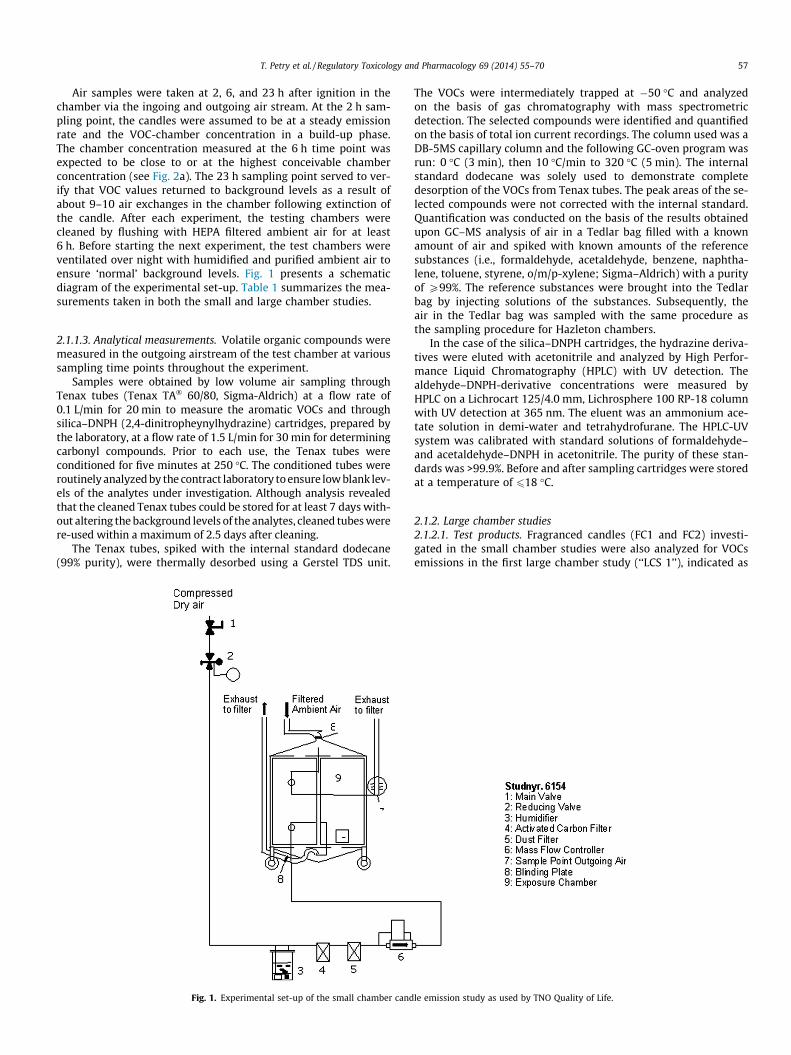
Air samples were taken at 2, 6, and 23 h after ignition in thechamber via the ingoing and outgoing air stream. At the 2 h sam-pling point, the candles were assumed to be at a steady emissionrate and the VOC-chamber concentration in a build-up phase.The chamber concentration measured at the 6 h time point wasexpected to be close to or at the highest conceivable chamberconcentration (see Fig. 2a). The 23 h sampling point served to ver-ify that VOC values returned to background levels as a result ofabout 9–10 air exchanges in the chamber following extinction ofthe candle. After each experiment, the testing chambers werecleaned by flushing with HEPA filtered ambient air for at least6 h. Before starting the next experiment, the test chambers wereventilated over night with humidified and purified ambient air toensure ‘normal’ background levels. Fig. 1 presents a schematicdiagram of the experimental set-up. Table 1 summarizes the mea-surements taken in both the small and large chamber studies.
2.1.1.3. Analytical measurements. Volatile organic compounds weremeasured in the outgoing airstream of the test chamber at varioussampling time points throughout the experiment.
Samples were obtained by low volume air sampling throughTenax tubes (Tenax TA� 60/80, Sigma-Aldrich) at a flow rate of0.1 L/min for 20 min to measure the aromatic VOCs and throughsilica–DNPH (2,4-dinitropheynylhydrazine) cartridges, prepared bythe laboratory, at a flow rate of 1.5 L/min for 30 min for determiningcarbonyl compounds. Prior to each use, the Tenax tubes wereconditioned for five minutes at 250 �C. The conditioned tubes wereroutinely analyzed by the contract laboratory to ensure low blank lev-els of the analytes under investigation. Although analysis revealedthat the cleaned Tenax tubes could be stored for at least 7 days with-out altering the background levels of the analytes, cleaned tubes werere-used within a maximum of 2.5 days after cleaning.
The Tenax tubes, spiked with the internal standard dodecane(99% purity), were thermally desorbed using a Gerstel TDS unit.
Fig. 1. Experimental set-up of the small chamber cand
The VOCs were intermediately trapped at �50 �C and analyzedon the basis of gas chromatography with mass spectrometricdetection. The selected compounds were identified and quantifiedon the basis of total ion current recordings. The column used was aDB-5MS capillary column and the following GC-oven program wasrun: 0 �C (3 min), then 10 �C/min to 320 �C (5 min). The internalstandard dodecane was solely used to demonstrate completedesorption of the VOCs from Tenax tubes. The peak areas of the se-lected compounds were not corrected with the internal standard.Quantification was conducted on the basis of the results obtainedupon GC–MS analysis of air in a Tedlar bag filled with a knownamount of air and spiked with known amounts of the referencesubstances (i.e., formaldehyde, acetaldehyde, benzene, naphtha-lene, toluene, styrene, o/m/p-xylene; Sigma–Aldrich) with a purityof P99%. The reference substances were brought into the Tedlarbag by injecting solutions of the substances. Subsequently, theair in the Tedlar bag was sampled with the same procedure asthe sampling procedure for Hazleton chambers.
In the case of the silica–DNPH cartridges, the hydrazine deriva-tives were eluted with acetonitrile and analyzed by High Perfor-mance Liquid Chromatography (HPLC) with UV detection. Thealdehyde–DNPH-derivative concentrations were measured byHPLC on a Lichrocart 125/4.0 mm, Lichrosphere 100 RP-18 columnwith UV detection at 365 nm. The eluent was an ammonium ace-tate solution in demi-water and tetrahydrofurane. The HPLC-UVsystem was calibrated with standard solutions of formaldehyde–and acetaldehyde–DNPH in acetonitrile. The purity of these stan-dards was >99.9%. Before and after sampling cartridges were storedat a temperature of 618 �C.
2.1.2. Large chamber studies2.1.2.1. Test products. Fragranced candles (FC1 and FC2) investi-gated in the small chamber studies were also analyzed for VOCsemissions in the first large chamber study (‘‘LCS 1’’), indicated as
le emission study as used by TNO Quality of Life.
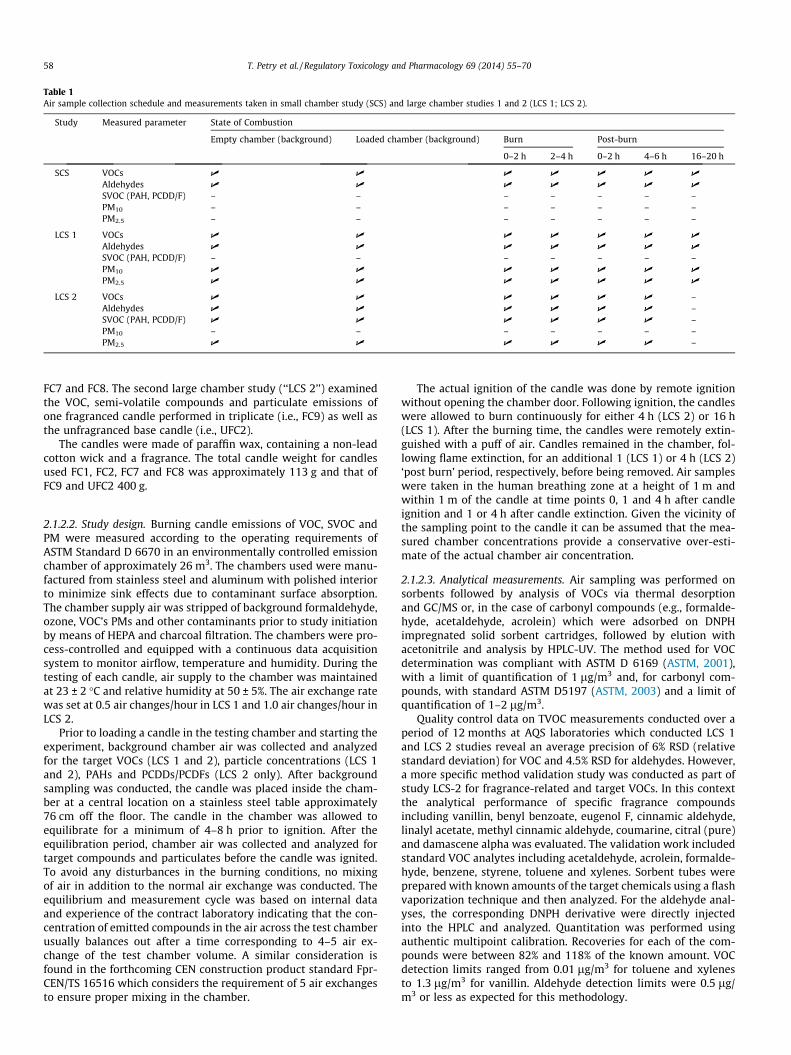
Table 1Air sample collection schedule and measurements taken in small chamber study (SCS) and large chamber studies 1 and 2 (LCS 1; LCS 2).
Study Measured parameter State of Combustion
Empty chamber (background) Loaded chamber (background) Burn Post-burn
0–2 h 2–4 h 0–2 h 4–6 h 16–20 h
SCS VOCs U U U U U U U
Aldehydes U U U U U U U
SVOC (PAH, PCDD/F) – – – – – – –PM10 – – – – – – –PM2.5 – – – – – – –
LCS 1 VOCs U U U U U U U
Aldehydes U U U U U U U
SVOC (PAH, PCDD/F) – – – – – – –PM10 U U U U U U U
PM2.5 U U U U U U U
LCS 2 VOCs U U U U U U –Aldehydes U U U U U U –SVOC (PAH, PCDD/F) U U U U U U –PM10 – – – – – – –PM2.5 U U U U U U –
58 T. Petry et al. / Regulatory Toxicology and Pharmacology 69 (2014) 55–70
FC7 and FC8. The second large chamber study (‘‘LCS 2’’) examinedthe VOC, semi-volatile compounds and particulate emissions ofone fragranced candle performed in triplicate (i.e., FC9) as well asthe unfragranced base candle (i.e., UFC2).
The candles were made of paraffin wax, containing a non-leadcotton wick and a fragrance. The total candle weight for candlesused FC1, FC2, FC7 and FC8 was approximately 113 g and that ofFC9 and UFC2 400 g.
2.1.2.2. Study design. Burning candle emissions of VOC, SVOC andPM were measured according to the operating requirements ofASTM Standard D 6670 in an environmentally controlled emissionchamber of approximately 26 m3. The chambers used were manu-factured from stainless steel and aluminum with polished interiorto minimize sink effects due to contaminant surface absorption.The chamber supply air was stripped of background formaldehyde,ozone, VOC’s PMs and other contaminants prior to study initiationby means of HEPA and charcoal filtration. The chambers were pro-cess-controlled and equipped with a continuous data acquisitionsystem to monitor airflow, temperature and humidity. During thetesting of each candle, air supply to the chamber was maintainedat 23 ± 2 �C and relative humidity at 50 ± 5%. The air exchange ratewas set at 0.5 air changes/hour in LCS 1 and 1.0 air changes/hour inLCS 2.
Prior to loading a candle in the testing chamber and starting theexperiment, background chamber air was collected and analyzedfor the target VOCs (LCS 1 and 2), particle concentrations (LCS 1and 2), PAHs and PCDDs/PCDFs (LCS 2 only). After backgroundsampling was conducted, the candle was placed inside the cham-ber at a central location on a stainless steel table approximately76 cm off the floor. The candle in the chamber was allowed toequilibrate for a minimum of 4–8 h prior to ignition. After theequilibration period, chamber air was collected and analyzed fortarget compounds and particulates before the candle was ignited.To avoid any disturbances in the burning conditions, no mixingof air in addition to the normal air exchange was conducted. Theequilibrium and measurement cycle was based on internal dataand experience of the contract laboratory indicating that the con-centration of emitted compounds in the air across the test chamberusually balances out after a time corresponding to 4–5 air ex-change of the test chamber volume. A similar consideration isfound in the forthcoming CEN construction product standard Fpr-CEN/TS 16516 which considers the requirement of 5 air exchangesto ensure proper mixing in the chamber.
The actual ignition of the candle was done by remote ignitionwithout opening the chamber door. Following ignition, the candleswere allowed to burn continuously for either 4 h (LCS 2) or 16 h(LCS 1). After the burning time, the candles were remotely extin-guished with a puff of air. Candles remained in the chamber, fol-lowing flame extinction, for an additional 1 (LCS 1) or 4 h (LCS 2)‘post burn’ period, respectively, before being removed. Air sampleswere taken in the human breathing zone at a height of 1 m andwithin 1 m of the candle at time points 0, 1 and 4 h after candleignition and 1 or 4 h after candle extinction. Given the vicinity ofthe sampling point to the candle it can be assumed that the mea-sured chamber concentrations provide a conservative over-esti-mate of the actual chamber air concentration.
2.1.2.3. Analytical measurements. Air sampling was performed onsorbents followed by analysis of VOCs via thermal desorptionand GC/MS or, in the case of carbonyl compounds (e.g., formalde-hyde, acetaldehyde, acrolein) which were adsorbed on DNPHimpregnated solid sorbent cartridges, followed by elution withacetonitrile and analysis by HPLC-UV. The method used for VOCdetermination was compliant with ASTM D 6169 (ASTM, 2001),with a limit of quantification of 1 lg/m3 and, for carbonyl com-pounds, with standard ASTM D5197 (ASTM, 2003) and a limit ofquantification of 1–2 lg/m3.
Quality control data on TVOC measurements conducted over aperiod of 12 months at AQS laboratories which conducted LCS 1and LCS 2 studies reveal an average precision of 6% RSD (relativestandard deviation) for VOC and 4.5% RSD for aldehydes. However,a more specific method validation study was conducted as part ofstudy LCS-2 for fragrance-related and target VOCs. In this contextthe analytical performance of specific fragrance compoundsincluding vanillin, benyl benzoate, eugenol F, cinnamic aldehyde,linalyl acetate, methyl cinnamic aldehyde, coumarine, citral (pure)and damascene alpha was evaluated. The validation work includedstandard VOC analytes including acetaldehyde, acrolein, formalde-hyde, benzene, styrene, toluene and xylenes. Sorbent tubes wereprepared with known amounts of the target chemicals using a flashvaporization technique and then analyzed. For the aldehyde anal-yses, the corresponding DNPH derivative were directly injectedinto the HPLC and analyzed. Quantitation was performed usingauthentic multipoint calibration. Recoveries for each of the com-pounds were between 82% and 118% of the known amount. VOCdetection limits ranged from 0.01 lg/m3 for toluene and xylenesto 1.3 lg/m3 for vanillin. Aldehyde detection limits were 0.5 lg/m3 or less as expected for this methodology.
T. Petry et al. / Regulatory Toxicology and Pharmacology 69 (2014) 55–70 59
Breakthrough studies for target chemicals were conducted inLCS 2 to ensure that all collected VOC was retained on thecollection media at the flow rates used and at concentration levelsexpected. Flash vaporization was used to spike a Tenax sorbenttube (Tenax TA� 60/80, Sigma–Aldrich) with an authentic standardat the 1000 ng level. A second sorbent tube was connected in serieswith the first tube, and a total of 24 L of air pulled across both tubesat a rate of 200 mL/minute. Both tubes were then analyzed and thearea response compared. There was no breakthrough observed forany of the target VOCs. Overall the analytical validation studyindicated that analyses of the volatile target chemicals wereconducted accurately and precisely within acceptable qualityobjectives.
Semi-volatile PAHs and PCDD/PCDF investigated in LCS 2 werecollected in accordance to US EPA methods TO-9A (US EPA, 1999a)and TO-13A (US EPA, 1999b) in an adsorbent cartridge assemblycontaining two polyurethane foam (PUF) plugs, with an internallayer of polymeric XAD resin in between, as supplied by a specializedPAH and PCDD/PCDF testing laboratory (i.e., Alta Analytical Labora-tory, Inc., El Dorado Hills, CA). This assembly allows for the collectionof PAHs/PCDD/PCDF in both the particulate as well as in the gasphase. In line with methods TO-9A and TO-13A, the PUF plugs as wellas the XAD resin were cleaned by Soxhlet extraction using appropri-ate solvents followed by vacuum and room drying prior to use. AltaAnalytical Laboratories also performed the analytical work usinghigh resolution gas chromatography mass spectrometry (HRMS),following CARB Method 429 for the identification and quantificationof PAHs (CARB, 1989), and CARB Method 428 for the identificationand quantification of PCDD and PCDF (CARB, 1988). To improvethe detection limit, PUF plugs and XAD resin were combined priorto extraction and analyses. Based on the air sample collection vol-umes utilized, the quantification limits of the methods were 8 ng/m3 for PAHs and 1 pg/m3 for PCDD/PCDF. Depending on congenersthe overall collection and analytical recover efficiency of the methodranged from 85% to 110% for PAHs and 90% to 110% for PCDD/PCDFwhen corrected for pre-spiked surrogate standards. Isotopically-la-beled standards were added to the PUF plugs prior to field samplingand account for any loss occurring during sample collection,shipment and analysis.
Continuous particle concentration monitoring was performedusing TSI Model 8520 Aerosol Monitors. The analytical range of thisinstrument is 0.001 to 100 mg/m3, with the measurement ofparticles ranging from 0.1 to 10 lm in size. While there are somelimitations of real-time measurements over gravimetric methods,gravimetric analyses, as typically recommended for the work placeby NIOSH or ACGIH, were too insensitive under the experimentalset-up. Two instruments were set up for the collection of particlesless than 2.5 lm (PM2.5) and two instruments were arranged forthe collection of particles less than 10 lm (PM10). A calibrationfactor for fly ash was determined and applied subsequent to theoriginal data collection to closely align measurements with a pre-sumably similar combustion particle mix.
Particle counts were measured using Pacific Scientific Met One2100 Particle Counters. Particle counts were provided for the fol-lowing size channels: 0.1, 0.2, 0.3, 0.5, 0.7 and 1.0 lm. Ultrafineparticle counts were measured using a TSI P-track Ultrafine ParticleCounter Model 8525. The minimum particle size measurable bythis instrument is 20 nm with an overall particle range of 20 to100 nm.
2.2. Estimating human indoor exposures to candle emissions
Two models have been chosen to estimate human indoor expo-sures to candle emissions on the basis of the candle emission ratesobtained from the environmental chamber studies. These are theConsExpo 1-box model (RIVM, 2007) as well as the 2-Box Indoor
Air Dispersion Model developed by the Research Institute for Fra-grance Materials (2010).
The ConsExpo (‘exposure to vapors – constant release’) 1-boxmodel2 was adopted to conservatively estimate consumer expo-sure concentrations to VOCs, SVOCs and particulates released fromcandles at maximum emission rates. The model assumes that theremoval of volatile compounds and particles from the indoor envi-ronment is solely a function of the air exchange. Although removalof VOCs, SVOCs or particulates due to adsorption or deposition(‘sinks’) is known to readily occur in common living spaces on car-pets, walls or other household items, with environmental tobaccosmoke as the prime example (e.g., EU, 2005; SCHER, 2007; VITO,2008), such removal is not considered in the ConsExpo modelincreasing the conservatism of the exposure estimates.
In addition to running the ConsExpo model, a refinement wasadopted by modeling the highest measured emission rates inRIFM’s 2-Box Indoor Air Dispersion Model. This model is a slightlysimplified version of the US EPA’s Multi Chamber Concentrationand Exposure Model (US EPA, 2001). This indoor exposure calcula-tion model is considered to provide a more realistic view on poten-tial human inhalation exposure concentrations to chemicalsreleased into indoor air from consumer products. The 2-box modelincorporates a more complex understanding of air flow/ventilationwithin an indoor environment, modeling the dispersion of VOCs,SVOCs or particulates between two inter-connected, enclosedzones, such as the room of interest and the rest of the house. In thismodel, the emission source (i.e., the candle) is located, for example,in a living room with a defined volume (Zone 1) and air exchange ismodeled between this room and Zone 2 (i.e., the rest of the resi-dence). The model incorporates the basic assumptions that concen-trations in Zones 1 and 2 disperse in a homogenous fashion andthat all chemical losses can be treated through a single degradationterm. The term, which is assumed to follow a first order loss ki-netic, is represented by a degradation half-life. This model alsoconsiders human activity patterns in the house throughout theday, and uses these data along with airborne concentration to de-rive human exposures. Like the ConsExpo model, the RIFM’s 2-boxmodel does not consider sink effects that are likely to occur incommon living spaces.
Both models have been used to determine peak and time-weighted average consumer exposure concentrations at maximumemission rates during, and following, the use of the candles. Due tothe infrequent usage of candles (i.e., 8.3 times/month), the shortburning time (i.e., 1.9–2.4 h/day) (IPSOS, 2006; VITO, 2006) andthe rapid decline of the airborne pollutant concentration, no accu-mulation of pollutants needs to be considered.
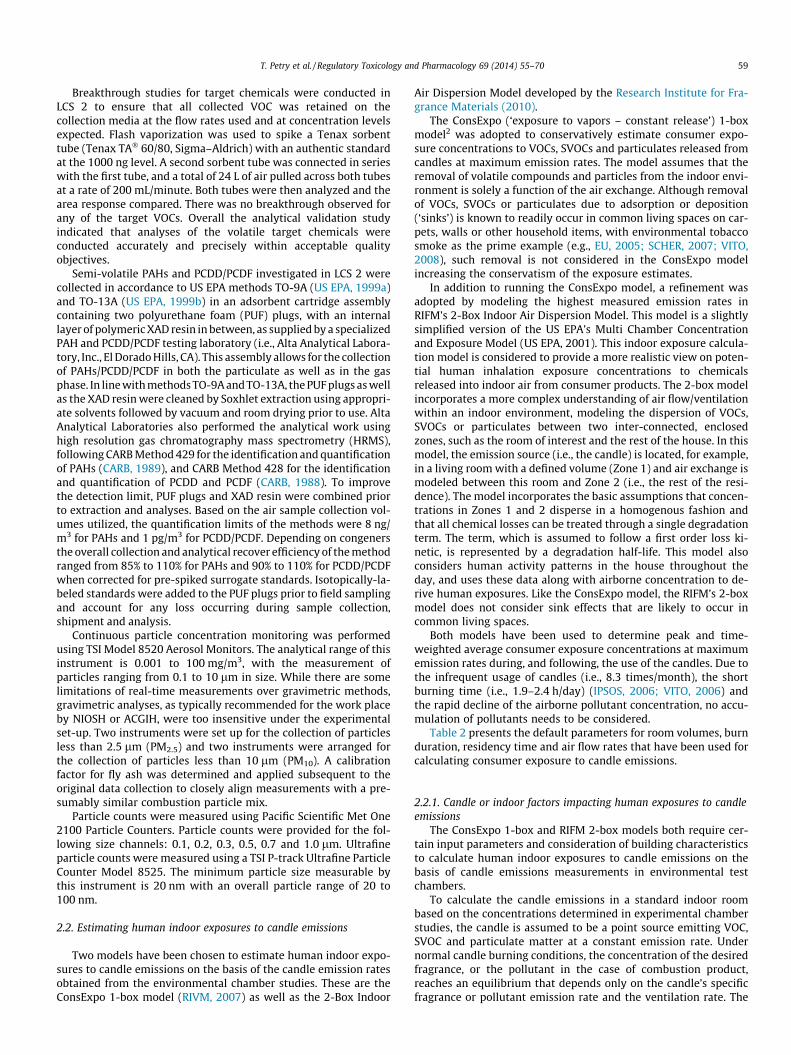
Table 2 presents the default parameters for room volumes, burnduration, residency time and air flow rates that have been used forcalculating consumer exposure to candle emissions.
2.2.1. Candle or indoor factors impacting human exposures to candleemissions
The ConsExpo 1-box and RIFM 2-box models both require cer-tain input parameters and consideration of building characteristicsto calculate human indoor exposures to candle emissions on thebasis of candle emissions measurements in environmental testchambers.
To calculate the candle emissions in a standard indoor roombased on the concentrations determined in experimental chamberstudies, the candle is assumed to be a point source emitting VOC,SVOC and particulate matter at a constant emission rate. Undernormal candle burning conditions, the concentration of the desiredfragrance, or the pollutant in the case of combustion product,reaches an equilibrium that depends only on the candle’s specificfragrance or pollutant emission rate and the ventilation rate. The
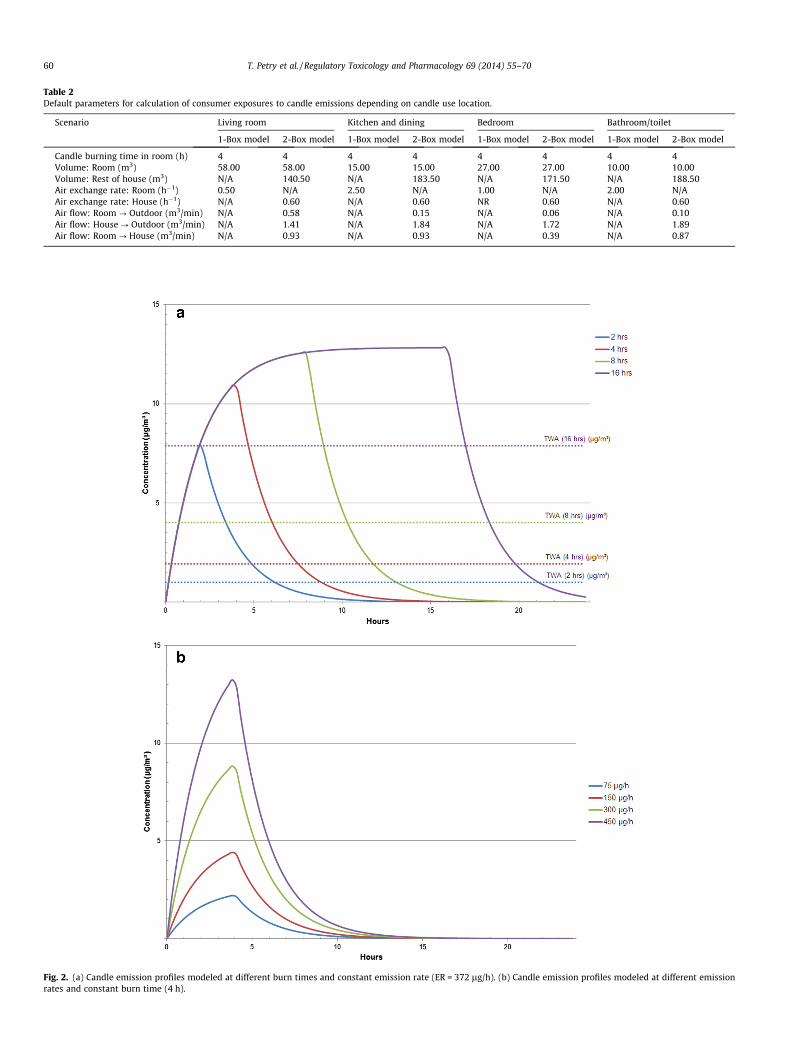
Table 2Default parameters for calculation of consumer exposures to candle emissions depending on candle use location.
Scenario Living room Kitchen and dining Bedroom Bathroom/toilet
1-Box model 2-Box model 1-Box model 2-Box model 1-Box model 2-Box model 1-Box model 2-Box model
Candle burning time in room (h) 4 4 4 4 4 4 4 4Volume: Room (m3) 58.00 58.00 15.00 15.00 27.00 27.00 10.00 10.00Volume: Rest of house (m3) N/A 140.50 N/A 183.50 N/A 171.50 N/A 188.50Air exchange rate: Room (h�1) 0.50 N/A 2.50 N/A 1.00 N/A 2.00 N/AAir exchange rate: House (h�1) N/A 0.60 N/A 0.60 NR 0.60 N/A 0.60Air flow: Room ? Outdoor (m3/min) N/A 0.58 N/A 0.15 N/A 0.06 N/A 0.10Air flow: House ? Outdoor (m3/min) N/A 1.41 N/A 1.84 N/A 1.72 N/A 1.89Air flow: Room ? House (m3/min) N/A 0.93 N/A 0.93 N/A 0.39 N/A 0.87
Fig. 2. (a) Candle emission profiles modeled at different burn times and constant emission rate (ER = 372 lg/h). (b) Candle emission profiles modeled at different emissionrates and constant burn time (4 h).
60 T. Petry et al. / Regulatory Toxicology and Pharmacology 69 (2014) 55–70

T. Petry et al. / Regulatory Toxicology and Pharmacology 69 (2014) 55–70 61
room volume and the ventilation rate determine the time it takesto reach equilibrium. This relationship is described in Eq. (1).
Air concentration ¼ BGþ ER � ð1� e�T�VRÞ=ðRV� VRÞ ð1Þ
BG = Background (lg/m3); ER = emission rate (lg/h); T = Time (h);RV = room volume (m3); VR = ventilation rate (h�1); AC = Air con-centration (lg/m3).
Accordingly, the emission rate is the scaling factor that can beused to calculate the equilibrium air concentrations in differentroom sizes at different air exchange rates. The emission rate canbe calculated according to the Eq. (2):
Emission Rate ¼ ðAC� BGÞ=ð1� e�T�VRÞ=ðRV� VRÞ ð2Þ
AC = Air concentration (lg/m3); BG = background (lg/m3);ER = emission rate (lg/h); T = Time (h); RV = room volume (m3);VR = ventilation rate (h�1).
In cases where the emission rate is constant, an asymptoticincrease of the concentration can be seen until equilibrium istheoretically reached. Therefore, calculating an equilibrium concen-tration at the highest measured emission rate represents the worstcase scenario for the exposure assessment. In reality, indoor air con-centrations in homes are however lower as a result of sink effects orhigher air exchange rates. Fig. 2a and b illustrate the impact of vary-ing burn time or emission rates on peak exposures as well as the24 h time-weighted average (TWA) concentrations at constantroom volume, and air exchange. Both figures have been modeledusing the ConsExpo 1-box model.
As can be seen in Eqs. (1) and (2), the key variables determiningthe inhalable air concentration to candle emissions are room vol-ume and ventilation rate. Average room sizes, building characteris-tics, as well as ventilation rates, vary significantly from region toregion and country to country.
The European Chemicals Agency’s (ECHA) technical guidancedocuments for consumer exposure assessments lists standardroom volumes to be used for exposure and risk assessment pur-poses indicating, for example, median room volumes in the Neth-erlands of 10 m3 for a bathroom and 58 m3 for a living room. InGermany, median room volumes are reported to be 64 m3. TheECHA technical guidance documents for consumer exposureassessments suggest ventilation rates to be 0.5–2.5 per hour(ECHA, 2012a). Air exchange rates and room sizes from RIVM’sTechnical Guidance Document were used to model exposure inthe one-box model.
Likewise, depending on the chemical nature of the fragranceingredient or the pollutant, the building materials and the presenceof furniture in rooms/dwellings, there is also a great variation ofVOC adsorption and particle deposition rates. VITO (2008) re-viewed studies available on the adsorption of VOCs on surfaces,and deposition rates of particles, as well as consideration of these
Table 3Measured maximum chamber concentrations and calculated emission rates of volatile org
Study Candle code Formaldehyde Acetaldehyde Benzene
lg/m3 lg/h lg/m3 lg/h lg/m3 lg/h
SCS FC1 121.20 137.90 34.75 41.20 18.62 21.10FC2 136.98 235.30 34.81 58.60 13.52 15.50FC3 59.49 73.00 12.93 13.60 2.66 2.70FC4 221.72 283.90 47.48 62.80 1.58 1.80FC5 323.50 372.20 74.95 85.70 28.49 32.60FC6 275.27 316.50 73.66 84.00 27.30 29.70UFC1 18.58 19.60 2.61 3.00 0.88 0.90
LCS1 FC7 18.20 234.00 8.20 105.00 2.30 29.60FC8 22.50 289.00 13.00 167.00 1.40 18.00
LCS2 FC9 10.90 280.00 2.40 61.70 2.80 72.00UFC2 <1.00 <25.70 <1.00 <25.70 <1.00 <25.70
measurements in indoor air exposure assessments. On the basis ofthis review, and for the purpose of this human health assessment,the conservative assumption was made that neither VOC/SVOCadsorption, nor particle deposition, occurs in addition to thatoccurring in the environmental chambers. Particle deposition rateslargely depend on the particle size distribution and the ventilationrate in the room. This assumption increases the conservatism ofthe consumer exposure estimates.
2.2.2. Consumers candle use practicesConsumer exposure to candle emissions is determined by the
candle emission itself and consumer candle use patterns. A signif-icant market research investigation on consumer air freshenershopping and use behavior was commissioned by the Belgian Min-istry of Health to have a better basis for conducting consumerexposure assessments to chemicals released from air freshenerincluding scented candles. This research was conducted by themarket research firm IPSOS and completed in 2006 (IPSOS, 2006).Under the European Union Health Programme 2008–2013, theEuropean Commission launched the EPHECT project which is aEuropean collaborative action focusing on surveying use as wellas identifying and assessing risks associated with indoor air pollu-tants emitted by a selection of consumer products includingscented candles (VITO, 2006; EU, 2011). This project is expectedto be completed in 2013, but results of this survey were not yetpublicly available at the time of this publication.
The IPSOS consumer research was performed via the computerassisted personal interview (CAPI) method on the basis of 646interviews of randomly selected and representative individuals liv-ing in Belgium with purchasing responsibility in their families.Specifically with regard to scented candles, the following consum-ers’ habits and practices were identified by IPSOS (2006):
� 92% of the consumers use scented candles in the living room, 9%in the kitchen and dining area and 6% in adults’ bedroom.� On average scented candles are used 8.3 times/month in the liv-
ing room, 9.8 times/month in the kitchen and dining area and7.1 times/month in adults’ bedroom.� The average use of scented candles is 2.4 h in the living room, 2 h
in the adult bedroom and 1.9 h in the kitchen and dining area.� In terms of ‘intensity’ [defined as (use) � (frequency)], 88% of
the purchased scented candles are used in the living room, 7%in the kitchen and dining area and 5% in adult bedrooms.
3. Results
3.1. Chamber emission studies
Tables 3–6 summarize the results obtained in the small andlarge chamber emission studies. The tables present the maximum
anic compounds.
Naphthalene Toluene Styrene Total xylenes
lg/m3 lg/h lg/m3 lg/h lg/m3 lg/h lg/m3 lg/h
6.68 7.70 8.88 11.40 17.85 20.70 8.80 10.204.48 5.20 9.24 14.60 16.21 18.80 10.26 14.502.89 0.50 2.37 2.60 1.55 1.80 2.89 3.300.99 1.70 3.79 6.50 1.51 1.80 1.37 2.401.60 1.90 14.15 16.30 69.63 80.60 6.68 7.703.75 2.80 5.65 7.70 12.51 16.20 12.58 19.200.10 0.20 0.28 0.30 0.09 0.20 0.31 0.50
4.40 56.50 3.30 42.40 3.40 43.70 2.30 29.600.40 5.10 1.00 12.90 2.00 25.70 0.50 6.40
0.13 3.24 3.30 84.80 2.20 56.50 <1.00 <25.700.03 0.72 <1.00 <25.70 <1.00 <25.70 <1.00 <25.70

Table 4Measured maximum chamber concentrations and calculated emission rates of volatile fragrance materials.
Study Candle Code Cinnamic aldehyde Citral Pure Coumarin Eugenol F Limonene Liliaal Linalool Linalyl acetate
lg/m3 lg/h lg/m3 lg/h lg/m3 lg/h lg/m3 lg/h lg/m3 lg/h lg/m3 lg/h lg/m3 lg/h lg/m3 lg/h
LCS1 FC7 – – – – – – – – 9.5 122.0 33.6 432.0 137 1760.0 – –FC8 – – – – – – – – 3.5 45.0 <0.1 <1.3 11.4 146 – –
LCS2 FC9 12.4 319 22.6 581 3.0 77.1 18.2 468 – – – – – – 3.9 100UFC2 <1.0 <25.7 <1.0 <25.7 <1.0 <25.7 <1.0 <25.7 – – – – – – <1.0 <25.7
Table 5Measured maximum chamber concentrations and calculated emission rates of polycyclic aromatic hydrocarbons (PAH) and polychlorinated dibenzodioxins/furans (PCDD/PCDF).
Study Candle code Benzo(a)anthracene
Benzo(k,f)fluoranthene
Benzo(a)pyrene
Dibenz(a,h)anthracene
Indeno(1,2,3-cd)pyrene
Benzo(g,h,i)perylene
2,3,7,8-TCDD(TEF = 1)
1,2,3,7,8-PeCDD(TEF = 1)
2,3,4,7,8-PeCDF(TEF = 0.3)
lg/m3 lg/h lg/m3 lg/h lg/m3 lg/h lg/m3 lg/h lg/m3 lg/h lg/m3 lg/h pg/m3 pg/h pg/m3 pg/h pg/m3 pg/h
LCS2 FC9 <0.01 <0.21 <0.01 <0.21 <0.01 <0.21 <0.01 <0.21 <0.01 <0.21 <0.01 <0.21 <1.43 <36.80 <0.96 <24.70 <1.22 <31.40UFC2 <0.01 <0.21 <0.01 <0.21 <0.01 <0.21 <0.01 <0.21 <0.01 <0.21 <0.01 <0.21 <1.36 <35.00 <0.87 <22.40 <1.11 <28.50
Table 6Measured burn and post-burn particulate chamber concentrations and calculated emission rates.
Study Candle code Burn Post-burn
PM2.5 PM10 PM2.5 PM10
lg/m3 lg/h lg/m3 lg/h lg/m3 lg/h lg/m3 lg/h
LCS1 FC7 1 13 4 51 844 10,800 1060 13,600FC8 1 13 6 77 267 3430 350 4500
LCS2 FC9 8 206 – – 17 437 – –UFC2 9 231 – – 55 1410 – –
62 T. Petry et al. / Regulatory Toxicology and Pharmacology 69 (2014) 55–70
measured chamber concentrations and emission rates of non-fragrance VOCs (Table 3), volatile fragrance compounds (Table 4),semi-volatile PAHs and PCDD/PCDF (Table 5) and particulate mat-ter (Table 6). Candle emissions of volatile fragrance compounds,SVOCs and particulate matter were only investigated in the largechamber studies.
While VOC and fragrance-VOC emissions from scented candleswere clearly measurable and discernible from the chamber back-ground concentrations, semi-volatile PAHs and PCDD/PCDF emis-sions were below the detection limit (i.e., <0.01 lg/m3 for PAHs;<1.5 pg/m3 for PCDD/PCDF) and therefore not identifiable. The par-ticulate matter concentrations and emission rates for PM2.5 andPM10 are presented for the burn and the post-burn phase, takinginto account that, following extinction of the candle, there is asharp increase in PM-emissions by the candle.
3.2. Estimation of room-specific human indoor air exposureconcentrations
Peak as well as 24 h time-weighted average human indoor airexposure concentrations have been calculated for each measuredemission at highest emission rate using the conservative ConsExpo1-box model as well as the more refined RIFM 2-Box indoor air dis-persion model. The results obtained for volatile and semi-volatileas well as for particulate matters are presented in Table 7.
4. Discussion
In this investigation, the emissions of VOC, SVOC and/or PM of atotal of nine scented candles were investigated in 3 independentstudies in external quality-controlled contract research laborato-ries. The methodology to measure candle emissions largely
followed the frame protocol described later by Petry et al. (2013)with regard to the experimental set-up, study protocol, meteoro-logical conditions and analytical methods used to measure VOCemissions from candles according to existing ISO- and/or ASTMstandards.
Similar to other candle emission studies published previously(e.g., Vito, 2006), some uncertainties relate to the lack of monitor-ing of possible changes of chamber temperature, relative humidity,surface velocity and the degree of oxygen depletion during theexperiments. These factors have been identified to impact thequality of the candle burn and subsequently the candle emissionpattern (Petry et al., 2013). On the basis of their investigations onformaldehyde and benzene emissions from scented candles inenvironmental test chambers, Petry et al. (2013) obtained repro-ducible results when the chamber temperature and relativehumidity (RH) did not exceed 30� and 75% RH throughout theexperiments. Likewise, the oxygen concentration should notdecrease by more than 2% throughout the experiment. Moreover,Petry et al. (2013) considered it important to include a referencecandle group outside the chamber which should be burned in par-allel to those inside the chamber to monitor the chamber candle’sburn rate. A minimal difference in burn rates of 615% between in-side and outside the testing chamber is considered to reflect stableburn conditions within the chamber. Despite the limitations of notfully controlling these parameters during the experiments under-lying this investigation, the emission rates that have taken forwardto model consumer exposures are considered suitable for healthrisk evaluation purposes as they are higher, hence more conserva-tive than those that can be derived from other comparable candleemission investigations (Vito, 2006, 2008; Petry et al., 2013).
Consumer risks associated with the inhalation exposure to can-dle emissions can be characterized by comparing estimated human
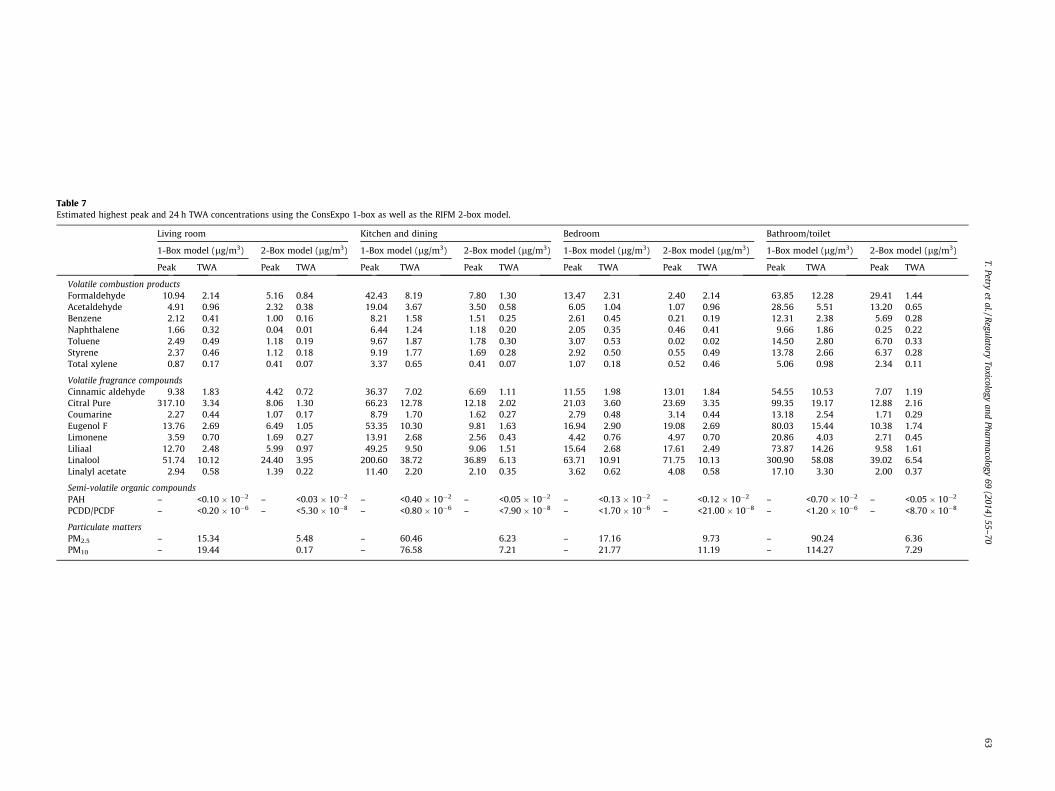
Table 7Estimated highest peak and 24 h TWA concentrations using the ConsExpo 1-box as well as the RIFM 2-box model.
Living room Kitchen and dining Bedroom Bathroom/toilet
1-Box model (lg/m3) 2-Box model (lg/m3) 1-Box model (lg/m3) 2-Box model (lg/m3) 1-Box model (lg/m3) 2-Box model (lg/m3) 1-Box model (lg/m3) 2-Box model (lg/m3)
Peak TWA Peak TWA Peak TWA Peak TWA Peak TWA Peak TWA Peak TWA Peak TWA
Volatile combustion productsFormaldehyde 10.94 2.14 5.16 0.84 42.43 8.19 7.80 1.30 13.47 2.31 2.40 2.14 63.85 12.28 29.41 1.44Acetaldehyde 4.91 0.96 2.32 0.38 19.04 3.67 3.50 0.58 6.05 1.04 1.07 0.96 28.56 5.51 13.20 0.65Benzene 2.12 0.41 1.00 0.16 8.21 1.58 1.51 0.25 2.61 0.45 0.21 0.19 12.31 2.38 5.69 0.28Naphthalene 1.66 0.32 0.04 0.01 6.44 1.24 1.18 0.20 2.05 0.35 0.46 0.41 9.66 1.86 0.25 0.22Toluene 2.49 0.49 1.18 0.19 9.67 1.87 1.78 0.30 3.07 0.53 0.02 0.02 14.50 2.80 6.70 0.33Styrene 2.37 0.46 1.12 0.18 9.19 1.77 1.69 0.28 2.92 0.50 0.55 0.49 13.78 2.66 6.37 0.28Total xylene 0.87 0.17 0.41 0.07 3.37 0.65 0.41 0.07 1.07 0.18 0.52 0.46 5.06 0.98 2.34 0.11
Volatile fragrance compoundsCinnamic aldehyde 9.38 1.83 4.42 0.72 36.37 7.02 6.69 1.11 11.55 1.98 13.01 1.84 54.55 10.53 7.07 1.19Citral Pure 317.10 3.34 8.06 1.30 66.23 12.78 12.18 2.02 21.03 3.60 23.69 3.35 99.35 19.17 12.88 2.16Coumarine 2.27 0.44 1.07 0.17 8.79 1.70 1.62 0.27 2.79 0.48 3.14 0.44 13.18 2.54 1.71 0.29Eugenol F 13.76 2.69 6.49 1.05 53.35 10.30 9.81 1.63 16.94 2.90 19.08 2.69 80.03 15.44 10.38 1.74Limonene 3.59 0.70 1.69 0.27 13.91 2.68 2.56 0.43 4.42 0.76 4.97 0.70 20.86 4.03 2.71 0.45Liliaal 12.70 2.48 5.99 0.97 49.25 9.50 9.06 1.51 15.64 2.68 17.61 2.49 73.87 14.26 9.58 1.61Linalool 51.74 10.12 24.40 3.95 200.60 38.72 36.89 6.13 63.71 10.91 71.75 10.13 300.90 58.08 39.02 6.54Linalyl acetate 2.94 0.58 1.39 0.22 11.40 2.20 2.10 0.35 3.62 0.62 4.08 0.58 17.10 3.30 2.00 0.37
Semi-volatile organic compoundsPAH – <0.10 � 10�2 – <0.03 � 10�2 – <0.40 � 10�2 – <0.05 � 10�2 – <0.13 � 10�2 – <0.12 � 10�2 – <0.70 � 10�2 – <0.05 � 10�2
PCDD/PCDF – <0.20 � 10�6 – <5.30 � 10�8 – <0.80 � 10�6 – <7.90 � 10�8 – <1.70 � 10�6 – <21.00 � 10�8 – <1.20 � 10�6 – <8.70 � 10�8
Particulate mattersPM2.5 – 15.34 5.48 – 60.46 6.23 – 17.16 9.73 – 90.24 6.36PM10 – 19.44 0.17 – 76.58 7.21 – 21.77 11.19 – 114.27 7.29
T.Petryet
al./Regulatory
Toxicologyand
Pharmacology
69(2014)
55–70
63
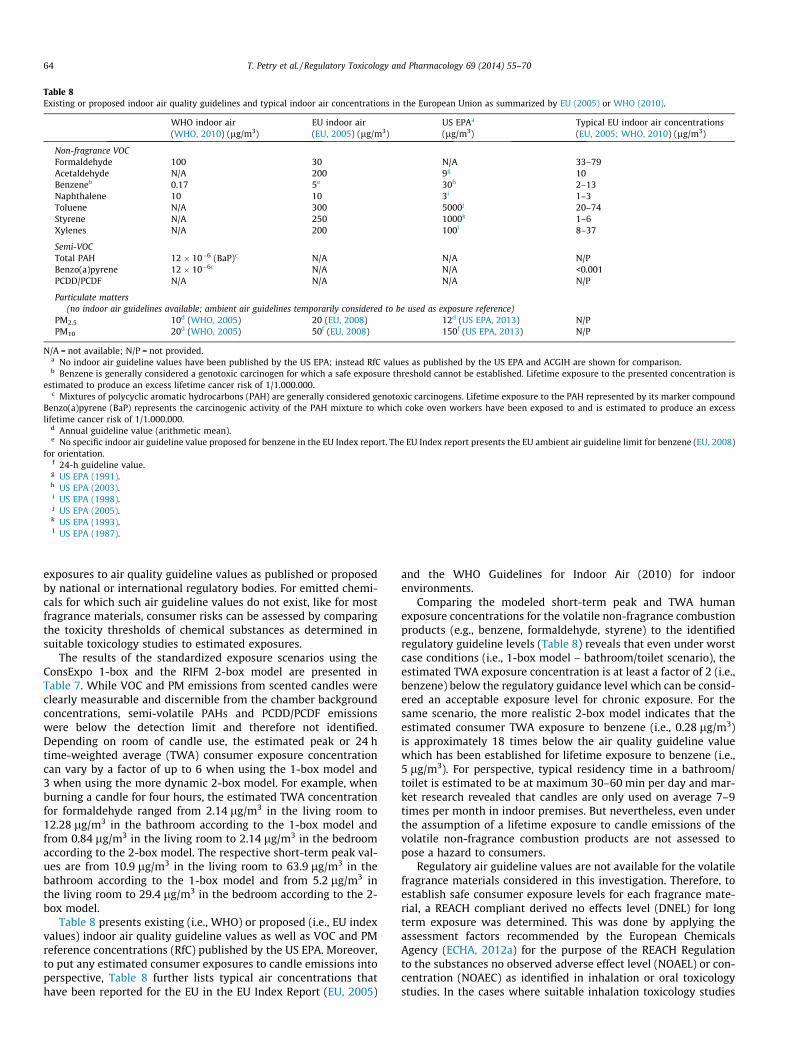
Table 8Existing or proposed indoor air quality guidelines and typical indoor air concentrations in the European Union as summarized by EU (2005) or WHO (2010).
WHO indoor air(WHO, 2010) (lg/m3)
EU indoor air(EU, 2005) (lg/m3)
US EPAa
(lg/m3)Typical EU indoor air concentrations(EU, 2005; WHO, 2010) (lg/m3)
Non-fragrance VOCFormaldehyde 100 30 N/A 33–79Acetaldehyde N/A 200 9g 10Benzeneb 0.17 5e 30h 2–13Naphthalene 10 10 3i 1–3Toluene N/A 300 5000j 20–74Styrene N/A 250 1000k 1–6Xylenes N/A 200 100l 8–37
Semi-VOCTotal PAH 12 � 10�6 (BaP)c N/A N/A N/PBenzo(a)pyrene 12 � 10�6c N/A N/A <0.001PCDD/PCDF N/A N/A N/A N/P
Particulate matters(no indoor air guidelines available; ambient air guidelines temporarily considered to be used as exposure reference)
PM2.5 10d (WHO, 2005) 20 (EU, 2008) 12d (US EPA, 2013) N/PPM10 20d (WHO, 2005) 50f (EU, 2008) 150f (US EPA, 2013) N/P
N/A = not available; N/P = not provided.a No indoor air guideline values have been published by the US EPA; instead RfC values as published by the US EPA and ACGIH are shown for comparison.b Benzene is generally considered a genotoxic carcinogen for which a safe exposure threshold cannot be established. Lifetime exposure to the presented concentration is
estimated to produce an excess lifetime cancer risk of 1/1.000.000.c Mixtures of polycyclic aromatic hydrocarbons (PAH) are generally considered genotoxic carcinogens. Lifetime exposure to the PAH represented by its marker compound
Benzo(a)pyrene (BaP) represents the carcinogenic activity of the PAH mixture to which coke oven workers have been exposed to and is estimated to produce an excesslifetime cancer risk of 1/1.000.000.
d Annual guideline value (arithmetic mean).e No specific indoor air guideline value proposed for benzene in the EU Index report. The EU Index report presents the EU ambient air guideline limit for benzene (EU, 2008)
for orientation.f 24-h guideline value.g US EPA (1991).h US EPA (2003).i US EPA (1998).j US EPA (2005).k US EPA (1993).l US EPA (1987).
64 T. Petry et al. / Regulatory Toxicology and Pharmacology 69 (2014) 55–70
exposures to air quality guideline values as published or proposedby national or international regulatory bodies. For emitted chemi-cals for which such air guideline values do not exist, like for mostfragrance materials, consumer risks can be assessed by comparingthe toxicity thresholds of chemical substances as determined insuitable toxicology studies to estimated exposures.
The results of the standardized exposure scenarios using theConsExpo 1-box and the RIFM 2-box model are presented inTable 7. While VOC and PM emissions from scented candles wereclearly measurable and discernible from the chamber backgroundconcentrations, semi-volatile PAHs and PCDD/PCDF emissionswere below the detection limit and therefore not identified.Depending on room of candle use, the estimated peak or 24 htime-weighted average (TWA) consumer exposure concentrationcan vary by a factor of up to 6 when using the 1-box model and3 when using the more dynamic 2-box model. For example, whenburning a candle for four hours, the estimated TWA concentrationfor formaldehyde ranged from 2.14 lg/m3 in the living room to12.28 lg/m3 in the bathroom according to the 1-box model andfrom 0.84 lg/m3 in the living room to 2.14 lg/m3 in the bedroomaccording to the 2-box model. The respective short-term peak val-ues are from 10.9 lg/m3 in the living room to 63.9 lg/m3 in thebathroom according to the 1-box model and from 5.2 lg/m3 inthe living room to 29.4 lg/m3 in the bedroom according to the 2-box model.
Table 8 presents existing (i.e., WHO) or proposed (i.e., EU indexvalues) indoor air quality guideline values as well as VOC and PMreference concentrations (RfC) published by the US EPA. Moreover,to put any estimated consumer exposures to candle emissions intoperspective, Table 8 further lists typical air concentrations thathave been reported for the EU in the EU Index Report (EU, 2005)
and the WHO Guidelines for Indoor Air (2010) for indoorenvironments.
Comparing the modeled short-term peak and TWA humanexposure concentrations for the volatile non-fragrance combustionproducts (e.g., benzene, formaldehyde, styrene) to the identifiedregulatory guideline levels (Table 8) reveals that even under worstcase conditions (i.e., 1-box model – bathroom/toilet scenario), theestimated TWA exposure concentration is at least a factor of 2 (i.e.,benzene) below the regulatory guidance level which can be consid-ered an acceptable exposure level for chronic exposure. For thesame scenario, the more realistic 2-box model indicates that theestimated consumer TWA exposure to benzene (i.e., 0.28 lg/m3)is approximately 18 times below the air quality guideline valuewhich has been established for lifetime exposure to benzene (i.e.,5 lg/m3). For perspective, typical residency time in a bathroom/toilet is estimated to be at maximum 30–60 min per day and mar-ket research revealed that candles are only used on average 7–9times per month in indoor premises. But nevertheless, even underthe assumption of a lifetime exposure to candle emissions of thevolatile non-fragrance combustion products are not assessed topose a hazard to consumers.
Regulatory air guideline values are not available for the volatilefragrance materials considered in this investigation. Therefore, toestablish safe consumer exposure levels for each fragrance mate-rial, a REACH compliant derived no effects level (DNEL) for longterm exposure was determined. This was done by applying theassessment factors recommended by the European ChemicalsAgency (ECHA, 2012a) for the purpose of the REACH Regulationto the substances no observed adverse effect level (NOAEL) or con-centration (NOAEC) as identified in inhalation or oral toxicologystudies. In the cases where suitable inhalation toxicology studies
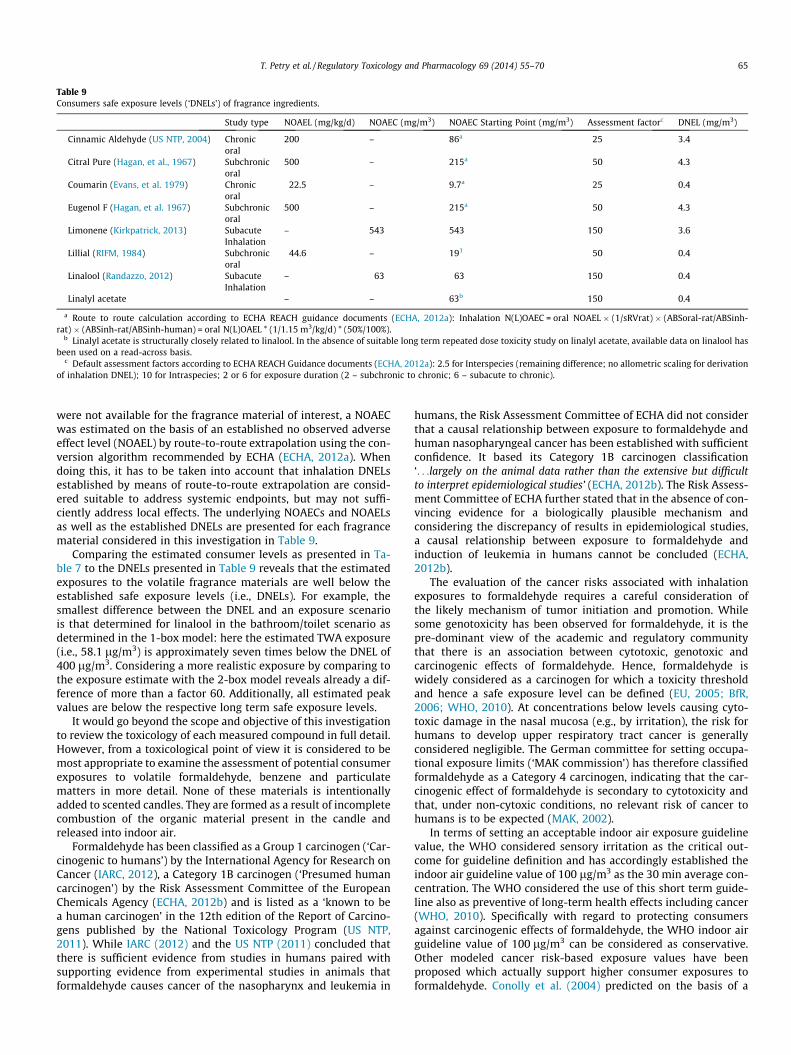
Table 9Consumers safe exposure levels (‘DNELs’) of fragrance ingredients.
Study type NOAEL (mg/kg/d) NOAEC (mg/m3) NOAEC Starting Point (mg/m3) Assessment factorc DNEL (mg/m3)
Cinnamic Aldehyde (US NTP, 2004) Chronicoral
200 – 86a 25 3.4
Citral Pure (Hagan, et al., 1967) Subchronicoral
500 – 215a 50 4.3
Coumarin (Evans, et al. 1979) Chronicoral
22.5 – 9.7a 25 0.4
Eugenol F (Hagan, et al. 1967) Subchronicoral
500 – 215a 50 4.3
Limonene (Kirkpatrick, 2013) SubacuteInhalation
– 543 543 150 3.6
Lillial (RIFM, 1984) Subchronicoral
44.6 – 191 50 0.4
Linalool (Randazzo, 2012) SubacuteInhalation
– 63 63 150 0.4
Linalyl acetate – – 63b 150 0.4
a Route to route calculation according to ECHA REACH guidance documents (ECHA, 2012a): Inhalation N(L)OAEC = oral NOAEL � (1/sRVrat) � (ABSoral-rat/ABSinh-rat) � (ABSinh-rat/ABSinh-human) = oral N(L)OAEL * (1/1.15 m3/kg/d) * (50%/100%).
b Linalyl acetate is structurally closely related to linalool. In the absence of suitable long term repeated dose toxicity study on linalyl acetate, available data on linalool hasbeen used on a read-across basis.
c Default assessment factors according to ECHA REACH Guidance documents (ECHA, 2012a): 2.5 for Interspecies (remaining difference; no allometric scaling for derivationof inhalation DNEL); 10 for Intraspecies; 2 or 6 for exposure duration (2 – subchronic to chronic; 6 – subacute to chronic).
T. Petry et al. / Regulatory Toxicology and Pharmacology 69 (2014) 55–70 65
were not available for the fragrance material of interest, a NOAECwas estimated on the basis of an established no observed adverseeffect level (NOAEL) by route-to-route extrapolation using the con-version algorithm recommended by ECHA (ECHA, 2012a). Whendoing this, it has to be taken into account that inhalation DNELsestablished by means of route-to-route extrapolation are consid-ered suitable to address systemic endpoints, but may not suffi-ciently address local effects. The underlying NOAECs and NOAELsas well as the established DNELs are presented for each fragrancematerial considered in this investigation in Table 9.
Comparing the estimated consumer levels as presented in Ta-ble 7 to the DNELs presented in Table 9 reveals that the estimatedexposures to the volatile fragrance materials are well below theestablished safe exposure levels (i.e., DNELs). For example, thesmallest difference between the DNEL and an exposure scenariois that determined for linalool in the bathroom/toilet scenario asdetermined in the 1-box model: here the estimated TWA exposure(i.e., 58.1 lg/m3) is approximately seven times below the DNEL of400 lg/m3. Considering a more realistic exposure by comparing tothe exposure estimate with the 2-box model reveals already a dif-ference of more than a factor 60. Additionally, all estimated peakvalues are below the respective long term safe exposure levels.
It would go beyond the scope and objective of this investigationto review the toxicology of each measured compound in full detail.However, from a toxicological point of view it is considered to bemost appropriate to examine the assessment of potential consumerexposures to volatile formaldehyde, benzene and particulatematters in more detail. None of these materials is intentionallyadded to scented candles. They are formed as a result of incompletecombustion of the organic material present in the candle andreleased into indoor air.
Formaldehyde has been classified as a Group 1 carcinogen (‘Car-cinogenic to humans’) by the International Agency for Research onCancer (IARC, 2012), a Category 1B carcinogen (‘Presumed humancarcinogen’) by the Risk Assessment Committee of the EuropeanChemicals Agency (ECHA, 2012b) and is listed as a ‘known to bea human carcinogen’ in the 12th edition of the Report of Carcino-gens published by the National Toxicology Program (US NTP,2011). While IARC (2012) and the US NTP (2011) concluded thatthere is sufficient evidence from studies in humans paired withsupporting evidence from experimental studies in animals thatformaldehyde causes cancer of the nasopharynx and leukemia in
humans, the Risk Assessment Committee of ECHA did not considerthat a causal relationship between exposure to formaldehyde andhuman nasopharyngeal cancer has been established with sufficientconfidence. It based its Category 1B carcinogen classification‘. . .largely on the animal data rather than the extensive but difficultto interpret epidemiological studies’ (ECHA, 2012b). The Risk Assess-ment Committee of ECHA further stated that in the absence of con-vincing evidence for a biologically plausible mechanism andconsidering the discrepancy of results in epidemiological studies,a causal relationship between exposure to formaldehyde andinduction of leukemia in humans cannot be concluded (ECHA,2012b).
The evaluation of the cancer risks associated with inhalationexposures to formaldehyde requires a careful consideration ofthe likely mechanism of tumor initiation and promotion. Whilesome genotoxicity has been observed for formaldehyde, it is thepre-dominant view of the academic and regulatory communitythat there is an association between cytotoxic, genotoxic andcarcinogenic effects of formaldehyde. Hence, formaldehyde iswidely considered as a carcinogen for which a toxicity thresholdand hence a safe exposure level can be defined (EU, 2005; BfR,2006; WHO, 2010). At concentrations below levels causing cyto-toxic damage in the nasal mucosa (e.g., by irritation), the risk forhumans to develop upper respiratory tract cancer is generallyconsidered negligible. The German committee for setting occupa-tional exposure limits (‘MAK commission’) has therefore classifiedformaldehyde as a Category 4 carcinogen, indicating that the car-cinogenic effect of formaldehyde is secondary to cytotoxicity andthat, under non-cytoxic conditions, no relevant risk of cancer tohumans is to be expected (MAK, 2002).
In terms of setting an acceptable indoor air exposure guidelinevalue, the WHO considered sensory irritation as the critical out-come for guideline definition and has accordingly established theindoor air guideline value of 100 lg/m3 as the 30 min average con-centration. The WHO considered the use of this short term guide-line also as preventive of long-term health effects including cancer(WHO, 2010). Specifically with regard to protecting consumersagainst carcinogenic effects of formaldehyde, the WHO indoor airguideline value of 100 lg/m3 can be considered as conservative.Other modeled cancer risk-based exposure values have beenproposed which actually support higher consumer exposures toformaldehyde. Conolly et al. (2004) predicted on the basis of a
66 T. Petry et al. / Regulatory Toxicology and Pharmacology 69 (2014) 55–70
biologically motivated computational modeling of the combinedrodent and human dataset an additional risk of upper respiratorytract cancer of 10�6 or less for non-smokers exposed continuouslyto 200 ppm (i.e., 246 lg/m3) formaldehyde. Using a similar model-ing approach, the German Federal Institute for Risk Assessment(BfR, 2006) concluded that a level of 100 ppm (i.e., 123 lg/m3)formaldehyde is ‘safe’ for the general population.
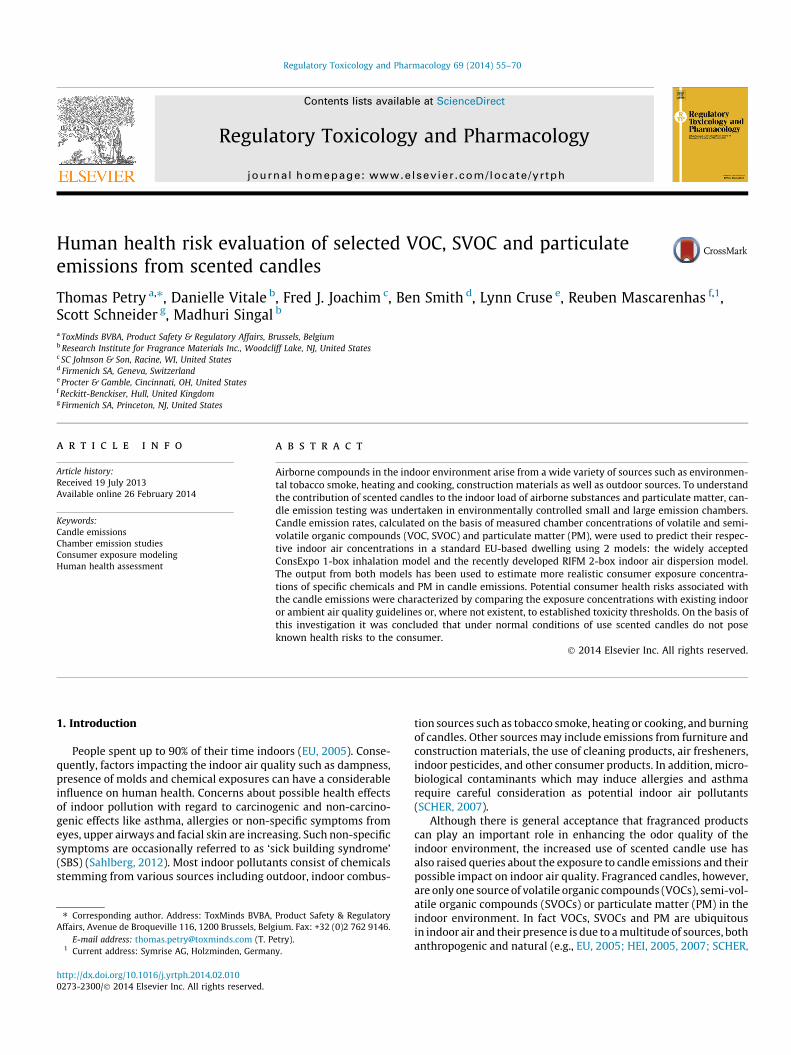
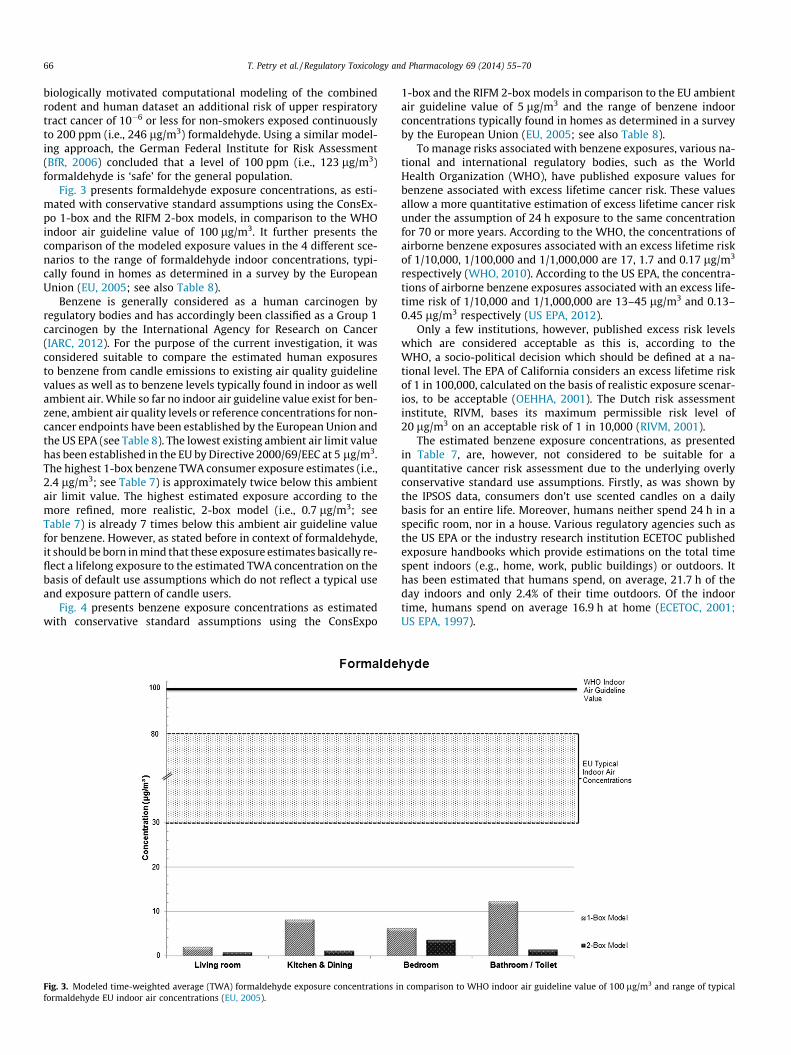
Fig. 3 presents formaldehyde exposure concentrations, as esti-mated with conservative standard assumptions using the ConsEx-po 1-box and the RIFM 2-box models, in comparison to the WHOindoor air guideline value of 100 lg/m3. It further presents thecomparison of the modeled exposure values in the 4 different sce-narios to the range of formaldehyde indoor concentrations, typi-cally found in homes as determined in a survey by the EuropeanUnion (EU, 2005; see also Table 8).
Benzene is generally considered as a human carcinogen byregulatory bodies and has accordingly been classified as a Group 1carcinogen by the International Agency for Research on Cancer(IARC, 2012). For the purpose of the current investigation, it wasconsidered suitable to compare the estimated human exposuresto benzene from candle emissions to existing air quality guidelinevalues as well as to benzene levels typically found in indoor as wellambient air. While so far no indoor air guideline value exist for ben-zene, ambient air quality levels or reference concentrations for non-cancer endpoints have been established by the European Union andthe US EPA (see Table 8). The lowest existing ambient air limit valuehas been established in the EU by Directive 2000/69/EEC at 5 lg/m3.The highest 1-box benzene TWA consumer exposure estimates (i.e.,2.4 lg/m3; see Table 7) is approximately twice below this ambientair limit value. The highest estimated exposure according to themore refined, more realistic, 2-box model (i.e., 0.7 lg/m3; seeTable 7) is already 7 times below this ambient air guideline valuefor benzene. However, as stated before in context of formaldehyde,it should be born in mind that these exposure estimates basically re-flect a lifelong exposure to the estimated TWA concentration on thebasis of default use assumptions which do not reflect a typical useand exposure pattern of candle users.
Fig. 4 presents benzene exposure concentrations as estimatedwith conservative standard assumptions using the ConsExpo
Fig. 3. Modeled time-weighted average (TWA) formaldehyde exposure concentrations iformaldehyde EU indoor air concentrations (EU, 2005).
1-box and the RIFM 2-box models in comparison to the EU ambientair guideline value of 5 lg/m3 and the range of benzene indoorconcentrations typically found in homes as determined in a surveyby the European Union (EU, 2005; see also Table 8).
To manage risks associated with benzene exposures, various na-tional and international regulatory bodies, such as the WorldHealth Organization (WHO), have published exposure values forbenzene associated with excess lifetime cancer risk. These valuesallow a more quantitative estimation of excess lifetime cancer riskunder the assumption of 24 h exposure to the same concentrationfor 70 or more years. According to the WHO, the concentrations ofairborne benzene exposures associated with an excess lifetime riskof 1/10,000, 1/100,000 and 1/1,000,000 are 17, 1.7 and 0.17 lg/m3
respectively (WHO, 2010). According to the US EPA, the concentra-tions of airborne benzene exposures associated with an excess life-time risk of 1/10,000 and 1/1,000,000 are 13–45 lg/m3 and 0.13–0.45 lg/m3 respectively (US EPA, 2012).
Only a few institutions, however, published excess risk levelswhich are considered acceptable as this is, according to theWHO, a socio-political decision which should be defined at a na-tional level. The EPA of California considers an excess lifetime riskof 1 in 100,000, calculated on the basis of realistic exposure scenar-ios, to be acceptable (OEHHA, 2001). The Dutch risk assessmentinstitute, RIVM, bases its maximum permissible risk level of20 lg/m3 on an acceptable risk of 1 in 10,000 (RIVM, 2001).
The estimated benzene exposure concentrations, as presentedin Table 7, are, however, not considered to be suitable for aquantitative cancer risk assessment due to the underlying overlyconservative standard use assumptions. Firstly, as was shown bythe IPSOS data, consumers don’t use scented candles on a dailybasis for an entire life. Moreover, humans neither spend 24 h in aspecific room, nor in a house. Various regulatory agencies such asthe US EPA or the industry research institution ECETOC publishedexposure handbooks which provide estimations on the total timespent indoors (e.g., home, work, public buildings) or outdoors. Ithas been estimated that humans spend, on average, 21.7 h of theday indoors and only 2.4% of their time outdoors. Of the indoortime, humans spend on average 16.9 h at home (ECETOC, 2001;US EPA, 1997).
n comparison to WHO indoor air guideline value of 100 lg/m3 and range of typical
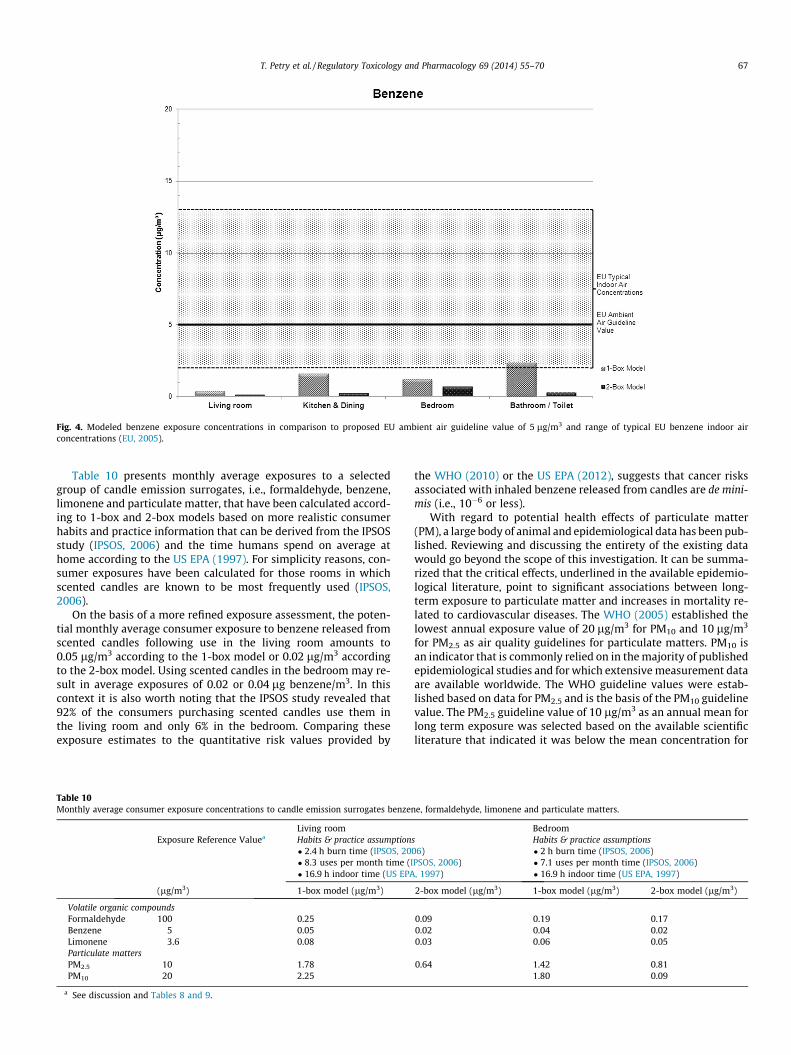
Fig. 4. Modeled benzene exposure concentrations in comparison to proposed EU ambient air guideline value of 5 lg/m3 and range of typical EU benzene indoor airconcentrations (EU, 2005).
T. Petry et al. / Regulatory Toxicology and Pharmacology 69 (2014) 55–70 67
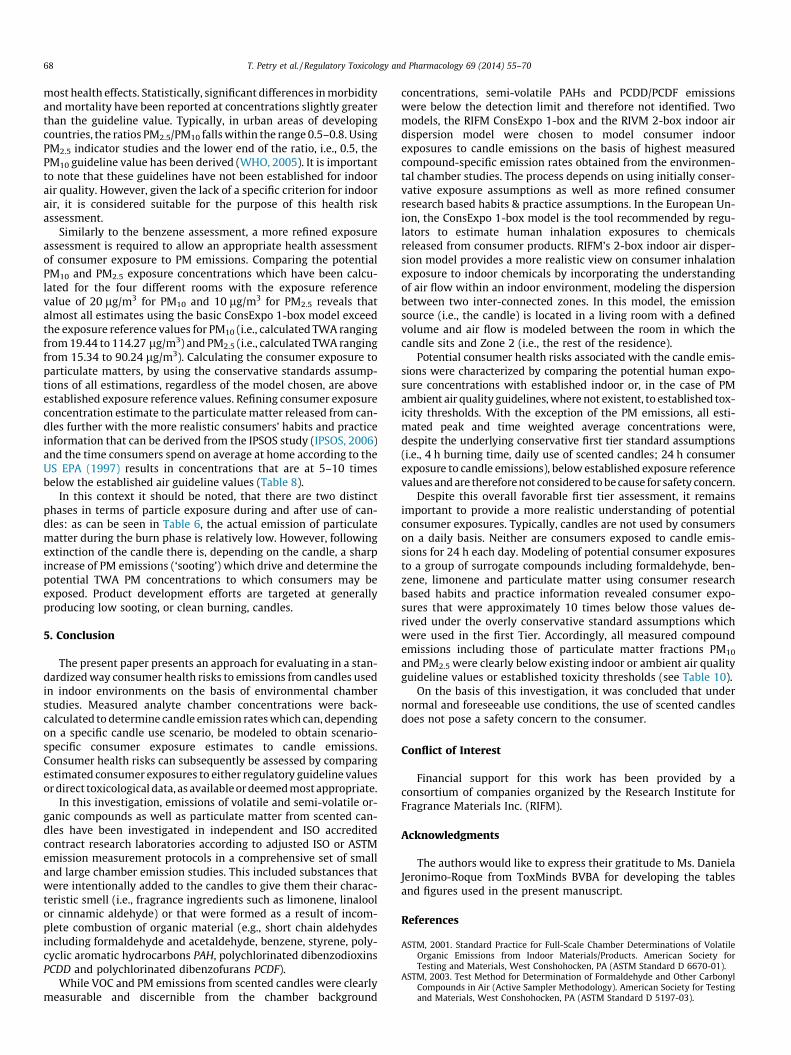
Table 10 presents monthly average exposures to a selectedgroup of candle emission surrogates, i.e., formaldehyde, benzene,limonene and particulate matter, that have been calculated accord-ing to 1-box and 2-box models based on more realistic consumerhabits and practice information that can be derived from the IPSOSstudy (IPSOS, 2006) and the time humans spend on average athome according to the US EPA (1997). For simplicity reasons, con-sumer exposures have been calculated for those rooms in whichscented candles are known to be most frequently used (IPSOS,2006).
On the basis of a more refined exposure assessment, the poten-tial monthly average consumer exposure to benzene released fromscented candles following use in the living room amounts to0.05 lg/m3 according to the 1-box model or 0.02 lg/m3 accordingto the 2-box model. Using scented candles in the bedroom may re-sult in average exposures of 0.02 or 0.04 lg benzene/m3. In thiscontext it is also worth noting that the IPSOS study revealed that92% of the consumers purchasing scented candles use them inthe living room and only 6% in the bedroom. Comparing theseexposure estimates to the quantitative risk values provided by
Table 10Monthly average consumer exposure concentrations to candle emission surrogates benzen
Living roomExposure Reference Valuea Habits & practice assumption
� 2.4 h burn time (IPSOS, 20� 8.3 uses per month time (I� 16.9 h indoor time (US EPA
(lg/m3) 1-box model (lg/m3)
Volatile organic compoundsFormaldehyde 100 0.25Benzene 5 0.05Limonene 3.6 0.08Particulate mattersPM2.5 10 1.78PM10 20 2.25
a See discussion and Tables 8 and 9.
the WHO (2010) or the US EPA (2012), suggests that cancer risksassociated with inhaled benzene released from candles are de mini-mis (i.e., 10�6 or less).
With regard to potential health effects of particulate matter(PM), a large body of animal and epidemiological data has been pub-lished. Reviewing and discussing the entirety of the existing datawould go beyond the scope of this investigation. It can be summa-rized that the critical effects, underlined in the available epidemio-logical literature, point to significant associations between long-term exposure to particulate matter and increases in mortality re-lated to cardiovascular diseases. The WHO (2005) established thelowest annual exposure value of 20 lg/m3 for PM10 and 10 lg/m3
for PM2.5 as air quality guidelines for particulate matters. PM10 isan indicator that is commonly relied on in the majority of publishedepidemiological studies and for which extensive measurement dataare available worldwide. The WHO guideline values were estab-lished based on data for PM2.5 and is the basis of the PM10 guidelinevalue. The PM2.5 guideline value of 10 lg/m3 as an annual mean forlong term exposure was selected based on the available scientificliterature that indicated it was below the mean concentration for
e, formaldehyde, limonene and particulate matters.
Bedrooms Habits & practice assumptions06)PSOS, 2006), 1997)
� 2 h burn time (IPSOS, 2006)� 7.1 uses per month time (IPSOS, 2006)� 16.9 h indoor time (US EPA, 1997)
2-box model (lg/m3) 1-box model (lg/m3) 2-box model (lg/m3)
0.09 0.19 0.170.02 0.04 0.020.03 0.06 0.05
0.64 1.42 0.811.80 0.09
68 T. Petry et al. / Regulatory Toxicology and Pharmacology 69 (2014) 55–70
most health effects. Statistically, significant differences in morbidityand mortality have been reported at concentrations slightly greaterthan the guideline value. Typically, in urban areas of developingcountries, the ratios PM2.5/PM10 falls within the range 0.5–0.8. UsingPM2.5 indicator studies and the lower end of the ratio, i.e., 0.5, thePM10 guideline value has been derived (WHO, 2005). It is importantto note that these guidelines have not been established for indoorair quality. However, given the lack of a specific criterion for indoorair, it is considered suitable for the purpose of this health riskassessment.
Similarly to the benzene assessment, a more refined exposureassessment is required to allow an appropriate health assessmentof consumer exposure to PM emissions. Comparing the potentialPM10 and PM2.5 exposure concentrations which have been calcu-lated for the four different rooms with the exposure referencevalue of 20 lg/m3 for PM10 and 10 lg/m3 for PM2.5 reveals thatalmost all estimates using the basic ConsExpo 1-box model exceedthe exposure reference values for PM10 (i.e., calculated TWA rangingfrom 19.44 to 114.27 lg/m3) and PM2.5 (i.e., calculated TWA rangingfrom 15.34 to 90.24 lg/m3). Calculating the consumer exposure toparticulate matters, by using the conservative standards assump-tions of all estimations, regardless of the model chosen, are aboveestablished exposure reference values. Refining consumer exposureconcentration estimate to the particulate matter released from can-dles further with the more realistic consumers’ habits and practiceinformation that can be derived from the IPSOS study (IPSOS, 2006)and the time consumers spend on average at home according to theUS EPA (1997) results in concentrations that are at 5–10 timesbelow the established air guideline values (Table 8).
In this context it should be noted, that there are two distinctphases in terms of particle exposure during and after use of can-dles: as can be seen in Table 6, the actual emission of particulatematter during the burn phase is relatively low. However, followingextinction of the candle there is, depending on the candle, a sharpincrease of PM emissions (‘sooting’) which drive and determine thepotential TWA PM concentrations to which consumers may beexposed. Product development efforts are targeted at generallyproducing low sooting, or clean burning, candles.
5. Conclusion
The present paper presents an approach for evaluating in a stan-dardized way consumer health risks to emissions from candles usedin indoor environments on the basis of environmental chamberstudies. Measured analyte chamber concentrations were back-calculated to determine candle emission rates which can, dependingon a specific candle use scenario, be modeled to obtain scenario-specific consumer exposure estimates to candle emissions.Consumer health risks can subsequently be assessed by comparingestimated consumer exposures to either regulatory guideline valuesor direct toxicological data, as available or deemed most appropriate.
In this investigation, emissions of volatile and semi-volatile or-ganic compounds as well as particulate matter from scented can-dles have been investigated in independent and ISO accreditedcontract research laboratories according to adjusted ISO or ASTMemission measurement protocols in a comprehensive set of smalland large chamber emission studies. This included substances thatwere intentionally added to the candles to give them their charac-teristic smell (i.e., fragrance ingredients such as limonene, linaloolor cinnamic aldehyde) or that were formed as a result of incom-plete combustion of organic material (e.g., short chain aldehydesincluding formaldehyde and acetaldehyde, benzene, styrene, poly-cyclic aromatic hydrocarbons PAH, polychlorinated dibenzodioxinsPCDD and polychlorinated dibenzofurans PCDF).
While VOC and PM emissions from scented candles were clearlymeasurable and discernible from the chamber background
concentrations, semi-volatile PAHs and PCDD/PCDF emissionswere below the detection limit and therefore not identified. Twomodels, the RIFM ConsExpo 1-box and the RIVM 2-box indoor airdispersion model were chosen to model consumer indoorexposures to candle emissions on the basis of highest measuredcompound-specific emission rates obtained from the environmen-tal chamber studies. The process depends on using initially conser-vative exposure assumptions as well as more refined consumerresearch based habits & practice assumptions. In the European Un-ion, the ConsExpo 1-box model is the tool recommended by regu-lators to estimate human inhalation exposures to chemicalsreleased from consumer products. RIFM’s 2-box indoor air disper-sion model provides a more realistic view on consumer inhalationexposure to indoor chemicals by incorporating the understandingof air flow within an indoor environment, modeling the dispersionbetween two inter-connected zones. In this model, the emissionsource (i.e., the candle) is located in a living room with a definedvolume and air flow is modeled between the room in which thecandle sits and Zone 2 (i.e., the rest of the residence).
Potential consumer health risks associated with the candle emis-sions were characterized by comparing the potential human expo-sure concentrations with established indoor or, in the case of PMambient air quality guidelines, where not existent, to established tox-icity thresholds. With the exception of the PM emissions, all esti-mated peak and time weighted average concentrations were,despite the underlying conservative first tier standard assumptions(i.e., 4 h burning time, daily use of scented candles; 24 h consumerexposure to candle emissions), below established exposure referencevalues and are therefore not considered to be cause for safety concern.
Despite this overall favorable first tier assessment, it remainsimportant to provide a more realistic understanding of potentialconsumer exposures. Typically, candles are not used by consumerson a daily basis. Neither are consumers exposed to candle emis-sions for 24 h each day. Modeling of potential consumer exposuresto a group of surrogate compounds including formaldehyde, ben-zene, limonene and particulate matter using consumer researchbased habits and practice information revealed consumer expo-sures that were approximately 10 times below those values de-rived under the overly conservative standard assumptions whichwere used in the first Tier. Accordingly, all measured compoundemissions including those of particulate matter fractions PM10
and PM2.5 were clearly below existing indoor or ambient air qualityguideline values or established toxicity thresholds (see Table 10).
On the basis of this investigation, it was concluded that undernormal and foreseeable use conditions, the use of scented candlesdoes not pose a safety concern to the consumer.
Conflict of Interest
Financial support for this work has been provided by aconsortium of companies organized by the Research Institute forFragrance Materials Inc. (RIFM).
Acknowledgments
The authors would like to express their gratitude to Ms. DanielaJeronimo-Roque from ToxMinds BVBA for developing the tablesand figures used in the present manuscript.
References
ASTM, 2001. Standard Practice for Full-Scale Chamber Determinations of VolatileOrganic Emissions from Indoor Materials/Products. American Society forTesting and Materials, West Conshohocken, PA (ASTM Standard D 6670-01).
ASTM, 2003. Test Method for Determination of Formaldehyde and Other CarbonylCompounds in Air (Active Sampler Methodology). American Society for Testingand Materials, West Conshohocken, PA (ASTM Standard D 5197-03).

T. Petry et al. / Regulatory Toxicology and Pharmacology 69 (2014) 55–70 69
BfR, 2006. Assessment of the Carcinogenicity of Formaldehyde. German FederalInstitute for Risk Assessment, Berlin, Germany. <http://www.bfr.bund.de/cm/350/assessment_of_the_carcinogenicity_of_formaldehyde.pdf> (accessedDecember 2013).
CARB, 1988. Determination of Polychlorinated Dibenzo-p-Dioxin (PCDD),Polychlorinated Dibenzofurans (PCDF), and Polychlorinated BiphenylEmissions from Stationary Sources. California Environmental ProtectionAgency, Air Resources Board, Monitoring and Laboratory Division (Method 428).
CARB, 1989. Determination of Polycyclic Aromatic Hydrocarbon Emissions fromStationary Sources. California Environmental Protection Agency, Air ResourcesBoard, Monitoring and Laboratory Division (Method 428).
Conolly, R.B., Kimbell, J.S., Janszen, D., Schlosser, P.M., Kalisak, D., Preston, J., et al.,2004. Human respiratory tract cancer risks of inhaled formaldehyde: dose–response predictions derived from biologically-motivated computationalmodeling of a combined rodent and human dataset. Toxicol. Sci. 82, 279–296.
ECETOC, 2001. Exposure Factors Sourcebook for European Populations (with Focuson UK Data). Technical Report No. 79. European Centre for Ecotoxicology andToxicology of Chemicals, Brussels, Belgium.
ECHA, 2012a. Guidance on Information Requirements and Chemical SafetyAssessment. Chapter R.15: Consumer Exposure Estimation. EuropeanChemicals Agency Version 2.1, October 2012. <http://echa.europa.eu/documents/10162/13632/information_requirements_r15_en.pdf> (accessedDecember 2013).
ECHA, 2012b. Final Minutes of the 23rd Meeting of the Committee for RiskAssessment (RAC-23) (27–30 November 2012). <http://echa.europa.eu/documents/10162/13579/rac_meeting_23_minutes_final_en.pdf> (accessedDecember 2013).
EU, 2005. The INDEX Project, Critical Appraisal of the Setting and Implementation ofIndoor Exposure Limits in the EU. Final Report. European Commission JointResearch Centre, Institute for Health and Consumer Protection, Physical andChemical Exposure Unit, Ispra, Italy. <http://ec.europa.eu/health/ph_projects/2002/pollution/fp_pollution_2002_frep_02.pdf> (accessed December 2013).
EU, 2008. Directive 2008/50/EC of the European Parliament and of the Council of 21May 2008 on Ambient Air Quality and Cleaner Air for Europe. OJ L 152,11.6.2008, pp. 1–44. <http://eur-lex.europa.eu/LexUriServ/LexUriServ.do?uri=OJ:L:2008:152:0001:0044:EN:PDF> (accessed December 2013).
EU, 2011. European Union Health Programme 2008–2013, Project No. 20091206.<http://ec.europa.eu/eahc/projects/database.html?prjno=20091206> (accessedMay 2013).
Evans, J.G., Gaunt, I.F., Lake, B.G., 1979. Two-year toxicity study on coumarin in thebaboon. Food Cosmet. Toxicol. 17 (3), 187–193.
Fine, P., Cass, G., Simoneit, B., 1999. Characterization of fine particle emissions fromburning church candles. Environ. Sci. Technol. 33, 2352–2362.
Geiss, O., Giannopoulos, G., Tirendi, S., Barrero-Moreno, J., Larsen, B.R., Kotzias, D.,2011. The AIRMEX study – VOC measurements in public buildings and schools/kindergartens in eleven European cities: statistical analysis of the data. Atmos.Environ. 45, 3676–3684.
Guo, Z., Mosley, R., McBrian, J., Fortmann, R., 2000. Fine particulate matteremissions from candles. In: Paper presented at Engineering Solutions toIndoor Air Quality Problems, 17–19 July 2000, Raleigh, NC.
Hagan, E.C., Hansen, W.H., Fitzhugh, O.G., Jenner, P.M., Jones, W.I., Taylor, J.M., Long,E.L., Nelson, A.A., Brouwer, J.B., 1967. Food flavorings and compounds of relatedstructure. II. Subacute and chronic toxicity. Food Cosmet. Toxicol. 5 (2), 141–157.
HEI, 2005. Relationships of Indoor, Outdoor, and Personal Air (RIOPA). ResearchReport Part I: Collection Methods and Descriptive Analyses. Health EffectsInstitute Number 130 Part I, November 2005. <http://pubs.healtheffects.org/getfile.php?u=25> (accessed December 2013).
HEI, 2007. Relationships of Indoor, Outdoor, and Personal Air (RIOPA). ResearchReport Part II: Analyses of Concentrations of Particulate Matter Species. HealthEffects Institute Number 130 Part II, August 2007. <https://sph.uth.edu/mleland/attachments/RIOPA%20Part%20II%20Web%20Files.pdf> (accessedDecember 2013).
IARC, 2012. Monographs on the Evaluation of Carcinogenic Risks to Humans, AReview of Human Carcinogens: Chemical Agents and Related Occupations, vol.100F. International Agency for Research on Cancer, World Health Organisation,Lyon, France.
IPSOS, 2006. Analysis of air freshener shopping and consumer behavior. Studyconducted by the market research institute IPSOS on the order of the BelgiumFederal Public Service of Health, Food Chain Safety and Environment (Ref.888BZ01, 2006).
ISO, 2006. Determination of the Emission of Volatile Organic Compounds fromBuilding Products and Furnishing, Emission Test Chamber Method,International Organization for Standard, Geneva, Switzerland (ISO 16000-9).
Isaacs, K., Burke, J., Smith, L., Williams, R., 2013. Identifying housing andmeteorological conditions influencing residential air exchange rates in theDEARS and RIOPA studies: development of distributions for human exposuremodeling. J. Expo. Sci. Environ. Epidemiol. 23 (3), 248–258.
Kirkpatrick, D.T., 2013. A two-week inhalation toxicity study of aerosolized d-limonene in the Sprague Dawley rat. Unpublished report by the ResearchInstitute for Fragrance Materials (RIFM).
Kotzias, D., Geiss, O., Tirendi, S., 2009. Exposure to multiple air contaminants inpublic buildings, schools and kindergartens – the European indoor airmonitoring and exposure assessment (AIRMEX) study. Fresenius Environ. Bull.18 (5a), 670–681.
Krause, J., Poor, N., Harbison, R., 1999. Characterization of aromatic candleemissions and its similarity to diesel engine exhaust. Toxicologist 48, 395.
Lau, C., Fiedler, H., Hutzinger, O., Schwind, K.-H., Hosseinpour, J., 1997. Levels ofselected organic compounds in materials for candle production and humanexposure to candle emission. Chemosphere 29, 1957–1963.
MAK, 2002. Formaldehyde, The MAK Collection for Occupational Health and Safety.Series Occupational Toxicants, vol. 17. Wiley-VCH Verlag.
Massolo, L., Rehwagen, M., Porta, A., Ronco, A., Herbarth, O., Mueller, A., 2010.Indoor–outdoor distribution and risk assessment of volatile organic compoundsin the atmosphere of industrial and urban areas. Environ. Toxicol. 25 (4), 339–349.
OEHHA, 2001. Benzene. Toxicity Criteria Database. Office of Environmental HealthHazard Assessment, California Environmental Protection Agency, Sacramento,California. Located at <http://www.oehha.ca.gov/risk/chemicalDB/index.asp>;<http://www.oehha.org/air/toxic_contaminants/pdf_zip/benzene_final.pdf>(accessed December 2013).
Oekometric GmbH, 1997. Investigation of Oxidation Gasses from Paraffin AromaticCandles in Toxicological Relevance to Classes of Damaging Materials. Studycommissioned by the Association of German Candle Manufacturers, ÖkometricGmbH, Bayreuth, Germany, Bayreuth Institute for EnvironmentalInvestigations. <http://www.candles.org/pdf/Okometric97study.pdf> (accessedDecember 2013).
Oekometric GmbH, 1999. Second Evaluation of Combustion Gases in ScentedParaffin Candles for Toxicologically Relevant Hazardous Substance Classes.Study commissioned by the Association of German Candle Manufacturers,Ökometric GmbH, Bayreuth, Germany, Bayreuth Institute for EnvironmentalInvestigations. <http://www.candles.org/pdf/1999Okometricstudysummary.pdf> (accessed December 2013).
Petry, T., Cazelle, E., Lloyd, P., Mascarenhas, R., Stintjes, G., 2013. A standard methodfor measuring benzene and formaldehyde emissions from candles in emissiontest chambers for human health risk assessment purposes. Environ. Sci.Processes Impacts 15, 1369–1382.
Randazzo, J.M., 2012. A two-week inhalation toxicity study of aerosolized linalool inthe Sprague Dawley rat. Unpublished report by the Research Institute forFragrance Materials (RIFM).
RIFM, 1984. A toxicity study following oral administration of p-t-butyl alpha-methylhydrocinnamic aldehyde in dogs during a period of 13 weeks. ResearchInstitute for Fragrance Materials (RIFM). Unpublished report.
RIFM, 2010. Estimating human exposure to fragrance materials in air fresheningproducts using a two-zone residential indoor air dispersion model. In: Singal,M., Pandian, M., Joachim, F., Cora, N. Jones, L., and Smith, L. (Eds.) Posterpresented at the 49th annual meeting of the Society of Toxicology (SOT) in SaltLake City (supplement to "The Toxicologist", 2010).
RIVM, 2001. Re-evaluation of Human Toxicological Maximum Permissible RiskLevels. Report 711701025. National Institute of Public Health and Environment,Bilthoven, The Netherlands. <http://www.rivm.nl/bibliotheek/rapporten/711701025.pdf> (accessed December 2013).
RIVM, 2007. Health-based guideline values for the indoor environment. Dusseldorp,A, van Bruggen, M, Douwes, J, Janssen, P.J.C.M., Kelfkens, G., RIVM Report609021044/2007. Bilthoven, The Netherlands.
Sahlberg, B., 2012. Indoor Environment in Dwellings and Sick Building Syndrome(SBS): Longitudinal Studies. Acta Universitatis Upsaliensis. DigitalComprehensives Summaries of Uppsala Dissertations from the Faculty ofMedicine 783, 63pp. Uppsala. ISBN-978-91-554-8393-7.
Sarigiannis, D.A., Karakitsios, S.P., Gotti, A., Liakos, I.L., Katsoyiannis, A., 2011.Exposure to major volatile organic compounds and carbonyls in Europeanindoor environments and associated health risks. Environ. Int. 37 (4), 743–765.
SCHER, 2007. Scientific Committee on Health and Environmental Risks: Opinion onRisk Assessment on Indoor Air Quality. European Commission, Health &Consumer Protection Directorate-General, 29 May 2007. <http://ec.europa.eu/health/ph_risk/committees/04_scher/docs/scher_o_055.pdf> (accessedDecember 2013).
Schwind, K.H., Hosseinpour, J., 1994. Bestimmung und Bewertung der Emissionenvon PCDD/PCDF, PAK und kurzkettigen Aldehyden in den Brandgasen vonKerzen. Z. Umweltchem. Ökotox. 6 (5), 243–246.
US EPA, 1987. IRIS File on Xylenes. US Environmental Protection Agency,Washington, DC, USA.
US EPA, 1991. IRIS File on Acetaldehyde. Inhalation RfC Assessment. Agency WorkGroup Review 10/01/1991. US Environmental Protection Agency, Washington,DC, USA.
US EPA, 1993. IRIS File on Styrene. Inhalation RfC Assessment. Agency Work Group07/01/1993. US Environmental Protection Agency, Washington, DC, USA.
US EPA, 1997. Exposure Factors Handbook, vol. 1. Office of Research andDevelopment, National Centre for Environmental Assessment, USEnvironmental Protection Agency, Washington, DC, USA.
US EPA, 1998. IRIS File on Naphthalene. Inhalation RfC Assessment. Agency WorkGroup Review 09/17/1998. US Environmental Protection Agency, Washington,DC, USA.
US EPA, 1999a. Compendium Method TO-9A. Determination of Polychlorinated,Polybrominated and Brominated/Chlorinated Dibenzo-p-Dioxins andDibenzofurans in Ambient Air. Center for Environmental ResearchInformation Office of Research and Development, US EnvironmentalProtection Agency, Cincinnati, OH 45268 (January 1999).
US EPA, 1999b. Compendium Method TO-9A. Determination of Polycyclic AromaticHydrocarbons (PAHs) in Ambient Air using Gas Chromatography/MassSpectrometry. Center for Environmental Research Information Office of

70 T. Petry et al. / Regulatory Toxicology and Pharmacology 69 (2014) 55–70
Research and Development, US Environmental Protection Agency, Cincinnati,OH 45268 (January 1999).
US EPA, 2003. IRIS File on Benzene. Inhalation RfC Assessment. Agency Work GroupReview 04/17/2003. US Environmental Protection Agency, Washington, DC,USA.
US EPA, 2005. IRIS File on Toluene. Inhalation RfC Assessment. Agency Work GroupReview 09/23/2005. US Environmental Protection Agency, Washington, DC,USA.
US EPA, 2012. Chemical-Specific Reference Values for Benzene (CASRN 71-43-2).National Center for Environmental Assessment Office of Research andDevelopment, US Environmental Protection Agency.
US EPA, 2013. Federal Register. National Ambient Air Quality Standards forParticulate Matter; Final Rule. 40 CFR Parts 50, 51, 52 et al. (15 January 2013).
US NTP, 2004. NTP Technical Report on the Toxicology and Carcinogenesis Studiesof Trans-Cinnamaldehyde (CAS No. 14371-10-9) in F344/rats and B6C3F1 Mice.National Toxicology Program Report NTP TR 514. NIH Publication No. 04-448.<http://ntp.niehs.nih.gov/ntp/htdocs/lt_rpts/tr514.pdf> (accessed December2013).
US NTP, 2011. Acetaldehyde (CAS No. 75-07-0). Report on Carcinogens, 12th ed.<http://ntp.niehs.nih.gov/?objectid=03C9AF75-E1BF-FF40-DBA9EC0928DF8B15>(accessed December 2013).
VITO, 2006. Influence of Air Freshener on the Indoor Quality. Study conducted bythe Flemish Institute for Technological Research NV on the order of the BelgiumFederal Public Service of Health, Food Chain Safety and Environment, Report2006/MIM/R/032.
VITO, 2008. Exposure and Risk Assessment of Air Fresheners. Study conducted bythe Flemish Institute for Technological Research NV on the order of the BelgiumFederal Public Service Health, Food Chain Safety and Environment, Report 2008/IMS/R222.
WHO, 2005. WHO Air Quality Guidelines for Particulate Matter, Ozone, NitrogenDioxide and Sulfur Dioxide. WHO Regional Publications, Regional Office forEurope, Copenhagen, Denmark, ISBN 92 890 2192 6.
WHO, 2010. WHO Guidelines for Indoor Air Quality: Selected Pollutants. Developedby the WHO European Centre for Environment and Health, Bonn Office and WHORegional Office for Europe, Copenhagen, Denmark. ISBN 978 92 890 0213 4.


![[Toxicology] toxicology introduction](https://img.pdfslide.net/doc/110x75/55c46616bb61ebb3478b4643/toxicology-toxicology-introduction.jpg)