Embed Size (px)
Citation preview
Regulatory UpdateRegulatory UpdateSilver Falls Conference Silver Falls Conference
20062006
DHS Drinking Water Program
Types of Coliform SamplesTypes of Coliform Samples
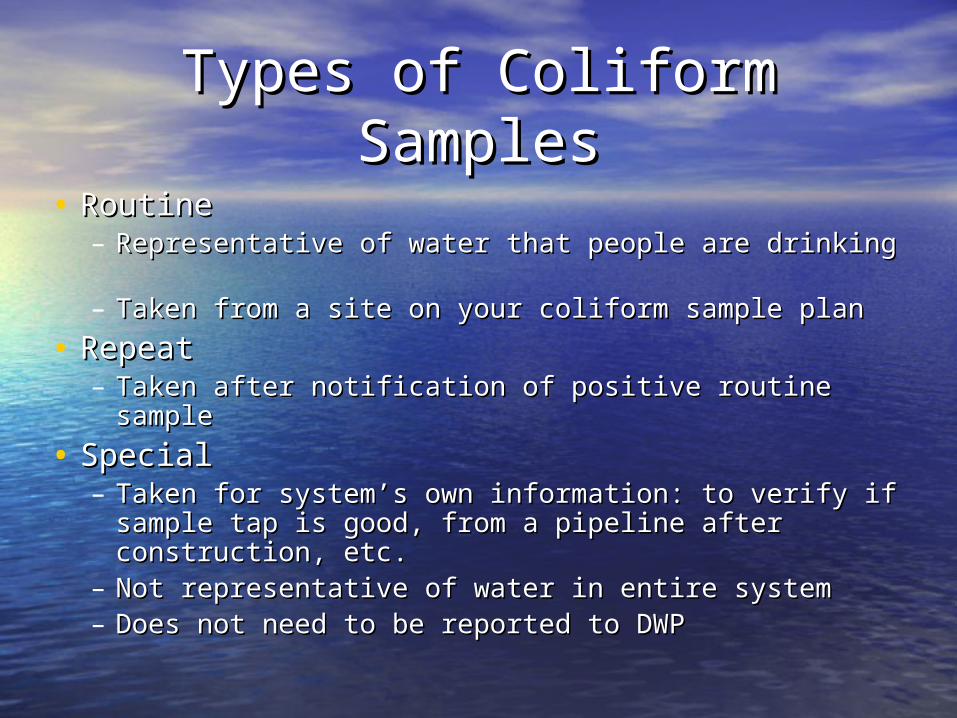
• Routine Routine – Representative of water that people are drinking Representative of water that people are drinking – Taken from a site on your coliform sample planTaken from a site on your coliform sample plan
• Repeat Repeat – Taken after notification of positive routine sampleTaken after notification of positive routine sample
• Special Special – Taken for system’s own information: to verify if Taken for system’s own information: to verify if
sample tap is good, from a pipeline after sample tap is good, from a pipeline after construction, etc. construction, etc.
– Not representative of water in entire systemNot representative of water in entire system– Does not need to be reported to DWPDoes not need to be reported to DWP
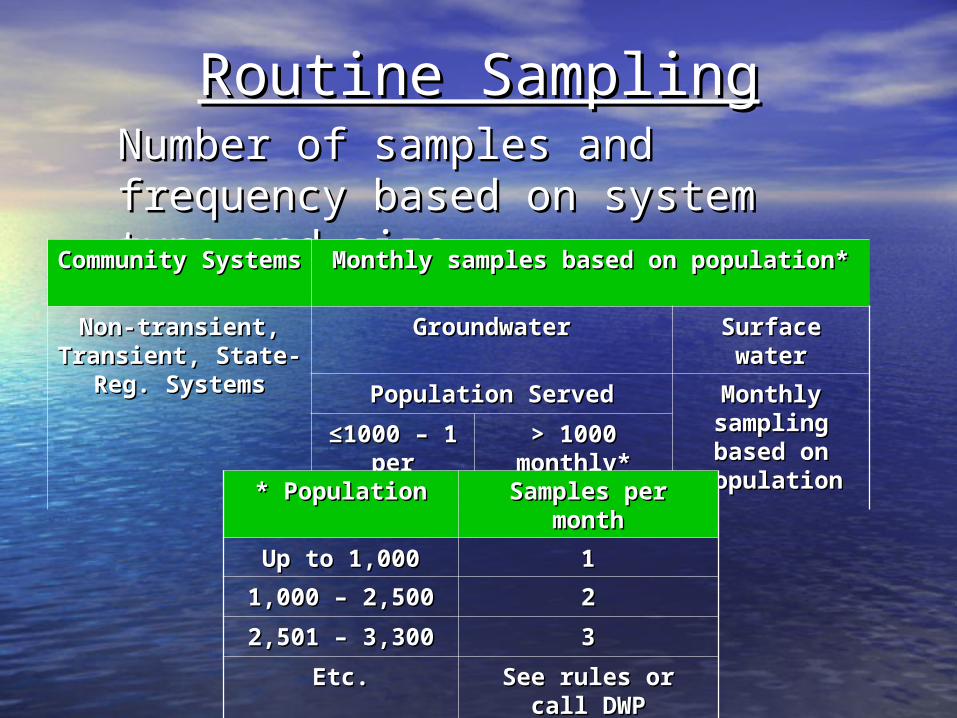
Routine SamplingRoutine SamplingNumber of samples and frequency Number of samples and frequency based on system type and sizebased on system type and size
Community Community SystemsSystems
Monthly samples based on population*Monthly samples based on population*
Non-transient, Non-transient, Transient, State-Transient, State-
Reg. SystemsReg. Systems
GroundwaterGroundwater Surface Surface waterwater
Population ServedPopulation Served Monthly Monthly sampling sampling based on based on
populationpopulation
≤≤1000 – 1 1000 – 1 per per
quarterquarter
> 1000 > 1000 monthly*monthly*
* Population* Population Samples per Samples per monthmonth
Up to 1,000Up to 1,000 11
1,000 – 2,5001,000 – 2,500 22
2,501 – 3,3002,501 – 3,300 33
Etc.Etc. See rules or call See rules or call DWPDWP
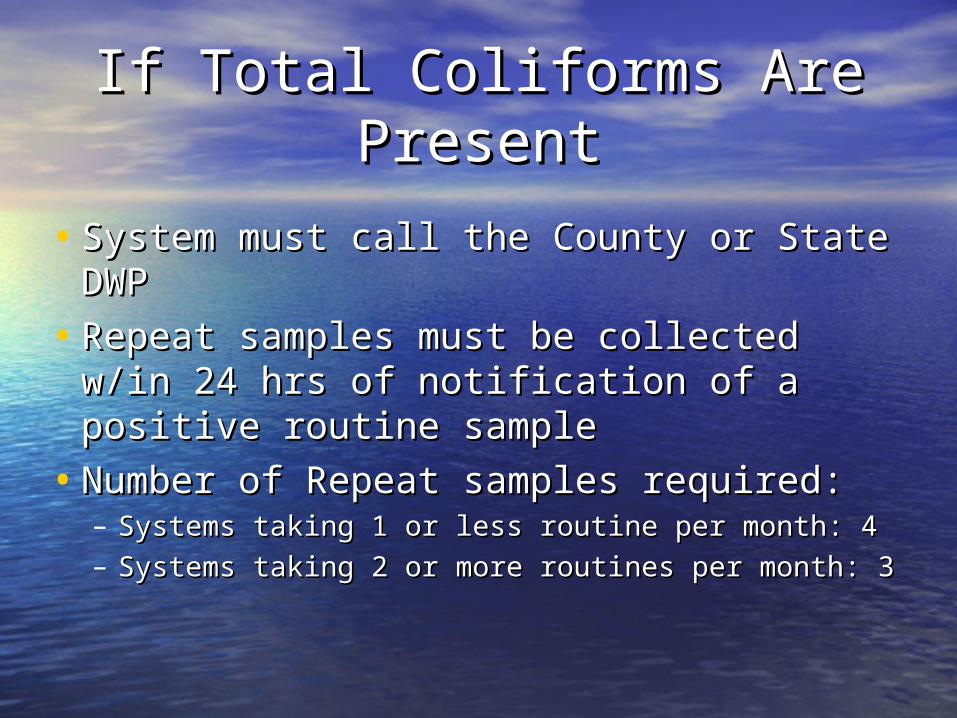
If Total Coliforms Are If Total Coliforms Are PresentPresent
• System must call the County or State System must call the County or State DWPDWP
• Repeat samples must be collected Repeat samples must be collected w/in 24 hrs of notification of a positive w/in 24 hrs of notification of a positive routine sampleroutine sample
• Number of Repeat samples required: Number of Repeat samples required: – Systems taking 1 or less routine per month: 4 Systems taking 1 or less routine per month: 4 – Systems taking 2 or more routines per month: 3Systems taking 2 or more routines per month: 3
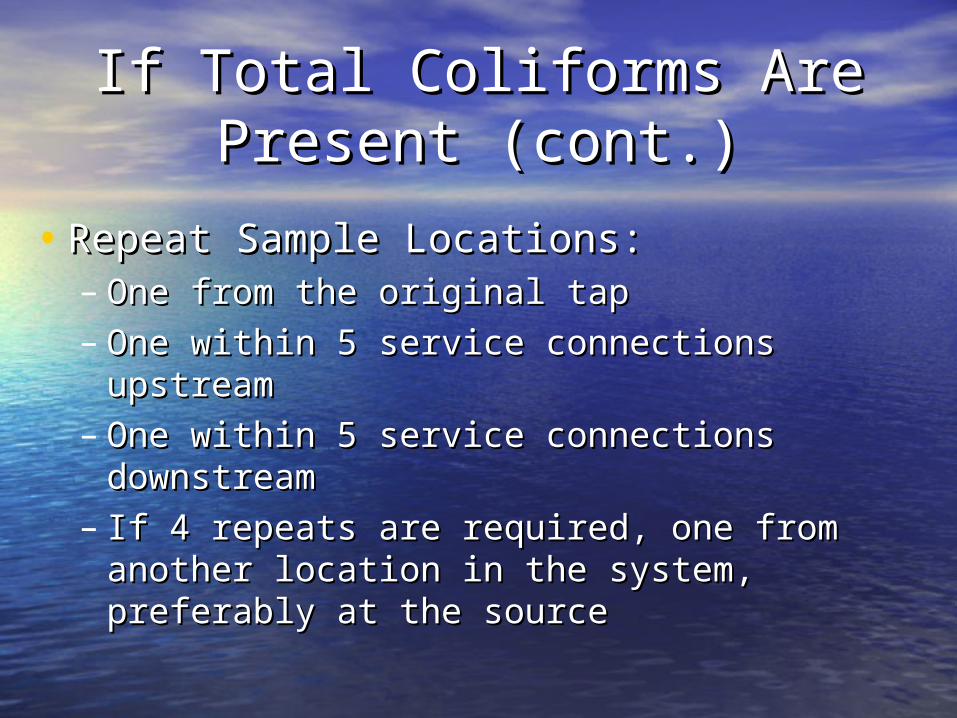
If Total Coliforms Are If Total Coliforms Are Present (cont.)Present (cont.)
• Repeat Sample Locations:Repeat Sample Locations:– One from the original tapOne from the original tap– One within 5 service connections upstreamOne within 5 service connections upstream– One within 5 service connections One within 5 service connections
downstreamdownstream– If 4 repeats are required, one from another If 4 repeats are required, one from another
location in the system, preferably at the location in the system, preferably at the sourcesource
Repeat Sampling ResultsRepeat Sampling Results
• If all repeat samples are coliform negative, If all repeat samples are coliform negative, problem is resolvedproblem is resolved
Just rememberJust remember: at least 5 routine samples must : at least 5 routine samples must be collected during the month following a positive be collected during the month following a positive samplesample
• If any* of the repeat samples are coliform If any* of the repeat samples are coliform positive, the system violates the total positive, the system violates the total coliform MCL - corrective action and public coliform MCL - corrective action and public notice is requirednotice is required
* Invalidation of results is possible – see rules.* Invalidation of results is possible – see rules.
Surface Water Treatment Surface Water Treatment RulesRules
• Interim Enhanced and Long Term 1 Interim Enhanced and Long Term 1 Enhanced Surface Water Treatment Enhanced Surface Water Treatment Rules.Rules.
• Applies to all public water systems that Applies to all public water systems that use surface water or are designated as use surface water or are designated as groundwater under direct influence of groundwater under direct influence of surface water.surface water.
• Systems Systems >> 10,000 population began 10,000 population began January, 2002; all others January, 2005.January, 2002; all others January, 2005.
Surface Water Treatment Surface Water Treatment RulesRules
• For conventional and direct filtration plants:For conventional and direct filtration plants:– Lowers turbidity standard to 0.3 NTU in at least Lowers turbidity standard to 0.3 NTU in at least
95% of measurements taken from the combined 95% of measurements taken from the combined filter effluent- never to exceed 1 NTU.filter effluent- never to exceed 1 NTU.
– Requires continuous monitoring of each filter unit Requires continuous monitoring of each filter unit and establishes turbidity performance triggers. and establishes turbidity performance triggers. When exceeded, requires follow-up actions (filter When exceeded, requires follow-up actions (filter assessments, additional reporting, etc.).assessments, additional reporting, etc.).
• Turbidity standards for slow sand, Turbidity standards for slow sand, diatomaceous earth, and alternative diatomaceous earth, and alternative filtration technologies stay the same (1.0 filtration technologies stay the same (1.0 NTU in 95% with max of 5 NTU).NTU in 95% with max of 5 NTU).
Surface Water Treatment Surface Water Treatment RulesRules
• Sets the MCLG at zero for cryptosporidium and a 99% Sets the MCLG at zero for cryptosporidium and a 99% (2-log) removal requirement. (2-log) removal requirement.
• WTPs are assumed to meet the removal requirement if WTPs are assumed to meet the removal requirement if they are meeting the turbidity standard.they are meeting the turbidity standard.
• Cartridge filter manufacturers must demonstrate 2 log Cartridge filter manufacturers must demonstrate 2 log removal for crypto. All cartridge filters in use must removal for crypto. All cartridge filters in use must comply with 2 log removal requirements by January comply with 2 log removal requirements by January 2007.2007.
• Systems with elevated levels of DBPs (TTHMs Systems with elevated levels of DBPs (TTHMs >> 0.064 0.064 mg/l or HAA5s mg/l or HAA5s >> 0.048 mg/l) are required to evaluate 0.048 mg/l) are required to evaluate their disinfection practices- develop a disinfection their disinfection practices- develop a disinfection profile from data collected for a one year period (used profile from data collected for a one year period (used to evaluate how changes made to the disinfection to evaluate how changes made to the disinfection process to lower DBPs might affect pathogen process to lower DBPs might affect pathogen inactivation).inactivation).
LT2/Stage 2 RulesLT2/Stage 2 Rules
• Promulgated: January 4 & 5, 2006 Promulgated: January 4 & 5, 2006 • Early implementation by EPA- contact Wendy Early implementation by EPA- contact Wendy
Marshall, EPA Region 10 at (206) 553-1890; or at Marshall, EPA Region 10 at (206) 553-1890; or at [email protected]@epa.gov
• EPA Hotline: (800) 426-4791.EPA Hotline: (800) 426-4791.• EPA Guidance materials available on-line at:EPA Guidance materials available on-line at:
– http://www.epa.gov/safewater/disinfection/stage2http://www.epa.gov/safewater/disinfection/stage2– http://www.epa.gov/safewater/disinfection/lt2http://www.epa.gov/safewater/disinfection/lt2
• Water systems involved in early monitoring and Water systems involved in early monitoring and implementation have been contacted by letter implementation have been contacted by letter directly from EPA.directly from EPA.
LT2ESWTR (LT2)LT2ESWTR (LT2)
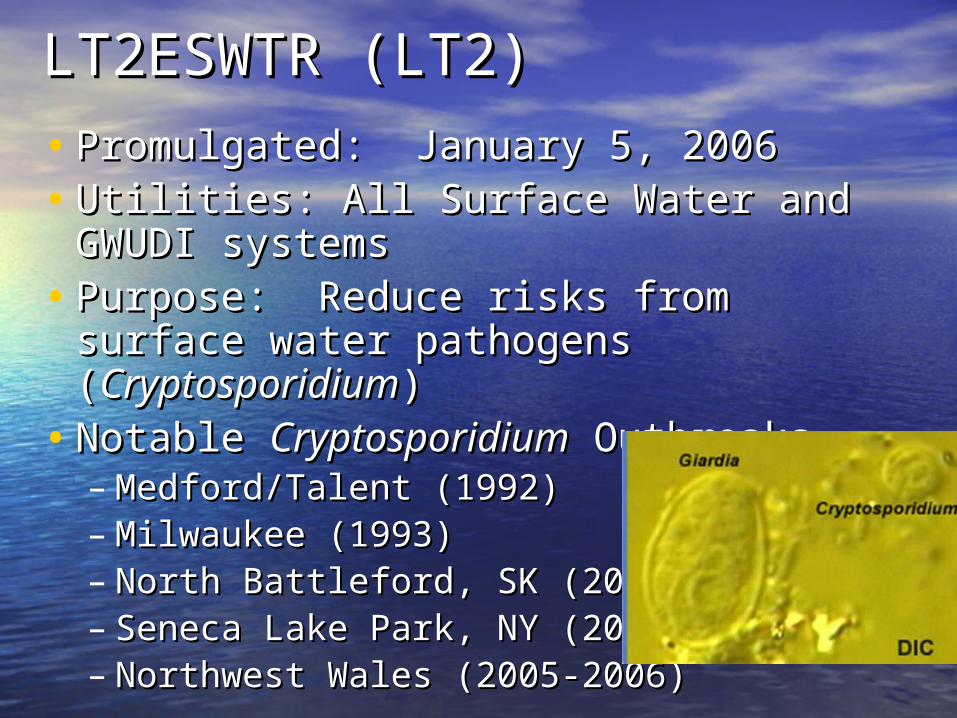
• Promulgated: January 5, 2006Promulgated: January 5, 2006• Utilities: All Surface Water and GWUDI Utilities: All Surface Water and GWUDI
systemssystems• Purpose: Reduce risks from surface Purpose: Reduce risks from surface
water pathogens (water pathogens (CryptosporidiumCryptosporidium))• Notable Notable CryptosporidiumCryptosporidium Outbreaks Outbreaks
– Medford/Talent (1992)Medford/Talent (1992)– Milwaukee (1993) Milwaukee (1993) – North Battleford, SK (2001)North Battleford, SK (2001)– Seneca Lake Park, NY (2005)Seneca Lake Park, NY (2005)– Northwest Wales (2005-2006)Northwest Wales (2005-2006)
LT2ESWTR - BasicsLT2ESWTR - BasicsStepsSteps
1.1. Monitor Source WaterMonitor Source Water– CryptosporidiumCryptosporidium and/or indicator levels and/or indicator levels– Screening procedure for small systems Screening procedure for small systems
2.2. Assign Treatment “Bin” 1, 2, 3, or 4Assign Treatment “Bin” 1, 2, 3, or 4– Based on monitoring resultsBased on monitoring results– Targets treatment for highest-riskTargets treatment for highest-risk
3.3. Implement TreatmentImplement Treatment– Based on the requirements of Bin #Based on the requirements of Bin #– Choose from Toolbox optionsChoose from Toolbox options
4.4. Cover or Treat Uncovered reservoirsCover or Treat Uncovered reservoirs

LT2ESWTR Source Water LT2ESWTR Source Water MonitoringMonitoring
• Systems initially monitor their water Systems initially monitor their water sources to determine treatment sources to determine treatment requirements. This monitoring involves two requirements. This monitoring involves two years of monthly sampling for years of monthly sampling for CryptosporidiumCryptosporidium. .
• To reduce monitoring costs, small filtered To reduce monitoring costs, small filtered water systems (<10,000) will first monitor water systems (<10,000) will first monitor for for E. coliE. coli–which is less expensive to analyze –which is less expensive to analyze than than CryptosporidiumCryptosporidium–and will monitor for –and will monitor for Cryptosporidium Cryptosporidium only if their only if their E. coli E. coli results results exceed specified concentration levels. exceed specified concentration levels.
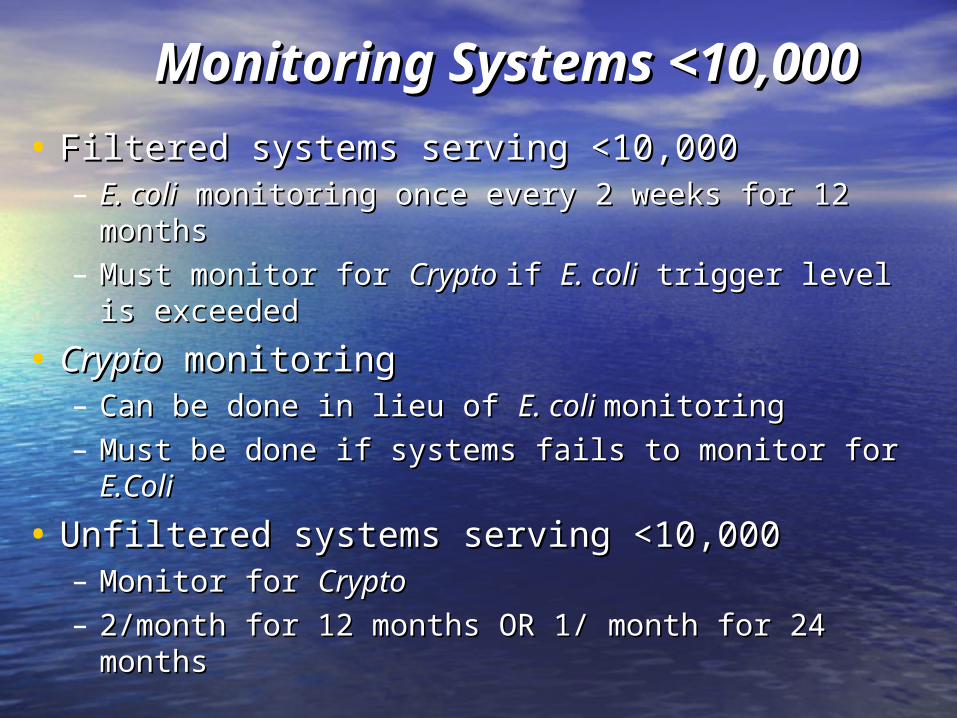
Monitoring Systems Monitoring Systems <10,000<10,000
• Filtered systems serving <10,000Filtered systems serving <10,000– E. coliE. coli monitoring once every 2 weeks for 12 monitoring once every 2 weeks for 12
monthsmonths– Must monitor for Must monitor for Crypto Crypto if if E. coliE. coli trigger level is trigger level is
exceededexceeded
• CryptoCrypto monitoring monitoring – Can be done in lieu of Can be done in lieu of E. coli E. coli monitoringmonitoring– Must be done if systems fails to monitor for Must be done if systems fails to monitor for E.ColiE.Coli
• Unfiltered systems serving <10,000Unfiltered systems serving <10,000– Monitor for Monitor for Crypto Crypto – 2/month for 12 months OR 1/ month for 24 months2/month for 12 months OR 1/ month for 24 months
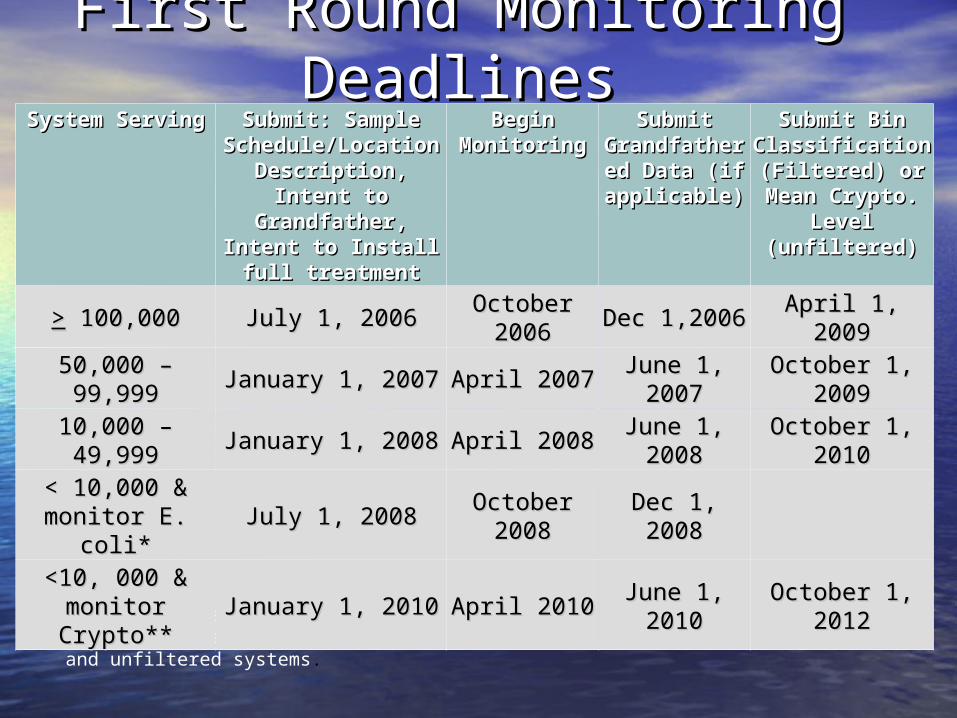
First Round Monitoring First Round Monitoring DeadlinesDeadlines
* filtered systems only**filtered systems exceeding the E. coli trigger, do not monitor for E. coli.; and unfiltered systems.
System ServingSystem Serving Submit: Sample Submit: Sample Schedule/Location Schedule/Location Description, Intent Description, Intent
to Grandfather, to Grandfather, Intent to Install Intent to Install full treatmentfull treatment
Begin Begin MonitoringMonitoring
Submit Submit GrandfatherGrandfathered Data (if ed Data (if applicable)applicable)
Submit Bin Submit Bin Classification Classification (Filtered) or (Filtered) or Mean Crypto. Mean Crypto.
Level Level (unfiltered)(unfiltered)
>> 100,000 100,000 July 1, 2006July 1, 2006 October October 20062006 Dec 1,2006Dec 1,2006 April 1, 2009April 1, 2009
50,000 – 99,99950,000 – 99,999 January 1, 2007January 1, 2007 April 2007April 2007 June 1, June 1, 20072007
October 1, October 1, 20092009
10,000 – 49,99910,000 – 49,999 January 1, 2008January 1, 2008 April 2008April 2008 June 1, June 1, 20082008
October 1, October 1, 20102010
< 10,000 & < 10,000 & monitor E. coli*monitor E. coli* July 1, 2008July 1, 2008 October October
20082008 Dec 1, 2008Dec 1, 2008
<10, 000 & <10, 000 & monitor monitor Crypto**Crypto**
January 1, 2010January 1, 2010 April 2010April 2010 June 1, June 1, 20102010
October 1, October 1, 20122012
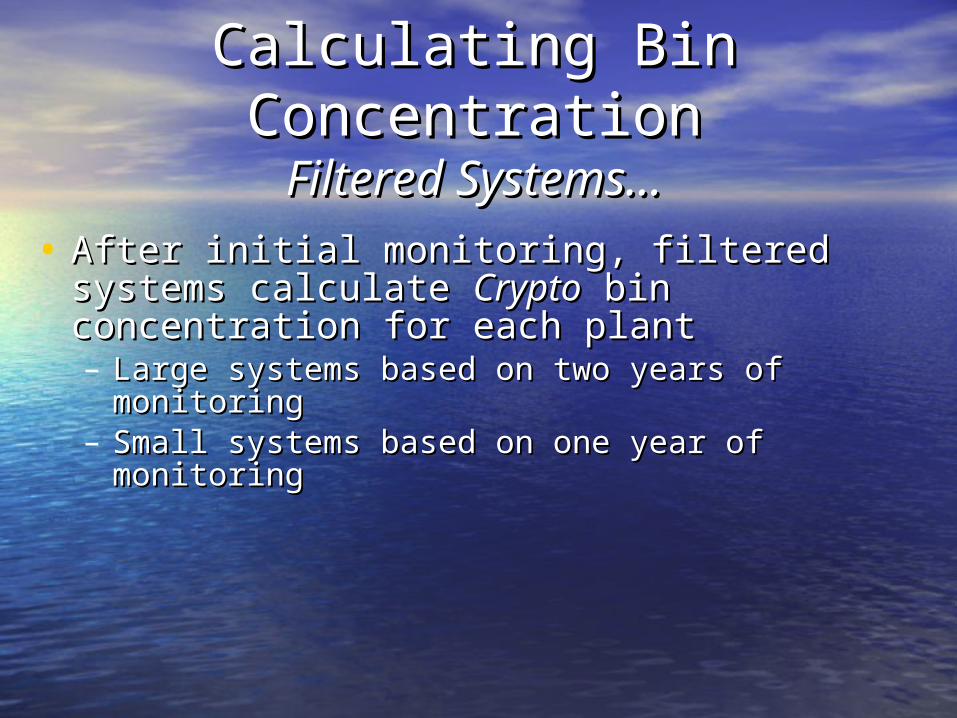
Calculating Bin Calculating Bin ConcentrationConcentration
Filtered Systems…Filtered Systems…• After initial monitoring, filtered systems After initial monitoring, filtered systems
calculate calculate CryptoCrypto bin concentration for each bin concentration for each plantplant– Large systems based on two years of monitoringLarge systems based on two years of monitoring– Small systems based on one year of monitoringSmall systems based on one year of monitoring
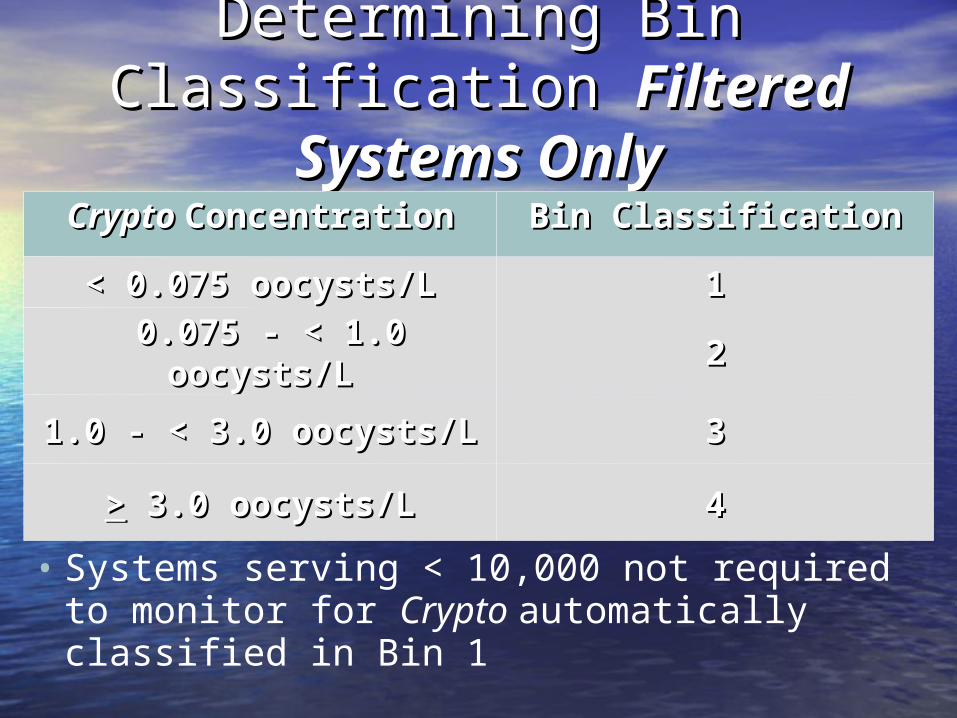
Determining Bin Classification Determining Bin Classification Filtered Systems OnlyFiltered Systems Only
Crypto Crypto ConcentrationConcentration Bin ClassificationBin Classification
< 0.075 oocysts/L< 0.075 oocysts/L 11
0.075 - < 1.0 oocysts/L0.075 - < 1.0 oocysts/L 22
1.0 - < 3.0 oocysts/L1.0 - < 3.0 oocysts/L 33
>> 3.0 oocysts/L 3.0 oocysts/L 44
• Systems serving < 10,000 not required to monitor for Crypto automatically classified in Bin 1
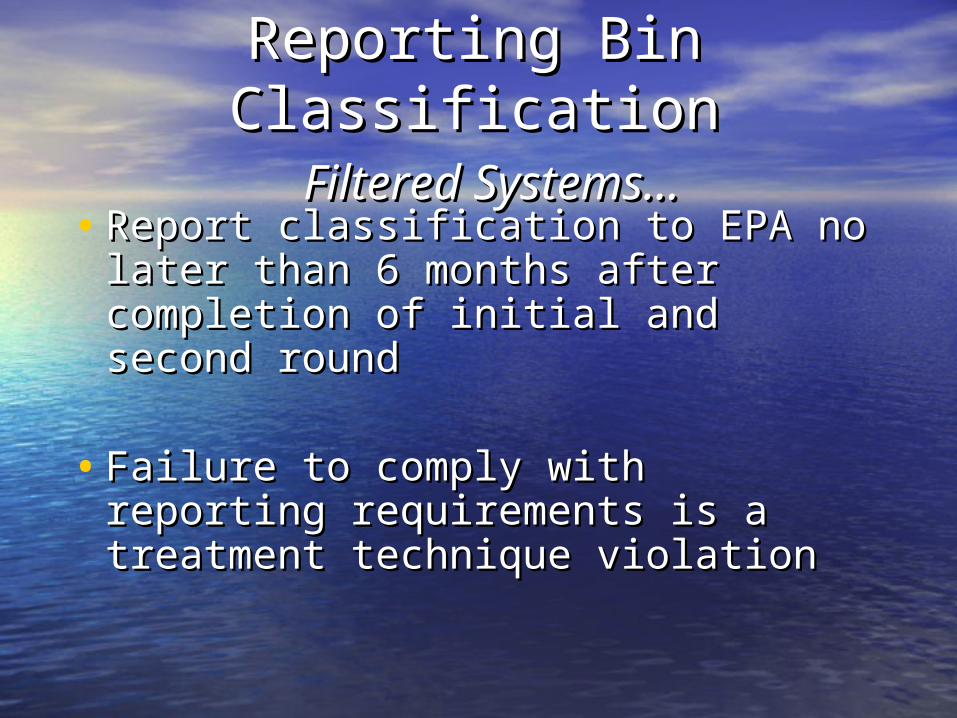
Reporting Bin ClassificationReporting Bin Classification Filtered Systems…Filtered Systems…
• Report classification to EPA no later Report classification to EPA no later than 6 months after completion of than 6 months after completion of initial and second roundinitial and second round
• Failure to comply with reporting Failure to comply with reporting
requirements is a treatment requirements is a treatment technique violationtechnique violation
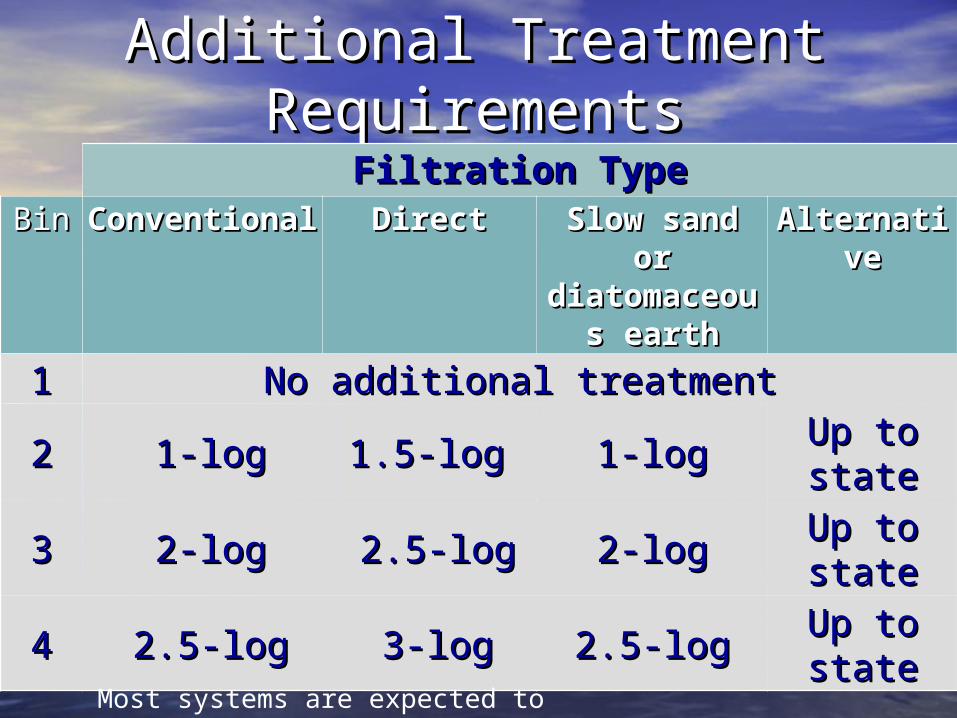
Additional Treatment Additional Treatment RequirementsRequirements
Filtration TypeFiltration TypeBinBin ConventionaConventiona
l l DirectDirect Slow sand Slow sand
or or diatomaceodiatomaceo
us earthus earth
AlternativAlternativee
11 No additional treatmentNo additional treatment
22 1-log1-log 1.5-log 1.5-log 1-log1-log Up to Up to statestate
33 2-log2-log 2.5-log2.5-log 2-log2-log Up to Up to statestate
44 2.5-log2.5-log 3-log3-log 2.5-log2.5-log Up to Up to statestate
Most systems are expected to fall into Bin 1
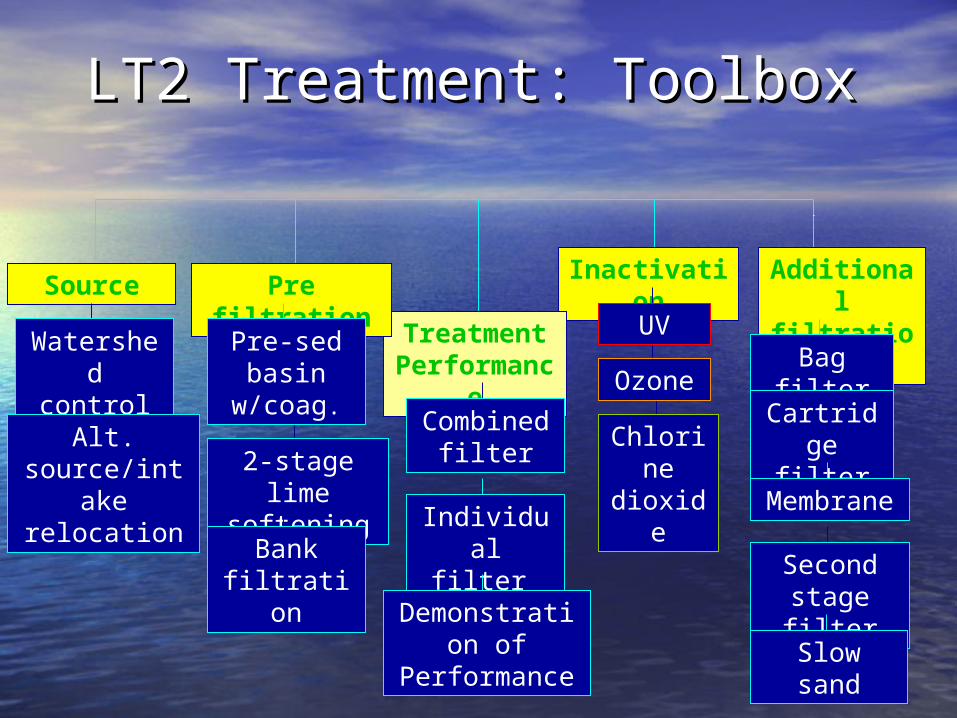
SourceInactivation Additional
filtrationTreatment
Performance
Pre filtration
Chlorine dioxide
Ozone
UV
Combined filter
Individual filter
Bag filter
Cartridge filter
Membrane
Second stage filter
Watershed control
Alt. source/intake
relocation
2-stage lime softening
Bank filtration
Pre-sed basin
w/coag.
Demonstration of Performance Slow sand
LT2 Treatment: ToolboxLT2 Treatment: Toolbox
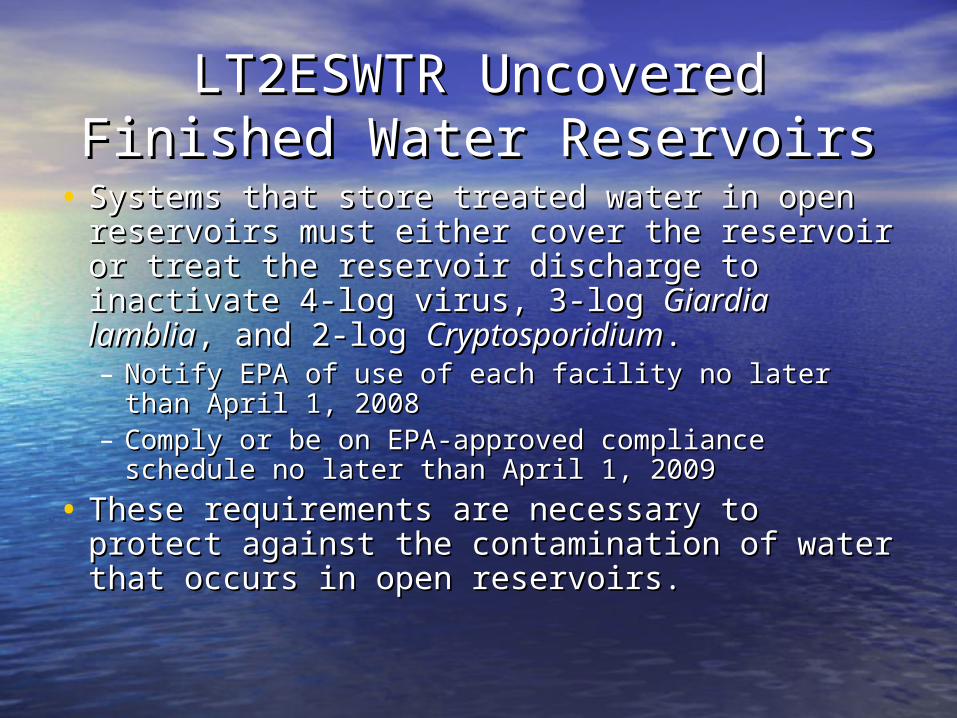
LT2ESWTR Uncovered Finished LT2ESWTR Uncovered Finished Water ReservoirsWater Reservoirs
• Systems that store treated water in open Systems that store treated water in open reservoirs must either cover the reservoir or reservoirs must either cover the reservoir or treat the reservoir discharge to inactivate 4-log treat the reservoir discharge to inactivate 4-log virus, 3-log virus, 3-log Giardia lambliaGiardia lamblia, and 2-log , and 2-log CryptosporidiumCryptosporidium. . – Notify EPA of use of each facility no later than April 1, Notify EPA of use of each facility no later than April 1,
20082008– Comply or be on EPA-approved compliance schedule Comply or be on EPA-approved compliance schedule
no later than April 1, 2009no later than April 1, 2009
• These requirements are necessary to protect These requirements are necessary to protect against the contamination of water that occurs against the contamination of water that occurs in open reservoirs. in open reservoirs.
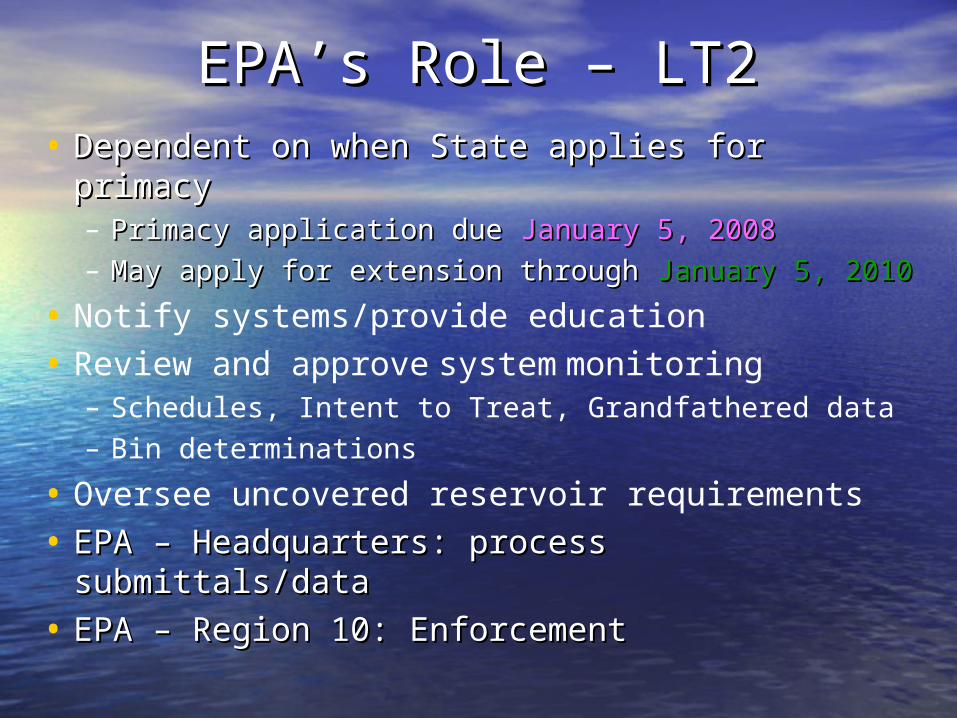
EPA’s Role – LT2EPA’s Role – LT2• Dependent on when State applies for Dependent on when State applies for
primacyprimacy– Primacy application due Primacy application due January 5, 2008January 5, 2008– May apply for extension through May apply for extension through January 5, 2010January 5, 2010
• Notify systems/provide education
• Review and approve system monitoring– Schedules, Intent to Treat, Grandfathered data– Bin determinations
• Oversee uncovered reservoir requirements
• EPA – Headquarters: process submittals/dataEPA – Headquarters: process submittals/data
• EPA – Region 10: Enforcement EPA – Region 10: Enforcement
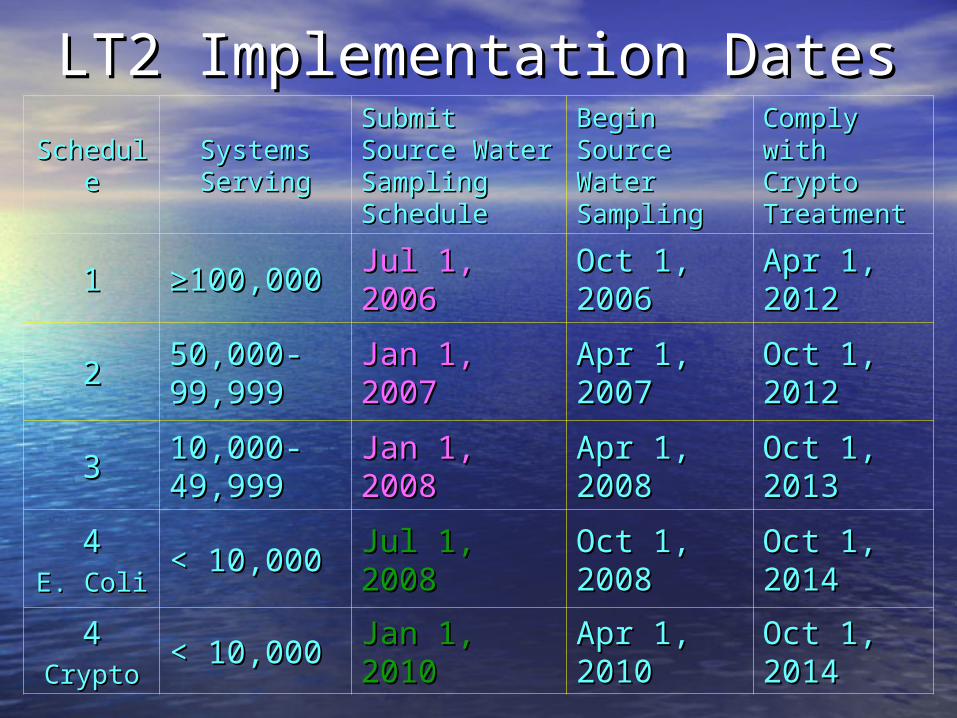
LT2 Implementation DatesLT2 Implementation Dates
ScheduleScheduleSystems Systems ServingServing
Submit Source Submit Source Water Sampling Water Sampling ScheduleSchedule
Begin Source Begin Source Water Water SamplingSampling
Comply with Comply with Crypto Crypto Treatment Treatment
11 ≥≥100,000100,000 Jul 1, 2006Jul 1, 2006 Oct 1, 2006Oct 1, 2006 Apr 1, 2012Apr 1, 2012
2250,000-50,000-99,99999,999
Jan 1, 2007Jan 1, 2007 Apr 1, 2007Apr 1, 2007 Oct 1, 2012Oct 1, 2012
3310,000-10,000-49,99949,999
Jan 1, 2008Jan 1, 2008 Apr 1, 2008Apr 1, 2008 Oct 1, 2013Oct 1, 2013
44E. ColiE. Coli
< 10,000< 10,000 Jul 1, 2008Jul 1, 2008 Oct 1, 2008Oct 1, 2008 Oct 1, 2014Oct 1, 2014
44CryptoCrypto
< 10,000< 10,000 Jan 1, 2010Jan 1, 2010 Apr 1, 2010Apr 1, 2010 Oct 1, 2014Oct 1, 2014
LT2ESWTR Disinfection LT2ESWTR Disinfection BenchmarkingBenchmarking
• If choosing “Inactivation” as a tool to comply If choosing “Inactivation” as a tool to comply with additional treatment requirements, with additional treatment requirements, systems must review their current level of systems must review their current level of microbial treatment before making a microbial treatment before making a significant change in their disinfection practice. significant change in their disinfection practice.
• This review will assist systems in maintaining This review will assist systems in maintaining protection against microbial pathogens as they protection against microbial pathogens as they take steps to reduce the formation of take steps to reduce the formation of disinfection byproducts under the Stage 2 disinfection byproducts under the Stage 2 Disinfection Byproducts Rule, which EPA is Disinfection Byproducts Rule, which EPA is finalizing along with the LT2ESWTR. finalizing along with the LT2ESWTR.
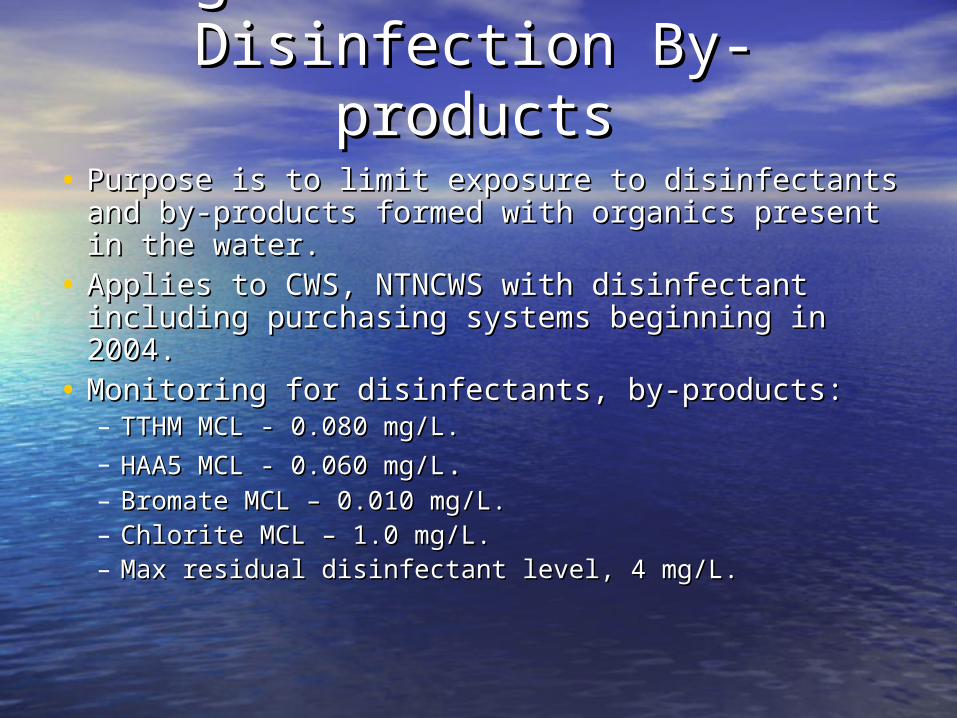
Stage 1 Disinfectants/ Stage 1 Disinfectants/ Disinfection By-productsDisinfection By-products
• Purpose is to limit exposure to disinfectants and Purpose is to limit exposure to disinfectants and by-products formed with organics present in the by-products formed with organics present in the water. water.
• Applies to CWS, NTNCWS with disinfectant Applies to CWS, NTNCWS with disinfectant including purchasing systems beginning in 2004.including purchasing systems beginning in 2004.
• Monitoring for disinfectants, by-products:Monitoring for disinfectants, by-products:– TTHM MCL - 0.080 mg/L.TTHM MCL - 0.080 mg/L.– HAA5 MCL - 0.060 mg/LHAA5 MCL - 0.060 mg/L..– Bromate MCL – 0.010 mg/L.Bromate MCL – 0.010 mg/L.– Chlorite MCL – 1.0 mg/L.Chlorite MCL – 1.0 mg/L.– Max residual disinfectant level, 4 mg/L.Max residual disinfectant level, 4 mg/L.
What are disinfection What are disinfection byproducts?byproducts?
• Disinfection byproducts (DBPs) are Disinfection byproducts (DBPs) are compounds formed when chlorine or other compounds formed when chlorine or other disinfectants used in drinking water disinfectants used in drinking water combine with organic matter (OM).combine with organic matter (OM).
• These include Total Trihalomethane These include Total Trihalomethane Compounds (TTHMs) and Haloacetic Acid Compounds (TTHMs) and Haloacetic Acid Compounds (HAA5s).Compounds (HAA5s).
• Potential health effects of long term Potential health effects of long term exposures to DBPs include adverse exposures to DBPs include adverse reproductive health effects, increased risk reproductive health effects, increased risk of cancer, liver and/or kidney disease.of cancer, liver and/or kidney disease.
Stage 1 DBP RuleStage 1 DBP Rule
• Paired samples taken from location(s) Paired samples taken from location(s) representing maximum residence representing maximum residence time in distribution system at warmest time in distribution system at warmest time of the monitoring period.time of the monitoring period.– MCL based on running annual average.MCL based on running annual average.– Reduced monitoring at <50% for 2 years.Reduced monitoring at <50% for 2 years.– Reduced monitoring at <25% for 1 year.Reduced monitoring at <25% for 1 year.– TOC <4 mg/L for 1 year (SW).TOC <4 mg/L for 1 year (SW).
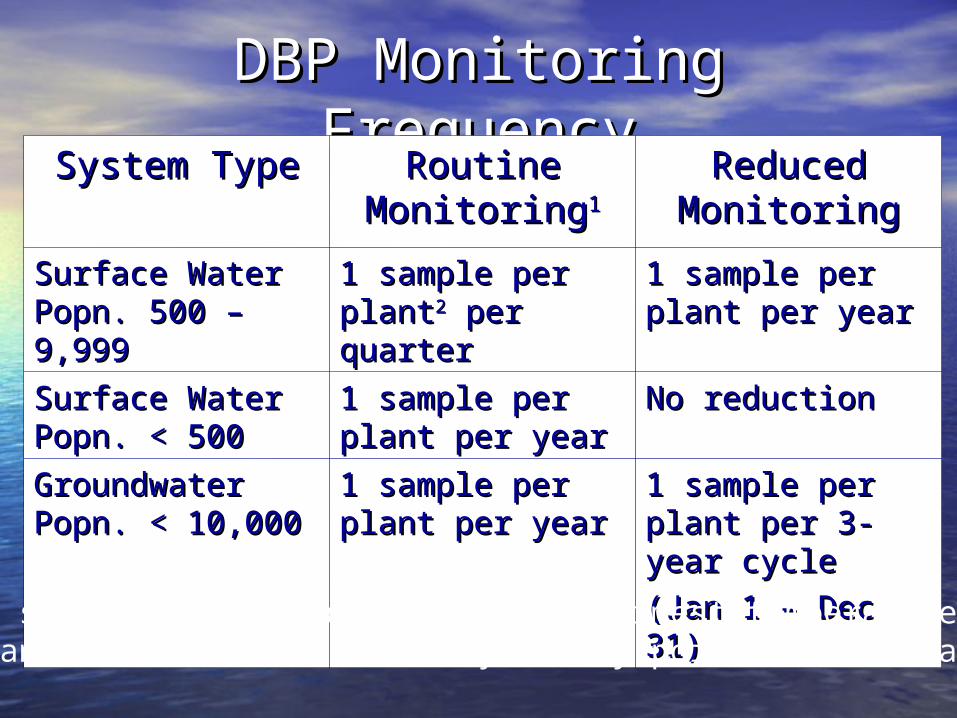
DBP Monitoring FrequencyDBP Monitoring FrequencySystem TypeSystem Type Routine Routine
MonitoringMonitoring11
Reduced Reduced MonitoringMonitoring
Surface Water Surface Water Popn. 500 – Popn. 500 – 9,9999,999
1 sample per 1 sample per plantplant22 per quarter per quarter
1 sample per 1 sample per plant per year plant per year
Surface Water Surface Water Popn. < 500Popn. < 500
1 sample per 1 sample per plant per yearplant per year
No reductionNo reduction
Groundwater Groundwater Popn. < 10,000Popn. < 10,000
1 sample per 1 sample per plant per yearplant per year
1 sample per 1 sample per plant per 3-year plant per 3-year cyclecycle
(Jan 1 – Dec 31)(Jan 1 – Dec 31)1 TTHM/HAA5 should be sampled in month of warmest temperature2 A plant can be a treatment facility, entry point, well or a wellfield
Stage 1 DBP RuleStage 1 DBP Rule
• Out of Compliance if running annual average Out of Compliance if running annual average exceeds MCL.exceeds MCL.– Notify State/County within 48 hours.Notify State/County within 48 hours.– Notify customers within 30 days (Tier 2 public Notify customers within 30 days (Tier 2 public
notice)notice)– Public notice must include specific health effects Public notice must include specific health effects
language.language.• Treatment Technique for TOC removal Treatment Technique for TOC removal
required if TOC > 2 mg/L (surface sources).required if TOC > 2 mg/L (surface sources).• All affected water systems must have a All affected water systems must have a
monitoring plan completed and available for monitoring plan completed and available for inspection.inspection.
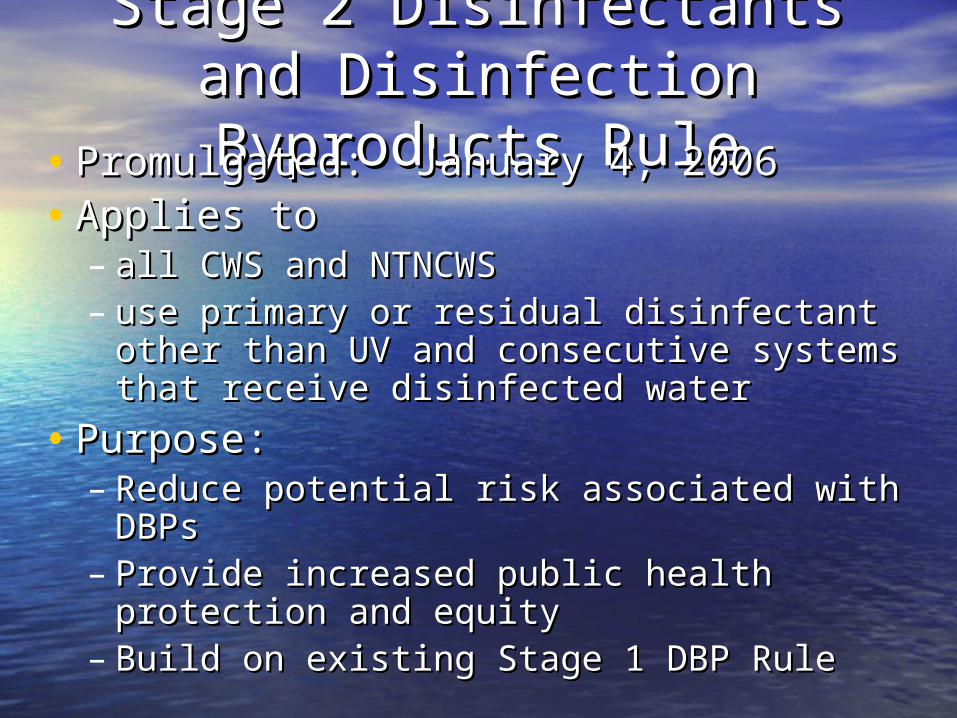
Stage 2 Disinfectants and Stage 2 Disinfectants and Disinfection Byproducts RuleDisinfection Byproducts Rule• Promulgated: January 4, 2006Promulgated: January 4, 2006• Applies toApplies to
– all CWS and NTNCWSall CWS and NTNCWS– use primary or residual disinfectant other use primary or residual disinfectant other
than UV and consecutive systems that than UV and consecutive systems that receive disinfected water receive disinfected water
• Purpose:Purpose:– Reduce potential risk associated with Reduce potential risk associated with
DBPsDBPs– Provide increased public health protection Provide increased public health protection
and equityand equity– Build on existing Stage 1 DBP RuleBuild on existing Stage 1 DBP Rule
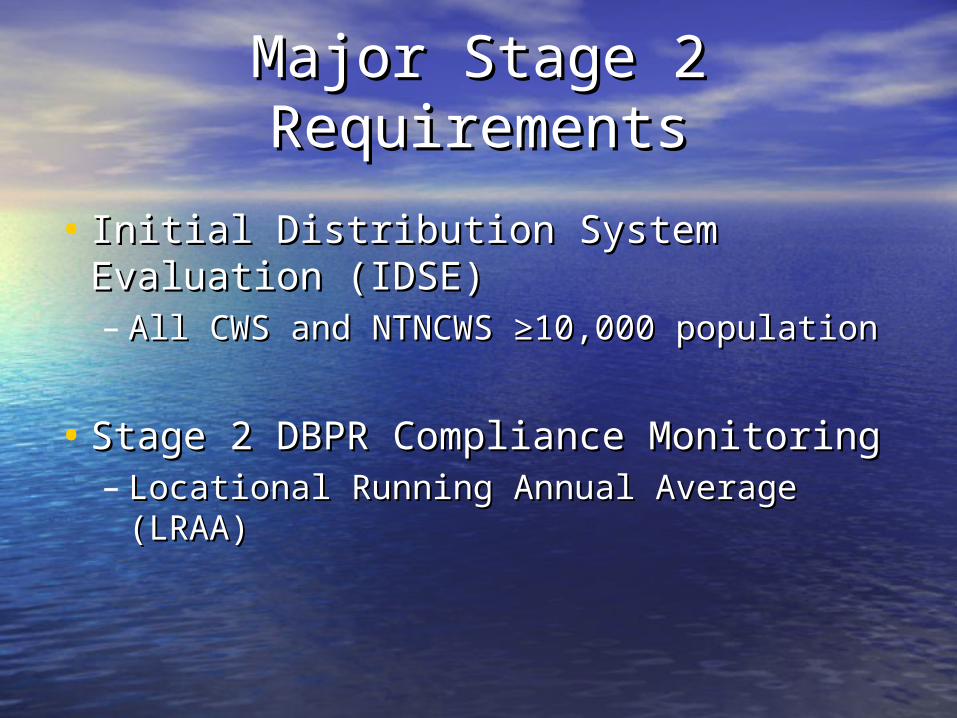
Major Stage 2 RequirementsMajor Stage 2 Requirements
• Initial Distribution System Evaluation Initial Distribution System Evaluation (IDSE)(IDSE)– All CWS and NTNCWS All CWS and NTNCWS ≥≥10,000 10,000
populationpopulation
• Stage 2 DBPR Compliance MonitoringStage 2 DBPR Compliance Monitoring– Locational Running Annual Average Locational Running Annual Average
(LRAA)(LRAA)
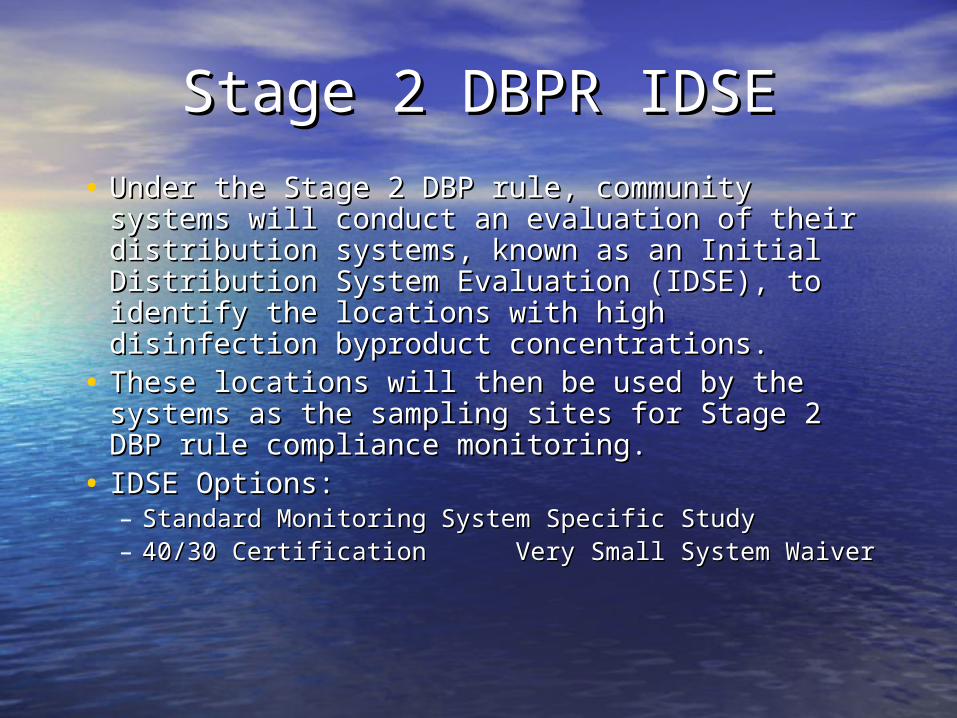
Stage 2 DBPR IDSEStage 2 DBPR IDSE
• Under the Stage 2 DBP rule, community Under the Stage 2 DBP rule, community systems will conduct an evaluation of their systems will conduct an evaluation of their distribution systems, known as an Initial distribution systems, known as an Initial Distribution System Evaluation (IDSE), to Distribution System Evaluation (IDSE), to identify the locations with high disinfection identify the locations with high disinfection byproduct concentrations. byproduct concentrations.
• These locations will then be used by the These locations will then be used by the systems as the sampling sites for Stage 2 DBP systems as the sampling sites for Stage 2 DBP rule compliance monitoring. rule compliance monitoring.
• IDSE Options:IDSE Options:– Standard MonitoringStandard Monitoring System Specific StudySystem Specific Study– 40/30 Certification 40/30 Certification Very Small System WaiverVery Small System Waiver
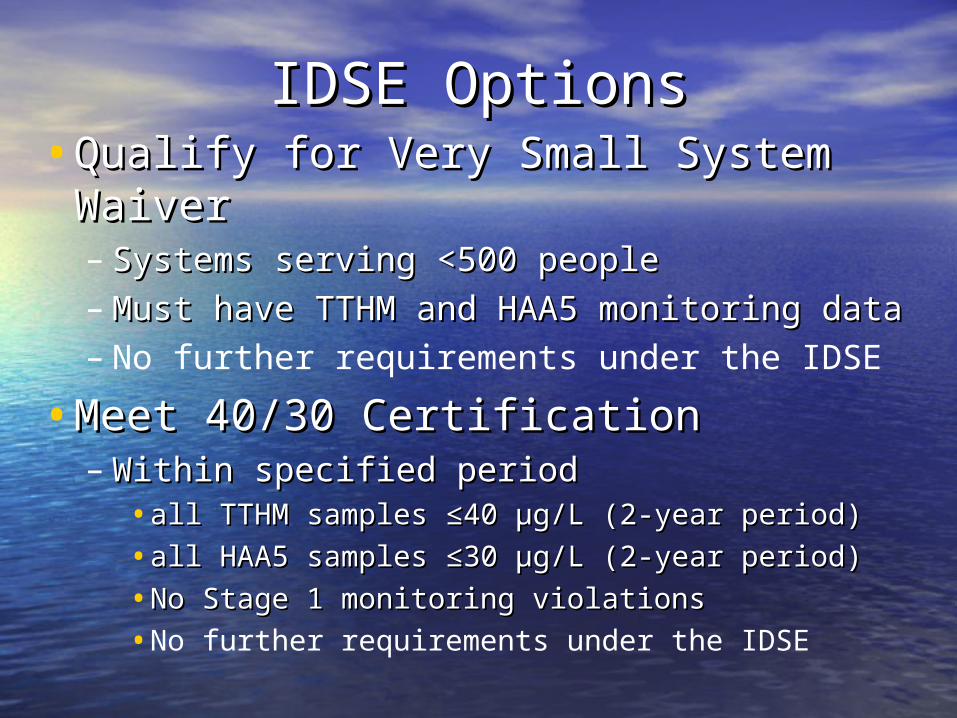
IDSE OptionsIDSE Options•Qualify for Very Small System Qualify for Very Small System
WaiverWaiver– Systems serving <500 peopleSystems serving <500 people– Must have TTHM and HAA5 monitoring dataMust have TTHM and HAA5 monitoring data– No further requirements under the IDSE
•Meet 40/30 CertificationMeet 40/30 Certification– Within specified period Within specified period
•all TTHM samples all TTHM samples ≤≤40 40 μμg/L (2-year period)g/L (2-year period)
•all HAA5 samples all HAA5 samples ≤≤30 30 μμg/L (2-year period)g/L (2-year period)
•No Stage 1 monitoring violationsNo Stage 1 monitoring violations
•No further requirements under the IDSE
IDSE OptionsIDSE Options
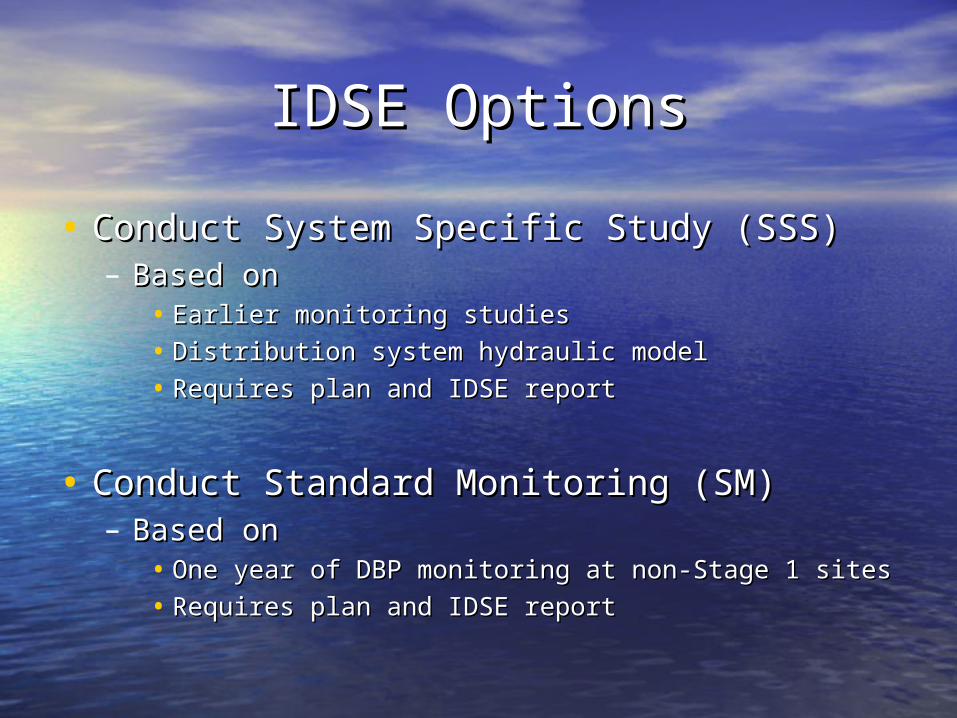
• Conduct System Specific Study (SSS) Conduct System Specific Study (SSS) – Based onBased on
• Earlier monitoring studiesEarlier monitoring studies
• Distribution system hydraulic modelDistribution system hydraulic model
• Requires plan and IDSE reportRequires plan and IDSE report
• Conduct Standard Monitoring (SM)Conduct Standard Monitoring (SM)– Based onBased on
• One year of DBP monitoring at non-Stage 1 sitesOne year of DBP monitoring at non-Stage 1 sites
• Requires plan and IDSE reportRequires plan and IDSE report
IDSE Plan & ReportIDSE Plan & Report
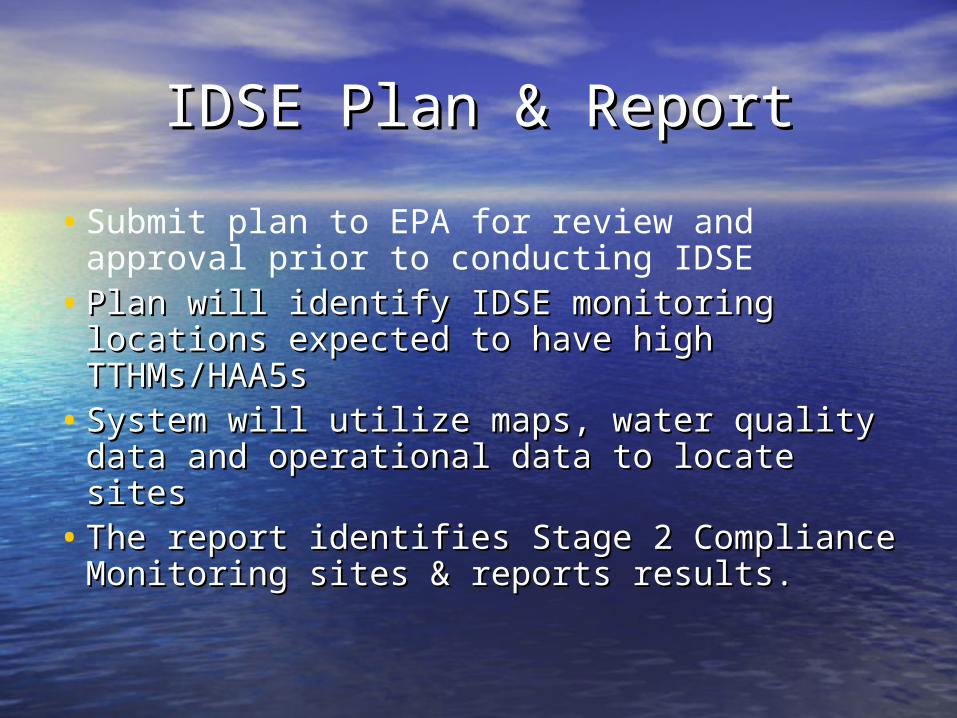
•Submit plan to EPA for review and approval prior to conducting IDSE
• Plan will identify IDSE monitoring locations Plan will identify IDSE monitoring locations expected to have high TTHMs/HAA5sexpected to have high TTHMs/HAA5s
• System will utilize maps, water quality System will utilize maps, water quality data and operational data to locate sitesdata and operational data to locate sites
• The report identifies Stage 2 Compliance The report identifies Stage 2 Compliance Monitoring sites & reports results.Monitoring sites & reports results.
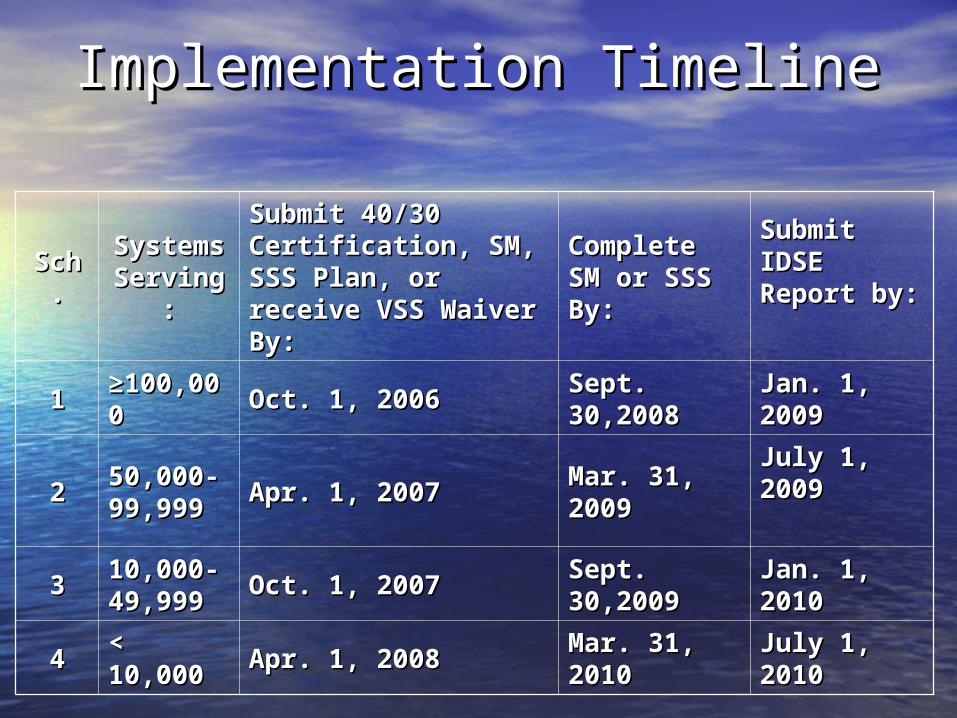
Implementation TimelineImplementation Timeline
SchSch..
SystemSystems s
ServingServing::
Submit 40/30 Submit 40/30 Certification, SM, Certification, SM, SSS Plan, or SSS Plan, or receive VSS Waiver receive VSS Waiver By:By:
Complete Complete SM or SSS SM or SSS By:By:
Submit Submit IDSE IDSE Report by: Report by:
11≥≥100,0100,00000 Oct. 1, 2006Oct. 1, 2006 Sept. Sept.
30,200830,2008Jan. 1, Jan. 1, 20092009
2250,000-50,000-99,99999,999 Apr. 1, 2007Apr. 1, 2007 Mar. 31, Mar. 31,
20092009
July 1, July 1, 20092009
3310,000-10,000-49,99949,999 Oct. 1, 2007Oct. 1, 2007 Sept. Sept.
30,200930,2009Jan. 1, Jan. 1, 20102010
44< < 10,00010,000 Apr. 1, 2008Apr. 1, 2008 Mar. 31, Mar. 31,
20102010July 1, July 1, 20102010
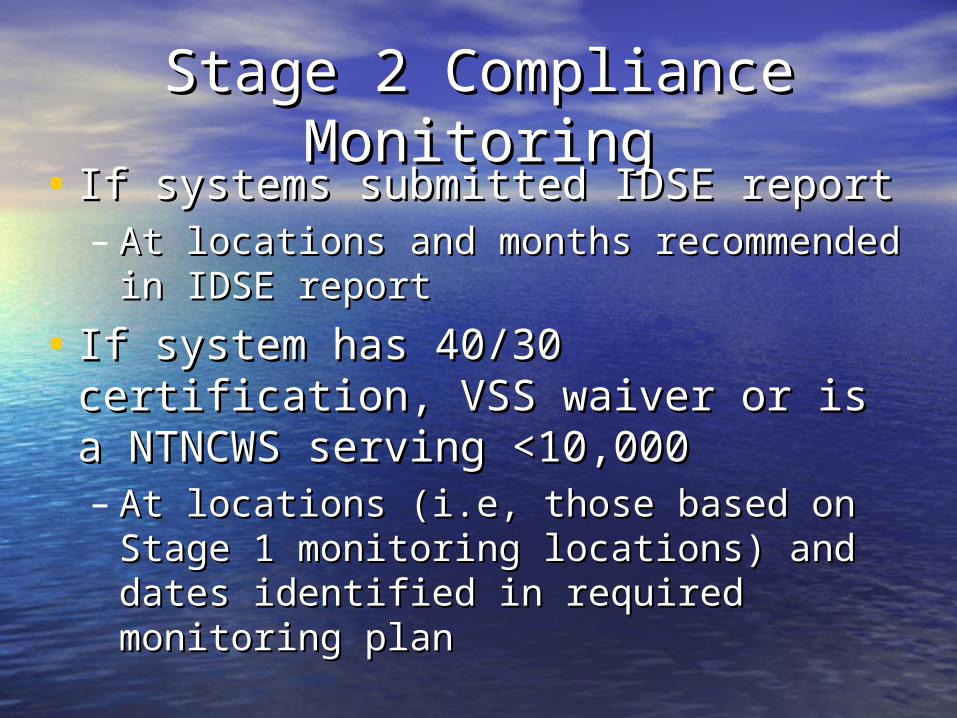
Stage 2 Compliance Stage 2 Compliance MonitoringMonitoring
• If systems submitted IDSE reportIf systems submitted IDSE report– At locations and months recommended in At locations and months recommended in
IDSE reportIDSE report
• If system has 40/30 certification, VSS If system has 40/30 certification, VSS waiver or is a NTNCWS serving waiver or is a NTNCWS serving <10,000<10,000– At locations (i.e, those based on Stage 1 At locations (i.e, those based on Stage 1
monitoring locations) and dates identified monitoring locations) and dates identified in required monitoring planin required monitoring plan
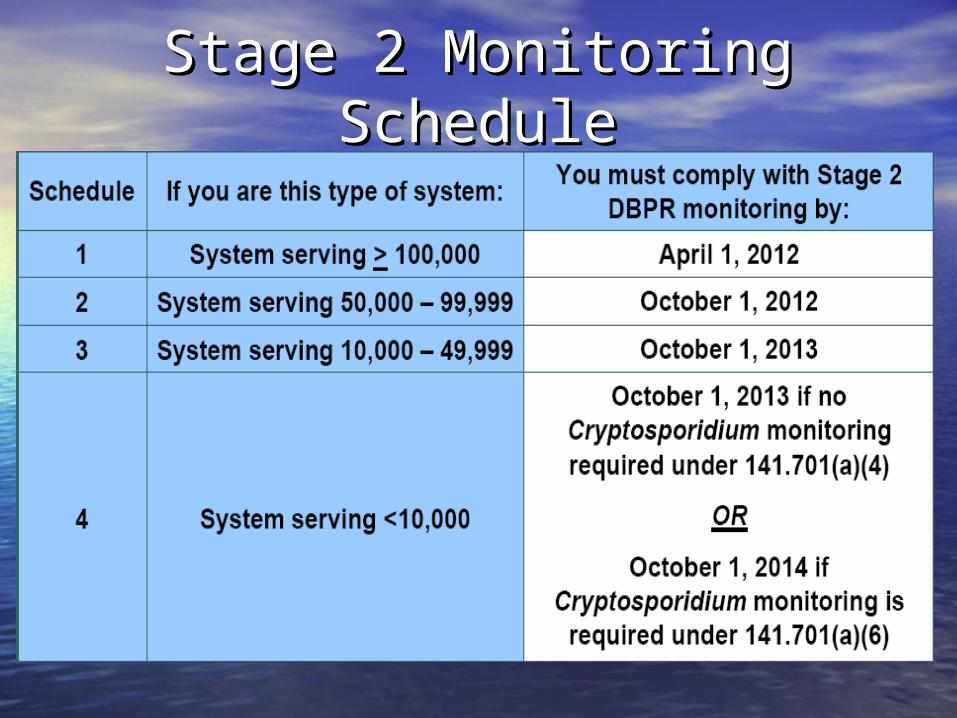
Stage 2 Monitoring ScheduleStage 2 Monitoring Schedule
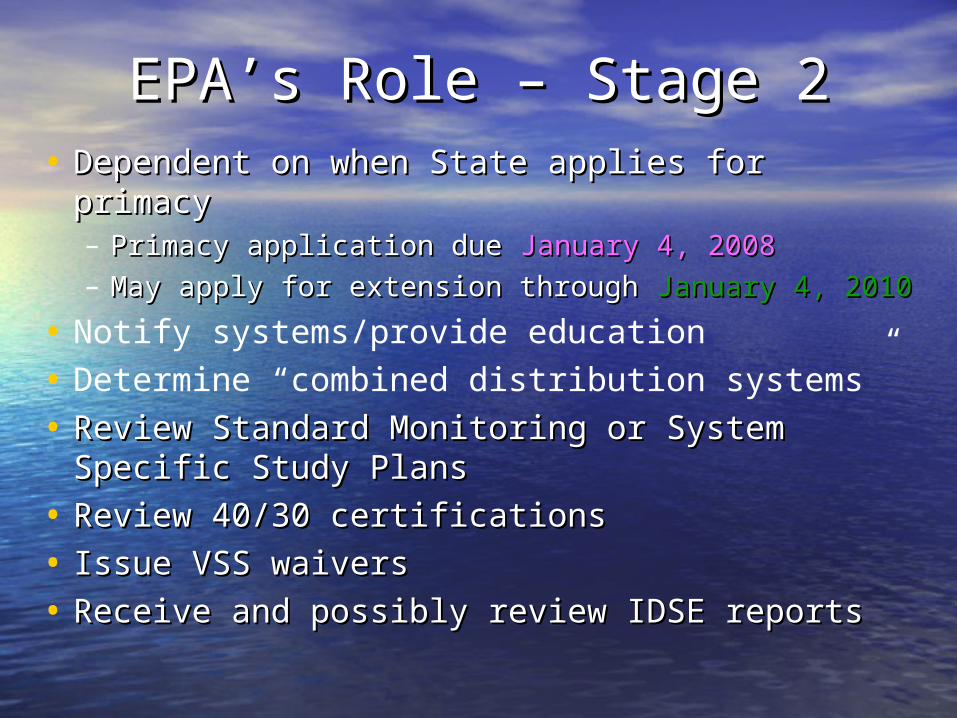
EPA’s Role – Stage 2EPA’s Role – Stage 2• Dependent on when State applies for Dependent on when State applies for
primacyprimacy– Primacy application due Primacy application due January 4, 2008January 4, 2008– May apply for extension through May apply for extension through January 4, 2010January 4, 2010
• Notify systems/provide education
• Determine “combined distribution systems”
• Review Standard Monitoring or System Review Standard Monitoring or System Specific Study PlansSpecific Study Plans
• Review 40/30 certificationsReview 40/30 certifications
• Issue VSS waiversIssue VSS waivers
• Receive and possibly review IDSE reportsReceive and possibly review IDSE reports
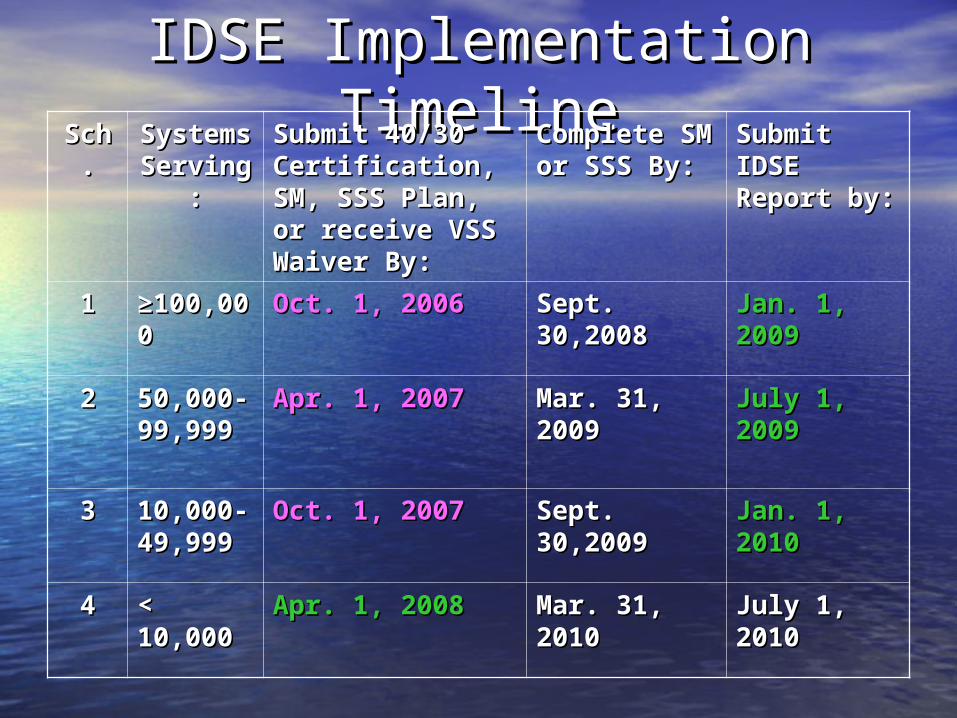
IDSE Implementation IDSE Implementation TimelineTimelineSchSch
..SystemSystem
s s ServingServing
::
Submit 40/30 Submit 40/30 Certification, Certification, SM, SSS Plan, SM, SSS Plan, or receive VSS or receive VSS Waiver By:Waiver By:
Complete Complete SM or SSS SM or SSS By:By:
Submit Submit IDSE IDSE Report by: Report by:
11 ≥≥100,0100,00000
Oct. 1, 2006Oct. 1, 2006 Sept. Sept. 30,200830,2008
Jan. 1, Jan. 1, 20092009
22 50,000-50,000-99,99999,999
Apr. 1, 2007Apr. 1, 2007 Mar. 31, Mar. 31, 20092009
July 1, July 1, 20092009
33 10,000-10,000-49,99949,999
Oct. 1, 2007Oct. 1, 2007 Sept. Sept. 30,200930,2009
Jan. 1, Jan. 1, 20102010
44 < < 10,00010,000
Apr. 1, 2008Apr. 1, 2008 Mar. 31, Mar. 31, 20102010
July 1, July 1, 20102010
ArsenicArsenic• New MCL of 0.010 mg/l- down from 0.05 New MCL of 0.010 mg/l- down from 0.05
mg/l- running annual average.mg/l- running annual average.• Applies to CWS, NTNCWS, new MCL effective Applies to CWS, NTNCWS, new MCL effective
on 01/23/06. First monitoring period 2005 - on 01/23/06. First monitoring period 2005 - 2007.2007.– If sampled prior to 01/23/06, new MCL doesn’t If sampled prior to 01/23/06, new MCL doesn’t
apply until next compliance period (2008-10).apply until next compliance period (2008-10).– If sampled after 01/23/06 or in 2007 and exceed If sampled after 01/23/06 or in 2007 and exceed
the MCL, quarterly sampling is required and a the MCL, quarterly sampling is required and a confirmation sample may be required.confirmation sample may be required.
– If sampled after 01/23/06 or in 2007 and are close If sampled after 01/23/06 or in 2007 and are close to the MCL, may require a confirmation sample.to the MCL, may require a confirmation sample.
ArsenicArsenic
• Monitor with Inorganic ChemicalsMonitor with Inorganic Chemicals– Monitoring reduction to every 9 years with three Monitoring reduction to every 9 years with three
results below the MCL- grandfathering allowed.results below the MCL- grandfathering allowed.
• 60 groundwater systems in Oregon with at 60 groundwater systems in Oregon with at least one result > 0.010 mg/L in recent least one result > 0.010 mg/L in recent sampling.sampling.
• Treatment – there are thirteen BATs for Treatment – there are thirteen BATs for arsenic removal- source blending, adsorption, arsenic removal- source blending, adsorption, ion exchange, reverse osmosis to name a few. ion exchange, reverse osmosis to name a few. Consider waste disposal when choosing a Consider waste disposal when choosing a treatment method.treatment method.
Radionuclides RuleRadionuclides Rule• Rule applies to Rule applies to CommunityCommunity water systems only. water systems only.
• Must monitor for gross alpha, radium 226, radium Must monitor for gross alpha, radium 226, radium 228 and uranium.228 and uranium.
• Initial monitoring period is 2004 – 2007. Four Initial monitoring period is 2004 – 2007. Four consecutive quarters must be sampled. consecutive quarters must be sampled. – 2005: systems serving > 300 people; 2005: systems serving > 300 people;
– 2006: systems serving 100-299 people; 2006: systems serving 100-299 people;
– 2007: systems serving < 100 people.2007: systems serving < 100 people.
• If you collected one sample of all 4 contaminants If you collected one sample of all 4 contaminants before 12/8/03, one sample substitutes for the before 12/8/03, one sample substitutes for the initial 4 quarterly samples.initial 4 quarterly samples.
• Follow-up sampling is:Follow-up sampling is: Every 9 years if no detectsEvery 9 years if no detectsEvery 6 years if < Every 6 years if <
½ MCL½ MCLEvery 3 years if > Every 3 years if >
½ MCL½ MCL
Groundwater RuleGroundwater Rule
• Applies to all public systems using Applies to all public systems using groundwater. groundwater.
• A sanitary survey is required for community A sanitary survey is required for community water systems every 3 years; non-community water systems every 3 years; non-community water systems every 5 years.water systems every 5 years.– Correct identified sanitary defects- major Correct identified sanitary defects- major
deficiencies.deficiencies.– List of major deficiencies found on DWP Website. List of major deficiencies found on DWP Website.
• Hydrogeologic sensitivity analysis is required.Hydrogeologic sensitivity analysis is required.– Source Water Assessments qualify.Source Water Assessments qualify.
• Fecal indicator monitoring of source water with Fecal indicator monitoring of source water with a history of coliform problems.a history of coliform problems.
Groundwater RuleGroundwater Rule
• Treat (disinfect) for bacteria and viruses if Treat (disinfect) for bacteria and viruses if there are uncorrected significant sanitary there are uncorrected significant sanitary survey deficiencies, if the source is survey deficiencies, if the source is sensitive, or the source is contaminated.sensitive, or the source is contaminated.– EPA estimates that the Groundwater Rule will EPA estimates that the Groundwater Rule will
effect 8% – 10% of the wells in the U.S.effect 8% – 10% of the wells in the U.S.
• Final rule is due to be promulgated by EPA Final rule is due to be promulgated by EPA sometime between Summer and Fall 2006.sometime between Summer and Fall 2006.
• Compliance date- three years after Compliance date- three years after promulgation.promulgation.
Groundwater Under Direct Groundwater Under Direct Influence of Surface Water Influence of Surface Water
(GWUDI) – NTNC & TNC(GWUDI) – NTNC & TNC• Evaluated 689 sources with possible hydraulic Evaluated 689 sources with possible hydraulic
connection to surface water based on results of connection to surface water based on results of Source Water Assessments.Source Water Assessments.
• Sources were dismissed based one or more of the Sources were dismissed based one or more of the following:following:– Hand Pump WellsHand Pump Wells– Surface water >200’ and drawing water from an alluvial Surface water >200’ and drawing water from an alluvial
aquiferaquifer– No disinfection treatment and no detections of coliform in No disinfection treatment and no detections of coliform in
the last 3 years or detections were distribution related the last 3 years or detections were distribution related only.only.
• Currently 245 sources will now be evaluated for Currently 245 sources will now be evaluated for surface water influence.surface water influence.
NTNC & TNC GWUDI NTNC & TNC GWUDI RequirementsRequirements
• Once system is notified by mail that they must Once system is notified by mail that they must evaluate their water source for GWUDI, they have evaluate their water source for GWUDI, they have three options:three options:1.1. Begin sampling monthly “special” raw water coliform for Begin sampling monthly “special” raw water coliform for
a period of 2 years.a period of 2 years.• If any results are confirmed positive for total coliform, the If any results are confirmed positive for total coliform, the
system must complete MPA testing.system must complete MPA testing.• If system misses 2 consecutive months or 3 months out of the If system misses 2 consecutive months or 3 months out of the
reporting year, the system must complete MPA testing.reporting year, the system must complete MPA testing.
2. Collect a total of 2 Microscopic Particulate Analyses (MPA) during high river stage (February – May) a minimum of 1 month apart.
3. Assume their source is GWUDI and install approved treatment.
GWUDI ChallengesGWUDI Challenges
• Test results will be sent to the Test results will be sent to the Springfield OfficeSpringfield Office
• Expecting high rate of non-Expecting high rate of non-compliance and enforcement may be compliance and enforcement may be a low prioritya low priority
• High cost and effort associated with High cost and effort associated with MPA testing ($250-$375 each) and MPA testing ($250-$375 each) and only two labs available for analysisonly two labs available for analysis
Source Water AssessmentsSource Water Assessments
• Source Water Assessments completed for Source Water Assessments completed for all C, NTNC, in July 2005. Handful of TNCs all C, NTNC, in July 2005. Handful of TNCs left to complete.left to complete.
• SWAs for new systems will be completed SWAs for new systems will be completed based on priority.based on priority.
• Updates for past SWAs are completed Updates for past SWAs are completed every 5 years with the Sanitary Survey for every 5 years with the Sanitary Survey for C and NTNC Schools or when a system C and NTNC Schools or when a system begins protection strategies.begins protection strategies.
Drinking Water ProtectionDrinking Water Protection
• Assist systems with developing and implementing Assist systems with developing and implementing protection strategiesprotection strategies
• Providing workshops for communities interested Providing workshops for communities interested in collaborative protection strategiesin collaborative protection strategies
• Continue to educate the public on drinking water Continue to educate the public on drinking water protectionprotection
• Partnership with DHS, DEQ and OAWUPartnership with DHS, DEQ and OAWU• DEQ DEQ - Integrate into watershed approach - Integrate into watershed approach
- Coordinate/leverage other programs and - Coordinate/leverage other programs and agencies (DEQ’s Tanks, ODF private agencies (DEQ’s Tanks, ODF private
forestlands, County planning, USFS, BLM, forestlands, County planning, USFS, BLM, ODOT, ODOT, ODA, SWCD, Watershed councils, etc.) ODA, SWCD, Watershed councils, etc.)