Embed Size (px)
Citation preview
Rehabilitating Rehabilitation: Prison Conditions andRecidivism∗
Giovanni Mastrobuoni†and Daniele Terlizzese‡
November 2014
Abstract
We use quasi-random variation in the fraction of time served in the Italian “open-cell prison” of Bollate to estimate the effect of rehabilitation efforts on recidivism.We deal with the endogeneity of rehabilitation assignments by focusing on thosesources of variability in the length of exposure to rehabilitation efforts that areplausibly unrelated to recidivism. Our most stringent test restricts the analysisto inmates who are displaced to Bollate due to overcrowding in nearby prisons,controlling for measures of observed (based on a revealed preference argument) andunobserved potential selection.
Spending one more year at the rehabilitating prison (and one less year at anordinary one) reduces recidivism by around 10 percentage points. For the group ofdisplaced inmates, which is shown to be negatively selected, the effects of rehabili-tation efforts on recidivism are larger.
While we find evidence that over time Bollate inmates become more likely towork outside the prison, more than a single mechanism seems to underlie theseeffects.
Keywords: Crime, Prison Conditions, RehabilitationJEL Codes: K140, K420
∗We would like to thank the Italian Ministry of Justice, the Italian Prison Adminstration (Dipartimentodell’Amministrazione Penitenziaria), and the people at Bollate Prison for invaluable discussions aboutthe rules governing the prisons and for providing the data. We thank in particular Roberto Bezzi,Francesco Cascini, Lucia Castellano, Emiliano D’Antoni, Anna Fino, Luigi Palmiero, Paola Severino,Giovanni Tamburino and Francesca Valenzi. The idea of working on the Bollate’s experience grew out ofmany passionate conversations with Donatella Stasio, who was also instrumental in obtaining the data.Ilaria Enrica Loda provided excellent research assistance. We received very useful comments when wepresented this work at the Transatlantic Workshop in the Economics of Crime (Bocconi Univesity) andat the Department of Criminology at the University of Pennsylvania. We would also like to thank JoshAngrist, Nadia Campaniello, Franco Peracchi, Sara Heller, and Frank Vella for useful discussions.†University of Essex, [email protected]‡EIEF and Bank of Italy, [email protected]
1 Introduction
Over recent decades most developed countries have witnessed high and often increasingrates of incarceration. The most well known case are the United States where in 2012more than 2.25 millions of the 310 millions residents were behind bars, with a sevenfoldincrease in the incarceration rate since the early 70s (in spite of the minor net outflowfrom jails and prisons observed in the previous few years); incarceration rates are highand increasing in several other countries, including Italy and the United Kingdom.
This process risks however of feeding on itself, as a large fraction of those who are sentto prison are repeat offenders. In the U.S. State prisons, for example, about 40 percent ofreleased inmates are re-incarcerated within three years.1 Therefore, if societies were ableto reduce recidivism, through either deterrence or rehabilitation, victimization rates aswell as incarceration rates would be reduced as well, generating large societal benefits (seeRaphael and Stoll, 2009).Moreover, given the high costs of building and running prisons,this would also have economic benefits for public budgets.
Opinions differ markedly, however, on the best way to curb recidivism. In Europe,rehabilitation is widely seen as the way to go. For example, a recommendation of theCouncil of Europe (2006) stresses that “ the enforcement of custodial sentences and thetreatment of prisoners necessitate ... prison conditions which do not infringe humandignity and which offer meaningful occupational activities and treatment programmes toinmates, thus preparing them for their reintegration into society.” Conversely, in the U.S.the deterrence effect of experiencing harsh prison conditions (usually referred to as specificdeterrence) is often seen as key. Almost all U.S. states and the federal government havesome sort of mandatory prison sentences, whose major justification is that they will teachoffenders that “crime does not pay”.
Yet, also in the U.S. rehabilitation is increasingly seen as an effective way of keepingin check the long-term costs of housing inmates: even Correction Corp. of America(CCA), the largest private prison firm, has recently announced a change in its businessmodel, committing to “play a leadership role in reducing recidivism...planning to expandthe company’s prison rehabilitation programs, drug counseling and its prisoner re-entrywork in cities around the country”, as quoted in a recent Wall Street Journal article.2.
Unfortunately, the debate between proponent of rehabilitation and supporters of spe-cific deterrence often occurs in an empirical vacuum: relatively little is known about theeffect of incarceration, and of the conditions in which incarceration takes place, on re-cidivism. A recent review by Nagin et al. (2009) concludes that “rigorous investigationson the effect of incarceration on reoffending are in short supply. As imprisonment isused in contemporary democratic societies, the scientific jury is still out on its effect onreoffending.”3
In this paper we provide novel and robust evidence supporting the view that rehabili-tation reduces recidivism – that is the likelihood that a released prisoner is re-incarcerated
1See http://www.bjs.gov/index.cfm?ty=daa.2See WSJ, September 12, 2014: “Prison Firm CCA seeks to reduce the number of repeat offenders”.
Interestingly, CCA mentions pressures from government clients to justify its change of strategy3For an additional insightful literature review see Ouss (2013).
2
within three years from the end of his custodial and non-custodial (e.g. home detention,monitored liberty, etc.) sentence.4 We compare post-release incarceration rates of inmateswho spent different fractions of the same overall sentence in a prison offering a rich set oftreatments developing human and social capital. Since the same sentence length mightinduce very different post-release behaviour, depending on whether the prison conditionswere harsh or mild or whether rehabilitation programs were present or not, we believethat it is important, when studying what drives recidivism, to control for the detailedconditions under which the sentence is served. This lacks from most of the studies re-viewed in Nagin et al. (2009), which focus on the impact on re-offending of receiving, ornot receiving, a custodial sentence or, in few cases, analyze the impact of the incarcerationlength; almost none take into account the conditions under which the sentence is served.5
Indeed, there is considerably more experimental evidence on the effects of reentrytreatment programs for ex-inmates – for example, post-release job training – on recidivismand employment, albeit with mixed results: some papers find that job training can bebeneficial (Raphael, 2010, Redcross et al., 2010), other finds the opposite (Visher et al.,2005).
The inmates included in our sample, instead, are not offered any post-release pro-grams. We have detailed data on inmates who spent some time in the Bollate prison,an Italian detention center inaugurated at the end of 2000 near the city of Milan, whichfeatured in 2003 in the New York Times article “Italian inmates receive training in aCisco computer program: Behind bars but learning to network”.Bollate is the only pure“open-cell prison” in Italy, and one of the few in the World. Open-cell prisons are morecommon in Scandinavian countries and, to a lesser degree, in the United Kingdom.6. Inthose prisons cells are kept open during the day, and prisoners are trusted to serve theirsentences with minimal supervision: inmates are allowed to freely move across the prisonwith electronic badges, making it easier to reach the location where they either study orwork. Indeed, inmates can go to school (up to secondary education), learn English andcomputer languages. They can train to become carpenters, electricians, cooks, welders,as well as work in or out of prison for several agricultural and service cooperatives. Andfor about a third even prison walls are “open”, as they are given the opportunity to workusing day releases.
Moreover, Bollate has its own garden produce, as well as horses, and both are used fortherapeutic reasons. Bollate is thus able to offer a wide range of professional developmentstrategies that can suit inmates with different predispositions.
Inmates elect their representatives and, within a given budget, have a say on severalaspect of their prison life (furniture, food, etc). When children are visiting their parentsthey can spend their time in dedicated play rooms that are nicely furnished and full of
4Since our sample comprises inmates released between 2000 and 2009 and we can follow them until2013, the three year period is never truncated.
5Notable exceptions are Katz et al. (2003), Chen and Shapiro (2007), and Drago et al. (2011). Whilethe first paper finds that harsher prison conditions (proxied by prison suicides) are associated with lowercrime rates, the other two papers show that if anything such conditions increase recidivism.
6Some examples are Bastoy (Norway), Suomenlinna Prison (Finland), Soebysoegaard (Denmark), HMPrison Prescoed (South Wales), HM Prison Castle Huntly (Scotland), HM Prison Ford (England).
3
toys.In such an environment, prison violence is contained and fewer guards are needed,
which keeps costs down.7 Against an average daily cost per inmate of about 130 euros,in 2013, the cost at Bollate was only about 64 euros.
In sum, the treatment at Bollate consists of a complex set of differential interventionsand prison conditions.8 Additional information on the prison and a comparison with theconditions in other prisons will be provided in Section 2.
It is hard to think of prison conditions that more closely approximate the idea setforth by the previously quoted Recommendation of the Council of Europe. It is thereforenatural to ask whether they are effective in preparing inmates for their reintegration intosociety, or at the very least in reducing their recidivism.
To answer this question we must of course confront a serious selection problem, asclearly prisoners sent to Bollate are not a random sample of prisoners, and we might expectthe selection to negatively correlate with the unconditional propensity to recidivate. Wedeal with this issue by exploiting the length of the period spent in Bollate: the subjectsof our analysis are all treated, but they differ for the dose of the treatment. This isnot dissimilar to the standard analysis of the returns to education. The usefulness ofsuch approach, in connection with recidivism, is noted and exploited by Di Tella andSchargrodsky (2013). Of course, we need to argue that the length itself varies in a near-random fashion. We will do this by progressively restricting the sources of variability inthe length of the treatment.
First, we consider the timing of the selection into Bollate: due to arguably randomdelays in the various steps of the selection process (which will be explained in detail inSection 2) some inmates end up spending a smaller fraction of their overall sentence inBollate. This generates a quasi-experimental random variation in the duration of the“Bollate treatment” – which we here define as the length of the residual sentence spentthere – that allows to identify its causal effect on recidivism. Comparing conditionalrecidivism rates of inmates who spent different fractions of their total prison time inBollate we find that, for a given total sentence (and controlling for many covariates),replacing one year in a traditional “closed cells” prison with one year in an “open cells” onereduces recidivism (over a three-year horizon) by about 10 percentage points (against anaverage three-year recidivism of about 40 percent). If indeed the delays in the completionof the selection process are random, this measure of the effect of prison conditions onrecidivism solves the selection problem, since among a group of prisoners who are allselected, the different “doses” of the treatment are (quasi) randomly assigned.
It might be argued, however, that the delays are not random, and we do find some(limited) evidence of correlation between some covariates, mainly the type of crimes com-mitted, and the length of the residual sentence spent at Bollate.
To overcome this potential difficulty we restrict the analysis to those prisoners whoare displaced to Bollate because of overcrowding in nearby prisons. As the administration
7In 2009, in the Bollate prison, 470 prison guards and administrative staff dealt with 1032 inmates, aratio of about 1/2. Nationwide the same year the total number of prison guards and administrative staffworking inside penal institutions was 43,817 against a prison population of 63,983, a ratio of about 2/3.
8The appendix Figures ?? to ?? provide photographic evidence on the prison conditions at Bollate.
4
of Bollate prison cannot refuse to accept displaced inmates (as long as there is spaceleft in Bollate), the explicit selection process is sidestepped. True enough, the displacedprisoners usually remain at Bollate for a shorter period, and are not subject to the samequalitative treatment of the other inmates. Yet they experience there an environmentradically different from those of other prisons, much more respectful of their dignity, andparticipate in some of the activities. At the same time, the length of the residual sentencethat they end up spending at Bollate is mostly due to the occurrence of overcrowding innearby prisons, an event which is arguably random. As before, we exploit the different“doses” of the treatment to identify its causal effect.
Interestingly, despite a potentially less motivated group of inmates (they did not applyto be at Bollate) and a qualitatively less intense treatment, the point estimate of the effectof the “Bollate treatment” on recidivism, in the case of displaced inmates, is even largerthan for the total sample: a reduction of about 13 percentage points for every year spentat Bollate instead of the prison of origin. This might reflect the fact that non-selectedinmates have more room for improving.
One could still be worried that prisoners displaced to Bollate are not randomly chosenby the sending prison. On the one hand, other prisons might have an incentive to get ridas early as possible of their more dangerous inmates. On the other hand, being displacedto Bollate might be used as a reward for the best prisoners. While the first behaviourwould bias our estimates towards zero, and would therefore reinforce our conclusions, thesecond would bias the results away from zero.
To deal with this difficulty we exploit the variability in the residual sentence amonginmates displaced to Bollate at the same time and from the same prison. This ensuresthat, whatever the selection process implemented by the sending prison, it is the same forall the displaced inmates. Therefore, provided the selection process is not itself based onthe residual sentence, the variability of the latter then results solely from the random datein which different inmates started serving their sentence (controlling for its total length).In this case, the different “doses” of the Bollate treatment can be interpreted as randomlyassigned to inmates otherwise identical. Controlling for the prison of origin and for theweek of displacement does not alter our results.
There remains a final potential concern: the sending prison might select the displacedinmates taking into account not only their dangerousness, but also the length of theirresidual sentence, as the amount of troubles an inmate is expected to create is a functionof both margins. If this were the case, the displaced inmates with a short residual sentencewould be those who are particularly dangerous, thereby generating a negative correlationbetween residual sentence and recidivism independent from the effect of the treatment.While there is no evidence that among the inmates displaced from a given prison at agiven time the residual sentence correlates with the other covariates in a way that wouldbias our results downwards, we develop a strategy to measure, for each inmate, the degreeof selection.
To do this, we attach to each displaced inmate a score, increasing in the number oftimes in which he could have been displaced in the past, from the same prison, and wasnot. By revealed preferences, conditional on the total sentence length this is a measureof the perceived dangerousness of the inmate: if the administration of the sending prison
5
could have gotten rid of him earlier and chose not to, he must have been perceived as lessdangerous than other inmates who were displaced earlier. We then check whether thisscore correlates with future recidivism, adding it as an additional variable to the mainregression. Our results, again, do not change.
The effects of the “Bollate treatment” differ across different categories of inmates: thereduction of recidivism is very strong for inmates who were convicted for economicallymotivated crimes (theft, robbery, extortion, fraud...), while it is not significant for inmatesconvicted for violent crimes; it is stronger for inmates who do not have a long history ofrecidivism, and who are less educated. Taken together, these heterogeneous responsessuggest that the treatment is most effective when administered early enough on thosepeople who are driven to a criminal activity by necessity.
As to the mechanisms underlying the reduction in recidivism resulting from the “Bol-late treatment,” we find that the latter becomes more intense as time goes by, for both,displaced and selected inmates: the longer their stay at Bollate, the more they are likelyto be transferred to the Section 5, which gives access to jobs outside of prison, and to beallowed day releases. This suggests that offering opportunities to work and facilitatingthe entry (or re-entry) into the labor market is an important ingredient of the treatment.
However, the even larger effects of the treatment on displaced inmates, who are muchless likely to be given access to work opportunities while in prison, points to the existenceof additional mechanisms. We conjecture that conditions respectful of human dignity, cou-pled with responsibility and productive use of time, as offered by Bollate’s environment,in and of themselves positively affect the post release behavior of inmates. Interestingly,the larger effect of the “Bollate treatment” on the displaced inmates, relative to the ac-tively selected prisoners, suggests that the selection into Bollate picks those inmates thatbenefit relatively less from being there (at least when the benefit is measured in terms ofreduced recidivism). To rephrase this conclusion in positive terms, it would seem that aless choosy selection into Bollate would generate more bang for the buck.
This would not be the case, however, if the reduced recidivism were to result fromweaker deleterious peer effects: indeed, Bollate might use the selection to limit the arrivalof “bad” peers. If so, the possibility to scale up the Bollate experience would be curtailed,since a less exacting selection process would undermine the effectiveness of the treatment.We use data on the cell and the prison section to measure the effect on recidivism ofbeing exposed to a larger group of displaced inmates during an inmate’s stay. We find noevidence that such exposure increases recidivism, even when such exposure in measuredat a very fine level (cells).
Differently from the broad conclusion of the Nagin et al. (2009) survey, which findsthat incarceration has a null or mildly criminogenic effect, we show that, unlike the prisonsof origin, the Bollate prison is not criminogenic. Provided that the time spent in prison isappropriately used to offer “meaningful occupational activities and treatment programmesto inmates, thus preparing them for their reintegration into society,” recidivism can bereduced. The old view that, in terms of rehabilitation, “nothing works,” seems thereforeincorrect. The two requirements embodied in the Council of Europe’s recommendation–dignity of treatment and rehabilitation–appear to be closely linked: prison conditions thatrespect the dignity of inmates are conducive to rehabilitation. Given the widespread use
6
of incarceration and the expansion of the prison system across most countries, identifyingwhat works and implementing the right correctional policy will have large payoffs.
1.1 Relationship with the literature
Our work is related to a few economic studies analysing the effect of imprisonment onrecidivism. Di Tella and Schargrodsky (2013) use ideological differences of randomly as-signed judges to show that Argentinean inmates who spend part of their sentence underelectronic monitoring, instead of prison, have lower recidivism. They also analyze theintensity of treatment in a way that resembles our study. Focussing on the group ofelectronically monitored inmates, where they argue that “the problem of selection is lessrelevant”, they find that increasing the fraction of time spent under electronic monitoring(as opposed to ordinary imprisonment) reduces recidivism. Their results are consistentwith our own. On the one hand, the larger is the fraction of time served under condi-tions more respectful of human dignity (as when allowed to be outside the prison underelectronic monitoring), the lower is recidivism; this is clearly reminiscent of our “Bollatetreatment.” On the other hand, the larger the total time served in ordinary prisons, whichin the Argentinean case are often degrading, the larger is recidivism; we find the sameresult when lengthening the time served in an ordinary prison (holding fixed the timespent at Bollate).
Aizer and Joseph J. Doyle (2013) use the same identification strategy (random as-signment of judges who differ in their punitiveness) to focus on the effect of juvenileincarcerations on recidivism. The labor market prospects of incarcerated juveniles, whowould otherwise be at school, might suffer more than those of adults; juveniles might alsobe more susceptible to criminal peer effects. While data limitations do not allow them tomeasure recidivism effects at the intensive margin (short vs. long incarcerations), theydo indeed find compelling evidence that any juvenile incarceration increases recidivism asan adult, as well as reducing the likelihood of high school graduation. Our data does notcontain any juveniles. The youngest inmates are 19 years old, and the average age is 38.9
Opposite to the above findings, in Kuziemko (2013) an exogenous one-year increasein prison length driven by changes in Georgia’s parole-board guidelines lowers three-yearrecidivism by a very large degree (-43 percent). Our results might provide an explanationfor such opposite findings: prison time served by adult inmates in different prisons, withdifferent rehabilitation programs, can lead to very different effects on recidivism. A longerprison time served might reduce or increase recidivism, depending on whether it takesplace in a prison with rehabilitation programs, like Bollate or prisons in Georgia U.S., orin a much harsher one, like the other prisons in Lumbardy or prisons in Argentina.
As a background to our analysis it is also worth mentioning Raphael and Stoll (2009),who provide an insightful counterfactual analysis of the U.S. incarceration rates between
9Similar criminogenic effects of prison time have been found by Gaes and Camp (2009), while Greenand Winik (2010), exploiting once again random assignment of judges, find that recidivism does notrespond to incarceration. Starting with Kling (2006), researchers have also used the random assignmentof judges to estimate the effect of incarceration length on the inmates’ labor market prospects.
7
1980 and 2005. Their findings show that most of the observed growth is driven by in-creased admission rates into prison (as opposed to changes in release probabilities and inthe average time served). While their study can not distinguish first-time prisoners fromrecidivists, the increase in the admission rate of inmates on parole, who represent a subsetof all recidivists, explains about 20 percent of the growth in the U.S. prison populationbetween 1980 and 2005.10
The next Section provides additional information on Bollate and on the selectionprocess, discusses our identification strategy and describes the data. Section 3 presents theresults and a battery of robustness checks. Section 4 makes a first attempt at investigatingthe mechanism underlying our results. Section 5 concludes.
2 The Quasi-experiment
To understand the sources of variability that will allow us to identify the causal effect ofthe “Bollate treatment” it is useful to start with a little background on the Bollate prison,and on the working of the Italian judicial and prison system.
2.1 The Bollate Prison
Inmates convicted to a prison sentence of less than three years and inmates waiting fortheir definitive sentence are typically incarcerated in jail (Case Circondariali), near theplace where they reside, or, temporarily, near the place where they committed the crime.11
Given that most incarcerations in the Case Circondariali tend to be short, thesedetention centers invest very little effort in trying to rehabilitate the inmates. If convictedto a prison sentence of at least three years, the inmates are transferred to a different typeof prison, known as Casa di Reclusione. The aim is a) to separate serious convictedoffenders from the other ones, and b) to focus rehabilitative efforts on those inmates whospend a sufficiently long time in prison. In fact, due to overcrowding and lack of resources,the rehabilitative efforts in most Case di Reclusione are often rather limited.
We focus on inmates who spent at least part of their sentence in the “Casa di Reclu-sione Bollate” (near Milan; we will henceforth refer to this prison simply as Bollate). Aswe mentioned in the Introduction, Bollate was opened in late 2000, with the explicit goalof creating a rehabilitating prison, leaving ample room for a range of activities and es-tablishing joint work/training programs with regional institutions and non governmentalorganizations. Differently from other prisons, security was not seen merely as a policeconcern but also educators, psychologists and even the inmates themselves were involved
10Both, Raphael and Stoll (2009) and Neal and Rick (2014) show that the growth in admissions inmainly driven by changes in criminal justice policy towards more punitive sentencing rather than changesin criminal behavior.
11Individuals can be incarcerated before trial if caught in the act of committing an offence (flagranzadi reato) or whenever there is a significant risk that they either pollute the evidence, recommit the samecrime, or escape the judgment (upon decision of a special court, Giudice per le indagini preliminari).
8

and given responsibilities.12
Table ?? presents the main characteristics of the prisons from which the Bollate prisondraws most of its inmates. About 70 percent of inmates are transferred from the largestCasa circondariale in the Lumbardy region, San Vittore. The first striking differencebetween Bollate and all other prisons is that in the former all inmates are part of the“open cells policy”. Badges allow them to move out of their cells for most of the day(10 to 12 hours), while the majority of inmates in the other prisons spend only around 4hours outside their cells (which represents the minimum time required by law).
Bollate is also the youngest prison. San Vittore was built in 1879, following Bentham’spanopticon design. Opera, the other major Casa di Reclusione was built in 1980. Theseolder prisons tend to be overcrowded: in 2009, at San Vittore, the ratio of inmatesover official capacity was 142 percent, at Opera it was 128 percent (similar conditionsare observed in all the other years of our sample). Bollate, instead, is always below itscapacity. This contributes to better prison life, keeping suicides and attempted suicides,self-inflicted injuries, and hunger strikes at the lowest level compared to all the otherprisons in Lumbardy.
Apart from the open cell policy and the lack of overcrowding, Bollate is special forits rehabilitation efforts, and in particular for those targeted to the future entry into thelabour market of inmates. In most prisons, a fraction of the inmates (between 12 and 30percent) work for the prison administration, cleaning, cooking, etc. These jobs are hardlyuseful for their future job chances outside the prison.
At Bollate inmates have the opportunity to work for other employers than the prisonadministration, both inside and outside the prison. At a given point in time, about30 percent of inmates are actively working for pay, either for employers that open aproduction line inside Bollate or for employers outside the prison. The fraction of inmateswith similar arrangements is just 0.5 percent at San Vittore, 6.5 percent at Opera, and isnever larger than 6.6 percent at other prisons in Lumbardy.
On top of this inmates in Bollate are more likely to be at school or at the university.For example, in 2009 in Bollate 8 inmates were enrolled at a university, against the 7inmates at all the other prisons in Lumbardy combined.
A remarkable feature of Bollate is that its running costs are much lower than theaverage prison in Italy. Table ?? shows, for two recent years, that the per-inmate dailycost of Bollate is about 65 euros, while the average for the whole country is about 130euros. The difference is mainly due to the much lower wage cost, which in turn reflectsthe much lower number of guards and administrative staff, relative to inmates (the percapita wage of people working at Bollate is the same as in other prisons of the country).
Taking all together, Bollate is then radically different from most other prisons in Italy.Not all the differences, though, are supply driven. Bollate inmates represent a selectedgroup, and their demand of rehabilitation might be stronger. In the next section wedescribe how the selection works.
12Inmates were asked to sign a “Responsibility Pact”, committing to a responsible behavior lest beingtransferred to a different prison.
9
2.2 The Treatment and the Identification Strategy
Inmates are selected into Bollate through two main channels. Either they apply to besent there, or they are proposed by the administration of a different prison (usually inthe same region) or by the Justice Department.13 A third channel of access to Bollate,which does not involve an explicit selection process, is provided by displacement of nearbyovercrowded prisons; we will considered displaced inmates later.
2.2.1 The Explicit Selection
For each request/proposal, the regional administration office for Lumbardy of the Ministryof Justice (the “Provveditorato Regionale di Milano”) assesses, together with the Bollateprison administration, whether the following criteria are satisfied. Inmates should, as arule: have a residual sentence in the range 2 to 10 years; be in a good health status, andnot be under methadone treatment; have a definitive sentence;14 have shown propensityand active interest for rehabilitation programs (this is reflected in a positive assessmentby a specialized team); have had a generally good behaviour in the previous prison; and,finally reside or have interests and relationships in the Lumbardy region.
Although some exceptions to these criteria are allowed, and some of them have beeninterpreted at times in a somewhat looser way, they provide a fairly accurate descriptionof the requirements to be a “regular” Bollate prisoner (these requirements do not applyfor prisoners displaced to Bollate; we will have more to say about this later).
Once the assessment is completed, either the same regional office or a Departmentwithin the Ministry (the “Dipartimento dell’Amministrazione Penitenziaria”) decree thetransfer of the inmate. Crucially for our analysis, the time it takes for the whole procedureto be completed, and therefore the residual sentence upon arrival at Bollate, can vary fora host of factors:
1. the initial request/proposal can be incomplete, and additional documents need tobe obtained;
2. some of the criteria might not be fully satisfied,or the people assessing them mightnot be fully convinced that they are satisfied, and the request/proposal is put onhold until they are;
3. there can be delays with which an inmate who satisfies the criteria submits therequest or is identified by the administration of the current prison as eligible for theproposal;
13A small number of inmates give up themselves directly to the Bollate prison, which we treat as ifthey applied to be sent to Bollate.
14The Italian judicial system allows for up to two appeal courts. Depending on whether or not a givensentence is resisted, and up to which degree of appeal, the time elapsed before the sentence becomesdefinitive can vary by several years. Although in principle a convicted should not go to prison before thesentence is definitive, there can be a number of reasons why he/she is incarcerated even before the finalappeal is decided.
10
4. whenever the inmate is considered a good prisoner worthwhile retaining, the admin-istration of the prison of origin might potentially delay the process;
5. an inmate might be already involved in some activities or rehabilitation processesthat is best not to interrupt;
6. the various administrative offices involved in the procedure can take different timeto process the information and to reach a judgment, due to random variation of thebacklog of other administrative tasks or of their efficiency;
7. whenever the conditions for the application of preemptive imprisonment (“custodiacautelare”) apply, an inmate might have already served part of his/her sentencebefore the latter becomes definitive, depending on the number of appeals and onthe speed with which they are settled. Since in principle Bollate only accepts inmateswith a definitive sentence, any given sentence length can be associated with differentlengths of the residual sentence;
While some of these factors impart near-random variability to the timing of arrival toBollate, in some instances it might be argued that the length of the delay itself reflectssome selection. For example, for factors 1, 2 and 3 it could be argued that “better”inmates (more educated, with better labour skill, better behaviour, etc.) are more likelyto be identified earlier and in a clearer cut way, so they would end up in Bollate earlier; asto factors 4 and 5, conversely, it could be argued that “better” inmates are more likely tobe retained for longer by the prison of origin, so they would end up in Bollate later. Factor6 is arguably fully exogenous. A point worth stressing relates to factor 7. Conditional onthe crime committed and on the criminal history, the speed with which a a given sentencebecomes definitive often depends on the working efficiency of judges. As shown in Covielloet al. (2011) different judges can have very different levels of productivity.15 Since judgesare randomly assigned to cases, these differences lead to random variation of the timingof arrival to Bollate.
Unfortunately, it is impossible with the data at our disposal to weigh the importanceof the different delays.
However, we have a range of variables that characterize the selection mechanism ofinmates (whether they applied or were proposed, where they were spending their previousprison time) and their previous criminal history, which are arguably a good proxy of theinformation set available to the people involved in the selection process. Our identificationassumption when using the entire sample of inmates, and not just the displaced ones, isthat conditional on such variables, as well as on the total sentence length, the time ittakes for the process to be completed – which translates into the residual sentence to bespent in Bollate when transferred – is as good as random. Later we are going to testwhether the residual sentence, conditional on the total prison time, is correlated with anyof the observables (see the Balance Test Table ??).
15The judges in their data are also based in Milan, but deal with labor controversies. The judge withthe lowest productivity would on average take 400 days to finish a trial, while the fasted ones would takeless than half that time.
11
For about 2/3 of inmates the residual sentence upon arrival at Bollate represents theactual sentence spent there, as they are never transferred again before their final prisonrelease. An inmate might however be transferred to another prison ahead of time if he/shemisbehaves, or the treatment appears to be of little use. An alternative possibility is thatthe inmate’s behaviour is so promising that he/she is given an early release (through non-custodial sentences). Clearly, both possibilities are the result of the inmate’s behaviour,so the actual time spent in Bollate suffers from endogeneity. The effect of the residualsentence upon arrival at Bollate, therefore, has the nature of an intention to treat ef-fect. It might differ from the average treatment effect as the actual prison time, possiblyshorter, is potentially endogenous. Despite this drawback, it could be considered a moreappropriate measure of the treatment, since the residual sentence upon arrival might over-state the effective “dose” of the treatment received. This is a standard problem in policyevaluation studies: the intention to treat is cleaner, because it is more clearly exogenous,but overstates the measure of the administered treatment due to non-compliance.16 Weconsider the intention to treat as our preferred measure of the treatment, but we will alsopresent results for the actual time spent in Bollate, instrumenting it with the potentialone.
2.2.2 The Displaced Inmates
As mentioned, not all inmates in Bollate go through the admission procedure we havejust described. Some inmates are sent there because nearby prisons are overcrowded andBollate has spare capacity (which is very frequent). The Bollate administration has nocontrol on which or when inmates are displaced there. Since almost all displacementsoriginate from prisons within the same Lumbardy region, the “Provveditorato Regionaledi Milano” collects the requests from the prisons having too many inmates, relative totheir capacity, and distributes them in nearby prisons with spare capacity. For a numberof years the inmates displaced to Bollate did not need to satisfy the requirements thatwe described before; only recently (post 2008) a looser version of the screening processhas been introduced also for displaced inmates, but given that our sample stops in 2009almost all the displaced inmates that we consider belong to the pre-screening period.
This implies that the delays affecting the explicit selection process (factors 1, 2, 3above), which are more likely to imply that “better” inmates are selected earlier (increas-ing their residual sentence in Bollate), are shut down. These are for us the most worryingkind of delays, since speeding up the arrival of the most promising inmates, or delayingthe arrival of the least promising ones, would generate a negative correlation between theresidual sentence length and future recidivism, even in the absence of a real treatmenteffect. Thus, focussing on displaced inmates strengthen our identification strategy. More-over, given that the displaced inmates are much more likely to be a random sample of the
16In studies where compliance cannot be observed, the intention to treat provides a sobering butperhaps more realistic assessment of the effects of the treatment, as a certain share of non-compliance ispart and parcel of the treatment. In our case, in which any difference between the intention to treat andthe actual treatment is under the control of the prison administration, perhaps the latter is in principlethe most appropriate measure.
12
whole population of inmates, they provide an interesting comparison group to the inmatesselected into Bollate, and one for which the external validity of our results is arguablystronger.
Focussing on displaced inmates, we are left with residual sentences that vary because,conditional on total sentence length, there is random variation in the time of arrest andconviction (similar to factor 7 above) and in the time when a given prison becomes over-crowded and a transfer takes place; moreover, an additional source of variability (admit-tedly, a limited one) is provided by possible delays in the administrative process matchingthe requests by overcrowded prisons with the available places in nearby prisons with sparecapacity, similar to factor 6 above. In passing, these sources of variability resemble theconditional exogeneity assumption used by Drago et al. (2009) and by Kuziemko (2013).In both studies the difference between the actual and the recommended sentence is notdue to the timing of overcrowding at a specific prison facility, but rather due to the timingof a mass release.
We cannot rule out, however, that the prison of origin still cherry-picks the inmatesto be displaced. Thus, some elements of selection might be present even when restrictingthe analysis to displaced inmates. A plausible conjecture, which is unofficially confirmedby prison operators and administrators, is that more trouble-making prisoners are morelikely to be displaced (this point is akin to factors 4 and 5 above). If this were the case,in a sample that includes subsequent waves of displaced inmates from the same prison,more trouble-making prisoners would be displaced earlier, and would mechanically tendto have longer residual sentences. This would be a source of bias in our estimates, thoughone biasing the estimated effect of the treatment towards zero. If instead the less trouble-making prisoners were to be preferentially selected for displacement – as one could argueif the transfer to Bollate were to be used as a reward for good behaviour – we wouldobserve the opposite bias.
Indeed, the evidence seems to support the first possibility: our sample of displacedinmates seems to be be negatively selected, as is apparent from their recidivism rates(Table ??). The difference in recidivism between displaced and actively selected inmatesis 12.1 percentage points (39.7 against 27.8 percent), and is significant at the 1 percentlevel.
How do these recidivism rates compare with those observed on average? While theItalian Justice Department does not publish three-year recidivism rates for the entireItalian prison population, we can use the 2006 collective pardon, which in the first weekof August released around one third of the prison population, to compute an overallmeasure of recidivism.17 After 35 months, thus in June 2009, re-incarceration rates wereequal to 30.3 percent. In comparison with this, therefore, the recidivism rate observed forour selected sample is slightly lower, while it is somewhat larger for the displaced sample.However, the comparison suffers from two opposite biases: on the one hand, the inmatesin our sample (who have a prison sentence of at least 3 years) tend to be more seriouscriminals than the average pardoned ones; on the other hand, the pardons have been
17Barbarino and Mastrobuoni (2014) show that there was little selection in the pardon, and thatpardoned inmates were on average similar to the typical Italian inmates.
13
shown to generate additional deterrence (in case of re-offending, the pardoned sentenceis added to the new sentence).18 On balance, and taking into account the selection ofinmates into Bollate, the recidivism rates in our sample seem broadly consistent withthose observed in the rest of the country.
2.2.3 A Revealed Preference Measure of Selection
Whatever the sign of the bias on the estimated effect of the treatment on displacedinmates, we can attempt to eliminate such bias by focussing on those inmates who weredisplaced at the same time and from the same prison: in this way we get rid of themechanical link between the residual sentence and the timing of displacement and weare left with the variability arising from the random variation in the time of arrest,conditional on total sentence length. Intuitively, we identify the effect of the “Bollatetreatment” by comparing the future recidivism of inmates who were displaced to Bollateat the same time, from the same prison, where they were serving the same sentence,but who had started serving it at different random times in the past, so that they areleft with randomly different residual sentences to be served at Bollate and are thereforetreated with randomly different “doses” of the treatment.
A bias might still be present, however, if the selection of the displaced inmates were tobe based directly on their residual sentence. This might be the case if the sending prisonwanted to get rid of those inmates who were expected to generate the largest amount oftrouble, which in turn is given by the product of their “instantaneous troublesomeness”and the length of their presence in the sending prison, if not displaced. Under thishypothesis, the inmates with a short residual sentence would be displaced only if their“instantaneous troublesomeness” were particularly high, thereby generating a negativecorrelation between residual sentence and recidivism independent from the effect of thetreatment.
Our informal discussions with prison administrators do not lend much credence tosuch an hypothesis. Moreover, the residual sentence of displaced inmates is on averagerather short, and is therefore a margin somewhat unlikely to be really relevant. Still, wecontrol for the possibility that the selection of the inmates to be displaced were based ontheir residual sentence in two ways. First, we compute a balance table to test whether theresidual sentence is orthogonal to observable characteristics of the displaced inmates, andthus presumably also to unobservable ones. Second, we make use of revealed preferenceargument of selection. For each inmate we can reconstruct how many times he could havebeen displaced from a given prison but was not. If the hypothesis we are trying to testwere true, any inmate who could have been displaced and was not would be revealed tobe preferred, by prison administrators, to an inmate who was indeed displaced earlier.Conditional on the sentence served in the prison of origin, such count represents a measureof selection that is directly linked to the choice of the administrators of the prisons oforigin, which can be added as an additional control to the recidivism regressions.
18Drago et al. (2009) exploit this feature to estimate deterrence.
14
2.3 The Data and the Randomization Tests
2.3.1 Prison Records and Sample Selection
We collaborated with the “Dipartimento dell’Amministrazione Penitenziaria” of the Ital-ian Ministry of Justice, its regional administration office for Lumbardy, the “Provvedi-torato Regionale di Milano” and the administration of the Bollate prison to link differentadministrative records collected up to February 15, 2013.
We were granted access to a large amount of information on inmates who spent someprison time in Bollate between 2001, the opening year, and 2013, the closing date of ouranalysis. The information includes the entire history of incarcerations, dating as far backas 1971, and of incarcerations following their release from Bollate (if occurring before2013). Starting in 2006 we can also measure transitions inside the Bollate prison acrossdifferent sections, which will allow us to provide direct evidence about the treatmentmechanisms (as different sections correspond to different activities inside and outside theprison).
As mentioned, we restrict our sample to Italian (57 percent of inmates are foreigners),male (less than 30 inmates are female), inmates that are not sex offenders. We excludedforeigners because of the difficulty of measuring recidivism for foreign offenders, who mostof the time are illegal immigrants without any paperwork and are therefore able to hidetheir identity or leave the country after dismissal from prison. We excluded the 8 percentof inmates who are sex offenders because they are subject to specific incarceration rules.
There are many possible definitions of recidivism. From a legal viewpoint, recidivismoccurs when a release after a definitive conviction 19 is followed by another definitive con-viction. We will maintain the first requirement and weaken the second, by considering asrecidivist any inmate who, having served a definitive conviction, is re-incarcerated withinthree years from the end of his custodial and non-custodial (e.g. home detention, moni-tored liberty, etc.) sentence. We are not requiring that the last imprisonment correspondsto a definitive conviction because the latter would force us to keep a very long windowof observation after the inmate release, given the three levels of appeal in the Italianjudicial system. Implicitly, we therefore prefer false positives (a re-incarcerated inmatewho is later acquitted) to false negatives (a re-incarcerated inmate who is definitively con-victed only past the three year window). Given that conviction rates for re-incarceratedcriminals tend to be high, the likelihood of false negatives is likely to be negligible, andunrelated to the residual sentence in Bollate.
Having chosen a three year measure of recidivism, this forces us to restrict our analysison inmates released up to 2009.
In the end we have, for each (Italian, male, not sex-offender, serving a definitive sen-tence) inmate who spent some time in Bollate between 2001 and 2009 (about 2300 people)a complete “prison history,” with the number and the dates of previous prison spells (ifany), the dates of the period spent in Bollate, the date of a possible new incarceration
19Inmates who by the time of dismissal had a definitive conviction are 90 percent of the total numberof inmates. Restricting to a definitive conviction before the release avoids that a re-incarcerated is dueto the final conviction for the same crime
15

after Bollate (and up to February 2013). We have information on a number of character-istics of the inmates as well as on the crimes for which they had been imprisoned. Wealso have some information on the selection process into Bollate, as we can distinguishthe prisoners displaced there due to overcrowding of nearby prisons, those transferred for“treatment” reasons, those assigned there when their request has been approved, thoseassigned there by the Justice Department without mentioning “treatment”, and thosetransferred for other reasons (mainly transfers from the Central Government or arrestsby Bollate officers). This kind of information is missing for 12 percent of the sample.
2.3.2 Summary Statistics and Randomization Tests
Our main measure of the “Bollate treatment” is the length of the residual sentence tobe spent in Bollate (we will always condition on the total sentence served). Figure ??shows the distribution of the ratio between the residual and the total sentence, namelythe fraction of the total sentence served at Bollate. The left panel is for the entire sample,the right one for the sample of displaced inmates. Transfers are more likely to happen atthe beginning of an inmate’s incarceration, which skews the distribution to the left, andthis is true even when focussing on displaced inmates.
The average sentence and average residual sentence served at Bollate by entry reasonare shown in Table ??. Inmates displaced to Bollate have an average total “served”sentence (1.268 years, or 15 months) that is lower than the three years minimum sentencethat inmates typically need to be at Bollate. Thus their average residual sentence uponarrival is also low (9 months), 6 months shorter on average than that of the selectedinmates.
One third of the times the actual sentence served in Bollate is shorter than the potentialone (this is true also for displaced inmates). This happens either because inmates aretransferred to other prisons or because they are given non-custodial sentences at theend of their stay in Bollate. The different entry reasons is associated with differenttreatment strategies. Table ?? show that only a handful of displaced inmates finishtheir incarceration in Section 5 – the section from which inmates spend daytime workingoutside the Bollate prison – while for the other inmates the proportion varies from 10 to 25percentage points. Recidivism patterns are also strikingly different. Inmates selected tobe sent at Bollate have on average a recidivism rate much lower, by 12 percentage points,than inmates displaced there. Among the selected inmates, those who applied to betransferred and those transferred by the Justice department and the Central Government(other entry reasons) have the lowest recidivism rates.
Summary statistics for all the additional variables that describe the inmates and theircrimes and that are later used as regression controls are shown in Table ?? (for theentire sample, inclusive of the displaced inmates, on the left panel and for the sampleof only the displaced inmates on the right one). We already described the recidivismpatterns. The second variable in Table ??, Art. 4 bis (Divieto di concessione dei beneficie accertamento della pericolosit sociale dei condannati per taluni delitti), restricts theapplicability of prison benefits (day releases, outside work, non-custodial sentences) fora series of crimes (e.g. terrorism, organized crime, slavery, sex trade, kidnapping with
16
extortion, etc.). Twelve percent of all inmates are subject to such restrictions, while thefraction goes down to 6 percent for displaced inmates. On average an inmate is 38 yearsold, single (60 percent), not addicted to drugs (70 percent), with a secondary schoolingdegree (50 percent), and with an unknown employment status. He has an average of 3.3previous incarceration spells, has committed either a theft (30 and 33 percent for the fullsample and the displaced one), a drug-related crime (29 and 22 percent), or a robbery(24 and 19 percent).
Next to the mean and the standard deviation we show the coefficients on the residualsentence in regressions where the dependent variables are, one at the time, those listedin the first columns. The purpose is to formally check the quasi-random nature of ourtreatment, by comparing the expected value of each covariate conditional on differentlevels of the residual sentence. Each regression also controls for the total years spent inprison. This is key, since residual and total sentences are strongly positively correlated.Without conditioning on the total sentence, inmates with longer residual sentences areassociated with more serious crimes, tend to be older, etc. We can only hope to verify thequasi-random assignment of the residual sentence once we condition on the total sentence.
Ideally, we would not want any of the coefficients in these regressions to be statis-tically significant, with the obvious exception of that associated with the first variable(recidivism). Indeed, most are not, but there are some observable characteristics thatare different for inmates with different potential treatment levels. In particular, inmateswhose residual sentence in Bollate is higher are more likely to have secondary schooling,and show a few significant differences in the types of crimes committed. While of coursewe will control for these (and other) variables in our main regressions, this casts somedoubts on the random nature of the residual sentence assignment. For this reason, wewill restrict our sample of analysis in the attempt to isolate the variability of the residualsentence that can more confidently be judged as random.
However, we will later show that, when assessing the effect of the treatment on recidi-vism, whether or not we control for these differences (e.g. we also control for a full setof age fixed effects) makes little difference. This is reassuring, as it implies that even ifthere were some selection at work in the treatment assignment, it does not seem to bevery predictive of recidivism.
The coefficients on the right panel of Table ?? represent the balance check for thedisplaced sample, with (columns 9 and 10) and without (columns 7 and 8) controls forprison of origin times week of transfer fixed effects. Controlling for these fixed effectswe are essentially comparing inmates who were displaced at the same time and from thesame prison. Hence, we are treating each overcrowding event as a separate experimentwhere the selection process , if present, is common to all transferred inmates. Almostall the coefficients are now statistically insignificant. The few that remain significantconsistently suggest, if anything, a negative selection. Displaced inmates with longerresidual sentences are more likely to be “worse”: more likely to be drug addicts and notbeing able to describe their employment condition, less likely to be employed. This kindof selection, if present, would impart a bias towards zero to our estimates of the effect ofthe treatment on recidivism.
Overall, recidivism is the only variable that is consistently associated with residual
17
sentences. This represents a first indication that the two might indeed be causally linkedto each other.
3 Results
3.1 Main Results
We estimate the intention to treat effect by ordinary least squares with a linear probabilitymodel (later we will see that probit regressions lead to similar results). Standard errorsare always clustered by Bollate prison section and week of exit, thus allowing inmates thatmight have interacted in prison and are released around the same time to have correlatedresiduals.
For individual i, transferred in week t̃ from prison j, and released at time t, recidivismis a function of the total years served (TOT Y RS), potential years served at Bollate(POT BOL Y RS), as well as other controls (X):20
RECIDi(j, t) = β1TOT Y RSi + β2POT BOL Y RSi + γ′Xi + εi,
where
εi =
{αj,t̃ + εi(s, t), if displaced;αj + δt + εi(s, t), otherwise;
The unobserved errors εi(s, t) are allowed to be correlated across inmates releasedduring the same week who spent their final prison time in Bollate in the same sections ∈ 1, ..., 5.
When estimating the average treatment effect we run a two-stage least squares regres-sions (2SLS), using the potential time served at Bollate as an instrument for the actualtime served.
Table ?? shows both kind of regressions for the whole sample and table ?? doesthe same, distinguishing between the sample of displaced inmates and the sample ofthose actively selected. Time served at Bollate (both potential and actual) is measuredin years (days divided by 365). Looking first at the whole sample, and focussing onthe intention to treat, one extra (potential) year at Bollate (and therefore one less yearspent at a “normal” prison, given that the regression controls for the total length of thesentence) reduces recidivism by 5.2 percentage points when controlling only for the totaltime served in prison (as in the previous balance test table), and by 5.6 percentage pointswhen controlling also for the possible causes of entry and for all the additional variableslisted in the summary statistics table (see Table ??). In addition, we also control for yeartimes quarter of release, to capture labor market conditions inmates face when they exitprison, and prison of origin fixed effects, to control for differential treatments there. Thereduction in recidivism is highly statistically significant and sizeable. In relative terms,one more year at Bollate, as opposed to any of the prisons of origin, reduces recidivismby 16 percent of the average recidivism rate.
20Later we are going to test for non-linear effects.
18
The sign of the other covariates is in line with expectations. A previous historyof recidivism, proxied by the number of previous incarcerations, is highly predictive offuture recidivism. Interestingly, the total time spent in prison increases recidivism, eventhough the effect is statistically significant only when other controls are present. Thiscriminogenic effect of prison time at ordinary prisons is in line with the results reportedby Nagin et al. (2009). Our result show, however, that merely looking at the time spentin prison can be highly misleading. The way in which the prison time is spent is ofcrucial importance, and a good use of that time actually reduces recidivism. The causesof entry into Bollate that reflect a conscious choice (by the inmates and by the officialsassessing the requests) are highly significant and are associated with a sizeable reductionin recidivism, confirming that the selection process is effective in screening inmates witha lower recidivism potential. Finally, drug addiction significantly increases recidivism, awell known result.
We also control for marital status, three education dummies, three employment dum-mies, and nine crime dummies. As mentioned, the estimated effect of the treatment islittle affected by the inclusions of the controls (if anything, the point estimate is somewhatlarger).
The IV regression gives similar results. The effect of the treatment, when measured bythe actual time spent in Bollate, is about 10 percentage points when only the total sentencelength is controlled for, and 9.5 percentage points when also all the other controls areincluded. The larger effect is expected, as the residual sentence upon arrival overestimatesthe length of the actual prison stay: in the first stage regression the coefficient on thelength of the first is always close to 50 percent, with a t-statistic of about 15, and an F-statistic of about 200. A visual representation of the first stage is shown in Figure ??. Forabout 2/3 of inmates actual and potential days spent in Bollate coincide (they correspondto points on the 45 degree line in the figure). The rest of inmates is either transferred toother prisons or is given alternative sentences, and these are clearly endogenous outcomes.
The result for the sample of displaced inmates suggests that selection is unlikely toexplain these large treatment effects. Table ?? shows that for displaced inmates the esti-mated intention to treat effects (Columns 2 to 4) and average treatment effects (Columns6 to 8) are not only highly significant, but even larger than for the selected inmates(Columns 1 and 5, respectively).
The difference between the columns 2 and 3 (and between columns 6 and 7) reflectsthe inclusion of some variables controlling for the possibility that the prisons of originselect inmates to be displaced based on their dangerousness.In particular, a set of prisonof origin times week of release fixed effects makes sure that we are comparing inmatesthat have been displaced from the same institution around the same time, and thus aresubject, if anything, to the same selection criteria. This controls for the potential biasinduced by a selection of the inmates to be displaced based on their dangerousness ortrouble-making potential (be it positive or negative). In this way we are left comparinginmates whose only difference is the moment in which they started serving their originalsentence. It should be noted that when we control for the week of transfer we cannotanymore control for the quarter of exit, since these two variables would implicitly fix theresidual time spent at Bollate. This is why the quarterly unemployment rate in Northern
19
Italy and the quarterly youth unemployment rate are added as a proxy for the labormarket conditions inmates face when released.
As mentioned, one residual concern could be that the selection of displaced inmates,while being common, is based on the residual sentence itself. We appease this concern byusing a revealed preference measure of selection. For each inmate, we count the number ofdisplacement events that took place during his stay at the prison of origin; these are eventsin which he could have been displaced and yet he was not. The larger their number, thelower must have been the urge of getting rid of him perceived by the prison administrators,as revealed by their own choices (assuming that there was any such urge). In Figure ??we provide visual evidence of the absence of correlation between the number of timesinmates are not selected and recidivism. While this is reassuring,there might still be acorrelation conditional on all other covariates.
Yet, in Columns 4 and 8 we find no evidence that more dangerous or trouble-makinginmates are displaced sooner (or later): the coefficient on the revealed preference indexis not statistically different from zero, and its inclusion among the controls does notsignificantly change the estimated effect of the treatment.
Summing up, even controlling for just the total time served, as shown in Table ??,the intention to treat effect on displaced inmates is 6.8 percentage points, or 17 percentrelative to their average recidivism rate (40 percent). Adding a large number of controlsincreases the estimate by just 1 percentage point. In particular, while displaced inmatestend to be more dangerous (more prone to recidivism) we find no evidence that theywere selected on the basis of their residual sentence length. The variability of the latter,therefore, can be taken as a near-random variability that identifies the causal effect of thetreatment length.
3.2 Robustness Checks
In Table ?? we run several robustness checks for all inmates (conditional on the cause ofentry), and for the displaced ones. All regressions control for the usual set of variables,including prison of origin and year times quarter of exit fixed effects. For brevity wefocus on the intention to treat (first set of columns) and on the average treatment effects(second set of columns).
The baseline intention to treat effects were 5.6 percent for the entire sample (Table ??)and 7.7 percent for the displaced sample (Table ??). The first two rows of Table ?? showthat excluding the few inmates that have one definitive conviction but also an ongoingtrial at the time of release does not alter the results.21 The second set of regressions showsthat the intention to treat is only slightly lower when we exclude the 652 inmates whohave shown some addiction to drugs, showing that the rehabilitation effects are not drivenby such inmates. Despite the much smaller sample size, focussing on recent years alsodoes not alter the results. Shortening the horizon within which we measure recidivismfrom 3 to 2 year lowers the treatment effects, indicating that long term effects might be
21These inmates might end up in prison again when their ongoing trial is settled with a definitivesentence. Their new incarceration, therefore, would reflect an older crime.
20
larger than short term ones.The results are also robust to using a probit model instead of a linear model (next
two rows). Adding demeaned squared terms for the total time served and the time servedin Bollate makes little difference for the overall sample, while for the displaced sample itlowers the size and the significance of the reported coefficients (last two rows). Yet thecorresponding joint tests of significance can all be rejected at the 5 percent level. Finally,the results for displaced inmates could potentially be biased if some of the inmates whosecause of entry is unknown were also displaced inmates, and if such “item non response”were correlated with recidivism. In row 13 we report results obtained by adding thoseinmates to the sample of displaced inmates. Comparing these results with those of thesecond and sixth Column of Table 5 we see that there are almost no differences.
4 The Mechanism
Our results show that spending more time at Bollate, and correspondingly less time atone of the other traditional prisons, reduces recidivism by a statistically significant andeconomically meaningful amount. What is not clear is the mechanism underlying thiseffect: is it merely the passing of time, leading to a larger dose of the same treatment?Or is the passing of time just the gateway for qualitative differences in the treatment,which are the true causes of the observed effect on recidivism? While we will not be ableto conclusively answer these questions, in this Section we will make a first attempt atidentifying the underlying mechanism.
4.1 Heterogeneity of the Effects
We can learn something about the mechanisms by trying to identify the circumstancesin which the treatment is most effective. We will therefore explore whether the effectsacross different groups of inmates are heterogeneous. The Table ?? reports, for varioussubgroups of inmates having or not having a certain characteristic in the total sampleand in the sample of displaced ones, the intention to treat effect and the (instrumented)average treatment effect. The first four rows in the Table (rows 1 to 4) refers to inmateswho have or do not have committed economically motivated crimes.
The intention to treat effects are -5.7 and -8 percent, significantly different from zero,for the subset of the total sample of inmates and of the sample of displaced ones, re-spectively, who have committed economically motivated crimes (e.g., theft, burglary,robbery, drug dealing, fraud), while they are close to zero for those in prison due tonon-economically motivated and mostly violent crimes. This suggests that inmates whowere committing crimes for a living are more likely to respond favorably to the Bollaterehabilitation efforts.
The second set of results (rows 5 to 8), shows that the treatment response is consid-erably larger (in absolute terms) among inmates who are at the first prison experience,especially relative to their lower recidivism. For example, average treatment effects for“rookies” displaced inmates are equal to -17 percentage points, while their average recidi-
21
vism is just 26.4 percent. Yet, even inmates who have been in prison before are respondingpositively to the treatments. This suggests that rehabilitation efforts are most successfulwhen applied earlier in the criminal career.
The third set of results (rows 9 to 12) show that the effects tend to be larger (inabsolute terms) for inmates who have a family, in particular when we consider displacedinmates. Though we do not have information about the presence of children, these resultsare consistent with a positive role in reducing recidivism being played by the presence ofbetter visiting facilities for children and partners at Bollate, compared to other prisons.Rehabilitation efforts seem to be more fruitful, therefore, when they interact with familyrelationships.
Looking separately at inmates who have, or have not, at least secondary education, thefourth set of results (rows 13 to 16), shows that the treatment is more effective for inmateswith lower levels of education. This points at greater effectiveness of rehabilitation effortson those inmates who are less well equipped to cope with the challenges of a non-criminallife and who would be more likely to struggle once released.
The final set of regressions (rows 17 to 20) considers separately inmates who are, orare not, prohibited from accessing alternative sanctions by a previous judge order. Thereis no evidence that the effect of the treatment is significantly different across these twogroups.
According to most of the measures of prison conditions shown in Table ??, the SanVittore prison stands out as probably the harshest prison in Lumbardy, which makes thecomparison with the conditions at Bollate starkest. For this reason we might conjecturethat the effect of the “Bollate treatment” be larger for inmates that are transferred fromthe San Vittore prison. Table ?? shows that the treatment effects are indeed larger (inabsolute terms) when looking at inmates displaced from San Vittore, but such differencesare not statistically different from zero (given that only 12 percent of the displaced inmatesare transferred from a prison that is not San Vittore, the statistical power to detecttreatment differences across prisons is limited).
4.2 Direct Evidence of the Mechanism
In Section 2.1 we highlighted that spending prison time at Bollate as opposed to SanVittore or any other prison in Lumbardy can be a very different experience. This is theresult of several differences between Bollate, on the one hand, and other prisons, on theother. The first, and perhaps the most striking, is that at Bollate inmates spend two tothree times more hours outside their cells. The significance of this difference becomes evenmore salient when we consider that, as shown in Table ??, San Vittore, Opera, Monza,and Busto Arsizio – the prisons from which more than 80 percent of transferred inmatescome – are regularly overcrowded, which translates into more inmates per cell and thusless space than the 9 square meters (100 square feet) each inmate is supposed to haveunder normal circumstances. Another important difference is the “Responsibility Pact”that inmates sign when entering Bollate. They are offered the opportunity to activelyparticipate in their rehabilitation program (work, education, the interior design of theirprison, etc.)in exchange of peaceful behavior (and cheaper supervision).
22
Compared to the “panopticon-style” of prison life that is the norm in most prisons inthe world, these humanizing prison conditions are indeed a momentous change, and it isreasonable to conjecture both, that they can influence the inmates’ recidivism, and thatsuch influence is increasing in the duration of their stay at Bollate. This however cannotbe empirically tested, since those conditions equally apply to all Bollate inmates as soonas they are transferred there.
There is however one important aspect of the treatment that is unevenly assigned andis measurable: work outside of the Bollate prison. Inmates who work outside of Bollateare transferred to Section 5. And once they are in Section 5, Bollate keeps track of the dayreleases.22 For each inmate (not just the ones that were released) we computed a dummyequal to one if an inmate has ever been transferred to Section 5. For selected inmates(left columns), the likelihood to be transferred during an incarceration is 27 percent. Fordisplaced inmates is only 7.8 percent.
Regressing this dummy on the potential years served at Bollate, as well as the usualcontrols, we get that each potential year increases the likelihood to be transferred toSection 5 by 8 percentage points (30 percent) for the selected inmates, and by 2 percentagepoints (25 percent) for the displaced ones (though for the displaced inmates the coefficientis not significantly different from zero). Regressing the dummy on the actual years spentat Bollate (instrumented with the potential ones) shows that an additional year increasesthe chances of transfer by 18 percentage points for the selected inmates, and by 7.5percentage points (again without reaching statistical significance) for the displaced ones.
The fraction of days spent in day releases (typically corresponding to work outsideBollate) can be used in a similar manner to understand the mechanisms. During theirentire stay, selected inmates can spend on average 1.44 percent of their days outside ofprison; displaced inmates only 0.24 percent. Yet, an additional potential year in Bollateincreases such fraction by 1.43 percentage points (almost 100 percent) for the selectedinmates, and by 0.21 percentage points (87 percent) for the displaced ones. Both intentionto treat effects are significantly different from zero, and the same is true for the averagetreatment effects, which are more than twice as large.
It obviously stands to reason that having the possibility to work outside, while beingin prison, is an important ingredient of rehabilitation, and is therefore a driver of theestimated effects of the treatment. It is moreover consistent with the finding that thelargest changes in recidivism are for economically motivated crimes.
At the same time, the larger effects found for the displaced inmates, who are lessexposed to outside work, suggest that other mechanisms might be important as well: asmentioned before, freedom of movement, responsibility, conditions respectful of humandignity, productive use of time, all these might positively affect the post release behaviorof inmates.
22Since 2006 Bollate keeps track of all transfers across the different Sections in Bollate.
23
4.3 Negative Spillovers
One additional mechanism that might be at play is provided by peer effects.23 By selecting“better” inmates Bollate might in fact simply minimize negative peer influences. Sincemore time spent at Bollate is equivalent to spending more time with more positivelyselected inmates, this could explain our results.
We try to test whether this is a relevant mechanism underlying our results by usingthe presence of displaced peers. The idea is that displaced inmates are negatively selected(as shown in Section 2.2.2), and therefore, the higher the presence of displaced inmatesamong ones’ peers, the less effective a mechanism based on the influence of positivelyselected inmates should be. We measure the presence of displaced peers by computingthe fraction of “prisoner days” spent together with displaced inmates: at Bollate (firstmeasure); in the final prison Section (second measure);in the final cell (third measure).While the last two measures might be endogenous (Bollate might redistribute displacedinmates to reduce negative peer effects), they are also more precise.
In Table ?? we control for such “exposure” to displaced inmates, and also interact itwith the potential time served in Bollate. Overall there is no evidence that the effect onrecidivism is significantly affected by the “exposure” to potentially “worse” peers. Giventhe result that the effect of the treatment is larger for displaced inmates as comparedto the actively selected ones, this suggests that a less exacting selection process wouldgenerate a larger marginal effect on recidivism.
5 Conclusions
This paper has shown that, when trying to reduce recidivism, something works : followingthe recommendation of the Council of Europe (2006), that is offering prison conditionswhich do not infringe human dignity and which offer meaningful occupational activitiesand treatment programmes to inmates, thus preparing them for their reintegration intosociety, seems effective in curtailing recidivism. Conversely, traditional prison conditionsseem to be criminogenic. This is good news for those countries (Italy being a notableexample) whose laws, often neglected, mandate prison conditions in line with the Councilof Europe recommendation: by doing the “right thing” they would also reap the economicand social benefits of a fall in recidivism. It should provide instead cause for thought tothose countries that primarily rely on the deterrence provided by harsh prison conditions,as their policy might backfire due to increased recidivism.
More work needs to be done to understand the mechanisms underlying our results.We find evidence that one such mechanism involves offering inmates, while in prison, op-portunities to work outside, thus making it easier their entry into the labour market whenreleased. Offering such opportunities might be difficult, however, particularly when thereis substantial slack in the labour market. Therefore, policies aimed at reducing recidivismby “making prison work,” while sensible and effective, might be hard to implement andare largely outside the control of prisons’ administrators.
23See Chen and Shapiro (2007) and Bayer et al. (2009)) for evidence on peer effects in prison.
24

We find evidence that even for inmates who are not involved in outside work be-ing exposed to prison conditions that emphasize responsibility and guarantee freedom ofmovement, conditions respectful of human dignity, productive use of time, are effectivein reducing recidivism. Policies to that effect seem easier to implement, and are almostsurely cost effective.
Finally, we do not find robust evidence that peer effects are an important driver ofour results. This suggests that scaling up the experience of Bollate, even by weakeningsomewhat the selection criteria, and adopting similar standards in other prisons, mightnot risk undermining the positive results so far observed.
25
References
Anna Aizer and Jr. Joseph J. Doyle. Juvenile incarceration, human capital and futurecrime: Evidence from randomly-assigned judges. Working Paper 19102, National Bu-reau of Economic Research, June 2013.
Alessandro Barbarino and Giovanni Mastrobuoni. The Incapacitation Effect of Incarcer-ation: Evidence from Several Italian Collective Pardons. American Economic Journal:Economic Policy, 6(1):1–37, February 2014.
Patrick Bayer, Randi Hjalmarsson, and David Pozen. Building criminal capital behindbars: Peer effects in juvenile corrections. The Quarterly Journal of Economics, 124(1):105–147, 2009.
M. Keith Chen and Jesse M. Shapiro. Do harsher prison conditions reduce recidivism? Adiscontinuity-based approach. American Law and Economics Review, 2007.
Decio Coviello, Andrea Ichino, and Nicola Persico. The inefficiency of worker time use,2011.
Rafael Di Tella and Ernesto Schargrodsky. Criminal recidivism after prison and electronicmonitoring. Journal of Political Economy, 121(1):28–73, 2013.
Francesco Drago, Roberto Galbiati, and Pietro Vertova. The deterrent effects of prison:evidence from a natural experiment. Journal of Political Economy, 117(2):257–280,2009.
Francesco Drago, Roberto Galbiati, and Pietro Vertova. Prison conditions and recidivism.American Law and Economics Review, 13(1):103–130, 2011.
Gerald G Gaes and Scott D Camp. Unintended consequences: Experimental evidencefor the criminogenic effect of prison security level placement on post-release recidivism.Journal of Experimental Criminology, 5(2):139–162, 2009.
Donald P Green and Daniel Winik. Using random judge assignments to estimate theeffects of incarceration and probation on recidivism among drug offenders. Criminology,48(2):357–387, 2010.
Lawrence Katz, Steven D. Levitt, and Ellen Shustorovich. Prison Conditions, CapitalPunishment, and Deterrence. American Law and Economics Review, 5(2):318–343,August 2003.
Jeffrey R. Kling. Incarceration Length, Employment, and Earnings. American EconomicReview, 96(3):863–876, June 2006.
Ilyana Kuziemko. How should inmates be released from prison? an assessment of paroleversus fixed-sentence regimes. The Quarterly Journal of Economics, 128(1):371–424,2013.
26
Daniel S Nagin, Francis T Cullen, and Cheryl Lero Jonson. Imprisonment and reoffending.Crime and justice, 38(1):115–200, 2009.
Derek Neal and Armin Rick. The prison boom and the lack of black progress after smithand welch. Working Paper 20283, National Bureau of Economic Research, July 2014.
Aurelie Ouss. What works in reducing re-offending? In Philip J Cook, Stephen Machin,Olivier Marie, and Giovanni Mastrobuoni, editors, Lessons from the Economics ofCrime: What Reduces Offending? MIT Press, 2013.
Steven Raphael. Improving employment prospects for former prison inmates: Challengesand policy. In Controlling Crime: Strategies and Tradeoffs, pages 521–565. Universityof Chicago Press, 2010.
Steven Raphael and Michael A. Stoll. Do prisons make us safer?: The benefits and costsof the prison boom. chapter Why Are So Many Americans in Prison? Russell SageFoundation, 2009.
Cindy Redcross, Dan Bloom, Erin Jacobs, Michelle Manno, Sara Muller-Ravett, KristinSeefeldt, Jennifer Yahner, Alford A Young Jr, and Janine Zweig. Work after prison:One-year findings from the transitional jobs reentry demonstration. MDRC, 2010.
Christy A Visher, Laura Winterfield, and Mark B Coggeshall. Ex-offender employmentprograms and recidivism: A meta-analysis. Journal of Experimental Criminology, 1(3):295–316, 2005.
27

Figure 1: Histogram of the Fraction of Time Spent in the Bollate Prison
Figure 2: First Stage Relationship
Notes: Actual time in Bollate against potentialtime expressed in semesters to highlight thedistribution (truncated at 100 weeks). For about2/3 of inmates the two durations coincide.
Figure 3: Revealed Choice Measure for Dis-placed Inmates
Notes: Vertical lines indicate 95 percent confidenceintervals.
28
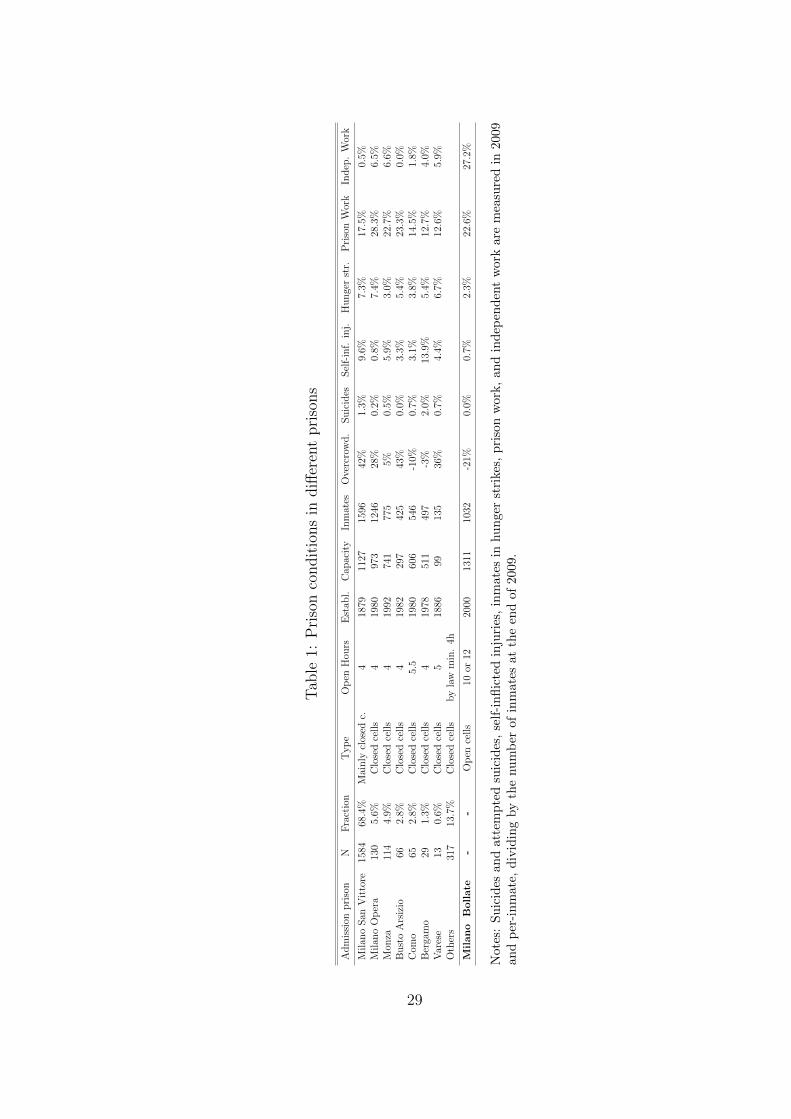
Tab
le1:
Pri
son
condit
ions
indiff
eren
tpri
sons
Adm
issi
onpri
son
NF
ract
ion
Typ
eO
pen
Hou
rsE
stab
l.C
apac
ity
Inm
ates
Ove
rcro
wd.
Suic
ides
Sel
f-in
f.in
j.H
unge
rst
r.P
riso
nW
ork
Indep
.W
ork
Milan
oSan
Vit
tore
1584
68.4
%M
ainly
clos
edc.
418
7911
2715
9642
%1.
3%9.
6%7.
3%17
.5%
0.5%
Milan
oO
per
a13
05.
6%C
lose
dce
lls
419
8097
312
4628
%0.
2%0.
8%7.
4%28
.3%
6.5%
Mon
za11
44.
9%C
lose
dce
lls
419
9274
177
55%
0.5%
5.9%
3.0%
22.7
%6.
6%B
ust
oA
rsiz
io66
2.8%
Clo
sed
cells
419
8229
742
543
%0.
0%3.
3%5.
4%23
.3%
0.0%
Com
o65
2.8%
Clo
sed
cells
5.5
1980
606
546
-10%
0.7%
3.1%
3.8%
14.5
%1.
8%B
erga
mo
291.
3%C
lose
dce
lls
419
7851
149
7-3
%2.
0%13
.9%
5.4%
12.7
%4.
0%V
ares
e13
0.6%
Clo
sed
cells
518
8699
135
36%
0.7%
4.4%
6.7%
12.6
%5.
9%O
ther
s31
713
.7%
Clo
sed
cells
by
law
min
.4h
Mil
an
oB
oll
ate
--
Op
ence
lls
10or
1220
0013
1110
32-2
1%0.
0%0.
7%2.
3%22
.6%
27.2
%
Not
es:
Su
icid
esan
dat
tem
pte
dsu
icid
es,
self
-in
flic
ted
inju
ries
,in
mate
sin
hu
nger
stri
kes,
pri
son
work
,an
din
dep
end
ent
work
are
mea
sure
din
2009
and
per
-in
mat
e,d
ivid
ing
by
the
num
ber
ofin
mat
esat
the
end
of
2009.
29
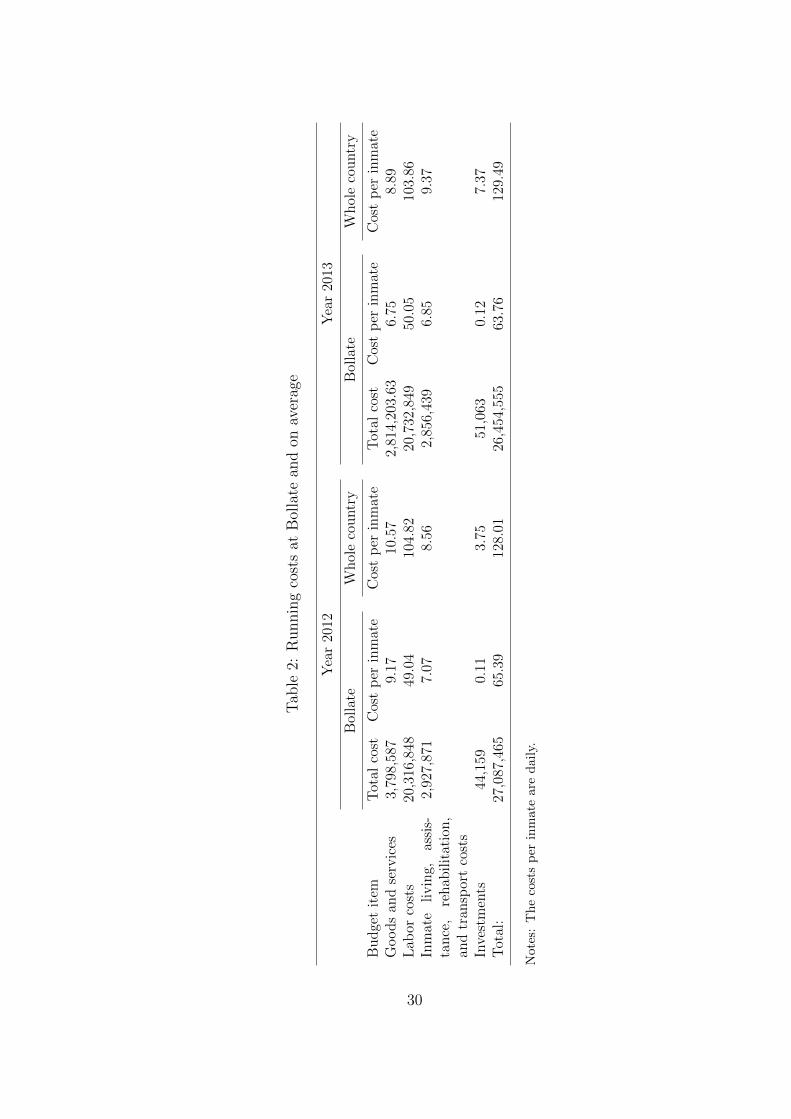
Tab
le2:
Runnin
gco
sts
atB
olla
tean
don
aver
age
Yea
r20
12Y
ear
2013
Bol
late
Whol
eco
untr
yB
olla
teW
hol
eco
untr
y
Budge
tit
emT
otal
cost
Cos
tp
erin
mat
eC
ost
per
inm
ate
Tot
alco
stC
ost
per
inm
ate
Cos
tp
erin
mat
eG
oods
and
serv
ices
3,79
8,58
79.
1710
.57
2,81
4,20
3.63
6.75
8.89
Lab
orco
sts
20,3
16,8
4849
.04
104.
8220
,732
,849
50.0
510
3.86
Inm
ate
livin
g,as
sis-
tance
,re
hab
ilit
atio
n,
and
tran
spor
tco
sts
2,92
7,87
17.
078.
562,
856,
439
6.85
9.37
Inve
stm
ents
44,1
590.
113.
7551
,063
0.12
7.37
Tot
al:
27,0
87,4
6565
.39
128.
0126
,454
,555
63.7
612
9.49
Not
es:
The
cost
sp
erin
mat
ear
ed
aily
.
30
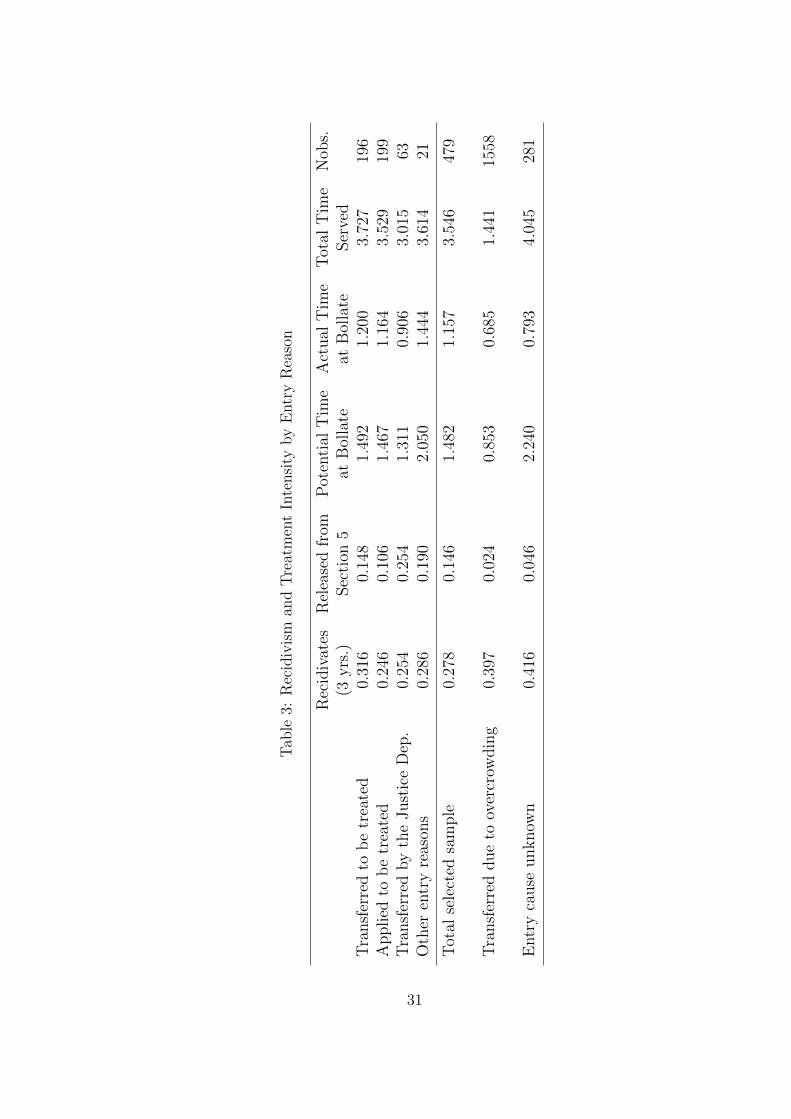
Tab
le3:
Rec
idiv
ism
and
Tre
atm
ent
Inte
nsi
tyby
Entr
yR
easo
n
Rec
idiv
ates
Rel
ease
dfr
omP
oten
tial
Tim
eA
ctual
Tim
eT
otal
Tim
eN
obs.
(3yrs
.)Sec
tion
5at
Bol
late
atB
olla
teSer
ved
Tra
nsf
erre
dto
be
trea
ted
0.31
60.
148
1.49
21.
200
3.72
719
6A
pplied
tob
etr
eate
d0.
246
0.10
61.
467
1.16
43.
529
199
Tra
nsf
erre
dby
the
Just
ice
Dep
.0.
254
0.25
41.
311
0.90
63.
015
63O
ther
entr
yre
ason
s0.
286
0.19
02.
050
1.44
43.
614
21
Tot
alse
lect
edsa
mple
0.27
80.
146
1.48
21.
157
3.54
647
9
Tra
nsf
erre
ddue
toov
ercr
owdin
g0.
397
0.02
40.
853
0.68
51.
441
1558
Entr
yca
use
unknow
n0.
416
0.04
62.
240
0.79
34.
045
281
31
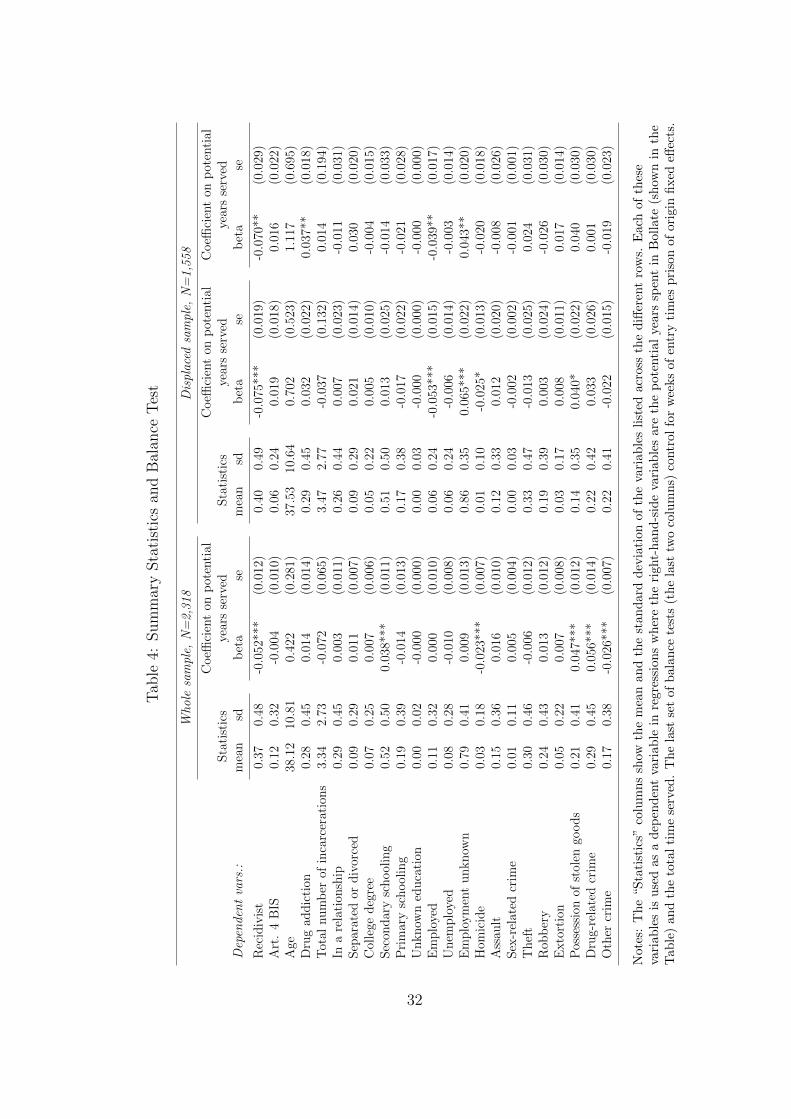
Tab
le4:
Sum
mar
ySta
tist
ics
and
Bal
ance
Tes
t
Who
lesa
mpl
e,N
=2,
318
Dis
plac
edsa
mpl
e,N
=1,
558
Coeffi
cien
ton
pot
enti
alC
oeffi
cien
ton
pot
enti
alC
oeffi
cien
ton
pot
enti
alS
tati
stic
sye
ars
serv
edSta
tist
ics
year
sse
rved
year
sse
rved
Dep
ende
nt
vars
.:m
ean
sdb
eta
sem
ean
sdb
eta
seb
eta
se
Rec
idiv
ist
0.37
0.48
-0.0
52**
*(0
.012
)0.
400.
49-0
.075
***
(0.0
19)
-0.0
70**
(0.0
29)
Art
.4
BIS
0.12
0.32
-0.0
04(0
.010
)0.
060.
240.
019
(0.0
18)
0.01
6(0
.022
)A
ge38
.12
10.8
10.
422
(0.2
81)
37.5
310
.64
0.70
2(0
.523
)1.
117
(0.6
95)
Dru
gad
dic
tion
0.28
0.45
0.01
4(0
.014
)0.
290.
450.
032
(0.0
22)
0.03
7**
(0.0
18)
Tot
alnu
mb
erof
inca
rcer
atio
ns
3.34
2.73
-0.0
72(0
.065
)3.
472.
77-0
.037
(0.1
32)
0.01
4(0
.194
)In
are
lati
onsh
ip0.
290.
450.
003
(0.0
11)
0.26
0.44
0.00
7(0
.023
)-0
.011
(0.0
31)
Sep
arat
edor
div
orce
d0.
090.
290.
011
(0.0
07)
0.09
0.29
0.02
1(0
.014
)0.
030
(0.0
20)
Col
lege
deg
ree
0.07
0.25
0.00
7(0
.006
)0.
050.
220.
005
(0.0
10)
-0.0
04(0
.015
)S
econ
dar
ysc
hool
ing
0.52
0.50
0.03
8***
(0.0
11)
0.51
0.50
0.01
3(0
.025
)-0
.014
(0.0
33)
Pri
mar
ysc
hool
ing
0.19
0.39
-0.0
14(0
.013
)0.
170.
38-0
.017
(0.0
22)
-0.0
21(0
.028
)U
nkn
own
edu
cati
on0.
000.
02-0
.000
(0.0
00)
0.00
0.03
-0.0
00(0
.000
)-0
.000
(0.0
00)
Em
plo
yed
0.11
0.32
0.00
0(0
.010
)0.
060.
24-0
.053
***
(0.0
15)
-0.0
39**
(0.0
17)
Un
emp
loye
d0.
080.
28-0
.010
(0.0
08)
0.06
0.24
-0.0
06(0
.014
)-0
.003
(0.0
14)
Em
plo
ym
ent
un
kn
own
0.79
0.41
0.00
9(0
.013
)0.
860.
350.
065*
**(0
.022
)0.
043*
*(0
.020
)H
omic
ide
0.03
0.18
-0.0
23**
*(0
.007
)0.
010.
10-0
.025
*(0
.013
)-0
.020
(0.0
18)
Ass
ault
0.15
0.36
0.01
6(0
.010
)0.
120.
330.
012
(0.0
20)
-0.0
08(0
.026
)S
ex-r
elat
edcr
ime
0.01
0.11
0.00
5(0
.004
)0.
000.
03-0
.002
(0.0
02)
-0.0
01(0
.001
)T
hef
t0.
300.
46-0
.006
(0.0
12)
0.33
0.47
-0.0
13(0
.025
)0.
024
(0.0
31)
Rob
ber
y0.
240.
430.
013
(0.0
12)
0.19
0.39
0.00
3(0
.024
)-0
.026
(0.0
30)
Exto
rtio
n0.
050.
220.
007
(0.0
08)
0.03
0.17
0.00
8(0
.011
)0.
017
(0.0
14)
Pos
sess
ion
ofst
olen
good
s0.
210.
410.
047*
**(0
.012
)0.
140.
350.
040*
(0.0
22)
0.04
0(0
.030
)D
rug-
rela
ted
crim
e0.
290.
450.
056*
**(0
.014
)0.
220.
420.
033
(0.0
26)
0.00
1(0
.030
)O
ther
crim
e0.
170.
38-0
.026
***
(0.0
07)
0.22
0.41
-0.0
22(0
.015
)-0
.019
(0.0
23)
Not
es:
The
“Sta
tist
ics”
colu
mn
ssh
owth
em
ean
an
dth
est
an
dard
dev
iati
on
of
the
vari
ab
les
list
edacr
oss
the
diff
eren
tro
ws.
Each
of
thes
eva
riab
les
isu
sed
asa
dep
end
ent
vari
able
inre
gres
sions
wh
ere
the
right-
han
d-s
ide
vari
ab
les
are
the
pote
nti
al
years
spen
tin
Boll
ate
(sh
own
inth
eT
able
)an
dth
eto
tal
tim
ese
rved
.T
he
last
set
ofb
ala
nce
test
s(t
he
last
two
colu
mn
s)co
ntr
ol
for
wee
ks
of
entr
yti
mes
pri
son
of
ori
gin
fixed
effec
ts.
32
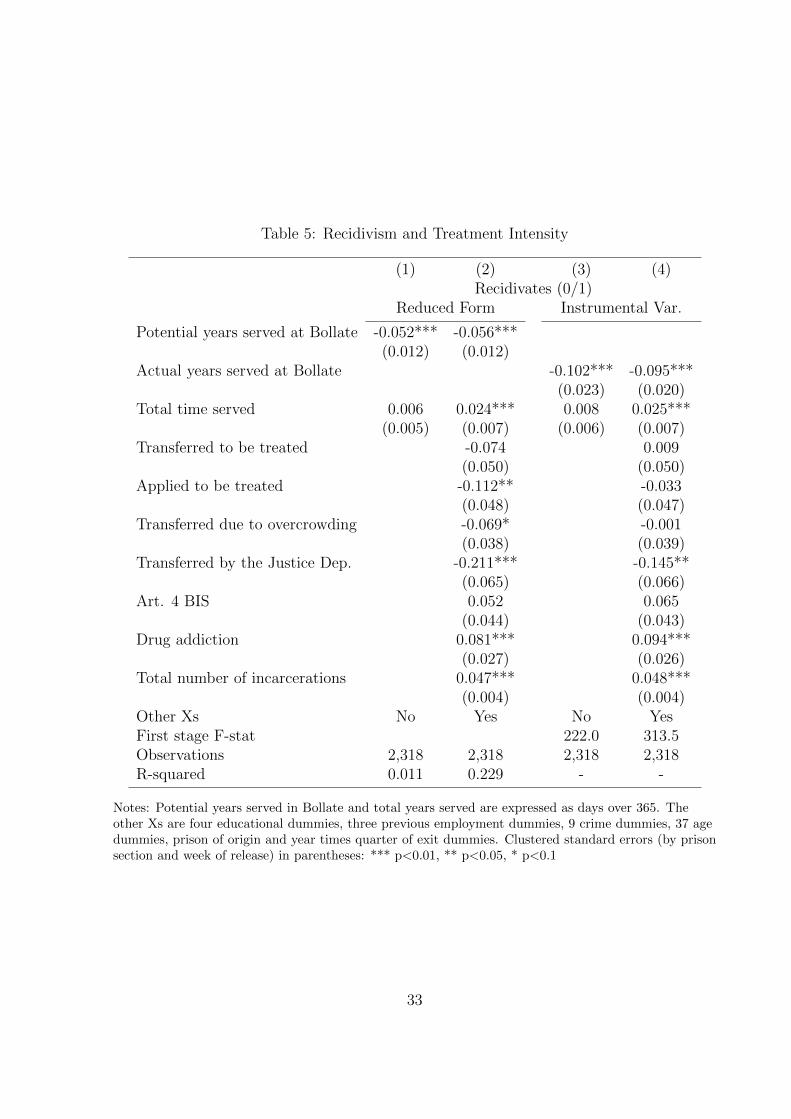
Table 5: Recidivism and Treatment Intensity
(1) (2) (3) (4)Recidivates (0/1)
Reduced Form Instrumental Var.
Potential years served at Bollate -0.052*** -0.056***(0.012) (0.012)
Actual years served at Bollate -0.102*** -0.095***(0.023) (0.020)
Total time served 0.006 0.024*** 0.008 0.025***(0.005) (0.007) (0.006) (0.007)
Transferred to be treated -0.074 0.009(0.050) (0.050)
Applied to be treated -0.112** -0.033(0.048) (0.047)
Transferred due to overcrowding -0.069* -0.001(0.038) (0.039)
Transferred by the Justice Dep. -0.211*** -0.145**(0.065) (0.066)
Art. 4 BIS 0.052 0.065(0.044) (0.043)
Drug addiction 0.081*** 0.094***(0.027) (0.026)
Total number of incarcerations 0.047*** 0.048***(0.004) (0.004)
Other Xs No Yes No YesFirst stage F-stat 222.0 313.5Observations 2,318 2,318 2,318 2,318R-squared 0.011 0.229 - -
Notes: Potential years served in Bollate and total years served are expressed as days over 365. Theother Xs are four educational dummies, three previous employment dummies, 9 crime dummies, 37 agedummies, prison of origin and year times quarter of exit dummies. Clustered standard errors (by prisonsection and week of release) in parentheses: *** p<0.01, ** p<0.05, * p<0.1
33
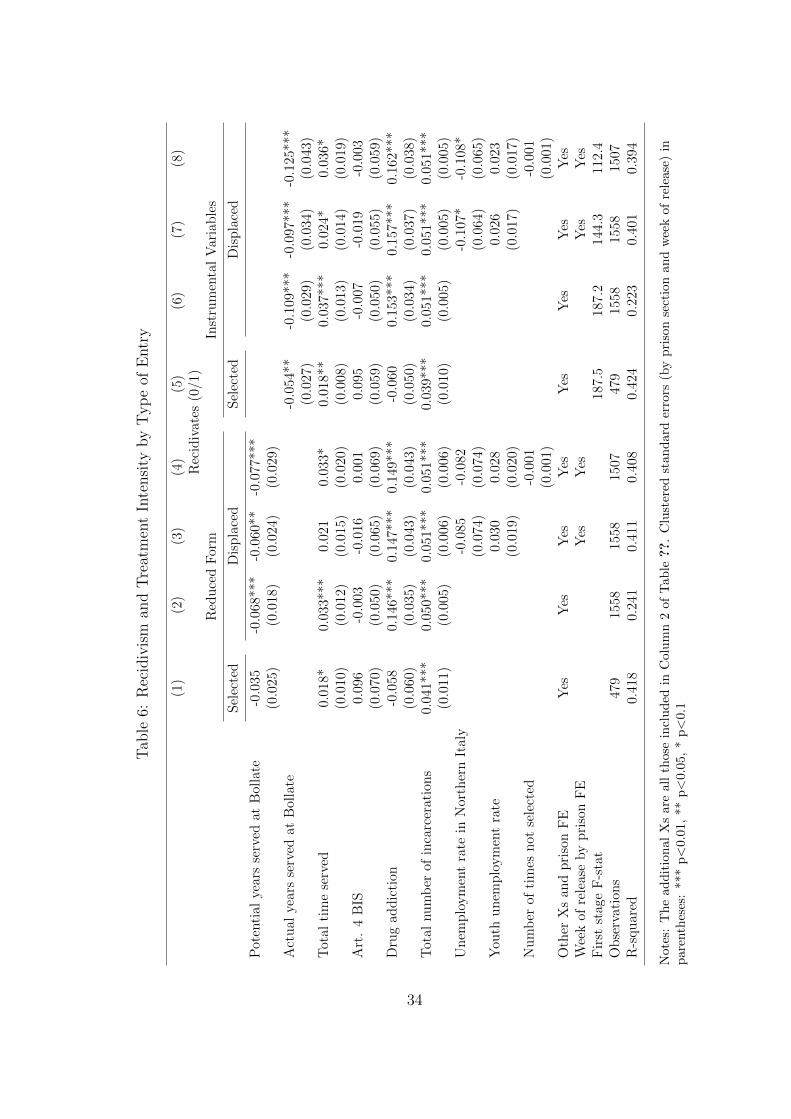
Tab
le6:
Rec
idiv
ism
and
Tre
atm
ent
Inte
nsi
tyby
Typ
eof
Entr
y
(1)
(2)
(3)
(4)
(5)
(6)
(7)
(8)
Rec
idiv
ates
(0/1
)R
edu
ced
For
mIn
stru
men
tal
Var
iab
les
Sel
ecte
dD
isp
lace
dS
elec
ted
Dis
pla
ced
Pot
enti
alye
ars
serv
edat
Bol
late
-0.0
35-0
.068
***
-0.0
60**
-0.0
77**
*(0
.025
)(0
.018
)(0
.024
)(0
.029
)A
ctu
alye
ars
serv
edat
Bol
late
-0.0
54**
-0.1
09**
*-0
.097
***
-0.1
25**
*(0
.027
)(0
.029
)(0
.034
)(0
.043
)T
otal
tim
ese
rved
0.01
8*0.
033*
**0.
021
0.03
3*0.
018*
*0.
037*
**0.
024*
0.03
6*(0
.010
)(0
.012
)(0
.015
)(0
.020
)(0
.008
)(0
.013
)(0
.014
)(0
.019
)A
rt.
4B
IS0.
096
-0.0
03-0
.016
0.00
10.
095
-0.0
07-0
.019
-0.0
03(0
.070
)(0
.050
)(0
.065
)(0
.069
)(0
.059
)(0
.050
)(0
.055
)(0
.059
)D
rug
add
icti
on-0
.058
0.14
6***
0.14
7***
0.14
9***
-0.0
600.
153*
**0.
157*
**0.
162*
**(0
.060
)(0
.035
)(0
.043
)(0
.043
)(0
.050
)(0
.034
)(0
.037
)(0
.038
)T
otal
nu
mb
erof
inca
rcer
atio
ns
0.04
1***
0.05
0***
0.05
1***
0.05
1***
0.03
9***
0.05
1***
0.05
1***
0.05
1***
(0.0
11)
(0.0
05)
(0.0
06)
(0.0
06)
(0.0
10)
(0.0
05)
(0.0
05)
(0.0
05)
Un
emp
loym
ent
rate
inN
orth
ern
Ital
y-0
.085
-0.0
82-0
.107
*-0
.108
*(0
.074
)(0
.074
)(0
.064
)(0
.065
)Y
outh
un
emp
loym
ent
rate
0.03
00.
028
0.02
60.
023
(0.0
19)
(0.0
20)
(0.0
17)
(0.0
17)
Nu
mb
erof
tim
esn
otse
lect
ed-0
.001
-0.0
01(0
.001
)(0
.001
)O
ther
Xs
and
pri
son
FE
Yes
Yes
Yes
Yes
Yes
Yes
Yes
Yes
Wee
kof
rele
ase
by
pri
son
FE
Yes
Yes
Yes
Yes
Fir
stst
age
F-s
tat
187.
518
7.2
144.
311
2.4
Ob
serv
atio
ns
479
1558
1558
1507
479
1558
1558
1507
R-s
qu
ared
0.41
80.
241
0.41
10.
408
0.42
40.
223
0.40
10.
394
Not
es:
The
add
itio
nal
Xs
are
all
thos
ein
clu
ded
inC
olu
mn
2of
Tab
le??.
Clu
ster
edst
an
dar
der
rors
(by
pri
son
sect
ion
an
dw
eek
of
rele
ase
)in
par
enth
eses
:**
*p<
0.01
,**
p<
0.05
,*
p<
0.1
34
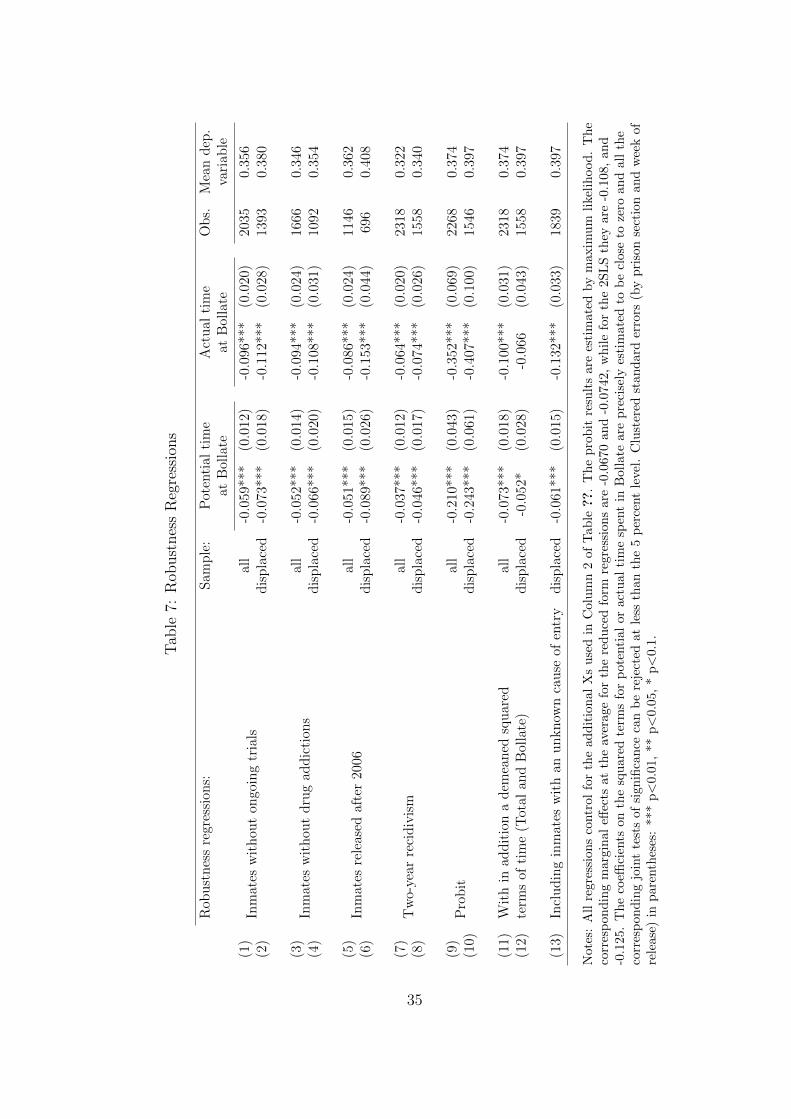
Tab
le7:
Rob
ust
nes
sR
egre
ssio
ns
Rob
ust
nes
sre
gres
sion
s:S
amp
le:
Pot
enti
alti
me
Act
ual
tim
eO
bs.
Mea
nd
ep.
atB
olla
teat
Bol
late
vari
able
(1)
Inm
ates
wit
hou
ton
goin
gtr
ials
all
-0.0
59**
*(0
.012
)-0
.096
***
(0.0
20)
2035
0.35
6(2
)d
isp
lace
d-0
.073
***
(0.0
18)
-0.1
12**
*(0
.028
)13
930.
380
(3)
Inm
ates
wit
hou
td
rug
add
icti
ons
all
-0.0
52**
*(0
.014
)-0
.094
***
(0.0
24)
1666
0.34
6(4
)d
isp
lace
d-0
.066
***
(0.0
20)
-0.1
08**
*(0
.031
)10
920.
354
(5)
Inm
ates
rele
ased
afte
r20
06al
l-0
.051
***
(0.0
15)
-0.0
86**
*(0
.024
)11
460.
362
(6)
dis
pla
ced
-0.0
89**
*(0
.026
)-0
.153
***
(0.0
44)
696
0.40
8
(7)
Tw
o-ye
arre
cid
ivis
mal
l-0
.037
***
(0.0
12)
-0.0
64**
*(0
.020
)23
180.
322
(8)
dis
pla
ced
-0.0
46**
*(0
.017
)-0
.074
***
(0.0
26)
1558
0.34
0
(9)
Pro
bit
all
-0.2
10**
*(0
.043
)-0
.352
***
(0.0
69)
2268
0.37
4(1
0)d
isp
lace
d-0
.243
***
(0.0
61)
-0.4
07**
*(0
.100
)15
460.
397
(11)
Wit
hin
addit
ion
ad
emea
ned
squ
ared
all
-0.0
73**
*(0
.018
)-0
.100
***
(0.0
31)
2318
0.37
4(1
2)te
rms
ofti
me
(Tot
alan
dB
olla
te)
dis
pla
ced
-0.0
52*
(0.0
28)
-0.0
66(0
.043
)15
580.
397
(13)
Incl
ud
ing
inm
ates
wit
han
un
kn
own
cau
seof
entr
yd
isp
lace
d-0
.061
***
(0.0
15)
-0.1
32**
*(0
.033
)18
390.
397
Not
es:
All
regr
essi
ons
contr
olfo
rth
ead
dit
ion
alX
su
sed
inC
olu
mn
2of
Tab
le??.
Th
ep
rob
itre
sult
sare
esti
mate
dby
maxim
um
like
lih
ood
.T
he
corr
esp
ond
ing
mar
gin
aleff
ects
atth
eav
erag
efo
rth
ere
du
ced
form
regre
ssio
ns
are
-0.0
670
and
-0.0
742,
wh
ile
for
the
2S
LS
they
are
-0.1
08,
an
d-0
.125
.T
he
coeffi
cien
tson
the
squ
ared
term
sfo
rp
ote
nti
al
or
act
ual
tim
esp
ent
inB
oll
ate
are
pre
cise
lyes
tim
ate
dto
be
close
toze
roan
dall
the
corr
esp
ond
ing
join
tte
sts
ofsi
gnifi
can
ceca
nb
ere
ject
edat
less
than
the
5p
erce
nt
level
.C
lust
ered
stand
ard
erro
rs(b
yp
riso
nse
ctio
nan
dw
eek
of
rele
ase)
inp
aren
thes
es:
***
p<
0.01
,**
p<
0.05
,*
p<
0.1
.
35
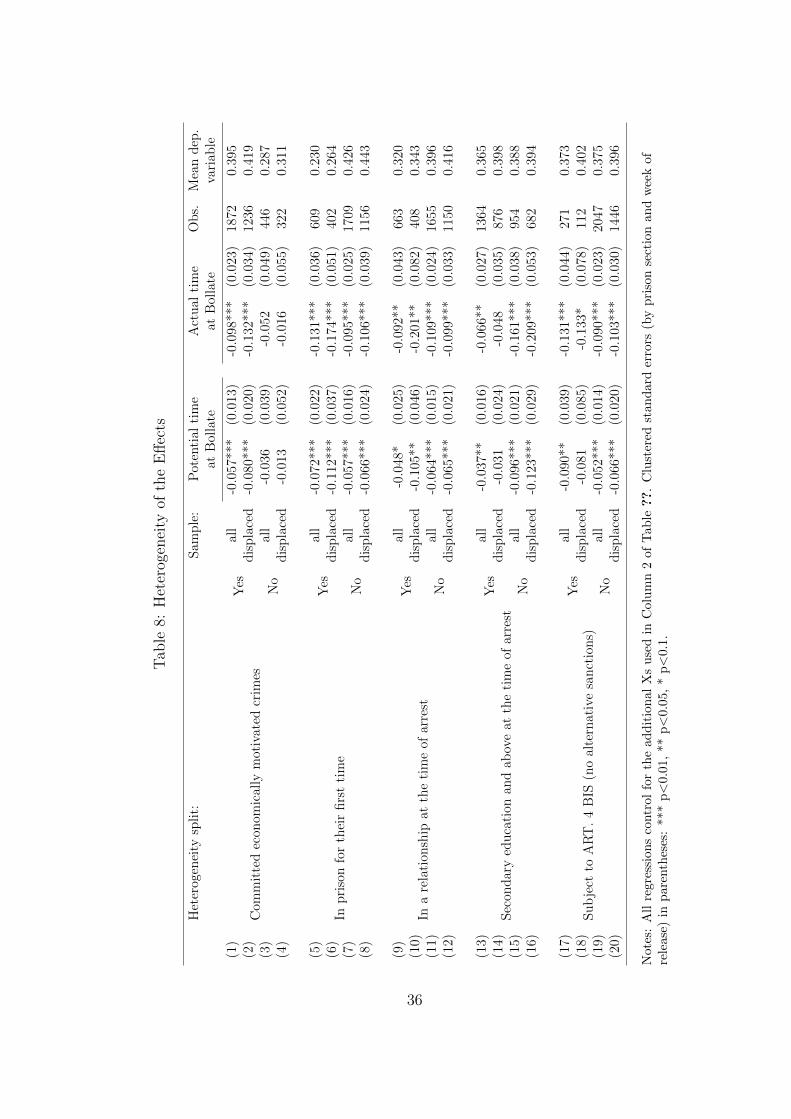
Tab
le8:
Het
erog
enei
tyof
the
Eff
ects
Het
erog
enei
tysp
lit:
Sam
ple
:P
oten
tial
tim
eA
ctu
alti
me
Ob
s.M
ean
dep
.at
Bol
late
atB
olla
teva
riab
le
(1)
Com
mit
ted
econ
omic
ally
mot
ivat
edcr
imes
Yes
all
-0.0
57**
*(0
.013
)-0
.098
***
(0.0
23)
1872
0.39
5(2
)d
isp
lace
d-0
.080
***
(0.0
20)
-0.1
32**
*(0
.034
)12
360.
419
(3)
No
all
-0.0
36(0
.039
)-0
.052
(0.0
49)
446
0.28
7(4
)d
isp
lace
d-0
.013
(0.0
52)
-0.0
16(0
.055
)32
20.
311
(5)
Inp
riso
nfo
rth
eir
firs
tti
me
Yes
all
-0.0
72**
*(0
.022
)-0
.131
***
(0.0
36)
609
0.23
0(6
)d
isp
lace
d-0
.112
***
(0.0
37)
-0.1
74**
*(0
.051
)40
20.
264
(7)
No
all
-0.0
57**
*(0
.016
)-0
.095
***
(0.0
25)
1709
0.42
6(8
)d
isp
lace
d-0
.066
***
(0.0
24)
-0.1
06**
*(0
.039
)11
560.
443
(9)
Ina
rela
tion
ship
atth
eti
me
ofar
rest
Yes
all
-0.0
48*
(0.0
25)
-0.0
92**
(0.0
43)
663
0.32
0(1
0)d
isp
lace
d-0
.105
**(0
.046
)-0
.201
**(0
.082
)40
80.
343
(11)
No
all
-0.0
64**
*(0
.015
)-0
.109
***
(0.0
24)
1655
0.39
6(1
2)d
isp
lace
d-0
.065
***
(0.0
21)
-0.0
99**
*(0
.033
)11
500.
416
(13)
Sec
ond
ary
edu
cati
onan
dab
ove
atth
eti
me
ofar
rest
Yes
all
-0.0
37**
(0.0
16)
-0.0
66**
(0.0
27)
1364
0.36
5(1
4)d
isp
lace
d-0
.031
(0.0
24)
-0.0
48(0
.035
)87
60.
398
(15)
No
all
-0.0
96**
*(0
.021
)-0
.161
***
(0.0
38)
954
0.38
8(1
6)d
isp
lace
d-0
.123
***
(0.0
29)
-0.2
09**
*(0
.053
)68
20.
394
(17)
Su
bje
ctto
AR
T.
4B
IS(n
oal
tern
ativ
esa
nct
ion
s)Y
esal
l-0
.090
**(0
.039
)-0
.131
***
(0.0
44)
271
0.37
3(1
8)d
isp
lace
d-0
.081
(0.0
85)
-0.1
33*
(0.0
78)
112
0.40
2(1
9)N
oal
l-0
.052
***
(0.0
14)
-0.0
90**
*(0
.023
)20
470.
375
(20)
dis
pla
ced
-0.0
66**
*(0
.020
)-0
.103
***
(0.0
30)
1446
0.39
6
Not
es:
All
regr
essi
ons
contr
olfo
rth
ead
dit
ion
alX
su
sed
inC
olu
mn
2of
Tab
le??.
Clu
ster
edst
an
dard
erro
rs(b
yp
riso
nse
ctio
nand
wee
kof
rele
ase)
inp
aren
thes
es:
***
p<
0.01
,**
p<
0.05
,*
p<
0.1
.
36
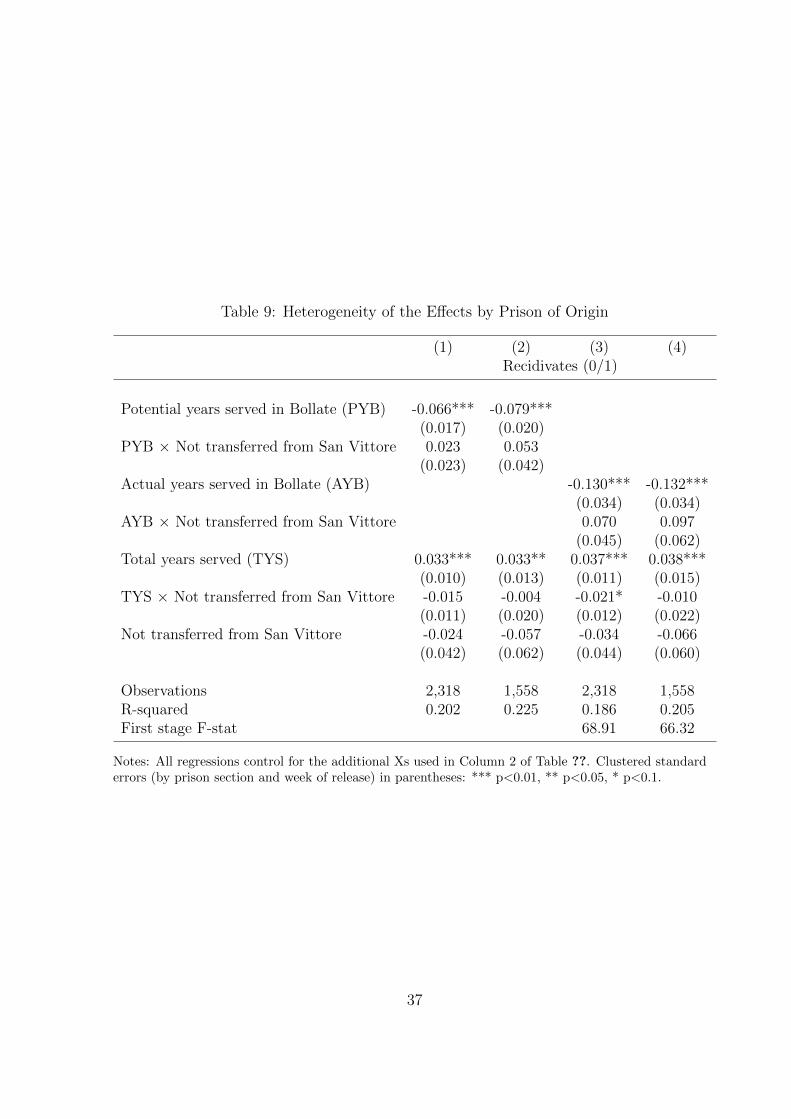
Table 9: Heterogeneity of the Effects by Prison of Origin
(1) (2) (3) (4)Recidivates (0/1)
Potential years served in Bollate (PYB) -0.066*** -0.079***(0.017) (0.020)
PYB × Not transferred from San Vittore 0.023 0.053(0.023) (0.042)
Actual years served in Bollate (AYB) -0.130*** -0.132***(0.034) (0.034)
AYB × Not transferred from San Vittore 0.070 0.097(0.045) (0.062)
Total years served (TYS) 0.033*** 0.033** 0.037*** 0.038***(0.010) (0.013) (0.011) (0.015)
TYS × Not transferred from San Vittore -0.015 -0.004 -0.021* -0.010(0.011) (0.020) (0.012) (0.022)
Not transferred from San Vittore -0.024 -0.057 -0.034 -0.066(0.042) (0.062) (0.044) (0.060)
Observations 2,318 1,558 2,318 1,558R-squared 0.202 0.225 0.186 0.205First stage F-stat 68.91 66.32
Notes: All regressions control for the additional Xs used in Column 2 of Table ??. Clustered standarderrors (by prison section and week of release) in parentheses: *** p<0.01, ** p<0.05, * p<0.1.
37
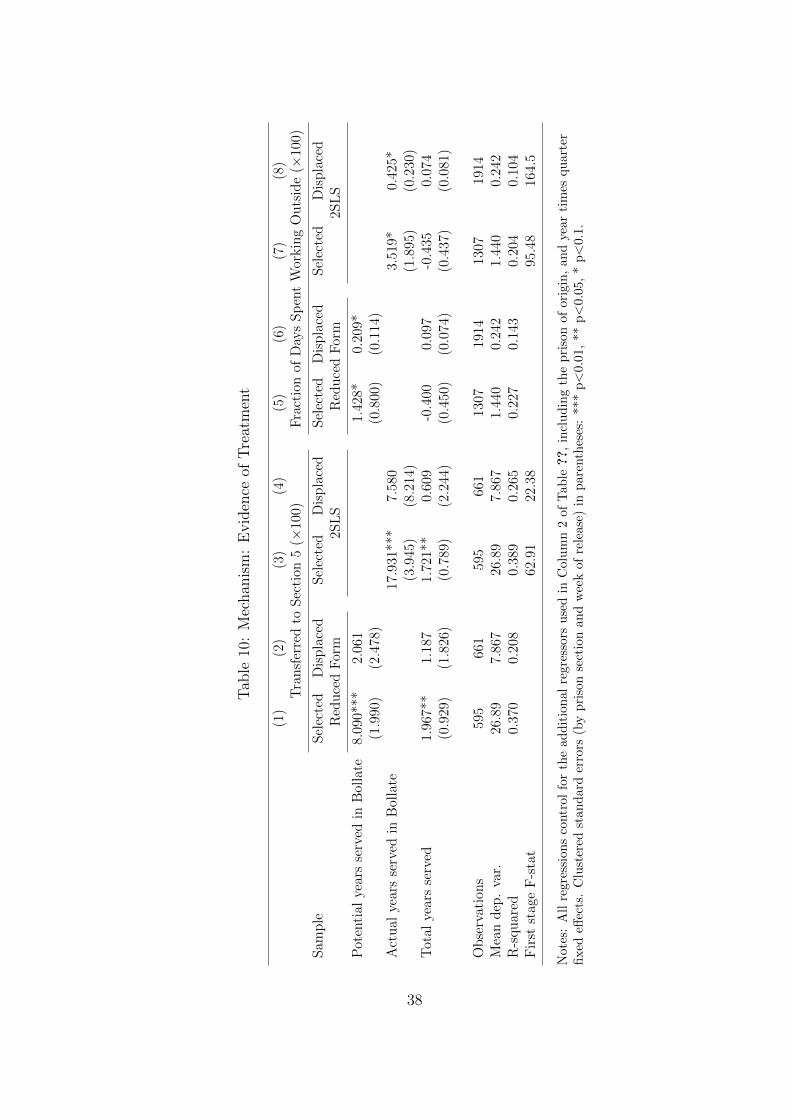
Tab
le10
:M
echan
ism
:E
vid
ence
ofT
reat
men
t
(1)
(2)
(3)
(4)
(5)
(6)
(7)
(8)
Tra
nsf
erre
dto
Sec
tion
5(×
100)
Fra
ctio
nof
Day
sSp
ent
Wor
kin
gO
uts
ide
(×10
0)
Sam
ple
Sel
ecte
dD
ispla
ced
Sel
ecte
dD
ispla
ced
Sel
ecte
dD
ispla
ced
Sel
ecte
dD
ispla
ced
Red
uce
dF
orm
2SL
SR
educe
dF
orm
2SL
S
Pot
enti
alye
ars
serv
edin
Bol
late
8.09
0***
2.06
11.
428*
0.20
9*(1
.990
)(2
.478
)(0
.800
)(0
.114
)A
ctual
year
sse
rved
inB
olla
te17
.931
***
7.58
03.
519*
0.42
5*(3
.945
)(8
.214
)(1
.895
)(0
.230
)T
otal
year
sse
rved
1.96
7**
1.18
71.
721*
*0.
609
-0.4
000.
097
-0.4
350.
074
(0.9
29)
(1.8
26)
(0.7
89)
(2.2
44)
(0.4
50)
(0.0
74)
(0.4
37)
(0.0
81)
Obse
rvat
ions
595
661
595
661
1307
1914
1307
1914
Mea
ndep
.va
r.26
.89
7.86
726
.89
7.86
71.
440
0.24
21.
440
0.24
2R
-squar
ed0.
370
0.20
80.
389
0.26
50.
227
0.14
30.
204
0.10
4F
irst
stag
eF
-sta
t62
.91
22.3
895
.48
164.
5
Not
es:
All
regr
essi
ons
contr
olfo
rth
ead
dit
ion
alre
gre
ssors
use
din
Colu
mn
2of
Tab
le??,
incl
ud
ing
the
pri
son
of
ori
gin
,an
dye
ar
tim
esqu
art
erfi
xed
effec
ts.
Clu
ster
edst
and
ard
erro
rs(b
yp
riso
nse
ctio
nan
dw
eek
of
rele
ase
)in
pare
nth
eses
:***
p<
0.0
1,
**
p<
0.0
5,
*p<
0.1
.
38
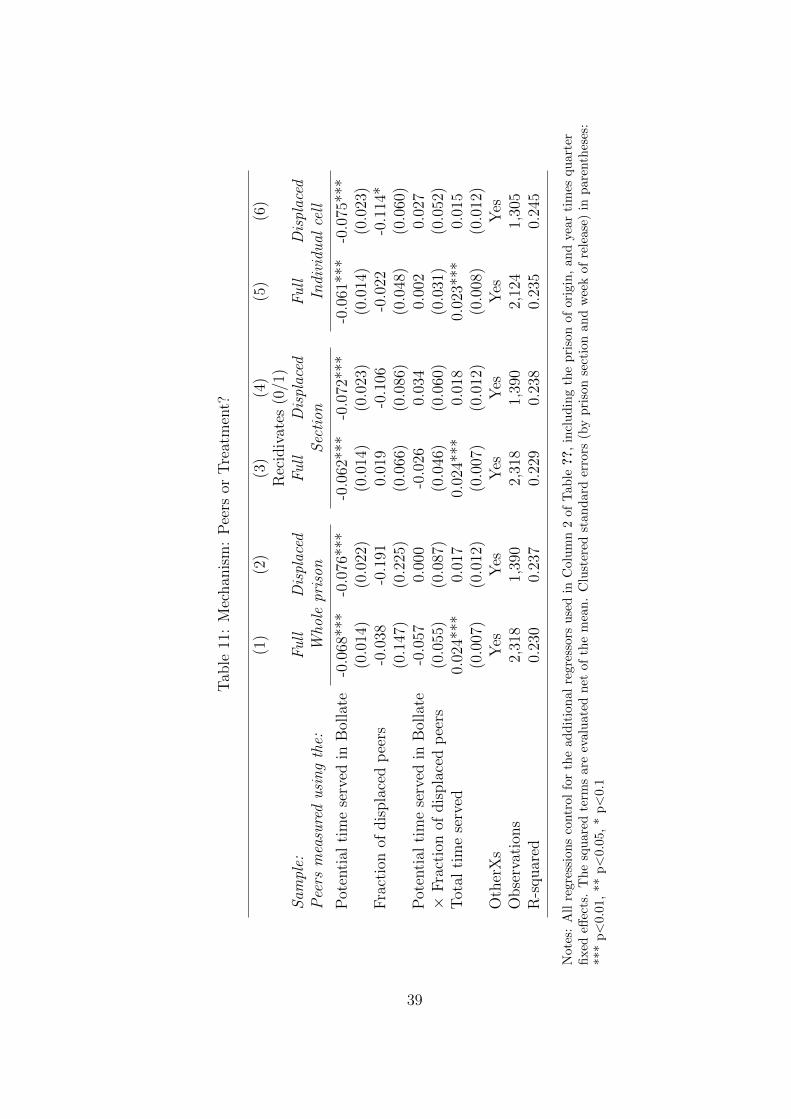
Tab
le11
:M
echan
ism
:P
eers
orT
reat
men
t?
(1)
(2)
(3)
(4)
(5)
(6)
Rec
idiv
ates
(0/1
)S
ampl
e:F
ull
Dis
plac
edF
ull
Dis
plac
edF
ull
Dis
plac
edP
eers
mea
sure
du
sin
gth
e:W
hole
pris
onS
ecti
onIn
divi
dual
cell
Pot
enti
alti
me
serv
edin
Bol
late
-0.0
68**
*-0
.076
***
-0.0
62**
*-0
.072
***
-0.0
61**
*-0
.075
***
(0.0
14)
(0.0
22)
(0.0
14)
(0.0
23)
(0.0
14)
(0.0
23)
Fra
ctio
nof
dis
pla
ced
pee
rs-0
.038
-0.1
910.
019
-0.1
06-0
.022
-0.1
14*
(0.1
47)
(0.2
25)
(0.0
66)
(0.0
86)
(0.0
48)
(0.0
60)
Pot
enti
alti
me
serv
edin
Bol
late
-0.0
570.
000
-0.0
260.
034
0.00
20.
027
×F
ract
ion
ofdis
pla
ced
pee
rs(0
.055
)(0
.087
)(0
.046
)(0
.060
)(0
.031
)(0
.052
)T
otal
tim
ese
rved
0.02
4***
0.01
70.
024*
**0.
018
0.02
3***
0.01
5(0
.007
)(0
.012
)(0
.007
)(0
.012
)(0
.008
)(0
.012
)O
ther
Xs
Yes
Yes
Yes
Yes
Yes
Yes
Obse
rvat
ions
2,31
81,
390
2,31
81,
390
2,12
41,
305
R-s
quar
ed0.
230
0.23
70.
229
0.23
80.
235
0.24
5
Not
es:
All
regr
essi
ons
contr
olfo
rth
ead
dit
ion
alre
gre
ssors
use
din
Colu
mn
2of
Tab
le??,
incl
ud
ing
the
pri
son
of
ori
gin
,an
dye
ar
tim
esqu
art
erfi
xed
effec
ts.
Th
esq
uar
edte
rms
are
eval
uat
edn
etof
the
mea
n.
Clu
ster
edst
an
dard
erro
rs(b
yp
riso
nse
ctio
nan
dw
eek
of
rele
ase
)in
pare
nth
eses
:**
*p<
0.01
,**
p<
0.05
,*
p<
0.1
39

A Photographic Evidence
Figure 4: Pictures taken in Bollate
Notes: The pictures have been taken from http://www.carcerebollate.it/. From left to right andtop to bottom they show the visitors’ center for children, a cell and a corridor.
Figure 5: Pictures taken in Bollate
Notes: Most pictures have been taken from http://www.carcerebollate.it/. From left to right andtop to bottom they show the horses, the library, the garden, the music sound room, and the glasslaboratory.
Figure 6: Pictures taken in Bollate
Notes: Most pictures have been taken from http://www.carcerebollate.it/. From left to right andtop to bottom they show the school, the carpentry, the computer laboratory, the kitchen, the gardenproduce, and the cell phone laboratory.
40
![Rehabilitating and releasing badgers in England · mation is given in the Badger Rehabilitation Protocol [Mullineaux 2018]). The process of rehabilitation provides an opportunity](https://img.pdfslide.net/doc/110x75/5ff0ff99bbe4117f9a58b21a/rehabilitating-and-releasing-badgers-in-england-mation-is-given-in-the-badger-rehabilitation.jpg)


![Radicalization in Custody - Program On Extremism · National Strategy for Counterterrorism highlights “limit[ing] prison radicalization by training prison staff and supporting rehabilitation”](https://img.pdfslide.net/doc/110x75/5eb6e27dfd91d42f1113fc95/radicalization-in-custody-program-on-extremism-national-strategy-for-counterterrorism.jpg)