Embed Size (px)
Citation preview
January 2009
REINSURANCE MARKET OUTLOOKGlobal Prices Firm as Reinsurers Maintain Core Capital Amid Credit Crisis
2
Global reinsurance prices firmed for January 1, 2009 renewals and are expected to remain firm as we look forward to the April through July 2009 renewals. Because U.S. hurricane and earthquake exposures drive the capital requirements for most reinsurers, we forecasted that the impact of the credit crisis would primarily affect pricing, capacity, and cedent retentions in those regions. This forecast result has been realized even though the credit and liquidity crisis is truly global.
Executive Summary
Taking capital as the nearest proxy for capacity, we estimate that reinsurer capital, down 8 to 10 percent through September 30, 2008, will be down by 15 to 20 percent for the year ending December 31, 2008 when reported. The pricing and capacity changes witnessed for January 1, 2009 were in line with these expectations, with U.S. hurricane and earthquake reinsurance pricing rising modestly, while pricing of other global natural perils held firm.
Approximately 90 percent of the decrease in reinsurer capital is due to the credit and liquidity crisis with the balance flowing from catastrophe losses. This firming of the reinsurance market is one of the first caused by asset related issues rather than significant ceded losses. Thankfully, the credit and liquidity crisis follows strong industry profits in 2006 and 2007. Despite the ongoing credit crisis during the first half of 2008, several reinsurers believed they had sufficient economic capital cushions and, in the face of a slowly softening reinsurance market, began to repurchase shares. Nearly all of these repurchases ceased in the third and fourth quarters as the credit and liquidity crisis expanded from structured finance related assets, where reinsurers generally had comparably lower exposures than insurers and other financial institutions, to corporate and municipal bonds, as well as equity securities.
The impact of the credit and liquidity crisis has been considerably worse for insurers than for reinsurers. For calendar year 2008, we estimate insurer capital has decreased by 25 to 30 percent; on average it was down 20 percent through September 30, 2008. Despite this material erosion of accounting, economic, and rating agency capital, insurers have not materially changed reinsurance buying. Only in limited circumstances have we seen the more stressed balance sheets driving additional reinsurance buying. Where reinsurance pricing has increased, cedents have in some cases tried to offset increased reinsurance spending through higher retentions. A summary of the global rate on line, capacity, and retention changes experienced at January 1, 2009 is provided at the sector level later in this report.
Looking ForwardAssuming only limited additional financial turbulence, we expect the April through July reinsurance renewal market will be similar to the January 1, 2009 market, with the exception of U.S. hurricane dominated programs, especially those exposed in the state of Florida. Florida exposed programs will suffer more significant price increases than others due to the uncertainty associated with the state’s partially mandatory, partially optional residential hurricane loss reimbursement program. This program, the Florida Hurricane Catastrophe Fund (FHCF), has estimated it may not be able to finance in the
Aon Benfield
3
municipal bond market over $18 billion of its nearly $30 billion projected 2009 capacity. The Florida legislature is expected to carefully consider its options with respect to the FHCF in the current capacity constrained municipal bond market. Cedents will seek early direction from the state of Florida as they structure the available reinsurance market capacity around a potentially reduced commitment, or less confidence in timely reimbursement from an unchanged FHCF reimbursement structure. With early direction from the Florida legislature, insurers will have the greatest opportunity to minimize potential increases in reinsurance costs, and reinsurers will have more time to build additional capacity, if required.
Although Florida exposed personal lines program renewals, concentrated on June and July renewal dates, may be the source of additional demand for private market reinsurance, Florida exposed commercial lines programs, concentrated on July renewal dates, will not be immune to pricing fluctuations related to the potential changes in the FHCF program because these changes may affect market capacity.
The Japanese market renews most of its substantial programs on the first of April. Japan’s insurers have not been immune to the turbulence in the global financial markets. Thankfully, Japan’s significant catastrophe exposed programs do not drive the peak capital requirements of most reinsurers, and the reduction in reinsurer capital is not expected to disrupt the orderly renewal of these competitively priced programs.
Longer Range Reinsurance Opportunity from Credit Crisis and 2008 EventsWhile there is much greater economic exposure to California earthquake risk, reinsurance aggregate is driven by U.S. hurricane risk. This unusual outcome is driven by the fact that Freddie Mac and Fannie Mae, two giant U.S. government sponsored mortgage financing enterprises, do not require homeowners to insure mortgaged homes for earthquakes but do require homeowners to insure for hurricane. We anticipate that as Freddie Mac and Fannie Mae are greatly reduced in size through the terms of their U.S. government sponsored conservatorships, the successor investor/lender based (rather than government based) mortgage market will require its collateral to be insured for earthquakes. There is significant reinsurance capacity available for what may be a growing demand for earthquake insurance as existing mortgages mature or are refinanced. This transition is likely to take some of the reinsurance cost burden off of Floridians. Unrelated to the credit and liquidity crisis, the significant earthquake in China in May of 2008 reinforced the theory that catastrophe zones in China will eventually surpass Florida, California, Europe, and Japan as peak reinsured catastrophe aggregate zones. The costs to rebuild structures destroyed by the May event have been estimated to exceed $146 billion. Of course for China to surpass other peak regions, property owners in China will need to greatly expand the use of insurance to insure against natural catastrophes. If such an insurance market matures, there is likely to be even greater reinsurance market capacity as reinsurers will have the opportunity to diversify global concentrations by providing capacity to Chinese cedents.
ReinsuRAnce MARket OutLOOk
4
Expectations for Upcoming Property Catastrophe Renewals
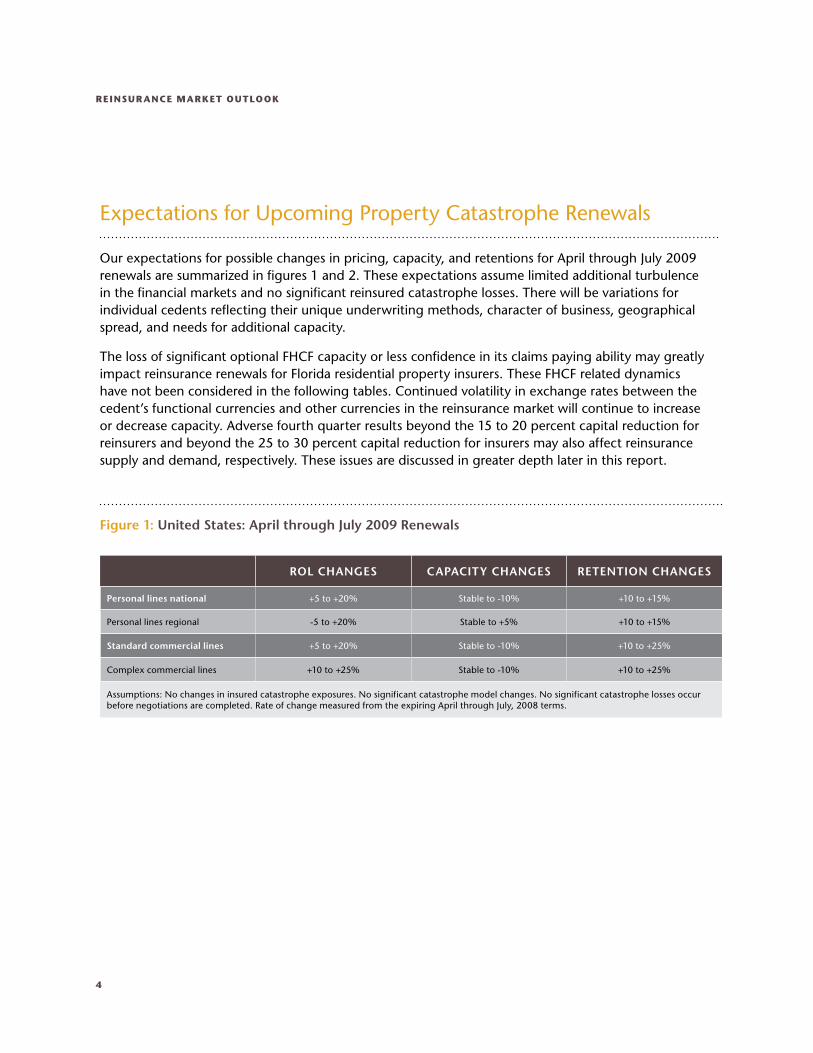
Our expectations for possible changes in pricing, capacity, and retentions for April through July 2009 renewals are summarized in figures 1 and 2. These expectations assume limited additional turbulence in the financial markets and no significant reinsured catastrophe losses. There will be variations for individual cedents reflecting their unique underwriting methods, character of business, geographical spread, and needs for additional capacity.
The loss of significant optional FHCF capacity or less confidence in its claims paying ability may greatly impact reinsurance renewals for Florida residential property insurers. These FHCF related dynamics have not been considered in the following tables. Continued volatility in exchange rates between the cedent’s functional currencies and other currencies in the reinsurance market will continue to increase or decrease capacity. Adverse fourth quarter results beyond the 15 to 20 percent capital reduction for reinsurers and beyond the 25 to 30 percent capital reduction for insurers may also affect reinsurance supply and demand, respectively. These issues are discussed in greater depth later in this report.
Figure 1: United States: April through July 2009 Renewals
ROL CHANGES CAPACITY CHANGES RETENTION CHANGES
Personal lines national +5 to +20% Stable to -10% +10 to +15%
Personal lines regional -5 to +20% Stable to +5% +10 to +15%
Standard commercial lines +5 to +20% Stable to -10% +10 to +25%
Complex commercial lines +10 to +25% Stable to -10% +10 to +25%
Assumptions: No changes in insured catastrophe exposures. No significant catastrophe model changes. No significant catastrophe losses occur before negotiations are completed. Rate of change measured from the expiring April through July, 2008 terms.
Aon Benfield
5
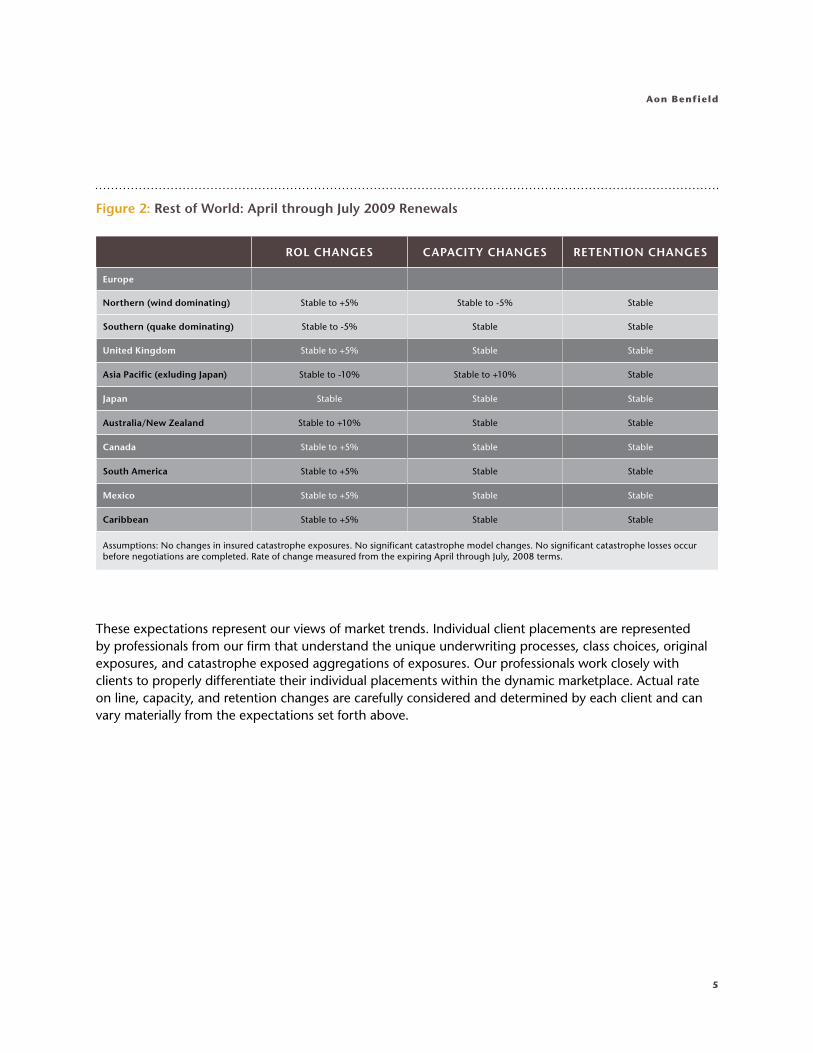
These expectations represent our views of market trends. Individual client placements are represented by professionals from our firm that understand the unique underwriting processes, class choices, original exposures, and catastrophe exposed aggregations of exposures. Our professionals work closely with clients to properly differentiate their individual placements within the dynamic marketplace. Actual rate on line, capacity, and retention changes are carefully considered and determined by each client and can vary materially from the expectations set forth above.
Figure 2: Rest of World: April through July 2009 Renewals
ROL CHANGES CAPACITY CHANGES RETENTION CHANGES
Europe
Northern (wind dominating) Stable to +5% Stable to -5% Stable
Southern (quake dominating) Stable to -5% Stable Stable
United Kingdom Stable to +5% Stable Stable
Asia Pacific (exluding Japan) Stable to -10% Stable to +10% Stable
Japan Stable Stable Stable
Australia/New Zealand Stable to +10% Stable Stable
Canada Stable to +5% Stable Stable
South America Stable to +5% Stable Stable
Mexico Stable to +5% Stable Stable
Caribbean Stable to +5% Stable Stable
Assumptions: No changes in insured catastrophe exposures. No significant catastrophe model changes. No significant catastrophe losses occur before negotiations are completed. Rate of change measured from the expiring April through July, 2008 terms.
ReinsuRAnce MARket OutLOOk
6
Factors Impacting Demand
While largely escaping the mortgage crisis through early 2008, the ensuing fallout of the credit market and drop in investment portfolios has changed the 2009 insurance landscape. Although not yet materialized, an intuitive increase in demand for reinsurance capital may result from insurer capital erosion and lack of capital alternatives due to the decline in insurer valuations and the disruption in the debt markets. Reinsurance remains one of the only functioning capital markets for insurers.
Further fostering an increase in demand for reinsurance capital may be rating agency pressure to restore capitalization, enhancements to enterprise risk management programs, and economic capital modeling resulting in lower insurer risk appetites and the potential inability of the FHCF to fund their prior commitments. Each of these factors is discussed in greater detail below.
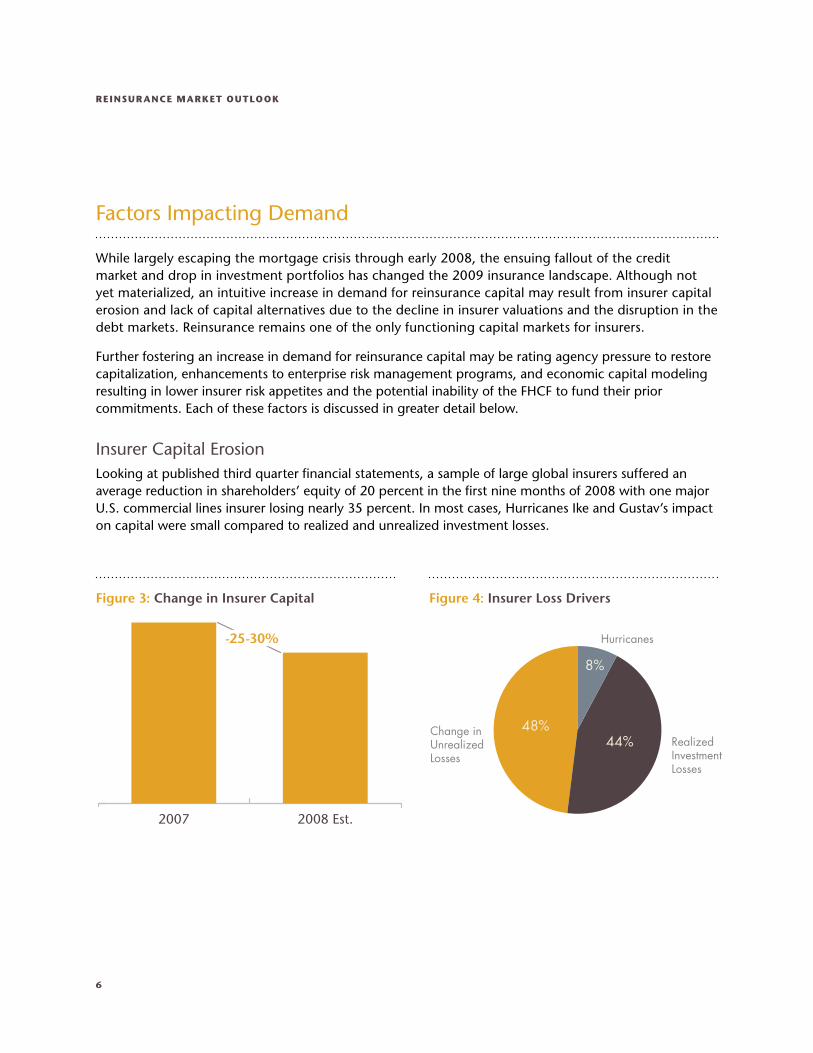
Insurer Capital ErosionLooking at published third quarter financial statements, a sample of large global insurers suffered an average reduction in shareholders’ equity of 20 percent in the first nine months of 2008 with one major U.S. commercial lines insurer losing nearly 35 percent. In most cases, Hurricanes Ike and Gustav’s impact on capital were small compared to realized and unrealized investment losses.
2008 Est.2007
-25-30%
RealizedInvestmentLosses
Change inUnrealizedLosses
Hurricanes
8%
44%48%
Figure 3: Change in Insurer Capital Figure 4: Insurer Loss Drivers
Aon Benfield
7
This capital reduction; however, has not yet led to the expected upswing in demand for reinsurance capital. The reasons are complex. Partially, the speed of the credit-led financial crisis provided little time to look at capital management activities other than trying to understand the remaining volatility associated with structured finance securities, corporate credits, large name bankruptcies, and finally the equity markets themselves.
Asset valuations are so low in historical terms that some wonder if the next source of capital may come from a recovering investment market. Many times in the last 18 months it seemed asset valuations had hit ultimate lows; and unfortunately, these feelings have generally been met with even lower lows. Planning future capital needs in advance has proven the most efficient strategy during this time of market turbulence. Capital management moves that appeared out of line with historical norms when transacted now look almost hyper accretive when compared to the increased cost of capital in the current debt and equity markets. Reinsurance remains an attractive source of underwriting capital for most insurers.
Insurers can also expect a reduction in profitability that occurs within a recession. Premium increases will be harder to obtain, non-essential insurance covers will not be purchased, and many insureds will scale back operations with some ceasing to exist through consolidation or bankruptcy. Reinsurance, and certainly more expensive reinsurance against this backdrop, may appear a significant “cost“ item that needs to be tightly managed to a budget or even reduced. This may denote that if reinsurance prices do rise, retentions may also increase as insurers are unwilling or unable to pay the increased prices.
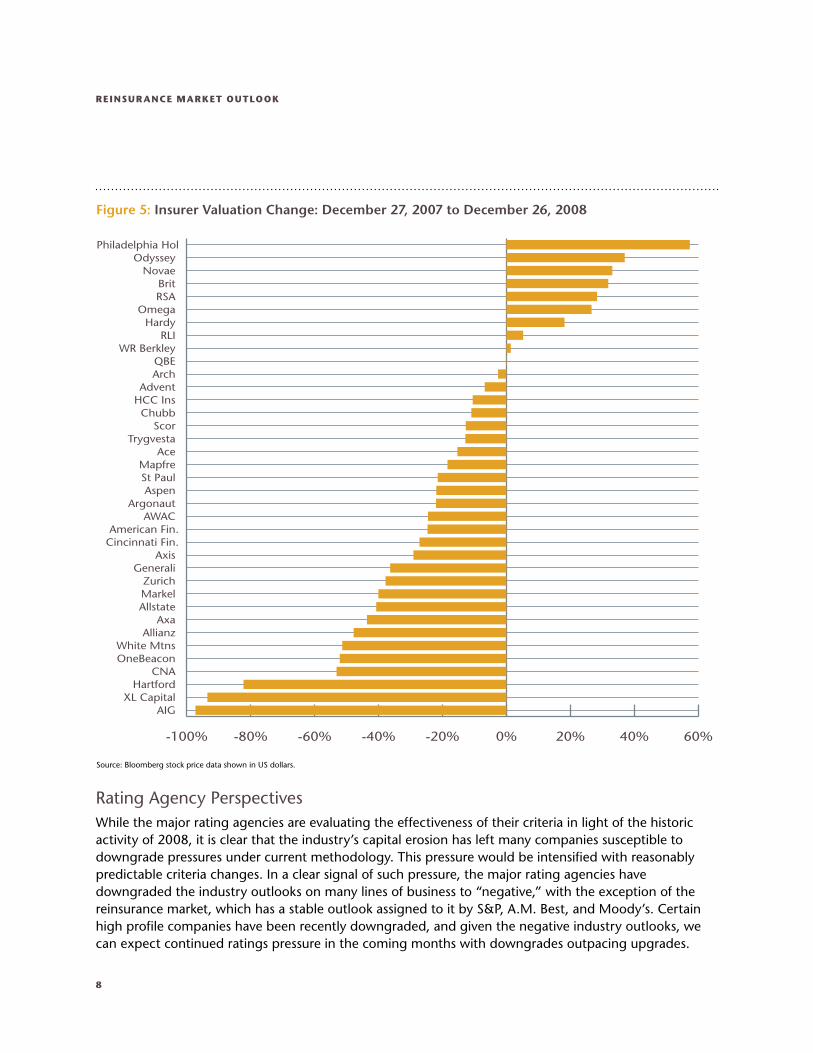
Insurer Market Valuation The ability for insurers to replenish capital through equity offerings or rights issues is hindered by the decline in both book value and the current price/book multiples. These compounding factors result in substantial dilution of current shareholders from equity issuance, even if such capital was available. In 2008, the S&P Insurance Index dropped approximately 60 percent. This percentage is heavily driven by AIG, with individual company movements varying considerably, as the following table illustrates.
ReinsuRAnce MARket OutLOOk
8
Rating Agency PerspectivesWhile the major rating agencies are evaluating the effectiveness of their criteria in light of the historic activity of 2008, it is clear that the industry’s capital erosion has left many companies susceptible to downgrade pressures under current methodology. This pressure would be intensified with reasonably predictable criteria changes. In a clear signal of such pressure, the major rating agencies have downgraded the industry outlooks on many lines of business to “negative,” with the exception of the reinsurance market, which has a stable outlook assigned to it by S&P, A.M. Best, and Moody’s. Certain high profile companies have been recently downgraded, and given the negative industry outlooks, we can expect continued ratings pressure in the coming months with downgrades outpacing upgrades.
Figure 5: Insurer Valuation Change: December 27, 2007 to December 26, 2008
-100% -80% -60% -40% -20% 0% 20% 40% 60%
AIG XL Capital
Hartford CNA
OneBeacon White Mtns
Allianz Axa
Allstate Markel Zurich
Generali Axis
Cincinnati Fin.American Fin.
AWAC Argonaut
Aspen St Paul Mapfre
Ace Trygvesta
Scor Chubb
HCC Ins Advent
Arch QBE
WR Berkley RLI
Hardy Omega
RSA Brit
Novae Odyssey
Philadelphia Hol
Source: Bloomberg stock price data shown in US dollars.
Aon Benfield
9
Ratings pressure is emanating from several key issues emerging in the second half of 2008. These factors are discussed in greater detail on the following pages.
the FinAnciAL MARkets
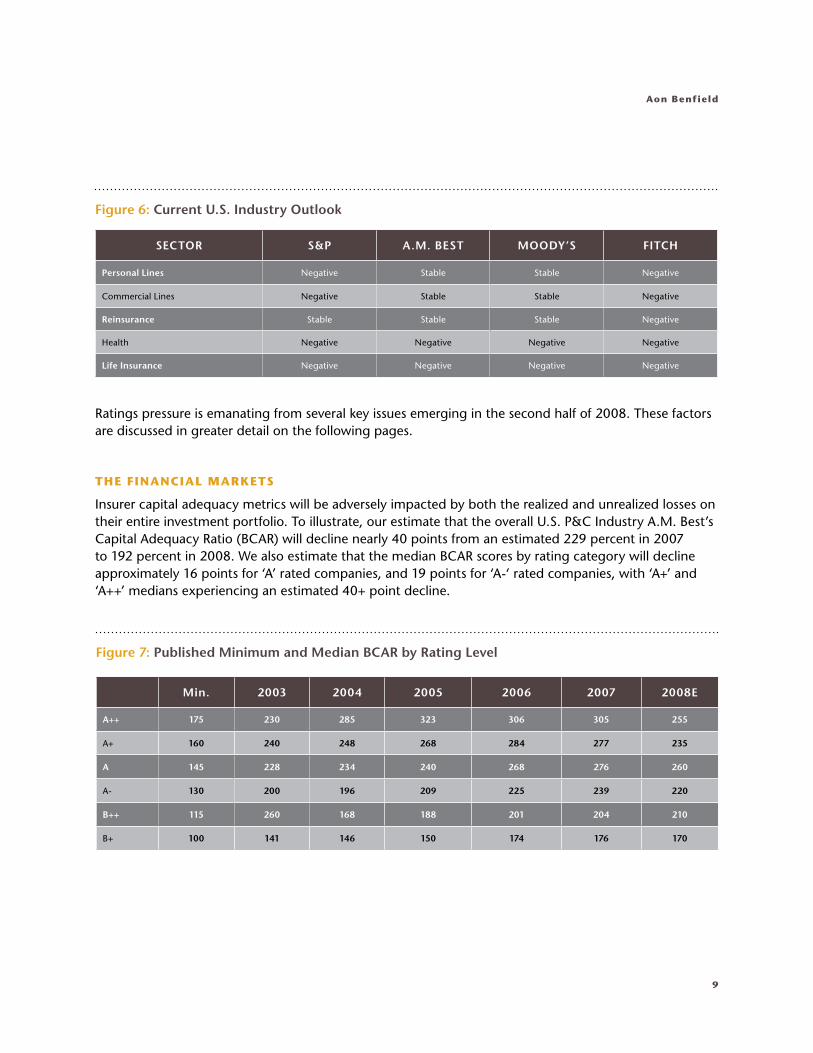
Insurer capital adequacy metrics will be adversely impacted by both the realized and unrealized losses on their entire investment portfolio. To illustrate, our estimate that the overall U.S. P&C Industry A.M. Best’s Capital Adequacy Ratio (BCAR) will decline nearly 40 points from an estimated 229 percent in 2007 to 192 percent in 2008. We also estimate that the median BCAR scores by rating category will decline approximately 16 points for ‘A’ rated companies, and 19 points for ‘A-‘ rated companies, with ‘A+’ and ‘A++’ medians experiencing an estimated 40+ point decline.
Figure 7: Published Minimum and Median BCAR by Rating Level
Min. 2003 2004 2005 2006 2007 2008E
A++ 175 230 285 323 306 305 255
A+ 160 240 248 268 284 277 235
A 145 228 234 240 268 276 260
A- 130 200 196 209 225 239 220
B++ 115 260 168 188 201 204 210
B+ 100 141 146 150 174 176 170
Figure 6: Current U.S. Industry Outlook
SECTOR S&P A.M. BEST MOODY’S FITCH
Personal Lines Negative Stable Stable Negative
Commercial Lines Negative Stable Stable Negative
Reinsurance Stable Stable Stable Negative
Health Negative Negative Negative Negative
Life Insurance Negative Negative Negative Negative
ReinsuRAnce MARket OutLOOk
10
Further, A.M. Best currently caps unrealized losses on fixed income investments at 15 percent of capital, net of tax. Many companies have experienced unrealized losses well in excess of this level. A.M. Best will be calculating 2008 BCAR scores with and without the cap to determine how much stress is on the rating resulting from investment losses. Companies that have BCAR scores at or below the minimum for their rating after removing the cap will be at risk for a downgrade unless they can demonstrate strong liquidity driven by positive operating cash flows, liquid assets sufficient to cover short-term obligations, and other forms of financial flexibility. For 2008, we estimate that over 100 companies will have a BCAR score within 15 points of the published minimum for their rating, up significantly from 30 companies for 2007.
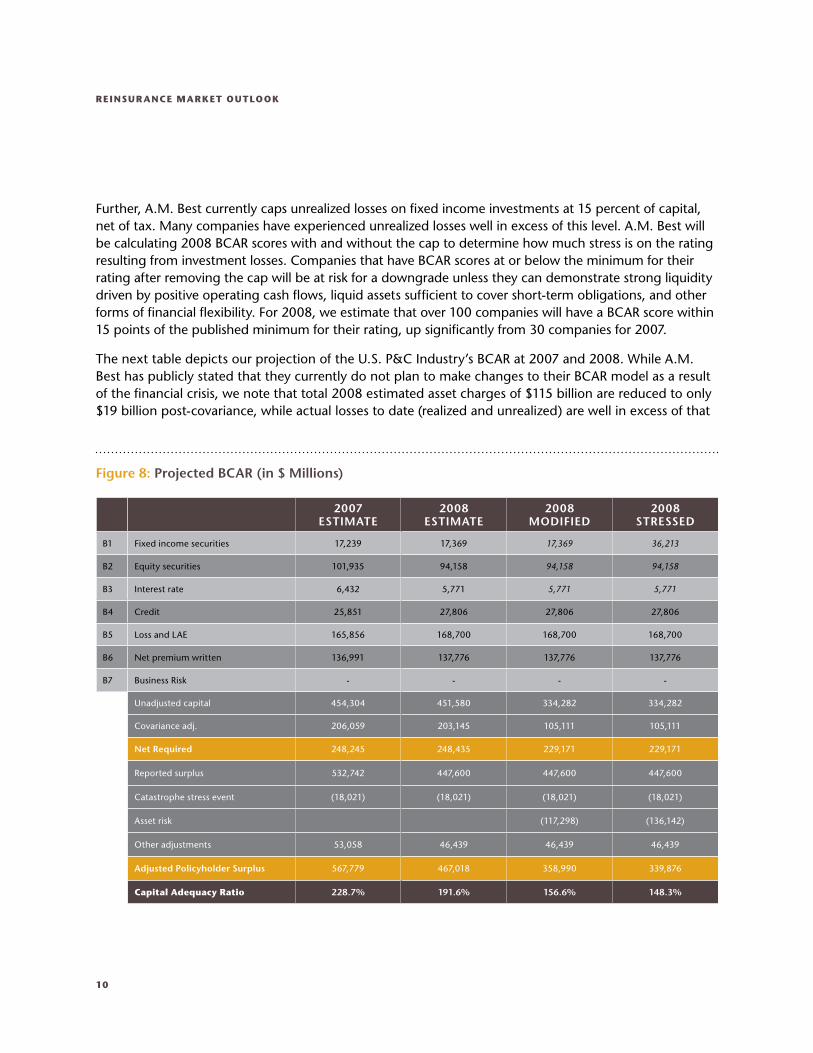
The next table depicts our projection of the U.S. P&C Industry’s BCAR at 2007 and 2008. While A.M. Best has publicly stated that they currently do not plan to make changes to their BCAR model as a result of the financial crisis, we note that total 2008 estimated asset charges of $115 billion are reduced to only $19 billion post-covariance, while actual losses to date (realized and unrealized) are well in excess of that
2007 ESTIMATE
2008 ESTIMATE
2008 MODIFIED
2008 STRESSED
B1 Fixed income securities 17,239 17,369 17,369 36,213
B2 Equity securities 101,935 94,158 94,158 94,158
B3 Interest rate 6,432 5,771 5,771 5,771
B4 Credit 25,851 27,806 27,806 27,806
B5 Loss and LAE 165,856 168,700 168,700 168,700
B6 Net premium written 136,991 137,776 137,776 137,776
B7 Business Risk - - - -
Unadjusted capital 454,304 451,580 334,282 334,282
Covariance adj. 206,059 203,145 105,111 105,111
Net Required 248,245 248,435 229,171 229,171
Reported surplus 532,742 447,600 447,600 447,600
Catastrophe stress event (18,021) (18,021) (18,021) (18,021)
Asset risk (117,298) (136,142)
Other adjustments 53,058 46,439 46,439 46,439
Adjusted Policyholder Surplus 567,779 467,018 358,990 339,876
capital Adequacy Ratio 228.7% 191.6% 156.6% 148.3%
Figure 8: Projected BCAR (in $ Millions)
Aon Benfield
11
amount. Two logical analyses that A.M. Best could undertake to analyze the impact of the investment losses are (1) “2008 Modified:” remove the asset charges from the covariance, similar to S&P’s historical approach, which would decrease the estimated industry BCAR by 35 points; and (2) “2008 Stressed:” adopt the actual credit fixed income securities decrease of $36.2 million rather than the $17 million modeled asset charge. This is similar to A.M. Best’s approach to catastrophe risk subsequent to Hurricane Katrina, where if a company’s actual loss was in excess of its 100 year modeled loss, the actual losses became the 100 year PML going forward. This approach would result in a 43 point reduction in BCAR.
FLORidA huRRicAne cAtAstROphe Fund
The rating agencies are requiring companies to present their solutions for recapitalization should a significant hurricane occur in 2009 and the FHCF not be able to raise funds post-event. Recapitalization can come from additional third party reinsurance, contingent capital facilities, or other forms of financial flexibility. The rating agencies expect companies to be prepared to describe how they will continue to operate in the event of a major hurricane with no FHCF support.
As discussed below, there is much speculation regarding the amount of capacity that will be available in 2009 from the FHCF including the temporary increase in coverage limit (TICL) layer and the market take-up rate, as well as related rating agency credit. To measure this potential impact on ratings, we developed a BCAR score specific to the Florida Homeowners composite. Even though many Florida homeowners companies are not rated by A. M. Best, we felt this was the best approach to measure potential impact. Our analysis covers companies that write $5.5 billion (part of $8.6 billion total) Florida homeowners direct written premium with over $3 billion in policyholder surplus and a TICL exposure of over $5 billion. The analysis excludes Citizens Insurance, which writes $1.5 billion of the $8.6 billion total Florida homeowners premium.
The BCAR estimate for the composite is a baseline score of 145 percent including full benefit from TICL. However, should the TICL layer not be available or not receive credit from the rating agencies, the composite BCAR score would be subject to at least a $3 billon charge, resulting in a negative BCAR score. Replacing TICL coverage through the open market would eliminate this additional charge, and although at a substantial cost, it is most likely the only viable source of capital for most companies. Furthermore, extrapolating this impact to the entire Florida homeowners industry (i.e., Citizens) and considering the implications of Best’s catastrophe test, the implied rating agency capital shortfall amounts to nearly $5 billion.
In addition, Demotech, the sole rating agency for many Florida specialty companies, is currently rethinking its approach to analyzing Florida-only companies. Companies rated by Demotech will be expected to present their plans for recapitalization should the FHCF announce in May that it cannot complete post-event funding.
ReinsuRAnce MARket OutLOOk
12
sOFt cycLe
Given that companies cannot rely on investment income to offset underwriting losses and asset devaluations are actually driving down capital, it is more important than ever for companies to effectively manage this cycle. The rating agencies have reiterated that cycle management continues to be among the key rating concerns for the 2008 reviews.
Companies therefore need to present strong cases to the rating agencies that they are effectively managing this cycle and will be able to produce underwriting profits despite declining rates. We observe analysts asking rated companies the following questions, which show a comprehensive concern regarding companies’ ability to maintain underwriting discipline through a tough market:
• What is your target threshold for underwriting a risk (e.g., Combined Ratio, ROE, etc.)?
• How will the CEO and CFO know when that threshold has been breached? How will the underwriter know?
• How are you capturing slippage in terms and conditions as well as rates?
• Is any part of underwriting compensation tied to volume?
• If you struggled during the last soft market, what changes have been made to assure better performance in the current cycle?
• Has your strategy changed or is it changing with respect to the strong reserve adequacy you have been displaying at recent analyst meetings?
• If you are willing to be disciplined in underwriting, what measures are in place to manage the expense ratio?
RAting Agency cOncLusiOn
Companies in 2009 will need to focus on rebuilding their capital base as they will be under pressure both internally and from the rating agencies to increase capital organically through underwriting income, not knowing if and when the financial markets will rebound. We anticipate rating agencies to take more concrete actions once 2008 annual statements are filed, the FHCF limits are finalized, and there is a better understanding of the impact the recent events have had on the industry as a whole. In addition, rating agencies are likely to take into account the impending insurance losses related to the global credit crisis and potentially devise new stress tests. As annual rating meetings approach, there will inherently be a focus on liquidity and capital management, which is expected to lead to an increase in demand for reinsurance as an efficient source of capital to enhance an insurers rating position.
Aon Benfield
13
Regulatory CapitalFollowing a year where several governments around the world have had to inject capital into banks and certain combined banking and insurance franchises, there is little doubt that there will be significant changes in minimum regulatory capital and liquidity levels in coming years. The anticipated strong regulatory emphasis on liquidity in addition to capital levels is unprecedented and highlights the shortcomings of primarily regulating capital.
It is likely that the immediate focus of these governments will be on banks where the capital and liquidity crisis had its most dramatic peak but insurers are likely to be considered next or fall into the same capital requirements for asset related exposures. These changes are expected to be material and likely beyond what has been considered under Solvency II and other applied risk based capital models. It is possible that some of these anticipated liquidity and capital regulations may eclipse rating agency capital requirements as the primary capital constraint.
Enterprise Risk Management Events during 2008 showed how important effective Enterprise Risk Management (ERM) is to all financial companies. They also showed there are some weaknesses in ERM as it is currently practiced. Despite these limitations, the ERM approach and philosophy of an integrated, enterprise-wide view of risk with clear risk owners and specified risk appetites, adds substantially to shareholder value over the long-term. For example, a recent study by S&P showed that companies whose ERM they rated as strong or excellent in 2007 had net income changes in 2008 over ten points better than those rated adequate, and thirty points better than those rated weak.
Going into 2009 the need for effective ERM at insurers and reinsurers will continue to grow. We see five key issues facing companies as they implement and enhance their ERM efforts during the year. Each of them should result in an increased demand for risk transfer products.
• Liquidity risk, legal entity risk, and contingent encumbrances matter. The standard approach to economic capital modeling looks through legal entity boundaries and considers aggregate risk vs. aggregate capital resources. Several examples in 2008 showed that capital is not transferable across legal entities and that legal entity and liquidity risk requires more careful analysis. Contingent encumbrances, often triggered by rating agency actions, can prove to be a “sudden-death” clause, greatly reducing operational flexibility and liquidity at just the wrong time. Considering risk tolerance at the legal entity level, and including liquidity risk, will reduce overall risk bearing capacity.
• The possible is as important as the probable. The introduction of probabilistic models led some companies to ignore risks which the models said were extremely remote. In capital models, quantification of risk at extreme return periods is always more subjective and uncertain than near the mean of the distribution. Reflecting this, there should be a greater emphasis put on scenario testing against possible events, even in cases where the models say they are unlikely. Companies need a survival strategy or risk transfer mechanism to respond to possible extreme events.
ReinsuRAnce MARket OutLOOk
14
• Defining risk tolerance to consider a financial flexibility threshold. ERM is concerned with risk at all levels, from threats to solvency to threats to income. Regulators and rating agencies focus their analysis of ERM on extreme tail outcomes. However, ERM for the going concern also needs to monitor and manage risks to financial flexibility. Flexibility is impinged at a much lower loss threshold, especially in today’s credit crunch and capital constrained market.
• Asset risk. Asset price movements in 2008 were extreme. For assets with long histories results were near the worst on record; for newer classes of assets the results seemed unprecedented. Future asset risk measurement will need to incorporate stress tests based on 2008, with appropriate risk re-parameterization. Recalibrated asset risk will consume more capacity than previously anticipated and reduce that available for underwriting in 2009.
• Capture all of the known risks both current and emerging. Enterprise risk management which does not capture enterprise-wide risk is misleading and damaging. Examples of this include catastrophe modeling pre-Katrina which did not model all perils or all risks (such as off-shore energy, boats, or flood) and asset modeling in 2008 which did not include the spread between fundamental value and market value.
These five considerations suggest lower underwriting risk capacity or lower overall risk tolerance in 2009, both of which should drive increased demand for risk transfer mechanisms.
Florida Hurricane Catastrophe Fund Capacity Florida hurricane exposure drives the capacity of many of the world’s reinsurers. As such, changes to the Florida catastrophe market have an impact beyond Florida and the U.S.
The Florida government increased capacity provided by the Florida Hurricane Catastrophe Fund (FHCF) by 75 percent for the 2007 hurricane season when it created the Temporary Increase in Coverage Limit (TICL) program. It was initially authorized for three years, meaning it will still offer up to $12 billion of capacity for the 2009 season. Insurers have come to rely on this additional reinsurance capacity offered at far below market prices, as they purchased just over $11 billion of this limit for 2008.
In October, as part of their biannual review of the FHCF’s bonding capacity, the FHCF reported that in their best judgment and under current market conditions, the FHCF could count on selling between $1 and $3 billion of bonds post-event. If this was true and a major hurricane had occurred in Florida in 2008, there could have been a $14.5 billion shortfall in reimbursements to ceding companies.
Aon Benfield
15
At this time, it is unknown how or whether the Florida legislature will respond to an even larger estimated $18.4 billion potential shortfall for the 2009 hurricane season. In 2008, there were legislative attempts to scale back the TICL program. Even if the TICL program remains unchanged, some insurers will likely opt to replace it with private reinsurance in which they have more confidence in making needed and timely recoveries of losses incurred.
In 2008, private insurers represented 64 percent of the FHCF (as measured by FHCF premiums). They were apportioned about $7.7 billion of TICL capacity, of which about $6.6 billion was purchased. Hence, there could be additional demand of over $6 billion for Florida capacity—whether due to legislative action or insurers’ preference. Note that this estimate assumes Citizens would not (or could not) also choose to purchase the TICL layer ($4.3 billion) in the private market. Such an increase in demand would, undoubtedly, produce even more upward rate pressure on Florida programs.
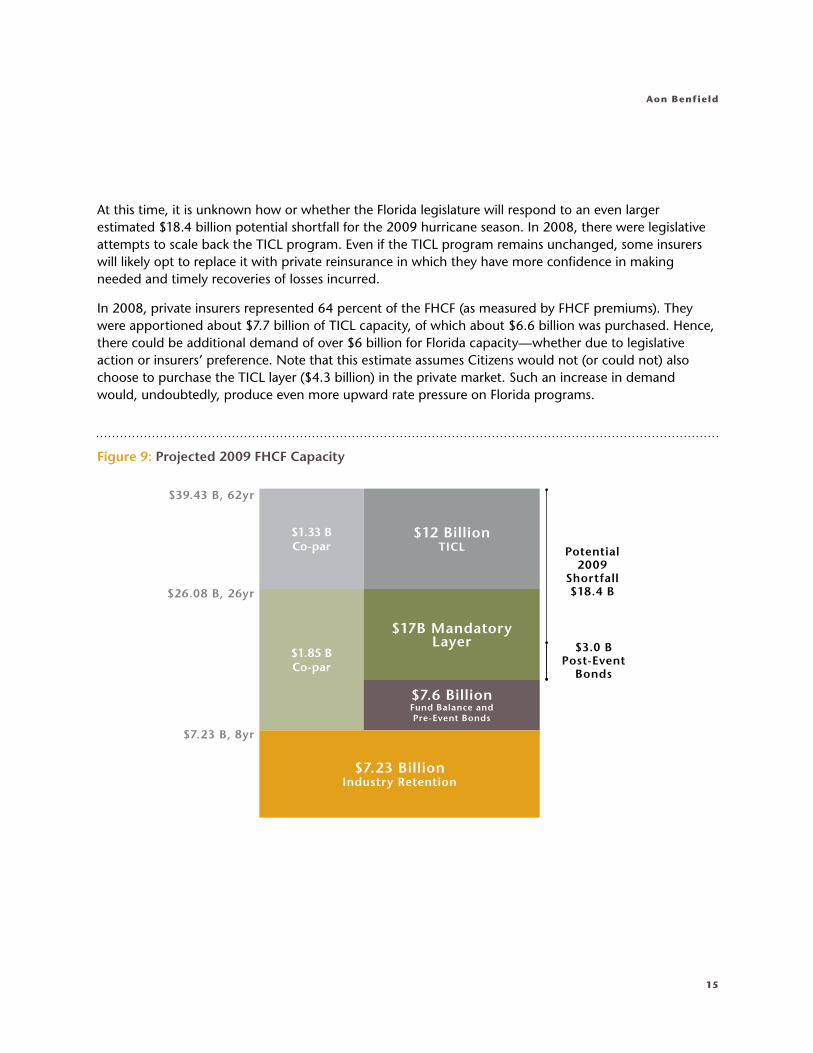
Figure 9: Projected 2009 FHCF Capacity
$1.33 BCo-par
$12 Billion TICL
$1.85 B Co-par
$17B Mandatory Layer
$7.6 Billion Fund Balance andPre-Event Bonds
$7.23 Billion Industry Retention
$39.43 B, 62yr
$26.08 B, 26yr
$7.23 B, 8yr
Potential 2009
Shortfall $18.4 B
$3.0 B Post-Event
Bonds
ReinsuRAnce MARket OutLOOk
16
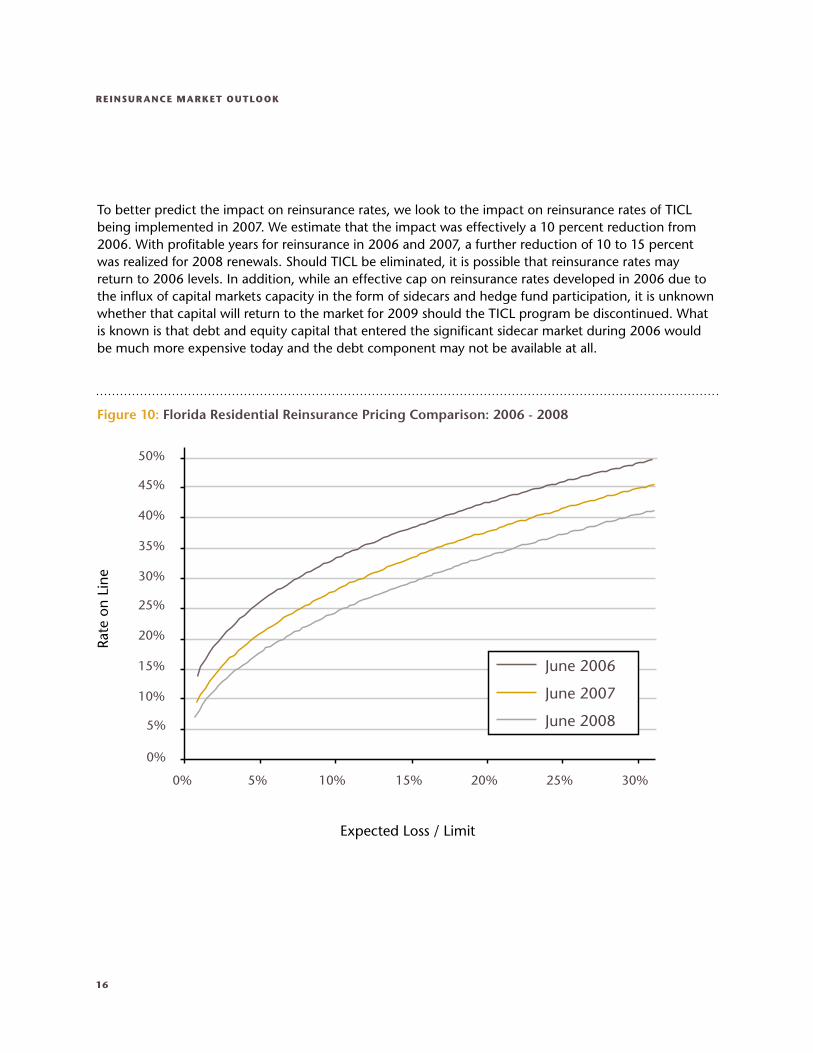
To better predict the impact on reinsurance rates, we look to the impact on reinsurance rates of TICL being implemented in 2007. We estimate that the impact was effectively a 10 percent reduction from 2006. With profitable years for reinsurance in 2006 and 2007, a further reduction of 10 to 15 percent was realized for 2008 renewals. Should TICL be eliminated, it is possible that reinsurance rates may return to 2006 levels. In addition, while an effective cap on reinsurance rates developed in 2006 due to the influx of capital markets capacity in the form of sidecars and hedge fund participation, it is unknown whether that capital will return to the market for 2009 should the TICL program be discontinued. What is known is that debt and equity capital that entered the significant sidecar market during 2006 would be much more expensive today and the debt component may not be available at all.
Figure 10: Florida Residential Reinsurance Pricing Comparison: 2006 - 2008
0%
10%
5%
20%
15%
30%
25%
40%
35%
50%
45%
0% 5% 10% 15% 20% 25% 30%
Expected Loss / Limit
Rate
on
Line
June 2006
June 2007
June 2008
Aon Benfield
17
Factors Impacting Supply
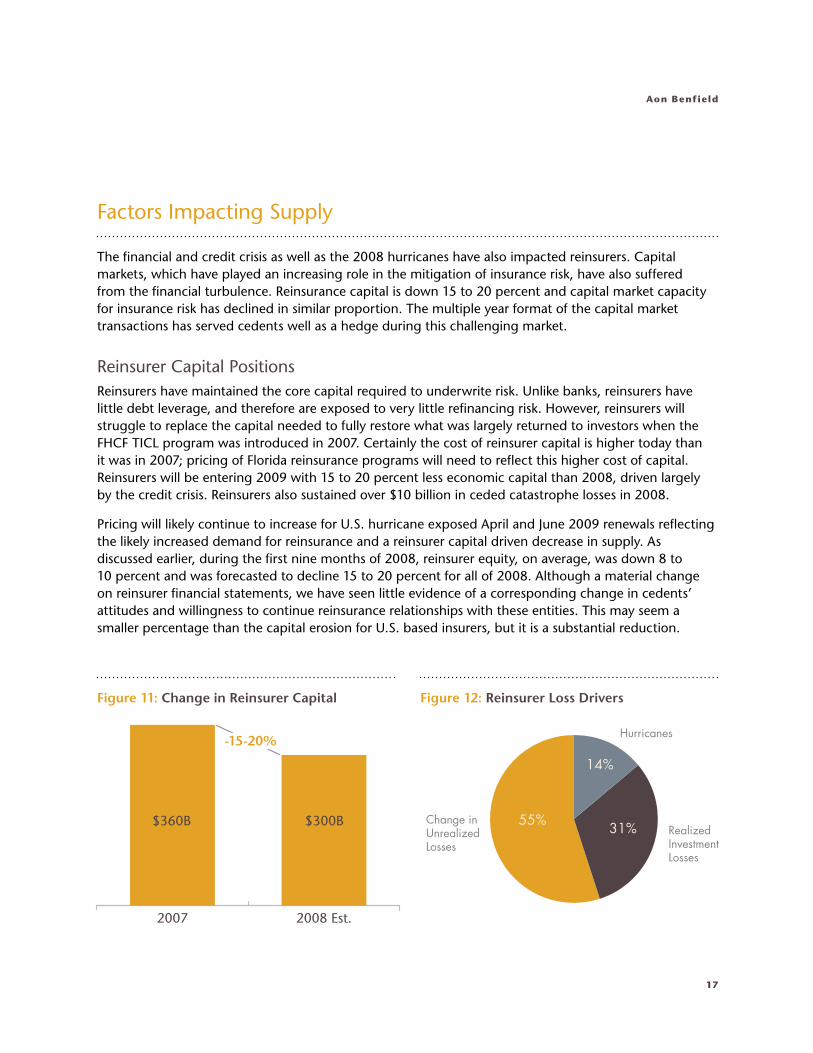
The financial and credit crisis as well as the 2008 hurricanes have also impacted reinsurers. Capital markets, which have played an increasing role in the mitigation of insurance risk, have also suffered from the financial turbulence. Reinsurance capital is down 15 to 20 percent and capital market capacity for insurance risk has declined in similar proportion. The multiple year format of the capital market transactions has served cedents well as a hedge during this challenging market.
Reinsurer Capital PositionsReinsurers have maintained the core capital required to underwrite risk. Unlike banks, reinsurers have little debt leverage, and therefore are exposed to very little refinancing risk. However, reinsurers will struggle to replace the capital needed to fully restore what was largely returned to investors when the FHCF TICL program was introduced in 2007. Certainly the cost of reinsurer capital is higher today than it was in 2007; pricing of Florida reinsurance programs will need to reflect this higher cost of capital. Reinsurers will be entering 2009 with 15 to 20 percent less economic capital than 2008, driven largely by the credit crisis. Reinsurers also sustained over $10 billion in ceded catastrophe losses in 2008.
Pricing will likely continue to increase for U.S. hurricane exposed April and June 2009 renewals reflecting the likely increased demand for reinsurance and a reinsurer capital driven decrease in supply. As discussed earlier, during the first nine months of 2008, reinsurer equity, on average, was down 8 to 10 percent and was forecasted to decline 15 to 20 percent for all of 2008. Although a material change on reinsurer financial statements, we have seen little evidence of a corresponding change in cedents’ attitudes and willingness to continue reinsurance relationships with these entities. This may seem a smaller percentage than the capital erosion for U.S. based insurers, but it is a substantial reduction.
Figure 11: Change in Reinsurer Capital Figure 12: Reinsurer Loss Drivers
2008 Est.2007
-15-20%
$360B $300BRealizedInvestmentLosses
Change inUnrealizedLosses
Hurricanes
14%
31%55%
ReinsuRAnce MARket OutLOOk
18
Cedents are sensitive to reinsurer ratings and balance sheet changes. The rapid deterioration of many financial institutions during 2008 has added value to the diligence around counterparty selection.
Factors that may play a role in selecting reinsurers include:
• Types of business a cedent will allow a reinsurer to support (short tail vs. long tail)
• Types of business a reinsurer writes
• Long-term claim paying ability and history of a reinsurer
Rating agencies are also a factor for reinsurers as a number of them have already been downgraded or had outlooks changed to negative and more may follow. Lack of capacity in the retrocession market may reduce capacity and little new equity capital appears poised to enter the business.
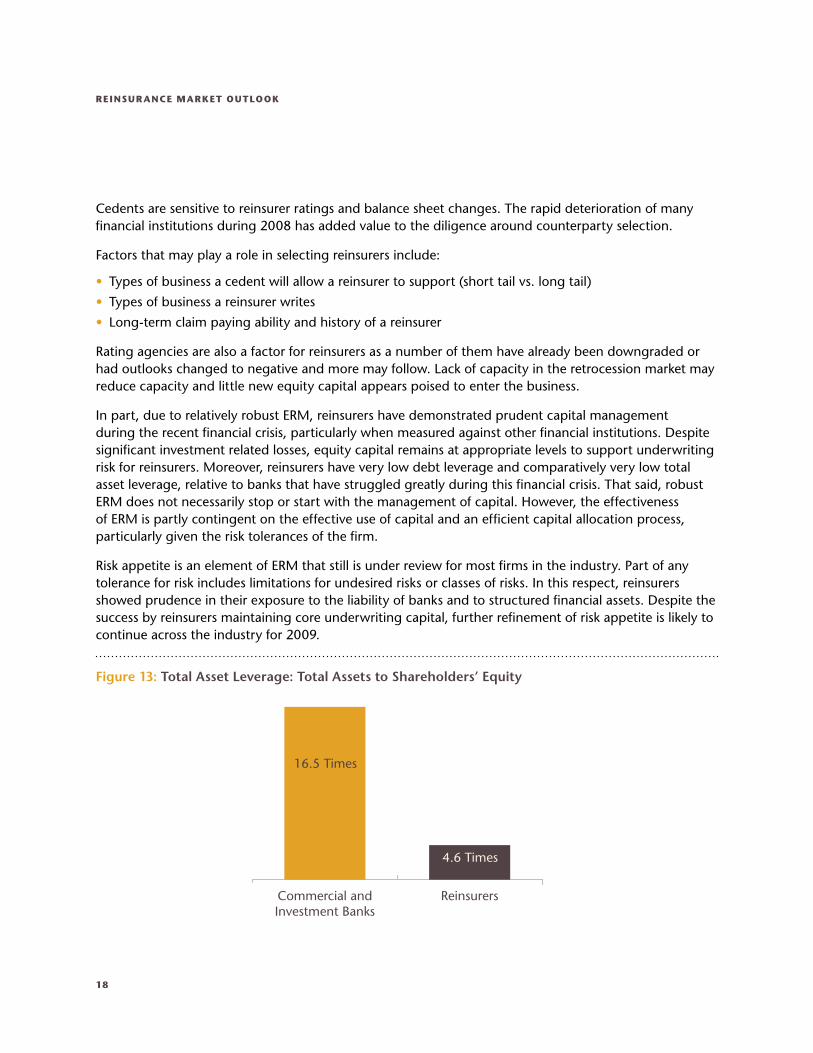
In part, due to relatively robust ERM, reinsurers have demonstrated prudent capital management during the recent financial crisis, particularly when measured against other financial institutions. Despite significant investment related losses, equity capital remains at appropriate levels to support underwriting risk for reinsurers. Moreover, reinsurers have very low debt leverage and comparatively very low total asset leverage, relative to banks that have struggled greatly during this financial crisis. That said, robust ERM does not necessarily stop or start with the management of capital. However, the effectiveness of ERM is partly contingent on the effective use of capital and an efficient capital allocation process, particularly given the risk tolerances of the firm.
Risk appetite is an element of ERM that still is under review for most firms in the industry. Part of any tolerance for risk includes limitations for undesired risks or classes of risks. In this respect, reinsurers showed prudence in their exposure to the liability of banks and to structured financial assets. Despite the success by reinsurers maintaining core underwriting capital, further refinement of risk appetite is likely to continue across the industry for 2009.
Figure 13: Total Asset Leverage: Total Assets to Shareholders’ Equity
ReinsurersCommercial andInvestment Banks
16.5 Times
4.6 Times
Aon Benfield
19
Mergers & Acquisitions Despite market expectations of consolidation within the global reinsurance sector in general, and the Bermuda reinsurance sector specifically, we have not yet seen significant consolidation of the reinsurance industry. This trend, if continued, has a net favorable impact on capacity for cedents because it is rare that consolidating reinsurers offer more program capacity post merger. In fact, the opposite is usually the case and less capacity is offered to individual cedents from the combined entities.
Motivations for consolidation are strong; however, and boards and shareholders will eventually find compelling reasons to pursue M&A, such as:
• Achieving scale to participate in larger programs and drive terms
• Enabling operational efficiencies
• Lower rating agency capital requirements as benefits of size and diversification are realized
In recent weeks, two distressed financial investors, Cerberus Capital Management L.P. and Citadel Investment Group, L.L.C., have disposed of their reinsurance platforms, namely GMAC Re and New Castle Re respectively.
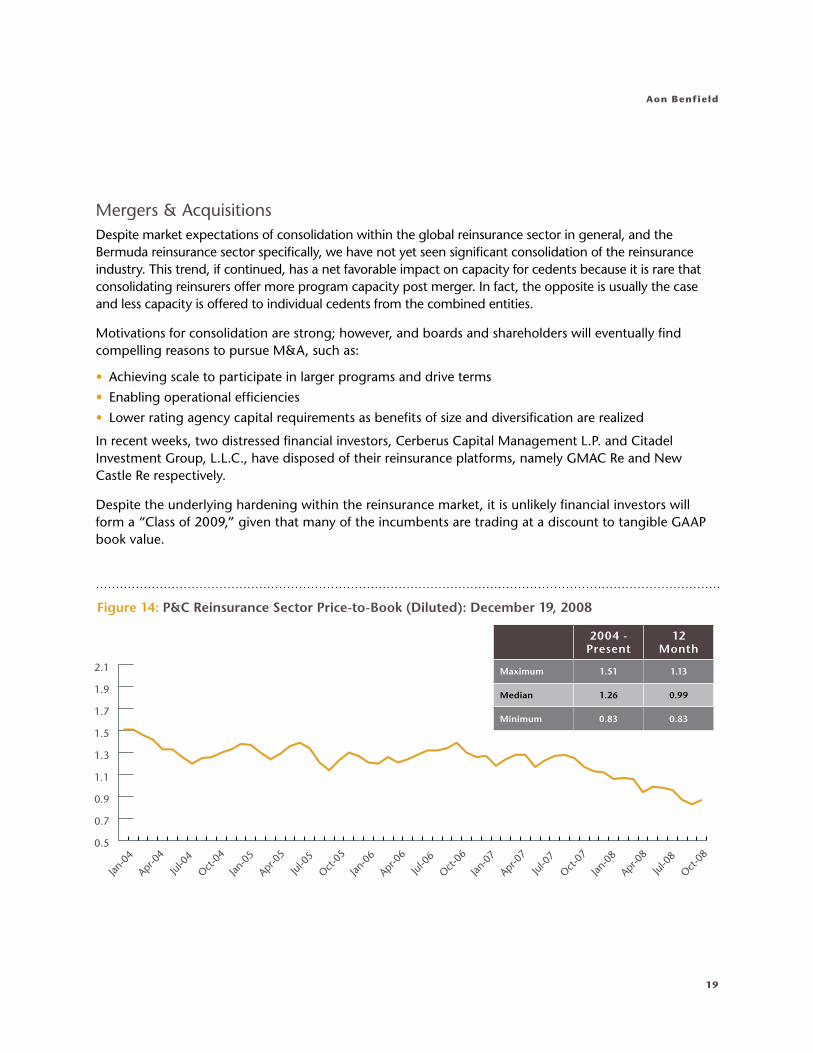
Despite the underlying hardening within the reinsurance market, it is unlikely financial investors will form a “Class of 2009,” given that many of the incumbents are trading at a discount to tangible GAAP book value.
Figure 14: P&C Reinsurance Sector Price-to-Book (Diluted): December 19, 2008
Jan-0
4
Apr-0
4
Jul-0
4
Oct-04
Jan-0
5
Apr-0
5
Jul-0
5
Oct-05
Jan-0
6
Apr-0
6
Jul-0
6
Oct-06
Jan-0
7
Apr-0
7
Jul-0
7
Oct-07
Jan-0
8
Apr-0
8
Jul-0
8
Oct-08
0.5
0.7
0.9
1.1
1.3
1.5
1.7
1.9
2.1
2004 - Present
12 Month
Maximum 1.51 1.13
Median 1.26 0.99
Minimum 0.83 0.83
ReinsuRAnce MARket OutLOOk
20
Property Catastrophe Dynamics
Until insurance penetration increases in global natural catastrophe prone areas, U.S. hurricane risk remains a prime driver of reinsurance pricing for many reinsurers and so affects all classes of business. Coupled with the impact on investment portfolios for both insurers and reinsurers, as well as the potential changes to the FHCF, a few additional dynamics are developing in the property catastrophe market.
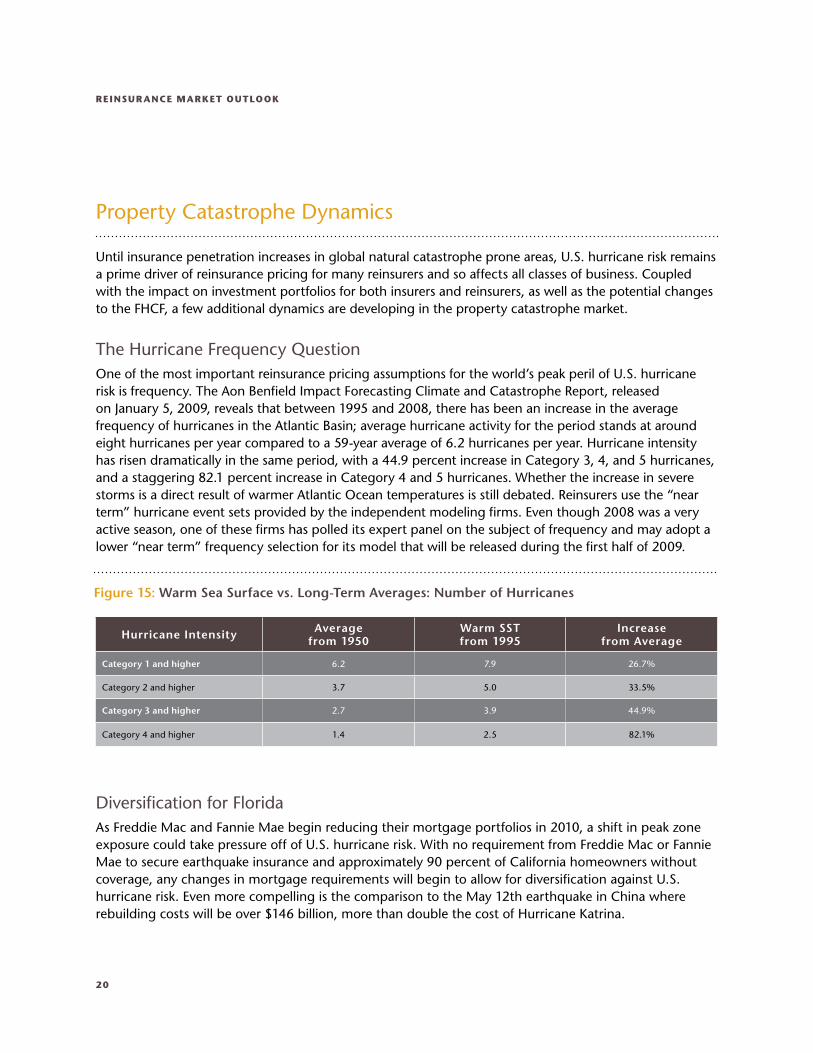
The Hurricane Frequency QuestionOne of the most important reinsurance pricing assumptions for the world’s peak peril of U.S. hurricane risk is frequency. The Aon Benfield Impact Forecasting Climate and Catastrophe Report, released on January 5, 2009, reveals that between 1995 and 2008, there has been an increase in the average frequency of hurricanes in the Atlantic Basin; average hurricane activity for the period stands at around eight hurricanes per year compared to a 59-year average of 6.2 hurricanes per year. Hurricane intensity has risen dramatically in the same period, with a 44.9 percent increase in Category 3, 4, and 5 hurricanes, and a staggering 82.1 percent increase in Category 4 and 5 hurricanes. Whether the increase in severe storms is a direct result of warmer Atlantic Ocean temperatures is still debated. Reinsurers use the “near term” hurricane event sets provided by the independent modeling firms. Even though 2008 was a very active season, one of these firms has polled its expert panel on the subject of frequency and may adopt a lower “near term” frequency selection for its model that will be released during the first half of 2009.
Diversification for FloridaAs Freddie Mac and Fannie Mae begin reducing their mortgage portfolios in 2010, a shift in peak zone exposure could take pressure off of U.S. hurricane risk. With no requirement from Freddie Mac or Fannie Mae to secure earthquake insurance and approximately 90 percent of California homeowners without coverage, any changes in mortgage requirements will begin to allow for diversification against U.S. hurricane risk. Even more compelling is the comparison to the May 12th earthquake in China where rebuilding costs will be over $146 billion, more than double the cost of Hurricane Katrina.
Figure 15: Warm Sea Surface vs. Long-Term Averages: Number of Hurricanes
Hurricane Intensity Averagefrom 1950
Warm SSTfrom 1995
Increasefrom Average
Category 1 and higher 6.2 7.9 26.7%
Category 2 and higher 3.7 5.0 33.5%
Category 3 and higher 2.7 3.9 44.9%
Category 4 and higher 1.4 2.5 82.1%
Aon Benfield
21
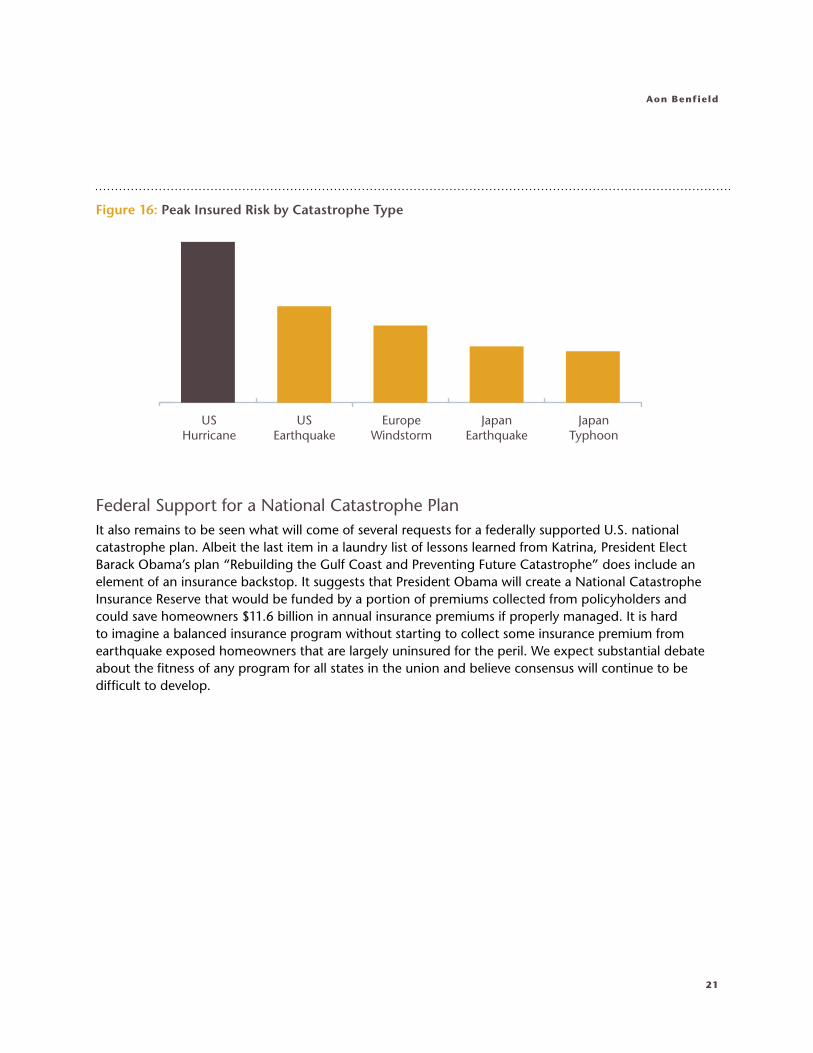
Federal Support for a National Catastrophe PlanIt also remains to be seen what will come of several requests for a federally supported U.S. national catastrophe plan. Albeit the last item in a laundry list of lessons learned from Katrina, President Elect Barack Obama’s plan “Rebuilding the Gulf Coast and Preventing Future Catastrophe” does include an element of an insurance backstop. It suggests that President Obama will create a National Catastrophe Insurance Reserve that would be funded by a portion of premiums collected from policyholders and could save homeowners $11.6 billion in annual insurance premiums if properly managed. It is hard to imagine a balanced insurance program without starting to collect some insurance premium from earthquake exposed homeowners that are largely uninsured for the peril. We expect substantial debate about the fitness of any program for all states in the union and believe consensus will continue to be difficult to develop.
Figure 16: Peak Insured Risk by Catastrophe Type
USHurricane
USEarthquake
EuropeWindstorm
JapanEarthquake
JapanTyphoon
ReinsuRAnce MARket OutLOOk
22
Capital Markets
Capacity in the insurance-linked securities markets suffered from the global financial contagion in the broader financial markets during the second half of 2008. The valuation of insurance linked securities held up well compared to most other structured finance related asset classes, with certain Lehman Brothers related exceptions noted below. The benefit these securities held in valuation and liquidity allowed certain investors the opportunity to generate liquidity needed to meet fund redemptions. While the need for liquidity from certain investors meant that there was limited capacity for new transactions in the fourth quarter, it did prove to investors that the market can produce liquidity at reasonable valuations even in stressful markets. This positive performance has been observed by investors that liked the diversification potential of the securities but have largely remained on the sidelines. We believe that once the current fund redemption cycle ends and new asset allocations are made, the number of investors interested in diversification through insurance-linked securities will be larger than ever.
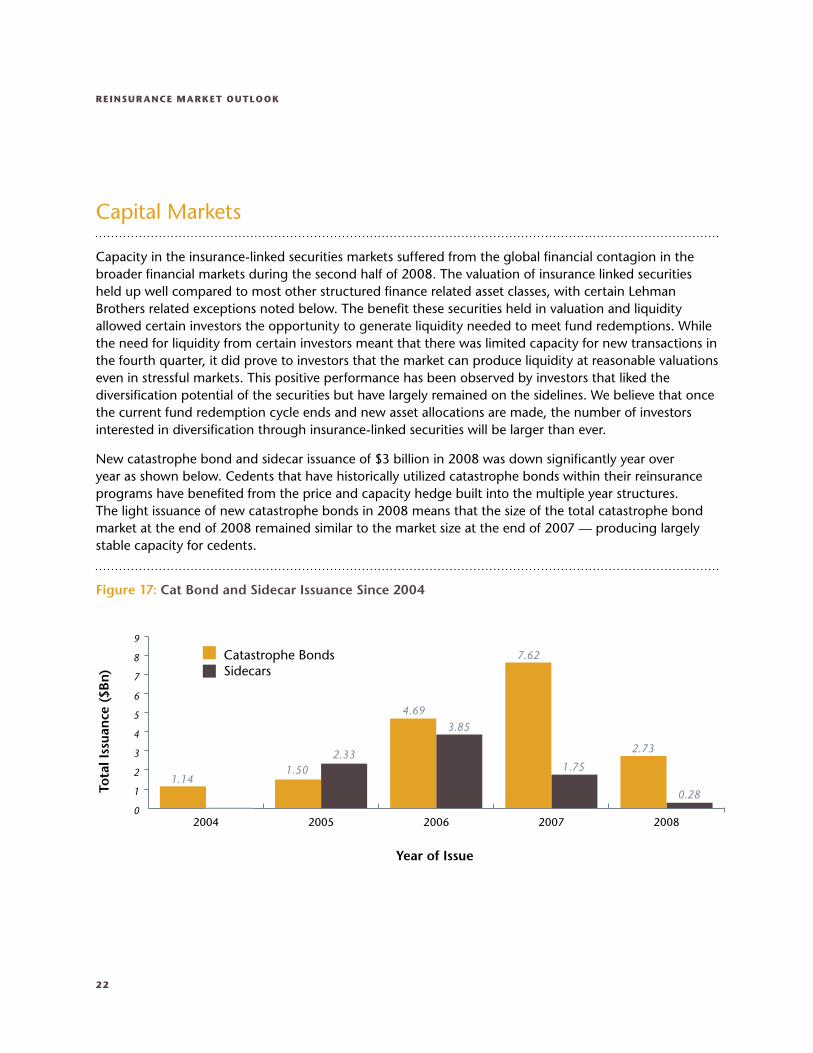
New catastrophe bond and sidecar issuance of $3 billion in 2008 was down significantly year over year as shown below. Cedents that have historically utilized catastrophe bonds within their reinsurance programs have benefited from the price and capacity hedge built into the multiple year structures. The light issuance of new catastrophe bonds in 2008 means that the size of the total catastrophe bond market at the end of 2008 remained similar to the market size at the end of 2007 — producing largely stable capacity for cedents.
Tota
l Iss
uan
ce (
$Bn)
Year of Issue
1.141.50
2.33
4.693.85
7.62
1.75
2.73
0.28
Catastrophe BondsSidecars
0
1
2
3
4
5
6
7
8
9
20082007200620052004
Figure 17: Cat Bond and Sidecar Issuance Since 2004
Aon Benfield
23
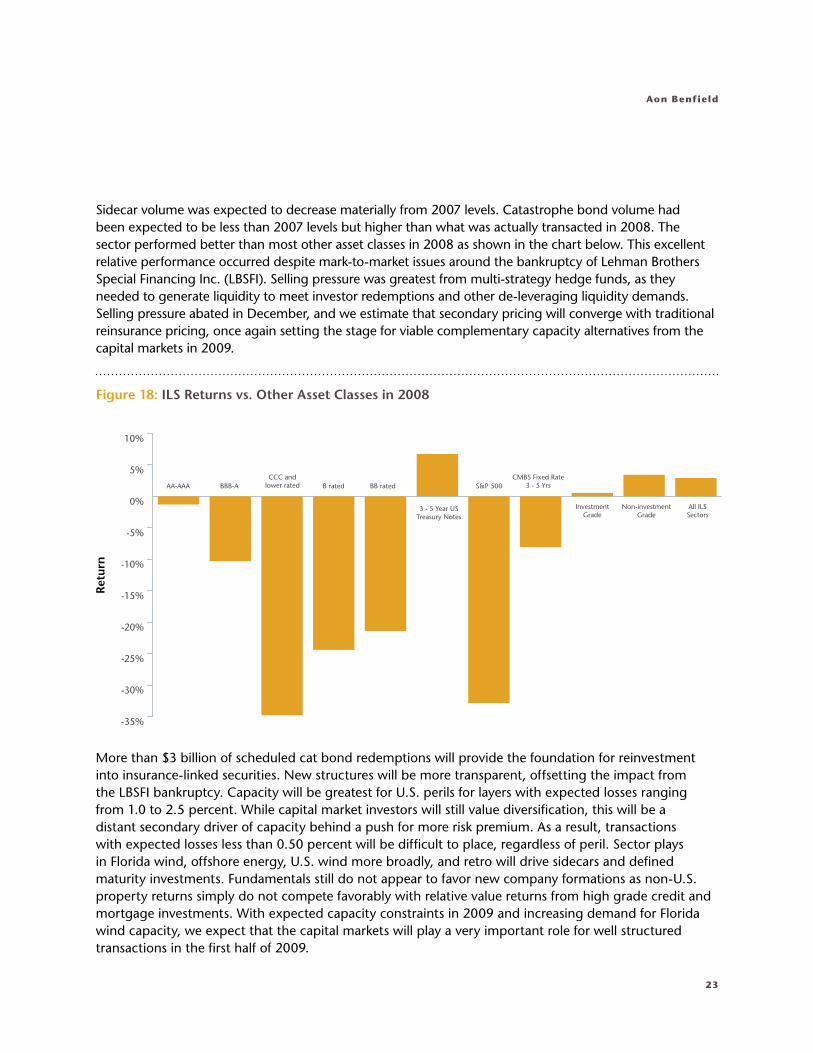
Sidecar volume was expected to decrease materially from 2007 levels. Catastrophe bond volume had been expected to be less than 2007 levels but higher than what was actually transacted in 2008. The sector performed better than most other asset classes in 2008 as shown in the chart below. This excellent relative performance occurred despite mark-to-market issues around the bankruptcy of Lehman Brothers Special Financing Inc. (LBSFI). Selling pressure was greatest from multi-strategy hedge funds, as they needed to generate liquidity to meet investor redemptions and other de-leveraging liquidity demands. Selling pressure abated in December, and we estimate that secondary pricing will converge with traditional reinsurance pricing, once again setting the stage for viable complementary capacity alternatives from the capital markets in 2009.
More than $3 billion of scheduled cat bond redemptions will provide the foundation for reinvestment into insurance-linked securities. New structures will be more transparent, offsetting the impact from the LBSFI bankruptcy. Capacity will be greatest for U.S. perils for layers with expected losses ranging from 1.0 to 2.5 percent. While capital market investors will still value diversification, this will be a distant secondary driver of capacity behind a push for more risk premium. As a result, transactions with expected losses less than 0.50 percent will be difficult to place, regardless of peril. Sector plays in Florida wind, offshore energy, U.S. wind more broadly, and retro will drive sidecars and defined maturity investments. Fundamentals still do not appear to favor new company formations as non-U.S. property returns simply do not compete favorably with relative value returns from high grade credit and mortgage investments. With expected capacity constraints in 2009 and increasing demand for Florida wind capacity, we expect that the capital markets will play a very important role for well structured transactions in the first half of 2009.
AA-AAA BBB-ACCC and
lower rated B rated BB rated S&P 500CMBS Fixed Rate
3 - 5 Yrs
InvestmentGrade
Non-investmentGrade
All ILSSectors
3 - 5 Year USTreasury Notes
Ret
urn
-35%
-30%
-25%
-20%
-15%
-10%
-5%
0%
5%
10%
Figure 18: ILS Returns vs. Other Asset Classes in 2008
ReinsuRAnce MARket OutLOOk
24
U.S. Treasury TARP Funds
By 2008, several banks had entered the reinsurance and insurance-linked securities market using their own balance sheets to take or warehouse risk. Some also provided low cost debt financing to sidecars and other providers of collateralized reinsurance.
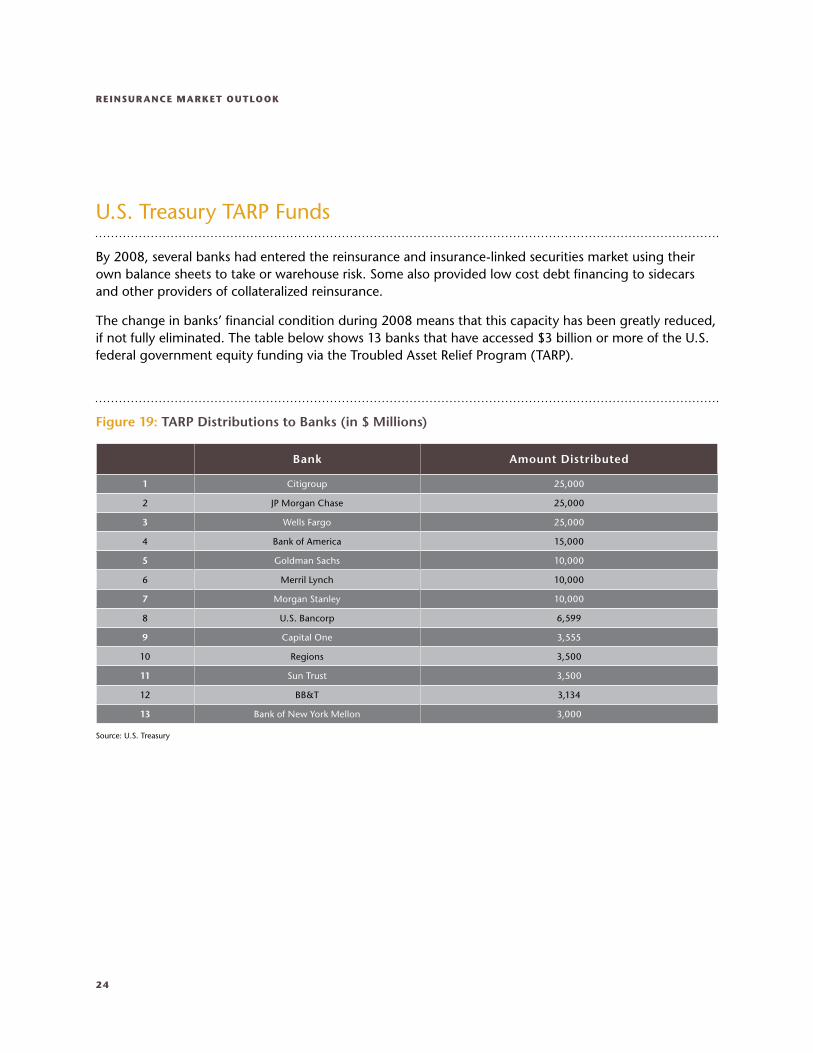
The change in banks’ financial condition during 2008 means that this capacity has been greatly reduced, if not fully eliminated. The table below shows 13 banks that have accessed $3 billion or more of the U.S. federal government equity funding via the Troubled Asset Relief Program (TARP).
Bank Amount Distributed
1 Citigroup 25,000
2 JP Morgan Chase 25,000
3 Wells Fargo 25,000
4 Bank of America 15,000
5 Goldman Sachs 10,000
6 Merril Lynch 10,000
7 Morgan Stanley 10,000
8 U.S. Bancorp 6,599
9 Capital One 3,555
10 Regions 3,500
11 Sun Trust 3,500
12 BB&T 3,134
13 Bank of New York Mellon 3,000
Figure 19: TARP Distributions to Banks (in $ Millions)
Source: U.S. Treasury
Aon Benfield
25
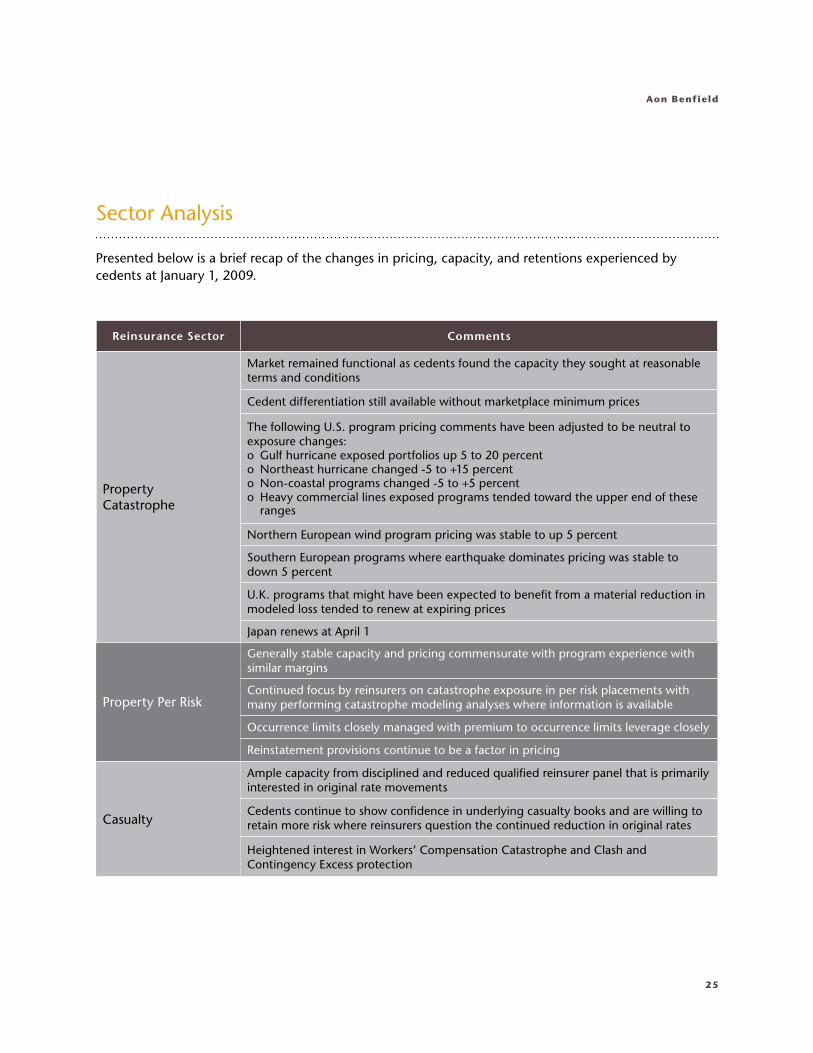
Sector Analysis
Presented below is a brief recap of the changes in pricing, capacity, and retentions experienced by cedents at January 1, 2009.
Reinsurance Sector Comments
PropertyCatastrophe
Market remained functional as cedents found the capacity they sought at reasonable terms and conditions
Cedent differentiation still available without marketplace minimum prices
The following U.S. program pricing comments have been adjusted to be neutral to exposure changes:o Gulf hurricane exposed portfolios up 5 to 20 percento Northeast hurricane changed -5 to +15 percento Non-coastal programs changed -5 to +5 percento Heavy commercial lines exposed programs tended toward the upper end of these
ranges
Northern European wind program pricing was stable to up 5 percent
Southern European programs where earthquake dominates pricing was stable to down 5 percent
U.K. programs that might have been expected to benefit from a material reduction in modeled loss tended to renew at expiring prices
Japan renews at April 1
Property Per Risk
Generally stable capacity and pricing commensurate with program experience with similar margins
Continued focus by reinsurers on catastrophe exposure in per risk placements with many performing catastrophe modeling analyses where information is available
Occurrence limits closely managed with premium to occurrence limits leverage closely
Reinstatement provisions continue to be a factor in pricing
Casualty
Ample capacity from disciplined and reduced qualified reinsurer panel that is primarily interested in original rate movements
Cedents continue to show confidence in underlying casualty books and are willing to retain more risk where reinsurers question the continued reduction in original rates
Heightened interest in Workers’ Compensation Catastrophe and Clash and Contingency Excess protection
ReinsuRAnce MARket OutLOOk
26
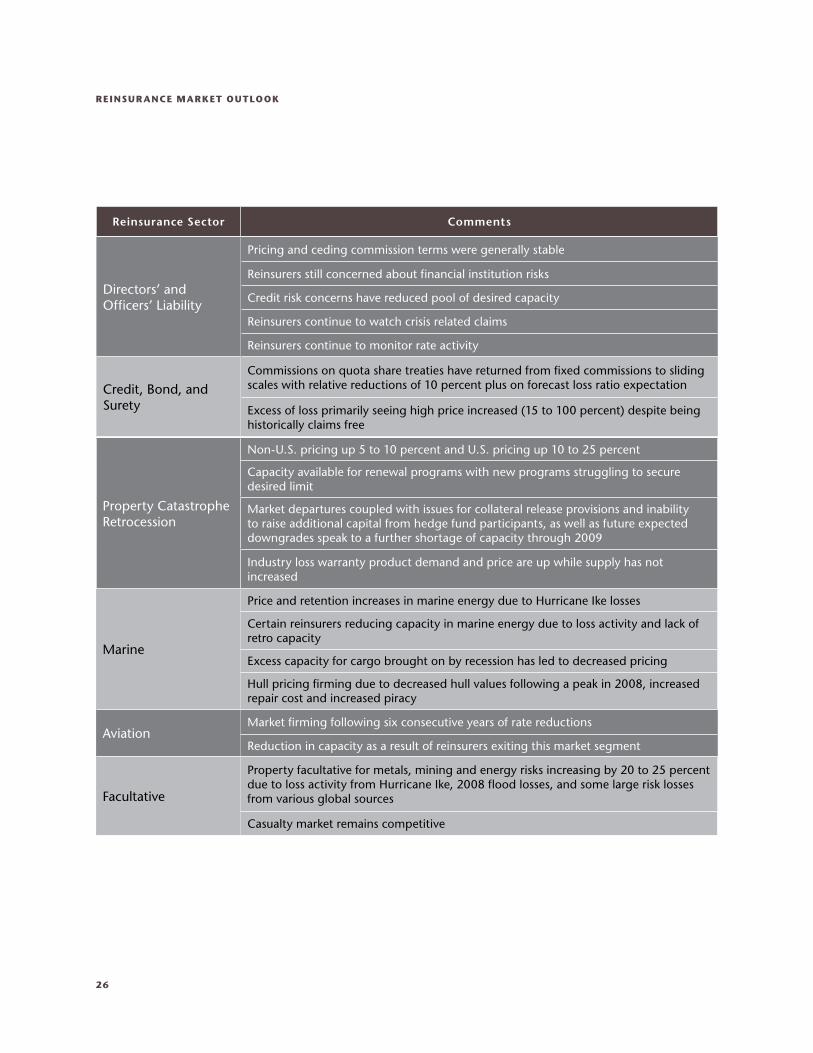
Reinsurance Sector Comments
Directors’ andOfficers’ Liability
Pricing and ceding commission terms were generally stable
Reinsurers still concerned about financial institution risks
Credit risk concerns have reduced pool of desired capacity
Reinsurers continue to watch crisis related claims
Reinsurers continue to monitor rate activity
Credit, Bond, andSurety
Commissions on quota share treaties have returned from fixed commissions to sliding scales with relative reductions of 10 percent plus on forecast loss ratio expectation
Excess of loss primarily seeing high price increased (15 to 100 percent) despite being historically claims free
Property Catastrophe Retrocession
Non-U.S. pricing up 5 to 10 percent and U.S. pricing up 10 to 25 percent
Capacity available for renewal programs with new programs struggling to secure desired limit
Market departures coupled with issues for collateral release provisions and inability to raise additional capital from hedge fund participants, as well as future expected downgrades speak to a further shortage of capacity through 2009
Industry loss warranty product demand and price are up while supply has not increased
Marine
Price and retention increases in marine energy due to Hurricane Ike losses
Certain reinsurers reducing capacity in marine energy due to loss activity and lack of retro capacity
Excess capacity for cargo brought on by recession has led to decreased pricing
Hull pricing firming due to decreased hull values following a peak in 2008, increased repair cost and increased piracy
Aviation Market firming following six consecutive years of rate reductions
Reduction in capacity as a result of reinsurers exiting this market segment
Facultative
Property facultative for metals, mining and energy risks increasing by 20 to 25 percent due to loss activity from Hurricane Ike, 2008 flood losses, and some large risk losses from various global sources
Casualty market remains competitive

27
Aon Benfield: Unique Forward Looking Insights for Clients
Aon Benfield believes it delivers more value to insurers by identifying changes to the reinsurance markets in advance of key industry renewal dates rather than merely reporting on the varied results of actual renewals following key renewal dates. We work with each of our clients to help them understand how these global market factors will affect their property catastrophe reinsurance renewal. Factors such as insurer underwriting methods, data quality, capacity required, experience, and current modeled margin levels can combine to create a better or worse outcome.
About Aon Benfield
Aon Benfield is the world’s premier insurance risk and capital management advisory firm serving the insurance and reinsurance industry. Formed through the December 2008 merger between Aon Re Global and Benfield, this combination brings together the best in our industry to create the destination of choice for clients. Aon Benfield operates through an international network of offices spanning 50 countries and more than 4,000 professionals. Clients of all sizes and in all locations can access the broadest portfolio of integrated capital solutions and services, world-class talent, and unparalleled global reach with local expertise. Additional information can be found at www.aonbenfield.com.
Copyright Aon Re Global, Inc. and Benfield Inc. dba Aon Benfield | Aon Re Global, Inc. and Benfield Inc. are wholly owned subsidiaries of Aon Corporation.
This document is intended for general information purposes only and should not be construed as advice or opinions on any specific facts or circumstances. The analysis
and comments in this paper are based upon Aon Benfield’s general observations of reinsurance market conditions as of January 2009. Forward looking statements are
based on existing conditions in the marketplace which are always subject to change, therefore, actual future market conditions may be materially different from the
opinions expressed in this paper. The content of this document is made available on an “as is” basis, without warranty of any kind. Aon Benfield disclaims any legal liability
to any person or organization for loss or damage caused by or resulting from any reliance placed on that content. Aon Benfield reserves all rights to the content of this
document. Members of the Aon Benfield Analytics Team will be pleased to consult on any specific situations and to provide further information regarding the matters
discussed herein.

200 East Randolph Street, Chicago, IL 60601 t: +1.312.381.5300 | f: +1.312.381.0160 | www.aonbenfield.com