Embed Size (px)
Citation preview
Reinventing Michigan:Investing in our Future
SAAABAApril 18, 2012
Presented by: Phillip Jeffery
Chief Deputy Director, DTMB
Today’s roadmap
• Summary of Accomplishments• Where we are Today• FY 2013 Budget Principles• FY 2013 Strategic Investments• Questions
2
FY 2012 Accomplishments
• Structurally Balanced Budget – $1.5 B perpetual deficit eliminated
• New predictable & stable tax system that is simple, fair & efficient
• Made first deposit of $255 M into the Budget Stabilization Fund since 2004
Fiscal Order Restored
3
FY 2012 AccomplishmentsFiscal Order Restored
• Added $280 M to fully fund actuarial required contributions for post retirement benefits
• OPEB legislation caps long-term post retirement healthcare liabilities• Immediately reduces states $14.7 B unfunded liability
by over $5 B • Protects current employees • Incentives for new employees to save for post
retirement healthcare needs – 2% match for 401K
Addressed Long-term Liabilities
4
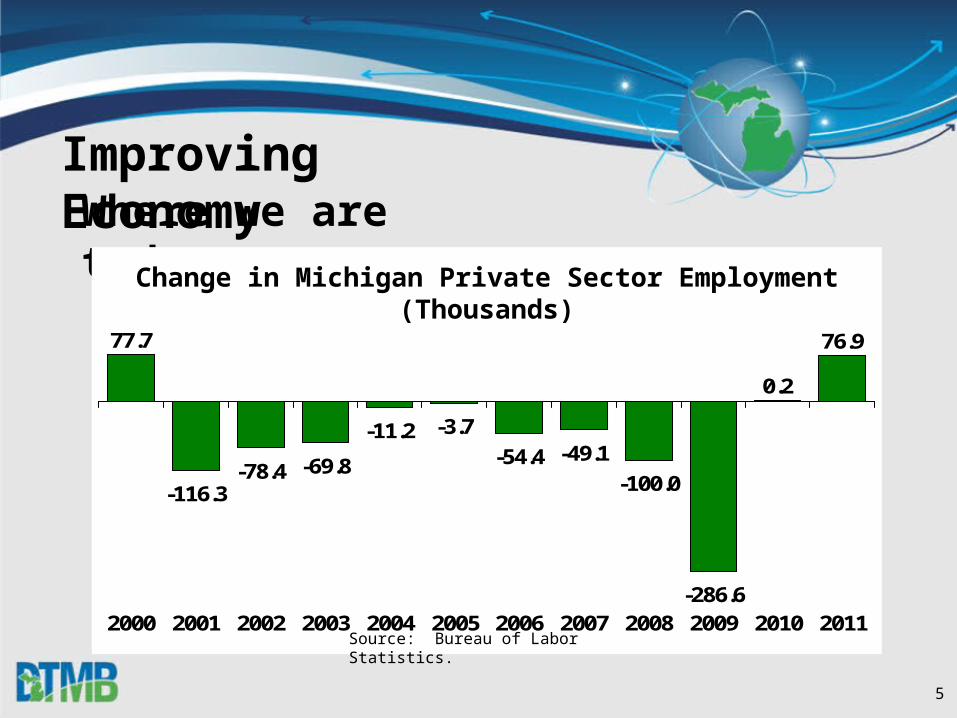
Improving EconomyWhere we are today
Change in Michigan Private Sector Employment(Thousands)
77.7
-116.3-78.4 -69.8
-11.2 -3.7
-54.4 -49.1
-100.0
-286.6
0.2
76.9
2000 2001 2002 2003 2004 2005 2006 2007 2008 2009 2010 2011Source: Bureau of Labor Statistics.
5
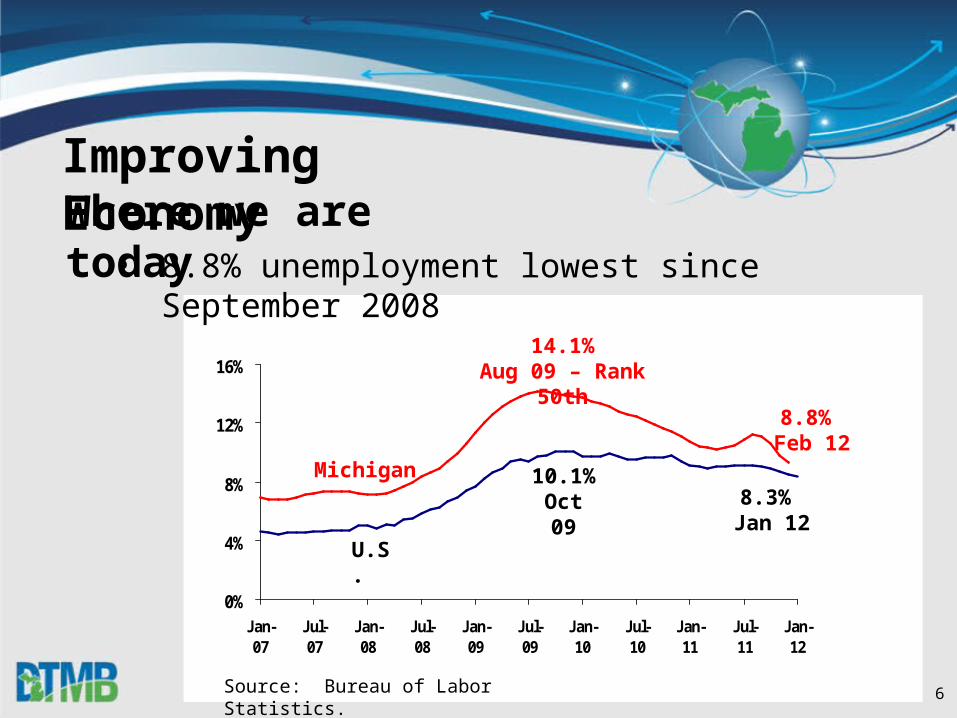
Improving EconomyWhere we are today
0%
4%
8%
12%
16%
Jan-07
Jul-07
Jan-08
Jul-08
Jan-09
Jul-09
Jan-10
Jul-10
Jan-11
Jul-11
Jan-12
8.3% Jan 12
8.8% Feb 12
Source: Bureau of Labor Statistics.
14.1%Aug 09 – Rank 50th
10.1%Oct 09
Michigan
U.S.
• 8.8% unemployment lowest since September 2008
6
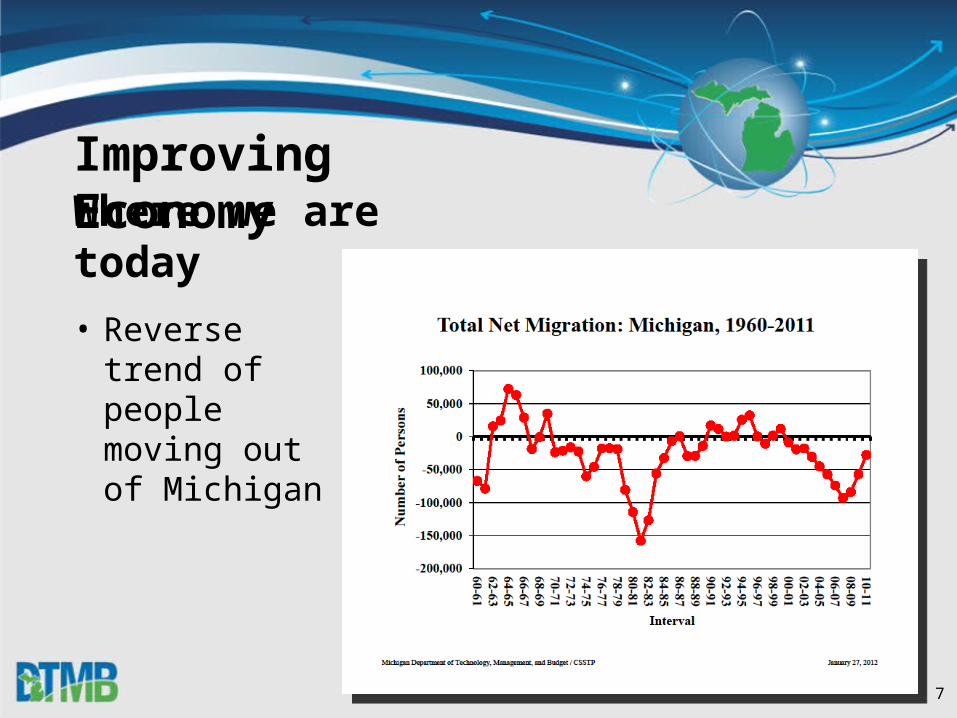
Improving Economy
• Reverse trend of people moving out of Michigan
Where we are today
7
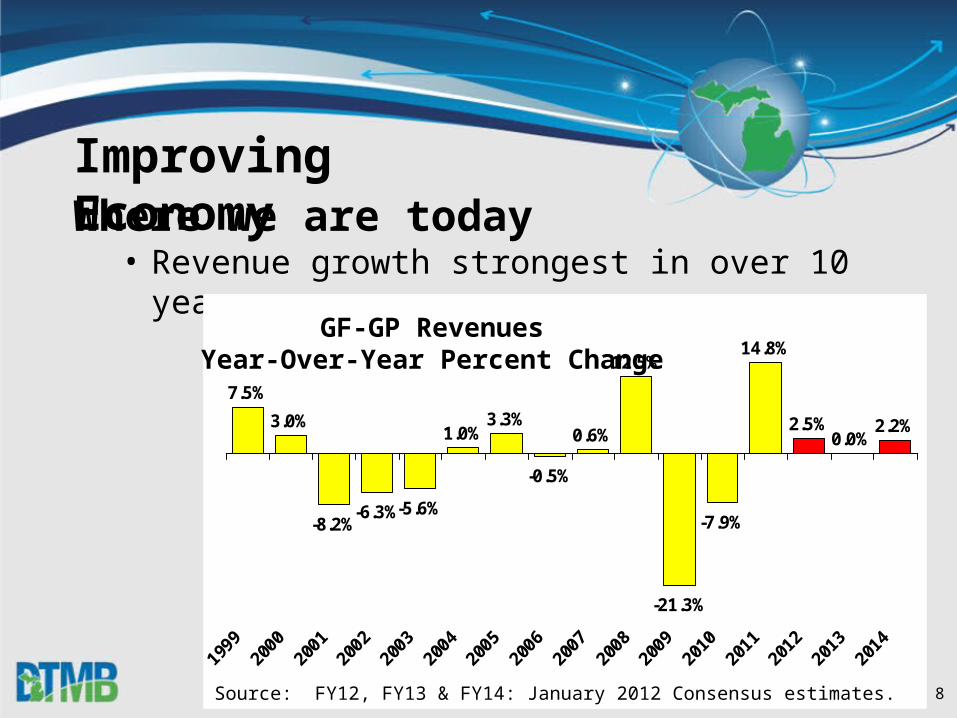
Improving EconomyWhere we are today
• Revenue growth strongest in over 10 years
7.5%
3.0%
-8.2%-6.3%-5.6%
1.0%3.3%
-0.5%
0.6%
12.5%
-21.3%
-7.9%
14.8%
2.5%0.0%
2.2%
Source: FY12, FY13 & FY14: January 2012 Consensus estimates.
GF-GP RevenuesYear-Over-Year Percent Change
8
FY 2013 Budget Principles
• Maintain Structural Balance• Separate ongoing & one-time money• No one-time money in the base budget• Protect education & stabilize state agency budgets• Invest in critical infrastructure, economic
development & public safety needs• Meet the needs of the most vulnerable among us by
investing in important safety net programs• Save for the future
9
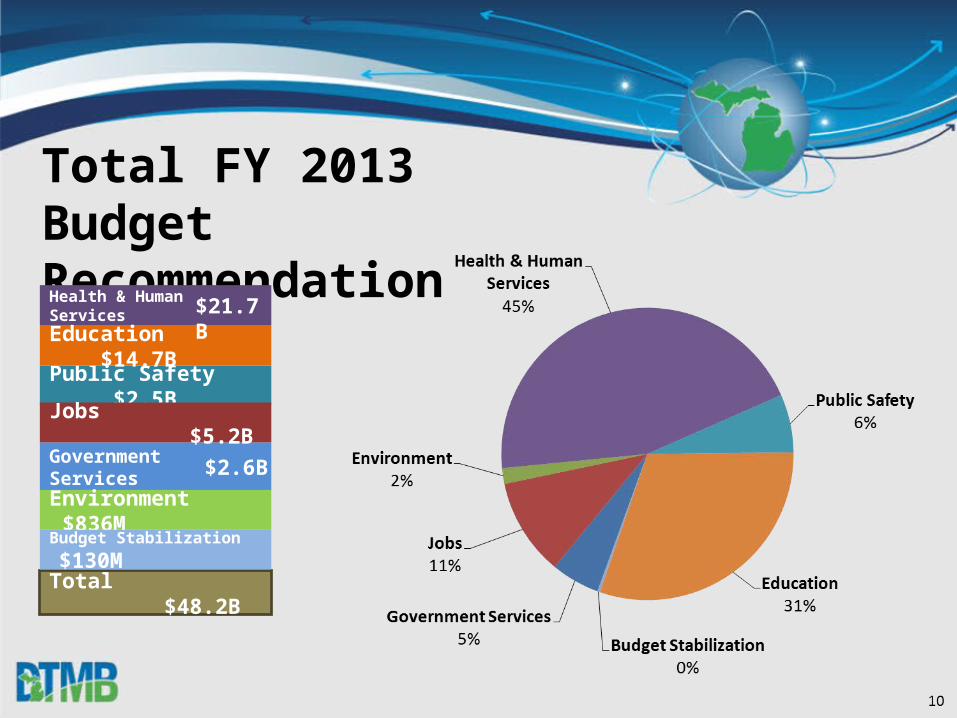
Total FY 2013 Budget Recommendation
Health & Human Services
Public Safety $2.5B
Total $48.2B
Government Services
Jobs $5.2B
Environment $836M
Education $14.7B
Budget Stabilization $130M
$21.7B
$2.6B
• $195 M gross ($120 M general fund) – continue providing assistance to Michigan businesses• $100 M – business attraction & economic gardening
– moved to ongoing funding• $25 M ongoing – Pure Michigan• $25 M ongoing – innovation & entrepreneurship• $15 M ongoing – support long-term unemployed • $5 M ongoing – arts & cultural grants
2013 Strategic InvestmentsJob # 1 is Jobs – MEDC
11
2013 Strategic Investments
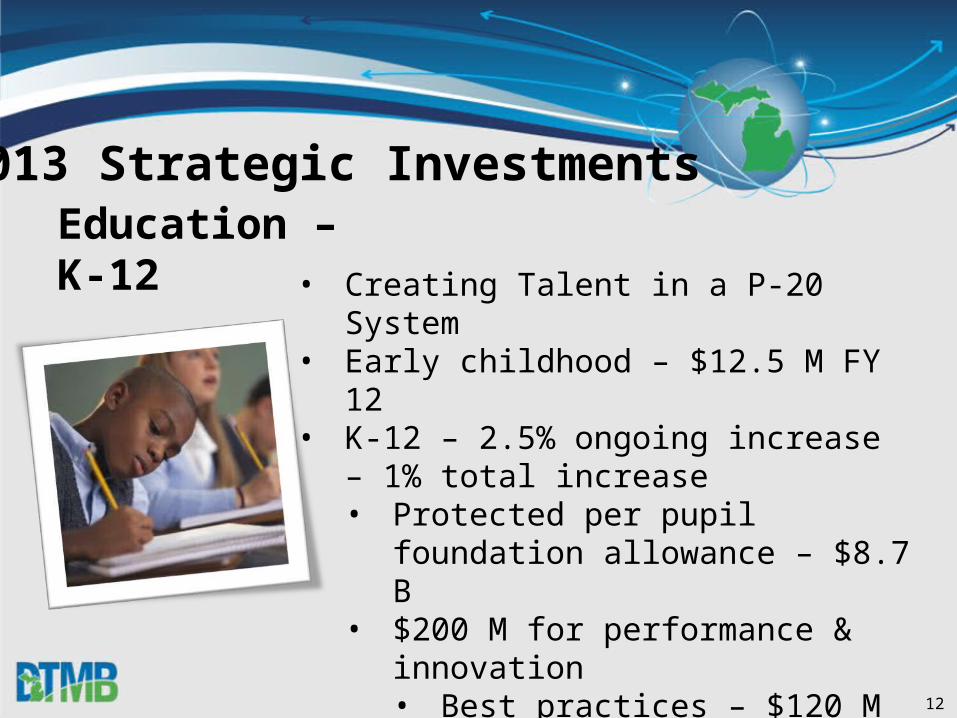
• Creating Talent in a P-20 System • Early childhood – $12.5 M FY 12• K-12 – 2.5% ongoing increase – 1% total
increase• Protected per pupil foundation
allowance – $8.7 B• $200 M for performance & innovation
• Best practices – $120 M• Student growth – $70 M• Consolidation Grants – $10 M
• Long term liabilities – $179 M
Education – K-12
12
• Increased funding for higher education institutions by 3% ($36.2 M general fund) tied to new formula based on 4 criteria:
1. Growth in number of undergraduate degrees2. Undergraduate completions in critical skills areas3. Undergraduate Pell Grant recipients4. Compliance with tuition restraint
• Recommends 9 university capital outlay projects for construction – ($500 M total – $250 M state share)
2013 Strategic InvestmentsEducation – Higher Ed
13
• Increased funding for Community Colleges by 3% ($8.5 M) • Distributed based on the
number of certificate & associate degree completions in critical skills areas
• Recommends 9 capital outlay projects for construction ($110 M total – $53 M state share)
2013 Strategic InvestmentsEducation – Community Colleges
14
• Additional $43.1 M in general fund – 16% increase• Regional Policing Plan for mobile policing• Staffing in Forensic Sciences – reduce processing
time for forensic tests for criminal investigations – $3.1 M
• Replace critical equipment – $2.7 M• Two Trooper recruit schools – graduate 180
troopers – $15 M
2013 Strategic InvestmentsPublic Safety – Michigan State Police
15
• $257 M ($87 M general fund) for caseload & utilization growth
• $34 M ($10 M general fund) – provide autism coverage for children eligible for Medicaid or the MiChild program
• $25 M ($8.4 M general fund) – Healthy Kids Dental program phased-in expansion
• $7.5 M ($3.4 M general fund) to expand MI Choice waiver
• $6 M general fund for health & wellness initiatives
2013 Strategic InvestmentsSafety Net – Community Health
16
• $11.3 M ($6.3 M general fund) – increase basic rate for foster parents by $3 per day
• $60 M in restricted funds for home heating assistance for the vulnerable
2013 Strategic InvestmentsSafety Net – Human Services
17
• Agriculture – $1.5 M – food safety• Judiciary – $1 M – Mental Health Courts• Natural Resources
• $5 M – Summer Youth Program – teens in Flint, Detroit, Pontiac & Saginaw
• Dam Safety Program – $2.5 M
2013 Strategic InvestmentsOther Government
18
• $119 M – one-time general fund appropriation ($3.3 B gross funding)• Allows state to maximize
matching federal aid• Allows time for the
legislature to develop long-term road & transit funding solution
2013 Strategic InvestmentsInfrastructure – Transportation
19
• $10 M increase for environmental clean-ups – restricted refined petroleum fund
• $5 M additional general fund – state match to obtain federal grant dollars for drinking water revolving fund
2013 Strategic InvestmentsInfrastructure – Environmental Resources
20
• No longer deferring maintenance costs for state facilities
• Preserves critical physical assets – prisons, hospitals & office buildings• State Building Maintenance –
$25 M total• Armory Maintenance – $4.8 M
total• Restacking $7 M
2013 Strategic InvestmentsInfrastructure – Maintenance
21
Restacking GoalBetter utilize space assets used by state agencies1. Maximize state-owned space – filling vacant space
resulting from State’s retirement incentive & attrition2. Increase the capacity of state-owned & leased facilities
– align the size of each workstation to private industry standards
3. Enhance use of workspace through technology & shared workstations – examine the space and business needs of each worker during workspace design
4. Improve agency efficiency through co-location within and across departments
10
22
Proposed Restacking PlanStandardization
• Review the balance of individual vs. common space
• Move toward industry standards • Reduce number of standard sizes• Review the functional need for
floor-to-ceiling offices• Phase in as agencies move to cause minimum disruption
& expense• Overall goal – 225 sq. ft. per employee space utilization
(including common areas)23
Proposed Restacking PlanBenefits of Standardization• Standards based on private industry practices would:
• Utilize shared meeting spaces & more innovative design concepts
• Significantly reduce time & labor cost by minimizing reconfiguration between tenants
• Increase building capacity by as much as 30%• Potential overall reduction of 1.5 M sq. ft. of office
space
24

Restacking PlanNext Steps
• Budget request submitted for $7 M for first building:• First priority - Constitution Hall - due to significant
vacancy• Continue working with
partner agencies to establish correct standards & determine individual space needs
• Beginning space planning to meet agency requirements
25
Restacking PlanNext Steps
• Savings will result from “Domino Affect”• Work to place agencies together for efficiency in
operations• Reduce lease space once agency placement is
strategically decided• ROI will begin between 12 – 18 months - depending on
agency placement• Payback in 3 – 5 years
26
• $50 M – ongoing funding to address highest need areas based on a formal risk assessment
• Technology is the backbone for more efficient & effective government services• Long term savings• Improved efficiency • Improved customer services • Increased usage rate
2013 Strategic InvestmentsInfrastructure – Information Technology
27
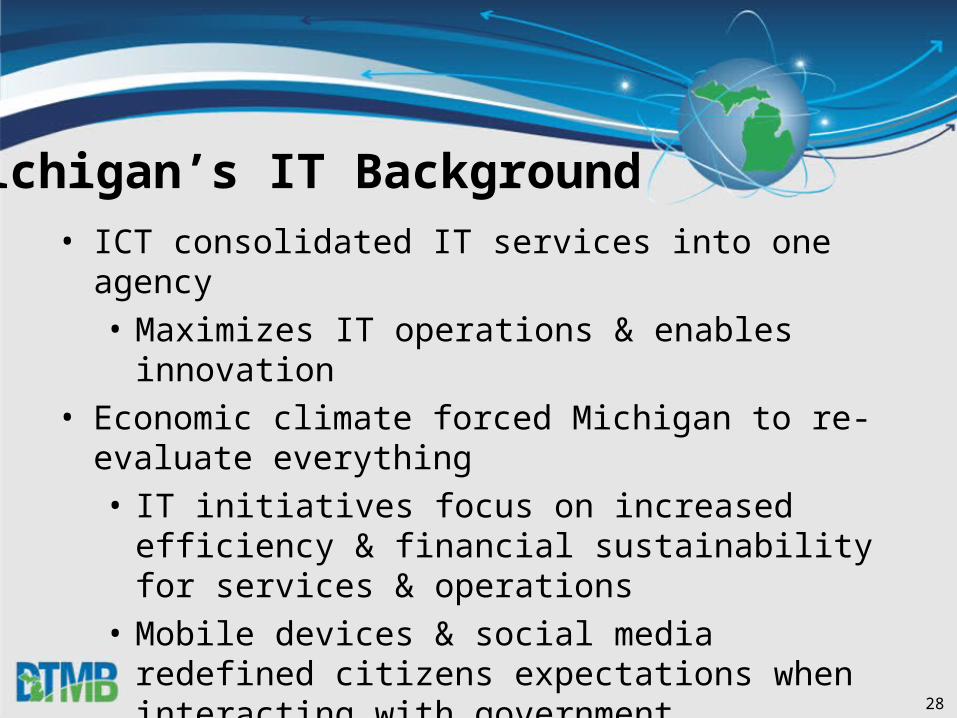
• ICT consolidated IT services into one agency• Maximizes IT operations & enables innovation
• Economic climate forced Michigan to re-evaluate everything• IT initiatives focus on increased efficiency & financial
sustainability for services & operations• Mobile devices & social media redefined citizens
expectations when interacting with government• Engaged Gartner for IT Assessment to identify areas of
improvement, untapped opportunities & others means to become more efficient & effective
Michigan’s IT Background
28
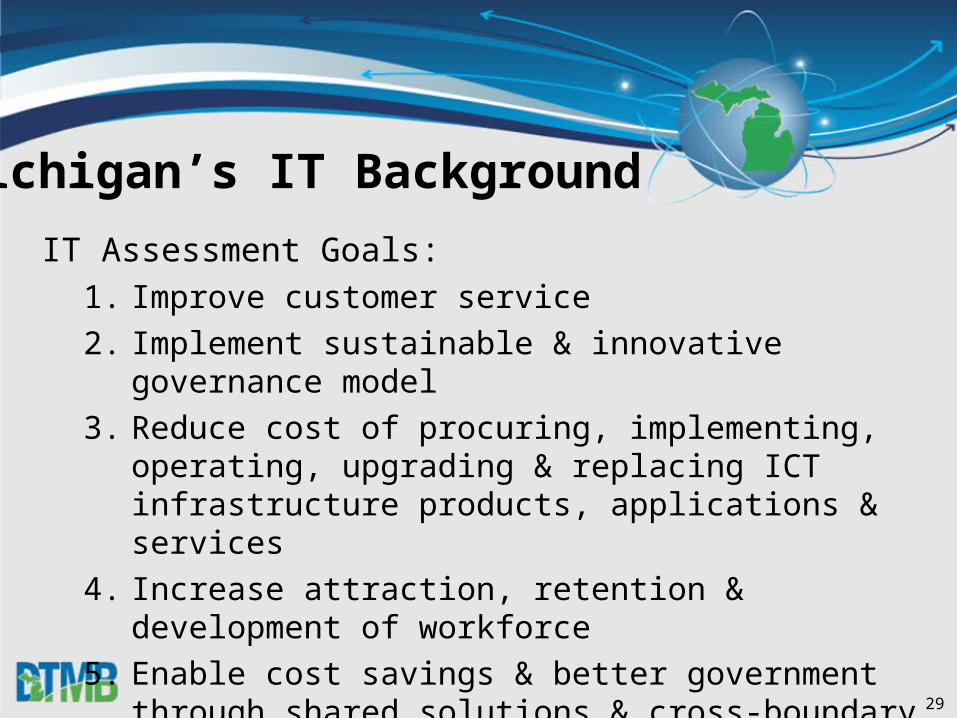
IT Assessment Goals:1. Improve customer service2. Implement sustainable & innovative governance model3. Reduce cost of procuring, implementing, operating, upgrading
& replacing ICT infrastructure products, applications & services
4. Increase attraction, retention & development of workforce5. Enable cost savings & better government through shared
solutions & cross-boundary partnerships6. Implement best-practice ICT solutions & technologies
Michigan’s IT Background
29
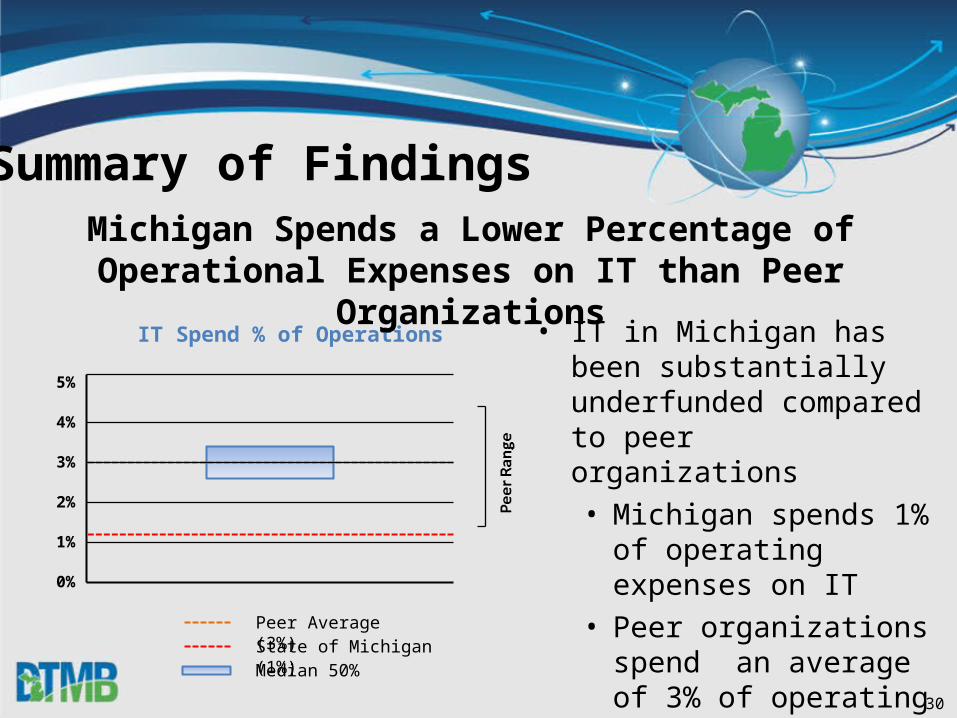
• IT in Michigan has been substantially underfunded compared to peer organizations• Michigan spends 1% of
operating expenses on IT• Peer organizations spend
an average of 3% of operating expenses on IT
IT Spend % of Operations
0%
Peer Average (3%)State of Michigan (1%)Median 50%
1%
2%
3%
4%
5%
Summary of FindingsMichigan Spends a Lower Percentage of Operational
Expenses on IT than Peer Organizations
30
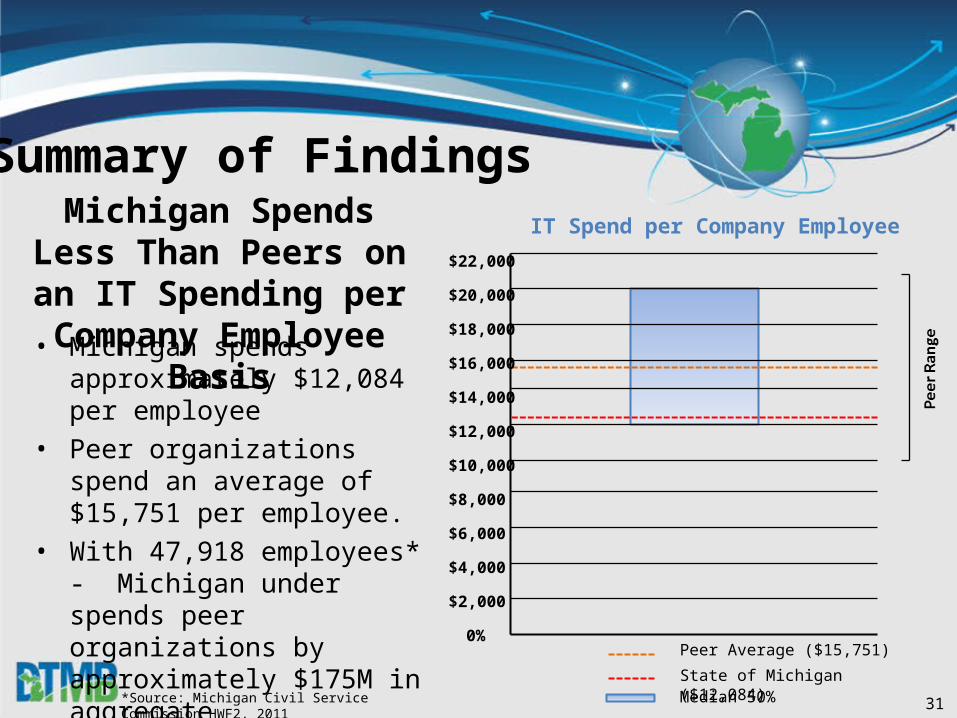
• Michigan spends approximately $12,084 per employee
• Peer organizations spend an average of $15,751 per employee.
• With 47,918 employees* - Michigan under spends peer organizations by approximately $175M in aggregate
IT Spend per Company Employee
0%Peer Average ($15,751)
State of Michigan ($12,084)Median 50%
$2,000
$4,000
$6,000
$8,000
$10,000
$12,000
$14,000
$16,000
$18,000
$20,000
$22,000
Summary of FindingsMichigan Spends Less Than Peers on an IT Spending per
Company Employee Basis
*Source: Michigan Civil Service Commission HWF2, 2011 31
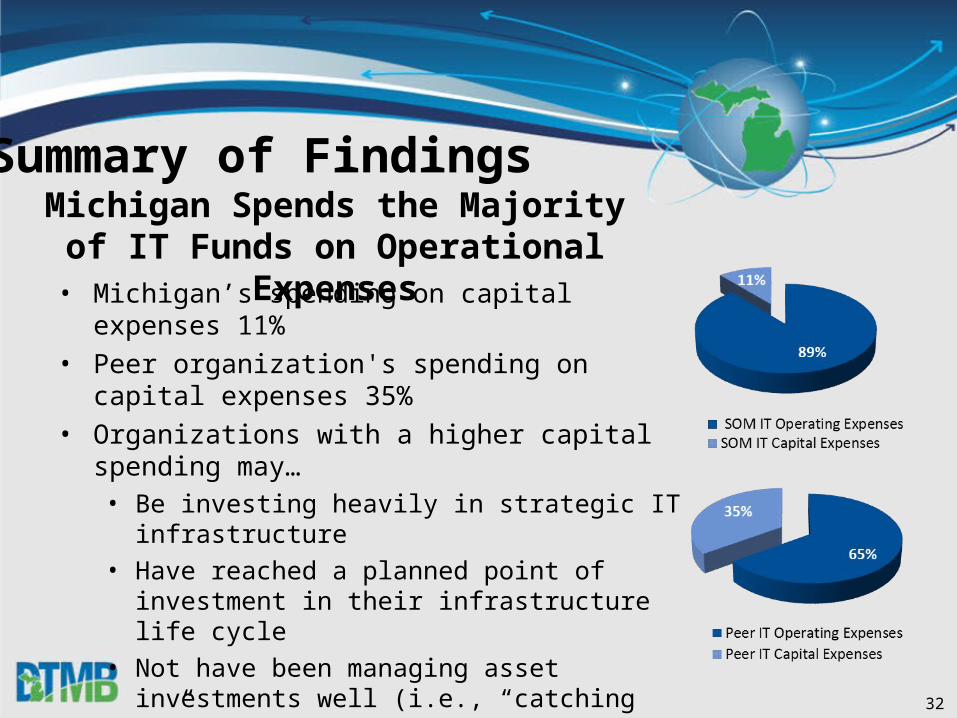
• Michigan’s spending on capital expenses 11% • Peer organization's spending on capital expenses 35%• Organizations with a higher capital spending may…
• Be investing heavily in strategic IT infrastructure• Have reached a planned point of investment in their
infrastructure life cycle• Not have been managing asset investments well (i.e.,
“catching up”)• Simply have a more aggressive capitalization policy
• Michigan is far below peer averages, which suggests the inverse of the scenarios listed above
Summary of FindingsMichigan Spends the Majority of IT
Funds on Operational Expenses
32
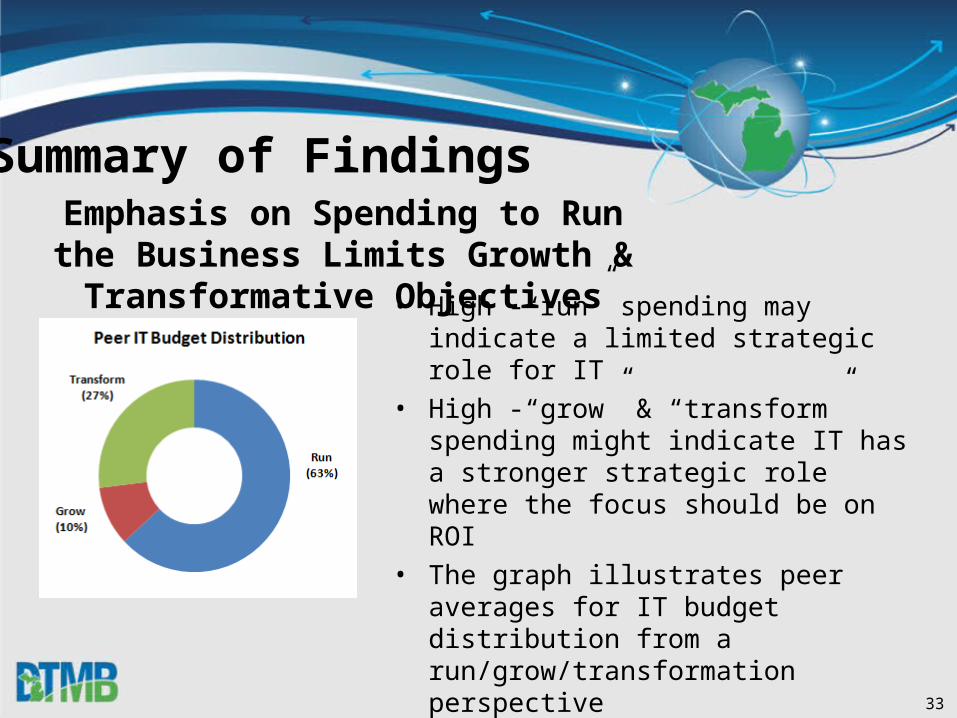
• High -“run” spending may indicate a limited strategic role for IT
• High -“grow” & “transform” spending might indicate IT has a stronger strategic role where the focus should be on ROI
• The graph illustrates peer averages for IT budget distribution from a run/grow/transformation perspective
• Michigan’s proportion of operational expenses, data suggests that current spending patterns limit growth & transformative efforts
Summary of FindingsEmphasis on Spending to Run the Business Limits Growth & Transformative Objectives
33
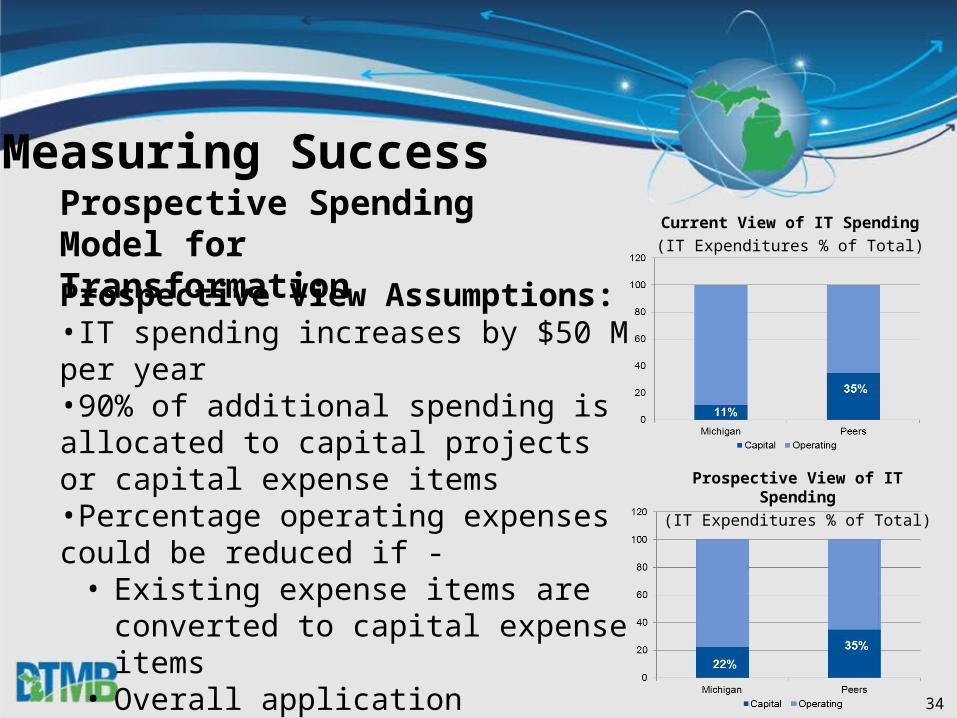
Prospective View Assumptions:•IT spending increases by $50 M per year•90% of additional spending is allocated to capital projects or capital expense items•Percentage operating expenses could be reduced if -
• Existing expense items are converted to capital expense items
• Overall application maintenance costs are reduced
Prospective View of IT Spending(IT Expenditures % of Total)
Current View of IT Spending(IT Expenditures % of Total)
Measuring SuccessProspective Spending Model for Transformation
34
• Deposit $130 M into the Budget Stabilization Fund
• Brings total at the end of FY 2013 to $388 M
• Total OPEB payment is $744 M gross – $367 M general fund
2013 Strategic InvestmentsSave for the Future
35
People are taking noteJuly 2011:
Fitch Ratings announced revisions to Michigan’s Rating Outlook for all bonds from Stable to Positive due to:•Continued evidence of a return to structural balanced budget•Continued progress toward re-building reserve funds•Continued employment recovery
36
People are taking noteNovember 2011:
Bloomberg Economic Evaluation of States (BEES)ranked Michigan 2nd best forecast for economic health in nation based on 6 key indicators:
1. Tax revenue2. Personal income3. Employment4. Home prices5. Mortgage foreclosures6. Stock performance of in-state companies
37
People are taking noteFebruary 2012:
Tax Foundation upgraded Michigan’s State Business Tax Climate Index from 49th to 7th in the nation. Tax Foundation measures this based on which states have the most neutral, simple & business-friendly tax structures.
According to Tax Foundation, it is clear the 2011 tax reforms are a “major improvement for Michigan’s business tax system.”
38
People are taking noteFebruary 2012:
Moody's Investors Service commented in it’s Weekly Credit Outlook that Governor Rick Snyder’s FY 2013 budget proposal is a “credit positive” for local governments & “a key turning point” for Michigan.
39
Thank you
Any Questions?
40