Embed Size (px)
Citation preview
Dr. Salim Hamed Hussein Sedimentology
1
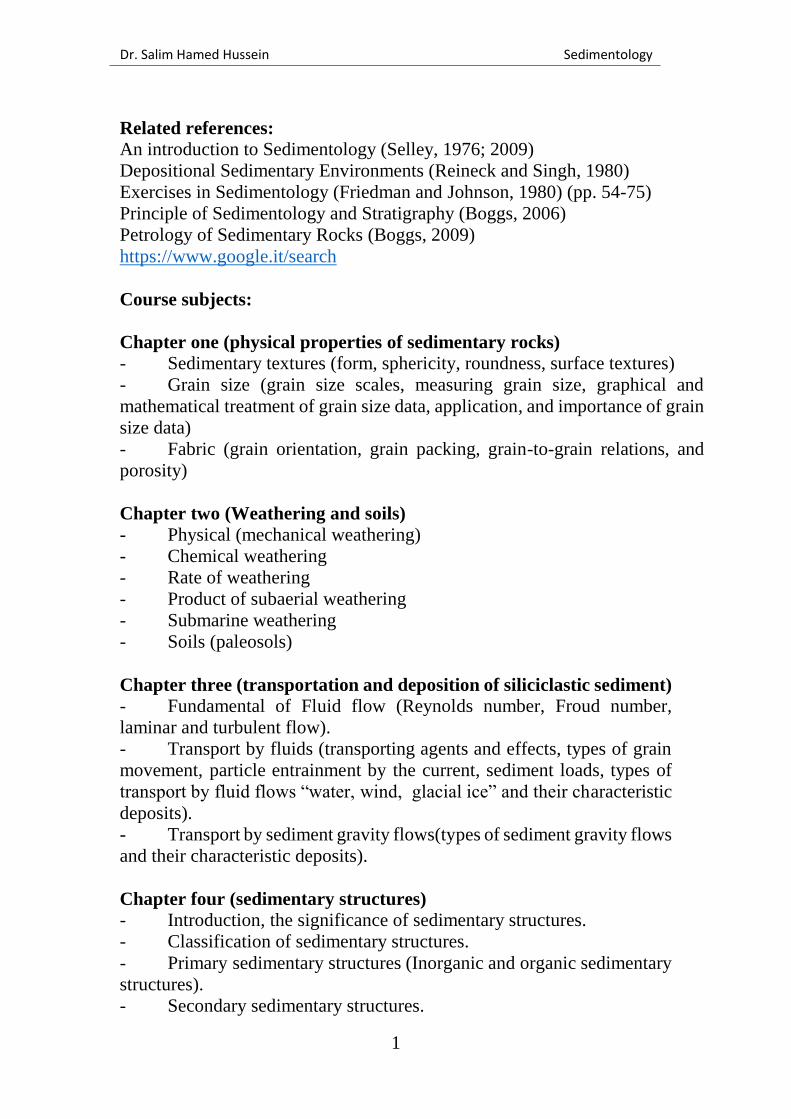
Related references:
An introduction to Sedimentology (Selley, 1976; 2009)
Depositional Sedimentary Environments (Reineck and Singh, 1980)
Exercises in Sedimentology (Friedman and Johnson, 1980) (pp. 54-75)
Principle of Sedimentology and Stratigraphy (Boggs, 2006)
Petrology of Sedimentary Rocks (Boggs, 2009)
https://www.google.it/search
Course subjects:
Chapter one (physical properties of sedimentary rocks)
- Sedimentary textures (form, sphericity, roundness, surface textures)
- Grain size (grain size scales, measuring grain size, graphical and
mathematical treatment of grain size data, application, and importance of grain
size data)
- Fabric (grain orientation, grain packing, grain-to-grain relations, and
porosity)
Chapter two (Weathering and soils)
- Physical (mechanical weathering)
- Chemical weathering
- Rate of weathering
- Product of subaerial weathering
- Submarine weathering
- Soils (paleosols)
Chapter three (transportation and deposition of siliciclastic sediment)
- Fundamental of Fluid flow (Reynolds number, Froud number,
laminar and turbulent flow).
- Transport by fluids (transporting agents and effects, types of grain
movement, particle entrainment by the current, sediment loads, types of
transport by fluid flows “water, wind, glacial ice” and their characteristic
deposits).
- Transport by sediment gravity flows(types of sediment gravity flows
and their characteristic deposits).
Chapter four (sedimentary structures)
- Introduction, the significance of sedimentary structures.
- Classification of sedimentary structures.
- Primary sedimentary structures (Inorganic and organic sedimentary
structures).
- Secondary sedimentary structures.
Dr. Salim Hamed Hussein Sedimentology
2
Chapter one (physical properties of sedimentary rocks)
Sedimentary texture: Sedimentary texture refers to the shape, size, and arrangement
(orientation) of the particles that make up a sedimentary rock. Sedimentary
texture encompasses three fundamental properties of sedimentary rocks:
grain shape, grain size, and fabric. The interrelationships of these
primary textural properties control other, derived, textural properties such
as bulk density, porosity, and permeability.
The textures of siliciclastic sedimentary rocks (conglomerates,
sandstones, siltstones, and claystones.) are produced primarily by physical
processes of sedimentation, whereas the textures of nonsiliciclastic
sedimentary rocks (such as rock salt, reef, and limestones) are caused
principally by chemical or biological sedimentation processes.
The characterization of textures can aid in interpreting depositional
environments and transport conditions.
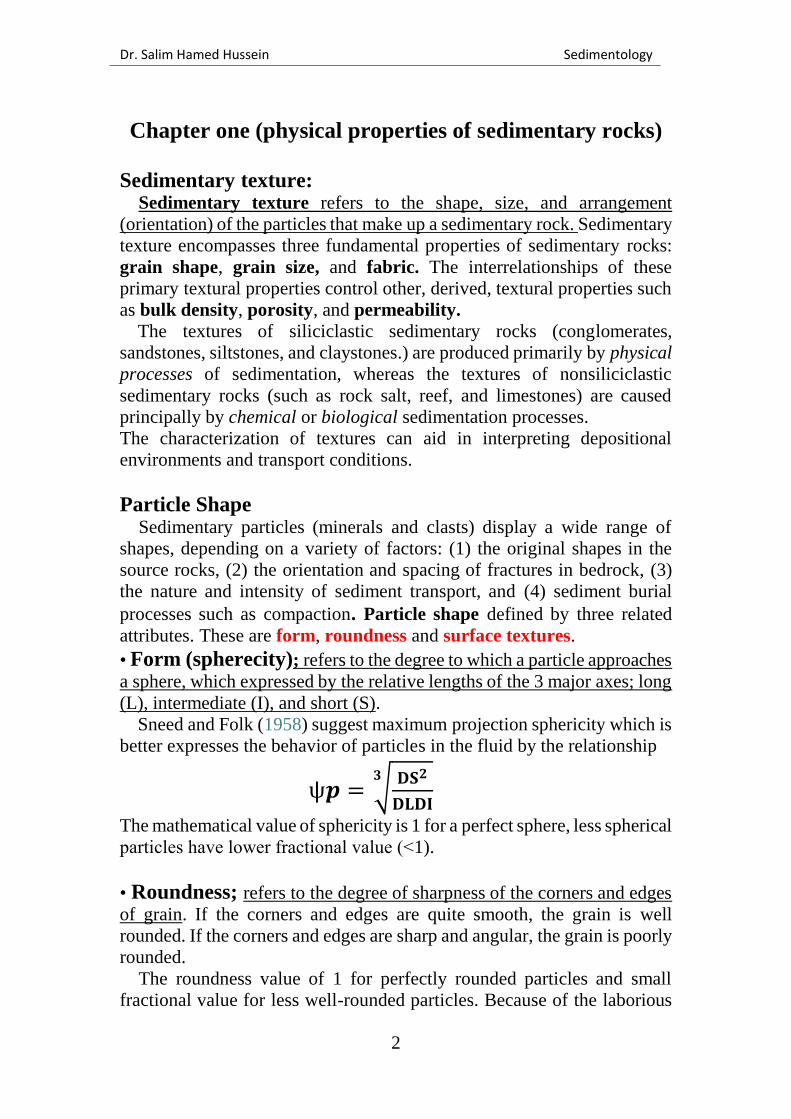
Particle Shape Sedimentary particles (minerals and clasts) display a wide range of
shapes, depending on a variety of factors: (1) the original shapes in the
source rocks, (2) the orientation and spacing of fractures in bedrock, (3)
the nature and intensity of sediment transport, and (4) sediment burial
processes such as compaction. Particle shape defined by three related
attributes. These are form, roundness and surface textures.
• Form (spherecity); refers to the degree to which a particle approaches
a sphere, which expressed by the relative lengths of the 3 major axes; long
(L), intermediate (I), and short (S).
Sneed and Folk (1958) suggest maximum projection sphericity which is
better expresses the behavior of particles in the fluid by the relationship
ѱ𝒑 = √ 𝐃𝐒𝟐
𝐃𝐋𝐃𝐈
𝟑
The mathematical value of sphericity is 1 for a perfect sphere, less spherical
particles have lower fractional value (˂1).
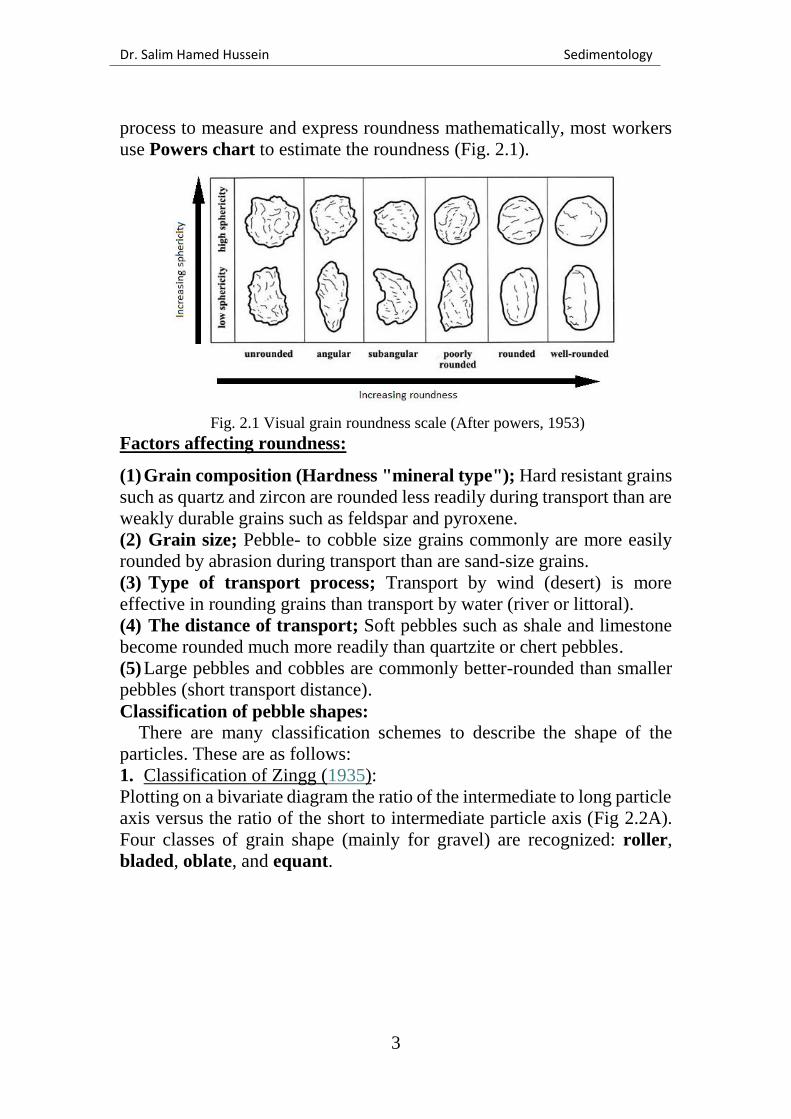
• Roundness; refers to the degree of sharpness of the corners and edges
of grain. If the corners and edges are quite smooth, the grain is well
rounded. If the corners and edges are sharp and angular, the grain is poorly
rounded.
The roundness value of 1 for perfectly rounded particles and small
fractional value for less well-rounded particles. Because of the laborious
Dr. Salim Hamed Hussein Sedimentology
3
process to measure and express roundness mathematically, most workers
use Powers chart to estimate the roundness (Fig. 2.1).
Fig. 2.1 Visual grain roundness scale (After powers, 1953)
Factors affecting roundness:
(1) Grain composition (Hardness "mineral type"); Hard resistant grains
such as quartz and zircon are rounded less readily during transport than are
weakly durable grains such as feldspar and pyroxene.
(2) Grain size; Pebble- to cobble size grains commonly are more easily
rounded by abrasion during transport than are sand-size grains.
(3) Type of transport process; Transport by wind (desert) is more
effective in rounding grains than transport by water (river or littoral).
(4) The distance of transport; Soft pebbles such as shale and limestone
become rounded much more readily than quartzite or chert pebbles.
(5) Large pebbles and cobbles are commonly better-rounded than smaller
pebbles (short transport distance).
Classification of pebble shapes:
There are many classification schemes to describe the shape of the
particles. These are as follows:
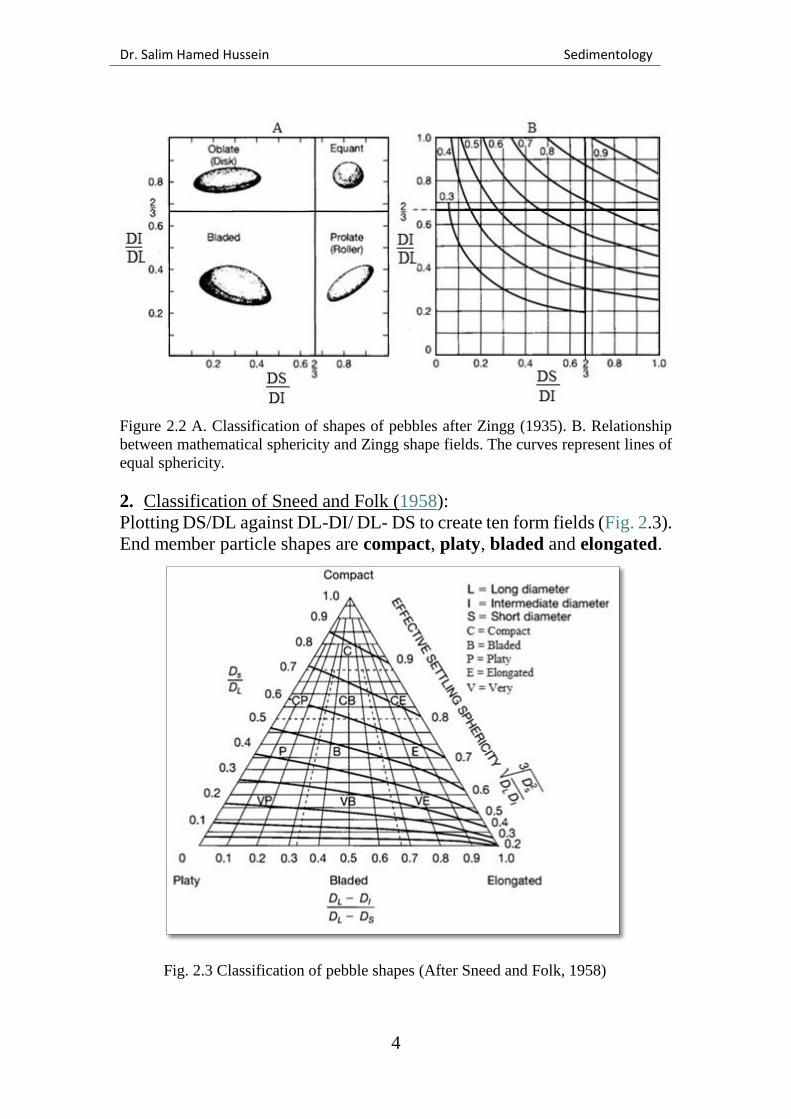
1. Classification of Zingg (1935):
Plotting on a bivariate diagram the ratio of the intermediate to long particle
axis versus the ratio of the short to intermediate particle axis (Fig 2.2A).
Four classes of grain shape (mainly for gravel) are recognized: roller,
bladed, oblate, and equant.
Dr. Salim Hamed Hussein Sedimentology
4
Figure 2.2 A. Classification of shapes of pebbles after Zingg (1935). B. Relationship
between mathematical sphericity and Zingg shape fields. The curves represent lines of
equal sphericity.
2. Classification of Sneed and Folk (1958):
Plotting DS/DL against DL-DI/ DL- DS to create ten form fields (Fig. 2.3).
End member particle shapes are compact, platy, bladed and elongated.
Fig. 2.3 Classification of pebble shapes (After Sneed and Folk, 1958)
Dr. Salim Hamed Hussein Sedimentology
5
Surface texture
Surface texture; refers to microrelief features, such as scratches, ridges,
fractures, and pits, that appear on the surfaces of clastic particles (pebbles
and mineral grains), particularly particles that have undergone transport.
• The surface of particles may be polished, frosted (dull, matte) or marked
by a variety of surface markings.
• Surface textural features can be observed with a naked eye, binocular or
petrographic microscope; however, a detailed study of surface textures
requires high magnification (SEM).
• Most investigators carry out their study on quartz grains because of the
physical hardness and chemical stability of quartz grains allow these
particles to retain surface marking for geologically long periods of time. The surface textures originate in diverse ways including:
1) Mechanical abrasion during sediment transport.
2) Tectonic polishing during deformation.
3) Chemical corrosion, etching, and precipitation of authigenic growths
on grain surfaces during diagenesis and weathering.
Geologists considered surface textural features as possible indicators of
ancient transport conditions and depositional environments. However, the
usefulness of surface texture in environmental analysis is limited
because:
(1) Several markings can be produced in the same environment.
(2) The markings produced on grains in one environment may remain on
grains that are transported into another environment.
(3) Surface markings can be changed during diagenesis by the addition of
cementing overgrowths or chemical etching and solution.
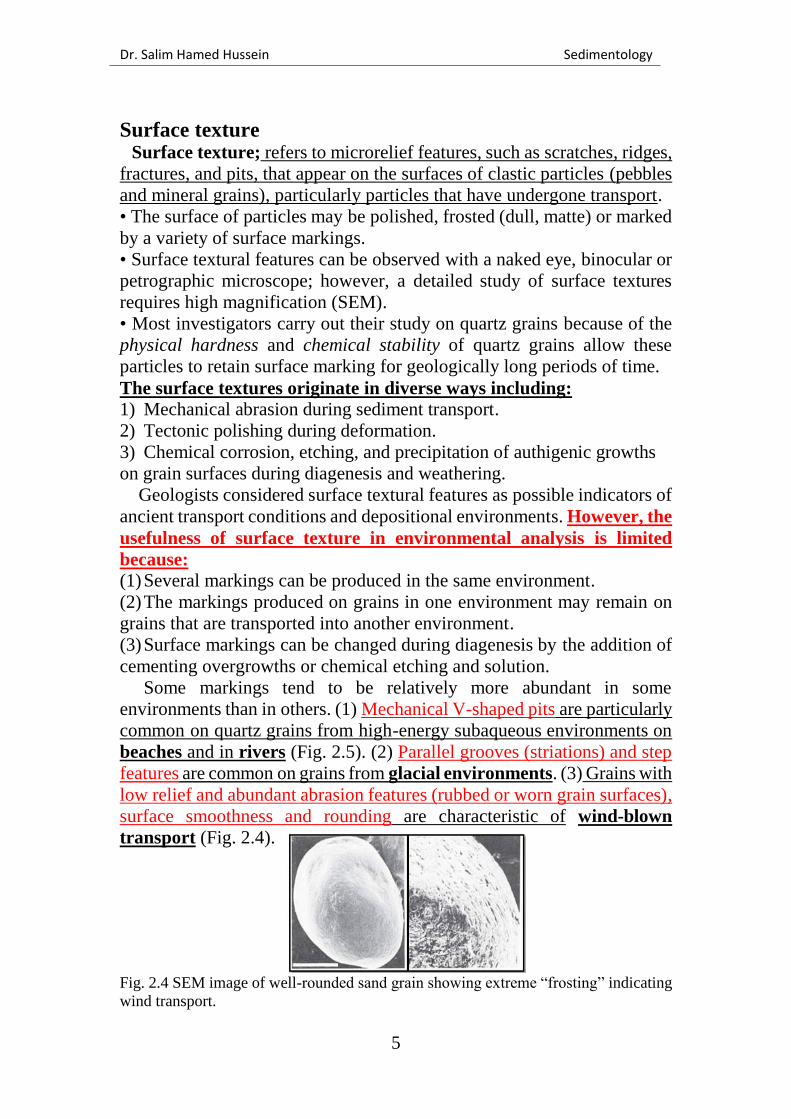
Some markings tend to be relatively more abundant in some
environments than in others. (1) Mechanical V-shaped pits are particularly
common on quartz grains from high-energy subaqueous environments on
beaches and in rivers (Fig. 2.5). (2) Parallel grooves (striations) and step
features are common on grains from glacial environments. (3) Grains with
low relief and abundant abrasion features (rubbed or worn grain surfaces),
surface smoothness and rounding are characteristic of wind-blown
transport (Fig. 2.4).
Fig. 2.4 SEM image of well-rounded sand grain showing extreme “frosting” indicating
wind transport.
Dr. Salim Hamed Hussein Sedimentology
6
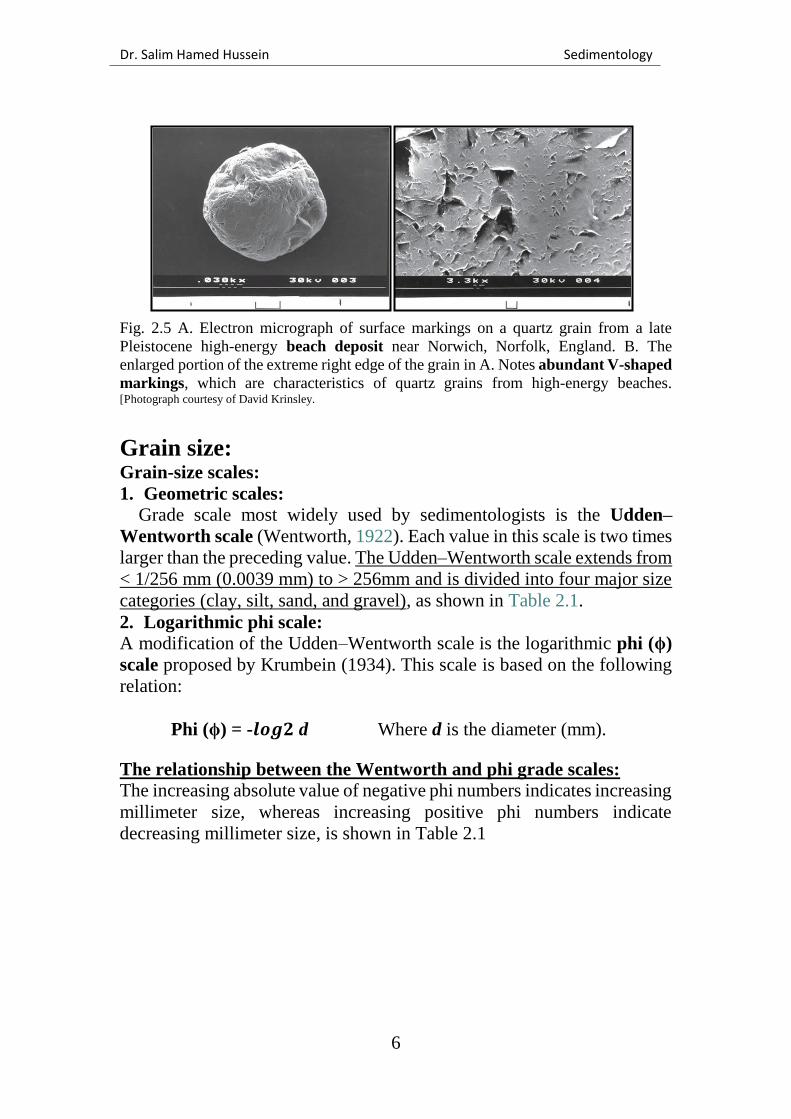
Fig. 2.5 A. Electron micrograph of surface markings on a quartz grain from a late
Pleistocene high-energy beach deposit near Norwich, Norfolk, England. B. The
enlarged portion of the extreme right edge of the grain in A. Notes abundant V-shaped
markings, which are characteristics of quartz grains from high-energy beaches. [Photograph courtesy of David Krinsley.
Grain size: Grain-size scales:
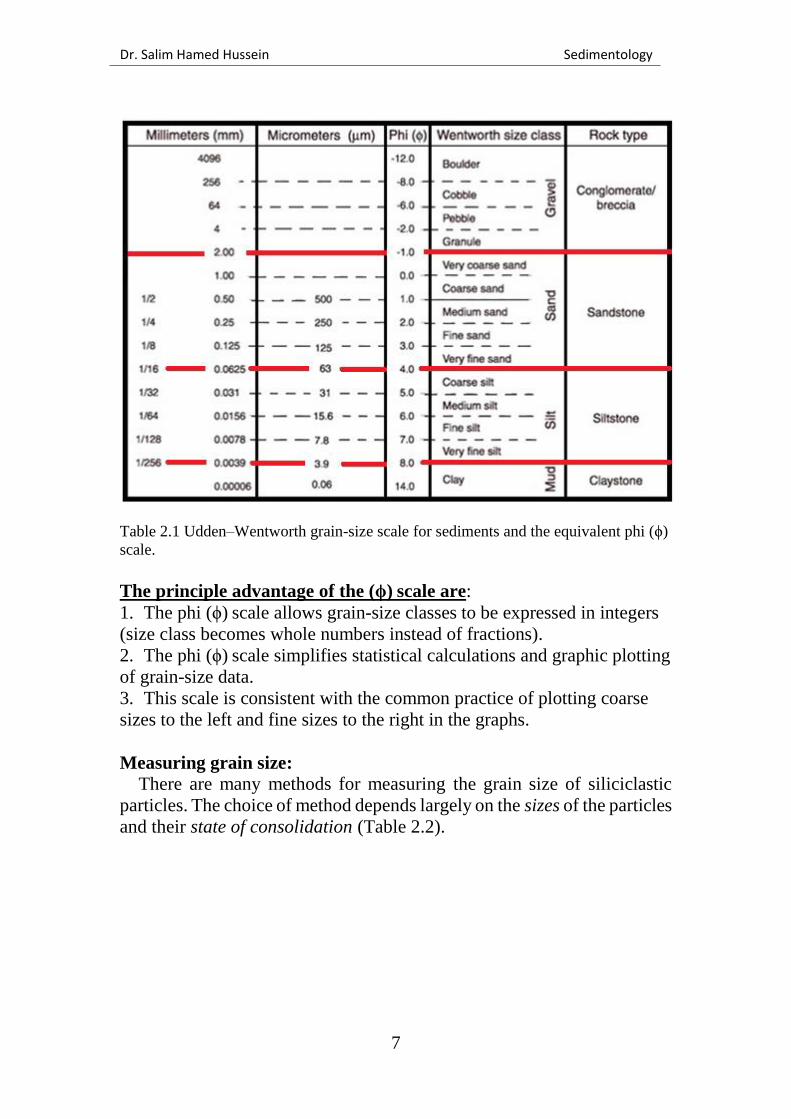
1. Geometric scales: Grade scale most widely used by sedimentologists is the Udden–
Wentworth scale (Wentworth, 1922). Each value in this scale is two times
larger than the preceding value. The Udden–Wentworth scale extends from
< 1/256 mm (0.0039 mm) to > 256mm and is divided into four major size
categories (clay, silt, sand, and gravel), as shown in Table 2.1.
2. Logarithmic phi scale: A modification of the Udden–Wentworth scale is the logarithmic phi (ϕ)
scale proposed by Krumbein (1934). This scale is based on the following
relation:
Phi (ϕ) = -𝒍𝒐𝒈𝟐 d Where d is the diameter (mm).
The relationship between the Wentworth and phi grade scales:
The increasing absolute value of negative phi numbers indicates increasing
millimeter size, whereas increasing positive phi numbers indicate
decreasing millimeter size, is shown in Table 2.1
Dr. Salim Hamed Hussein Sedimentology
7
Table 2.1 Udden–Wentworth grain-size scale for sediments and the equivalent phi (ϕ)
scale.
The principle advantage of the (ϕ) scale are:
1. The phi (ϕ) scale allows grain-size classes to be expressed in integers
(size class becomes whole numbers instead of fractions).
2. The phi (ϕ) scale simplifies statistical calculations and graphic plotting
of grain-size data.
3. This scale is consistent with the common practice of plotting coarse
sizes to the left and fine sizes to the right in the graphs.
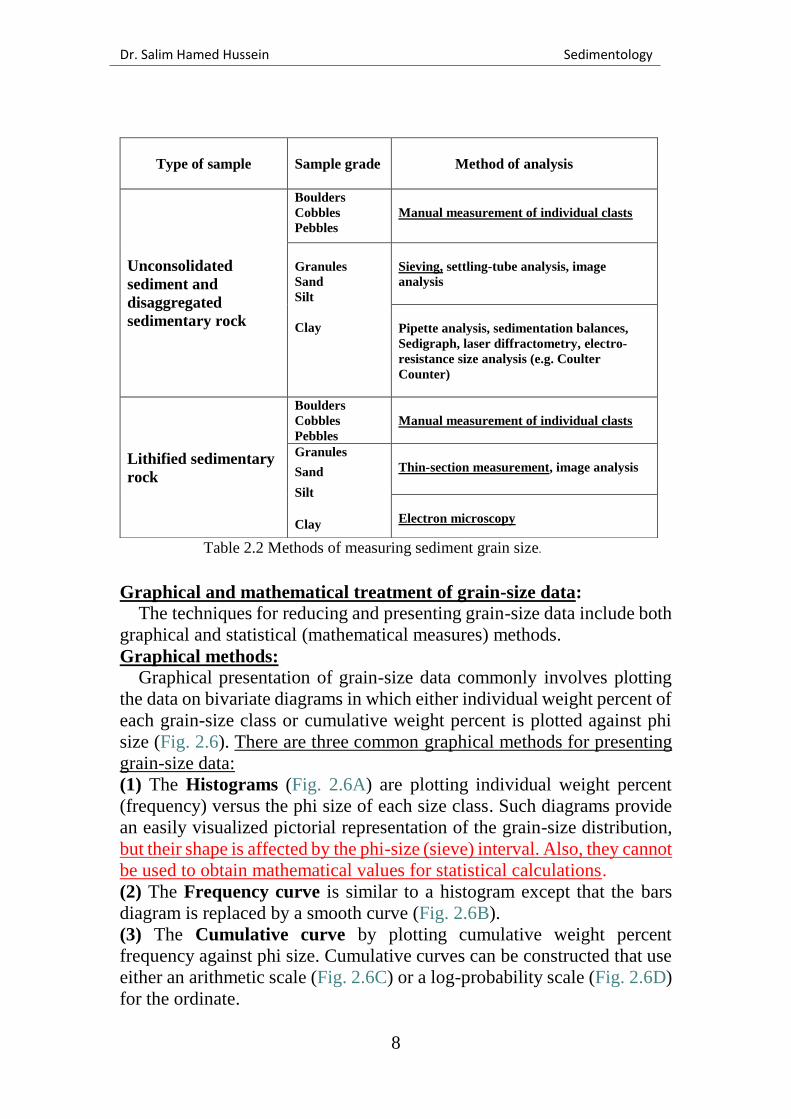
Measuring grain size:
There are many methods for measuring the grain size of siliciclastic
particles. The choice of method depends largely on the sizes of the particles
and their state of consolidation (Table 2.2).
Dr. Salim Hamed Hussein Sedimentology
8
Table 2.2 Methods of measuring sediment grain size.
Graphical and mathematical treatment of grain-size data:
The techniques for reducing and presenting grain-size data include both
graphical and statistical (mathematical measures) methods.
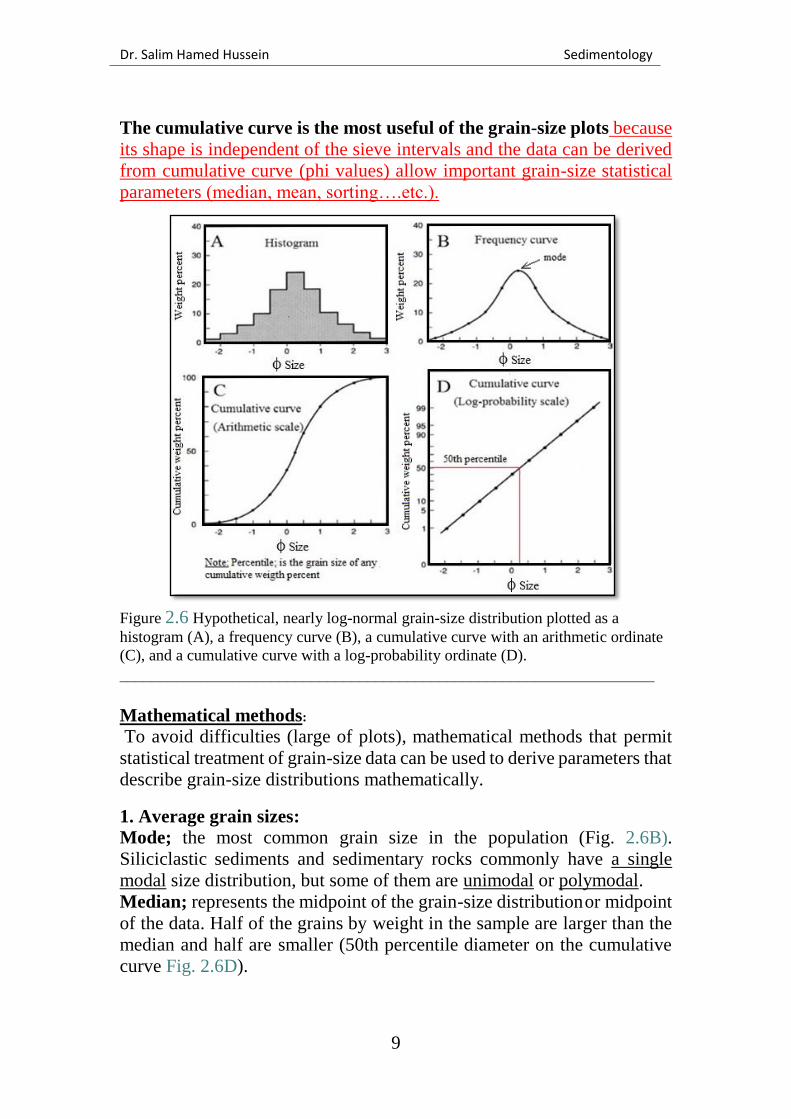
Graphical methods: Graphical presentation of grain-size data commonly involves plotting
the data on bivariate diagrams in which either individual weight percent of
each grain-size class or cumulative weight percent is plotted against phi
size (Fig. 2.6). There are three common graphical methods for presenting
grain-size data:
(1) The Histograms (Fig. 2.6A) are plotting individual weight percent
(frequency) versus the phi size of each size class. Such diagrams provide
an easily visualized pictorial representation of the grain-size distribution,
but their shape is affected by the phi-size (sieve) interval. Also, they cannot
be used to obtain mathematical values for statistical calculations.
(2) The Frequency curve is similar to a histogram except that the bars
diagram is replaced by a smooth curve (Fig. 2.6B).
(3) The Cumulative curve by plotting cumulative weight percent
frequency against phi size. Cumulative curves can be constructed that use
either an arithmetic scale (Fig. 2.6C) or a log-probability scale (Fig. 2.6D)
for the ordinate.
Type of sample
Sample grade
Method of analysis
Unconsolidated
sediment and
disaggregated
sedimentary rock
Boulders
Cobbles
Pebbles
Manual measurement of individual clasts
Granules
Sand
Silt
Clay
Sieving, settling-tube analysis, image
analysis
Pipette analysis, sedimentation balances,
Sedigraph, laser diffractometry, electro-
resistance size analysis (e.g. Coulter
Counter)
Lithified sedimentary
rock
Boulders
Cobbles
Pebbles
Manual measurement of individual clasts
Granules
Sand
Silt
Clay
Thin-section measurement, image analysis
Electron microscopy
Dr. Salim Hamed Hussein Sedimentology
9
The cumulative curve is the most useful of the grain-size plots because
its shape is independent of the sieve intervals and the data can be derived
from cumulative curve (phi values) allow important grain-size statistical
parameters (median, mean, sorting….etc.).
Figure 2.6 Hypothetical, nearly log-normal grain-size distribution plotted as a
histogram (A), a frequency curve (B), a cumulative curve with an arithmetic ordinate
(C), and a cumulative curve with a log-probability ordinate (D). ___________________________________________________________________
Mathematical methods:
To avoid difficulties (large of plots), mathematical methods that permit
statistical treatment of grain-size data can be used to derive parameters that
describe grain-size distributions mathematically.
1. Average grain sizes: Mode; the most common grain size in the population (Fig. 2.6B).
Siliciclastic sediments and sedimentary rocks commonly have a single
modal size distribution, but some of them are unimodal or polymodal.
Median; represents the midpoint of the grain-size distribution or midpoint
of the data. Half of the grains by weight in the sample are larger than the
median and half are smaller (50th percentile diameter on the cumulative
curve Fig. 2.6D).
Dr. Salim Hamed Hussein Sedimentology
10
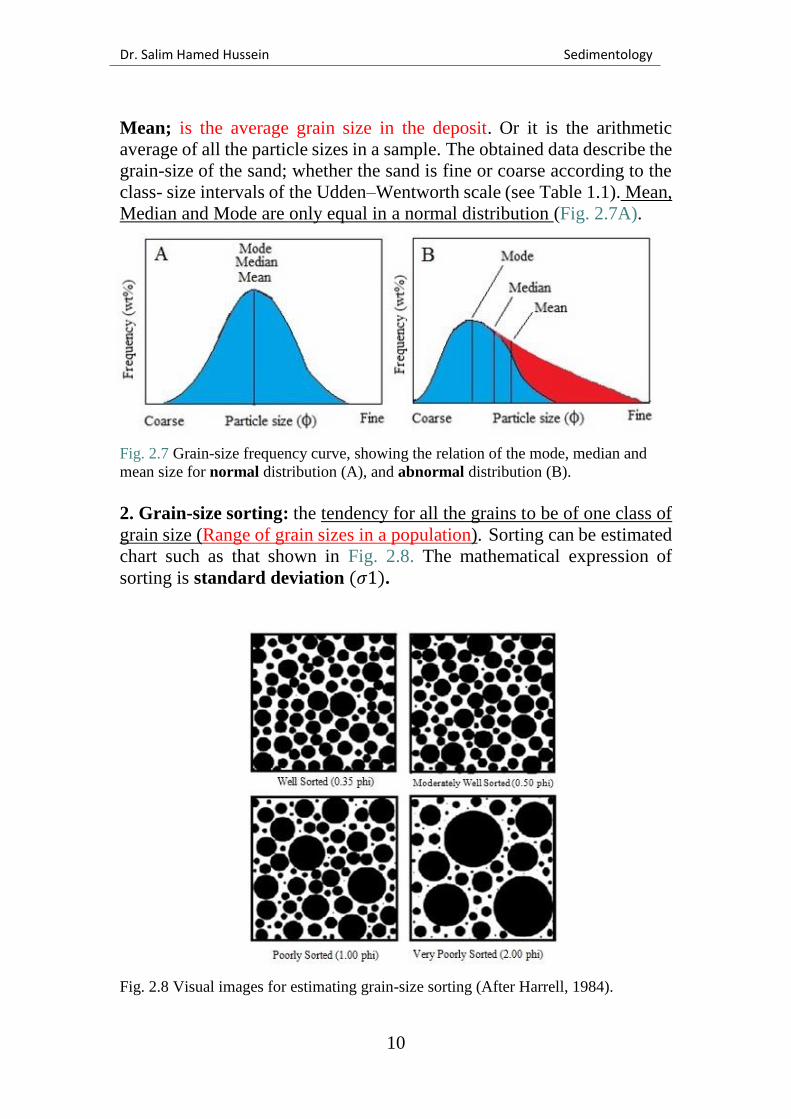
Mean; is the average grain size in the deposit. Or it is the arithmetic
average of all the particle sizes in a sample. The obtained data describe the
grain-size of the sand; whether the sand is fine or coarse according to the
class- size intervals of the Udden–Wentworth scale (see Table 1.1). Mean,
Median and Mode are only equal in a normal distribution (Fig. 2.7A).
Fig. 2.7 Grain-size frequency curve, showing the relation of the mode, median and
mean size for normal distribution (A), and abnormal distribution (B).
2. Grain-size sorting: the tendency for all the grains to be of one class of
grain size (Range of grain sizes in a population). Sorting can be estimated
chart such as that shown in Fig. 2.8. The mathematical expression of
sorting is standard deviation (𝜎1).
Fig. 2.8 Visual images for estimating grain-size sorting (After Harrell, 1984).
Dr. Salim Hamed Hussein Sedimentology
11
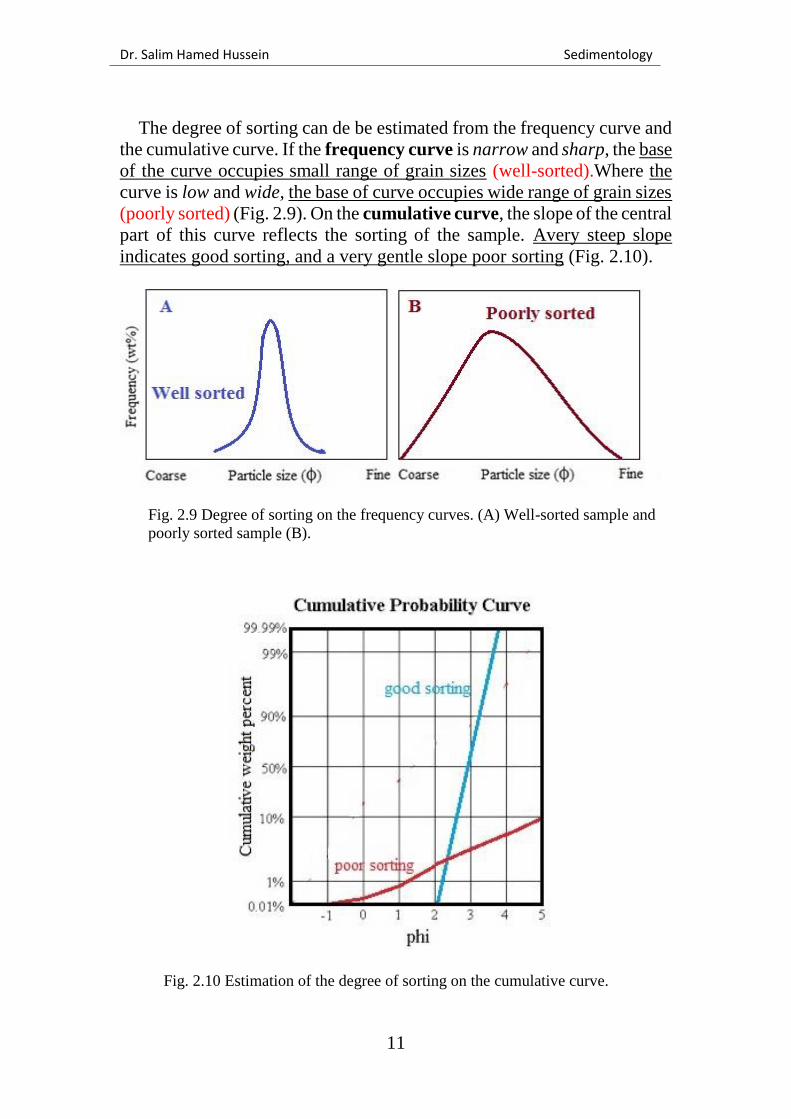
The degree of sorting can de be estimated from the frequency curve and
the cumulative curve. If the frequency curve is narrow and sharp, the base
of the curve occupies small range of grain sizes (well-sorted).Where the
curve is low and wide, the base of curve occupies wide range of grain sizes
(poorly sorted) (Fig. 2.9). On the cumulative curve, the slope of the central
part of this curve reflects the sorting of the sample. Avery steep slope
indicates good sorting, and a very gentle slope poor sorting (Fig. 2.10).
Fig. 2.9 Degree of sorting on the frequency curves. (A) Well-sorted sample and
poorly sorted sample (B).
Fig. 2.10 Estimation of the degree of sorting on the cumulative curve.
Dr. Salim Hamed Hussein Sedimentology
12
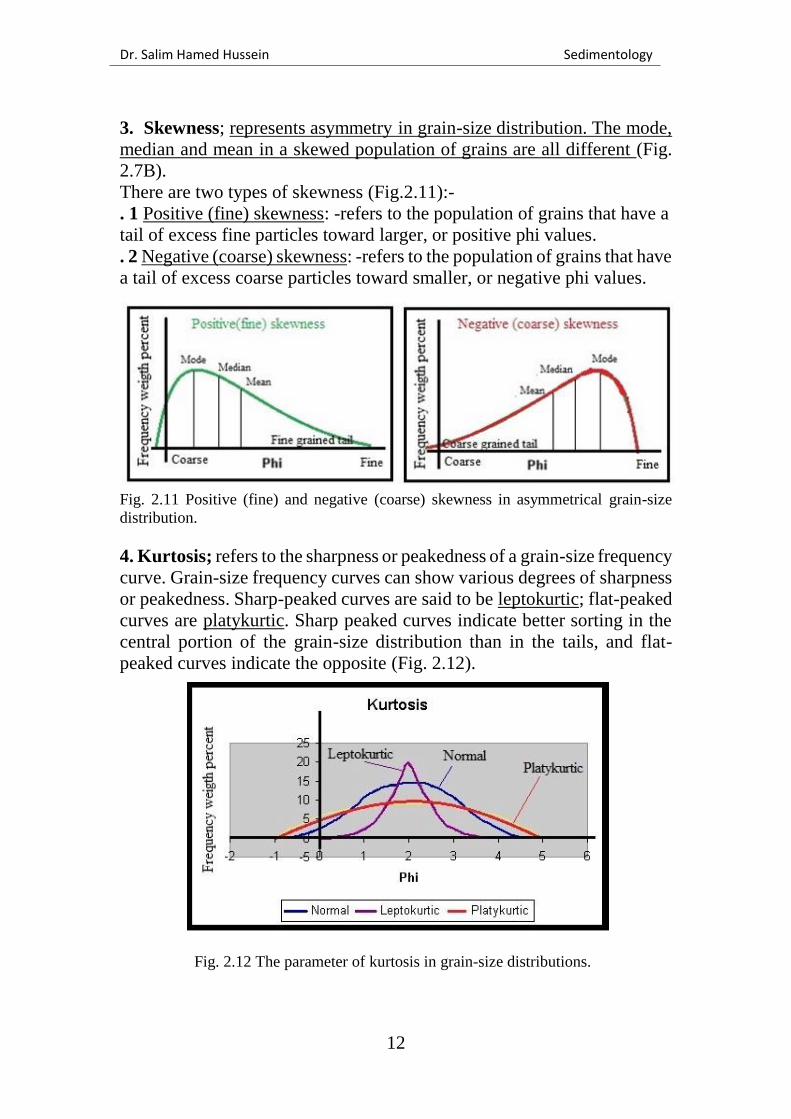
3. Skewness; represents asymmetry in grain-size distribution. The mode,
median and mean in a skewed population of grains are all different (Fig.
2.7B).
There are two types of skewness (Fig.2.11):-
. 1 Positive (fine) skewness: -refers to the population of grains that have a
tail of excess fine particles toward larger, or positive phi values.
. 2 Negative (coarse) skewness: -refers to the population of grains that have
a tail of excess coarse particles toward smaller, or negative phi values.
Fig. 2.11 Positive (fine) and negative (coarse) skewness in asymmetrical grain-size
distribution.
4. Kurtosis; refers to the sharpness or peakedness of a grain-size frequency
curve. Grain-size frequency curves can show various degrees of sharpness
or peakedness. Sharp-peaked curves are said to be leptokurtic; flat-peaked
curves are platykurtic. Sharp peaked curves indicate better sorting in the
central portion of the grain-size distribution than in the tails, and flat-
peaked curves indicate the opposite (Fig. 2.12).
Fig. 2.12 The parameter of kurtosis in grain-size distributions.
Dr. Salim Hamed Hussein Sedimentology
13
Applications and significance of grain-size data:
1) Grain-size is useful in describing siliciclastic sediments and
sedimentary rocks into gravels, sands, and muds
2) Grain-size data provide important information that is useful in
evaluating the economic significance of sedimentary rocks (petroleum and
groundwater) or in interpreting some aspect of Earth history.
3) Grain-size characteristics with a combination of sedimentary structures
may reflect depositional conditions and processes and interpreting ancient
depositional environments.
4) Grain size and sorting of the sediment may be indicative of the
sedimentation mechanism and depositional conditions.
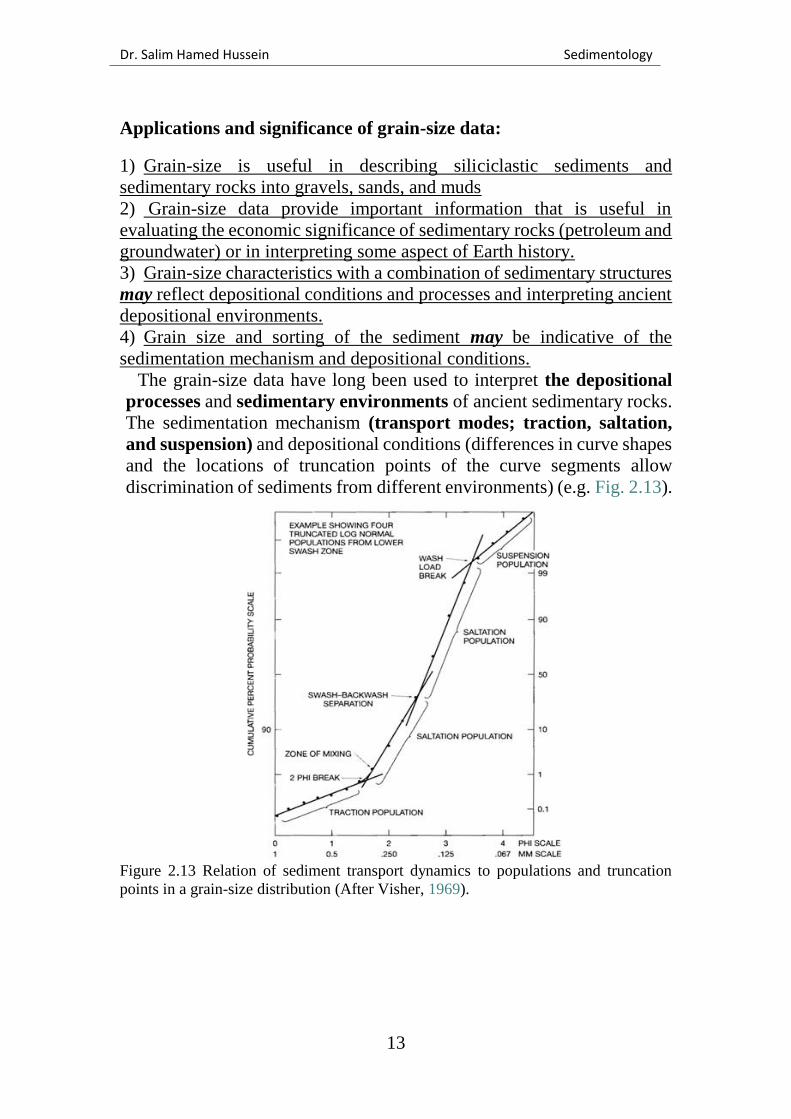
The grain-size data have long been used to interpret the depositional
processes and sedimentary environments of ancient sedimentary rocks.
The sedimentation mechanism (transport modes; traction, saltation,
and suspension) and depositional conditions (differences in curve shapes
and the locations of truncation points of the curve segments allow
discrimination of sediments from different environments) (e.g. Fig. 2.13).
Figure 2.13 Relation of sediment transport dynamics to populations and truncation
points in a grain-size distribution (After Visher, 1969).
Dr. Salim Hamed Hussein Sedimentology
14
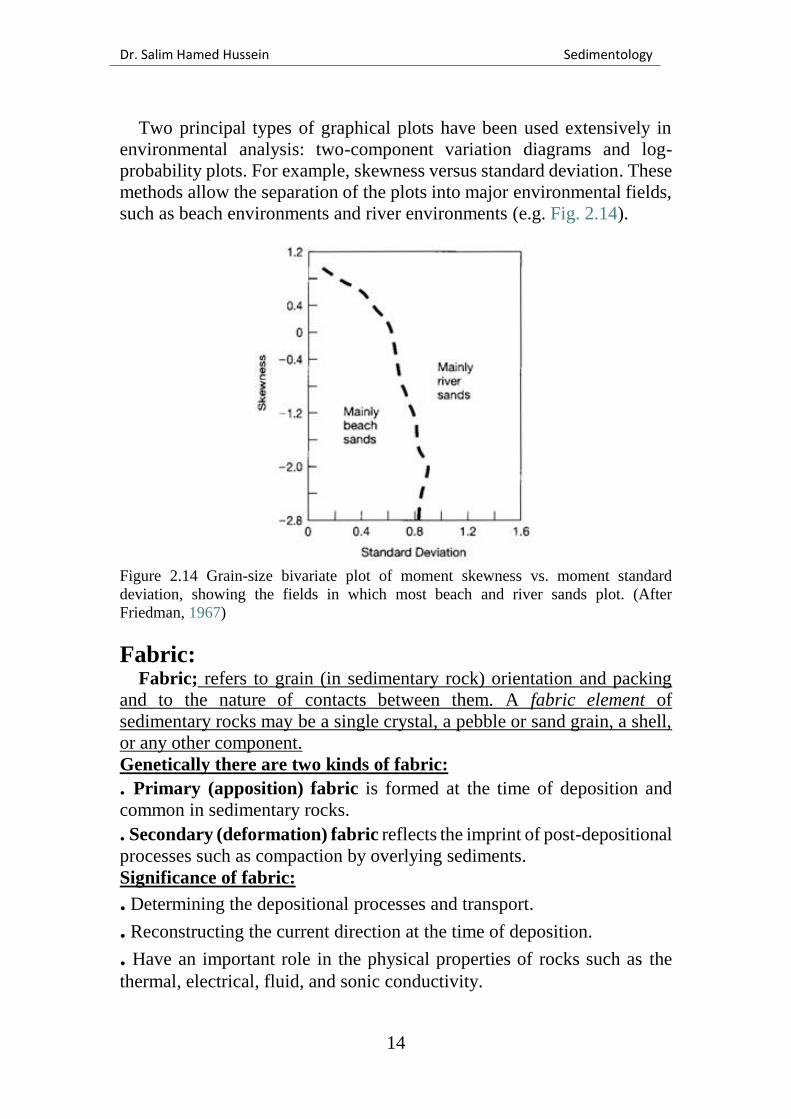
Two principal types of graphical plots have been used extensively in
environmental analysis: two-component variation diagrams and log-
probability plots. For example, skewness versus standard deviation. These
methods allow the separation of the plots into major environmental fields,
such as beach environments and river environments (e.g. Fig. 2.14).
Figure 2.14 Grain-size bivariate plot of moment skewness vs. moment standard
deviation, showing the fields in which most beach and river sands plot. (After
Friedman, 1967)
Fabric: Fabric; refers to grain (in sedimentary rock) orientation and packing
and to the nature of contacts between them. A fabric element of
sedimentary rocks may be a single crystal, a pebble or sand grain, a shell,
or any other component.
Genetically there are two kinds of fabric:
. Primary (apposition) fabric is formed at the time of deposition and
common in sedimentary rocks.
. Secondary (deformation) fabric reflects the imprint of post-depositional
processes such as compaction by overlying sediments.
Significance of fabric:
. Determining the depositional processes and transport.
. Reconstructing the current direction at the time of deposition.
. Have an important role in the physical properties of rocks such as the
thermal, electrical, fluid, and sonic conductivity.
Dr. Salim Hamed Hussein Sedimentology
15
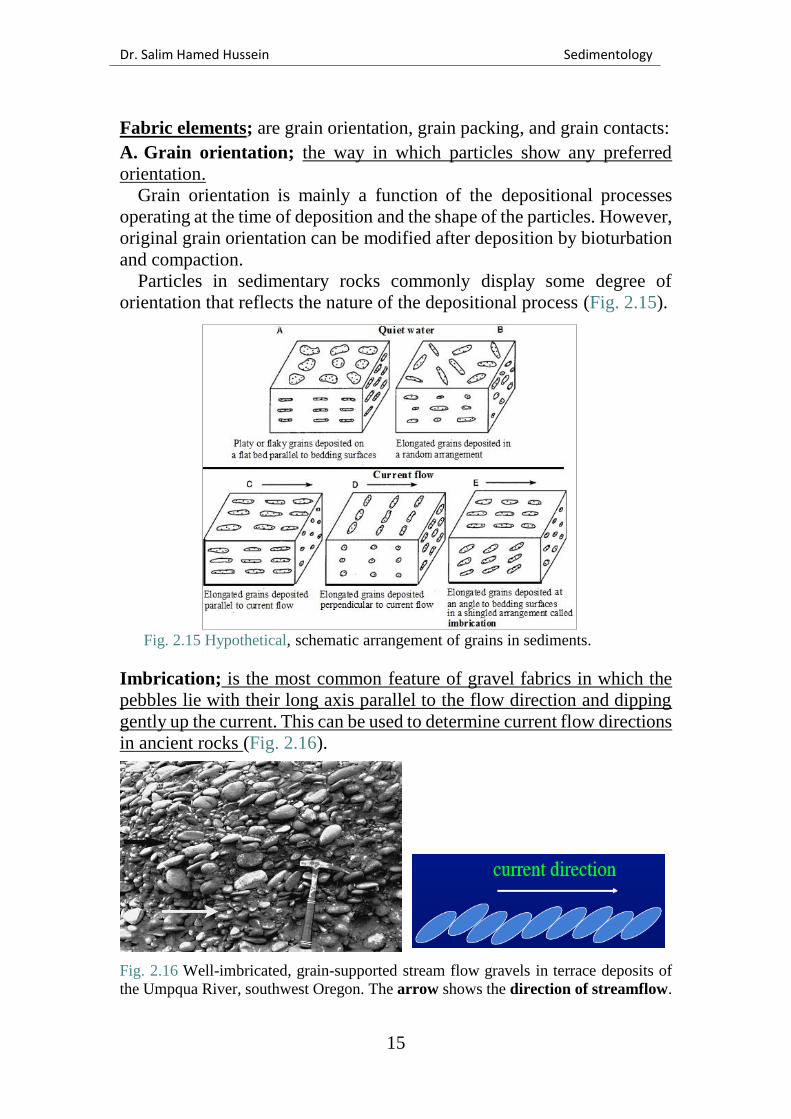
Fabric elements; are grain orientation, grain packing, and grain contacts:
A. Grain orientation; the way in which particles show any preferred
orientation.
Grain orientation is mainly a function of the depositional processes
operating at the time of deposition and the shape of the particles. However,
original grain orientation can be modified after deposition by bioturbation
and compaction.
Particles in sedimentary rocks commonly display some degree of
orientation that reflects the nature of the depositional process (Fig. 2.15).
Fig. 2.15 Hypothetical, schematic arrangement of grains in sediments.
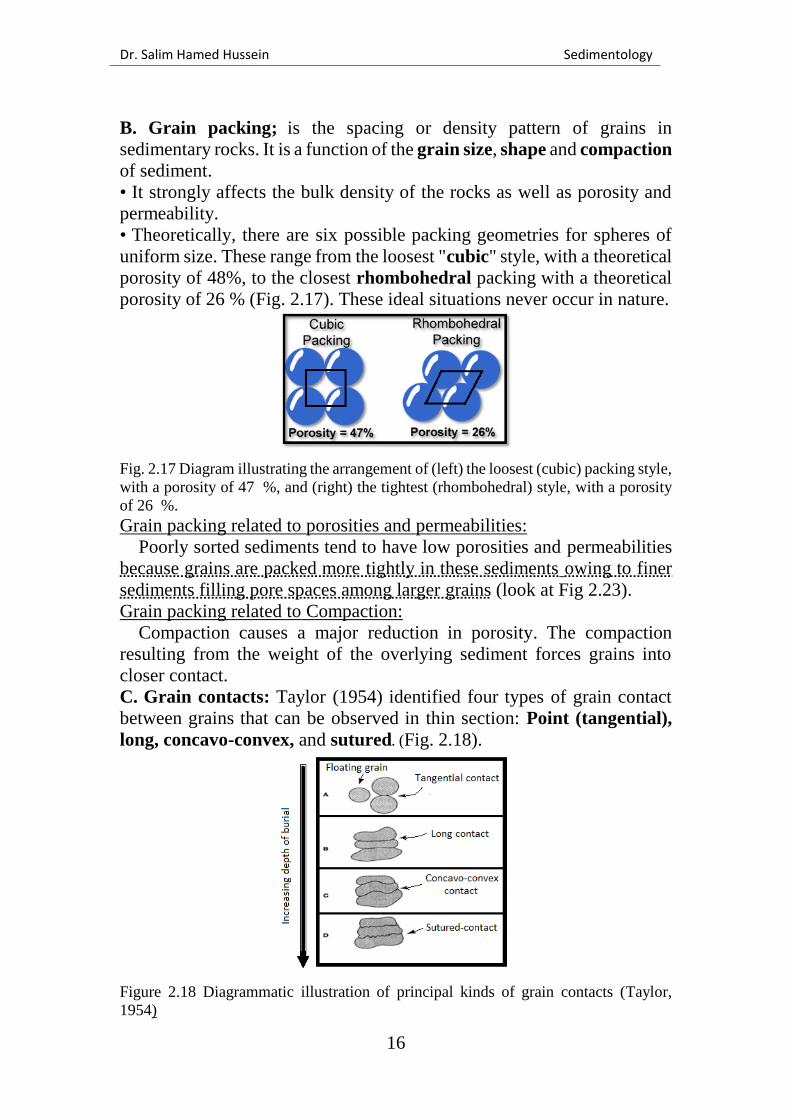
Imbrication; is the most common feature of gravel fabrics in which the
pebbles lie with their long axis parallel to the flow direction and dipping
gently up the current. This can be used to determine current flow directions
in ancient rocks (Fig. 2.16).
Fig. 2.16 Well-imbricated, grain-supported stream flow gravels in terrace deposits of
the Umpqua River, southwest Oregon. The arrow shows the direction of streamflow.
Dr. Salim Hamed Hussein Sedimentology
16
B. Grain packing; is the spacing or density pattern of grains in
sedimentary rocks. It is a function of the grain size, shape and compaction
of sediment.
• It strongly affects the bulk density of the rocks as well as porosity and
permeability.
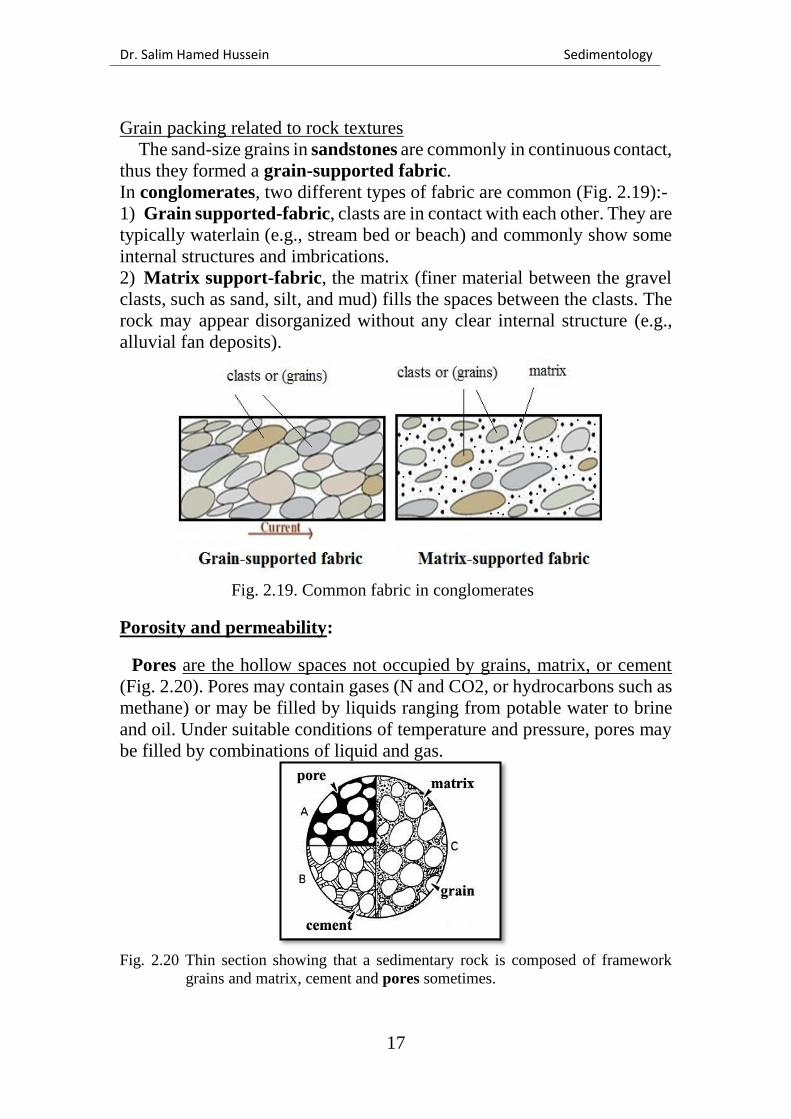
• Theoretically, there are six possible packing geometries for spheres of
uniform size. These range from the loosest "cubic" style, with a theoretical
porosity of 48%, to the closest rhombohedral packing with a theoretical
porosity of 26 % (Fig. 2.17). These ideal situations never occur in nature.
Fig. 2.17 Diagram illustrating the arrangement of (left) the loosest (cubic) packing style,
with a porosity of 47 %, and (right) the tightest (rhombohedral) style, with a porosity
of 26 %.
Grain packing related to porosities and permeabilities:
Poorly sorted sediments tend to have low porosities and permeabilities
because grains are packed more tightly in these sediments owing to finer
sediments filling pore spaces among larger grains (look at Fig 2.23).
Grain packing related to Compaction:
Compaction causes a major reduction in porosity. The compaction
resulting from the weight of the overlying sediment forces grains into
closer contact.
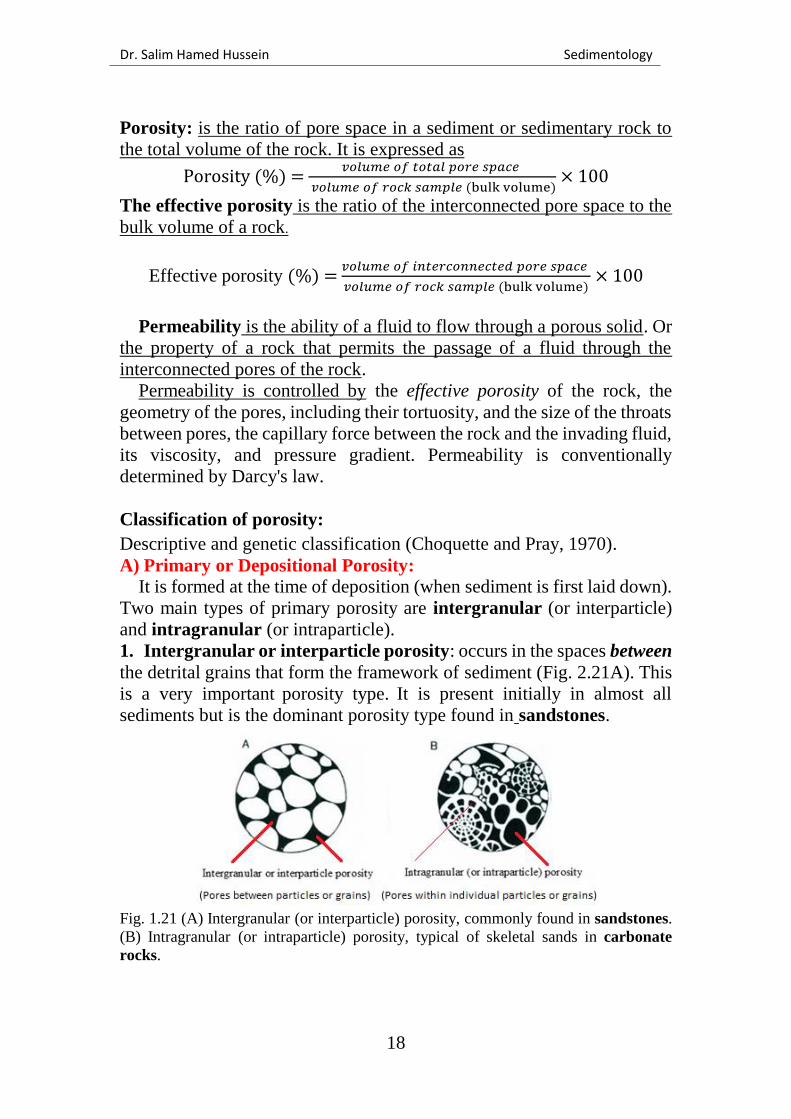
C. Grain contacts: Taylor (1954) identified four types of grain contact
between grains that can be observed in thin section: Point (tangential),
long, concavo-convex, and sutured. (Fig. 2.18).
Figure 2.18 Diagrammatic illustration of principal kinds of grain contacts (Taylor,
1954)
Dr. Salim Hamed Hussein Sedimentology
17
Grain packing related to rock textures
The sand-size grains in sandstones are commonly in continuous contact,
thus they formed a grain-supported fabric.
In conglomerates, two different types of fabric are common (Fig. 2.19):-
1) Grain supported-fabric, clasts are in contact with each other. They are
typically waterlain (e.g., stream bed or beach) and commonly show some
internal structures and imbrications.
2) Matrix support-fabric, the matrix (finer material between the gravel
clasts, such as sand, silt, and mud) fills the spaces between the clasts. The
rock may appear disorganized without any clear internal structure (e.g.,
alluvial fan deposits).
Fig. 2.19. Common fabric in conglomerates
Porosity and permeability:
Pores are the hollow spaces not occupied by grains, matrix, or cement
(Fig. 2.20). Pores may contain gases (N and CO2, or hydrocarbons such as
methane) or may be filled by liquids ranging from potable water to brine
and oil. Under suitable conditions of temperature and pressure, pores may
be filled by combinations of liquid and gas.
Fig. 2.20 Thin section showing that a sedimentary rock is composed of framework
grains and matrix, cement and pores sometimes.
Dr. Salim Hamed Hussein Sedimentology
18
Porosity: is the ratio of pore space in a sediment or sedimentary rock to
the total volume of the rock. It is expressed as
Porosity (%) = 𝑣𝑜𝑙𝑢𝑚𝑒 𝑜𝑓 𝑡𝑜𝑡𝑎𝑙 𝑝𝑜𝑟𝑒 𝑠𝑝𝑎𝑐𝑒
𝑣𝑜𝑙𝑢𝑚𝑒 𝑜𝑓 𝑟𝑜𝑐𝑘 𝑠𝑎𝑚𝑝𝑙𝑒 (bulk volume)× 100
The effective porosity is the ratio of the interconnected pore space to the
bulk volume of a rock.
Effective porosity (%) = 𝑣𝑜𝑙𝑢𝑚𝑒 𝑜𝑓 𝑖𝑛𝑡𝑒𝑟𝑐𝑜𝑛𝑛𝑒𝑐𝑡𝑒𝑑 𝑝𝑜𝑟𝑒 𝑠𝑝𝑎𝑐𝑒
𝑣𝑜𝑙𝑢𝑚𝑒 𝑜𝑓 𝑟𝑜𝑐𝑘 𝑠𝑎𝑚𝑝𝑙𝑒 (bulk volume)× 100
Permeability is the ability of a fluid to flow through a porous solid. Or
the property of a rock that permits the passage of a fluid through the
interconnected pores of the rock.
Permeability is controlled by the effective porosity of the rock, the
geometry of the pores, including their tortuosity, and the size of the throats
between pores, the capillary force between the rock and the invading fluid,
its viscosity, and pressure gradient. Permeability is conventionally
determined by Darcy's law.
Classification of porosity:
Descriptive and genetic classification (Choquette and Pray, 1970).
A) Primary or Depositional Porosity:
It is formed at the time of deposition (when sediment is first laid down).
Two main types of primary porosity are intergranular (or interparticle)
and intragranular (or intraparticle).
1. Intergranular or interparticle porosity: occurs in the spaces between
the detrital grains that form the framework of sediment (Fig. 2.21A). This
is a very important porosity type. It is present initially in almost all
sediments but is the dominant porosity type found in sandstones.
Fig. 1.21 (A) Intergranular (or interparticle) porosity, commonly found in sandstones.
(B) Intragranular (or intraparticle) porosity, typical of skeletal sands in carbonate
rocks.
Dr. Salim Hamed Hussein Sedimentology
19
2. Intragranular or intraparticle porosity: This type may be present
within the detrital grains, particularly in skeletal carbonate. For example,
the cavities of mollusks, ammonites, corals, bryozoa, and microfossils (Fig.
2.21B).
B) Secondary or Postdepositional Porosity:
It is formed after sediment was deposited. It is more diverse in
morphology and more complex in genesis than primary porosity. It is more
commonly found in carbonate rocks than in siliciclastic sands.
The main types are:
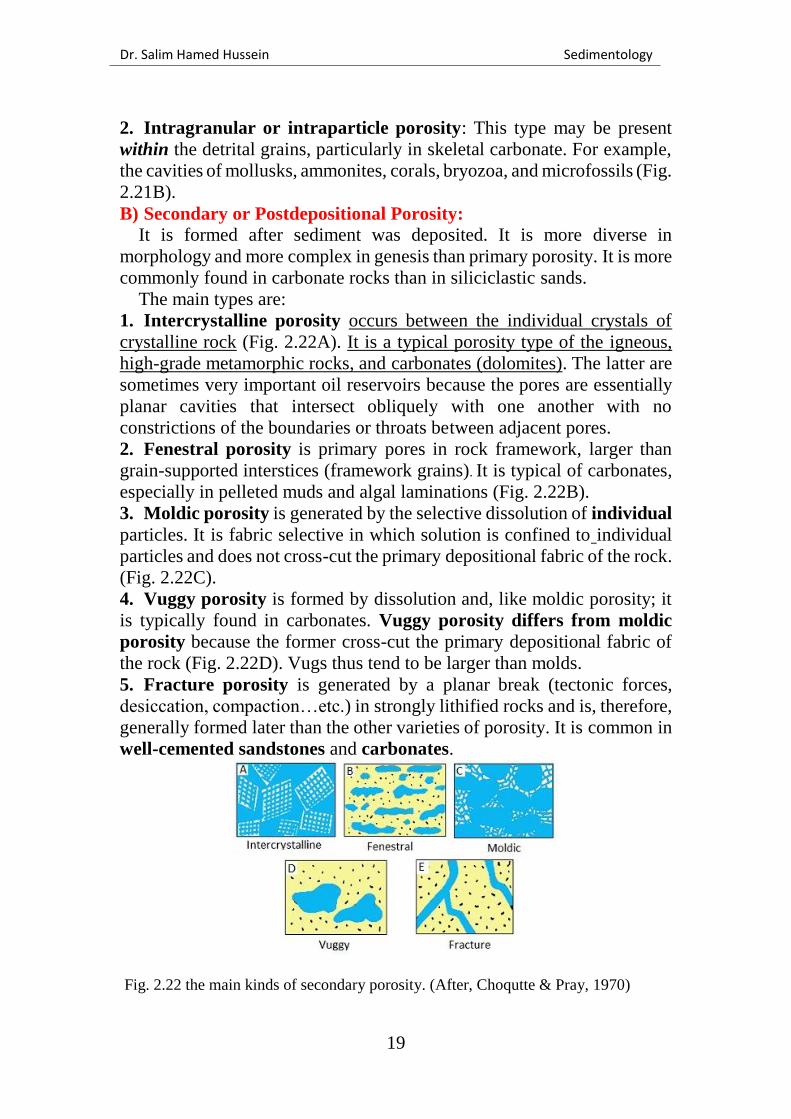
1. Intercrystalline porosity occurs between the individual crystals of
crystalline rock (Fig. 2.22A). It is a typical porosity type of the igneous,
high-grade metamorphic rocks, and carbonates (dolomites). The latter are
sometimes very important oil reservoirs because the pores are essentially
planar cavities that intersect obliquely with one another with no
constrictions of the boundaries or throats between adjacent pores.
2. Fenestral porosity is primary pores in rock framework, larger than
grain-supported interstices (framework grains). It is typical of carbonates,
especially in pelleted muds and algal laminations (Fig. 2.22B).
3. Moldic porosity is generated by the selective dissolution of individual
particles. It is fabric selective in which solution is confined to individual
particles and does not cross-cut the primary depositional fabric of the rock.
(Fig. 2.22C).
4. Vuggy porosity is formed by dissolution and, like moldic porosity; it
is typically found in carbonates. Vuggy porosity differs from moldic
porosity because the former cross-cut the primary depositional fabric of
the rock (Fig. 2.22D). Vugs thus tend to be larger than molds.
5. Fracture porosity is generated by a planar break (tectonic forces,
desiccation, compaction…etc.) in strongly lithified rocks and is, therefore,
generally formed later than the other varieties of porosity. It is common in
well-cemented sandstones and carbonates.
Fig. 2.22 the main kinds of secondary porosity. (After, Choqutte & Pray, 1970)
Dr. Salim Hamed Hussein Sedimentology
20
Factors affecting porosity:
(1) Physical characteristics, such as grain size, sorting, packing, and grain
arrangement (fabric) that are the result of depositional processes.
(2) Postdepositional processes such as compaction (which can rearrange
packing), solution, and cementation.
These factors are summarized as follows:
. Effect of grain size
The porosity generally increases with decreasing grain size for
unconsolidated sands (recent sediments) of uniform grain size. This
relationship is not always true for lithified sandstones, whose porosity
often increases with grain size. This may be because the finer sands have
suffered more from compaction and cementation. Permeability, by
contrast, increases with increasing grain size. This is because in finer
sediments the throat passages between pores are smaller and the higher
capillary attraction of the walls inhibits fluid flow. This relationship is
found in both unconsolidated and lithified sand.
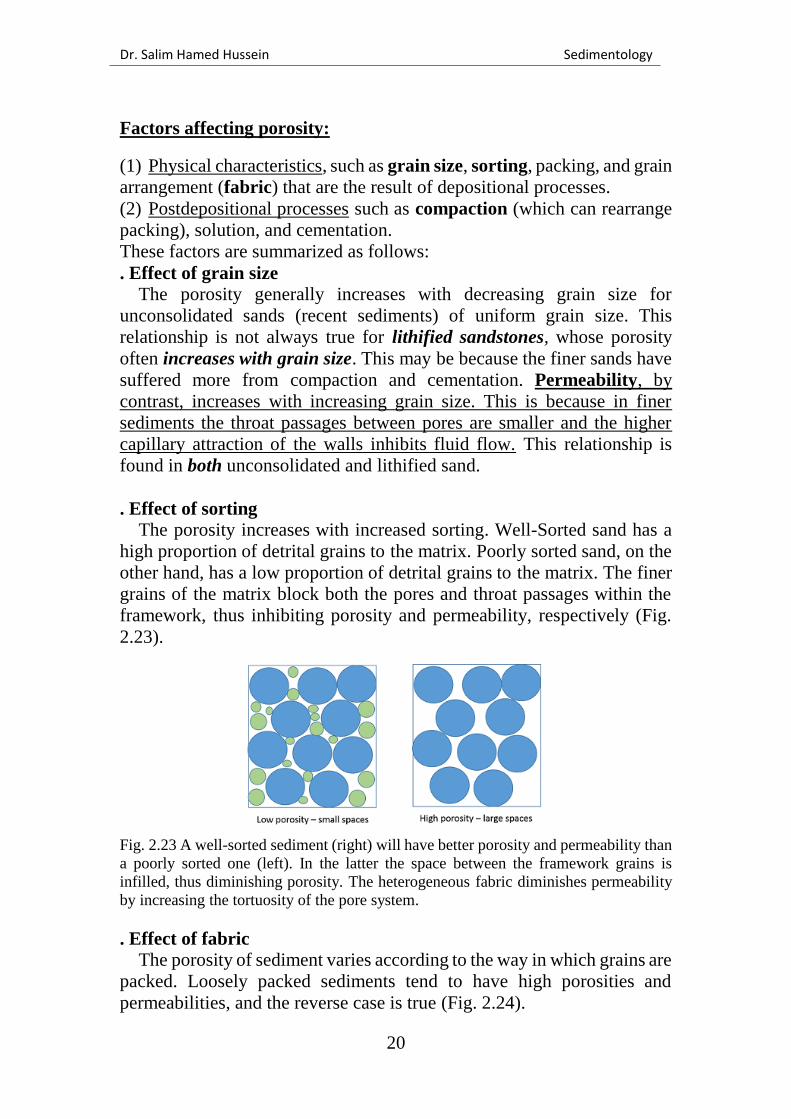
. Effect of sorting
The porosity increases with increased sorting. Well-Sorted sand has a
high proportion of detrital grains to the matrix. Poorly sorted sand, on the
other hand, has a low proportion of detrital grains to the matrix. The finer
grains of the matrix block both the pores and throat passages within the
framework, thus inhibiting porosity and permeability, respectively (Fig.
2.23).
Fig. 2.23 A well-sorted sediment (right) will have better porosity and permeability than
a poorly sorted one (left). In the latter the space between the framework grains is
infilled, thus diminishing porosity. The heterogeneous fabric diminishes permeability
by increasing the tortuosity of the pore system.
. Effect of fabric
The porosity of sediment varies according to the way in which grains are
packed. Loosely packed sediments tend to have high porosities and
permeabilities, and the reverse case is true (Fig. 2.24).
Dr. Salim Hamed Hussein Sedimentology
21
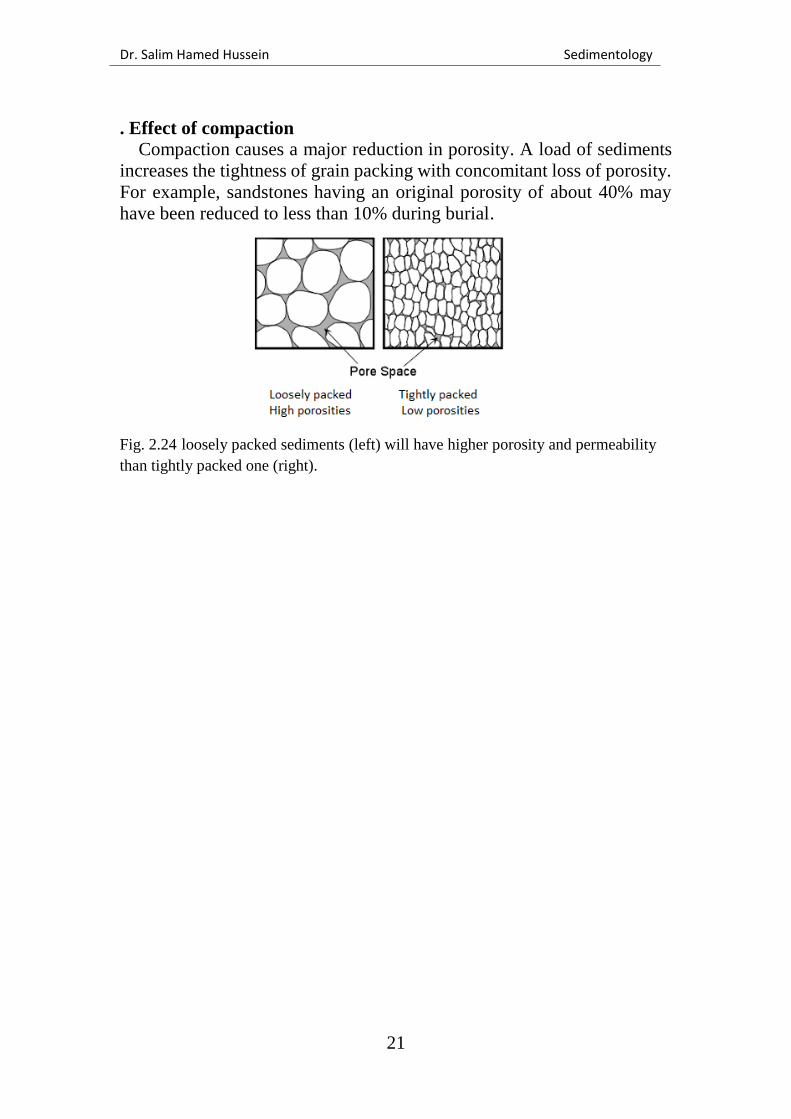
. Effect of compaction
Compaction causes a major reduction in porosity. A load of sediments
increases the tightness of grain packing with concomitant loss of porosity.
For example, sandstones having an original porosity of about 40% may
have been reduced to less than 10% during burial.
Fig. 2.24 loosely packed sediments (left) will have higher porosity and permeability
than tightly packed one (right).