Embed Size (px)
Citation preview

Relation between VIX’s return and volatility: A behavioral explanation
Ju Xiang*
Abstract
I investigate the relation between returns and volatility at daily to 1-min intervals for VIX
ETNs (like ETFs) and futures. As VIX is the implied volatility index and also known as “fear
gauge”, this study is on relation between returns of volatility and volatilities of volatility. I find
that, contrary to equity and commodity markets, volatility’s return and volatility exhibit positive
relation at daily basis. However, negative relation appears at the finer-grained 5-min and 1-min
intervals, with the latter stronger. This paper discovers a stronger behavioral case than Hibbert,
Daigler and Dupoyet (2008) and shows that behavioral explanation is the only feasible one,
among the three explanations of leverage, volatility feedback and behavioral effect. Firstly,
unlike equity, VIX ETNs and futures do not involve financial leverage. Secondly, the chance of
any event having shocks to volatility of volatility is slim. Moreover, I observe negative relation
only at very short intervals (less than 15-min) and a monotonic relation change from daily
positive to intraday negative, while leverage and volatility feedback models suggest longer
delayed effects and no such pattern of relation change. My findings imply that there are further
behavioral effects when market deals with fear, which itself has already been a behavioral
outcome.
JEL Classifications: D03, G01, G32
*Assistant Professor in Finance, Chinese Academy of Finance & Economics, Central U. of Finance & Economics. Add: 39 South College Road, Haidian District, Beijing, P.R.China, 100081. Tel: +86 10 62288266. Fax: +86 10 62288779. Email: [email protected], [email protected]

1
Relation between VIX’s return and volatility: A behavioral explanation
Abstract
I investigate the relation between returns and volatility at daily to 1-min intervals for VIX ETNs
(like ETFs) and futures. As VIX is the implied volatility index and also known as “fear gauge”,
this study is on relation between returns of volatility and volatilities of volatility. I find that,
contrary to equity and commodity markets, volatility’s return and volatility exhibit positive
relation at daily basis. However, negative relation appears at the finer-grained 5-min and 1-min
intervals, with the latter stronger. This paper discovers a stronger behavioral case than Hibbert,
Daigler and Dupoyet (2008) and shows that behavioral explanation is the only feasible one,
among the three explanations of leverage, volatility feedback and behavioral effect. Firstly,
unlike equity, VIX ETNs and futures do not involve financial leverage. Secondly, the chance of
any event having shocks to volatility of volatility is slim. Moreover, I observe negative relation
only at very short intervals (less than 15-min) and a monotonic relation change from daily
positive to intraday negative, while leverage and volatility feedback models suggest longer
delayed effects and no such pattern of relation change. My findings imply that there are further
behavioral effects when market deals with fear, which itself has already been a behavioral
outcome.

2
1. Introduction
Negative relation between returns and volatility is widely documented for various
markets. Specifically, innovations to return are negatively correlated with innovations to
volatility, with one’s declines more likely associated with the other’s increases. Moreover,
returns decline has a stronger effect on volatility increase than returns increase on volatility
decline (Bollerslev et al., 2007). Lien and Yang (2008) apply the negative asymmetric relation
in commodity markets to improve futures hedging.
Two prevailing theories have been discussed in literature to explain the negative relation.
The leverage hypothesis by Black (1976) implies that negative shocks to returns increase
financial leverage, making stocks riskier and therefore subsequently driving up volatility. On the
other hand, volatility feedback hypothesis from Poterba and Summers (1986) and Campbell and
Hentschel (1992) suggest a reverse mechanism, where positive innovations to volatility lead to a
decline in returns. A more recent study by Hibbert, Daigler and Dupoyet (2008) propose a
behavioral explanation for short-term negative asymmetric relation between market returns and
implied/realized volatility, after refuting leverage and volatility feedback models’ effectiveness
for S&P500 ( Nasdaq 100) index.
I investigate the relation between market returns and volatility at daily to 1-min intervals
for ETNs1 and futures based on VIX, which is the implied volatility index and also known as
“fear gauge”. This study is on relation between return of volatility and the volatility of volatility. 1 ETN is like ETF with performances linked to certain assets, but essentially a bond. More info at http://www.ipathetn.com/VXX-overview.jsp and http://www.moneyandmarkets.com/why-etns-are-riskier-than-they-look-29589
3
I find that, contrary to equity and commodity markets, volatility’s return and volatility exhibit
positive relation at daily basis. However, negative relation appears at the finer-grained 5-min
and 1-min intervals, with the latter stronger.
This paper discovers a stronger behavioral case than Hibbert, Daigler and Dupoyet
(2008), which shows that behavioral explanation is the only feasible one, among the triad
explanations of leverage, volatility feedback and behavioral effect. Firstly, unlike equity, VIX
ETNs and futures do not involve financial leverage. Secondly, the chance of any event having
shocks to volatility of volatility2 is slim. Moreover, I observe negative relation only at very short
intervals (less than 15-min), while leverage and volatility feedback models suggest longer
delayed effects.
I add to the literature by proposing well-controlled scenarios for testing pure behavioral
effects in financial markets, discovering positive correlation between daily VIX products’ returns
and volatilities, identifying a new pattern in relation change from daily to intraday, and providing
parallel intraday results for the return–volatility relation for instruments derived from the single
underlying VIX. In particular, this study shows that the negative association of return to changes
in volatility is consistent with behavioral explanations, while the leverage and volatility feedback
models do not explain our results for VIX instruments, which do not follow the fundamental
value properties required by either model.
Empirical tests in this paper include three major advantages over previous research. First,
I use VIX instruments which provide well-designed samples to control for interfering factors. 2 If we treat return as the first difference of equity price, then volatility is the second order of difference. Thus the return of volatility and volatility of volatility are 3rd and 4th order difference of price, respectively. These higher order properties can be linked to higher moments of price’s statistical distribution.

4
VIX products’ prices are not based on economic values as stocks are, since VIX is just a measure
of market fear. Second, volatility of VIX instruments is a measure of fear in VIX, and fear is a
very essential part of market behaviors. In-depth studies on fears shed more lights on how
markets evolve. Third, based on the same VIX, these instruments including ETNs (VXX and
VXZ) and futures are different3 yet comparable. This study on all of them minimizes the chance
of data snooping when proposing the behavioral explanation.
The main empirical findings can be summarized along two dimensions. First, contrary to
earlier studies, I find a significant positive correlation between innovations in return and
volatility for VIX products on daily basis. The positive relation turns negative when we move to
more detailed intraday intervals. However, by using regression models similar to those of
Bollerslev and Zhou (2006), the results are consistent with behavioral explanations of the
relation, but not the leverage or volatility feedback explanations. The monotonic pattern of
relation changing from positive to negative strengthens behavioral explanations.
Second, by comparing the results of multiple derivatives from VIX, I find the same
relation change pattern in all of them as well as in VIX. This result implies that the negative
relation at intraday is not because the derivatives are tradable when compared to VIX, but
originates from the underlying VIX itself. This implies that there are further behavioral effects
when market deals with fear, which itself has already been behavioral outcome (Hibbert, Daigler
and Dupoyet, 2008) .
3 VIX futures represent market expectations to VIX, and may act quite differently from the VIX. VXX and VXZ ETNs are based on VIX futures of various maturities. More information is in the data section.

5
Taken as a whole, this research shows that there is more to the return–volatility relation
than suggested by the established hypotheses. In particular, I show the lack of support for
established leverage and volatility feedback theories concerning this relation, while the results
are consistent only with behavioral explanations. In addition, I examine the characteristics of the
relation using different instruments, across samples, for bear/bull market period separately.
2. The relation between returns and volatility
2.1. The leverage and volatility feedback hypotheses
Bollerslev et al. (2007) points out that most studies show a negative correlation between
current return shocks and future volatility, and some of them illustrate that negative shocks is
associated with a larger increase in volatility than positive ones. The prevailing theories on the
negative return–volatility relation are the leverage hypothesis and the volatility feedback
hypothesis. The leverage hypothesis states that when the value of a firm falls, its financial
leverage increases as debt amount is hardly affected. Thus, the value of its equity becomes a
smaller percentage of the firm’s total value, and thus bears more risks and volatility.
The volatility feedback hypothesis postulates that positive shocks to volatility come first
to cause negative returns, with time-varying risk premiums as the link between changes in
volatility and returns (Poterba and Summers, 1986). Campbell and Hentschel (1992) show
theoretically that current stock prices (and hence returns) will fall to adjust to expected increase
in future returns when volatility increases. Empirically, Campbell and Hentschel only find weak
support for their volatility feedback hypothesis.

6
More empirical tests have been done on these hypotheses. Schwert (1989) examines the
S&P 500 daily return–volatility relation and finds it is difficult for the leverage hypothesis to
explain the observed associated negative relation. Figlewski and Wang (2001) and Bollerslev et
al. (2006) show that decreasing prices’ impact on volatility is too large to be explained by
financial leverage fluctuations alone. Glosten et al. (1993) and Engle and Ng (1993) apply
various GARCH models with asymmetric coefficients to demonstrate volatility feedback
hypothesis. Kim and Kon (1994), Tauchen et al. (1996), Andersen et al. (2001) and Dennis et al.
(2006) show that the negative effect is more pronounced for market indexes than for individual
stocks. Bekaert and Wu (2000) demonstrate that in Japanese stock market the volatility feedback
hypothesis is more likely to generate an asymmetric response than would the leverage effect.
Low (2004) finds that financial leverage is at best a weak explanation for the asymmetry.
Between them, the leverage hypothesis has few supporters (see e.g. Low, 2004), while the
volatility feedback hypothesis involves a complicated economic process that passes through
expectations and dividends to validate the negative relation and only (weakly) explains the
longer term return–volatility relation.
2.2. Behavioral explanation for the return–implied volatility relation
In contrast to the leverage and volatility feedback hypotheses which are based on firms’
fundamental value, Dennis et al. (2006) propose a behavior-based explanation, showing that the
return–volatility relation is not a firm value phenomenon, but a market one. Hibbert , Daigler
Dupoyet (2008) imply that short-term dynamic relation can be explained only with the
behavioral explanation, as the leverage and volatility feedback theories are related to a longer-

7
term lagged effect between return and volatility. They also employ behavioral concepts based on
Shefrin (2005, Chapter 18, 2007, Chapter 4)’s discussing about the negative return–risk relation
in context of representativeness, affect, and extrapolation bias. Shefrin (2005, 2007) suggest that,
based on survey results, managers and investors view high return and low risk to be
representative of good investments, and thus associate negative returns with risks.
Such association provides a behavioral explanation for the negative relation between
returns and volatilities— larger negative (positive) returns and larger (smaller) risk or volatility
are viewed as related characteristics of market behavior, when people form emotional
associations with activities. Finucane et al. (2000) suggests that such labels strongly affect
people’s decisions, which induce behavioral aspects of financial markets. Bollen and Whaley
(2004) propose the price pressure argument that investors and dealers of options bid up put
prices (for downside protection) in the fear of further losses during market downturns.
Extrapolation bias also explains why a negative (positive) return would cause traders to increase
(decrease) put option premiums.
Shefrin (1999) implies that positive returns induce the exuberance of potential additional
increases in the market, while negative returns impose fears of additional declines in the market.
Bakshi and Madan (2006) find that market crashes are significantly more severe and more likely
to happen than rallies. They show that the probability of a daily stock market decline in excess
of 5% is a non-negligible 0.25% for the past 100 years of daily Dow Jones Industrial Average
prices. Considering the severe effect of market crash, it warrants investors’ fear to market
declines and invest with behavioral biases. Low (2004) suggests that a behavioral explanation
could be the cause of the asymmetric effect of losses being associated with larger volatility
8
changes than are gains, but he does not relate his results to behavioral concepts and only
examines the leverage effect to test the overall relation.
VIX as a fear index plays double role in this study. First, VIX itself measures the ‘‘fear of
a crash” bias in the equity market, as detailed above. Second, I find behavioral biases embedded
in VIX itself and its derivatives when traded as financial assets; they manifest negative relations
between intraday returns and volatilities only, suggesting that behavioral biases could be
universal.
3. Data
This study employs daily and intraday data from three volatility instruments: VIX index,
VIX futures, and VIX ETNs including VXX and VXZ.
3.1. The VIX
According to Hibbert , Daigler Dupoyet (2008) , the Chicago Board Options Exchange’s
(CBOE) VIX index is a implied volatility determined from market bid and ask prices of the S&P
500 index options. The VIX is calculated from all available stock index option bid and ask prices
in the tradable range of these options, providing an estimate of expected stock market volatility
for the subsequent 30 calendar days (about 21 trading days). A new method of VIX calculation is
adopted in September 2003, which is based on options on the S&P 500 index, uses options
across the tradable range of all strike prices possessing both a bid and ask price, and is
independent of any option-pricing model. These features have increased the practical

9
attractiveness of the VIX, since the S&P 500 is the core index of equities in the United States,
and the new calculation procedure provides a more robust measure of expected volatility along
with option implied volatility skew. In contrast, the original VIX version of 1993, now
disseminated under the new ticker symbol VXO, is based on the S&P 100 index, considers only
near-the-money options, and is calculated using the implied volatilities obtained from the Black–
Scholes option-pricing model. I employ reconstructed values for the new VIX back to 1998.
3.2. VIX Futures
The daily futures data is downloaded from CBOE futures exchange (CFE). I rollover the
monthly VIX futures contracts to get a contract of continuous returns. Next month’s contract is
taken when its volume surpasses that of the current one. VIX Futures provide a pure play on
implied volatility and its term-structure almost independent of the direction and level of stock
prices. VIX futures may also provide an effective way to hedge equity downside risks, to
diversify portfolios, and to profit from implied vs. realized volatility spread.
3.3. VIX ETNs: VXX and VXZ
In addition to VIX futures which are remote to small investors, there are ETNs based on VIX
futures and traded like stocks on NYSE. VXX, the iPath S&P 500 VIX Short-Term Futures ETN
starts to trade on 01/30/2009. Its daily volume reaches aboe 3 million in January 2010, and
skyrockets to over 20 million in April 2011. VXZ is its mid-term counterpart with a daily

10
volume around 1 million in April 2011. Their daily data are collected from Commodity Systems,
Inc (CSI).
Just like VIX futures, VXX and VXZ allow investor to buy volatility. Actually, they do not
directly track VIX, but VIX futures indexes. VXX follows the S&P 500 VIX Short-Term Futures
Index®, which is daily rolled to long the first and second month VIX futures. At every trading
day’s close, a proportion of investment on the first month VIX futures will be sold to buy the
second month futures according to the ratio of the two contracts’ days to maturity. Thus at the
maturity day of the first contract, investment to it will be sold out and all goes to the second
contract. On the following day, investment will start to partially flow from the full-invested
contract to the next contract with even longer maturity. VXZ follows the same rolling method,
except money flows into and rolls among all next four contracts in proportion to each contract’s
days to maturity. Thus VXX and VXZ allow investing on VIX term-structures in addition to
current VIX level.
3.4. Intraday ETNs and futures data
Intraday (15-min, 5-min and 1-min) VXX, VXZ, and futures data are downloaded from
Interactive Brokers LLC. from January 2010 through April 2011. I also check one month data of
the sample against Fidelity’s intraday data for quality purpose, and no discrepancy is noticed
between them.
I do not have full intraday data for all VIX futures contracts from January 2010 to May 2011.
To address the missing data issue, I randomly select one day data for each current futures

11
contract and compare its 1-min data with those of VXX on the same day. Results show that VXX
and VIX futures are highly correlated at 1-min interval with a coefficient of 93%. The similarity
is not unexpected as, on intraday basis, there is no roll-over yield kicking in between VXX and
futures, unlike the over-night difference due to daily rollover at market close.
4. Methodology
This paper applies a method similar to Bollerslev and Zhou (2006) and Hibbert , Daigler
Dupoyet (2008) via the regression below.
Volt = 0 + 1Rt + 2Rt-1 + 3Rt-2 + 4Rt-3 + 7Volt-1 + 8Volt-2 + 9Volt-3 + t (1)
In this model, returns Rt’s coefficient 1 captures the contemporaneous relation between
returns and volatility, and we focus on its sign and significance. Other coefficients i shows
lagged relations. Hibbert , Daigler Dupoyet (2008) also suggests that significant lagged volatility
changes (7 to 9) are indicative of behavioral effect. I run regress on daily, 15-min, 5-min, 1-
min data for VXX, VXZ, VIX futures and VIX, and compare coefficients across intervals and
instruments.
5. Results
5.1. Summary statistics
Table 1 presents statistical properties of each financial instruments (VXX, VXZ, VIX
Futures and VIX) ’s daily volatility Vol, volatiliy percent change Vol, and its return Rt . It

12
shows VIX futures are close to VIX in terms of Vol and Rt, while it has a larger Vol. VXZ’s
Vol and Rt are about half of those of VXX’s respectively, which in turn are about half of VIX
and VIX futures’s. VXZ and VIX futures have comparable Vol.
5.2. The relation between returns and volatility for daily data
Table 2 shows surprising results for daily regression of the four VIX instruments: VXX,
VXZ, VIX Futures and VIX. In contrast to previous studies displaying negative returns-volatility
relation, it demonstrates positive relation in all of them. For period of May 3, 2010 through
April 29, 2011 which is compatible with our intraday data sample, t-statistics of Rt are between
2.4 and 4.85 with VXZ has the least of 2.42, while none of the lagged Rt-1 to Rt-3 is significant.
For more data going back as far as January 19984, similar positive relation is found for VXX,
VIX futures and VIX (Panel B). Now VXZ’s Rt is marginally significant (t-statistic 1.71) and
some of the lagged Vol are positive and significant.
Even though VIX itself is negatively related to S&P500 returns (Hibbert, Daigler, and
Dupoyet, 2008), this relation does not apply to VIX’s returns and volatility at all. Obviously, the
leverage and volatility feedback hypotheses are not effective here as we identify no negative
relation. Furthermore, the fundamental properties of them imply there is no possibility of inverse
leverage or inverse volatility feedback to address the positive relation5.
4 As shown in the summary statistics part, VXX is liquid after January 2010, VXZ after March 2010, and VIX futures after January 2000. VIX itself does not have volumes to measure liquidity, and we its data since January 1998 as in Hibbert, Daigler, and Dupoyet (2008).
5 We cannot state that, as financial assets, VXX, VXZ, and VX futures’ positive returns have similar economic benefits as increases in volatility, according to return-risk premium relation in finance.

13
5.3. The relation between returns and volatility for intraday data
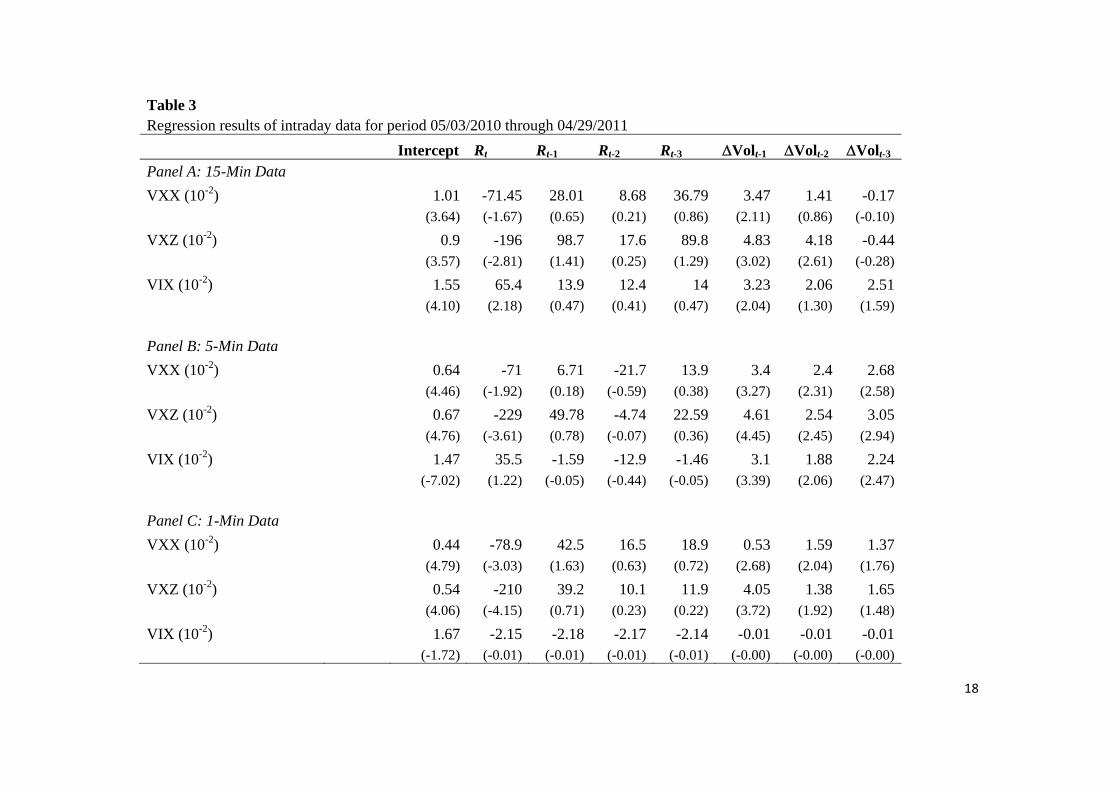
Table 3 provides results for intraday (15-min, 5-min and 1-min) regressions. In contrast
to daily results in Table 2, intraday VXX, VXZ displays negative returns and volatility relation,
and implies that such negative relation is getting stronger from 15-min to 1-min, with
monotonically decreasing Rt t-statistics (from -1.67 to -3.03 for VXX, and from -2.81 to -4.15 for
VXZ). VIX’s Rt follow a similar trend of decreasing t-statistics. While its 15-min (t-statistic 2.18)
and 5-min results still have positive relation as daily data does, 1-min data begin to exhibits
negative relation. No significant negative relation is found for lagged returns Rt-1 to Rt-3, which is
inconsistent with leverage or volatility feedback hypotheses.
Lagged volatility change Volt-1 is significant at all intraday intervals for VXX and VXZ,
while mostly not for daily data. Volt-2 and Volt-3 are mainly significant at 5-min and 1-min
intervals6. These are signs of behavioral effect according to our model.
5.4. Results summary and robustness check
Taken daily and intraday results together, we can identify a clear decreasing relation
(from positive to negative) between returns and volatility from larger to smaller interval. Either
leverage or volatility feedback models can explain the intraday negative relation (Hibbert,
Daigler, and Dupoyet , 2008), let alone a increasingly stronger negative one in shorter intervals.
6 5-min data have the most significant Vol than daily, 15-min and 1-min. This may suggest a behavioral time span around 5 minutes, as behaviors take time to form.
14
A more stark comparison is between VIX and VXX/VXZ, VIX’s positive relation is
getting weaker when intervals move from daily down to 1-min. This implies that the negative
relation is not because VXX and VXZ are tradable when compared to VIX, but originates from
the underlying VIX7.
For robustness check, we separate from the whole data sample the bear market period of
May 3, 2010 through July 2, 2010, which is the only bear market with length over 1 month since
March 2009. Table 4 shows that at daily and 15-min: all four products’ relations are negative,
and none is significant with VXX’s Rt has the lowest t-statistic -1.3. However, 1-min intervals
are negative and significant. Sample other than the bear period display similar relation trend.
Based on these results we conclude that neither leverage nor volatility feedback
hypothesis is consistent with intraday-only cotemporaneous negative return–volatility results.
These theories suggest that the negative relation should exist from returns to volatility over a
long lag time, not contemporaneously, as shown above. However, the significance of lagged
volatility changes’ effect supports the behavioral extrapolation bias.
6. Summary and conclusions
This paper examines the short-term relationship of ETNs and futures on VIX–the implied
volatility index, also known as the fear index. As these instruments’ prices are derived from
volatility, it is worthwhile to test if such relationship exists. I find that there is no negative
relation for VIX ETNs or futures on daily basis, while it exists for intraday 5-min and 1-min data.
7 I am collecting 15-sec, 30-sec VIX data to prove this.

15
Similar to Hibbert, Daigler and Dupoyet (2008), this paper shows that the negative
association of return to changes in implied volatility is consistent with behavioral explanations of
this phenomenon, while the leverage and volatility feedback models do not explain short-term
only negative relation or relation changes from daily positive to intraday negative one.

16
Table 1 Statistical properties of the daily data
Volt Volt(%) Rt(%) VXX mean 11.5 0.41 0.57VXX std. dev. 4.41 7.48 3.58VXZ mean 5.92 0.21 0.12VXZ std. dev. 2.53 7.85 1.89VIX Futures mean 23.3 0.29 0.25VIX Future std. dev. 10.7 8.74 7.34VIX mean 19.9 0.18 0.21VIX std. dev. 6.59 6.19 6.01
The Volt is the annualized historical 21-day volatility calculated from daily close prices, and Volt is its daily percent change. Rt is the daily return on each ticker. All tickers’ data end on April 29, 2011. The sample period for the VIX begins from January 1998, VIX futures from January 2000, VXX from January 2010, and VXZ from March 2010.
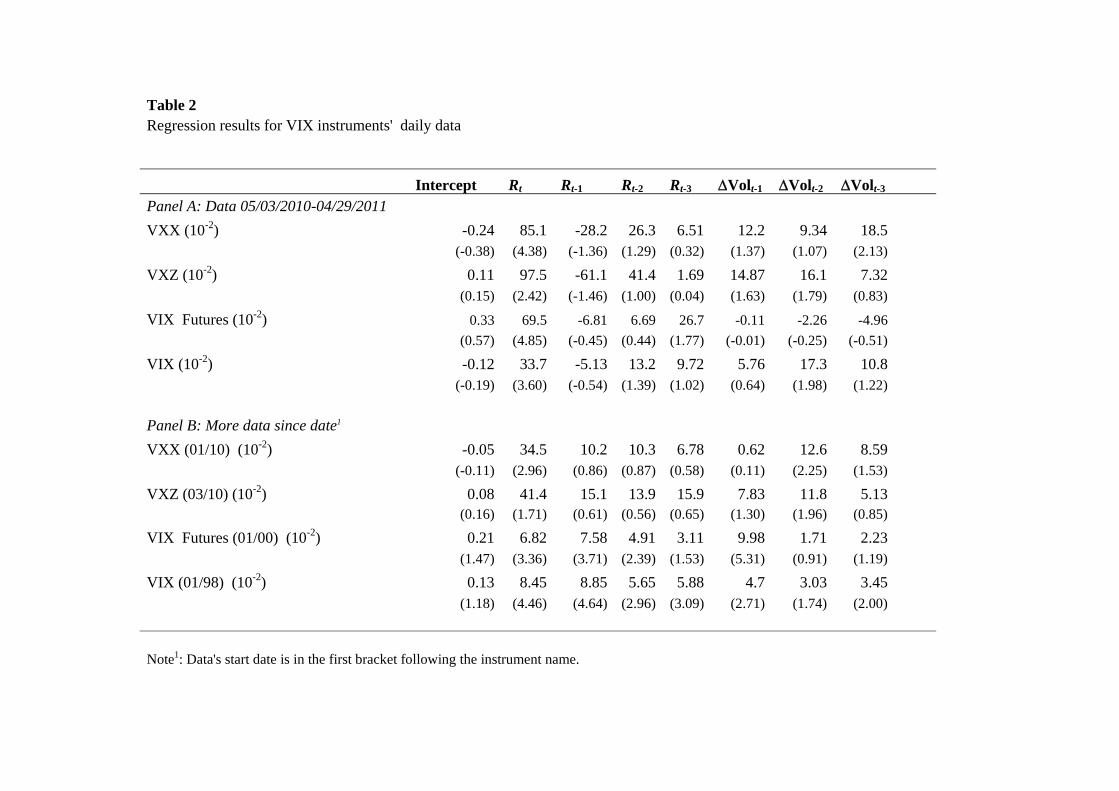
Table 2 Regression results for VIX instruments' daily data
Intercept Rt Rt-1 Rt-2 Rt-3 Volt-1 Volt-2 Volt-3 Panel A: Data 05/03/2010-04/29/2011
VXX (10-2) -0.24 85.1 -28.2 26.3 6.51 12.2 9.34 18.5(-0.38) (4.38) (-1.36) (1.29) (0.32) (1.37) (1.07) (2.13)
VXZ (10-2) 0.11 97.5 -61.1 41.4 1.69 14.87 16.1 7.32(0.15) (2.42) (-1.46) (1.00) (0.04) (1.63) (1.79) (0.83)
VIX Futures (10-2) 0.33 69.5 -6.81 6.69 26.7 -0.11 -2.26 -4.96
(0.57) (4.85) (-0.45) (0.44) (1.77) (-0.01) (-0.25) (-0.51)
VIX (10-2) -0.12 33.7 -5.13 13.2 9.72 5.76 17.3 10.8(-0.19) (3.60) (-0.54) (1.39) (1.02) (0.64) (1.98) (1.22)
Panel B: More data since date1
VXX (01/10) (10-2) -0.05 34.5 10.2 10.3 6.78 0.62 12.6 8.59(-0.11) (2.96) (0.86) (0.87) (0.58) (0.11) (2.25) (1.53)
VXZ (03/10) (10-2) 0.08 41.4 15.1 13.9 15.9 7.83 11.8 5.13(0.16) (1.71) (0.61) (0.56) (0.65) (1.30) (1.96) (0.85)
VIX Futures (01/00) (10-2) 0.21 6.82 7.58 4.91 3.11 9.98 1.71 2.23(1.47) (3.36) (3.71) (2.39) (1.53) (5.31) (0.91) (1.19)
VIX (01/98) (10-2) 0.13 8.45 8.85 5.65 5.88 4.7 3.03 3.45(1.18) (4.46) (4.64) (2.96) (3.09) (2.71) (1.74) (2.00)
Note1: Data's start date is in the first bracket following the instrument name.
18
Table 3 Regression results of intraday data for period 05/03/2010 through 04/29/2011
Intercept Rt Rt-1 Rt-2 Rt-3 Volt-1 Volt-2 Volt-3 Panel A: 15-Min Data
VXX (10-2) 1.01 -71.45 28.01 8.68 36.79 3.47 1.41 -0.17(3.64) (-1.67) (0.65) (0.21) (0.86) (2.11) (0.86) (-0.10)
VXZ (10-2) 0.9 -196 98.7 17.6 89.8 4.83 4.18 -0.44(3.57) (-2.81) (1.41) (0.25) (1.29) (3.02) (2.61) (-0.28)
VIX (10-2) 1.55 65.4 13.9 12.4 14 3.23 2.06 2.51(4.10) (2.18) (0.47) (0.41) (0.47) (2.04) (1.30) (1.59)
Panel B: 5-Min Data
VXX (10-2) 0.64 -71 6.71 -21.7 13.9 3.4 2.4 2.68(4.46) (-1.92) (0.18) (-0.59) (0.38) (3.27) (2.31) (2.58)
VXZ (10-2) 0.67 -229 49.78 -4.74 22.59 4.61 2.54 3.05(4.76) (-3.61) (0.78) (-0.07) (0.36) (4.45) (2.45) (2.94)
VIX (10-2) 1.47 35.5 -1.59 -12.9 -1.46 3.1 1.88 2.24(-7.02) (1.22) (-0.05) (-0.44) (-0.05) (3.39) (2.06) (2.47)
Panel C: 1-Min Data
VXX (10-2) 0.44 -78.9 42.5 16.5 18.9 0.53 1.59 1.37(4.79) (-3.03) (1.63) (0.63) (0.72) (2.68) (2.04) (1.76)
VXZ (10-2) 0.54 -210 39.2 10.1 11.9 4.05 1.38 1.65(4.06) (-4.15) (0.71) (0.23) (0.22) (3.72) (1.92) (1.48)
VIX (10-2) 1.67 -2.15 -2.18 -2.17 -2.14 -0.01 -0.01 -0.01(-1.72) (-0.01) (-0.01) (-0.01) (-0.01) (-0.00) (-0.00) (-0.00)

19
Table 4 Regression results for bear period of 05/03/2010-07/02/2010
Intercept Rt Rt-1 Rt-2 Rt-3 Volt-1 Volt-2 Volt-3 Panel A: Daily Data1
VXX (10-2) 0.00609 -0.2904 0.15045 -0.0434 0.11444 0.21546 -0.0885 0.22835(0.49) (-1.30) (0.69) (-0.20) (0.55) (1.32) (-0.54) (1.49)
VXZ (10-2) 0.01127 -0.1648 1.0196 -0.026 0.15027 0.04589 0.08398 0.02285(0.59) (-0.25) (1.63) (-0.04) (0.23) (0.26) (0.47) (0.14)
VIX Futures (10-2) -0.01227 -0.02019 0.15317 0.15546 0.008824 0.17356 0.38146 0.066705
(-1.04) (-0.29) (2.18) (2.11) (0.13) (0.95) (2.22) (0.40)
VIX (10-2) 0.02285 -0.184 0.306 0.02945 0.00891 -0.0254 0.23059 -0.0095(0.71) (-0.81) (1.42) (0.14) (0.04) (-0.14) (1.37) (-0.06)
Panel B: 15-Min Data
VXX (10-2) 1.15 -24.6 -4.76 -23.8 48.7 0.86 -3.35 2.68(1.87) (-0.4) (-0.08) (-0.40) (0.81) (0.25) (-0.98) (-0.78)
VXZ (10-2) 1.07 -38.9 -72.5 9.01 221 2.39 0.21 -9.24(1.70) (-0.22) (-0.41) (0.05) (1.27) (0.59) (0.05) (-2.26)
VIX (10-2) 1.18 -26.5 10.5 -7.69 20.1 3.89 -3.83 1.68(1.93) (-0.77) (-0.3) (-0.22) (0.59) (1.14) (-1.11) (0.48)
Panel C: 5-Min Data
VXX (10-2) 0.91 237 -10.9 24.1 145 2.06 2.28 1.73(2.45) (1.99) (-0.37) (1.66) (1.16) (1.10) (1.78) (0.98)

20
VXZ (10-2) 0.87 326 -54.3 -21.4 203 2.63 3.75 1.53(2.46) (1.94) (-0.32) (-0.13) (1.21) (1.13) (1.61) (0.66)
VIX (10-2) 0.88 47.15 -17.33 49.5 45.3 1.95 1.79 1.51(2.64) (1.31) (-0.47) (1.36) (1.26) (1.00) (0.92) (0.71)
Panel D: 1-Min Data
VXX (10-2) 0.44 -78.9 42.5 16.5 18.9 0.53 1.59 1.37(4.79) (-3.03) (1.63) (0.63) (0.72) (0.68) (2.04) (1.76)
VXZ (10-2) 0.34 -62.1 40.3 17.2 15.1 0.79 1.76 1.25(4.01) (-2.03) (1.22) (0.49) (0.65) (0.59) (2.00) (1.68)
VIX (10-2) 0.38 -65.8 57.6 13.6 17.8 0.73 1.02 1.65(3.69) (-2.51) (1.99) (0.44) (0.60) (0.55) (1.91) (1.66)
Note1: Since the volatility is calculated from 21-period data, the real data sample begins on 04/05/2010. I also adjust data in the same way for 15-min and 5-min regressions.

References
Andersen, T.G., Bollerslev, T., Diebold, F.X., Ebens, H., 2001. The distribution of stock return volatility. Journal of Financial Economics 61, 43–76.
Andersen, T.G., Bollerslev, T., Diebold, F.X., Labys, P., 2003. Modeling and forecasting realized volatility. Econometrica 75, 579–626.
Bakshi, G., Madan, D., 2006. Crash discovery in the stock market. Working Paper, University of Maryland.
Bekaert, G., Wu, G., 2000. Asymmetric volatility and risk in equity markets. Review of Financial Studies 13, 1–42.
Black, F., 1976. Studies of stock market volatility changes. Proceedings of the American Statistical Association, Business and Economic Statistics Section, 177–181.
Bollen, N.P.B., Whaley, R.E., 2004. Does net buying pressure affect the shape of the implied volatility functions? Journal of Finance 59, 711–753.
Bollerslev, T., Zhou, H., 2006. Volatility puzzles: A simple framework for gauging return–volatility regressions. Journal of Econometrics 131, 123–150.
Bollerslev, T., Litvinova, J., Tauchen, G., 2006. Leverage and volatility feedback effects in high-frequency data. Journal of Financial Econometrics 4 (3), 353–384.
Bollerslev, T., Kretschmer, U., Pigorsch, C., Tauchen, G., 2007. A discrete-time model for daily S&P 500 returns and realized variations: Jumps and leverage effects. Working Paper, Duke University.
Campbell, J.Y., Hentschel, L., 1992. No news is good news: An asymmetric model of changing volatility in stock returns. Journal of Financial Economics 31, 281–318.
Christie, A., 1982. The stochastic behavior of common stock variances: Value, leverage and interest rate effects. Journal of Financial Economics 10, 407–432.
David, A., Veronesi, P., 2002. Option prices with uncertain fundamentals, Working Paper, Board of Governors of the Federal Reserve System.
Dennis, P., Mayhew, S., Stivers, C., 2006. Stock returns, implied volatility innovations, and the asymmetric volatility phenomenon. Journal of Financial and Quantitative Analysis 41, 381–406.
Engle, R.F., Ng, V.K., 1993. Measuring and testing the impact of news on volatility. Journal of Finance 48, 1749–1778.

22
Figlewski, S., X. Wang, 2001. Is the leverage effect a leverage effect. Working Paper, New York University.
Finucane, M., Alhakami, A., Slovic, P., Johnson, S., 2000. The affect heuristic in judgments of risks and benefits. Journal of Behavioral Decision Making 13, 1–17.
Fleming, J., Ostdiek, B., Whaley, R., 1995. Predicting stock market volatility: A new measure. The Journal of Futures Markets 15, 265–302.
Giot, P., 2005. Relationships between implied volatility indexes and stock index returns. Journal of Portfolio Management 31, 92–100.
Glosten, L.R., Jagannathan, R., Runkle, D.E., 1993. On the relation between the expected value and the volatility of the nominal excess return on stocks. Journal of Finance 48, 1779–1801.
Hibbert ,A. M., and Daigler, R. T., Dupoyet, B, 2008. A behavioral explanation for the negative asymmetric. Journal of Banking & Finance 32(10), 2254–2266.
Kim, D., Kon, S., 1994. Alternative models for the conditional heteroskedasticity of stock returns. Journal of Business 67, 563–598.
Lien D., Yang L., 2008. Asymmetric effect of basis on dynamic futures hedging: Empirical evidence from commodity markets. Journal of Banking & Finance 32(2), 187-198.
Low, C., 2004. The fear and exuberance from implied volatility of S&P 100 index options. Journal of Business 77, 527–546.
Poterba, J.M., Summers, L.H., 1986. The persistence of volatility and stock market fluctuations. American Economic Review 76, 1142–1151.
Schwert, G.W., 1989. Why does stock market volatility change over time? Journal of Finance 44, 1115–1153.
Shefrin, H., 1999. Irrational exuberance and option smiles. Financial Analysts Journal, 91–103.
Shefrin, H., 2005. A Behavioral Approach to Asset Pricing. Elsevier, Burlington, MA.
Shefrin, H., 2007. Behavioral Corporate Finance. McGraw Hill, New York.
Tauchen, G., Zhang, H., Liu, M., 1996. Volume, volatility and leverage: A dynamic analysis. Journal of Econometrics 74, 177–208.
Whaley, R., 2000. The investor fear gauge. Journal of Portfolio Management 26, 12–17.

23
Wu, G., 2001. The determinants of asymmetric volatility. Review of Financial Studies 14, 837–859.