Embed Size (px)
Citation preview

STATENS SERUM INSTITUT
Relationship BetweenAntibiotic Consumption
and Resistancein European Hospitals
Dominique L. MonnetNational Center for Antimicrobials and Infection Control,
Statens Serum Institut, Copenhague, Danemark
STATENS SERUM INSTITUT
The World (of Antimicrobial Resistance) According to… Human Bacterial Pathogens and Their Habitat
H
R Strep. pneumoniae
R Haem. influenzae
R Pseudomonas aeruginosaR Acinetobacter baumannii
Foo
dA
nim
als
Hum
ans
Hum
ans
R Salm.
R Camp.
R E. coli
R E. coli
MRSA
RS. aureus
RS. aureus
le MONDe de la Résistance Intrinsèque et Acquise aux ANtibiotiques ;-).

STATENS SERUM INSTITUTAntimicrobial Consumption and Resistance:
Examples from ARPAC European Hospitals, 2001
n=112R2 =0.07
n=110R2 =0.09
Source: ARPAC, 2004 (http://www.abdn.ac.uk/arpac/)
0 1 2 3 4 5 6 7 80
10
20
30
40
50
Carbapenem cosumption(J01DH, DDD/100 bed-days)
% Im
ipen
em-r
esis
tan
tP
seu
do
mo
nas
aer
ug
ino
sa0 5 10 15 20
0
10
20
30
40
50
Fluoroquinolone consumption(J01MA, DDD/100 bed-days)
% F
luo
roq
uin
olo
ne-
resi
stan
tE
sch
eric
hia
co
li(%
)

STATENS SERUM INSTITUT
Antimicrobial Use (DDD/1,000 pt-days)
% R
esis
tant
bact
eria
+
++
+ +++
++
++
++
+
+
++
+
++ + +
+
Usefulness of Antimicrobial Resistance and Antimicrobial Use Data Comparison
Low level of resistanceLow antimicrobial use
High level of resistanceLow antimicrobial use
High level of resistanceHigh antimicrobial use
Low level of resistanceRelatively high antimicrobial use
Area of improvement: antimicrobial use
Possible area of improvement: detection of resistance in the laboratoryPossible explanation: resistant bacteria has not been introduced in setting
Possible areas of improvement: . infection control. identif. of colonized patientsupon admission
. appropriate dosage (low dose)
. use of other antimicrobials
Source : Int J Antimicrob Agents 2000;15:91-101 (adapted from CDC/NNIS/ICARE Phase 1).
median
median+

STATENS SERUM INSTITUT
Source: Goossens H, et al. Lancet 1986;2:804.
R = 0.90p < 0.005
Gentamicin useprevious year (g/year)
Gentamicin usesame year (g/year)
% G
enta
mic
in-r
esis
tant
gram
-neg
ativ
e ba
cilli
Gentamicin Use and %Gentamicin-ResistantGram-Neg. Bacilli Isolates, Brussels, 1979-1986
02468
10
0 500 1000 1500 2000
02468
10
0 500 1000 1500 2000

STATENS SERUM INSTITUTPercent Ceftazidime-Resistant/Intermediate
Gram-Negative Bacilli and Hospital Ceftazidime Use, Hospital Vega Baja, Spain, 1991-1998
ViResiSTSource: Monnet DL, et al. Clin Microbiol Infect 2001; 7(Suppl 5):29-36.
Yearly data Monthly data(5-month moving average)
0
2
4
6
8
10
12
Jan-
91
Jan-
92
Jan-
93
Jan-
94
Jan-
95
Jan-
96
Jan-
97
Jan-
98
0
2
4
6
8
10
12
1991 1992 1993 1994 1995 1996 1997 1998
Ceftazidime use (DDD/1,000 pt-days) Ceftazidime-resistant GNB (%)

STATENS SERUM INSTITUT
Source: FT Investor Financial Times, 7/29/2002.
Examples of Time SeriesDow Jones Industrial Average
Source: Aiello AE & Larson EL. Lancet Infect Dis 2002;2:103-10.
Crude Death Rates for InfectiousDiseases, USA, 1900-1996

STATENS SERUM INSTITUT
ErrUDA with ErrRes
Nº de retardos
76543210-1-2-3-4-5-6-7
CC
F
1.0
.5
0.0
-.5
-1.0
Límites confianza
Coeficiente
CCF
n To assess relationships between a target (output) series and one orseveral explanatory (input) seriesn Various types of models: transfer
function (TF), polynomial distributedlag (PDL), etc.n TF models: cross-correlation function
(CCF) to identify time lags betweenseries
0
2
4
6
8
10
12
Jan-91
Jul-91
Jan-9
2Jul
-92Jan
-93Jul
-93Jan
-94Jul
-94Ja
n-95
Jul-95
Jan-96
Jul-96
Jan-97
Jul-97
Jan-9
8Jul
-98
0
2
4
6
8
10
12
Multivariate Time Series Analysis
Sources: Helfenstein U. Stat Meth Med Res 1996;5:3-22.Haugh LD. J Am Stat Assoc 1976;71:378-385.Pankratz A. Forecasting with dynamic regression models. New York, NY: Wiley, 1991.

STATENS SERUM INSTITUT
Ceftazidime Use1 month before
ViResiST
R2=0.44
Average delay = 1 month+1 DDD/1,000 patient-days = 6.5 days of treatment à +0.42 %R
e.g. from R = 5% à R = 5.42 %
Source : López-Lozano JM, et al. Int J Antimicrob Agents 2000;14:21-30.
Transfer Function Model for Percent Ceftazidime-Resistant/Intermediate Gram-Negative Bacilli Series
(taking into account hospital ceftazidime use)
Term Parameter (SE) T-ratio P-value
Constant 1.354 (0.760) 1.78 0.078
AR3 0.352 (0.096) 3.68 < 0.001
AR5 0.265 (0.098) 2.72 < 0.01
ULAG1 0.420 (0.096) 4.34 < 0.0001
STATENS SERUM INSTITUT
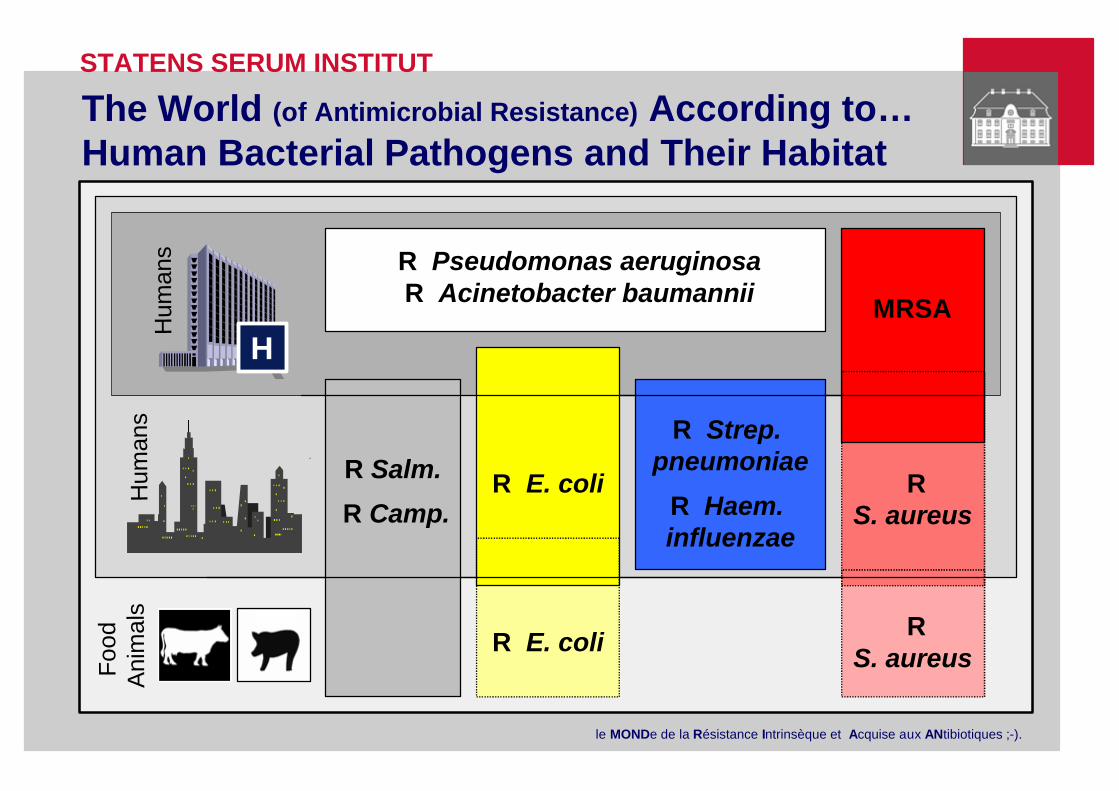
Source : Monnet DL, et al. Clin Microbiol Infect 2001; 7(Suppl 5):29-36. ViResiSTMonths
5-Month Moving Average Percent Amikacin-Resistant/Intermediate P. aeruginosa and Hospital
Antimicrobial Use, Hospital Vega Baja, Spain, 1991-1999
0
10
20
30
40
50
60
70
Amikacin use(DDD/1,000 pt-dys)
Amikacin-R P. aeruginosa (%)

STATENS SERUM INSTITUT
0
10
20
30
40
50
60
70Gentamicin use(DDD/1,000 pt-dys)
Tobramycin use(DDD/1,000 pt-days)
Cefotaxime use(DDD/1,000 pt-dys)
Ceftazidime use(DDD/1,000 pt-dys)
Ceftriaxone(DDD/1,000 pt-dys)
Amikacin use(DDD/1,000 pt-dys)
Amikacin-R P. aeruginosa (%)Months
Source : Monnet DL, et al. Clin Microbiol Infect 2001; 7(Suppl 5):29-36. ViResiST
5-Month Moving Average Percent Amikacin-Resistant/Intermediate P. aeruginosa and Hospital
Antimicrobial Use, Hospital Vega Baja, Spain, 1991-1999

STATENS SERUM INSTITUT
Source : Monnet DL, et al. Clin Microbiol Infect 2001; 7(Suppl 5):29-36. ViResiST
Transfer Function Model for PercentAmikacin-Resistant Pseudomonas aeruginosa Series
(taking into account aminoglycoside and 3rd-generation cephalosporin use)
Term Order Parameter (SE) T-ratio P-value
Constant 0 -20.741 (4.516) -4.59 < 0.001
Amikacin 7 0.973 (0.391) 2.49 < 0.02
Gentamicin 7 0.420 (0.153) 2.75 < 0.01
Cefotaxime 3 0.297 (0.112) 2.66 < 0.01
Cefotaxime 6 0.437 (0.110) 3.98 < 0.001
AR 2 0.295 (0.091) 3.24 < 0.01

STATENS SERUM INSTITUT
* only 55.3% of isolates were tested for susceptibility to ceftriaxone
ViResiSTSource: Monnet DL, et al. Clin Microbiol Infect 2001; 7(Suppl 5):29-36.
Co-Resistances in Amikacin-Resistant/Intermediateand Susceptible Pseudomonas aeruginosa Isolates,
Hospital Vega Baja, Spain, 1991-1999
Cross-resistance Amikacin-R/I Amikacin-S RR P-valueno. (%) no. (%)
Gentamicin-R/I 78 (97.5) 177 (17.5) 128.0 <0.0000001 Cefotaxime-R/I 73 (91.3) 840 (83.0) - NS Ceftriaxone-R/I* 40 (81.6) 361 (74.7) - NS Tobramycin-R/I 34 (42.5) 18 (1.8) 14.8 <0.0000001 Ceftazidime-R/I 15 (18.8) 37 (3.7) 4.6 <0.0000001
Co-resistance

STATENS SERUM INSTITUT
ViResiST
R2=0.902
Source: Monnet DL, et al. Emerg Infect Dis 2004;10:1432-1441.
%MRSA and Monthly Use of Macrolides, Third-Generation Cephalosporins and Fluoroquinolones,
Aberdeen Royal Infirmary, 01/1996-12/2001
Explaining variable
for monthly %MRSA
Lag (months) Estimated
coefficient
%MRSA 1 0.420
Macrolide use 1,2,3 0.165
Third-generation
cephalosporin use4,5,6,7 0.290
Fluoroquinolone use 4,5 0.255
Constant - - 36.7

STATENS SERUM INSTITUT
ViResiSTUpdated from: López-Lozano JM, et al. Int J Antimicrob Agents 2000;14:21-30.
% Im
ipen
em-r
esis
tant
/inte
rmed
iate
Pse
udom
onas
aeru
gino
sa
Ho
spit
al im
ipen
emus
e(D
DD
/1,0
00 p
atie
nt-
day
s)
Average delay = 1 month
1 DDD/1,000 pat-days à +0.40 %R
5-Month Moving Average Percent Imipenem-Resistant/Intermediate P. aeruginosa and Hospital
Imipenem Use, Hospital Vega Baja, Spain, 1991-1999
0
5
10
15
20
25
Jan -91
Jul -9
1
Jan -92
Jul -9
2
Jan -93
Jul -9
3
Jan -94
Jul -9
4
Jan -95
Jul -9
5
Jan -96
Jul -9
6
Jan -97
Jul -9
7
Jan -98
Jul -9
80
5
10
15
20
25
30

STATENS SERUM INSTITUT
Univ. Hospital, Ulm (D)Lepper et al. AAC 2002;46:2920-5.
Univ. Hospital, Antwerp (B)Goossens H, et al. Unpublished data.
Univ. Hospital, Utah (USA)Samore MH, et al. Unpublished data.
Centre Hosp. Mulhouse (F)Aujoulat O, Delarbre JM. ViResiST.
Averagedelay
= 0-1 month
Averagedelay
= 0-2 months
Averagedelay
= 0-1 month
Averagedelay
= n.a.
%Carbapenem-Resistant Pseudomonas aeruginosaand Carbapenem Use in 4 Hospitals, 1996-2003
ViResiST0
10
20
30
40
Jan -97
Jan -98
Jan -99
Jan -00
Jan -01
Jan -02
Car
bap
enem
use
(D
DD
/100
pt-
days
)
0
1
2
3
4
5
Car
bap
enem
-res
ista
nt
P.a
eru
gin
osa
(%)
0
10
20
30
40
Jan -96
Jan -97
Jan -98
Jan -99
Jan -00
Jan -01
Car
bap
enem
use
(D
DD
/100
pt-
days
)
0
0.5
1
1.5
2
Car
bap
enem
-res
ista
nt
P.a
eru
gin
osa
(%)
0
10
20
30
40
Jan -99
Jan -00
Jan -01
Jan -02
Jan -03
Jan -04
Car
bap
enem
use
(D
DD
/100
pt-
days
)
0
0.1
0.2
0.3
0.4
0.5
Imip
enem
-res
ista
nt
P.a
eru
gin
osa
(%)

STATENS SERUM INSTITUT
ACR Chart
Source: Muller A, et al. (available free-of-charge, September 2005)

STATENS SERUM INSTITUTEffects of reduction of quinolone use
on antibiotic susceptibility in P. aeruginosa, Pittsburgh (PA), 2001-2004
Source: Paterson DL, et al. 44th ICAAC, Washington (DC), 30-10/2-11-2004, abstr. K-347.

STATENS SERUM INSTITUT
Effect of Restricting Fluoroquinolones, ICU, Saint-Etienne (F), 2000-2002
Source: Aubert G, et al. J Hosp Infect 2005;59:83-89.
0
100
200
300
400
500
Jan-Dec2000
Jan-Jun2001
Jul 2001-Jun 2002
Flu
oroq
uino
lone
con
sum
ptio
n(D
DD
/1,0
00 p
atie
nt-d
ays)
0
20
40
60
80
Res
ista
nce
(%) Fluoroquinolone
consumptionCiprofloxacin-RP. aeruginosaOfloxacin-R S. aureusMRSA

STATENS SERUM INSTITUTAntibiotic Rotation and Development of Gram-Negative Antibiotic Resistance, Surgical ICU, Utrecht (NL), 2001-2002
Levofloxacin Cefpirome Levofloxacin Pip/Tazo
Source: van Loon HJ, et al. AJRCCM, in press (published online, October 29, 2004).
Proportion of patients treated (%)
Levofloxacin 40 0 52 5 Cefpirome 0 44 0 0Pip/Tazo 6 1 1 55
STATENS SERUM INSTITUT
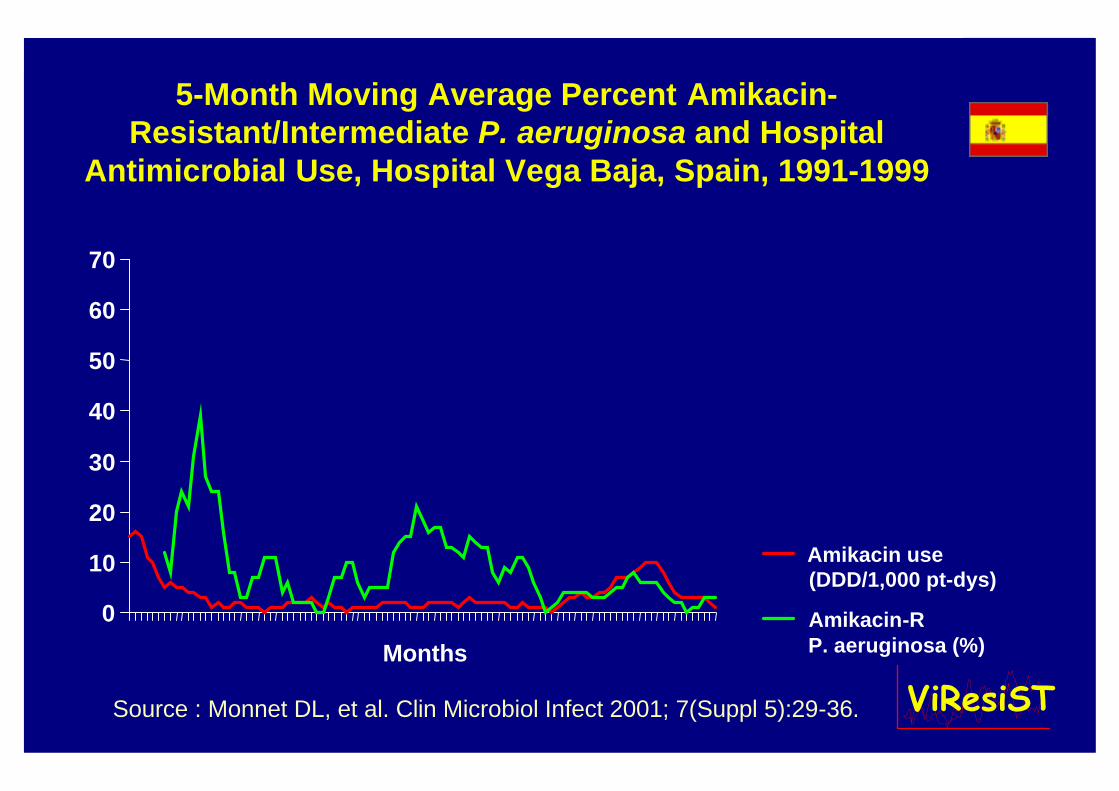
Cycling Mixing
180016001400120010008006004002000
0.7
0.6
0.5
0.4
0.3
0.2
0.1
Fra
ctio
n R
esis
tant
180016001400120010008006004002000
0.7
0.6
0.5
0.4
0.3
0.2
0.1180016001400120010008006004002000
0.7
0.64
0.58
0.52
0.46
0.4
0.34
0.28
0.22
0.16
0.1
Time (days)
10 day cycles 360 day cycles90 day cycles
Source: Bergstrom CT, et al. Proc Natl Acad Sci USA 2004;101:13285-90.
Effect of Cycle Length

STATENS SERUM INSTITUT
Areas for Future Research
nAdequation between studies at patient level and time series analyses?nAre these relationships found in every hospital?nMore on the effect of interventions aiming at
rationalizing antimicrobial prescriptionsnShort cycling vs. optimal mixing of prescriptionsnMRSA vs. antimicrobial consumptionnOutbreaks vs. endemic situationsn Interaction between infection control and
antimicrobial consumption

STATENS SERUM INSTITUT
Colistin
Pan-resistantGram-neg. bact.
Pan-Resistant Gram-Negative Bacilli
• ICU, Henry Dunant Hosp., Athens, Greece, 2001-2004Falagas ME, et al. BMC Infect Dis 2005;5:24.
0
1
2
Jan.
2001
Jan.
2002
Jan.
2003
Jan.
2004
No.
cas
esPrior colisitin use (days) 0 23 11 33,31 6
† †
• Hosp. Clinico San Carlos, Madrid, 08/2003-08/2004: >20 pts with carbapenem-R, colistin-R P. aeruginosaSánchez A, et al. Rev Esp Quimioterap 2004;17:336-40.
Carbapenem-R, colistin-S only
Gram-neg. bact.
3rd-gen. cephs-RGram-neg. bact.
Carbapenems

STATENS SERUM INSTITUT
Illustration: Prittie EJ. Philadeplphia, PA: JC Winston, 1930.
It’s a numbers
game!