Embed Size (px)
Citation preview
Relationship Between Atmospheric Dissolved Depositionand Mineral Dust Deposition in French Forests
Émeline Lequy & Manuel Nicolas & Sébastien Conil &Marie-Pierre Turpault
Received: 8 February 2013 /Accepted: 26 July 2013 /Published online: 24 August 2013# Springer Science+Business Media Dordrecht 2013
Abstract Calcium dissolved deposition shows an unusu-al spatial structure in France, probably due to the contri-bution of southern air masses fromMediterranean Sea andSaharan desert. These masses are often loaded with ter-rigenous particles that contain carbonates. However, noprecise relationship has been quantified between dissolvedCa and mineral dust deposition (MDD). The database ofthe French network RENECOFOR, gathering atmospher-ic deposition <0.45 μm in 27 sites near forests during18 years, was used to determine the non-sea-salt atmo-spheric deposition over France. This study (1) explores therelationship between dissolved components to deciphertheir origin in atmospheric deposition nearby forestsand (2) tests the use of dissolved Ca and Mg as proxiesfor MDD. In the RENECOFOR database, non-sea-saltCa (nssCa) preferentially deposited between May andAugust. MDD observed in RENECOFOR was
synchronic with high nssCa deposition, particularly inJune 2008, when air mass highly loaded with Saharandust covered France. The dissolution of thismineral dustlikely contributed to the nssCa deposition of this periodand suggested a relationship between the depositions ofnssCa and MDD. Then, MDD was specifically sampledwith dissolved deposition in four sampling sites.Encouraging relationships were found between MDDand the depositions of nssMg and nssCa, suggesting thatthe latter could be used as a proxy for MDD in regionswhere it is not monitored, and in a retrospective ap-proach in order to calculate nutrient fluxes.
Keywords Atmospheric deposition . Atmosphericmineral particles . Proxy . Calcium
1 Introduction
Atmospheric deposition is an entry of nutrients inforest ecosystems (Ranger and Turpault 1999). Betterdescribing the entries of nutrients is of major impor-tance for forest management. Indeed, the quantity ofwood harvested depends on the determined nutrientinputs, and forest sustainability is evaluated by input–output budgets. It has been suggested that atmosphericparticulate deposition could also be a source of nutri-ents for forests (Lequy et al. 2012). Up to now, only the<0.45 μm fraction of atmospheric deposition was takeninto account in input–output budgets. This will bereferred to as atmospheric dissolved deposition. The
Water Air Soil Pollut (2013) 224:1680DOI 10.1007/s11270-013-1680-4
É. Lequy :M.<P. Turpault (*)INRA (BEF) Route d’Amance,54280 Champenoux, Francee-mail: [email protected]
M. NicolasOffice National des Forêts Direction techniqueet commerciale bois Département recherche,Bâtiment B, Boulevard de Constance,77300 Fontainebleau, France
É. Lequy : S. ConilDRD—Observation Surveillance, Observatoire Pérennede l’Environnement, Centre Meuse—Haute Marne,55290 Bure, France
criterion of 0.45 μm is the size of the filter pores usedto filtrate the samples for chemical analyses.
Atmospheric deposition has marine and terrigenousorigins, which adds an anthropogenic component, sincethe industrial revolution (Negrel and Roy 1998). Theanthropogenic components are mostly due to the indus-trial and agricultural activities, traffic emissions, andbiomass burning. The marine source contributesthrough sea salt spray. The terrigenous component iscomposed of naturally wind-blown soil particles emittedby erosion and during volcanic eruptions, as well asorganic aerosols emitted by continental ecosystems andof pollens.
Previous studies assessed the marine, terrigenous, oranthropogenic contributions to dissolved deposition inFrance. This was done in a simplified way by discrim-inating the groups formed by means of major elementsas follows: (1) samples influenced by marine sourcesare marked by dissolved salts (mainly based on Na, Cl,and Mg), (2) terrigenous sources by dissolved Ca, K,and HCO3 and mineral particles, and (3) anthropogenicsources by dissolved NO3 and SO4 and compositesaerosols of sulfate, nitrate, and black carbon particles(Meybeck 1983; Sanusi et al. 1996; Plaisance et al.1997; Celle-Jeanton et al. 2009).
These discriminating groups surely are a raw esti-mation with clear limitations, as they do not take intoaccount the multiple origins of several elements. Forexample, Ca is emitted by cement factories and trafficbut is also present in sea spray, Cl is emitted by thepaper industry and sea salt spray, K by biomass andfossil fuel burning, as well as in a minor part by sea saltspray, and SO4 by industry and sea salt spray (Meybeck1983; Sanusi et al. 1996).
Local soils and remote terrains contribute to theterrigenous mineral components of atmospheric parti-cles, mostly during field works (Goossens et al. 2001)and during favorable meteorological conditions (Fieldet al. 2009), respectively. These atmospheric solidmineral particles of terrigenous origin are often re-ferred to as Aeolian dust. To avoid any misunderstand-ing, in particular with organic particulate matter, thedeposition of such solid mineral particles of terrige-nous origin will be referred to as mineral dust deposi-tion (MDD). MDD originates from erosion of localsoils and remote areas that may travel long distancesin the atmosphere. Desert regions are the world’s larg-est source of mineral dust, which influences climatebut also marine and continental ecosystems in many
regions (Goudie and Middleton 2006; Goudie 2009).For example, the Sahara desert emits large pulses ofmineral dust, which are transported to Europe andSouth America up to several times a year dependingon the meteorological conditions (Swap et al. 1992;Loye-Pilot and Martin 1996; Avila and Penuelas1999). These Saharan outbursts are much frequent inthe Mediterranean region, for example, in Spain andCorsica. They may also occur in much northern loca-tions, such as Scandinavia, in some extraordinary cases(Franzen et al. 1994). This mineral dust contains calcite(CaCO3) and other Ca-rich minerals (Alastuey et al.2005; Fiol et al. 2005). During its atmospheric trans-port, it is partly dissolved, transformed, and can bedeposited mainly through wet processes causing redrain events (Diaz-Hernandez and Parraga 2008). Thisdissolution contributes indeed to the dissolved atmo-spheric deposition. For example, CaCO3 is known tocontribute to the Ca dissolved deposition in southernFrance (Loye-Pilot and Morelli 1988; Negrel and Roy1998). This suggests that dissolved Ca could be used asa proxy of MDD. Besides, this was suggested in icecores coming from Europe, Greenland, or Antarctic(Deangelis and Gaudichet 1991; Mayewski et al.1993; Yao et al. 2004).
While atmospheric dissolved deposition is exten-sively sampled and analyzed, the study of MDD isoften limited by the difficulty to get samples and data.To our knowledge, only 20 studies in the world werecarried out to quantify MDD, and even fewer in forestecosystems. In forests developed on acidic soils, nutri-ent budgets are low, andMDD remains a nonquantifiedsource of nutrients (Lequy et al. 2012).
This paper aims at (1) characterizing the terrigenousatmospheric deposition in France and (2) at specifyingthe relationship between MDD and atmosphericdissolved deposition of terrigenous origin, particularlyCa. From the large database of the RENECOFORnetwork, including measurements in 27 French forestsites during 18 years (1993–2010), we specify thecontribution of the marine and terrigenous sources toatmospheric dissolved deposition. The relationshipsbetween dissolved Ca and MDD are also explored ina qualitative way. The correlation between non-sea-saltCa (nssCa) and MDD are then quantified in a differ-ent dataset from 2 years sampling of atmosphericdissolved deposition and MDD at four French forestsites. This allows estimating the use of nssCa as a proxyfor MDD.
1680, Page 2 of 12 Water Air Soil Pollut (2013) 224:1680
2 Sampling Networks, Collection, and PreparationProcedures and Methodology
2.1 Sampling Networks
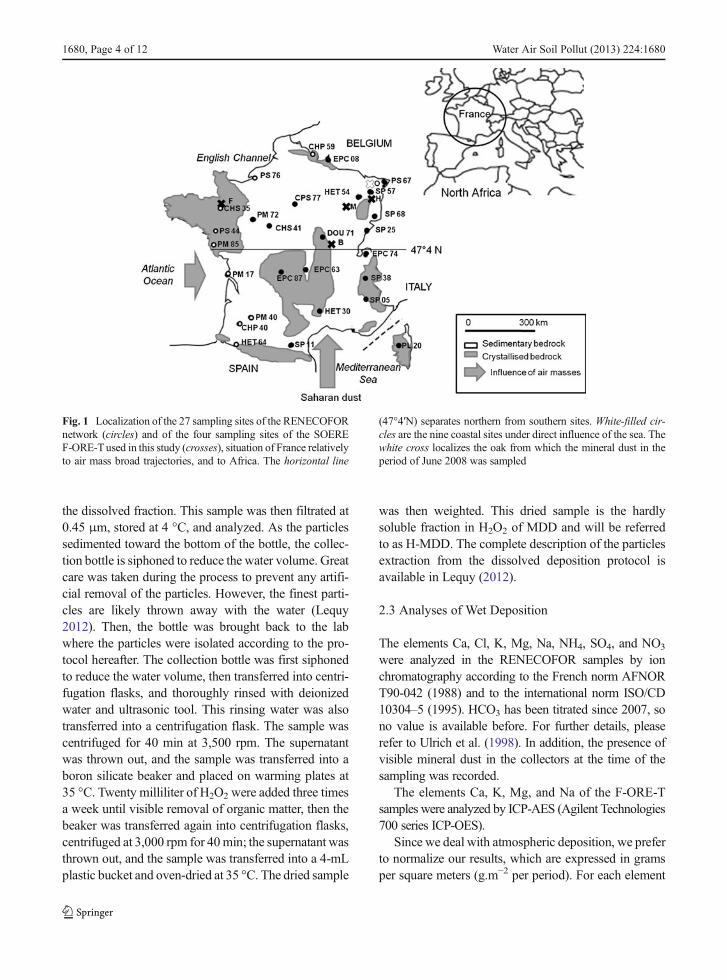
Precipitations were collected in two different networksof metropolitan France (Fig. 1).
& Twenty-seven sites in the monitoring networkRENECOFOR (national network for the long-termmonitoring of forest ecosystems), managed by theONF (the French national forest agency) between1992 and 2010: CHP 40, CHP 59, CHS 35, CHS 41,CPS 77, DOU 71, EPC 08, EPC 63, EPC 74, EPC87, HET 30, HET 54a, HET 64, PL 20, PM 17, PM40c, PM 72, PM 85, PS 44, PS 67a, PS 76, SP 05,SP 11, SP 25, SP 38, SP 57, and SP 68.
& Four sites of the SOERE F-ORE-T (long-term ob-servation and experiment system for the environ-mental research that studies the functioning of forestecosystems): Montiers-sur-Saulx1 (M), Hesse (H),Fougères (F), and Breuil-Chenue (B), which aremanaged by the laboratories BEF, EEF, and SAS ofthe Inra (National institute of Agronomic research)between November 2009 and August 2011.
The 27 RENECOFOR sites are presented in detail byUlrich et al. (1998). Briefly, to sample open field depo-sition, these sites were all set up in forested areas inedges or clearings of forests and are distant between 4and 44 km from urban and industrial pollution sources.However, a diffuse agricultural source was shown tocontribute to precipitations compositions in several re-gions (Ulrich et al. 1998). Croisé and coauthors (2005)distinguished 9 coastal sites under direct influence of thesea (CHP 59, PS 76, CHS 35, PS 44, PM 85, PM17, PM40, CHP 40, and HET 64), while the 16 other sites wereclassified as continental.
The four F-ORE-T sites are distant between 500 mto 12 km from the edge of the forests, which keepsthem from direct pollution and are far from urbanpollution. The H site is 5 km away from a cementfactory. The H and F sites had a collector on a towerabove canopy, and the B and M sites had collectorsin clearings.
These two networks are spatially distributed overFrance, so that soil and climate conditions between thesites are different. Thus, bedrocks are either sedimen-tary, with mainly limestone, or crystallized (Fig. 1).Regarding the climatic conditions, the influence ofAtlantic Ocean’s wet and cool air masses decreasesfrom SW to NE. Besides, northerly and easterly windsmay bring drier air masses influenced by the easternEuropean terrain.
During some specific meteorological conditions,southerly flow from the Mediterranean Sea might travelover France from south to north. They may be loadedwith Saharan dust, which may deposit by dry and/or wetdepositions, if rain episodes are met (Lequy 2012).
2.2 Material and Sampling of Dissolved Depositionand MDD in the Two Networks in Open Field
2.2.1 Dissolved Deposition in the RENECOFORNetwork
A complete description of the sampling materials andprocedures used in the RENECOFOR network is givenin Ulrich et al. (1998). Briefly, bulk samplers were usedto collect weekly samples. They are made of polyeth-ylene (PE) funnels (20-cm diameter). The funnels leadthe water directly into the sampling bottles. A nylonsieve is used to prevent the sample pollution by coarsevegetal debris and insects. The weekly amount of pre-cipitation is measured separately with a rain gauge.The sampling bottles are stored at 4 °C near the sam-pling site. Every 4 weeks, the bottles are sent to thecentral analysis laboratory, where they are pooled inproportion to the weekly precipitation to get a 4-weekcomposite sample. Then, the composite sample isfiltrated at 0.45 μm, stored at 4 °C, and analyzed. Theperiods are named after the sampling date, and thus thesamples correspond to the previous four samplingweeks.
2.2.2 MDD and Dissolved Deposition in the F-ORE-TNetwork
In the F-ORE-T sites, MDD and dissolved depositionare also collected with a PE funnel (53-cm diameter) in20 L collecting bottles.
The sampling period was of 4 weeks. At each sam-pling, the deposition volumewas measured onsite, and asample was taken from the top of the bottle to represent
1 The experimental site Montiers-sur-Saulx is managed in col-laboration between Andra and INRA and is also part of theSOERE OPE (permanent environment observatory)
Water Air Soil Pollut (2013) 224:1680 Page 3 of 12, 1680
the dissolved fraction. This sample was then filtrated at0.45 μm, stored at 4 °C, and analyzed. As the particlessedimented toward the bottom of the bottle, the collec-tion bottle is siphoned to reduce the water volume. Greatcare was taken during the process to prevent any artifi-cial removal of the particles. However, the finest parti-cles are likely thrown away with the water (Lequy2012). Then, the bottle was brought back to the labwhere the particles were isolated according to the pro-tocol hereafter. The collection bottle was first siphonedto reduce the water volume, then transferred into centri-fugation flasks, and thoroughly rinsed with deionizedwater and ultrasonic tool. This rinsing water was alsotransferred into a centrifugation flask. The sample wascentrifuged for 40 min at 3,500 rpm. The supernatantwas thrown out, and the sample was transferred into aboron silicate beaker and placed on warming plates at35 °C. Twenty milliliter of H2O2 were added three timesa week until visible removal of organic matter, then thebeaker was transferred again into centrifugation flasks,centrifuged at 3,000 rpm for 40min; the supernatant wasthrown out, and the sample was transferred into a 4-mLplastic bucket and oven-dried at 35 °C. The dried sample
was then weighted. This dried sample is the hardlysoluble fraction in H2O2 of MDD and will be referredto as H-MDD. The complete description of the particlesextraction from the dissolved deposition protocol isavailable in Lequy (2012).
2.3 Analyses of Wet Deposition
The elements Ca, Cl, K, Mg, Na, NH4, SO4, and NO3
were analyzed in the RENECOFOR samples by ionchromatography according to the French norm AFNORT90-042 (1988) and to the international norm ISO/CD10304–5 (1995). HCO3 has been titrated since 2007, sono value is available before. For further details, pleaserefer to Ulrich et al. (1998). In addition, the presence ofvisible mineral dust in the collectors at the time of thesampling was recorded.
The elements Ca, K, Mg, and Na of the F-ORE-Tsamples were analyzed by ICP-AES (Agilent Technologies700 series ICP-OES).
Since we deal with atmospheric deposition, we preferto normalize our results, which are expressed in gramsper square meters (g.m−2 per period). For each element
Fig. 1 Localization of the 27 sampling sites of the RENECOFORnetwork (circles) and of the four sampling sites of the SOEREF-ORE-Tused in this study (crosses), situation of France relativelyto air mass broad trajectories, and to Africa. The horizontal line
(47°4′N) separates northern from southern sites. White-filled cir-cles are the nine coastal sites under direct influence of the sea. Thewhite cross localizes the oak from which the mineral dust in theperiod of June 2008 was sampled
1680, Page 4 of 12 Water Air Soil Pollut (2013) 224:1680
and for MDD, in each site and each sampling period,deposition fluxes were calculated by multiplying theconcentration (in milligrams per liter) with the amountof rain (in liters per square meter) collected over a4 week-period.
2.4 Calculation of the Marine and Non-MarineContribution to the Total Dissolved Depositionwith the Na-Ratios Method
Analyzing the terrigenous fraction of dissolved depo-sition requires excluding the marine contribution fromthe total deposition of each element. The calculatednon-marine contribution contains the terrigenous frac-tion mixed with the anthropogenic one. Deposition wasexpressed in milligrams per square meter during a4-week sampling period. Only NO3 and NH4 werenot concerned by these calculations because their ma-rine fraction is undetectable. They could be also ofterrigenous origin, which is often negligible (Praveenet al. 2007).
Na is the marine chemical element measured both inthe F-ORE-T and RENECOFOR samples. It was usedas the marine reference to determine the marine con-tribution of the elements Ca, Mg, K, HCO3, and SO4
(Negrel and Roy 1998). To ensure that their ratios toNa in the present study represent the marine fraction(Table 1), they were calculated from average globalseawater ratios (Savenko 1976).
Thus, these ratios were used to calculate the sea-saltcontribution of each element to the total deposition asfollows:
ssX ¼ CX−Na⋅Na ð1Þ
Where ssX is the sea-salt contribution of Ca, Mg, K,HCO3, and SO4, CX-NA is the ratio X/Na (Table 1), andNa is the total sodium deposition. The non-sea-saltcontribution of each element is calculated as follows:
nssX ¼ X−ssX ð2Þ
To get these correlations as well as those betweennssCa, nssMg, and MDD, we used simple linearregressions.
2.5 Study of the Periods of MDD and of Upper nssCaDeposition
The visible presence of mineral dust in the sampleswas recorded in the RENECOFOR database. Thisallowed selecting the periods of sand deposition inthe 27 sites of this network, which were then studiedapart.
The periods when MDD had been noticed in thesamples were selected. Since MDD was not quanti-fied in the RENECOFOR sites, the study thenfocused on nssCa, when MDD was noticed and dur-ing synchronic periods of upper nssCa deposition(nssCaup) between the sites. Indeed, nssCa deposi-tion is highly variable in space and time. So, studyingsynchronic nssCaup periods allows distinguishing spa-tiotemporal patterns. In particular, synchronic nssCaupperiods would indeed indicate common Ca-rich airmasses.
The detection of the nssCaup deposition periods wasmade on a simple criterion. In each site, the thresholdvalue was the third quartile of nssCa deposition calcu-lated from the 236 sampling periods. We then compiledthe 27 sites during the 236 periods and selectedsynchronic periods, when at least 15 sites presentednssCaup.
2.6 Analyses of the Mineral Dust Episode of June2008
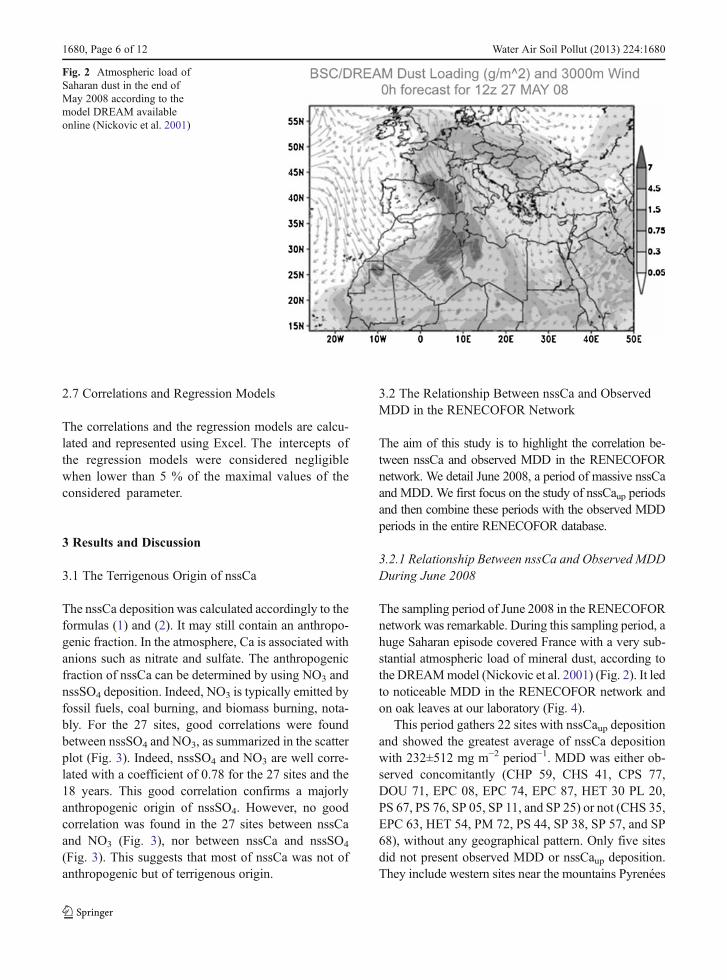
Before the studied period, an important Saharan dustevent occurred over Europe at the end of May 2008.This event was noticeable with the DREAM model(Nickovic et al. 2001). This model is available online.It reveals an atmospheric load of African origin as highas 4.5 mg m−2 on a 6 h forecast on May 26, 2008(Fig. 2).
On this occasion, leaves of the oak near the labora-tory BEF exhibited visible traces of MDD. As anexploratory study to determine the carbonate contentsof this MDD in this site of the northeast of France, morethan 1,000 km far from the dust source, the oak leaveswere photographed, and one oak leaf with particularlyvisible mineral dust was sampled for the analysis withSEM-EDS.
Table 1 Mass ratios between Na and Ca, Mg, K, HCO3, andSO4 in seawater used to calculate sea-salt and non-sea-salt con-tribution for each chemical element from Savenko (1976)
Ca/Na Mg/Na K/Na HCO3/Na SO4/Na
0.038 0.121 0.036 0.013 0.251
Water Air Soil Pollut (2013) 224:1680 Page 5 of 12, 1680
2.7 Correlations and Regression Models
The correlations and the regression models are calcu-lated and represented using Excel. The intercepts ofthe regression models were considered negligiblewhen lower than 5 % of the maximal values of theconsidered parameter.
3 Results and Discussion
3.1 The Terrigenous Origin of nssCa
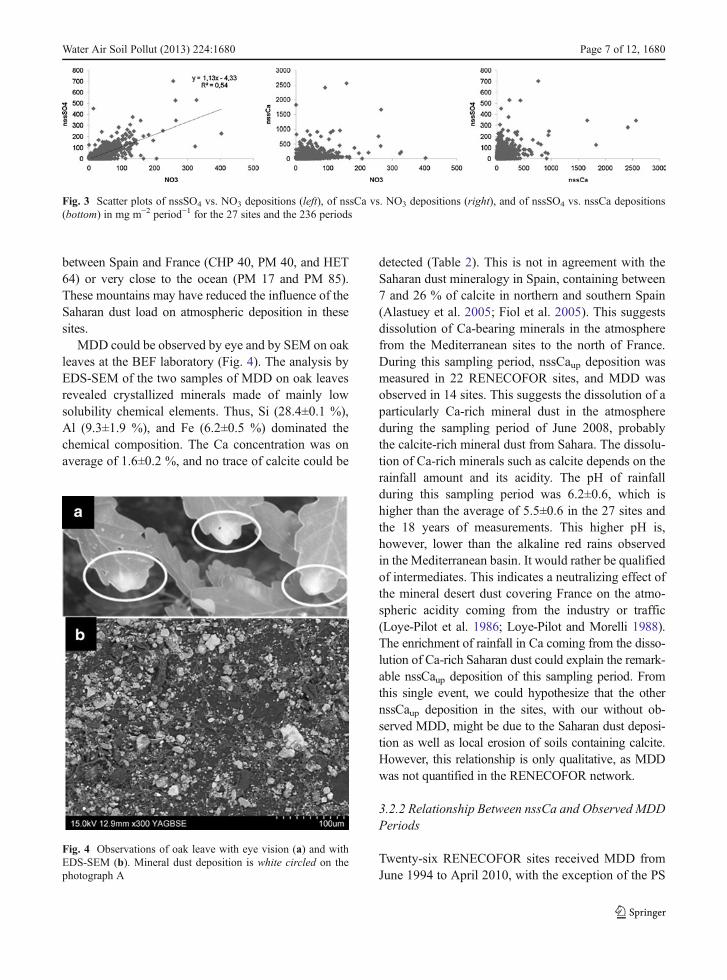
The nssCa deposition was calculated accordingly to theformulas (1) and (2). It may still contain an anthropo-genic fraction. In the atmosphere, Ca is associated withanions such as nitrate and sulfate. The anthropogenicfraction of nssCa can be determined by using NO3 andnssSO4 deposition. Indeed, NO3 is typically emitted byfossil fuels, coal burning, and biomass burning, nota-bly. For the 27 sites, good correlations were foundbetween nssSO4 and NO3, as summarized in the scatterplot (Fig. 3). Indeed, nssSO4 and NO3 are well corre-lated with a coefficient of 0.78 for the 27 sites and the18 years. This good correlation confirms a majorlyanthropogenic origin of nssSO4. However, no goodcorrelation was found in the 27 sites between nssCaand NO3 (Fig. 3), nor between nssCa and nssSO4
(Fig. 3). This suggests that most of nssCa was not ofanthropogenic but of terrigenous origin.
3.2 The Relationship Between nssCa and ObservedMDD in the RENECOFOR Network
The aim of this study is to highlight the correlation be-tween nssCa and observed MDD in the RENECOFORnetwork. We detail June 2008, a period of massive nssCaand MDD. We first focus on the study of nssCaup periodsand then combine these periods with the observed MDDperiods in the entire RENECOFOR database.
3.2.1 Relationship Between nssCa and Observed MDDDuring June 2008
The sampling period of June 2008 in the RENECOFORnetwork was remarkable. During this sampling period, ahuge Saharan episode covered France with a very sub-stantial atmospheric load of mineral dust, according tothe DREAMmodel (Nickovic et al. 2001) (Fig. 2). It ledto noticeable MDD in the RENECOFOR network andon oak leaves at our laboratory (Fig. 4).
This period gathers 22 sites with nssCaup depositionand showed the greatest average of nssCa depositionwith 232±512 mg m−2 period−1. MDD was either ob-served concomitantly (CHP 59, CHS 41, CPS 77,DOU 71, EPC 08, EPC 74, EPC 87, HET 30 PL 20,PS 67, PS 76, SP 05, SP 11, and SP 25) or not (CHS 35,EPC 63, HET 54, PM 72, PS 44, SP 38, SP 57, and SP68), without any geographical pattern. Only five sitesdid not present observed MDD or nssCaup deposition.They include western sites near the mountains Pyrenées
Fig. 2 Atmospheric load ofSaharan dust in the end ofMay 2008 according to themodel DREAM availableonline (Nickovic et al. 2001)
1680, Page 6 of 12 Water Air Soil Pollut (2013) 224:1680
between Spain and France (CHP 40, PM 40, and HET64) or very close to the ocean (PM 17 and PM 85).These mountains may have reduced the influence of theSaharan dust load on atmospheric deposition in thesesites.
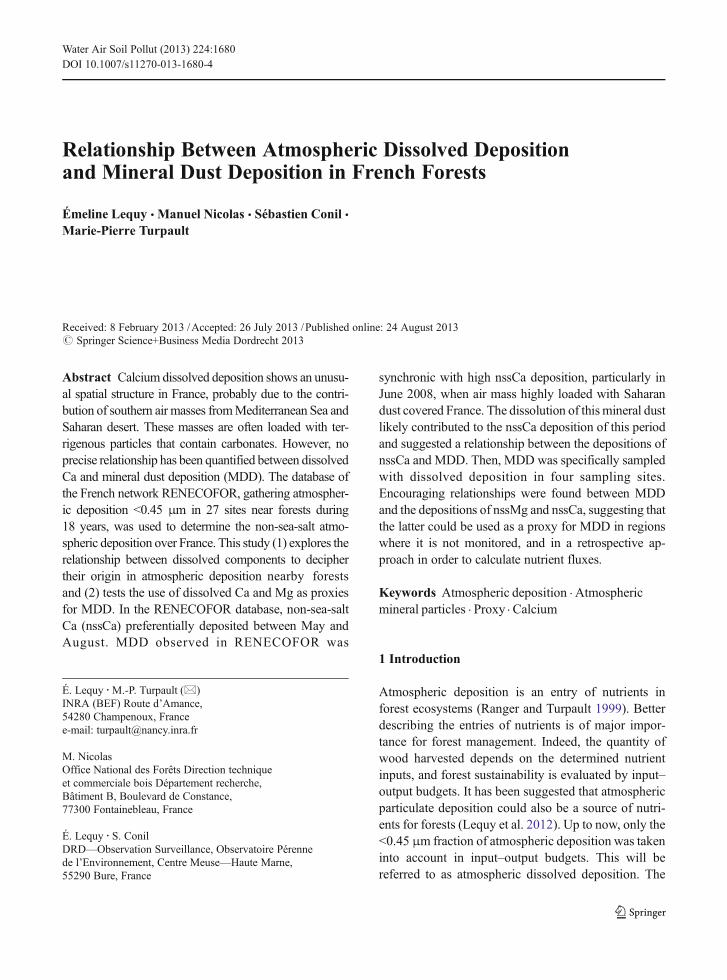
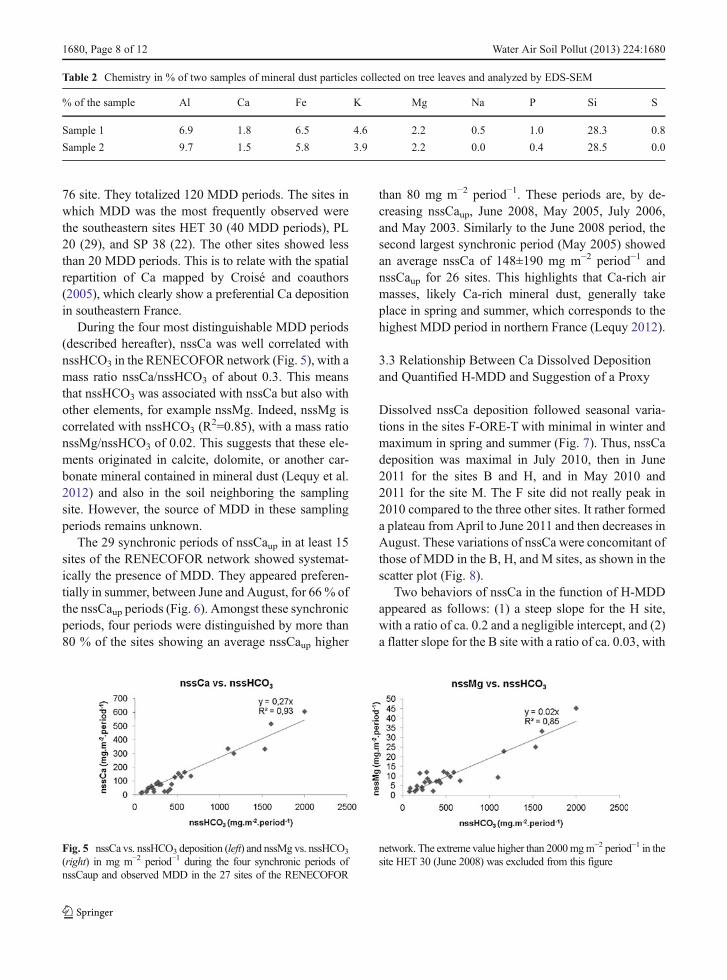
MDD could be observed by eye and by SEM on oakleaves at the BEF laboratory (Fig. 4). The analysis byEDS-SEM of the two samples of MDD on oak leavesrevealed crystallized minerals made of mainly lowsolubility chemical elements. Thus, Si (28.4±0.1 %),Al (9.3±1.9 %), and Fe (6.2±0.5 %) dominated thechemical composition. The Ca concentration was onaverage of 1.6±0.2 %, and no trace of calcite could be
detected (Table 2). This is not in agreement with theSaharan dust mineralogy in Spain, containing between7 and 26 % of calcite in northern and southern Spain(Alastuey et al. 2005; Fiol et al. 2005). This suggestsdissolution of Ca-bearing minerals in the atmospherefrom the Mediterranean sites to the north of France.During this sampling period, nssCaup deposition wasmeasured in 22 RENECOFOR sites, and MDD wasobserved in 14 sites. This suggests the dissolution of aparticularly Ca-rich mineral dust in the atmosphereduring the sampling period of June 2008, probablythe calcite-rich mineral dust from Sahara. The dissolu-tion of Ca-rich minerals such as calcite depends on therainfall amount and its acidity. The pH of rainfallduring this sampling period was 6.2±0.6, which ishigher than the average of 5.5±0.6 in the 27 sites andthe 18 years of measurements. This higher pH is,however, lower than the alkaline red rains observedin the Mediterranean basin. It would rather be qualifiedof intermediates. This indicates a neutralizing effect ofthe mineral desert dust covering France on the atmo-spheric acidity coming from the industry or traffic(Loye-Pilot et al. 1986; Loye-Pilot and Morelli 1988).The enrichment of rainfall in Ca coming from the disso-lution of Ca-rich Saharan dust could explain the remark-able nssCaup deposition of this sampling period. Fromthis single event, we could hypothesize that the othernssCaup deposition in the sites, with our without ob-served MDD, might be due to the Saharan dust deposi-tion as well as local erosion of soils containing calcite.However, this relationship is only qualitative, as MDDwas not quantified in the RENECOFOR network.
3.2.2 Relationship Between nssCa and Observed MDDPeriods
Twenty-six RENECOFOR sites received MDD fromJune 1994 to April 2010, with the exception of the PS
Fig. 3 Scatter plots of nssSO4 vs. NO3 depositions (left), of nssCa vs. NO3 depositions (right), and of nssSO4 vs. nssCa depositions(bottom) in mg m−2 period−1 for the 27 sites and the 236 periods
Fig. 4 Observations of oak leave with eye vision (a) and withEDS-SEM (b). Mineral dust deposition is white circled on thephotograph A
Water Air Soil Pollut (2013) 224:1680 Page 7 of 12, 1680
76 site. They totalized 120 MDD periods. The sites inwhich MDD was the most frequently observed werethe southeastern sites HET 30 (40 MDD periods), PL20 (29), and SP 38 (22). The other sites showed lessthan 20 MDD periods. This is to relate with the spatialrepartition of Ca mapped by Croisé and coauthors(2005), which clearly show a preferential Ca depositionin southeastern France.
During the four most distinguishable MDD periods(described hereafter), nssCa was well correlated withnssHCO3 in the RENECOFOR network (Fig. 5), with amass ratio nssCa/nssHCO3 of about 0.3. This meansthat nssHCO3 was associated with nssCa but also withother elements, for example nssMg. Indeed, nssMg iscorrelated with nssHCO3 (R
2=0.85), with a mass rationssMg/nssHCO3 of 0.02. This suggests that these ele-ments originated in calcite, dolomite, or another car-bonate mineral contained in mineral dust (Lequy et al.2012) and also in the soil neighboring the samplingsite. However, the source of MDD in these samplingperiods remains unknown.
The 29 synchronic periods of nssCaup in at least 15sites of the RENECOFOR network showed systemat-ically the presence of MDD. They appeared preferen-tially in summer, between June and August, for 66 % ofthe nssCaup periods (Fig. 6). Amongst these synchronicperiods, four periods were distinguished by more than80 % of the sites showing an average nssCaup higher
than 80 mg m−2 period−1. These periods are, by de-creasing nssCaup, June 2008, May 2005, July 2006,and May 2003. Similarly to the June 2008 period, thesecond largest synchronic period (May 2005) showedan average nssCa of 148±190 mg m−2 period−1 andnssCaup for 26 sites. This highlights that Ca-rich airmasses, likely Ca-rich mineral dust, generally takeplace in spring and summer, which corresponds to thehighest MDD period in northern France (Lequy 2012).
3.3 Relationship Between Ca Dissolved Depositionand Quantified H-MDD and Suggestion of a Proxy
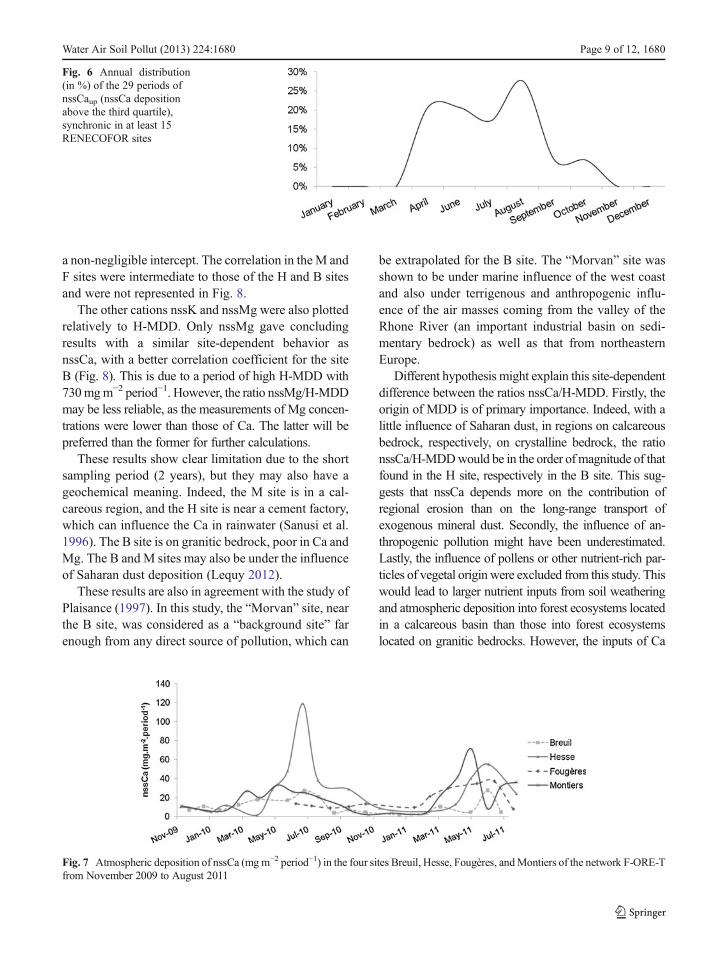
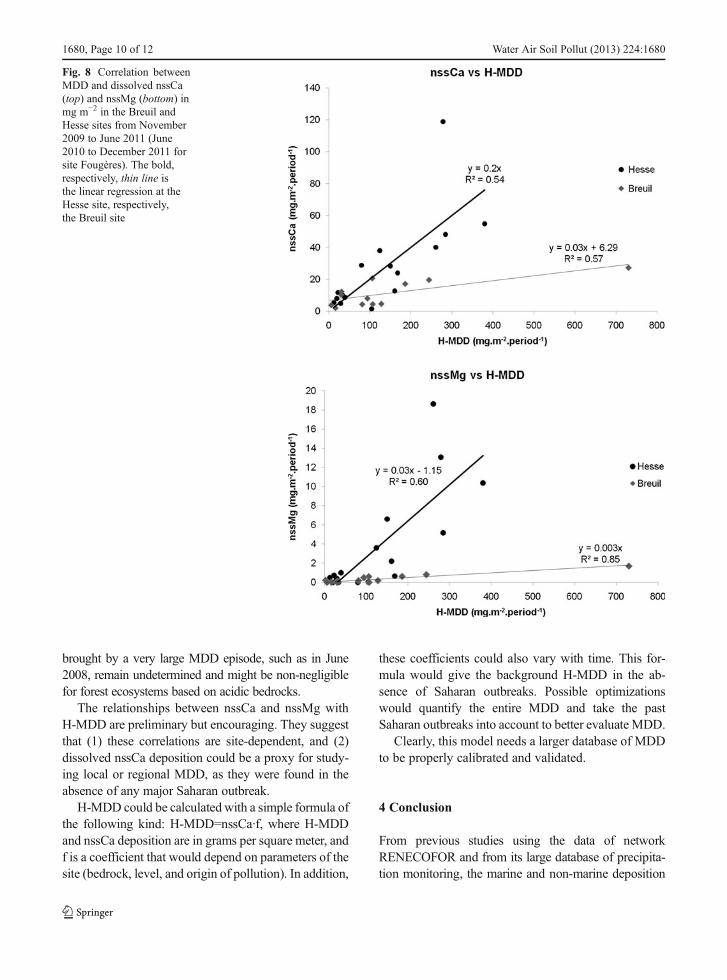
Dissolved nssCa deposition followed seasonal varia-tions in the sites F-ORE-T with minimal in winter andmaximum in spring and summer (Fig. 7). Thus, nssCadeposition was maximal in July 2010, then in June2011 for the sites B and H, and in May 2010 and2011 for the site M. The F site did not really peak in2010 compared to the three other sites. It rather formeda plateau from April to June 2011 and then decreases inAugust. These variations of nssCa were concomitant ofthose of MDD in the B, H, and M sites, as shown in thescatter plot (Fig. 8).
Two behaviors of nssCa in the function of H-MDDappeared as follows: (1) a steep slope for the H site,with a ratio of ca. 0.2 and a negligible intercept, and (2)a flatter slope for the B site with a ratio of ca. 0.03, with
Table 2 Chemistry in % of two samples of mineral dust particles collected on tree leaves and analyzed by EDS-SEM
% of the sample Al Ca Fe K Mg Na P Si S
Sample 1 6.9 1.8 6.5 4.6 2.2 0.5 1.0 28.3 0.8
Sample 2 9.7 1.5 5.8 3.9 2.2 0.0 0.4 28.5 0.0
Fig. 5 nssCa vs. nssHCO3 deposition (left) and nssMg vs. nssHCO3
(right) in mg m−2 period−1 during the four synchronic periods ofnssCaup and observed MDD in the 27 sites of the RENECOFOR
network. The extreme value higher than 2000mgm−2 period−1 in thesite HET 30 (June 2008) was excluded from this figure
1680, Page 8 of 12 Water Air Soil Pollut (2013) 224:1680
a non-negligible intercept. The correlation in the M andF sites were intermediate to those of the H and B sitesand were not represented in Fig. 8.
The other cations nssK and nssMg were also plottedrelatively to H-MDD. Only nssMg gave concludingresults with a similar site-dependent behavior asnssCa, with a better correlation coefficient for the siteB (Fig. 8). This is due to a period of high H-MDD with730mgm−2 period−1. However, the ratio nssMg/H-MDDmay be less reliable, as the measurements of Mg concen-trations were lower than those of Ca. The latter will bepreferred than the former for further calculations.
These results show clear limitation due to the shortsampling period (2 years), but they may also have ageochemical meaning. Indeed, the M site is in a cal-careous region, and the H site is near a cement factory,which can influence the Ca in rainwater (Sanusi et al.1996). The B site is on granitic bedrock, poor in Ca andMg. The B and M sites may also be under the influenceof Saharan dust deposition (Lequy 2012).
These results are also in agreement with the study ofPlaisance (1997). In this study, the “Morvan” site, nearthe B site, was considered as a “background site” farenough from any direct source of pollution, which can
be extrapolated for the B site. The “Morvan” site wasshown to be under marine influence of the west coastand also under terrigenous and anthropogenic influ-ence of the air masses coming from the valley of theRhone River (an important industrial basin on sedi-mentary bedrock) as well as that from northeasternEurope.
Different hypothesis might explain this site-dependentdifference between the ratios nssCa/H-MDD. Firstly, theorigin of MDD is of primary importance. Indeed, with alittle influence of Saharan dust, in regions on calcareousbedrock, respectively, on crystalline bedrock, the rationssCa/H-MDDwould be in the order of magnitude of thatfound in the H site, respectively in the B site. This sug-gests that nssCa depends more on the contribution ofregional erosion than on the long-range transport ofexogenous mineral dust. Secondly, the influence of an-thropogenic pollution might have been underestimated.Lastly, the influence of pollens or other nutrient-rich par-ticles of vegetal origin were excluded from this study. Thiswould lead to larger nutrient inputs from soil weatheringand atmospheric deposition into forest ecosystems locatedin a calcareous basin than those into forest ecosystemslocated on granitic bedrocks. However, the inputs of Ca
Fig. 6 Annual distribution(in %) of the 29 periods ofnssCaup (nssCa depositionabove the third quartile),synchronic in at least 15RENECOFOR sites
Fig. 7 Atmospheric deposition of nssCa (mgm−2 period−1) in the four sites Breuil, Hesse, Fougères, andMontiers of the network F-ORE-Tfrom November 2009 to August 2011
Water Air Soil Pollut (2013) 224:1680 Page 9 of 12, 1680
brought by a very large MDD episode, such as in June2008, remain undetermined and might be non-negligiblefor forest ecosystems based on acidic bedrocks.
The relationships between nssCa and nssMg withH-MDD are preliminary but encouraging. They suggestthat (1) these correlations are site-dependent, and (2)dissolved nssCa deposition could be a proxy for study-ing local or regional MDD, as they were found in theabsence of any major Saharan outbreak.
H-MDD could be calculated with a simple formula ofthe following kind: H-MDD=nssCa·f, where H-MDDand nssCa deposition are in grams per square meter, andf is a coefficient that would depend on parameters of thesite (bedrock, level, and origin of pollution). In addition,
these coefficients could also vary with time. This for-mula would give the background H-MDD in the ab-sence of Saharan outbreaks. Possible optimizationswould quantify the entire MDD and take the pastSaharan outbreaks into account to better evaluate MDD.
Clearly, this model needs a larger database of MDDto be properly calibrated and validated.
4 Conclusion
From previous studies using the data of networkRENECOFOR and from its large database of precipita-tion monitoring, the marine and non-marine deposition
Fig. 8 Correlation betweenMDD and dissolved nssCa(top) and nssMg (bottom) inmg m−2 in the Breuil andHesse sites from November2009 to June 2011 (June2010 to December 2011 forsite Fougères). The bold,respectively, thin line isthe linear regression at theHesse site, respectively,the Breuil site
1680, Page 10 of 12 Water Air Soil Pollut (2013) 224:1680
of Ca were calculated. The correlation of nssCa with thatof NO3, a typically anthropogenic pollutant, indicatedthat nssCa was majorly of terrigenous origin.
The period of June 2008 highlighted the terrigenousorigin of nssCa. It originates in the dissolution ofSaharan dust, generally rich in calcite that covered al-most the entire France in this sampling period. In theRENECOFOR network, periods of synchronic nssCaupwere systematically concomitant with observed MDD.Besides, these synchronic nssCaup periods occurredmainly during spring and summer. This corresponds tothe maximal MDD in France. This deposition patternmay also be due to non-terrigenous influences, such asanthropogenic emissions or vegetal particles rich innutrients (pollens, seeds…) that contribute to atmo-spheric particles during spring and summer.
In the four F-ORE-T sampling sites dedicated to thisstudy, good correlations were found between nssCadeposition and quantified H-MDD. These correlationsseem to depend on the regional geologic background,suggesting further investigations need to be done inorder to build a MDD model based on nssCa. Such amodel would be useful (1) to validate depositionmodels such as DREAM and (2) retrospectively inareas where dissolved Ca was measured and to calculateits inputs to terrigenous ecosystems.
Acknowledgments We would like to thank the following in-stitutions: the Andra for funding this study, the GIP ECOFOR forthe financial support to the sites, and the ONF (French Office forForest Management) for the access to the study sites and thedatabase RENECOFOR, in particular its measures and updating.
We are also grateful to Jérôme Demaison and Serge Didier fordesigning and setting up the samples in field, to Pascal Courtoisand Patrick Gross from the EEF laboratory (INRA), ChrisFléchard and Yannick Fauvel of the SAS laboratory (INRA),Pascale Battung, Perrine Mathieu and Claire Pantigny from theBEF laboratory (INRA), and Maxime Simon from the ANDRAfor sampling and preparing the samples. The analyses of thesamples were performed by Carine Cochet from BEF. We wouldlike to thank Christophe Calvaruso for his help on the field andthe discussion, and to Anna Avila for her suggestions improvingthe manuscript. We are also grateful to the two anonymousreviewers that considerably helped us improve the manuscript.
References
Alastuey, A., Querol, X., Castillo, S., Escudero, M., Avila, A.,Cuevas, E., et al. (2005). Characterization of TSP and PM2.5 atIzana and Sta. Cruz de Tenerife (Canary Islands, Spain) during aSaharan Dust Episode (July 2002). Atmospheric Environment,39(26), 4715–4728.
Avila, A., & Penuelas, J. (1999). Increasing frequency of Saharanrains over northeastern Spain and its ecological consequences.Science of the Total Environment, 228(2–3), 153–156.
Celle-Jeanton, H., Travi, Y., Loye-Pilot, M. D., Huneau, F., &Bertrand, G. (2009). Rainwater chemistry at a Mediterraneaninland station (Avignon, France): local contribution versuslong-range supply. Atmospheric Research, 91(1), 118–126.
Croisé, L., Ulrich, E., Duplat, P., & Jaquet, O. (2005). Twoindependent methods for mapping bulk deposition inFrance. Atmospheric Environment, 39(21), 3923–3941.
Deangelis, M., & Gaudichet, A. (1991). Saharan dust depositionover Mont-Blanc (French Alps) during the last 30 years.Tellus Series B-Chemical and Physical Meteorology, 43(1),61–75.
Diaz-Hernandez, J. L., & Parraga, J. (2008). The nature andtropospheric formation of iberulites: pinkish mineralmicrospherulites. Geochimica Et Cosmochimica Acta,72(15), 3883–3906.
Field, J. P., Belnap, J., Breshears, D. D., Neff, J. C., Okin, G. S.,Whicker, J. J., et al. (2009). The ecology of dust. Frontiersin Ecology and the Environment, 8(8), 423–430.
Fiol, L. A., Fornos, J. J., Gelabert, B., & Guijarro, J. A. (2005).Dust rains in Mallorca (Western Mediterranean): their oc-currence and role in some recent geological processes.Catena, 63(1), 64–84.
Franzen, L. G., Hjelmroos, M., Kallberg, P., Brorstromlunden,E., Juntto, S., & Savolainen, A. L. (1994). The yellow-snowepisode of northern Fennoscandia, March-1991—a case-study of long-distance transport of soil, pollen, and stableorganic compounds. Atmospheric Environment, 28(22),3587–3604.
Goossens, D., Gross, J., & Spaan, W. (2001). Aeolian dust dy-namics in agricultural land areas in lower Saxony, Germany.Earth Surface Processes and Landforms, 26(7), 701–720.
Goudie, A. S. (2009). Dust storms: recent developments. Journalof Environmental Management, 90(1), 89–94.
Goudie, A. S., & Middleton, N. J. (2006). Desert Dust in theGlobal System. Springer.
Lequy, E. (2012). Dépôts atmosphériques particulaires sur lesécosystèmes forestiers de la moitié nord de la France:influence sur les cycles biogéochimiques.
Lequy, É., Conil, S., & Turpault, M.-P. (2012). Impacts ofAeolian dust deposition on European forest sustainability:a review. Forest Ecology and Management, 267, 240–252.
Loye-Pilot, M. D., & Martin, J. M. (1996). Saharan dust input tothe western Mediterranean: an 11 years record in Corsica. InS. Guerzoni & R. Chester (Eds.), The Impact of AfricanDust Across the Mediterranean (pp. 191–199). Dordrecht:Kluwer Academic Publisher.
Loye-Pilot, M. D., & Morelli, J. (1988). Fluctuations of ioniccomposition of precipitations collected in Corsica related tochanges in the origins of incoming aerosols. Journal ofAerosol Science, 19(5), 577–585.
Loye-Pilot, M. D., Martin, J. M., & Morelli, J. (1986). Influenceof Saharan dust on the rain acidity and atmospheric input tothe Mediterranean. Nature, 321(6068), 427–428.
Mayewski, P. A., Meeker, L. D., Morrison, M. C., Twickler, M. S.,Whitlow, S. I., Ferland, K. K., et al. (1993). Greenland icecore signal characteristics—an expanded view of climate-change. Journal of Geophysical Research-Atmospheres,98(D7), 12839–12847.
Water Air Soil Pollut (2013) 224:1680 Page 11 of 12, 1680

Meybeck, M. (1983). Atmospheric inputs and river transport ofdissolved substances. Association International des SciencesHydrologiques Publication, 141, 173–192.
Negrel, P., & Roy, S. (1998). Chemistry of rainwater in theMassif Central (France): a strontium isotope and majorelement study. Applied Geochemistry, 13(8), 941–952.
Nickovic, S., Kallos, G., Papadopoulos, A., & Kakaliagou, O.(2001). A model for prediction of desert dust cycle in theatmosphere. Journal of Geophysical Research-Atmospheres,106(D16), 18113–18129.
Plaisance, H., Galloo, J. C., & Guillermo, R. (1997). Sourceidentification and variation in the chemical composition ofprecipitation at two rural sites in France. Science of the TotalEnvironment, 206(1), 79–93.
Praveen, P. S., Rao, P. S. P., Safai, P. D., Devara, P. C. S., Chate, D.M., Ali, K., & Momin, G. A. (2007). Study of aerosol trans-port through precipitation chemistry over Arabian Sea duringwinter and summer monsoons. Atmospheric Environment,41(4), 825–836. doi:10.1016/j.atmosenv.2006.08.049.
Ranger, J., & Turpault,M. P. (1999). Input–output nutrient budgetsas a diagnostic tool for sustainable forest management.ForestEcology and Management, 122(1–2), 139–154.
Sanusi, A., Wortham, H., Millet, M., & Mirabel, P. (1996).Chemical composition of rainwater in eastern France.Atmospheric Environment, 30(1), 59–71.
Savenko, V. (1976). Chemical composition of atmospheric pre-cipitations over oceans. Geokhimiya, 12, 1890–1893.
Swap, R., Garstang, M., Greco, S., Talbot, R., & Kallberg, P.(1992). Saharan Dust in the Amazon Basin. Tellus Series B-Chemical and Physical Meteorology, 44(2), 133–149.
Ulrich, E., LeLong, N., Lanier, M., & Schneider, A. (1998).Regional differences in the relation between monthly pre-cipitation and bulk concentration in France (renecofor).Water, Air, and Soil Pollution, 102(3–4), 239–257.
Yao, T. D., Wu, G. J., Pu, J. C., Jiao, K. Q., & Huang, C. L.(2004). Relationship between calcium and atmospheric dustrecorded in Guliya ice core. Chinese Science Bulletin,49(7), 706–710.
1680, Page 12 of 12 Water Air Soil Pollut (2013) 224:1680