Embed Size (px)
Citation preview
Dept. for Speech, Music and Hearing
Quarterly Progress andStatus Report
Relationship betweenchanges in voice pitch and
loudnessGramming, P. and Sundberg, J. and
Ternstrom, S. and Leanderson, R. andPerkins, W. H.
journal: STL-QPSRvolume: 28number: 1year: 1987pages: 039-055
http://www.speech.kth.se/qpsr


STL-QPSR 1/1987
A. RELATIONSHIP BETWEEN CHANGES I N VOICE PITCH AND LOL7llPJESS Pa t r i c i a Gramming*, Johan Sundberg, Sten Ternstrom, Fblf Leanderson**, and William H. Perkins***
Abstract The change i n mean fundamental frequency accompanying changes i n
loudness of phonation during reading is analyzed i n nine professional s ingers , nine nonsingers and i n t e n m a l e and t e n female pa t i en t s suffer- ing f r o m vocal fa t igue and/or functional dysfunction. The subjects read discurs ive t e x t s w i t h 19-f i l tered noise i n earphones, and s o m e also a t v o l u n t a r i l y v a r i e d voca l loudness. Also, t h e h e a l t h y v o i c e s u b j e c t s phonated as s o f t l y and as l o u d l y as p o s s i b l e a t v a r i o u s fundamental frequencies throughout their p i tch ranges, and t he resu l t ing mean phone- tograms a r e compared. The mean fundamental f requency was found t o increase by between 0.2 and 0.6 semitones per d B equivalent sound level . No g r e a t d i f ferences were found between these subject groups, although t h e s ingers were found to vary their mean fundamental frequency m o r e than the nonsingers. It is possible to explain the voice p i t ch changes as the passive r e s u l t s of t h e changes of subglo t ta l pressure applied i n order t o vary sound leve l of phonation.
Introduction Recordings of minimum and maximum phonatory sound leve l as func-
t i o n s of fundamental frequency are ca l led phonetograms. These are fre- q u e n t l y used i n some v o i c e c l i n i c s as a h e l p to d e s c r i b e t h e v o i c e function.
The axes of a phonetogram are re la ted t o two important phonatory dimensions, namely voice fundamental frequency and loudness of phona- t i o n . These pa rame te r s r e f l e c t , i n t u r n , b a s i c a s p e c t s o f t h e v o i c e source t h a t would be revealing to voice function: t h e p i tch o f phonation is determined by the vibrat ion frequency of the vocal folds while the
phonatory sound leve l r e f l e c t s the maximum amplitude of the d i f f eren- tiatecl t r ansg lo t t a l a i r f l ow (Gauffin & Sundberg, 1980; Fant, 1979; Fant, Li l jencrants & Tin, 1985). For these reasons, the phonetogram s e e m s promising a l s o i n c l i n i c a l work, espec ia l ly as t h e recording t i m e needed is comparatively short.
* Dept. of Phoniatr ics, ENT Cl inic , M a x > Ceneral EBspital. ** Dept . of Phoniatr ics , Karolinska S j u ld~use t , Stockholm. ***Univ. of Southern Cal i fornia , I n s Anqeles, C A I IJSA.
STL-QPSR 1/1987
It is a notorious observation that speakers who raise their loud- ness of phonation also raise their mean voice fundamental frequency. This suggests the existence of habitual pathways in the phonetogram. Such pathways may help understanding the phonetogram from a practical point of view, and are thus interesting to describe. It seems worth- while to find out how subjects vary their mean fundamental frequency and mean sound pressure level (SPL) when asked to speak at different degrees of vocal loudness.
Speakers tend to increase loudness of speech with the ambient ~oise level (Lane & Tranel, 1971). With regard to vocal abuse, clinicians discourage speaking under noisy conditions; this implies that speaking loudly may be detrimental to vocal health. Coricert and opera singers, and stage actors, often use their voices at loudness and pitch levels that would render untrained voices hoarse; yet they do not normally suffer vocal damage. It is interesting to see whether the type of voice use, that speaking in noise induces, leads to a combination of mean SPL and mean fundamental frequency different from that chosen when loudness of phonation is voluntarily raised.
The aim of the present investigation was to examine the vocal behavior of different groups of speakers with respect to mean fundamen- tal frequency and mean sound level and to relate these data to the subjects' phonetogram.
The investigation combines data gathered for two different pur-- poses. One purpose was to explore singers' and nonsingers' phonatory reactions to various noise and auditory feedback conditions. The other was to describe an aspect of status of voice function in dysphonic
patients.
Experiment The effects of voluntarily changed phonatory loudness on level of
phonation and voice fundamental frequency was analyzed in two groups of subjects: nine male singers and nine male nonsingers, all with no history of voice disorders. One singer had only vocal training whereas
the other eight had performed professionally in opera and concert. Also, the effects of reading in noise was studied in these subjects; the subjects heard a loud noise in earphones and were asked to read a text loud enough to get heard through this noise.
In addition, the effects of reading in noise was studied in ten male and ten female patients suffering from dysphonic phonastenia, i.e., a functional voice disorder. All the patients were on the waiting list for treatment at the Phoniatric Department, Malmij General Hospital.
In the case of the healthy voices, the recordings were carried out in an anechoic room and the sound was picked up by a Sennlleiser (MD 211) microphone at a constant distance in front of the subject's mouth. For

STL-QPSR 1/1987
the patients, a sound treated room (4*3*2.3 m) was used and the micro-
phone was an AKG CMSE CElO electret. Voice fundamental frequency was determined from the signal recorded by an accelerometer, fastened to the subject's neck just below the thyroid cartilage; for the patients this
microphone was complemented with an electroglottograph. The subject wore a calibrated headset (TDH 49P) with capsules
tightly sealing off the ears from external sound. The sound level of the auditory feedback, obviously critical to the effect of the noise, was
adjusted so that a vowel yielding a 90 dB SPL at 1 m distance generated a 105 dB SPL in the headset. This approximates the level at which the subjects would hear their own voices without the headset in an anechoic room. In the case of the patients Sennheiser (MD414) headset was used, which does not seal off the ears.
In the headset noise was presented. In the case of the healthy voices, a white noise was used filtered at 2.2 kHz by an LP filter with a roll-off of 18 dB/octave, see Fig. 1. In the case of the patients, unfiltered white noise was used which was presented at 70 dB SPL.
The sound picked up by the microphone was recorded on one track of a calibrated tape recorder, and on the second track a signal was record- ed for fundamental frequency measurement.
MASKING NOISE
0.1 0.2 0.5 1 2 5 10
FREQUENCY (kHz1
Fig. 1. Ilong-term-average spectrum from a third-octave filterbank
of the LP-filtered masking noise.
All subjects read a discursive text material with and without the masking noise. In the noise-free condition, the voice patients were asked to read at a normal loudness only, while the healthy voices read two times (Trial I and 11) for at least 30 sec under each of three loudness conditions : ( 1 ) norma 1 conversational loudness, (2) a lotdness level appropriate for an audience, and (3) the loudest level pssible.
Phonetograms were made for the healthy voices only, before reading the text. To provide data for phonetograms, the reconunencld procedure is
STL-QPSR 1/1987
to have the subject phonate at certain, given pitches as loudly and as softly as possible (Schutte & Seidner, 1983). In this case, however, we used a slightly different procedure. The singers sang triads, while the nonsingers made pitch glides from highest to lowest pitch or vice versa.
Analysis The signal for fundamental frequency analysis was fed to a funda-
mental frequency extractor connected to a digital analyzer, displaying the fundamental frequency distributions in terms of a histogram. Also, the mean and the standard deviation of fundamental frequency were shown. Using these means, the fundamental frequency mean and standard deviation were determined for each sample.
The program also displays fundamental frequency and sound level as function of time. Such graphs were used for analyzing SPL and funda- mental frequency in the pitch glides and triads that the subjects per- formed during the recording sessions. The resulting data were used for plotting phonetograms.
As different voices have differing mean fundamental frequencies, the relevant measure is the change in each subject's mean fundamental frequency induced by the experimental conditions. Therefore, this change was determined for each sample, and expressed in semitones (henceforth st).
In the case of the healthy voices, a computer program for long- term-average spectrum analysis was used for determining the equivalent sound level,
Leq* For the voice patients L was determined by a B&K
eq 2218 sound level meter.
Results The results from the two trials of the healthy voices did not show
any significant differences (a variance analysis is published elsewhere, ( Perkins, Ternstrom, Sundberg & Gramming, 1987).
Fig. 2 shows the average for the various conditions in the healthy voices. The singers produced higher L than the nonsingers. It can be eq noted that the data point for the unmasked conditions adhere to a straight line. This implies that, on the average, the subjects inter- preted "loud" as situated on a logarithmic sound pressure scale midway between "normal" and "loudest". The increment was 9 and 7 dB for the singers and nonsingers, respectively. Under conditions of masking noise, the nonsingers raised their L while the singers reduced their
eq
Leq somewhat as compared with the loudest reading. Evidently, the mean fundamental frequency varies considerably be-
tween subjects, reflecting morphological and habitual differences. Therefore, Fig. 3 shows, on a 1ogariWic scale, the fundamental fre-

STL-QPSR 1/1987 - 43 -
Fig. 2.
50 I I I I
NORMAL LOUD LOUDEST MASKED
EXPERIMENTAL CONDITION
Fig. 3. Mean fundamental frequency recorded for nine singer a d nine nonsinger subjects (solid and dashed curves) when reading under the various conditions. The bars slmw +/- one the standard
Mean Lq observed for nine singer and nine nonsinger subjects ( s o l i d and dashed curves) when reading under var ious condi- tions. The bars show +/- one standard deviation.
16 I I I I
h
yl - - - w C o 14 - - - 5 E - w J) Y 12 - W U - Z
10 -
W / LL - U, -
8 -
>- - U
6 - - W s - W
4 - L
-
deviation.
Z a W 2 - t
0 NORMAL LOUD LOUDEST MASKED
EXPERIMENTAL CONDITION
- -
- - I I I I
STL-QPSR 1/1987
1L
12
10
8
6
L
2
0
- 2
SINGERS ~ I , T , I t , , , , , -
- C L F
-
- -
- - - - -
1 1 1 1 1 ,
14
12
10
8
6
4
2
0
-2
50 60 70 80
t I I I , I ,
- JON
- - - - - - -
I I t I I 1 , -
- SOL
- -
: - 1: I I I I I I I ,
1L
12
10
U
6
4
2
0
- 2
50 - /; 60 70 80
- SCH
-
-
-
-
- -
-
-
j__: I I r I I I t
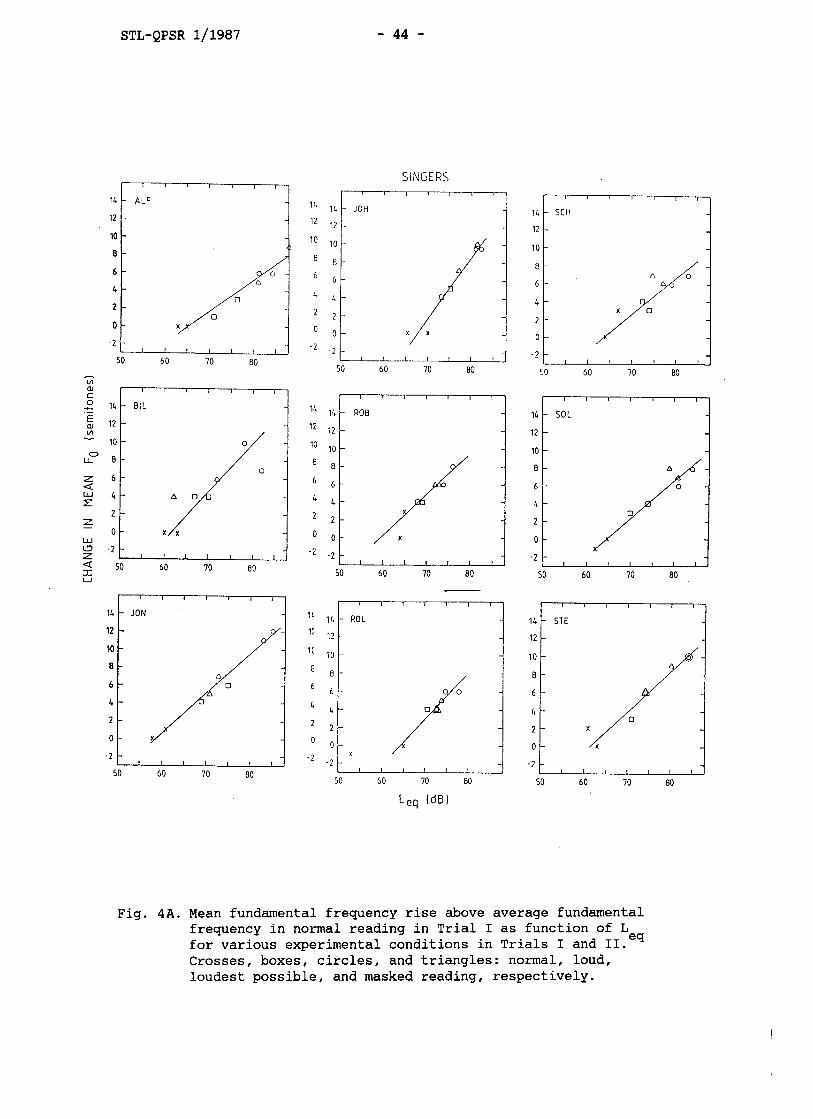
Fig. 4A. Mean fundamental frequency rise above average fundamental frequency in normal reading in Trial I as function of L for various experimental conditions in Trials I and 11. eq
Crosses, boxes, circles, and triangles: normal, loud, loudest possible, and masked reading, respectively.
50 60 70 80
lL 14
1: 12
i 9
t i -
6 -
4 -
2 -
O 0 -
- 2 .*
I 1 I I I I -
- ROL
-
-
-
50 I 60 , / I 70 80

STL-QPSR 1/1987
1L
12
10'
8
6
4 2 0
Fig. 4B.
1L
12
10
8
6
I I I I J I I 1
- JAN
-
-
-
-
- - - // ; - 2 - 1 I I , , -
I I i l I I I
- MAR
-
-
- -
-
50 60 70 80
4 - -
- 2 - I I I I I I I .
50 60 70 80
STL-QPSR 1/1987
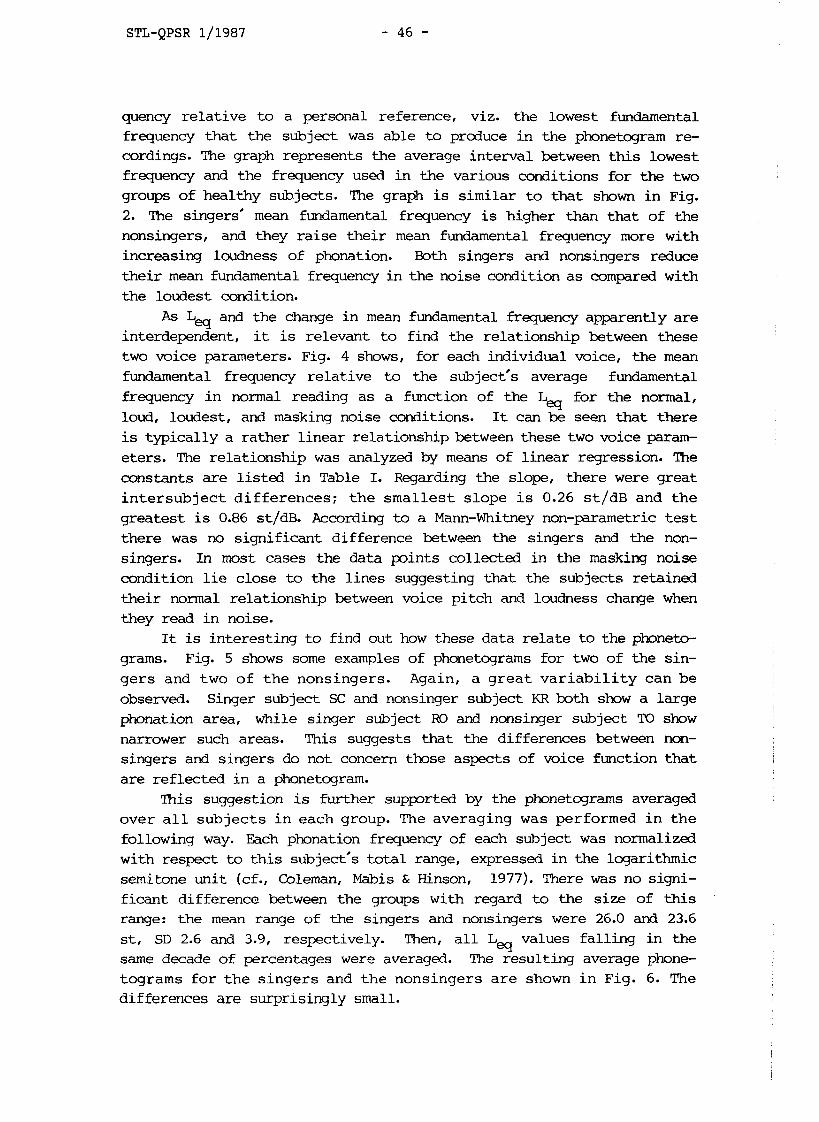
quency relative to a personal reference, viz. the lowest fundamental frequency that the subject was able to produce in the phonetgram re- cordings. The graph represents the average interval between this lowest frequency and the frequency used in the various conditions for the two groups of healthy subjects. The graph is similar to that shown in Fig. 2. The singers' mean fundamental frequency is higher than that of the nonsingers, and they raise their mean fundamental frequency more with increasing loudness of phonation. Both singers and nonsingers reduce their mean fundamental frequency in the noise condition as compared with the loudest condition.
As Leq and the change in mean fundamental frequency apparently are interdependent, it is relevant to find the relationship between these two voice parameters. Fig. 4 shows, for each individual voice, the mean fundamental frequency relative to the subject's average fundamental frequency in normal reading as a function of the L for the normal,
eq loud, loudest, and masking noise conditions. It can be seen that there is typically a rather linear relationship between these two voice param- eters. The relationship was analyzed by means of linear regression. The constants are listed in Table I. Regarding the slope, there were great intersubject differences; the smallest slope is 0.26 st/d~ and the greatest is 0.86 st/d~. According to a Mann-Whitney non-parametric test there was no significant difference between the singers and the non- singers. In most cases the data pints collected in the masking noise condition lie close to the lines suggesting that the subjects retained their normal relationship between voice pitch and loudness change when they read in noise.
It is interesting to find out how these data relate to the phoneto- grams. Fig. 5 shows some examples of phonetograms for two of the sin- gers and two of the nonsingers. Again, a great variability can be observed. Singer subject SC and nonsinger subject KR both show a large phonation area, while singer subject RO and nonsinger subject TO show narrower such areas. This suggests that the differences between non- singers and singers do not concern those aspects of voice function that are reflected in a phonetogram.
This suggestion is further supprted by the phonetograms averaged over all subjects in each group. The averaging was performed in the following way. Each phonation frequency of each subject was normalized with respect to this subject's total range, expressed in the logarithmic semitone unit (cf., Coleman, Mabis & Hinson, 1977). There was no signi- ficant difference between the groups with regard to the size of this range: the mean range of the singers and nonsingers were 26.0 and 23.6
st, SD 2.6 and 3.9, respectively. Then, all Lq values falling in the same decade of percentages were averaged. The resulting average phone- tograms for the singers and the nonsingers are shown in Fig. 6. The differences are surprisingly small.

110
103
90
- m u -
- 8 0 G- a
_1
70
60
. 50 i2 5 . 4 C E3 G A C EL G A C € 5 E2 G A C € 3 G A C E4 G A C € 5
82,5 98 ",'o 131 165 196 220 262 330 392 4'+0 524 b60 82,5 98 110 131 165 196 220 262 330 392 440 524 660
PHOKATION FREQUENCY PHONATION FREQUENCY Fig. 5. Examples of phonetograms for (left) singer subjects RO (above) and SC (below) and (right) tor
nonsinger subjects KR (above) and TO (below). N, L, LL, and M refer to L values for the normal, loud, very loud, and masked conditions, respectively. eq
I I I I I I I I I I I
- -
- d X - x
-
- /x-xH -
- /x
; rM x /x\x.x
/x\,/~ -
-
- /x.x -
-
I I I I I I I I I I I
110 11 0
100 100
- m
90 o 90 - m E -u -
80 er, __t a- a
t- a -J
?o a "7 70
60 60
50 50
?? 0
100
- m 3 9C - E m 0 t- ao
-=l
i n 70 v,
6 5
5 0
I I 1 I I I I - I I I I
- -
- -
-
/x-x- - -
/<* - -
- - - zx:x-x-x -
yX - -
- -
- -
-
I I I I I I I I I I I
STL-QPSR 1/1987
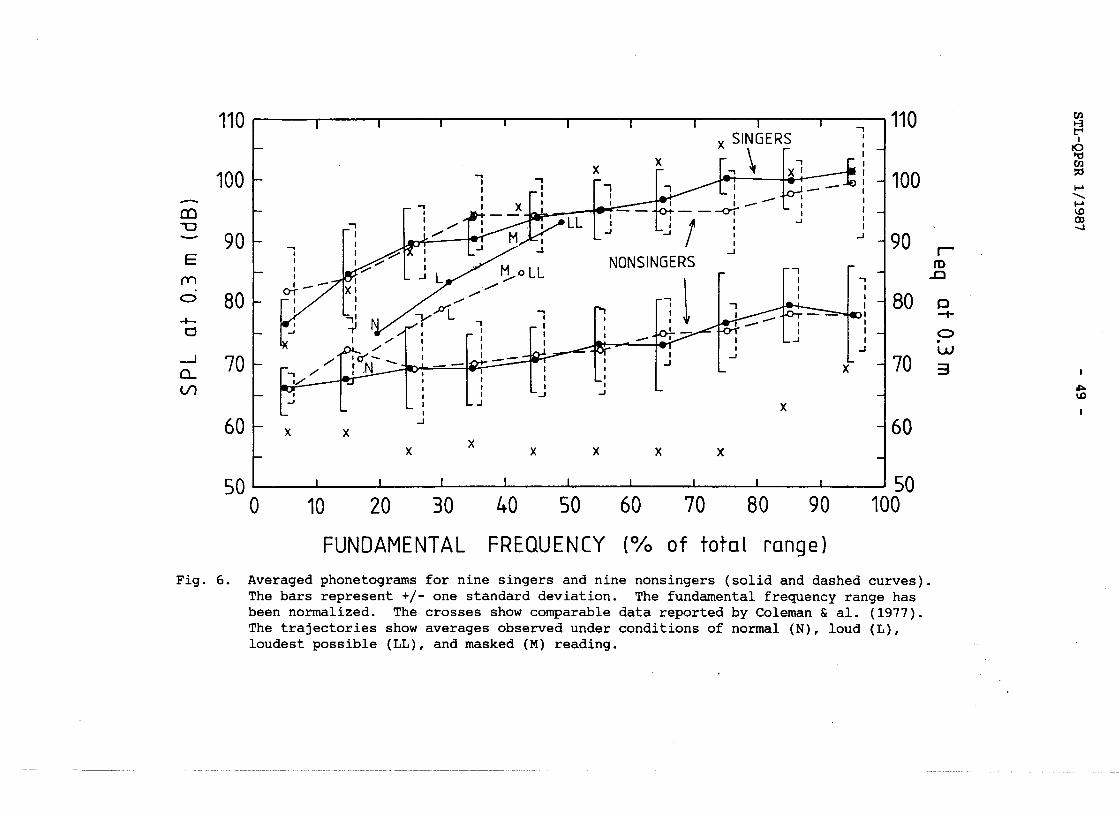
For canparison we also show in this same figure the average phone- tcgram for normal voices with no or only moderate experience of singing, that was previously published by Coleman & al. (1977). There is a fair agreement with regard to the upper contour, referring to loud maximum phonation; however, our subjects did not reach as high values as in the previous investigation. There is a great difference in the lower con- tour (for soft phonation), which is 10 to 20 dB lower in the Coleman &
al. study. In these phonetograms are also included the trajectories showing
how the subjects changed their mean relative fundamental frequency as they changed loudness in the normal, loud, loudest, and noise condi- tions.
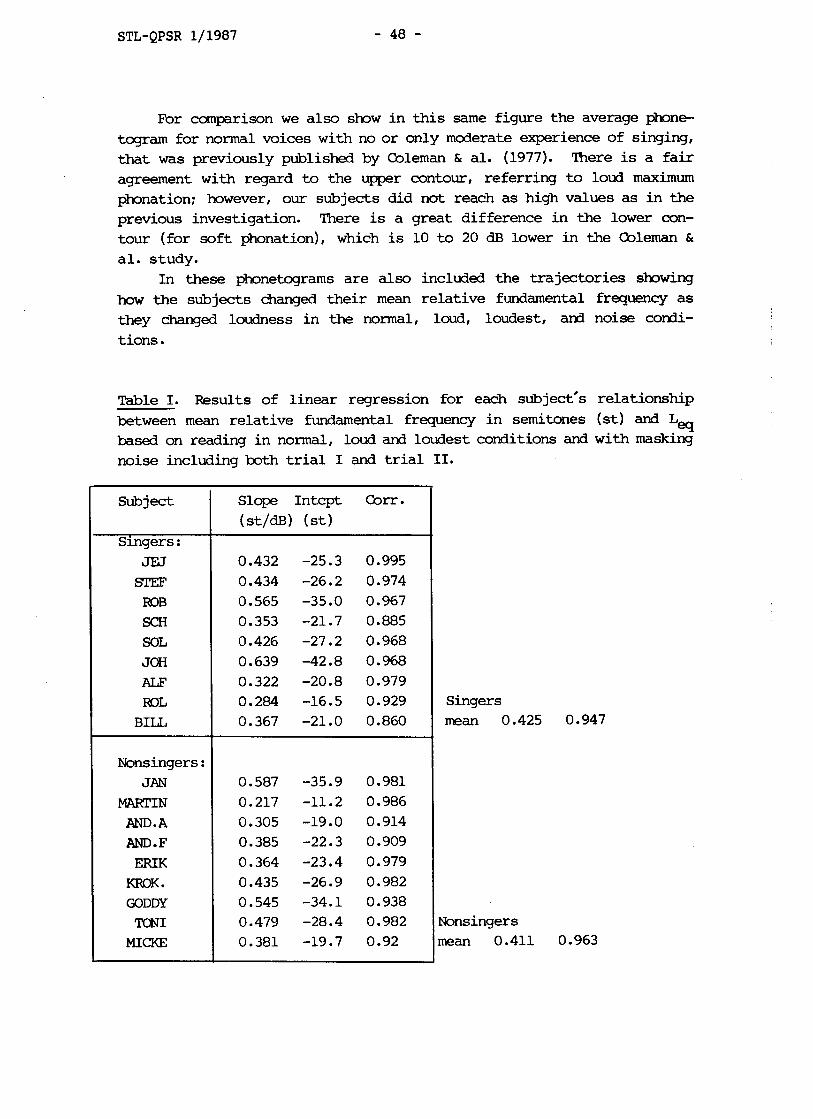
Table I. Results of linear regression for each subject's relationship between mean relative fundamental frequency in semitones (st) and La
based on reading in normal, loud and loudest conditions and with masking noise including both trial I and trial 11.
Subject
Singers : JEJ
STEF
ROB
SCH SOL
JOH ALF ROL
BILL
Slope Intcpt Corr.
(st/dB) (st)
Nonsingers: JAN
MAWTIN AND. A AND. F ERIK m. GODDY
TONI MICKE
Singers mean 0.425 0.947
Nonsingers mean 0.411 0.963
FUNDAMENTAL FREQUENCY (% o f total range)
Fig. 6. Averaged phonetograms for nine singers and nine nonsingers (solid and dashed curves). The bars represent +/- one standard deviation. The fundamental frequency range has been normalized. The crosses show comparable data reported by Coleman & al. (1977). The trajectories show averages observed under conditions of normal (N), loud (L), loudest possible (LL), and masked (M) reading.

STL-QPSR 1/1987
Before commenting upon these t ra jec tor ies , it is necessary t o digress for a moment and recall the relationship between the two loud- ness measures involved. The L is a time average of SPL:
eq
where T is the intergration time PA(t ) is the SPL as measured with A-weighting Po is the reference pressure (=20 uPa)
Therefore, the L an3 the SPL w i l l be equal only under coditions eq of sustained sounds. In speech, pauses occur and the SPL varies conti- nuously. Therefore, the L w i l l always be lower than the highest SPL in eq the speech sample analyzed. Thus, i f the maximum SPL occurs only during 1/10 of the total reading time, the Leq w i l l be 10 dB lower than this maximum SPL, and i f the maximum SPL occurs half of the reading time, the difference w i l l be 3 dB. For these reasons, the Lq values slmuld be expected t o be rather low as compared with the phonetogram top SPL values, which apply to sustained phonation of the vowel /q. However, the fundamental frequency value assigned t o an L--value is an average representing both lower and higher fundamental frequencies. In averaging sound level, high sound levels a re more inf luent ia l than low sound levels. Moreover, pbnation tends t o be louder a t higher than a t lower fundamental frequencies. This has the effect of raising L -values for
eq speech with a varying fundamental frequency, or , i n other words, it causes the points on the t ra jec tor ies i n the figure t o approach the upper phonetogram contour.
The subjects' mean fundamental frequency in normal speech l i e s a t about 15 t o 20% which corresponds t o about 5 semitones above the lowest pitch. For loudest possible speech, it is raised to 40 or 50%, or about one octave above the lowest pitch. The equivalent sound level in normal speech is close to the minimum SPL and approaches maximum SPL for loud- est possible speech. The singers are seen to phonate a t a higher sound level and a t higher mean relative fundamental frequency througbut. They also seem t o place their mean fundamental frequency relatively higher than the nonsingers.
With respect to the trajectories, the singers are seen to phonate a t a higher L and a t higher mean re la t ive fundamental frequency
eq throughout, a s was previously shown in Figs. 2 and 3. Moreover, the nonsingers seem to place their mean fundamental frequency lower in their range than the singers. The loudest codition yielded a point close to the top contour for the singers. This may depend on an ar t iculatory factor: many singers applied a legato style of speaking in loud reading, apparently shortening unvoiced segments. In both the singers and the
STL-QPSR 1/1987 - 51 -
nonsingers, the data points pertaining to the noise c o d i t i o n (M) f a l l close t o the l i n e joining the p i n t s for loudest and loud reading.
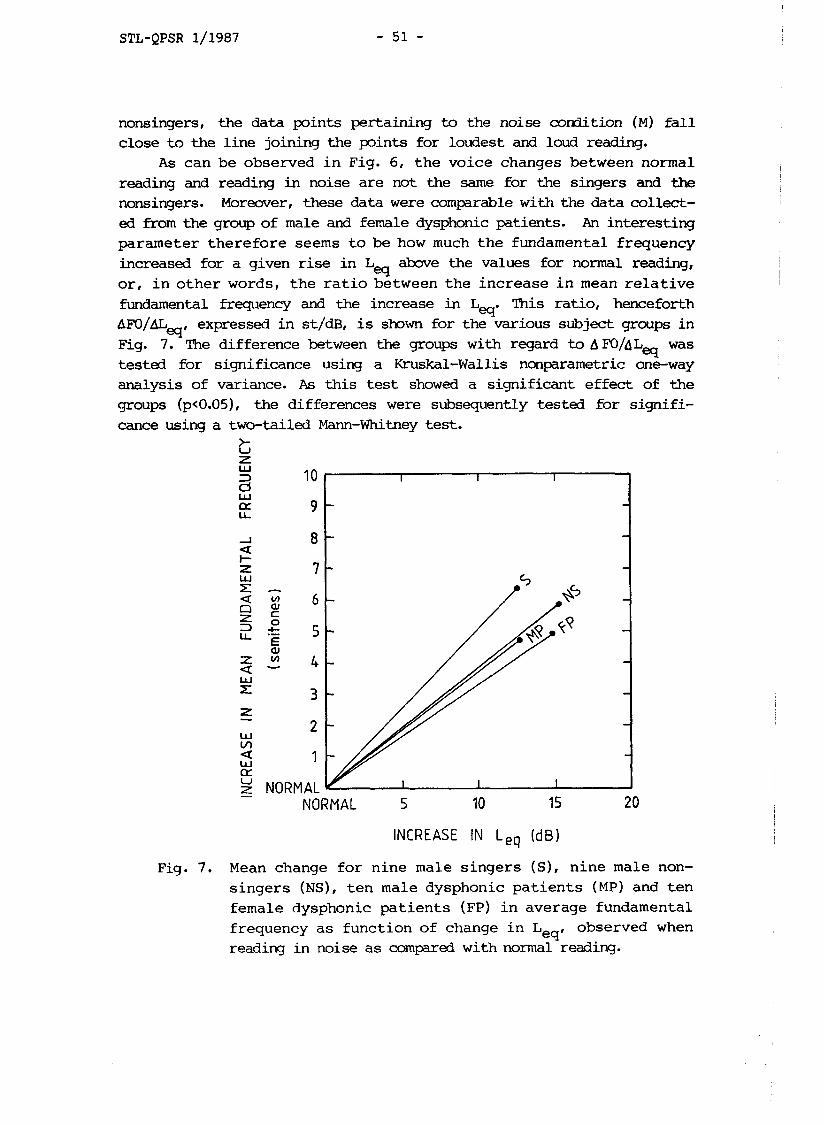
As can be observed i n Fig. 6, t h e voice changes between normal reading and reading i n noise a re not the same for the singers and the nonsingers. Moreover, these data were comparable with the data collect- ed from the group of male and female dysphonic patients. An interesting parameter t h e r e f o r e seems t o be how much t h e fundamental frequency increased for a given rise i n L above the values for normal reading, o r , i n o t h e r words, t h e r a t i o between t h e increase i n mean r e l a t i v e fundamental frequency and the increase i n L This rat io, henceforth
eq' A F ~ / A L ~ , expressed i n s t / d ~ , i s shDm for the various subject groups i n Fig. 7. The difference between the groups with regard to A F0/6 L was tested for significance using a Kruskal-Wallis nonparametric one-way analysis of variance. A s t h i s test showed a significant e f fec t of the groups (p<0.05), the differences were subsequently tested f o r s ignif i - cance using a two-tailed Mann-Whitney tes t .
t, 2
Z - W
2 I/) -=l W 1 (Y
NORMAL NORMAL
INCREASE IN Leq ( d B )
Fig. 7. Mean change f o r nine male s ingers (S), n ine male non- s ingers (NS), t e n male dysphonic p a t i e n t s (MP) and t e n female dysphonic p a t i e n t s (FP) i n average fundamental frequency a s funct ion of change i n L observed when eq' reading i n noise a s compared with normal reading.

STL-QPSR 111987 - 52 -
The results shown in Table I1 indicate that the singers differed significantly (p<0.05) from the nonsingers and the patients, while there was no significant difference between the two last-mentioned groups. Thus, when the singers were reading in noise, they raised mean pitch more and Lq less abwe the normal reading level than did the nonsingers and the patients. With respect to the loudest condition there was no significant difference in this ratio between the singers and the non- singers.
Table 11. Analysis of variance of the effect of the groups on the in- creases in mean relative fundamental frequency relative to the increase in L (~FO/AL~: in st/d~) when reading in masking noise as compared eq with normal readmng.
Discussion In a study of mean fundamental frequency in speech during noise
Kitzing (1979) compared two groups of subjects: teachers of nursery school who had basically untrained voices and voice therapists who had had considerable voice training. It turned out that the trained subjects
t
Group
Singers Nonsingers Dysphonic patients (male) Dysphonic patients (female)
raised their mean fundamental frequency significantly less than did the untrained subjects. Our finding was that the singers raised their mean fundamental frequency more than did the nonsingers. The difference in these results may be explained by the difference in the voice education of singers and voice therapists; in singing as opposed to normal speech one must be able to change fundamental frequency within a wide range without straining the voice.
N Min Median Max ( st/dB) ( st/d~) ( st/dB)
9 0.3 0.540 1.250 9 0.2 0.430 0.640 10 0.15 0.400 0.480 10 0.18 0.320 0.460
We found that, when the singers were reading in noise, they raised mean pitch more and L less above the normal reading level than did the
eq nonsingers and the patients. One explanation of this would be that the singers possessed a wider phonation frequency range than the nonsingers. Wwever, there was no difference between the groups, neither with re- spect to L nor to phonation frequency range, as illustrated by the
eq ' similarity between the upper and lower countours shown in Fig. 6. Thus, the difference between the groups with regard to AFO/AL~~ cannot be explained by a difference in phonation frequency range.

STL-QPSR 1/1987 - 53 -
Another explanation may seem more plausible. It is likely that, as compared with nonsingers, singers can use a wider pitch range withDut stressing the voice. They may take advantage of this wider easily avail- able range when reading in noise.
In the experiment, two different types of noises were used; the noise used for the healthy subjects was LP filtered (cf., Fig. 1) while the noise used for the patients was white. Also, the SPL differed being 100 dB in the case of the filtered noise and 70 dB in the case of the white noise; however, because of the spectrum dissimilarities, this level difference does not imply any great difference in the loudness perceived. Above 500 Hz, approximately, a vowel spectrum typically falls off at a rate of 6 d~/octave, so the spectrum level at high frequencies is low. The filtered noise seems preferable to use as there is no need to bother subjects with masking noise energy in frequency regions that are practically void of sound energy. However, the choice does not seem critical to the effects induced. The patients and the untrained subjects reacted in similar ways, although the noise was different .
It is interesting that there was no clear difference between the nonsingers and the patients regarding the increases in SPL and in mean fundamental frequency observed during reading in noise. Thus, our method does not seem useful for discriminating normal and pathological voices. However, as shown by Kitzing (1979), differences appear after an ex- tended period of reading in noise.
Our lower phonetogram contour was similar to that reported by Seidner, Kreuger & Wernecke (1985) but considerably higher than that observed by Coleman & al. (1977). Cur higher contour is similar to that found by Coleman & al. but much higher than than found by Seidner & al. for nonsingers. The reason for these diverging results is probably differences in the procedures and in the vowel used. An interesting aspect of the relationship between shifts in L and fundamental fre-
eq quency is the fact that loudness level is regulated by subglottal pres- sure in the first place: according to Bouhuys, Mead, Proctor & Stevens (1968), a doubling of subglottal pressure tends to result in an increase of SPL of 9 dB, on the average. rnwever, a raised subglottal pressure also yields a rise in fundamental frequency: according to Baer (1979) the voice fundamental frequency increases by about 4 Hz per cm H20. In normal speech, subglottal pressure is typically in the vicinity of 5 cm H20. A loudness increase of 9 or 18 dB, can then be estimated to result from an increase of subglottal pressure by a factor of 2 or 4, respecti- vely, i.e., from 5 to 10 or to 20 cm H20. Such increases would induce fundamental frequency rises of about 20 or 60 Hz; counted from 100 Hz, this increase corresponds to about 3 a d 8 st.
We observed that the mean fundamental frequency rose by around 0.4 st/d~. For 9 dB this yields a rise of 3.6 st, ard for an 18 dB increase

STL-QPSR 1/1987
a r i s e of 7.2 st. Thus, the observed rises i n mean fundamental frequency are of the same order of magnitude as t b s e expected from the postulated increases i n subglottal pressure. In other words, the changes i n mean fundamental frequency could very well be the result of the sutglottal pressure changes.
The high correlation between mean fundamental frequency an3 L i n eq reading probably reflects a habit i n voice use under the experimental conditions used. In other words, it is certainly possible to combine loud reading with a low voice pitch or sof t reading with a high voice pitch, i f needed.
In cl inical work reading in noise and phonetograms are both methods that are frequently used. In the present investigation both these meth- ods have been applied. S t i l l , it i s hard t o compare t h e i r c l i n i c a l value, a s no phonetograms were made fo r the pat ients . Also, we lack independent data on voice function. QI the other hand, it may be worth- while t o analyze in relation t o the phonetogram L and mean fundamental frequency for voice patients speaking a t different vocal efforts. It is possible that it is more appropriate to speak about an optimal pathway i n the phonetogram rather than an optimal voice pitch.
Conclusions Singers phonated a t higher mean L and a t higher mean relative
eq fundamental frequency than nonsingers when reading with normal and raised loudness and during noise. When reading i n noise, the singers raised thei r mean fundamental frequency more and the mean L less above
eq the values observed for normal reading than the nansingers. M differ- ence was found between nonsingers and dysphonic patients i n t h i s re- spect.
The Lq and mean fundamental frequency were highly correlated; the subglottal pressure increases that can be postulated from the increases i n L are sufficient to explain the r ises i n mean fundamental frequency
eq as passively induced by the pressure rises. The correlation probably reflects a habit i n the use of the voice.
Mean phonetograms for singers and nonsingers differed consistently only i n t h a t t he nonsingers had a s l i g h t l y lower leve l a t the top frequencies of the upper contour. The phonetogram seems rather sensi- t ive t o the procedure used for recording it, as subjects would easily avoid extreme degrees of loudness.
The subjects are gratefully acknowledged for their kind coopera- tion, the Department of F'honiatrics, Malmo General Hospital for provid- ing access t o the patient groups, as well as to recording and computer

STL-QPSR 1/1987 - 55 -
facilities, Statistician J.A. Nilsson for assisting with statistical processing of data, Ing. L. akerlund for technical assistance in record- ing the patients a d analysis, and Professor N.G. Tbremalm for valuable support in many different ways.
References Baer, T. (1979): "Reflex activation of laryngeal msucles by sudden induced subglottal pressure changes", J.Acoust.Soc.Arn. - 65, pp. 1271- 1275.
Bouhuys, A., Mead, J., Proctor, D.F. & Stevens, K.N. (1968): "Pressure- flow events during singing", Ann. of the New York Acad. of Sci., 155, - A r t . 1, pp. 165-176.
Coleman, R., Mabis, J. & Hinson, J. (1977) : "Fundamental frequency - sound pressure level profiles of adult male and female voices", J. Speech and Hear .Res. 20, pp. 197-204. - Fant, G. (1979): "Glottal source and excitation analysis", STL-QPSR 1/1979, pp 85-107.
Fant, G., Liljencrants, J. & Lin, Q. (1985): "A four-parameter model of glottal flow", S'I'L-QPSR 4/1985, pp. 1-13.
Gauffin, J. & Sundberg, J. (1980): "Data on the glottal voice source behavior in vowel production", SIGQPSR 2-31 1980, pp. 61-70.
Kitzing, P. ( 1979) : "Glottogra fisk f rekvensindikering (Glottographic Frequency Indicator)", b t . diss., Lund University.
Lane, H. & Tranel, B. (1971): "The kmbrad sign and the role of hearing in speech", J. Speech and Hear.Res. - 14, pp. 677-709.
Perkins, W.H., Ternstrom, S., Sundberg, J. & Gramming, P. (1987): "Effects of high-frequency feedback and noise on phonation as analyzed by long-term-average spectra", STGQPSR 1/1987, pp. 57-80.
Schutte, H.K. & Seidner, W. (1983) : "Recommendation by the Union of European Phoniatricians (UEP) : Standardizing voice area measurement/ phonetography" , Fol. Phoniat. - 5 pp. 286-288.
Seidner, W., Krueger, H. & Wernecke, K-D. (1985): "Numerische Aus- wertung spektraler Stimrnfelder", Sprache-Stimme-Geh6r 9, pp. 10-13.