Embed Size (px)
Citation preview
RELATIONSHIP BETWEEN EXECUTIVE COMPENSATION AND
FINANCIAL PERFORMANCE OF COMMERCIAL STATE OWNED
ENTERPRISES IN THE ENERGY SECTOR IN KENYA
BY
BENARD MULWA KYALO
A RESEARCH PROJECT SUBMITTED IN PARTIAL FULFILLMENT OF
THE REQUIREMENTS FOR THE AWARD OF THE DEGREE OF MASTER
OF BUSINESS ADMINISTRATION (MBA), SCHOOL OF BUSINESS,
UNIVERSITY OF NAIROBI,
OCTOBER, 2015
ii
DECLARATION
I declare that this research project is my original work and has not been submitted for
an award of a degree in any other University for examination/academic purposes.
SIGNATURE:………………………………DATE: …………………………………
Benard M. Kyalo
D61/78053/2009
This research project has been submitted for examination with my approval as the
University Supervisor.
SIGNATURE:…………………………………………DATE:………………………
Dr. Josephat L. Lishenga
Lecturer, Department of Finance and Accounting

iii
DEDICATION
A special dedication to my family. My loving dear wife Esther (Ph. D student), my
children Kailu, Kisonzo, Mutuku and Kata. A special mention to my mother Kailu
Kyalo, for many hours they had to endure my absence in the family throughout my
MBA course.
I have been deeply humbled by the knowledge acquired during my studies at the
University of Nairobi.
iv
ACKNOWLEDGEMENT
Primarily I would thank God for being able to complete this project with success.
Then I would like to thank my Supervisor, Dr. J. Lishenga whose valuable guidance
has seen me patch the project and make it full proof success. His many suggestions
and instructions has served as the main contributor towards the completion of the
project.
I feel immensely grateful to my colleagues with a special mention of Kinyanjui and
Monica for standing with me and enduring my absence from our challenging office
during the entire period.
A special mention of Dr. Duncan Elly whose input in MBA Financial Accounting
class immensely contributed to the success of the project.
Finally and with sincererity, thank teaching and non-teaching staff of the University
of Nairobi, School of Business, Department of Finance and Accounting.
v
TABLE OF CONTENTS
DECLARATION ..................................................................................................... ii
DEDICATION ........................................................................................................ iii
ACKNOWLEDGEMENT ...................................................................................... iv
LIST OF TABLES ................................................................................................ viii
ABREVIATIONS AND ACRONYMS .................................................................. ix
ABSTRACT ............................................................................................................. x
CHAPTER ONE: INTRODUCTION ..................................................................... 1
1.1 Background of the Study ...................................................................................... 1
1.1.1 Executive Compensation ............................................................................. 2
1.1.2 Firm Performance ....................................................................................... 2
1.1.3 Executive Compensation and Firm Performance ......................................... 3
1.1.4 State Corporations in the Energy Sector of Kenya ....................................... 4
1.2 Research Problem ................................................................................................ 5
1.3 Research Objective .............................................................................................. 7
1.4 Value of the Study ............................................................................................... 7
CHAPTER TWO: LITERATURE REVIEW ........................................................ 8
2.1 Introduction ......................................................................................................... 8
2.2 Theoretical Framework ........................................................................................ 8
2.2.1 Agency Theory ........................................................................................... 8
2.2.2 Stewardship Theory .................................................................................... 9
2.2.3 Expectancy Theory ................................................................................... 10
2.3 Determinants of Firm Performance .................................................................... 11
2.3.1 Size of the Firm ......................................................................................... 11
vi
2.3.2 Capital Structure ....................................................................................... 11
2.3.3 External Factors ........................................................................................ 12
2.4 Empirical Review .............................................................................................. 12
2.5 Chapter Summary .............................................................................................. 17
CHAPTER THREE: RESEARCH METHODOLOGY ...................................... 18
3.1 Introduction ....................................................................................................... 18
3.2 Research Design ................................................................................................ 18
3.3 Target Population .............................................................................................. 18
3.4 Data Collection .................................................................................................. 18
3.5 Data Analysis .................................................................................................... 19
3.5.1 Analytical Model ...................................................................................... 19
3.6 Tests of Significance .......................................................................................... 19
CHAPTER FOUR: DATA ANALYSIS, RESULTS AND DISCUSSIONS ........ 21
4.1 Introduction ....................................................................................................... 21
4.2 Descriptive Statistics .......................................................................................... 21
4.3 Correlation Analysis .......................................................................................... 22
4.4 Executive Compensation and Firm Financial Performance ................................. 23
CHAPTER FIVE: SUMMARY, CONCLUSIONS AND
RECOMMENDATIONS ....................................................................................... 27
5.1 Introduction ....................................................................................................... 27
5.2 Summary of Findings ......................................................................................... 27
5.3 Conclusions ....................................................................................................... 29
5.4 Limitations of the Study ..................................................................................... 30

vii
5.5 Recommendations.............................................................................................. 31
5.6 Suggestions for further Research ........................................................................ 31
REFERENCES ...................................................................................................... 32
Appendix One: Commercial State Corporations in the Ministry of Energy ............... 36

viii
LIST OF TABLES
Table 4.1: Descriptive Statistics ............................................................................... 21
Table 4.2: Correlations ............................................................................................ 22
Table 4.3: Model Summary ..................................................................................... 23
Table 4.4: ANOVAa ................................................................................................ 24
Table 4.5: Coefficientsa ........................................................................................... 25
ix
ABREVIATIONS AND ACRONYMS
ANOVA Analysis of variance
CEO Chief Executive Officer
ERC Energy regulatory commission
GDC Geothermal Development Company
KENGEN Kenya Electricity Generation Company Limited
KETRACO Kenya Electricity Transmitting Company
KPRL Kenya Petroleum Refineries Limited
KPC Kenya Pipeline Company Limited
KPLC Kenya Power and Lighting Company Limited
NOCK National Oil Corporation of Kenya
NSE Nairobi Securities Exchange
REA Rural Electrification Authority
x
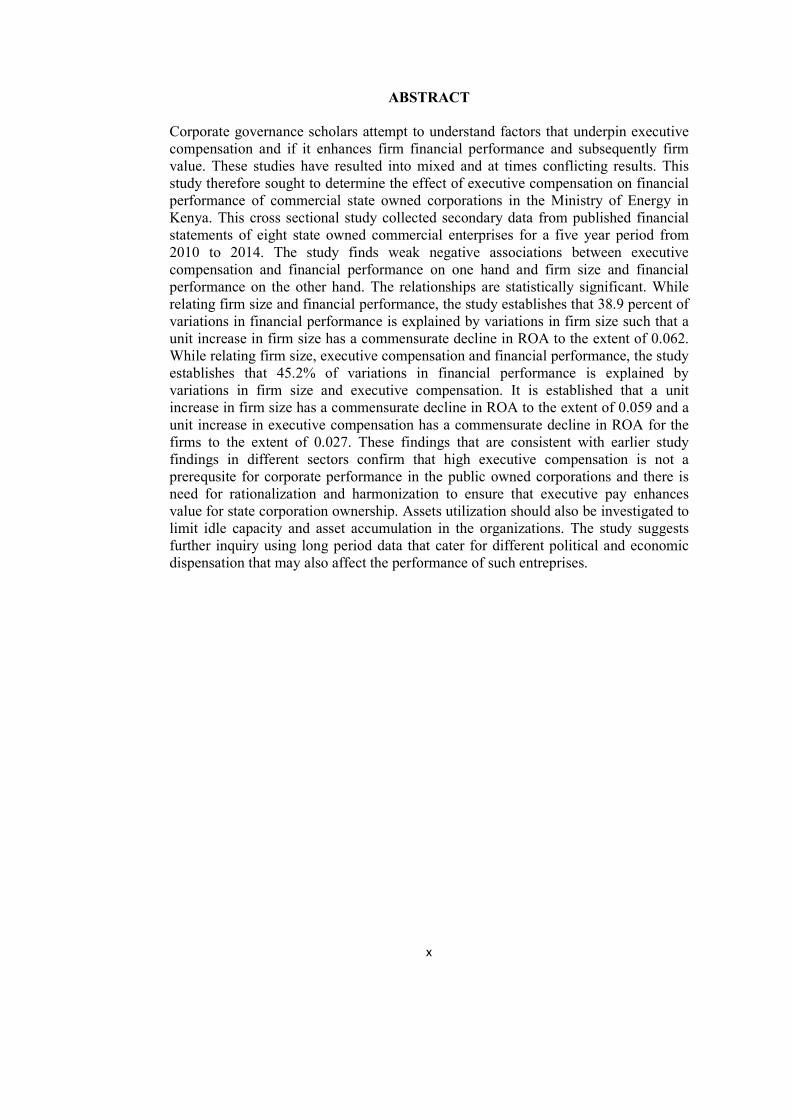
ABSTRACT
Corporate governance scholars attempt to understand factors that underpin executive compensation and if it enhances firm financial performance and subsequently firm value. These studies have resulted into mixed and at times conflicting results. This study therefore sought to determine the effect of executive compensation on financial performance of commercial state owned corporations in the Ministry of Energy in Kenya. This cross sectional study collected secondary data from published financial statements of eight state owned commercial enterprises for a five year period from 2010 to 2014. The study finds weak negative associations between executive compensation and financial performance on one hand and firm size and financial performance on the other hand. The relationships are statistically significant. While relating firm size and financial performance, the study establishes that 38.9 percent of variations in financial performance is explained by variations in firm size such that a unit increase in firm size has a commensurate decline in ROA to the extent of 0.062. While relating firm size, executive compensation and financial performance, the study establishes that 45.2% of variations in financial performance is explained by variations in firm size and executive compensation. It is established that a unit increase in firm size has a commensurate decline in ROA to the extent of 0.059 and a unit increase in executive compensation has a commensurate decline in ROA for the firms to the extent of 0.027. These findings that are consistent with earlier study findings in different sectors confirm that high executive compensation is not a prerequsite for corporate performance in the public owned corporations and there is need for rationalization and harmonization to ensure that executive pay enhances value for state corporation ownership. Assets utilization should also be investigated to limit idle capacity and asset accumulation in the organizations. The study suggests further inquiry using long period data that cater for different political and economic dispensation that may also affect the performance of such entreprises.
1
CHAPTER ONE:
INTRODUCTION
1.1 Background of the Study
Crystal (1991) observe that compensation paid to the top executives of corporations is
a politically sensitive area with critics claiming that amounts paid to executives are
too high. The levels of compensation in all countries have been rising dramatically
over the past decades. Not only is it rising in absolute terms, but also in relative terms.
Gabaix and Landier (2008) established that the compensation of other senior
executives has risen more rapidly than that of rank and file workers but has not kept
pace with CEO pay. A reason for these huge increases is a result of the addition of this
risky pay which necessitated an increase in compensation of the risk averse
executives.
Tosi, et al. (2000) opine that corporate governance scholars have long attempted to
understand a myriad of factors that underpin executive compensation. The most
popular stream of research based on agency theory suggests that the board of directors
and performance based incentives are among the critical governance mechanisms that
allow reducing opportunistic behavior of executives and aligning their interests with
those of shareholders.
Ochieng (2012) refers to various publicized landmark events and corporate frauds
including the bursting of the dotcom bubble in 2000, the housing bubble and the
subprime debacle to explain the renewed interest in high levels of executive
compensation and the possibility that executive compensation plan structures could
contribute to such events. This new attention is informed by two different views
adopted when evaluating executive compensation. Foremost, the rent extraction
2
approach that attributes executive compensation to power rather than inputs and
secondly, the efficiency approach that attributes executive compensation to inputs
that the executive officer brings to the organization.
1.1.1 Executive Compensation
Executive compensation (also executive pay), is financial compensation received by
an officer of a firm. It is typically a mixture of salary, bonuses, shares of and/or call
options on the company stock, benefits, and perquisites, ideally configured to take into
account government regulations, tax law, the desires of the organization and the
executive, and rewards for performance (Maijoor & Vanstraelen, 2006).
Bebchuk and Grinstein (2005) and Murphy (1999) opine that executive compensation
is pay received by an officer of a firm, often as a mixture of salary, bonuses, and
shares of and/or call options on the company stock, paid expenses (perks) or
insurance. It refers to the benefits and remuneration accruing to top management of a
corporation mostly the Board of Directors including the CEO.
Bebchuk and Fried (2004) and Kuhnen and Zwiebel (2009) discuss the various
components of executive compensation to include a basic salary, bonus, stock options,
and grant of shares, pension, severance pay and perquisites. Other benefits include
employee benefits and pension ideally configured to take into account government
regulations, tax law, the desires of the organization and the executive, and rewards for
performance.
1.1.2 Firm Performance
This is a measure of the extent the corporation has attained its goals and objectives
thereby meeting the needs of all stakeholders and specifically shareholders. According
3
to Bien (2002), financial performance is the economic financial condition of an entity
in a given time, which is also known as financial effectiveness.
The performance of a firm has to do with how effectively and efficiently it is able to
achieve the set goals which may be financial or operational. The financial
performance of a firm relates to its motive to maximize profit both to shareholders and
on assets (Chakravarthy, 1986) while operational performance concerns with growth
and expansions in relations to sale and market value (Hofer and Sandberg, 1987).
Leah (2008) explain that financial performance refers to the measurement of the
results of a firm’s strategies, policies and operations in monetary terms. These results
are reflected in the firm’s return on assets (ROA) and return on investments (ROI).
Various researchers have used different measures to capture organizational
performance including net income, Sales (Dollinger, 1984), Return on Investments
(ROI), Return on sales (ROS), and a combination of ROI and ROS (Pegels and Yang,
2000), return on assets (ROA) (Birley and Wiersema, 2002) and market to book value
of the equity as well as profitability and market share/ growth (Entrialgo, et al. 2000).
1.1.3 Executive Compensation and Firm Performance
Ideally, executive compensation and financial performance are perfectly correlated,
but associative studies on executive compensation and performance have yielded
mixed results. The executives who build real value in the company they manage
should be paid handsomely well but not excessive, hence a level which is able to
attract, maintain, and motivate such skilled managers who will enable the firm achieve
its objectives and goals in the long term (Busaule, 2011).
4
Murphy (1999) provides a general overview of the literature, methodology and issues
in executive compensation, starting from the influential study of Jensen and Murphy
(1990), which first identified the pay-performance puzzle and reported that there is
little relationship between executive pay and company performance. Main et al
(1996), Izan, Sidhu and Taylor (1998), and Benito and Conyon (1999) have confirmed
these low pay performance sensitivities. Most studies have found out that there exists
a positive relationship between cash compensation and financial performance in terms
of profitability measures. The purpose of executive compensation is to attract and
retain skilled labor. It also encourages employees to act in accordance with all the
stakeholders’ desires and thus reduce possible conflicts of interest within the
organization.
Kaplan and Atkinsson (1989) explain that executive compensation should be designed
in a way that affects employees positively and should fulfill three criteria. The
executive compensation should be competitive in terms of size in order to attract and
keep the best employees; Incentive programs shall communicate and strengthen the
main objectives of the company by attaching flexible compensation to performance;
Flexible compensation shall encourage a performance oriented corporate climate by
observing and rewarding good performance.
1.1.4 State Corporations in the Energy Sector of Kenya
The ministry of energy sector in Kenya comprises of various parastatals / statutory
bodies in the energy sector. Kenya Power and Lighting Company Limited (KPLC);
Kenya Petroleum Refineries Limited (KPRL); Kenya Electricity Generating Company
Limited (Kengen); National Oil Corporation of Kenya (National Oil); Kenya Pipeline
Company Limited (KPC); Energy Regulatory Commission (ERC); Rural
5
Electrification Authority (REA); Energy Tribunal; Geothermal Development
Company (GDC) and Kenya Electricity Transmitting Company (KETRACO) (Birech,
2011).
State corporations in Kenya have been put under performance contracting as an
effective and promising means of improving the performance of public enterprises as
well as government departments. Birech (2011) explain that the PC is a critical
instrument used by the Government of Kenya to realize its targets and cascaded
downwards from the top to the bottom of the state institutions. It promotes
transparency and accountability in the management of public resources and utilization
of the same for mutual benefit of the people of Kenya. The use of performance
contract is also useful in promoting good corporate governance and also offers better
and efficient project management and implementation.
1.2 Research Problem
The relationship between executive compensation and firm performance has been
documented in the literature to date. The compensation studies suggests that pay
performance sensitivities should vary systematically with firm size and CEO stature,
with strongest sensitivities associated with executives in larger firms. Ideally,
executive compensation and firm performance are perfectly correlated, but associative
studies on executive compensation and performance have yielded mixed results
(Aduda and Musyoka, 2011).
The performance of state owned corporations in Kenya’s energy sector is of
significance given the realization that development projects recommended under
vision 2030 will increase demand of Kenya’s energy supply. According to the Vision
6
2030 document, the Government is committed to continued institutional reforms in the
energy sector, including a strong regulatory framework, encouraging more private
generators of power, and separating generation from distribution.
There are mixed results in theory and empirical evidence with regard to the
relationship between financial performance and executive compensation. Tosi et al.
(2000) observed a weak correlation between CEO pay and performance but a strong
positive correlation with CEO pay and firm size. Shah et al. (2006) found a positive
relationship between total CEO compensation and firm performance and explain that
CEO compensation is a function of performance measures, size and corporate
governance variables. In the UK, Ozkan (2007) found out that there is a positive
relationship between CEO pay and a firm’s performance. In Sweden, Tariq (2010)
established that compensation of the CEO is an increasing function of size of the firm
and also growth of the company.
In Kenya, there exists mixed study findings on the relationships. Aduda and Musyoka
(2011) establishes a negative non-significant relationship between executive
compensation and performance of the commercial banks. Ongore and K‘obonyo
(2011) finds a positive relationship between insider ownership and performance of
firms listed at the NSE when executives take firm ownership stakes as part of
compensation. Lishenga (2011) observe that insider ownership falls with falling firm
performance as CEO remuneration is insensitive to firm performance amongst
companies listed at the NSE. Busaule (2014) found a positive but insignificant
relationship between financial performance and executive compensation of
commercial banks in Kenya. These mixed findings globally and locally point to the
reality that the studies have not exhaustively explored the link between executive
7
compensation and firm performance. The study thus poses the question: what is the
relationship between executive compensation and financial perfomance of commercial
state owned corporations in the energy sector in Kenya?
1.3 Research Objective
This study sought to establish the relationship between executive compensation and
financial performance of commercial state owned corporations in the energy sector in
Kenya.
1.4 Value of the Study
Stock Market Regulators: This study provides an understanding of executive
compensation and to contribute to a better understanding of some basic problems with
our corporate governance system. A full understanding of the flaws in current
compensation arrangements, and in the governance processes that have produced
them, is necessary to enable the stock market regulators to craft laws that will
minimize excess in executive compensation among the parastatals.
Shareholders: Our corporate governance system gives boards’ substantial power and
counts on them to monitor and supervise company managers. As long as corporate
directors are believed to carry out their tasks for the benefit of shareholders, current
governance arrangements, which insulate boards from intervention by shareholders,
appear acceptable. The analysis of the executive pay landscape casts doubt on the
validity of this belief and on the wisdom of insulating boards from shareholders.
Scholars/Researchers: This study fills an important gap in the literature by providing
rigorous econometric evidence on the pay performance relationships of Kenyan
parastatals executives. In so doing, the study contributes to one of the most important
recent public-policy debates in Africa, on corporate governance reform.
8
CHAPTER TWO:
LITERATURE REVIEW
2.1 Introduction
This chapter presents both conceptual and empirical literature on executive
compensation and firm performance. The theoretical framework, determinants of firm
performance, empirical studies and chapter summary is presented.
2.2 Theoretical Framework
The executive compensation and firm performance link is explained by various
theoretical propositions as dicussed hereunder. These theories include the agency
theory, stewardship theory and expectancy theory.
2.2.1 Agency Theory
The theory developed by Jensen and Meckling (1976) refer to the firm as a ‘black
box’, operated so as to meet relevant marginal conditions with respect to inputs and
outputs, thereby maximizing profits, that is, present value. The authors signalled that
no theory exists, explaining the way in which the conflicting objectives of individual
participants are brought into equilibrium to succeed in value maximization.
Jensen and Meckling (1976) define an agency relationship as a contract under which
one or more persons (the principal(s)) engage another person (the agent) to perform
some service on their behalf which involves delegating some decision-making
authority to the agent. The authors notice that if both parties are utility maximizers
(opportunistic behavior); a good reason exists to believe that the agent will not always
act in the best interests of the principal. According to Jensen and Meckling (1976)
divergence exists between the agent’s decisions and those decisions which would
9
maximize the welfare of the principal. Within this principal-agent relationship, owners
have an interest in maximizing the value of their shares, whereas managers are more
interested in ‘private consumption of firm resources’ and firm growth.
Costs that arise because of the delegation decision-making authority from the
principal to the agent, which is due to the ‘separation of ownership and control’ in
modern corporations, are referred to as ‘agency costs’. Jensen and Meckling (1976)
define as the sum of the agency costs: Monitoring costs; Bonding costs and The
residual losses. The ‘model of man’ underlying the Agency Theory is that of a rational
actor who seeks to maximize his or her utility with the least possible expenditure.
Both agents and principals seek to receive as much possible utility with the least
possible expenditure. Thus, given the choice between two alternatives, the rational
agent or principal will choose the option that increases his or her individual utility
(Davis et al., 1997).
2.2.2 Stewardship Theory
The theory proposed by Donaldson and Davis (1991) holds that there is no inherent,
general problem of executive motivation. “The executive manager, under this theory,
far from being an opportunistic shirker, essentially wants to do a good job, to be a
good steward of the corporate assets.”According to stewardship theory, performance
variations arise, not from inner motivational problems among executives, but from
whether the structural situation in which the executive is located facilitates effective
action by the executive.
Following Davis et al. (1997), in stewardship theory, the model of man is based on a
steward whose behavior is ordered such that pro-organizational, collectivistic
10
behaviors have higher utility than individualistic, self-serving behaviors. The
stewardship theory defines situations in which managers are not motivated by
individual goals. They are rather stewards whose motives with the objectives of their
principals are aligned.
Stewardship theorists assume a strong relationship between the success of the
organization and the principal’s satisfaction. A steward protects and maximizes
shareholders’ wealth through firm performance, because, by so doing, the steward’s
utility functions are maximized” (Davis et al., 1997). Stewards are motivated by
intrinsic rewards, such as reciprocity and mission alignment, rather than solely
extrinsic rewards. The steward, as opposed to the agent, places greater value on
collective rather than individual goals; the steward understands the company’s success
as his own achievement. According to Davis et al. (1997), the primary difference
between agency theory and stewardship theory lies in the assumptions about human
nature. According to the agency theory, people are individualistic, utility maximizes.
According to stewardship theory, people are collective self-actualizers who achieve
utility through organizational achievement.
2.2.3 Expectancy Theory
Proposed by Vroom (1964), the theory predicts that an individual will act in a certain
way based on the expectation that the act will be followed by a given outcome and on
the attractiveness of that outcome to the individual. The theory states that the actions
of an individual are driven by expected consequences. Deciding among behavioral
options, an individual is likely to select an option with the greatest motivation forces
(MF).
11
Gatewood, et al. (2002) explain that a person must believe that exerting a given
amount of effort can result in the achievement of a particular level of performance (the
effort performance relationship). However, even if expectancies change based on
direct and indirect experience or other beliefs, those changes may not be followed by
corresponding changes in actual behavior, like effort or performance
2.3 Determinants of Firm Performance
A number of factors are established in the literature to influence firm performance.
Some of these factors include size of the firm, age of the firm, capital structure and
external macro economic factors.
2.3.1 Size of the Firm
Dean et al. (2000) explain that firm size affects its marketing capabilities, attitudes,
needs and practices which are important for the firm’s performance and success. The
larger the firm, the more advantageous it is for the firm in acquiring resources. A large
firm will have advanced equipment, adequatecapital, more employees and higher
economies of scale. On the contrary, a small business will need less capital to finance
its investment whereas, a large business entreprise will need alot of capital to plan and
finance the investments, hence more flexible. Pandey (2005) indicate that size of a
firm can be measured in terms of number of employees, type of technology used,
amount of capital invested in it or its market coverage.
2.3.2 Capital Structure
Capital structure has long been regarded as an important parameter from a financial
economics standpoint since it is linked with a firm’s ability to meet the demands of
various stakeholders (Jensen, 1986). As explained by Jensen and Meckling (1976),
12
when financial leverage increases, it may bring better returns to some existing
shareholders but its risk also increases as it causes financial distress and agency costs.
Simerly and Li (2002) undescore that capital structure decisions are important not
only because of the need to maximize returns to the shareholders, but also because of
the impact of such decisions on an organization’s ability to deal with its competitive
environment.
2.3.3 External Factors
Mohd (2005) indicate that these as environmental factors which contribute to either
the failure or success of the business enterprises. Kuratko and Hodgetts (2004)
identify these factors to include the number of competitors in the market and the
competitive strategies they habe employed.
As explained by Colvin (1991), the performance of the firm will be highe when the
firm has gained competitive advantage over the rival. If the external factors outweigh
the firm, this may cause massive losses and could end up in collapsing the firm.
2.4 Empirical Review
Tosi et al. (2000) reported that there is a weak correlation between CEO pay and
performance but a strong positive correlation with CEO pay and size of the firm and it
is this correlation which is turned into a causal mechanism, to reward managers for
increasing the firm size of firms even though they destroy value in doing so.
Ogoye (2002) carried out an empirical study on the 41 public companies in Kenya
between 1994 -1998 and established that salary, allowances, pensions and loans
accounted for 70%, 14%, 7% and 6% of management compensation respectively. He
13
also found that the relationship between management compensation and firm
performance was negative and statistically insignificant. Sales were found to be
positively and significantly related to management compensation.
Mululu (2005) did a study on the relationship between board activity and firm
performance of the listed firms at the NSE and indicated that governance structures
are subject to more influence from the CEO and are correlated with higher levels of
CEO compensation. Moreover, the boards’ activity is positively related to the
financial performance of firms suggesting that boards’ activity is a value relevant to
attribute in corporate governance. The CEO is able to determine his/her benefits
through interference with the appointment of non executive directors and also
members of the remuneration committee.
Shah et al. (2006) studied a sample of 114 listed companies in Pakistani for the period
2002-2006 and found out that CEO compensation is a function of performance
measures, size, corporate governance variables like CEO duality, board independence
and board size, ownership structures and concentration, audit committee
independence. The study found a positive relationship between total CEO
compensation and firm performance.
Ozkan (2007) through his study found out that there is a positive relationship between
CEO pay and a firm’s performance(at least in the UK) and the relationship is positive
for cash compensation (salary and bonus) but when total compensation(cash
compensation and equity compensation) is considered then the relation becomes less
significant. Also he found out that there is a strong negative relation between CEO
compensation and firm performance and further asserted that CEO and Board
members engage in cronyism.
14
Frydman and Saks (2008) through their studies found out that the average CEO
compensation in large US public companies has increased in real terms by 500%.
Equity compensation which until the 1980s has been insignificant accounts for almost
all the growth.
Bizjak, Lemmon and Naveen (2008), Fauklender & Yang (2009) reported that firms
benchmark their pay on peer groups to determine levels of executive salary , bonus or
option rewards based on the industry and size. Size of the firm is the most important
determinant according to Murphy (1999), also through his study he found out a strong
relation between CEO cash compensation and firm’s revenues for each 5 years period
between 1970 and 1996 and is the same across industries.
Tariq (2010) studied the 30 largest companies in Sweden from 2004 to 2008 and after
controlling for firm size and growth opportunities found out a negative and
insignificant relationship between pay and performance. The compensation of the
CEO is an increasing function of size of the firm and also growth of the company.
Fernandes et al. (2010) studied an international comparison of CEO pay and reported
that in the UK as a percentage of 2006 total compensation package salary and pension
was 51%, equity based incentives was 30%, bonus 19% suggesting that there has been
a decline in the importance of base salary and an increase in the percentage of equity
based incentives pay for executives. Executive pay performance sensitivity with
respect to cash compensation including base salary and non equity bonuses and their
growth is well above inflation and wage growth for UK directors. It is the non equity
incentive payments which were paid on the basis of past short term profits that have
15
been most heavily criticized by regulators (Walker 2009a, 2009b; FSA 2009) as not
being related to long term performance. Previous UK studies that have explored
relative performance evaluation found insignificant results (Main et al.1996; Benit &
Conyon, 1999).
Aduda and Musyoka (2011) sought to examine the relationship between executive
compensation and performance of commercial banks listed at the Nairobi securities
exchange. The regression analysis results establishes a negative non-significant
relationship between executive compensation and performance of the commercial
banks. In the large commercial banks, the study observes that bank size is a key
criteria in determining executive compensation as it is significantly but negatively
relates to compensation. This is also attributed to the diminishing influence of key
owners in the management as the banks grow in size. The negative correlation
suggests the capping of executive compensation to ensure maximization of returns to
shareholders. As such, the interests of the executive directors are subordinated to those
of the shareholders in keeping with the agency theory.
Ongore and K‘obonyo (2011) in a census study examine the interrelations among
ownership structure and firm performance measured using accounting based measures
amongst all firms listed at the NSE. The study is informed by the proposition that
insider ownership is actualized through executive share options. The findings suggest
a positive relationship between insider ownership and firm performance thereby
affirming the proposition that when managers own shares, they become more
committed to the organization since they have a stake in the residual income of the
firm and they are likely to bear the costs of mismanagement.
16
Lishenga (2011) investigates the sensitivity of corporate governance structures and
practices to performance declines amongst companies quoted on the NSE. Several
components of corporate governance including CEO compensation measured as
salaries and bonuses, board composition, CEO and insider equity holdings, and
frequency of board meetings are studied with reference to the financial performance of
the firms classified in cohorts of losers, winners and mixed. The study employs the
Tobin‘s Q as proxy for financial performance and concludes that insider ownership
falls with falling firm performance as CEO remuneration is insensitive to firm
performance.
Cheruiyot (2013) sought to examine the effect of audit quality on executive
compensation of firms listed at the NSE. The study notes that firms listed in NSE
grant more equity-based compensation to their CEOs when audit quality is efficient in
terms of Number of accounting and audit committee, Audit fees and Number of
Auditing hours. The results suggest that it is important to consider the effect of
detection mechanisms such as auditor quality while examining the relation between
executive compensation and accounting manipulation.
Busaule (2014) sought to determine the relationship between financial performance
and executive compensation of commercial banks in Kenya where it considered a
functional form relationship between the financial performance as measured by return
on equity and executive compensation using a regression model. The study found a
positive but insignificant relationship between financial performance and executive
compensation of commercial banks in Kenya thereby suggesting that accounting
measures of performance like return on equity are not key determinants of executive
compensation for commercial banks in Kenya. The study recommends that
17
commercial banks should incorporate other factors like risk, size of the bank, skill,
quality and experience of the executives to determine the optimal compensation
needed to align their interests to those of shareholders.
2.5 Chapter Summary
The studies reviewed direct to diverse amd mixed findings as some studies establish
positive relationships between executive pay and firm performance while other studies
establish negative relationships. The relationships range from weak, strong, significant
and non significant which portrays that they may be influenced by other factors not
incorporated in all the studies.
The mixed findings include Murphy (1999) describing a strong relationship between
CEO cash compensation and firm’s revenues, Lishenga (2011) conclusion that CEO
remuneration is insensitive to firm performance, Tosi et al. (2000) observation of a
weak correlation between CEO pay and performance, Ogoye (2002) and Aduda and
Musyoka (2011) findings of a negative relationship between management
compensation and firm performance, Shah et al. (2006), Ozkan (2007) and Busaule
(2014) findings of a positive relationship between CEO total compensation and firm
performance. These mixed findings necessitate the need for further investigations of
this relationship in other study settings as controlled by other factors that influence
firm performance.
18
CHAPTER THREE:
RESEARCH METHODOLOGY
3.1 Introduction
The purpose of this study was to establish the relationship between executive
compensation and firm performance. In this chapter, the research design, target
population, data collection methodology and procedures as well as data analysis are
presented.
3.2 Research Design
This study adopted a cross - sectional research design. This design is appropriate when
data is gathered systematically over a period of time in order to answer a research
question. Mugenda and Mugenda (2003) contend that cross-sectional studies are
appropriate where the overall objective is to establish whether significant associations
among variables exist at some point in time. Aduda and Musyoka (2011) applied the
same technique to determine the sensitivity of executive pay to changes in firm
performance.
3.3 Target Population
The target population comprised of eight commercial state corporations in the
Ministry of Energy as listed in appendix one. Due to the small size of the population,
no sampling was done.
3.4 Data Collection
The study relied on secondary data on firm performance and executive compensation.
Data on net income, total assets and executive compensation were extrated from the
individual company published financial statements for a five year period (2010 to
2014).
19
3.5 Data Analysis
According to Cooper and Schindler (2006), data analysis refers to a process of editing
and reducing accumulated data to a manageable size, developing summaries, looking
for patterns and applying statistical techniques to arrive to findings. The study applied
the statistical package for social sciences (SPSS) to run the data for analysis.
Specifically, multiple regression analysis and correlation analysis were conducted.
3.5.1 Analytical Model
The relationship was analyzed in a multivariate regression model of the form:
Perf = f(EXREM, Size, Capital Structure)
Perfjt = α + β1EXREMjt + β2SIZEjt+ β3CAPSTRjt................................3.1
Where:
Perfjt: Performance – Return on Assets (net income/ Total assets)
EXREMjt: Executive Remuneration – Log of directors remuneration
SIZEjt: Firm Size – Log of firms total assets
CAPSTRjt: Capital Structure – debt equity ratio (Total debt/ Total equity)
α: A constant
β1, β2, β3: Coefficients
3.6 Tests of Significance
Inferential statistics such as non parametric test which include analysis of variance
(ANOVA) was used to test the significance of the overall model at 95% level of
confidence. Coefficient of correlation (r) was used to determine the magnitude of the
relationship between the dependent and the independent variables. Coefficient of
determination (r2) was used to show the percentage for which each independent

20
variable and all independent variables combined explain the change in the dependent
variable. As applied by Aduda and Musyoka (2012) and Lishenga (2011), Pearson
correlation coefficient (r) and Beta coefficient (β) are used to test for relationships
between executive compensation and firm performance.
21
CHAPTER FOUR:
DATA ANALYSIS, RESULTS AND DISCUSSIONS
4.1 Introduction
This chapter presents the information processed from the data collected during the
study on the relationship between firm performance and executive compensation. It
presents the descriptive statistics, correlation analysis and regression analysis from the
study findings.
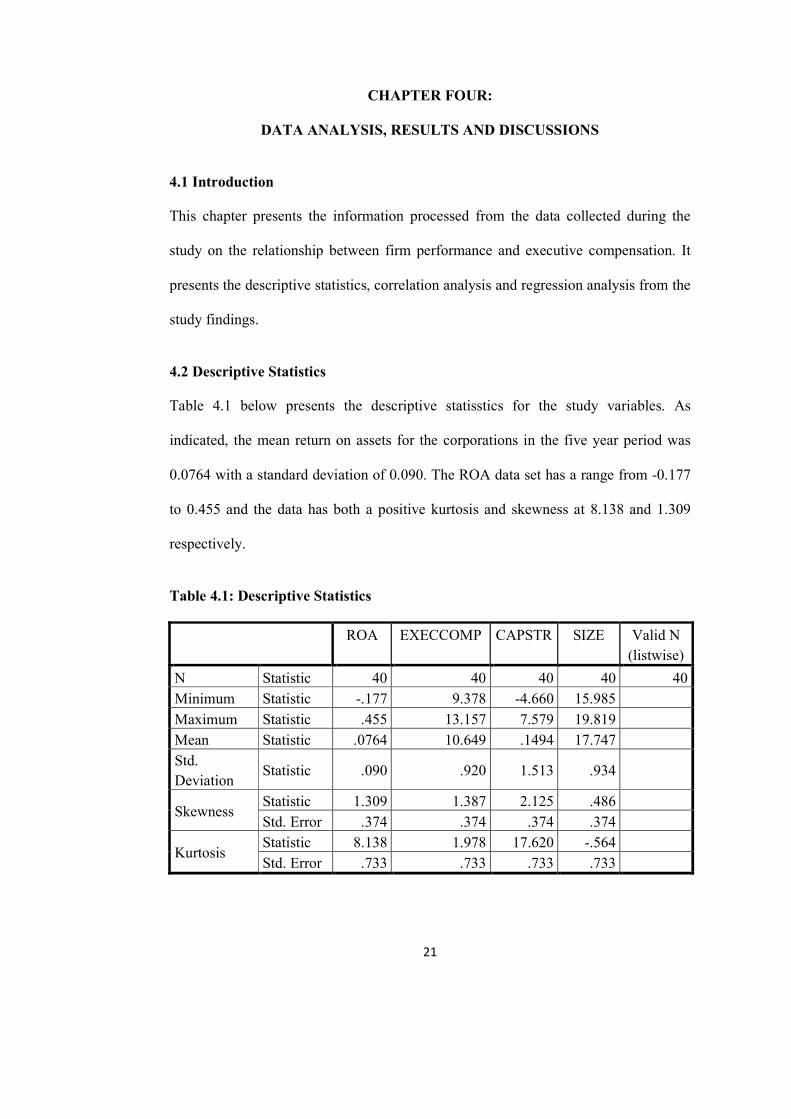
4.2 Descriptive Statistics
Table 4.1 below presents the descriptive statisstics for the study variables. As
indicated, the mean return on assets for the corporations in the five year period was
0.0764 with a standard deviation of 0.090. The ROA data set has a range from -0.177
to 0.455 and the data has both a positive kurtosis and skewness at 8.138 and 1.309
respectively.
Table 4.1: Descriptive Statistics
ROA EXECCOMP CAPSTR SIZE Valid N
(listwise)
N Statistic 40 40 40 40 40
Minimum Statistic -.177 9.378 -4.660 15.985
Maximum Statistic .455 13.157 7.579 19.819
Mean Statistic .0764 10.649 .1494 17.747
Std.
Deviation Statistic .090 .920 1.513 .934
Skewness Statistic 1.309 1.387 2.125 .486
Std. Error .374 .374 .374 .374
Kurtosis Statistic 8.138 1.978 17.620 -.564
Std. Error .733 .733 .733 .733
22
Executive compensation and capital structure datasets both have positive skewness
and positive Kurtosis over the years. The mean capital structure is at 0.1494 as the
minimum is -4.66 and the maximum is 7.579. The mean levels of executive
compensation transformed into natural logarithm is at 10.649 as the mimimum is at at
9.378 and the maximum is at 13.157. The mean firm size in terms of natural log of
assets is 17.747 as the minimum is 15.985 and the maximum is 19.819. Size data set
has positive skewness and a negative peakdeness.
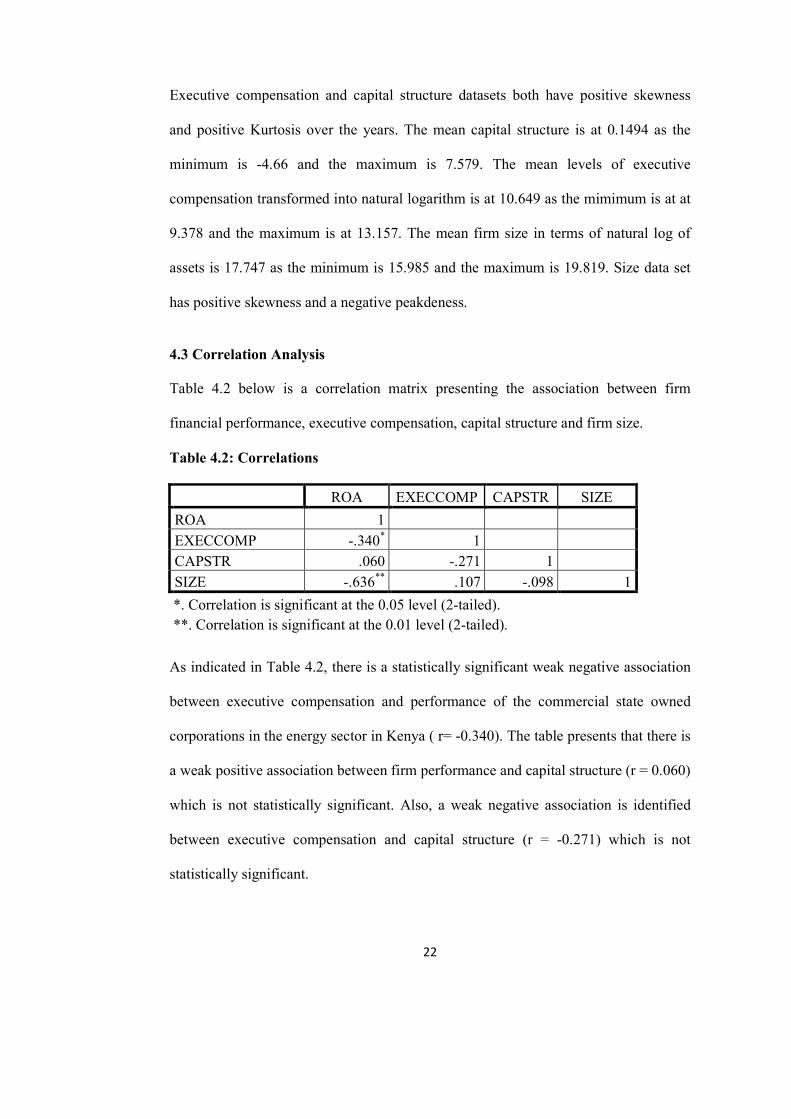
4.3 Correlation Analysis
Table 4.2 below is a correlation matrix presenting the association between firm
financial performance, executive compensation, capital structure and firm size.
Table 4.2: Correlations
ROA EXECCOMP CAPSTR SIZE
ROA 1
EXECCOMP -.340* 1
CAPSTR .060 -.271 1
SIZE -.636** .107 -.098 1
*. Correlation is significant at the 0.05 level (2-tailed).
**. Correlation is significant at the 0.01 level (2-tailed).
As indicated in Table 4.2, there is a statistically significant weak negative association
between executive compensation and performance of the commercial state owned
corporations in the energy sector in Kenya ( r= -0.340). The table presents that there is
a weak positive association between firm performance and capital structure (r = 0.060)
which is not statistically significant. Also, a weak negative association is identified
between executive compensation and capital structure (r = -0.271) which is not
statistically significant.
23
The correlation analyses results infer a strong negative association between firm size
and firm performance (r = -0.636) which is statistically significant. There is also a
weak negative association between firm size and capital structure (r = -0.098) which is
not statistically significant. There is also a weak positive association between firm size
and executive compensation (r = 0.107). The relationship is however not statistically
significant. This finding however rekindles Bizjak, Lemmon & Naveen (2008) and
Fauklender & Yang (2009) propositions that firms benchmark their pay on peer
groups to determine levels of executive salary , bonus or option rewards based on the
industry and size and as such firm size is a determinant of executive pay. The findings
conflict with Tosi et al. (2000) reporting that there is a weak correlation between CEO
pay and performance and a strong positive correlation with CEO pay and size of the
firm.
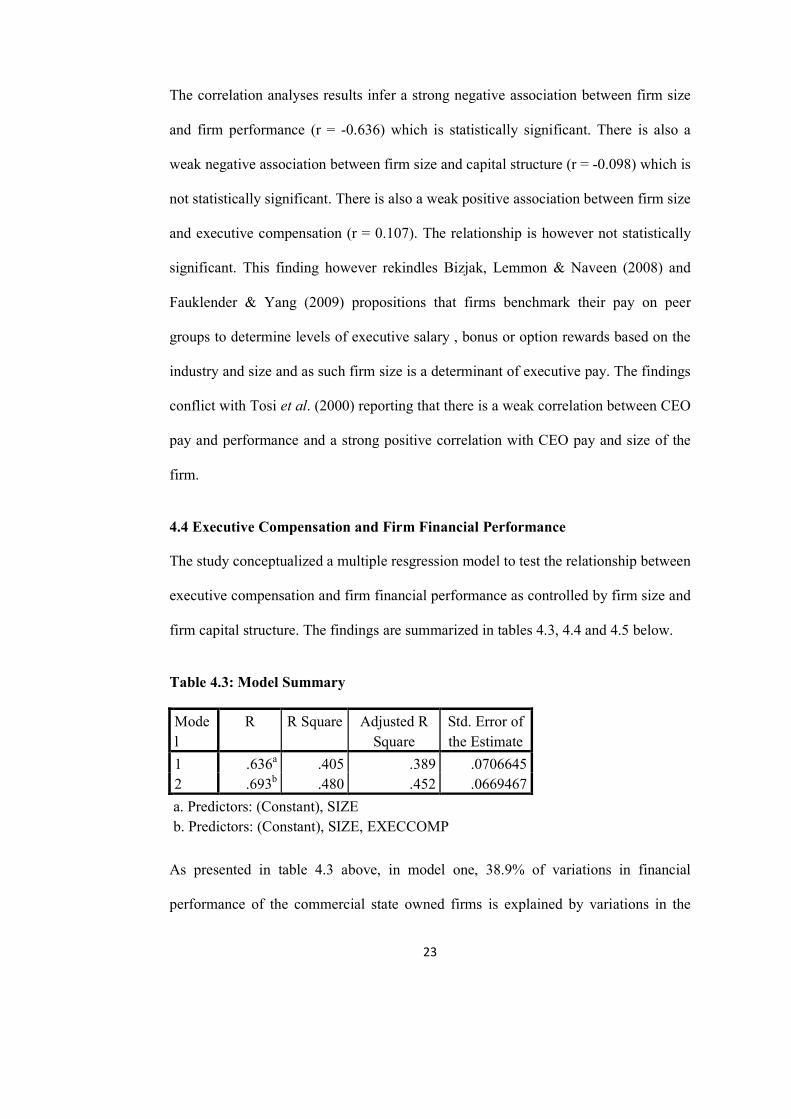
4.4 Executive Compensation and Firm Financial Performance
The study conceptualized a multiple resgression model to test the relationship between
executive compensation and firm financial performance as controlled by firm size and
firm capital structure. The findings are summarized in tables 4.3, 4.4 and 4.5 below.
Table 4.3: Model Summary
Mode
l
R R Square Adjusted R
Square
Std. Error of
the Estimate
1 .636a .405 .389 .0706645
2 .693b .480 .452 .0669467
a. Predictors: (Constant), SIZE
b. Predictors: (Constant), SIZE, EXECCOMP
As presented in table 4.3 above, in model one, 38.9% of variations in financial
performance of the commercial state owned firms is explained by variations in the
24
firm size (Adjusted R2= 0.389). Model two presents that 45.2% of variations in
financial performance of the firms is explained by variations in both the firm size and
the levels of executive compensation.
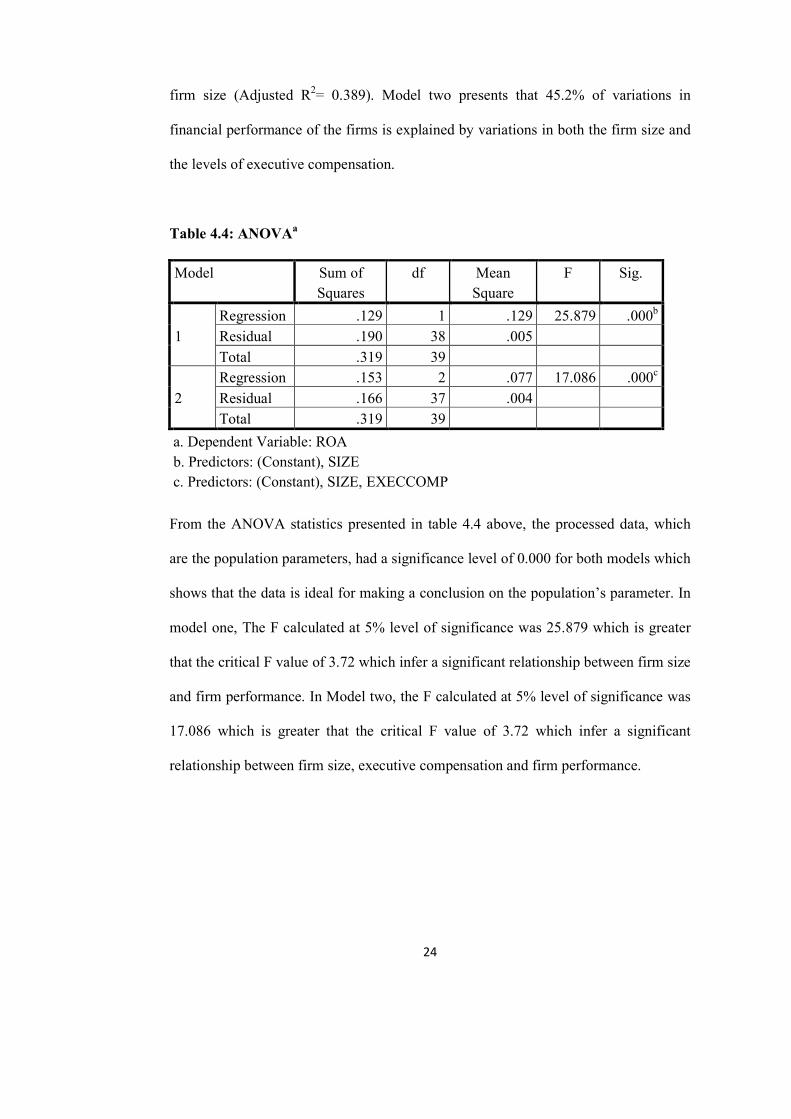
Table 4.4: ANOVAa
Model Sum of
Squares
df Mean
Square
F Sig.
1
Regression .129 1 .129 25.879 .000b
Residual .190 38 .005
Total .319 39
2
Regression .153 2 .077 17.086 .000c
Residual .166 37 .004
Total .319 39
a. Dependent Variable: ROA
b. Predictors: (Constant), SIZE
c. Predictors: (Constant), SIZE, EXECCOMP
From the ANOVA statistics presented in table 4.4 above, the processed data, which
are the population parameters, had a significance level of 0.000 for both models which
shows that the data is ideal for making a conclusion on the population’s parameter. In
model one, The F calculated at 5% level of significance was 25.879 which is greater
that the critical F value of 3.72 which infer a significant relationship between firm size
and firm performance. In Model two, the F calculated at 5% level of significance was
17.086 which is greater that the critical F value of 3.72 which infer a significant
relationship between firm size, executive compensation and firm performance.
25
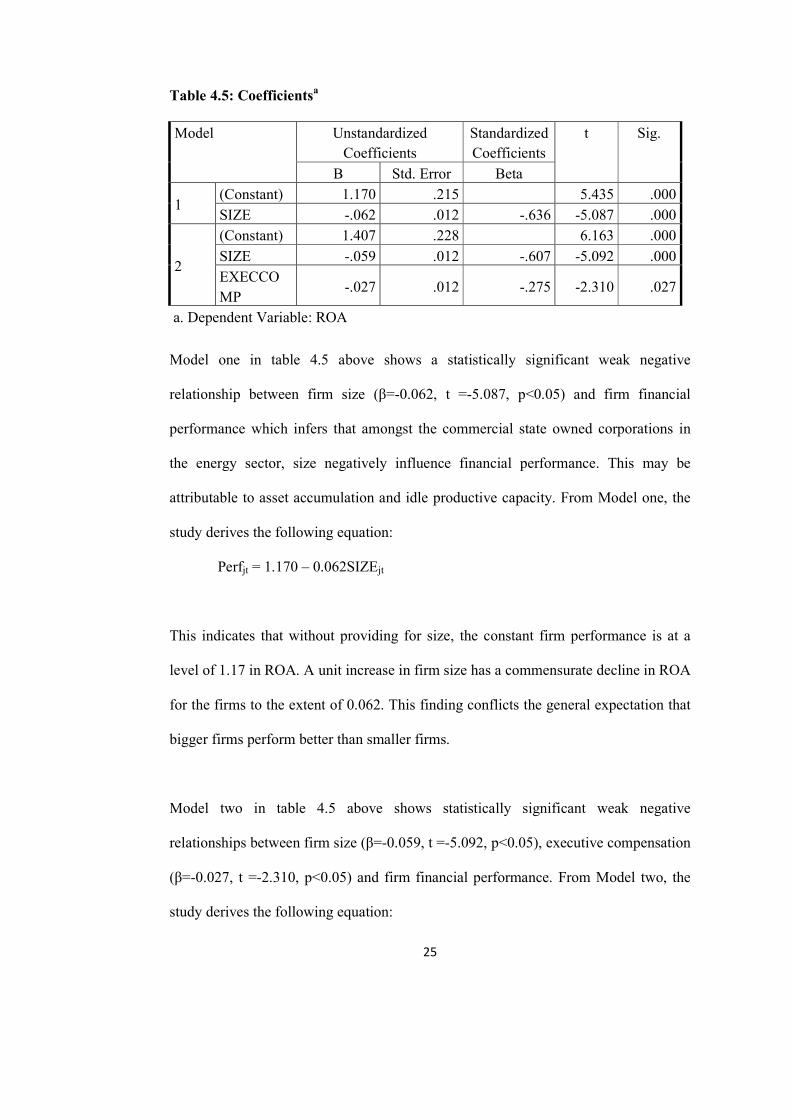
Table 4.5: Coefficientsa
Model Unstandardized
Coefficients
Standardized
Coefficients
t Sig.
B Std. Error Beta
1 (Constant) 1.170 .215 5.435 .000
SIZE -.062 .012 -.636 -5.087 .000
2
(Constant) 1.407 .228 6.163 .000
SIZE -.059 .012 -.607 -5.092 .000
EXECCO
MP -.027 .012 -.275 -2.310 .027
a. Dependent Variable: ROA
Model one in table 4.5 above shows a statistically significant weak negative
relationship between firm size (β=-0.062, t =-5.087, p<0.05) and firm financial
performance which infers that amongst the commercial state owned corporations in
the energy sector, size negatively influence financial performance. This may be
attributable to asset accumulation and idle productive capacity. From Model one, the
study derives the following equation:
Perfjt = 1.170 – 0.062SIZEjt
This indicates that without providing for size, the constant firm performance is at a
level of 1.17 in ROA. A unit increase in firm size has a commensurate decline in ROA
for the firms to the extent of 0.062. This finding conflicts the general expectation that
bigger firms perform better than smaller firms.
Model two in table 4.5 above shows statistically significant weak negative
relationships between firm size (β=-0.059, t =-5.092, p<0.05), executive compensation
(β=-0.027, t =-2.310, p<0.05) and firm financial performance. From Model two, the
study derives the following equation:
26
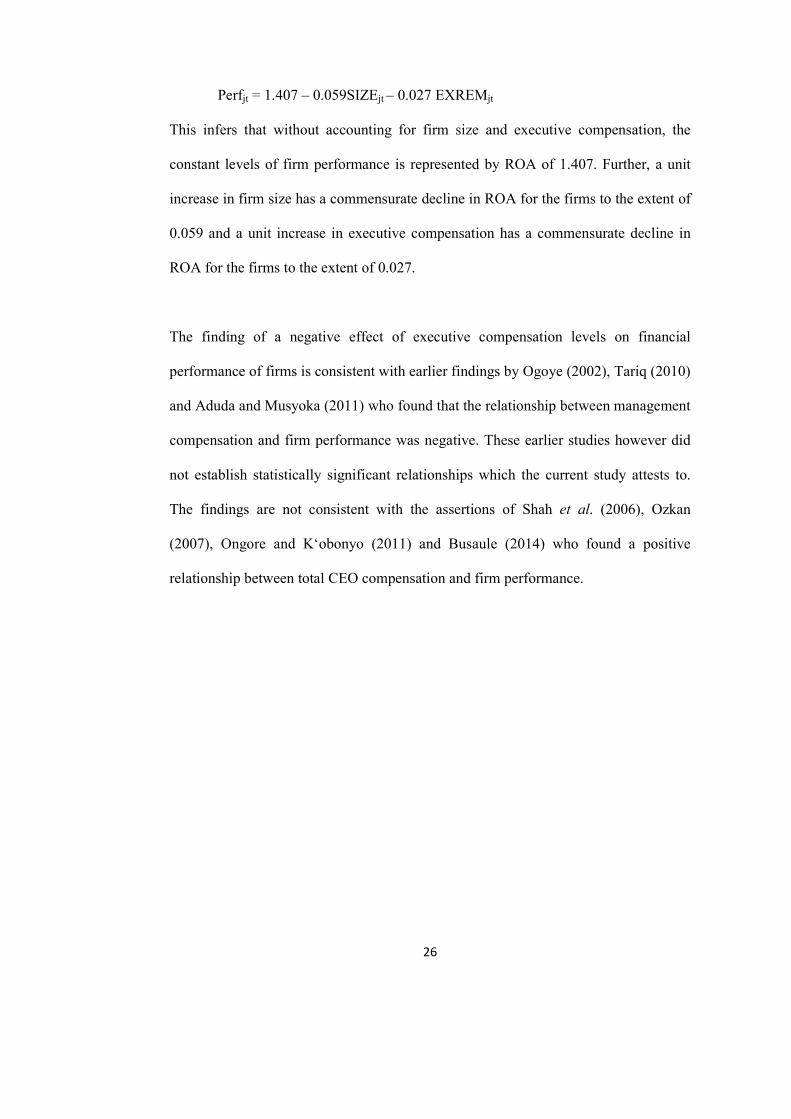
Perfjt = 1.407 – 0.059SIZEjt – 0.027 EXREMjt
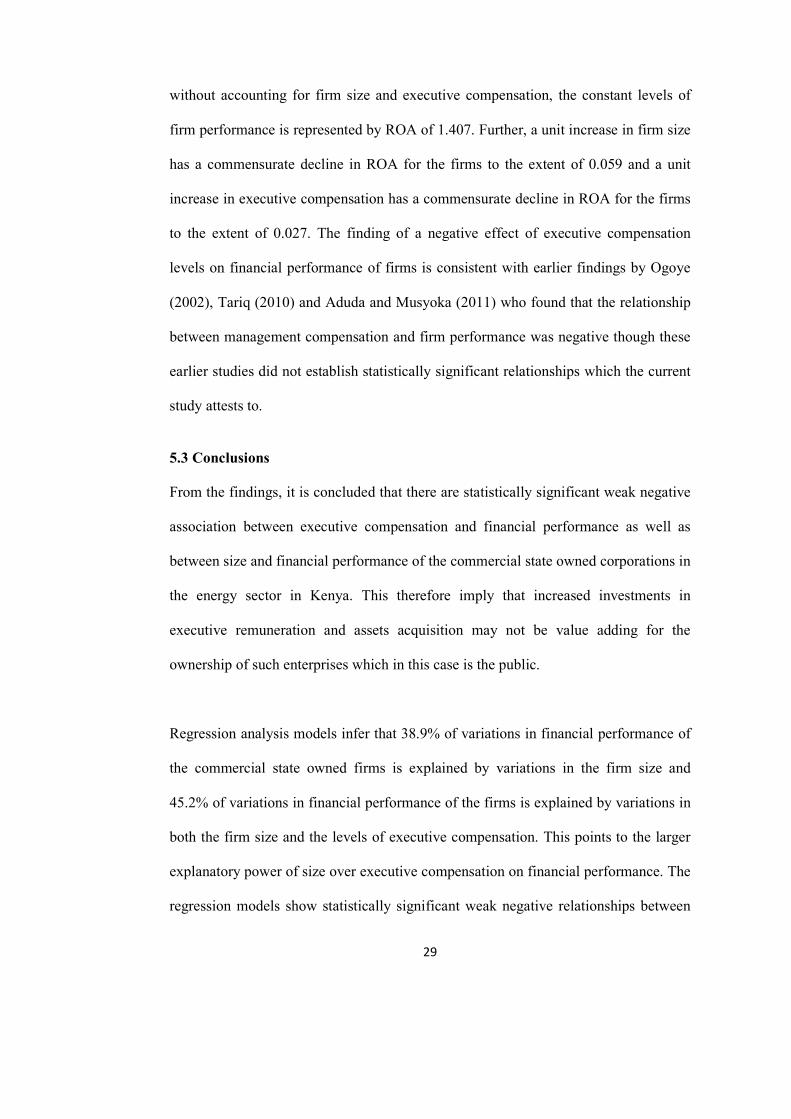
This infers that without accounting for firm size and executive compensation, the
constant levels of firm performance is represented by ROA of 1.407. Further, a unit
increase in firm size has a commensurate decline in ROA for the firms to the extent of
0.059 and a unit increase in executive compensation has a commensurate decline in
ROA for the firms to the extent of 0.027.
The finding of a negative effect of executive compensation levels on financial
performance of firms is consistent with earlier findings by Ogoye (2002), Tariq (2010)
and Aduda and Musyoka (2011) who found that the relationship between management
compensation and firm performance was negative. These earlier studies however did
not establish statistically significant relationships which the current study attests to.
The findings are not consistent with the assertions of Shah et al. (2006), Ozkan
(2007), Ongore and K‘obonyo (2011) and Busaule (2014) who found a positive
relationship between total CEO compensation and firm performance.
27
CHAPTER FIVE:
SUMMARY, CONCLUSIONS AND RECOMMENDATIONS
5.1 Introduction
This chapter presents a summary of the key elements of the study, discussion of major
findings and interpretation of the results. The chapter further presents the conclusions
drawn from the research findings as well as recommendations for improvement and
suggestions for further research.
5.2 Summary of Findings
The study sought to determine the effect of executive compensation on financial
performance of commercial state owned enterprises in the enery sector in Kenya.
Secondary data was collected on eight enterprises for the period 2010 to 2014. The
secondary data extracted from the published financial statements were for net income,
total assets, director remuneration, total debt and total equity. These data sets were
useful in deriving annual firm performance (return on assets), annual firm capital
structure (debt equity ratio), executive compensation proxied by director remuneration
and firm size proxied by assets accumulated by the firm.
Correlation analysis results suggest statistically significant weak negative association
between executive compensation and financial performance of the commercial state
owned corporations in the energy sector in Kenya. The findings conflict with Tosi et
al. (2000) arguments that there is a weak correlation between CEO pay and firm
performance. The analysis also confirms a statistically significant strong negative
association between firm size and financial performance of the commercial state
owned corporations in the energy sector in Kenya.
28
The findings infer weak non statistically significant negative association between
executive compensation and capital structure on one hand, and between firm size and
capital structure on the other hand. The study also establishes a non statistically
significant weak positive association between firm performance and capital structure.
The weak positive association between firm size and executive compensation is a
departure from Tosi et al. (2000) of a strong positive correlation with CEO pay and
size of the firm. This finding should lead to a revisit of Bizjak, Lemmon & Naveen
(2008) and Fauklender & Yang (2009) propositions that firms benchmark their pay on
peer groups to determine levels of executive and as such, firm size is a determinant of
executive pay.
Regression analysis models suggest that 38.9% of variations in financial performance
of the commercial state owned firms is explained by variations in the firm size and
45.2% of variations in financial performance of the firms is explained by variations in
both the firm size and the levels of executive compensation. The results suggest a
weak negative relationship between firm size and firm financial performance which
infers that amongst the commercial state owned corporations in the energy sector, size
negatively influence financial performance. This may be attributable to asset
accumulation and idle productive capacity. From the regression model, the study
indicates that without providing for size, the constant firm performance is at a level of
1.17 in ROA and a unit increase in firm size has a commensurate decline in ROA to
the extent of 0.062.
Further regression analysis shows statistically significant weak negative relationships
between firm size and financial performance on one hand and executive compensation
and firm financial performance on the other hand. The study findings infer that
29
without accounting for firm size and executive compensation, the constant levels of
firm performance is represented by ROA of 1.407. Further, a unit increase in firm size
has a commensurate decline in ROA for the firms to the extent of 0.059 and a unit
increase in executive compensation has a commensurate decline in ROA for the firms
to the extent of 0.027. The finding of a negative effect of executive compensation
levels on financial performance of firms is consistent with earlier findings by Ogoye
(2002), Tariq (2010) and Aduda and Musyoka (2011) who found that the relationship
between management compensation and firm performance was negative though these
earlier studies did not establish statistically significant relationships which the current
study attests to.
5.3 Conclusions
From the findings, it is concluded that there are statistically significant weak negative
association between executive compensation and financial performance as well as
between size and financial performance of the commercial state owned corporations in
the energy sector in Kenya. This therefore imply that increased investments in
executive remuneration and assets acquisition may not be value adding for the
ownership of such enterprises which in this case is the public.
Regression analysis models infer that 38.9% of variations in financial performance of
the commercial state owned firms is explained by variations in the firm size and
45.2% of variations in financial performance of the firms is explained by variations in
both the firm size and the levels of executive compensation. This points to the larger
explanatory power of size over executive compensation on financial performance. The
regression models show statistically significant weak negative relationships between
30
firm size and financial performance on one hand and executive compensation and firm
financial performance on the other hand. Specifically, without incorporating firm size
and executive compensation in the analysis, the constant ROA for firms is 1.407 as
any unit increase in firm size has a commensurate decline in ROA for the firms to the
extent of 0.059 and a unit increase in executive compensation has a commensurate
decline in ROA for the firms to the extent of 0.027. The study findings of a negative
effect of executive compensation levels on financial performance confirms earlier
findings in similar studies by Ogoye (2002), Tariq (2010) and Aduda and Musyoka
(2011).
5.4 Limitations of the Study
Secondary data was collected from the specific firms’ financial reports. The study was
therefore limited to the degree of precision of the data obtained from the secondary
source. While the data was verifiable since it came from the firms publications which
are filed with the ministry of energy, it nonetheless could still be prone to these
shortcomings.
The study was based on a five year study period from the year 2010 to 2014. A longer
duration of the study will have captured periods of various economic significances
such as booms and recessions and country political dispensation. This may have
probably given a longer time focus hence given a broader dimension to the problem.
The study was limited to establishing the relationship between executive
compensation and financial performance among state owned commercial
corporations. For this reason the private firms and non commercial firms could not be
incorporated in the study.
31
5.5 Recommendations
In view of the research findings, a negative relationship is evident between executive
compensation and financial performance which imply that there is no increased value
for higher executive compensation in the public sector corporations. There should
therefore be harmonization and review of the executive renumeration system in the
public sector corporations to enhance performance. This should include pay for
performance perks.
The study documents a negative relationship between size and financial performance
of the state owned commercial entreprises. This is an indication of excess asset
capacity in the public sector organizations where there are chances of idle capacity.
Efforts should be directed on rationalization of productive capacity of the assets
acquired to ensure they are utlized in value creation.
5.6 Suggestions for further Research
This study has reviewed the effect of executive compensation on performance of the
energy sector corporations in Kenya. A similar study should be carried out in other
government sectors to find out if the same findings will be obtained.
The study suggests that further studies can be conducted on CEO and board’s turnover
so as to establish how change in the boardroom affects public corporations financial
performance. Future studies can also be done on the effect of CEO attributes on
performance of such firms. Such studies should review the relationships between CEO
turnover and CEO compensation.
32
REFERENCES
Aduda, J. & Musyoka, L. (2011). The relationship between executive compensation
and firm performance in Kenyan banking industry, Journal of Accountancy
and Taxation. 3(6), 130 - 139.
Benito, A. & Conyon, M. (1999). The governance of directors pay from UK
Companies, Journal of Management and Governance, 3, 117-136.
Birech, K.W. (2011). The effect of performance contracting strategy on the
performance of state corporations in the energy sector in Kenya. Unpublished
MBA project, University of Nairobi.
Birley,G.A. & Wiersema, M.F. (2002). New CEOs and the corporate strategic
refocusing: how experience and heir apparent influences the use of power.
Administrative Science Quarterly, 47 (4).
Busaule, D.M. (2011). The relationship between financial performance and executive
compensation of commercial banks in Kenya. Unpublished MBA project,
University of Nairobi.
Chakravarthy, B.S. (1986). Measuring strategic performance. Strategic Management
Journal, (7), 437 – 58.
Cheruiyot, T. (2013). The effect of audit quality on executive comepnsation of firms
listed at Nairobi Securities Exchange. Unpublished MBA project, University
of Nairobi.
Colvin, J.G. (1991). Entrepreneurial versus Conservative firms: A comparison of
Strategies and Performance. Journal of Management Studies, 28 (5), 439 -462.
Cooper, R.D. & Schindler, P. (2006). Business Research Methods: 8th edition, Tata
McGraw-Hill Publishing company limited.
33
Crystal, G.S (1991).In Search of Excess: The Composition of American Executives.
Norton, New York.
Donaldson, L.& Davis, J.H. (1991). Stewardship theory or agency theory: CEO
governance and shareholder returns, Australian Journal of Management, 16,
(1), 49-65.
Dollinger, M. (1984). Environmental boundary spanning and information processiong
effects on organizational performance. Academy of Management Journal, 27,
351-368.
Entrialgo, M., Fernandez, E., & Vazquez, C.J. (2000). Linking Entrepreneurship and
Strategic management: Evidence from Spanish SMEs, Technovation.
Faulkender, M., & Yang, J. (2009). Is disclosure an effective cleansing mechanism?
The dynamics of compensation peer benchmarking. Working paper. R.H.
Smith School of Business, University of Maryland.
Frydman, C., & Saks, R. (2007). Executive Compensation: A new view from long
term perspective. Working paper, MIT & Federal Reserve Board.
Gabiax, X., and Landier, A. (2008). Why has CEO pay increased so much? Journal of
Economics,123 (1), 49-100.
Gatewood, E. J., Shaver, K. G., Powers, J., and Gartner, W. B. (2002). Entrepreneurial
expectancy, task effort, and performance. Entrepreneurship Theory and
Practice, 27(2), 187–207.
Izan, H.Y., Sidhu, B. & Taylor, S. (1998). Corporate Governance. An International
Review, 6 (1), 39-47.
Jensen, M. (1986). Agency cost of free cashflow, corporate finance and takeovers:
American Economic Review Papers Proceedings, 76, 323-329.
34
Jensen, M. & Meckling, W. (1976). Theory of the Firm: Managerial Behavior,
Agency Costs and Ownership Structure. Journal of Financial Economics, vol
3, 305-360.
Jensen, M. & Murphy, K, (1990). Performance pay and top management incentives.
Journal of Political Economy, 98, 225-264.
Leah, M. (2008). Interest Rate Forecasts, Financial Markets Group, London School of
Economics and Political Science, 42(3), 201-231.
Lishenga, L. (2011). Corporate governance reaction to declining firm performance:
Evidence from the NSE. International Journal of Governance, 1.
Maijoor, S. J., & Vanstraelen, A. (2006). Earnings management within Europe: the
effects of member state audit environment, audit firm quality and international
capital markets. Accounting & Business Research, 36(1), 33-52.
Main, B.G.M., Bruce, A. & Buck, T. (1996). Total board remuneration and company
performance. Journal of Economics, 106, 1627-1644.
Mululu, A. K. (2005). The relationship between board activity and firm performance:
A study of firms quoted on the Nairobi Stock Exchange. (Unpublished MBA
Project, University of Nairobi).
Murphy, K.J. (1999). "Executive Compensation," in Handbook of labor economics.
Volume 3. Amsterdam; New York and Oxford: Elsevier Science, North-
Holland, 2485-563.
Ochieng’, D.E. (2012). Executive compensation and firm financial performance: A
critical Literature review. Unpublished PhD independent study paper,
University of Nairobi.
35
Ogoye, H.K. (2002). Corporate Performance and Management Compensation: An
Empirical Investigation of Public Companies in Kenya.
Ongore, V.O. and K‘Obonyo, P.O. (2011). Effects of selected corporate governance
characteristics on firm Performance: Empirical evidence from Kenya.
Internationl Journal of Economics and Financial Issues, 1 (3), 99 – 122.
Pegels, C.C. and Yang, B. (2000). The impact of managerial characteristics on
strategic assets management capability. Team performance Management: An
International Journal, 6 (5/6) 97 – 106.
Simerly, R.L. & Li, M. (2002). Translating reserach into practical solutions,
Unpublished paper.
Tariq, U. (2010). CEO compensation: Relationship with performance and influence of
the board of directors, Unpublished MBA project, University of Nairobi.
Tosi, H., Werner, S., Katz, J. & Gomez-Mejia, L. (2000). How much does
performance matter? A metaanalysis of CEO pay studies. Journal of
Management, 26 (2), 301–339.
Vroom, V. H. (1964). Work and motivation. New York: Wiley.
36
APPENDIX ONE: COMMERCIAL STATE CORPORATIONS IN THE
MINISTRY OF ENERGY
1 Geothermal Development Company (GDC)
2 Kenya Electricity Generating Company Limited (Kengen)
3 Kenya Electricity Transmitting Company (KETRACO)
4 Kenya Petroleum Refineries Limited (KPRL)
5 Kenya Pipeline Company Limited (KPC)
6 Kenya Power and Lighting Company Limited (KPLC)
7 National Oil Corporation of Kenya (National Oil)
8 Rural Electrification Authority (REA)