Embed Size (px)
Citation preview
RELATIONSHIP BETWEEN FINANCIAL LITERACY
AND THE GROWTH OF MICRO AND SMALL
ENTERPRISES IN KENYA: A CASE OF KAKAMEGA
CENTRAL SUB- COUNTY.
EVELYN NEKESA LUSIMBO
MASTER OF SCIENCE
(Entrepreneurship)
JOMO KENYATTA UNIVERSITY OF
AGRICULTURE AND TECHNOLOGY.
2016
Relationship between financial literacy and the growth of micro and
small enterprises in Kenya: A case of Kakamega Central sub-
county.
Evelyn Nekesa Lusimbo
A Research Project Report Submitted to the Department of
Entrepreneurship, Technology Leadership and Management in the
College of Human Resource Development in Partial Fulfillment of
the Requirements for the Award of the Degree of Master of Science
in Entrepreneurship in the Jomo Kenyatta University of
Agriculture and Technology.
2016

ii
DECLARATION
This research project is my original work and has not been presented for a degree in
any other University.
Signature: …………………………………….. Date: ……………………………
Evelyn Nekesa Lusimbo
This research project has been submitted for examination with my approval as the
University Supervisor.
Signature…..………….……………………. Date ……………………………..
Dr Willy Muturi
Jkuat, Kenya

iii
DEDICATION
All praises to the Almighty God, the most gracious, for giving me the strength and
determination to complete this study. To my husband, Martin Yamame for his
sacrifice, encouragement and support that has seen me through this challenging
education path and to our children for their support and understanding during the
entire period of my studies.

iv
ACKNOWLEDGEMENT
My greatest gratitude is to God the Almighty. He is a faithful God and may His name
be praised forever. I also express my sincere gratitude and appreciation to my project
supervisor Dr. Willy Muturi for his patience, positive criticism, passion to see me
excel and persistent guidance in preparing this project. Thank you so much for your
time may God richly bless you. I am also grateful to all the lecturers at JKUAT
Kisumu CBD Campus for their guidance and support during my studies.
I also take this opportunity to thank the management of Bukura Agricultural College
more so the Principal Mr Justus Simiyu, and the entire Human Resource
management committee for sponsoring my studies and the Deputy Principal Dr
Beatrice Osumbah for her guidance during the data analysis stage of my project, may
God bless you all.
I greatly appreciate the companionship of my colleagues in the MSC
Entrepreneurship class 2014/2015 cohort for the support and tolerance throughout
the program. The discussions really helped me and may our good Lord reward you
abundantly. Lastly, I sincerely thank my mum, husband and children for their prayers
and encouragement, moral and material support which has been instrumental to bring
me this far.
v
TABLE OF CONTENT
DECLARATION ........................................................................................................ II
DEDICATION .......................................................................................................... III
ACKNOWLEDGEMENT ........................................................................................ IV
TABLE OF CONTENT ............................................................................................. V
LIST OF TABLES ................................................................................................. VIII
LIST OF FIGURES ................................................................................................... X
LIST OF APPENDICIES ......................................................................................... XI
LIST OF ACRONYMS AND ABBREVIATIONS .............................................. XII
DEFINITION OF TERMS .................................................................................... XIII
ABSTRACT ............................................................................................................ XIV
CHAPTER ONE ......................................................................................................... 1
INTRODUCTION ....................................................................................................... 1
1.1 Background of the Study ............................................................................... 1
1.2 Statement of the Problem ............................................................................... 7
1.3 Objectives of the Study .................................................................................. 8
1.3.1 General Objective ....................................................................................... 8
1.3.2 Specific Objectives ..................................................................................... 9
1.4 Research Questions. ....................................................................................... 9
1.5. Justification of the Study ................................................................................ 9
1.6 Scope of the Study. ....................................................................................... 10
CHAPTER TWO ...................................................................................................... 11
LITERATURE REVIEW. ....................................................................................... 11
2.1. Introduction. ................................................................................................. 11
2.2. Theoretical Framework ................................................................................ 11
vi
2.2.1. Enterprise Growth Theories ..................................................................... 11
2.2.2 The Dual –Process Theory. ...................................................................... 15
2.2.3 Operationalization of Variables. ............................................................... 17
2.3. Conceptual Framework ................................................................................. 18
2.4 Empirical Review. ........................................................................................ 19
2.4.1 Debt Management Literacy ........................................................................ 19
2.4.2 Budgeting Literacy ................................................................................... 21
2.4.3. Banking services Literacy ......................................................................... 22
2.4.4 Book Keeping Literacy. ............................................................................ 24
2.4.5 Micro and Small Enterprise Growth ........................................................ 26
2.5. Critique of the Literature Reviewed. ........................................................... 28
2.6. Summary ....................................................................................................... 30
2.7. Research Gaps ............................................................................................. 32
CHAPTER THREE .................................................................................................. 33
RESEARCH METHODOLOGY............................................................................. 33
3.1 Introduction ................................................................................................. 33
3.2 Research Design ........................................................................................ 33
3.3 Target Population ......................................................................................... 33
3.4 Sample and Sampling Technique ................................................................ 33
3.5 Data Collection Instruments. ........................................................................ 34
3.6. Data collection Procedure ............................................................................. 35
3.7. Pilot Testing. ..................................................................................................... 35
3.8. Reliability of Research Instruments ................................................................. 35
3.9. Validity of Research Instruments ..................................................................... 36
3.10. Data Analysis and Presentation .................................................................... 36
CHAPTER FOUR ..................................................................................................... 38
RESEARCH FINDINGS AND DISCUSSION ....................................................... 38
4.1 Introduction ................................................................................................. 38
4.2 Response Rate................................................................................................ 38
4.3 Demographic Characteristics ........................................................................ 38
vii
4.3.1. Gender of the Respondents. ...................................................................... 38
4.3.2 Age of the Respondents ............................................................................. 39
4.3.3. Educational Attainment. ........................................................................... 39
4.3.4. Type of Business. ...................................................................................... 40
4.3.5. Duration in Business. ................................................................................ 40
4.4. Awareness of Financial Education Services................................................. 41
4.5. Financial Literacy of the Respondents ........................................................... 44
4.5.1. Debt Management Literacy. .................................................................... 45
4.5.2. Budgeting and Control Literacy. .................................................................. 50
4.5.3. Banking Services Literacy. ........................................................................... 53
4.5.4 Book Keeping Literacy. ........................................................................... 55
4.6. Measuring MSE Growth. ............................................................................. 59
4.7. Financial Literacy and MSE Growth. ............................................................... 61
CHAPTER FIVE ....................................................................................................... 74
SUMMARY, CONCLUSIONS AND RECOMMENDATIONS .......................... 74
5.1. Introduction ................................................................................................... 74
5.2. Summary of the Findings ........................................................................... 74
5.2.1. Effect of Debt Management Literacy on the Growth of MSEs ................ 74
5.2.2. Effect of Budgeting Literacy on the Growth of MSEs ............................... 75
5.2.3. Effect of Banking Services Literacy on the Growth of SMEs ................... 75
5.2.4. Effect of Book keeping Literacy on the Growth of SMEs ......................... 76
5.3. Conclusions ................................................................................................ 76
5.4. Recommendations ....................................................................................... 77
5.4.1. Recommendations for Policy and Practice. ................................................ 77
5.4.2. Areas for Further Research. .......................................................................... 78
REFFERENCES. ...................................................................................................... 79
APPENDICES ........................................................................................................... 85
viii
LIST OF TABLES
Table 3 1: Sample Size ....................................................................................................... 34
Table 3 2: Questionnaire Reliability ................................................................................ 367
Table 4.1: Gender of Respondents ..................................................................................... 39
Table 4.2: Age of Respondents .......................................................................................... 39
Table 4.3: Level of Education ............................................................................................ 40
Table 4.4: Type of Business. .............................................................................................. 40
Table 4.5: Duration in Business ......................................................................................... 41
Table 4.6: Awareness of Financial Training Institutions *Training Attendance*
Gender Tabulation ............................................................................................. 43
Table 4.7: Financial Training Institutions in Kakamega County ....................................... 44
Table 4.8: Timely Loan Payment ....................................................................................... 45
Table 4.9: Ability to Compare Terms and Conditions ...................................................... 46
Table 4.10: Use More than Half Business Revenue to Repay Loans ................................. 46
Table 4.11: Access to Various Sources of Finance ............................................................ 47
Table 4.12: Effect of Inflation and Interest Rates .............................................................. 47
Table 4.13: Can Determine Accurately the Total Debt Position of my Business .............. 48
Table 4.14: Educational Attainment *Ability to Compare Terms and Conditions ............ 49
Table 4.15: Educational Attainment *The Effect of Inflation and Interest Rates .............. 49
Table 4.16: Prepare Written Annual Financial Objective .................................................. 50
Table 4.17: Prepare Annual Budgets for the Business ....................................................... 50
Table 4.18: Ability to Compare Financial Objectives and Business Performance ............ 51
Table 4.19: Use Budgets to Set Targets for Employees ..................................................... 51
Table 4.20: Use Budgets to Track Spending ...................................................................... 52
Table 4.21: Budgeting Literacy * Education Attainment* ................................................. 53
Table 4.22: Banking Services Literacy .............................................................................. 54
ix
Table 4.23: Ability to Prepare Financial Statements ......................................................... 56
Table 4.24: Ability to Perform Financial Analysis ............................................................ 56
Table 4.25: Maintenance of Cashbook ............................................................................... 57
Table 4.26: Filling Tax Returns ......................................................................................... 57
Table 4.27: Maintain and Balance the Ledger Accurately ................................................. 58
Table 4.28: Ability to do Bank Reconciliations ................................................................. 58
Table 4.29: Value of Assets ............................................................................................... 59
Table 4.30: Duration in Business *Value Assets Cross Tabulation .................................. 60
Table 4.31: Duration in Business *No of Permanent Employees Cross Tabulation ......... 61
Table 4.32: Training Attendance *Growth in Sales Volume Cross Tabulation................. 62
Table 4.33: Training Attendance *Duration in Business Cross Tabulation .................. 62
Table 4.34: Debt Literacy and Growth in Value of Assets ................................................ 65
Table 4.35: Budgeting Literacy and MSE Growth in Value of Assets .............................. 67
Table 4.36: Banking Service Literacy and Growth in Value of Assets ............................. 69
Table 4.37: Book Keeping Literacy and Growth in Value of Assets ................................. 71
x
LIST OF FIGURES
Figure 2 1: Phases and Crises of Growth ........................................................................... 13
Figure 2 2: Stages of an enterprise growth ......................................................................... 14
Figure 2. 3: Conceptual framework. .................................................................................. 18
Figure 4 1: Awareness of Financial Education Services by Respondents ......................... 41
Figure 4 2: Financial Literacy Training Attendance by Respondent ................................. 42
Figure 4 3: Reasons for not Attending Financial Literacy Training .................................. 43
Figure 4 4: Number of Permanent Employees .................................................................. 60
Figure 4 5: Want to increase Financial Knowledge ........................................................... 63

xi
LIST OF APPENDICIES
Appendix 1: Questionnaire for MSE Owners. ...................................................... 85
Appendix 2: Cross Tabulation Education Attainment * Book Keeping Literacy. 91
Appendix 3: Data Analysis figures ....................................................................... 95
Appendix 4: Location Map of Kakamega Central Sub County. ............................ 98
Appendix 5: Cover Letter ....................................................................................... 99
xii
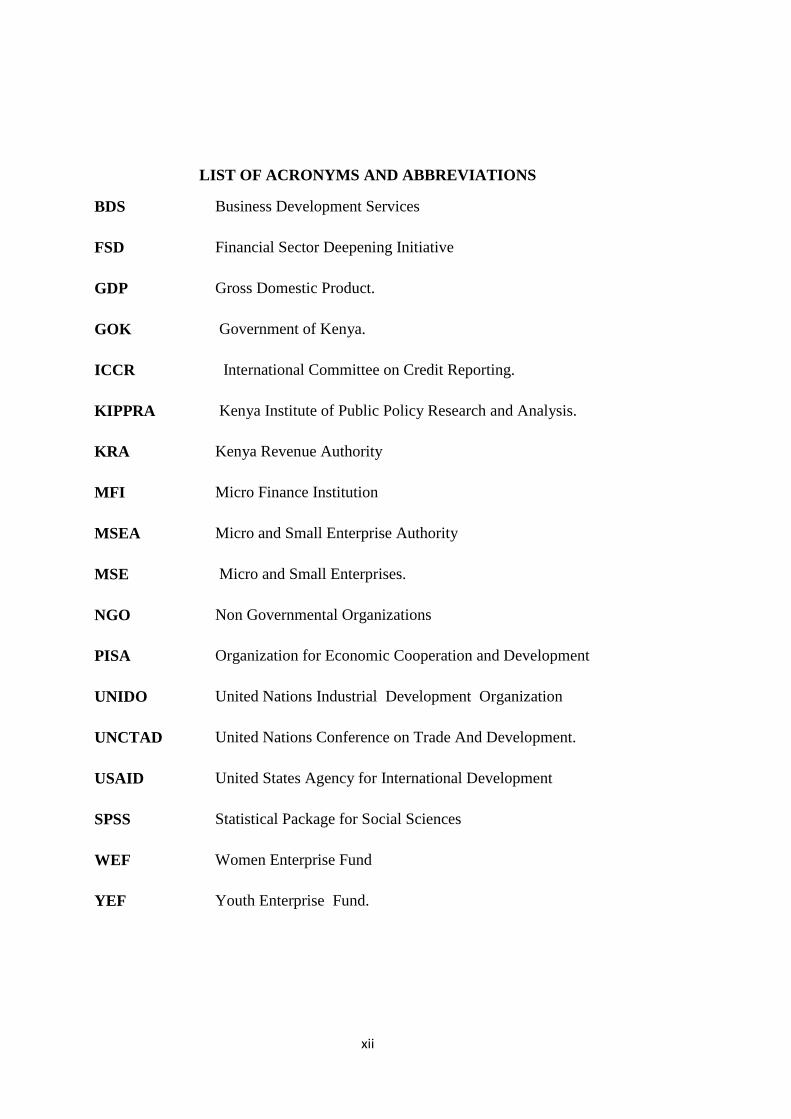
LIST OF ACRONYMS AND ABBREVIATIONS
BDS Business Development Services
FSD Financial Sector Deepening Initiative
GDP Gross Domestic Product.
GOK Government of Kenya.
ICCR International Committee on Credit Reporting.
KIPPRA Kenya Institute of Public Policy Research and Analysis.
KRA Kenya Revenue Authority
MFI Micro Finance Institution
MSEA Micro and Small Enterprise Authority
MSE Micro and Small Enterprises.
NGO Non Governmental Organizations
PISA Organization for Economic Cooperation and Development
UNIDO United Nations Industrial Development Organization
UNCTAD United Nations Conference on Trade And Development.
USAID United States Agency for International Development
SPSS Statistical Package for Social Sciences
WEF Women Enterprise Fund
YEF Youth Enterprise Fund.
xiii
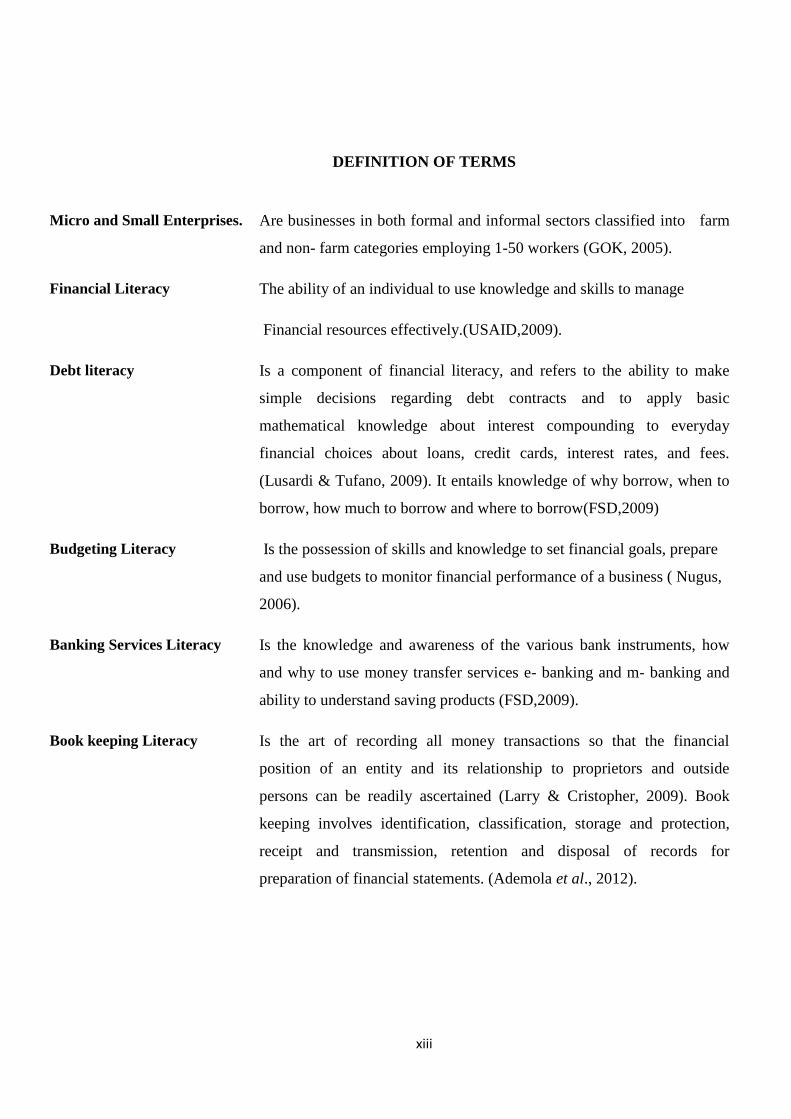
DEFINITION OF TERMS
Micro and Small Enterprises. Are businesses in both formal and informal sectors classified into farm
and non- farm categories employing 1-50 workers (GOK, 2005).
Financial Literacy The ability of an individual to use knowledge and skills to manage
Financial resources effectively.(USAID,2009).
Debt literacy Is a component of financial literacy, and refers to the ability to make
simple decisions regarding debt contracts and to apply basic
mathematical knowledge about interest compounding to everyday
financial choices about loans, credit cards, interest rates, and fees.
(Lusardi & Tufano, 2009). It entails knowledge of why borrow, when to
borrow, how much to borrow and where to borrow(FSD,2009)
Budgeting Literacy Is the possession of skills and knowledge to set financial goals, prepare
and use budgets to monitor financial performance of a business ( Nugus,
2006).
Banking Services Literacy Is the knowledge and awareness of the various bank instruments, how
and why to use money transfer services e- banking and m- banking and
ability to understand saving products (FSD,2009).
Book keeping Literacy Is the art of recording all money transactions so that the financial
position of an entity and its relationship to proprietors and outside
persons can be readily ascertained (Larry & Cristopher, 2009). Book
keeping involves identification, classification, storage and protection,
receipt and transmission, retention and disposal of records for
preparation of financial statements. (Ademola et al., 2012).
xiv
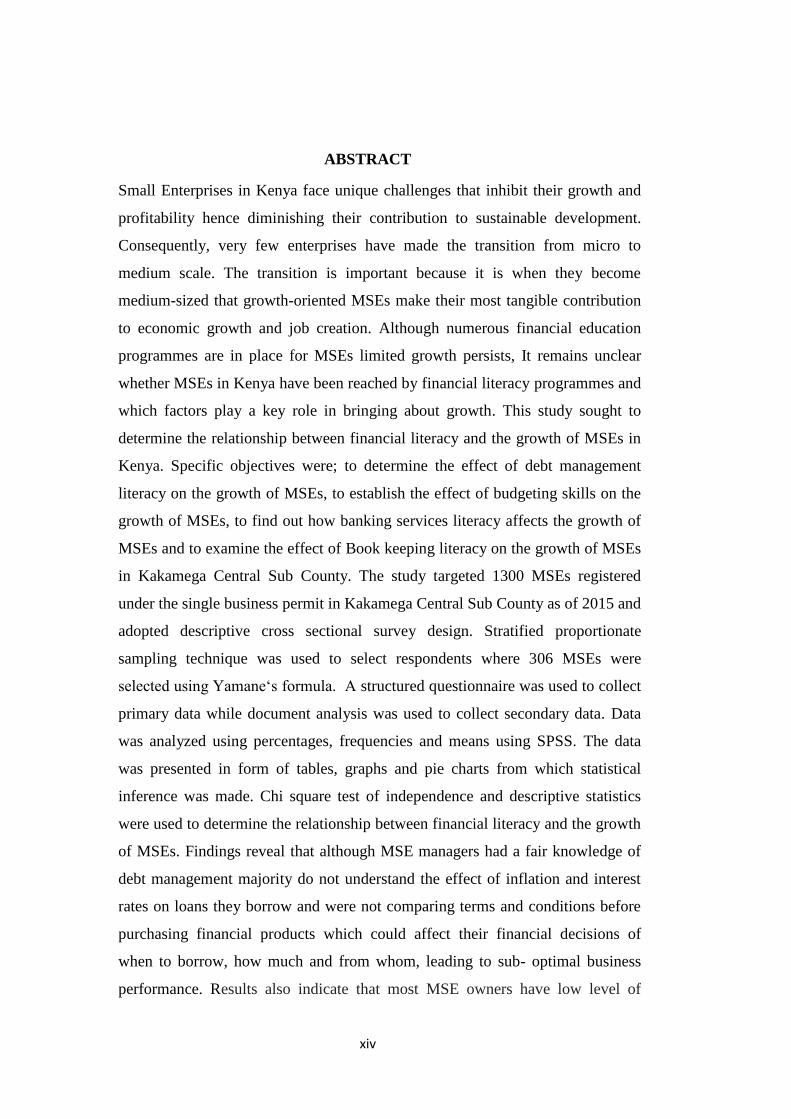
ABSTRACT
Small Enterprises in Kenya face unique challenges that inhibit their growth and
profitability hence diminishing their contribution to sustainable development.
Consequently, very few enterprises have made the transition from micro to
medium scale. The transition is important because it is when they become
medium-sized that growth-oriented MSEs make their most tangible contribution
to economic growth and job creation. Although numerous financial education
programmes are in place for MSEs limited growth persists, It remains unclear
whether MSEs in Kenya have been reached by financial literacy programmes and
which factors play a key role in bringing about growth. This study sought to
determine the relationship between financial literacy and the growth of MSEs in
Kenya. Specific objectives were; to determine the effect of debt management
literacy on the growth of MSEs, to establish the effect of budgeting skills on the
growth of MSEs, to find out how banking services literacy affects the growth of
MSEs and to examine the effect of Book keeping literacy on the growth of MSEs
in Kakamega Central Sub County. The study targeted 1300 MSEs registered
under the single business permit in Kakamega Central Sub County as of 2015 and
adopted descriptive cross sectional survey design. Stratified proportionate
sampling technique was used to select respondents where 306 MSEs were
selected using Yamane‘s formula. A structured questionnaire was used to collect
primary data while document analysis was used to collect secondary data. Data
was analyzed using percentages, frequencies and means using SPSS. The data
was presented in form of tables, graphs and pie charts from which statistical
inference was made. Chi square test of independence and descriptive statistics
were used to determine the relationship between financial literacy and the growth
of MSEs. Findings reveal that although MSE managers had a fair knowledge of
debt management majority do not understand the effect of inflation and interest
rates on loans they borrow and were not comparing terms and conditions before
purchasing financial products which could affect their financial decisions of
when to borrow, how much and from whom, leading to sub- optimal business
performance. Results also indicate that most MSE owners have low level of
xv
budgeting and Book keeping literacy since they do not engage in formal financial
planning, budgeting and control and do not keep proper books of account as well
as preparation of financial statements which increases their information opacity
and may constraint their access to finance. Although most of the respondents
appreciate the need to operate bank accounts for their businesses, majority do not
effectively utilize existing banking services. Results further indicate that those
businesses whose managers have low financial literacy have recorded minimal or
no growth over the years. Recommendations made include; organizing financial
literacy training programs for MSEs across the county, Incorporating financial
education in the school curriculum from Primary level so that individuals are
financially informed early in life, Government agencies such as MSEA, WEF,
YEF and Uwezo to develop downloadable easy to learn modules that can be
downloaded by interested MSEs to reduce information search costs and take
advantage of existing technology platforms.

CHAPTER ONE
INTRODUCTION
1.1 Background of the Study
Developed and developing economies continue to rely on small businesses to play a
key role in triggering and sustaining economic growth and equitable development.
Mills and MCarthy (2014) assert that Micro and Small Enterprises (MSEs) employ
half of the private sector workforce which ultimately creates 60 to 80 percent net
new jobs annually in the USA. United Nations Industrial Development
Organization(UNIDO,1999) estimates that MSEs represent over 90 percent of
private business and contribute to more than 50 percent of employment and of gross
domestic product (GDP) in most African countries. Abor and Quartey (2010)
estimate that 91 percent of formal business entities in South Africa are MSEs which
contribute between 52 to 57 percent to the GDP and provide about 61 percent
employment. In Kenya like in many countries worldwide, business experts, policy
makers and economists concur that MSEs are drivers of economic growth. The
Kenya Institute of Public Policy Research and Analysis (KIPPRA) estimates that the
MSE sector employs 42 per cent of the working population and accounted for 75 per
cent of all modern establishments as at 2011(KIPPRA, 2012). A healthy MSE sector
therefore contributes significantly to the economy through creating employment
opportunities, producing large volumes of goods and services, increasing exports and
a fertile ground for nurturing innovation and entrepreneurship skills. This implies
that for Kenya to realize and sustain double digit economic growth as envisioned in
the Kenya Vision 2030 strategy, the performance and competitiveness of MSEs
must be increased so as to effectively respond to the challenges of creating
productive and sustainable employment opportunities, promoting economic growth,
and poverty reduction in the country. This research sought to establish the
relationship between financial literacy and the growth of MSEs in Kenya.
Despite the numerous benefits of MSEs worldwide, these enterprises are reported to
have both a high birth rate and at the same time high death rate (Turyahebwa,
,Sunday, & Ssekajugo,2013; Fatoki, 2014; GOK, 2005; Oluoch, 2014). Studies
2
indicate that a large number of MSEs do not survive to celebrate their third birthday.
This is because they tend to remain small which makes them more vulnerable to
failure as a result of simple management mistakes as compared to large enterprises.
This means that there is no chance for MSE managers to learn from past mistakes
since their capital base remains insufficient to absorb resultant losses. The Sessional
paper No 2 of 2005 reports that when compared to other countries, the number of
Kenyan firms employing 11-50 persons is relatively small. Micro enterprises find it
difficult to graduate into medium and large-scale enterprises, thus creating the
“missing middle” phenomenon. Consequently, this has resulted to a weak base for
industrial take-off and sustainable development in Kenya (KIPPRA, 2012). The high
failure rate has also been attributed to low financial literacy which results to poor
planning, limited access to finance and poor financial management (Oluoch, 2014;
Agyei, 2014; Njoroge, 2012). Fatoki (2014) concurs with these assertions and also
adds that the difficult financial decisions that entrepreneurs make in their personal or
business finances could also be a contributing factor.
Mounting evidence reveals that apart from access to capital and an enabling
environment, the success of MSEs largely depends on the financial management
skills of the managers. Individuals with financial literacy skills tend to make better
financial decisions with fewer management mistakes than their counterparts who are
financially illiterate (Njoroge, 2014; Fatoki, 2014). Penrose (1959) in her theory of
enterprise growth posits that entrepreneurial knowledge, motivation and
entrepreneurial activity in terms of fund raising skills and entrepreneurial judgment
greatly determine a firm’s growth. Fund raising ability refers to the ability of the
owner to raise needed funds for expansion which requires the entrepreneur to create
trust in others and persuade them to invest in his venture based on its merits achieved
by keeping appropriate business records to show the profitability of the business.
Entrepreneurial judgment dictates the quality of decisions made by the owner
manager which largely depends on the ability of the owner to gather information, use
consultancy and decide when and how to act. Therefore MSE growth depends on
how well the owner manager is equipped with the right information to make sound
financial decisions in the business.
3
Atkinson and Messy (2005) define financial literacy as the combination of
consumers’/investors’ understanding of financial products and concepts and their
ability and confidence to appreciate financial risks and opportunities, to make
informed choices, to know where to go for help and take other effective actions to
improve their financial well-being (Siekei, Wagoki & Kalio, 2013). Fatoki (2014)
citing United States Agency for International Development (USAID, 2009) defines a
financially literate MSE owner/manager as “someone who knows the most suitable
financing and financial management options for his/her business at the various
growth stages, knows where to obtain the most suitable products and services and
interacts with confidence with the suppliers of these products and services. He/she is
familiar with the legal and regulatory framework and his/her rights and recourse
options.” Therefore financial literacy is simply the ability of an individual to use
knowledge and skills to manage financial resources effectively.
Extant studies further indicate that there is a strong association between financial
literacy, the ability to make good financial decisions, household well-being and
business survival (Njoroge, 2014; Turyahebwa et al., 2013; Lusardi & Mitchell,
2013; FSD, 2009). Sound financial management is critical to the survival and
management of MSEs because financial literacy skills empower and educate
investors so that they are able to evaluate financial products and make informed
decisions, facilitates proper debt management which improves the credit worthiness
of potential borrowers (MasterCard, 2011). A financially literate MSE manager is
likely to interact with confidence with financial service providers and make fewer
management mistakes than their illiterate counterparts which ultimately results to
MSE growth. Financial literacy also builds the risk management skills of individuals.
Siekei et al., (2013) argue that financial literacy prepares investors for tough
financial times through strategies that mitigate risk such as accumulating savings,
diversifying assets, purchasing insurance, avoiding over indebtness and less
vulnerability to fraudulent schemes.
4
Financially literate customers also help to improve the quality of financial products
and stability of financial institutions in the market. Wachira and Kihiu (2012) opine
that when financial regulators face an educated customer, they are forced to improve
the efficiency and quality of financial services because such consumers demand for
more appropriately priced and transparent services, by comparing options, asking the
right questions, and negotiating more effectively. Besides, financially literate
consumers pose less risk to the financial system due to their responsible use of
financial products and services which help to strengthen financial market stability
and contribute to increased savings, wider economic growth and development. This
view is corroborated by the Pisa (2013) report which asserts that financial literacy is
a key life skill. It posits that financially literate consumers make more informed
decisions and demand higher quality services, which will encourage competition and
innovation in the market. They are also less likely to react to market conditions in
unpredictable ways, unlikely to make unfounded complaints and more likely to
manage the risks transferred to them effectively which results to a more efficient
financial services sector and potentially less costly financial regulatory and
supervisory requirements. This helps in reducing government aid and taxation aimed
at assisting those who have taken unwise financial decisions or no decision at all.
When faced with scarce resources and multiple competing wants, a financially
literate individual is a better planner and prudent resource allocator than the illiterate
counterpart. This is supported by Greenspan (2002) who argues that financial literacy
equips individuals with the financial knowledge necessary to create household
budgets, initiate saving plans, and make strategic investment decisions. Financial
literacy knowledge is also important in choosing from among alternative financial
products. Wachira and Kihiu (2012) affirm that when clients borrow multiple loans
from multiple sources such as MFIs and other formal and informal providers,
challenges of managing repayment schedules and ensuring that the credit is used
optimally requires specific knowledge and skills about financial management.
Quality financial information is also necessary for sound decisions in a business.
Ezejiofor, Ezenyirimba and Olise (2014) assert that business decisions with regard to
expansion, maintaining a competitive edge and prevention of business failure need to
5
be supported by quality financial information which needs to be relevant, user
friendly and available in a timely manner. They therefore caution that accounting
systems that generate the information should be simple in order not to impose
unnecessary operative burdens.
Poor book keeping and poor financial management among a majority of MSEs has
been attributed to low level of financial literacy especially among the adult
population across countries (Lursadi & Mitchel, 2014; FSD, 2009; Fatoki, 2014).
Lursadi and Mitchel conducted various studies first with the US adult population of
50 years and above in 2004. The survey revealed that only 34% answered all the
financial literacy questions on inflation, compound interest and investment risk
correctly despite the fact that at their age they were expected to have made many
financial decisions and witnessed at least two periods of high inflation that should
have provided them with information on investment risks and interest. These same
questions were added to several other U.S. surveys thereafter, including the 2007–
2008 National Longitudinal Survey of Youth for young respondents (ages 23–28)
(Lusardi, Mitchell, and Curto 2010); the RAND American Life Panel covering all
ages (Lusardi and Mitchell 2009); and the 2009 and 2012 National Financial
Capability Study (Lusardi and Mitchell 2011d). All the studies revealed a low level
of financial literacy among Americans for all groups.
Comparative studies on the three financial literacy questions developed by Lusardi
and Mitchel were replicated in 11 countries by various researchers as reported by
Lusardi and Mitchel (2014). These studies also found a low level of financial literacy
across countries studied. In Netherlands only 44.8% answered the three questions
correctly, Germany 53.2%, Japan 27.0%.Australia 42.7%, New Zealand 24.0%,
Switzerland 50.1%, Italy 24.9%,Sweden 21.4%,France 30.9,Russia 3.7% and in
Romania only 3.8% of the respondents scored correctly on the financial literacy
questions. Atkison and Messy (2012) sponsored by Organization for Economic Co-
operation and Development (OECD) undertook a financial literacy survey using the
three questions developed by Lusardi and Mitchel in 12 countries drawn from Latin
America, Africa, West and East Europe and Asia which represented varying
6
geographical backgrounds and different levels of economic development. Findings
confirmed a similar pattern of low level financial literacy as had been reported in the
USA. These studies however focused on the numeracy skills of individuals and how
these skills affected their financial decisions; no attempt was made to establish how
the level of literacy of these individuals affected the performance of their businesses.
Fatoki (2014) found that despite financial literacy having a positive correlation with
MSE performance, a large majority of Micro entrepreneurs in South Africa had a low
level of financial literacy negatively affecting the performance of their businesses.
Similarly Agyei (2014) reported a low level of financial literacy among women
micro entrepreneurs in Accra Ghana. Given that most MSE owners in Kenya are
adults, these statistics could imply that low levels of financial literacy may be one of
the major causes of poor performance, stagnation and business failure for a majority
of MSEs. People with low levels of financial literacy often make unproductive
suboptimal financial decisions. However, by communicating a relevant message on
sound money management, financial education can offer these individuals the means
to use their scarce financial resources more effectively and to choose the financial
services and products that best meet their needs.
The Kenya government and other stakeholders in the financial sector through the
Financial Sector Deepening (FSD) initiative identified the gap in financial literacy
amongst Kenyans and made effort to educate people to enhance financial freedom
and enable individuals to make informed decisions to borrow, save and invest wisely
(Mastercard, 2011; FSD,2009). Individual institutions have also mounted elaborate
programmes to provide financial education to MSEs notably; Equity Foundation with
Mastercard, KCB with Visa international, Faulu and other development partners such
as USAID through NGOs such as Winrock International in Kakamega County.
Despite these efforts MSE growth is still limited. It’s therefore not clear which
aspects of financial literacy education lead to more growth. The problem is further
compounded by the existence of scanty literature evaluating directly the relationship
between financial literacy and MSE growth in Kenya. A vibrant MSE sector is
crucial in achieving the development agenda for most counties under the devolved
system of governance in Kenya.
7
1.2 Statement of the Problem
The Asian experience shows that it is mainly the growth-oriented medium-sized
MSEs that have a high propensity to apply technology and training to serve
specialized niche markets and bring about industrial growth. On the contrary, the
MSE sector in Kenya faces unique challenges which inhibit their growth and
profitability and hence diminish their ability to contribute effectively to sustainable
development. In Kenya the small enterprise sector shows a distinct dual structure, at
one extreme there exist a few large modern capital- intensive enterprises, while at the
other extreme there are small micro enterprises that are informal, use very simple
technologies and serve a limited local market. This structural imbalance exists
despite the implementation of MSE promotion programmes for many years hence the
“missing middle” phenomena (GOK, 2005). Consequently, this has resulted to a
weak base for industrial take-off and sustainable development in Kenya (KIPPRA,
2012). KIPPRA (2012) further reports that although the MSE sector generates up to
75% employment, enterprises with 11-50 workers constitute only 10.6% of the total
MSE employment meaning the bulk of the employment is created by the informal
sector enterprises that are mainly survivalist with high mortality rate. This poses a
challenge for the government to increase the proportion of MSEs that grow to
medium scale if Kenya is to achieve the 10% economic growth rate envisioned in
the vision 2030 strategy paper.
Although numerous financial education programmes are in place for MSE sector in
Kenya in addition to improved access to finance and improved institutional
framework, limited growth persists. It remains unclear whether MSEs in Kenya have
been reached by financial literacy programmes and which factors play a key role to
bring about growth (MasterCard, 2011). Financial institutions focus more on
increased product uptake and improved usage so as to make their customers less
risky to deal with. NGOs and BDS providers view financial education as part of a
more holistic social agenda that offers financial knowledge and skills to improve
financial decision-making, social well-being, and general livelihoods. The
government looks at financial education as a tool to introduce the public to basic
financial concepts and to promote financial inclusion for the unbanked, consumer
8
protection and awareness so that individuals are less vulnerable to fraudulent
schemes. As a result, it is not clear which financial factors play a more significant
role in promoting MSE growth.
The problem is further compounded by scanty empirical studies reviewing the
relationship between financial literacy and MSE growth. Njoroge (2013) sought to
find out the relationship between financial literacy and MSEs success in Nairobi
County. The study found a positive relationship between financial literacy and
entrepreneurial success. However, respondents were drawn from MSEs with at least
3 employees, at least five years of operation with a turnover of 5 million. This left
out micro enterprises with a lower turnover yet they form the bulk of traders in this
sector. Siekei et al.,(2013) looked at the role of financial literacy on performance of
MSE whose managers had undergone the Equity foundation financial literacy
training in Njoro district. The findings revealed a positive relationship between the
financial literacy training and the performance of the MSEs whose managers had
been trained. However, for a conclusive picture, it’s necessary to measure the level
of literacy of all MSEs so that those that have not been reached by financial
education training can be prioritized by future efforts. Consequently, MSEs continue
to perform poorly with limited growth despite the numerous financial education
programmes in the Kenyan business landscape. This study sought to determine the
relationship between financial literacy and the growth of MSEs in Kenya using a
case study of Kakamega Central Sub- County to point out the aspects of financial
education that have a high impact on MSE growth so as to inform future financial
literacy training programs. It was based on four of the six key themes of financial
literacy recommended by the Financial Sector Deepening initiative scoping exercise
of 2009.
1.3 Objectives of the Study
1.3.1 General Objective
This study sought to determine the relationship between financial literacy and the
growth of micro and small scale enterprises in Kenya.
9
1.3.2 Specific Objectives
The study addressed the following specific objectives;
1. To determine the effect of debt management literacy on the growth of MSEs
in Kakamega Central Sub County.
2. To establish the effect of budgeting literacy on the growth of MSEs in
Kakamega Central Sub County.
3. To find out how literacy on banking services affects the growth of MSEs in
Kakamega Central Sub County.
4. To examine the effect of Book keeping literacy on the growth of MSEs in
Kakamega Central Sub County.
1.4 Research Questions.
1. What is the effect of debt management literacy on the growth of MSE in
Kakamega Central Sub County?
2. To what extent does budgeting literacy affect the growth of MSE enterprises
in Kakamega Central Sub County?
3. How does literacy on banking services affect the growth of MSEs in
Kakamega Central Sub County?
4. What is the effect of Book keeping literacy on the growth of MSE in
Kakamega Central Sub County?
1.5. Justification of the Study
This study will greatly benefit MSE owners as it will highlight the benefits that will
be realized by acquisition of financial literacy skills to improve the financial
management of their businesses so as to improve growth prospects and profitability
and their credit rating by financiers. To policy makers, the research will draw
attention to areas of policy gaps in financial education that require policy
intervention within MSE sector in the county hence enabling the County government
of Kakamega to formulate policies that will encourage growth of MSEs to increase
employment, economic growth, market competitiveness and technological
innovativeness. Future researchers and academicians will also find this study useful
10
as it will contribute immensely to existing body of knowledge and provide useful
insights to enable them identify gaps for further research. Business Development
Service providers particularly those operating in Kakamega county will also find the
research findings valuable as it will provide insights on which aspects of financial
literacy have the highest impact on MSE growth which will inform program design
for future financial literacy trainings for the MSE sector in the county.
1.6 Scope of the Study.
The study covered 1300 MSEs registered by the Revenue Department under the
single business permit in Kakamega Central Sub County as at March 2015. It
focused on the relationship between financial literacy and the growth of MSEs in
Kakamega Central Sub County with respect to four variables namely; debt
management, budgeting and control, banking services and record keeping literacy.
1.7 Limitations of the Study.
Due to time and financial constraints, the Study was limited to investigating the
relationship between financial literacy and the growth of MSEs in Kakamega Central
Sub County only. However for a conclusive picture on the level of financial literacy
among MSEs and its impact on their growth, similar studies should be replicated in
all counties across the country. Another challenge faced was lack of well
documented business records for sales, assets and liabilities in the SMEs surveyed
which made it difficult to measure MSE growth on ratio and interval scales hence
the researcher had to collect data using ordinal and nominal scales.
11
CHAPTER TWO
LITERATURE REVIEW.
2.1. Introduction.
This chapter introduces the theoretical background of the study, displays the
conceptual framework of the study and provides an empirical review focusing on
financial literacy and the growth of MSE’s; It also provides a critique of the
existing literature relevant to the study, presents the chapter summary bringing to
light the research gaps identified.
2.2. Theoretical Framework
2.2.1. Enterprise Growth Theories
Enterprise growth, its drivers and limits have been studied by various scholars.
This review presents important contributions to explain this concept.
a) Resource Based View theory.
Edith Penrose (1959) posits that knowledge, motivation and entrepreneurial
talent are the main determinants of a firm’s growth. She suggests that enterprises
consist of a bundle of internal and external resources which helps it to achieve
competitive advantage. Penrose places the entrepreneur at the heart of a firm’s
growth and posits that growth comes from how the owner perceives productive
opportunities for the firm. Consequently growth will be restricted by the extent to
which a firm does not see opportunities for expansion, is unwilling to act upon
them, or is unable to respond to them (McKaskill, 2010). While organizational
size and complexity may limit growth, she argues that firms would simply
reorganize to manage the next stage of growth. She opines that large firms have
an advantage in pursuing growth compared to small firms due to economies of
size, ability to find new avenues for investment and the accumulated knowledge
within the firm. Growth of the firm is also advanced by the rate at which new
managerial talent is absorbed and integrated into the existing management team
as this provides a wider bandwidth to finding new opportunities. Penrose also
points out that decision making can inhibit growth if all decisions have to be
taken by senior management. To achieve faster growth decisions must be pushed
12
down within the organization and a strong culture developed to guide employees
in decision making to overcome managerial limit to growth.
Penrose further posits that, all other things being equal, growth comes from
entrepreneurial activity in terms of entrepreneurial versatility, fund raising
ingenuity, entrepreneurial ambition and entrepreneurial judgment.
Entrepreneurial versatility is the way in which an entrepreneur creates ways in
which new products can be brought to market or new geographic markets
pursued. Fund raising ingenuity refers to the ability of the owner to raise needed
funds for expansion by creating trust in others and persuading them of the merits
of his venture. Entrepreneurial ambition is the motivation of the owner towards
growth. Whereas some desire growth because it enables them to better deliver
their products and services to the market, others seek growth for personal
recognition as the founder of a business empire. Entrepreneurial judgment refers
to the quality of decision making of the owner. Some people make more mistakes
than others in business decision making, therefore quality business decisions are
made by owner managers with a strong inclination in common sense, self
confidence, and have the ability to gather information, use consultants and decide
when and how to act.
The Resource based view theory therefore proposed that it is the entrepreneur’s
view of the future and its possible opportunities that most determine the shape of
the company over time and that MSE growth depends on how well the owner
manager is equipped with the right information to make sound decisions in the
business, is able to seize and pursue opportunities and can create trust in others
and convince them to invest in his venture. This study suggests that financial
literacy education can improve the growth of MSEs by improving the ability of
the entrepreneur to make sound financial decisions, raise the required capital and
put in place appropriate financial performance measurement systems to monitor
and measure performance of the business and take corrective action.
13
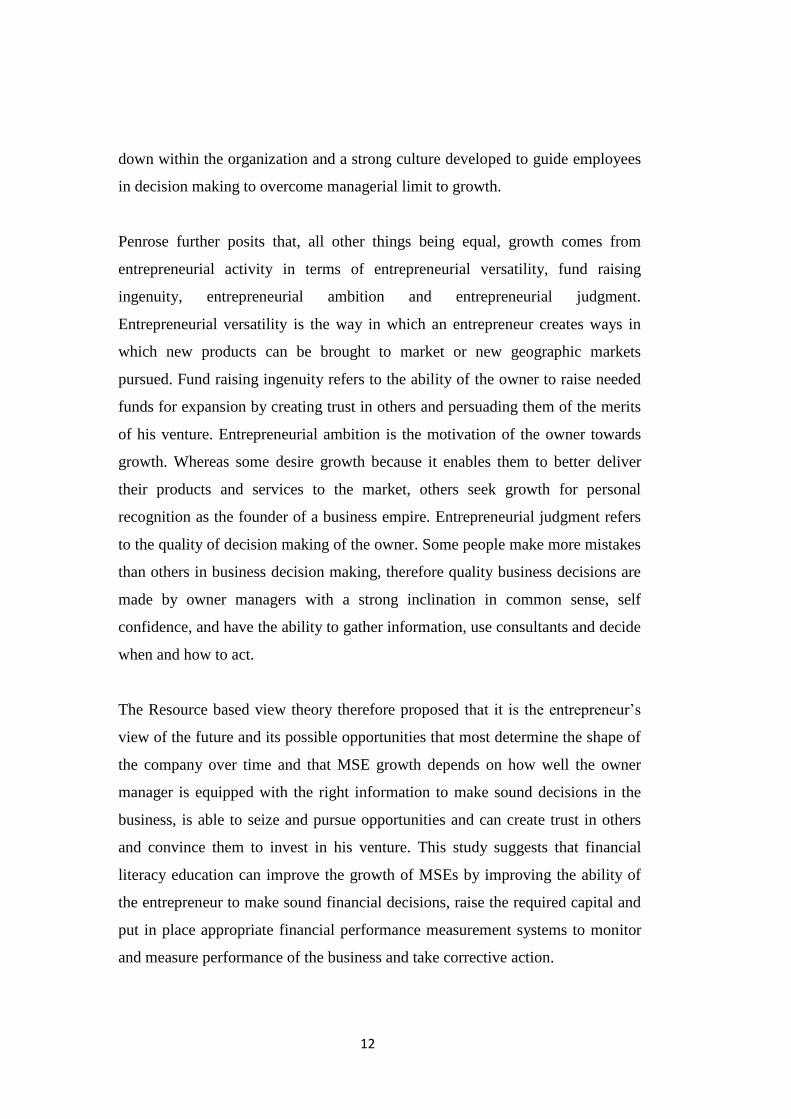
b) Stages of Growth Theory.
This theory was developed by Larry Greiner (1972) who posits that enterprises
move through five distinguishable stages of growth. Each phase contains a
relatively calm period of growth (evolution) that ends with a management crisis
(revolution) (Gupta et al., 2013; Mckaskill, 2010). These phases of growth are
creativity, direction, delegation, coordination, and collaboration (Figure 2.1).
Figure 2 1: Phases and Crises of Growth ( Gupter et al., 2013)
At creativity the enterprise is born, products and services to be offered to the
market are developed, long working hours and moderate salaries. Direction stage
is characterized by sustained growth and good management. At delegation stage,
the organization is decentralized, organization structures put in place. Most
responsibilities are assigned to line managers and employees. Coordination phase
brings in formal systems with clear flow of authority and headquarter is
established for better coordination of activities. Collaboration phase marks the
peak of growth which is characterized by strong interpersonal relationships and
teamwork. The enterprise largely invests in capacity building through workshops,
conferences and training.
Greiner argued that growth (evolution) proceeded until a crisis (revolution)
occurred. Each crisis is followed by a different management style. As the
business grows, communication becomes increasingly formalized as
communication lines become longer. Customer service quality falls as new
customers don’t have the advantage of personal links with the founders.
Problems escalate with the second location and now daily face-to-face
Bureaucracy
crisis Leadership
crisis
Autonomy
crisis Control
crisis
14
communication is not possible. External shareholders and/or external directors
force more transparent decision making and thus the entrepreneur can no longer
make decisions unilaterally. Larger numbers of staff, customers and other
stakeholders now depend on the business for their livelihood. Greiner concurs
with Penrose that for there to be growth each level of complexity must usher in a
new management style. Most entrepreneurs fail to appreciate the fact that at each
level of complexity their businesses must be managed differently hence they are
not able to make the transition or don’t want to. Consequently they stagnate and
eventually fail.
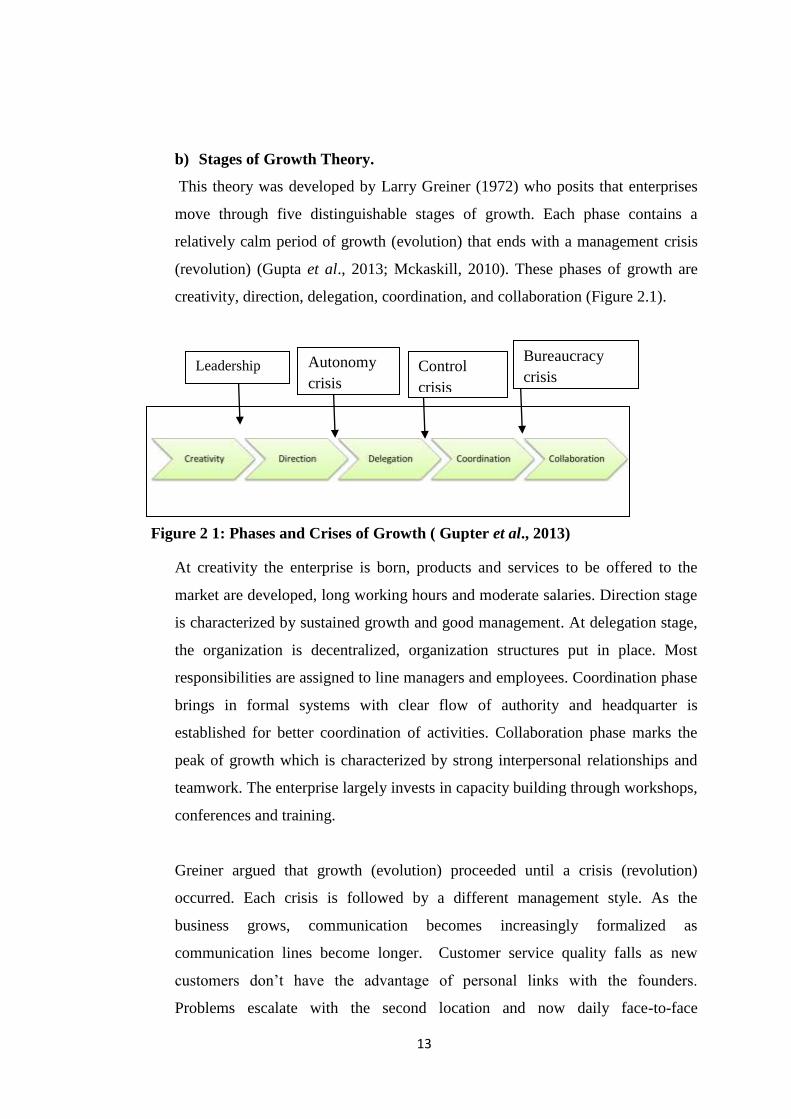
c) Churchill and Lewis Model
Applying the findings of Greiner to the small entrepreneurial business situation,
Churchill and Lewis (1983) developed a model. They posit that an enterprise can
have five stages of growth as depicted below (Figure 2.2).
Figure 2 2: Stages of an enterprise growth (Churchill and Lewis 1983)
Existence is the first stage, of the entrepreneurial venture. Here, the enterprise
struggles to establish its processes and works without a formal structure in place.
The owner of the enterprise takes close supervision of each and every business
activity. At the second stage, which is survival, the business grows and the
entrepreneur feels the need to have additional capital to expand the business.
Since the business activity is growing, he/she prefers to add family members or
known people as partners to expand the business. The main aim of the enterprise
is to reach the breakeven point so that adequate cash flow can be maintained to
meet day-to-day requirements of repair and replacements.
15
At the third stage of success, the enterprise begins to earn profits. They have
enough capital to either invest in further business opportunity or continue with
the same pace of growth. At this stage, the enterprise may take up team building
and people development as some of their focus areas; however, these initiatives
are driven by personal values and vision of the entrepreneur. At the takeoff stage,
the focus is on further growth, expansion, and seeking new opportunities. The
organization becomes more formal in nature, and work is properly defined and
delegated. Finally, at the resource maturity stage, the firm graduates to a
company and gives more emphasis on quality control, financial control, and
creating a niche market. The Churchill and Lewis model shows that there are
many choices open to the business as it grows larger and more complex,
including the choice to limit the growth and/or to sell the business. The three
theories of growth allude to the fact that the owner’s aspirations, goals,
entrepreneurial skills and willingness to delegate, become key factors in attaining
the growth of the business. This very much supports the assertion that the
financial literacy skills of the owner are a key factor in the growth of the firm.
2.2.2 The Dual –Process Theory.
This theory posits that financial decisions can be driven by both intuitive and
cognitive processes which mean that financial literacy may not always yield optimal
financial decisions. The Dual Process Financial literacy theory argues that the
behavior of people with a high level of financial literacy might depend on the
prevalence of the two thinking styles: intuition (system 1) and cognition (system 2)
(Lusardi & Mitchell, 2011; Glaser & Walther, 2013). Intuition is the ability to
acquire knowledge without inference or the use of reason. Intuition provides views,
understandings, judgments, or beliefs that cannot be empirically verified or rationally
justified. Taylor (1981) as cited by Chan and Park (2013) asserts that individuals
who rely on intuition prefer to use mental short cuts as they make decisions which
tend to be largely influenced by their emotions. Glaser and Walther (2013) point out
that the positive effect of financial literacy on reasonable investment decisions is
diminished by a high prevalence of intuition. Therefore, increased use of intuition
results to sub optimal investment decisions.
16
Cognition on the other hand is the process by which the sensory input is
transformed, reduced, elaborated, stored, recovered, and used. Cognition is the
mental processing that includes the comprehending, calculating, reasoning,
problem solving and decision making (Chan, & Park 2013). High cognition
individuals enjoy thinking, are analytical and are better at retaining information
and more likely to search out new information. They are more likely to be
influenced by a relevant message and not by irrelevant information such as
endorser’s appearance or use of humor (Chan & Park, 2013). Since the need for
cognition triggers the use of analytical process, it can directly shape investment
portfolio composition. Such investors will therefore more likely use the
systematic approach of capital budgeting when evaluating investment
opportunities and are more likely to diversify investments compared to those with
a low need for cognition.
Dual process theories imply that individuals who are high on cognition will seek
out for information and are more likely to be influenced by a relevant message.
This means that their decision making skills can be boosted by financial literacy
training using simple easy to understand methodologies. Moreover, use of
intuition may be reduced by provision of relevant information to support decision
making through financial education since individuals tend to rely on intuition
where relevant information is lacking. However optimal results may not be
achieved where individuals trust their intuitions in decision making.
17
2.2.3 Operationalization of Variables.
The enterprise growth theories and financial literacy theory allude to the fact that the
skills and knowledge of the entrepreneur are central in achieving enterprise growth
therefore financial management skills of the owner manager are an important
determinant of MSE growth. However, there is no standardized measure of financial
literacy; different studies have used different variables to measure financial literacy
(Fatoki, 2014; Cole & Fernando 2008). The USAID (2009) used finance related
knowledge i.e (awareness of sources of finance, awareness of business finance
technology and consumer financial literacy), finance related business skills and
information skills to measure financial literacy for an entrepreneur. Siekei et al.,
(2013) used competence in book keeping, credit management, budgeting skills and
financial control to measure financial literacy. Fatoki (2014) used financial planning
analysis and control, Book keeping, understanding of funding sources, Business
terminology, use of technology and risk management (insurance) to measure the
financial literacy of new micro entrepreneurs. Obago (2014) in a study to determine
the effect of financial literacy on management of personal finances of employees of
commercial banks in Kenya used: money basics, budgeting, saving and planning,
borrowing, debt literacy, financial products, recourse and self-help. The Kenya
Financial Sector Deepening report (FSD, 2009) identifies key themes of financial
literacy education as; Savings Culture, Financial planning and budgeting, Debt
Management, Bank Services and Investments management. In this study, the
researcher used debt management, budgeting, access to banking services and Book
keeping literacy in measuring financial literacy of MSE owners in Kakamega Central
Sub County.
18
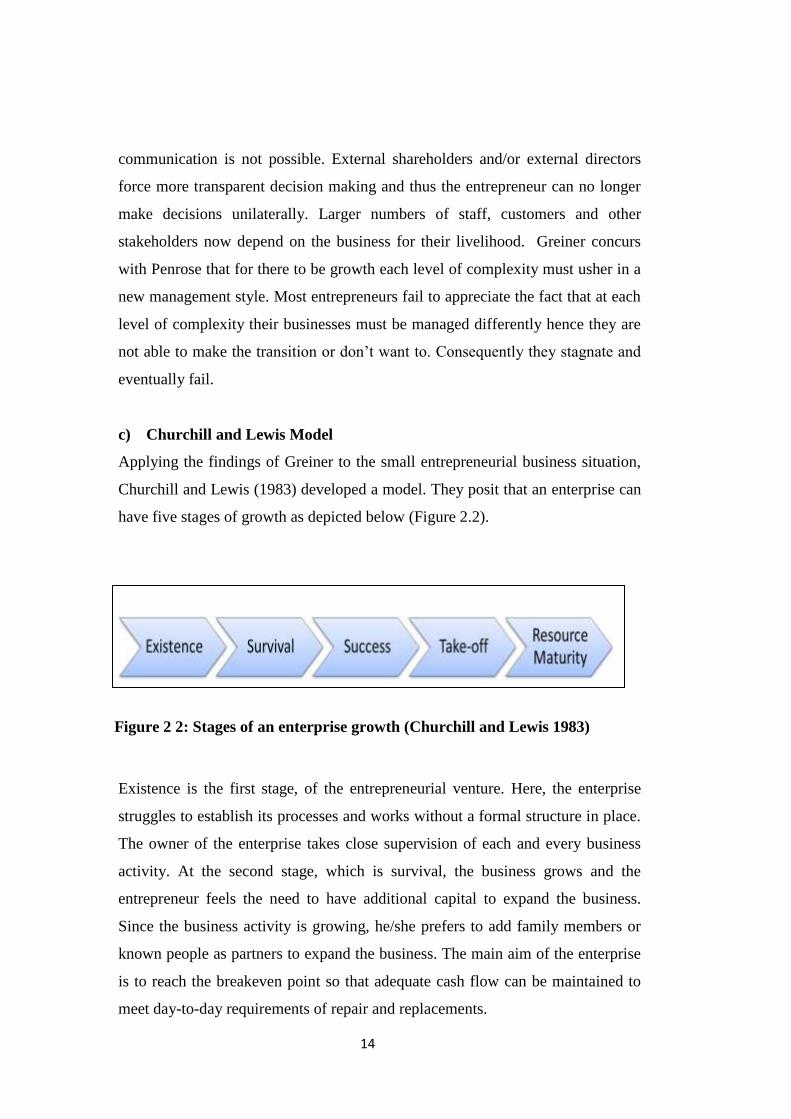
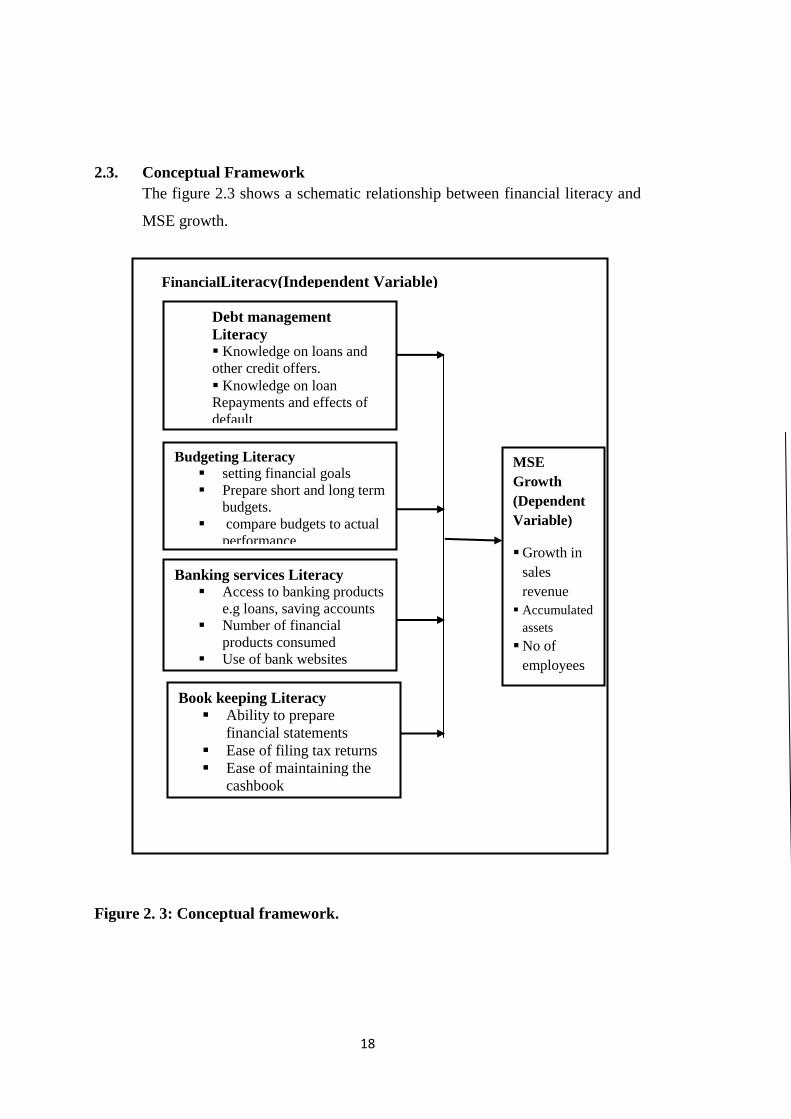
2.3. Conceptual Framework
The figure 2.3 shows a schematic relationship between financial literacy and
MSE growth.
Figure 2. 3: Conceptual framework.
Budgeting Literacy
setting financial goals
Prepare short and long term
budgets.
compare budgets to actual
performance
Use budgets to set
performance targets
Debt management
Literacy Knowledge on loans and
other credit offers.
Knowledge on loan
Repayments and effects of
default
Knowledge of interest rates
, inflation.
Level of indebtness
Book keeping Literacy
Ability to prepare
financial statements
Ease of filing tax returns
Ease of maintaining the
cashbook Ability to do bank
reconciliations
Banking services Literacy Access to banking products
e.g loans, saving accounts
Number of financial
products consumed
Use of bank websites
MSE
Growth
(Dependent
Variable)
Growth in
sales
revenue
Accumulated
assets
No of
employees
FinancialLiteracy(Independent Variable)
19
2.4 Empirical Review.
2.4.1 Debt Management Literacy
Most governments in developed and developing economies are concerned about the
financial literacy of their citizens. The Organization for Economic Cooperation and
Development (Pisa,2013) posits that the rising interest in financial literacy as a key
life skill has been brought about by a number of factors such as; transfer of risk from
both governments and employers to individuals as a result of introduction of
contributory pension to replace the automatic pension which has shifted to workers
the responsibility to save for their own financial security upon retirement, upsurge of
contributory health schemes, increased number of financial decisions that individuals
have to make both at the personal and business level as a result of the changing
market place and increased supply of a wide range of financial products from a
variety of providers which requires complex financial knowledge to select from a
wide array of alternatives. All of these trends have transferred the responsibility of
major financial decisions to individuals which require that individuals must be
sufficiently financially literate to take the necessary steps to protect themselves from
fraudulent schemes.
Accessing finance is a key element for MSEs to succeed in building productive
capacity, compete, create jobs and contribute to poverty alleviation in developing
countries. However, small businesses especially in Africa can rarely meet the
conditions set by financial institutions which see MSEs as risky because of poor
guarantees and lack of information about their ability to repay loans ( Siekei et al.,
2013). As a result of these constraints, most MSEs finance a smaller share of their
investment with formal sources of external finance than do large firms and instead,
relies more heavily on informal sources of finance, such as borrowing from family
and friends or from unregulated moneylenders which inhibits their growth. However,
although self financing and money lenders are an alternative, self financing is
constrained by low saving capabilities of most MSEs while money lenders charge
high interest rates due to the perceived high risk of default by MSEs (Rweyemamu,
Kimairo & Urasa, 2003; G20 Seoul Summit, 2010).
20
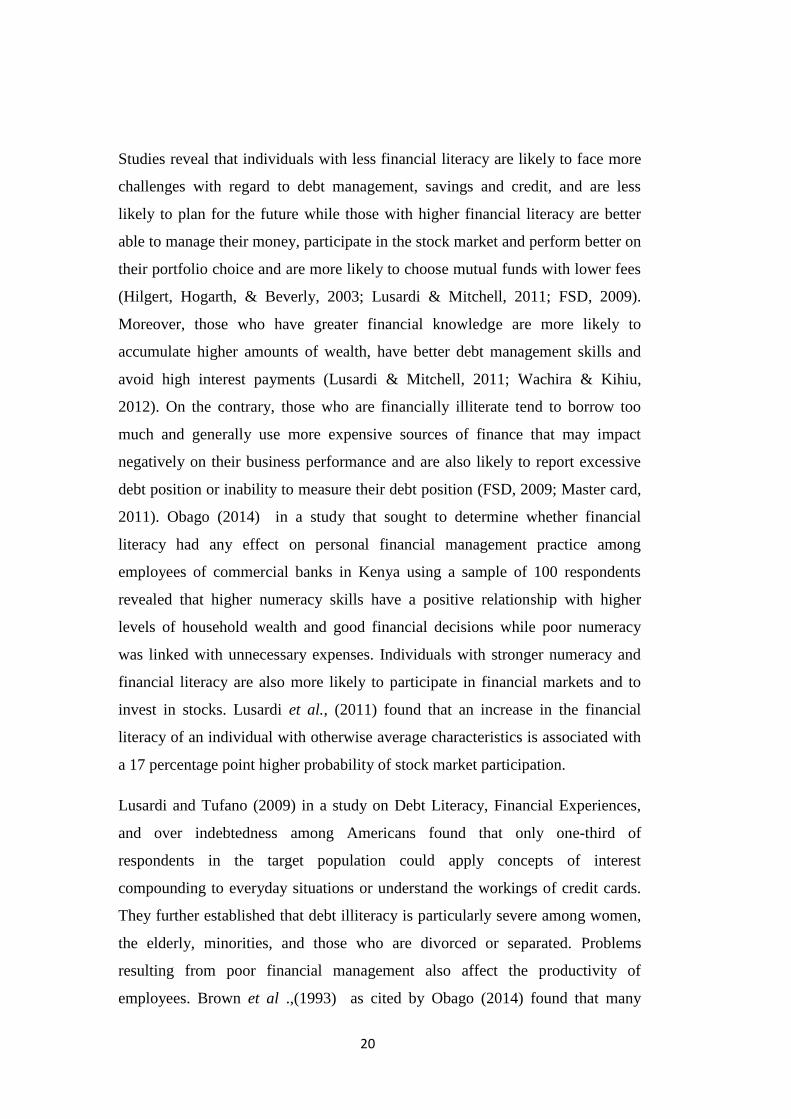
Studies reveal that individuals with less financial literacy are likely to face more
challenges with regard to debt management, savings and credit, and are less
likely to plan for the future while those with higher financial literacy are better
able to manage their money, participate in the stock market and perform better on
their portfolio choice and are more likely to choose mutual funds with lower fees
(Hilgert, Hogarth, & Beverly, 2003; Lusardi & Mitchell, 2011; FSD, 2009).
Moreover, those who have greater financial knowledge are more likely to
accumulate higher amounts of wealth, have better debt management skills and
avoid high interest payments (Lusardi & Mitchell, 2011; Wachira & Kihiu,
2012). On the contrary, those who are financially illiterate tend to borrow too
much and generally use more expensive sources of finance that may impact
negatively on their business performance and are also likely to report excessive
debt position or inability to measure their debt position (FSD, 2009; Master card,
2011). Obago (2014) in a study that sought to determine whether financial
literacy had any effect on personal financial management practice among
employees of commercial banks in Kenya using a sample of 100 respondents
revealed that higher numeracy skills have a positive relationship with higher
levels of household wealth and good financial decisions while poor numeracy
was linked with unnecessary expenses. Individuals with stronger numeracy and
financial literacy are also more likely to participate in financial markets and to
invest in stocks. Lusardi et al., (2011) found that an increase in the financial
literacy of an individual with otherwise average characteristics is associated with
a 17 percentage point higher probability of stock market participation.
Lusardi and Tufano (2009) in a study on Debt Literacy, Financial Experiences,
and over indebtedness among Americans found that only one-third of
respondents in the target population could apply concepts of interest
compounding to everyday situations or understand the workings of credit cards.
They further established that debt illiteracy is particularly severe among women,
the elderly, minorities, and those who are divorced or separated. Problems
resulting from poor financial management also affect the productivity of
employees. Brown et al .,(1993) as cited by Obago (2014) found that many
21
employees suffer from stress as a result of money problem behaviors which
include: over-indebtedness, overspending, unwise use of credit, poor money
management and inadequate resources to make ends meet which impacts
negatively on their productivity at work. As a result of these employee problems,
many companies in the United States adopted financial education at work places
aimed at equipping their employees with personal financial management skills.
The Financial capability Report of 2009 reveals that a significant population of
Kenyans i.e 25% has credit difficulties and tends to borrow loans to repay loans
and admit that they are not in control of their finances. Therefore acquisition of
financial literacy skills would have a positive impact on an individual’s behaviors
in terms of increased savings, wealth accumulation and avoidance of unnecessary
expenses. This would make MSE managers better customers for the banks,
prudent managers of the limited financial resources in their businesses and better
able to select the most suitable products for their businesses.
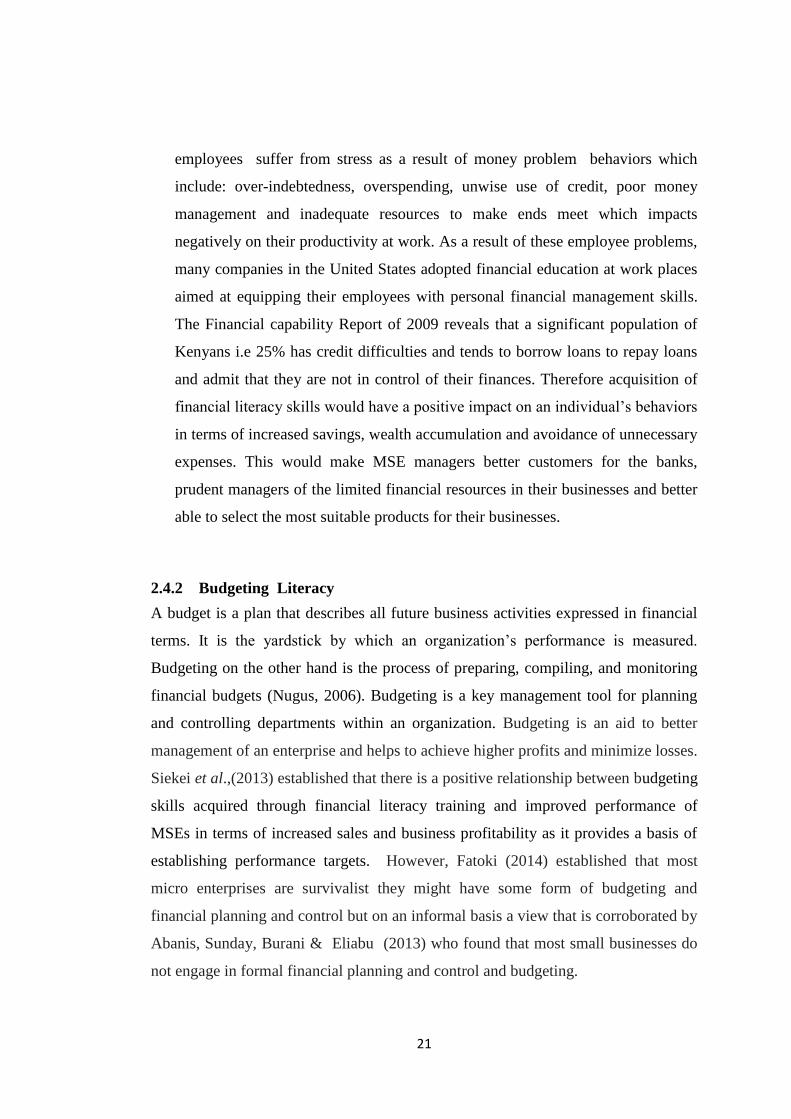
2.4.2 Budgeting Literacy
A budget is a plan that describes all future business activities expressed in financial
terms. It is the yardstick by which an organization’s performance is measured.
Budgeting on the other hand is the process of preparing, compiling, and monitoring
financial budgets (Nugus, 2006). Budgeting is a key management tool for planning
and controlling departments within an organization. Budgeting is an aid to better
management of an enterprise and helps to achieve higher profits and minimize losses.
Siekei et al.,(2013) established that there is a positive relationship between budgeting
skills acquired through financial literacy training and improved performance of
MSEs in terms of increased sales and business profitability as it provides a basis of
establishing performance targets. However, Fatoki (2014) established that most
micro enterprises are survivalist they might have some form of budgeting and
financial planning and control but on an informal basis a view that is corroborated by
Abanis, Sunday, Burani & Eliabu (2013) who found that most small businesses do
not engage in formal financial planning and control and budgeting.
22
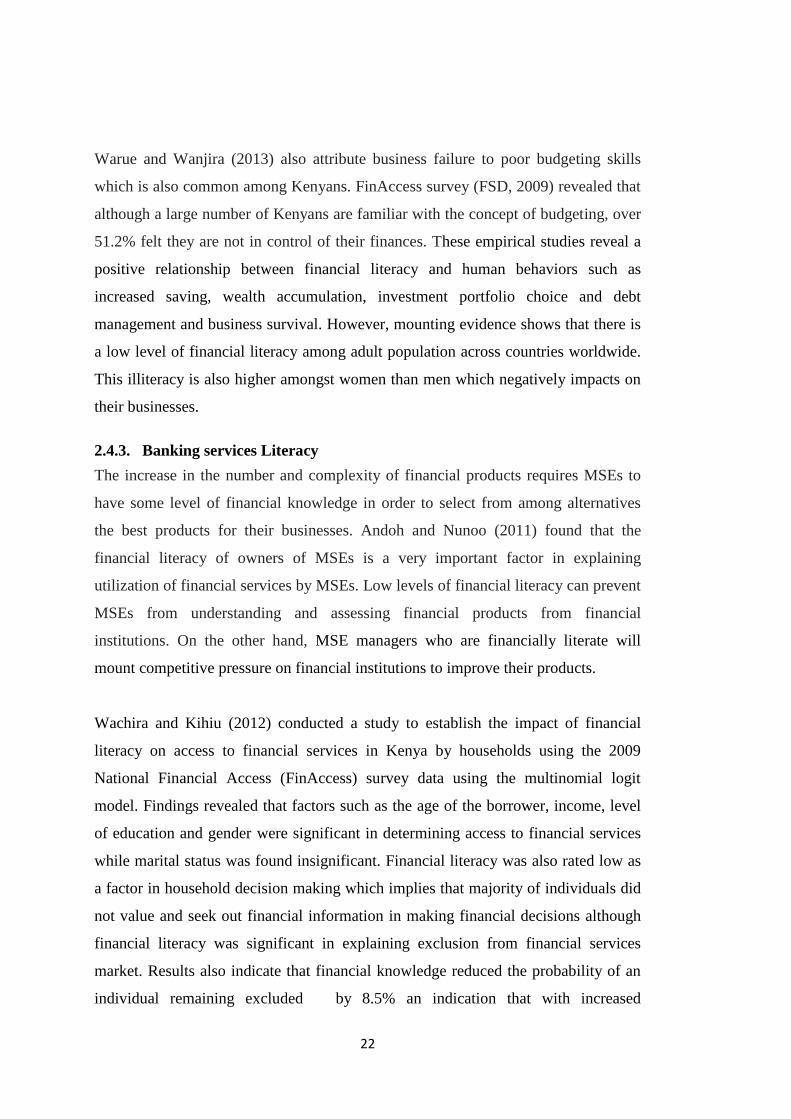
Warue and Wanjira (2013) also attribute business failure to poor budgeting skills
which is also common among Kenyans. FinAccess survey (FSD, 2009) revealed that
although a large number of Kenyans are familiar with the concept of budgeting, over
51.2% felt they are not in control of their finances. These empirical studies reveal a
positive relationship between financial literacy and human behaviors such as
increased saving, wealth accumulation, investment portfolio choice and debt
management and business survival. However, mounting evidence shows that there is
a low level of financial literacy among adult population across countries worldwide.
This illiteracy is also higher amongst women than men which negatively impacts on
their businesses.
2.4.3. Banking services Literacy
The increase in the number and complexity of financial products requires MSEs to
have some level of financial knowledge in order to select from among alternatives
the best products for their businesses. Andoh and Nunoo (2011) found that the
financial literacy of owners of MSEs is a very important factor in explaining
utilization of financial services by MSEs. Low levels of financial literacy can prevent
MSEs from understanding and assessing financial products from financial
institutions. On the other hand, MSE managers who are financially literate will
mount competitive pressure on financial institutions to improve their products.
Wachira and Kihiu (2012) conducted a study to establish the impact of financial
literacy on access to financial services in Kenya by households using the 2009
National Financial Access (FinAccess) survey data using the multinomial logit
model. Findings revealed that factors such as the age of the borrower, income, level
of education and gender were significant in determining access to financial services
while marital status was found insignificant. Financial literacy was also rated low as
a factor in household decision making which implies that majority of individuals did
not value and seek out financial information in making financial decisions although
financial literacy was significant in explaining exclusion from financial services
market. Results also indicate that financial knowledge reduced the probability of an
individual remaining excluded by 8.5% an indication that with increased
23
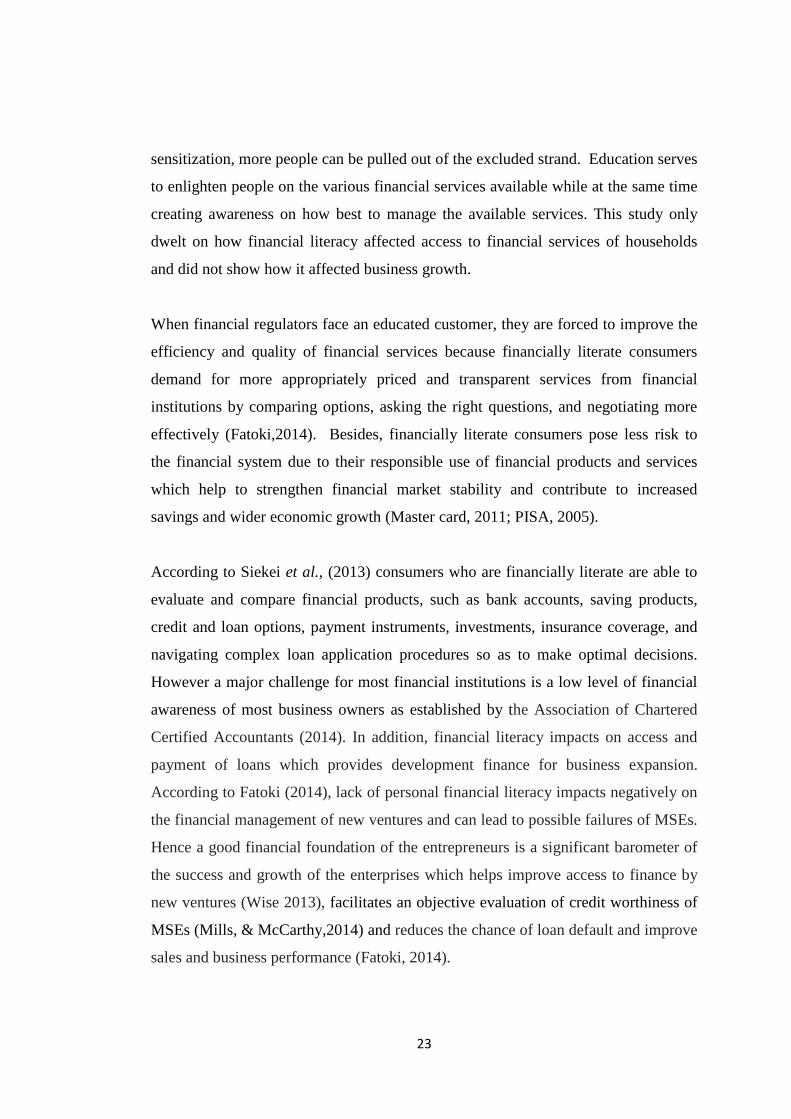
sensitization, more people can be pulled out of the excluded strand. Education serves
to enlighten people on the various financial services available while at the same time
creating awareness on how best to manage the available services. This study only
dwelt on how financial literacy affected access to financial services of households
and did not show how it affected business growth.
When financial regulators face an educated customer, they are forced to improve the
efficiency and quality of financial services because financially literate consumers
demand for more appropriately priced and transparent services from financial
institutions by comparing options, asking the right questions, and negotiating more
effectively (Fatoki,2014). Besides, financially literate consumers pose less risk to
the financial system due to their responsible use of financial products and services
which help to strengthen financial market stability and contribute to increased
savings and wider economic growth (Master card, 2011; PISA, 2005).
According to Siekei et al., (2013) consumers who are financially literate are able to
evaluate and compare financial products, such as bank accounts, saving products,
credit and loan options, payment instruments, investments, insurance coverage, and
navigating complex loan application procedures so as to make optimal decisions.
However a major challenge for most financial institutions is a low level of financial
awareness of most business owners as established by the Association of Chartered
Certified Accountants (2014). In addition, financial literacy impacts on access and
payment of loans which provides development finance for business expansion.
According to Fatoki (2014), lack of personal financial literacy impacts negatively on
the financial management of new ventures and can lead to possible failures of MSEs.
Hence a good financial foundation of the entrepreneurs is a significant barometer of
the success and growth of the enterprises which helps improve access to finance by
new ventures (Wise 2013), facilitates an objective evaluation of credit worthiness of
MSEs (Mills, & McCarthy,2014) and reduces the chance of loan default and improve
sales and business performance (Fatoki, 2014).
24
2.4.4 Book Keeping Literacy.
Larry and Cristopher (2009) define book keeping as “the art of recording all money
transactions so that financial position of an undertaking and its relationship to
proprietors and outside persons can be readily ascertained”. Every enterprise,
however simple requires written records which are used by managers as guides to
routine action, taking of decisions, formulation of general rules and maintaining
relationships with other organizations or with individuals (Frankwood, 2010).
Therefore a business without written records is like a blind man without his aid or a
vehicle without a driver for it does not know which way it is going. Frankwood,
(2010) identifies the following as the main benefits of keeping business records;
They help in calculating business profits or losses, reveal value of debtors in terms of
amount due and when payments are due so as to avoid heavy costs of bad debts,
They reveal fast moving and slow moving goods and those about to expire, They also
help in business planning and are needed by lenders of business finance etc. Hussein
(1983) as cited by Ezejiofor, Ezenyirimba, & Olise (2014) notes that, a good
accounting system is not only judged by how well records are kept but by how well it
is able to meet the information needs of both internal and external decision-makers.
Quality accounting information will enhance financial management as well as
accessibility of finance by small businesses. Wise (2013) finds that increase in
financial literacy leads to more frequent production of financial statements and such
an entrepreneur who produces financial statements more frequently has a higher
probability of loan repayment and a lower probability to voluntarily close his/her
business. Ezejiofor et al., (2014) in a study to establish the relevance of accounting
records in small business performance in Nigeria found that MSEs that kept proper
books of account were able to measure accurately the performance of their
businesses. They also assert that business decisions with regard to expansion,
maintaining a competitive edge, prevention of business failure and filling tax returns
need to be supported by quality financial information which needs to be relevant,
user friendly and available in a timely manner. They caution that accounting systems
that generate the information should be simple in order not to impose unnecessary
operative burdens.
25
Most micro-enterprises do not keep books of accounts that will allow them to extract
useful accounting information due to lack of accounting knowledge (Fatoki, 2014;
Agyei, 2011; Maseko & Manyani, 2011). In addition, these findings indicate that
most micro-enterprises still use manual method instead of computers for operations
which results to inefficient use of accounting information to support assessment of
financial performance of their businesses. They propose the use of accounting
software to improve accounting practices, albeit they lament the unavailability of
medium-sized software for MSEs. Ezejiofor et al., (2014) opine that except for
statutory demands, MSEs hardly give serious thoughts to the process of sound
accounting, yet the inadequacy and ineffectiveness of accounting processes have
been responsible for untimely collapse of a host of them. Most MSE owners prefer
to recruit unskilled personnel especially clerical and accounting staff the product of
which is business stagnation and winding up. This is because unskilled accounting
staffs are not able to keep reliable accounting records and cannot correctly determine
the profit or loss of the firm.
The Kenya Revenue Authority (KRA) commissioner general Waweru in his report
on “Addressing the different tax policy and tax administrative challenges of micro,
small and medium businesses” observed that, many small businesses in Kenya in the
informal sector lack detailed business records as a strategy to avoid taxation
(Waweru, 2007). He opines that imposing fines on such entities would discourage
rather than enforce tax compliance. These entities may avoid taxation but this
information asymmetry has a negative effect on the business as it makes it difficult
for financiers to quantify accurately the level of risk involved in a business
opportunity so as to fix accurate interest rates which results to high transaction costs
due to high cost of information gathering, screening and monitoring of MSEs.
Consequently financiers tend to fix high premiums, high interest rates and demand
excess collateral which makes it difficult for MSEs to comply. Such severe credit
rationing for MSEs results to credit constraints making them miss out on projects that
are profitable because they cannot raise the external capital necessary to fund them
(G20 Seoul Summit, 2010).
26
The G20 Seoul Summit (2010) also reports that low levels of financial literacy
particularly book keeping skills have contributed to lost opportunities for a large
number of MSEs worldwide. It affirms that information asymmetry arising from
MSEs inadequate financial statements or business plans make it difficult for creditors
to assess the creditworthiness of potential MSE proposals which makes most lenders
reluctant to fund small firms especially those with new products. Mills and McCarthy
(2014) confirm this and opine that assessing creditworthiness of small businesses is
difficult due to information asymmetry because their transactions are largely
informal. Through business training an entrepreneur can acquire basic skills of Book
keeping which increases the transparency of his business and improves his credit
standing.
2.4.5 Micro and Small Enterprise Growth
The Micro and Small enterprise sector plays a critical role in economic growth of
both developed and developing economies which affirms the recent attention to the
growth and sustainability of this sector. This focus has been boosted by the formation
of worldwide networks such as the Global Entrepreneurship Network that aims at
marshalling resources for the sector through forums such as the Global
Entrepreneurship Summit held in Kenya in July 2015. Enterprise growth can be
measured in various ways. Gupta ,Guha, & Shiva (2013) suggests the use of
quantitative features such as; value addition, revenue generation, volume of assets
and volume of business or qualitative features like market position, quality of
product, and goodwill of the customers, on the contrary Mateev and Anastasov
(2010) opines that financial structure, productivity, sales revenue and total assets
have a more direct impact on growth but caution that the number of employees,
investment in R & D, and other intangible assets have minimal influence on the
enterprise's growth prospects. Chaston and Mangles (1997) suggest that if an
enterprise adopts multi-strategy transformation initiatives, the probability of
achieving the growth objective increases.
27
A number of factors have also been identified by various scholars as determinants
of MSE growth; Muthaih and Venkatesh (2012) suggest that presence of institutional
and financial barriers may hinder MSE growth. Institutional barriers include the
enterprise's interaction with government, legal requirements and procedures, taxation
while financial barriers involve lack of financial resources. Gilbert , McDougall and
Audretsch (2006) suggested that it is the how and where questions that are more
important in the context of the growth of an enterprise. They opine that growth is a
function of the decisions an entrepreneur makes, like how to grow internally or
externally and where to grow in domestic market or international market.
Conversely, Lorunka , Kessler, Frank and Lueger, (2011) argue that the gender of
the founder, the amount of capital required at the time of starting the business,
commitment of the entrepreneur and growth strategy of the enterprise are the most
important factors in predicting growth in a small enterprise. Men owned enterprises
exhibited faster growth than women owned enterprises. This could be attributed to
the assertion that men tend to acquire knowledge on financial literacy earlier in life
while women will do so late in life particularly in anticipation of death of a spouse
(Lusardi & Mitshell, 2013). Consequently, growth may be achieved quickly, slowly,
or not at all. It depends on the strength of the growth aspirations and growth-enabling
factors of an enterprise (Mckaskill, 2010)
Various studies further confirm that while some entreprepreneurs aspire to grow
either for recognition as founders of business empires or to serve their customers
better (Penrose, 1959) others are not able to grow due to inability to manage
transition (Greiner, 1972) and others do not want to grow. A study by Kolvereid and
Bullvag (1996) found that almost 40% of the respondents do not want to grow.
Further, they found that there is a significant relation between education, industry,
past growth in turnover, and entrepreneur's aspiration to grow. They concluded that
entrepreneurs who want their firms to grow will have higher level of education and
will tend to have manufacturing firms rather than service firms. However, Njoroge
(2013) argues that education may not be the only determinant of growth as there are
also cases of illiterate persons running successful enterprises in Kenya especially in
informal sector, many Jua Kali and farming entrepreneurs are financially illiterate
28
and yet they run very successful MSEs. A clear understanding of factors that greatly
influence the growth of MSEs would ensure that they are measured and enhanced to
promote the growth of MSEs. More research is also needed to find out whether the
financially illiterate entrepreneurs would be better if they had financial literacy.
In a study to investigate the effect of business development services on the
performance of Small Scale enterprises in Kisii Town Osinde ,Iravo, Munene, &
Omaiyo (2013) found that the entrepreneurs who received business training services
recorded an improvement in the growth of sales and market shares. 83.3% of MSE
managers who always attended training recorded an improvement in their businesses
in terms of growth in sales and profits as opposed to only 41.2% of those who never
attended training. This study focused on the financial literacy skills of the
entrepreneur and how it affected the growth of MSE businesses in Kakamega Central
Sub County. Growth was measured in terms of sales revenue, accumulated assets and
number of employees.
2.5. Critique of the Literature Reviewed.
Empirical studies reviewed present both convergent and divergent views on the role
of financial literacy on the growth of MSEs. Most scholars concur that financial
literacy greatly influences enterprise growth. While various factors may play a role in
determining enterprise growth, the skills of the entrepreneur have been found to be a
key determinant. Penrose (1959) and Greiner (1972) concur that enterprise success is
dictated by the ability of the owner manager to make sound business decisions,
identify and pursue opportunities and convince others to invest in his venture. They
also concur that growth brings about organizational complexities and it’s only those
organizations that are able to reorganize that will transit to the next level of growth.
Whereas Penrose (1959) proposes a participatory management style to push decision
making to lower levels of management so as to avoid managerial limitations to
growth and take advantage of existing talent in the business. Greiner (1972) and
Lewis & Churchill (1983) propose a new management style at each level of
complexity with main emphasis on appropriate delegation of responsibility and
29
sound financial controls and capacity building of managers. This implies that with
appropriate financial management literacy MSE managers can put in place adequate
financial controls to enhance accountability of employees for faster growth.
Kolvereid and Bullvag (1996) opine that high growth firms have entrepreneurs with
high level of education. On the contrary Njoroge ( 2013) argues that the level of
education may not be the only determinant as there are very successful MSEs run by
illiterate managers while others run by highly educated managers have failed.
Lorunka et al.,(2011) argues that the gender of the founder is significant in predicting
growth in small enterprises. Men owned enterprises experience faster growth than
women owned enterprises a view that is supported by Lusardi and Mitchel (2013)
and Wachira and Kihiu (2012) who opine that men tend to acquire financial
knowledge earlier in life than women. Although access to finance is crucial for
MSEs to build productive capacity, compete and create employment, Siekei et
al.,(2013) argues that it is the poor guarantees and lack of financial information that
makes MSEs to be rationed out in access to loan finance. They therefore tend to rely
on money lenders who are expensive and family and friends who may not raise
adequate funds thus they miss out on investment opportunities that could bring
growth. The G20 Seoul Summit (2010) and Wachira and Kihiu (2013) confirm that
lack of relevant information is a major reason for credit rationing of MSEs by
financial institutions.
Financial literacy has also been associated with positive behaviors such as debt
management, increased savings, wealth accumulation and avoidance of over
indebtness (Lusardi & Mitchell, 2011; Mastercard,2011; Obago ,2014). However,
Chan, and Park (2013) caution that financial literacy may not always yield optimal
results where an individual relies heavily on intuitions in decision making. Wachira
and Kihiu (2012) further suggest that increase in knowledge about financial services
reduces the probability of an individual being financially excluded by 8.5%. This
view is corroborated by Lusardi and Mitchell (2011) who opine that increase in
financial literacy of an individual with average characteristics would increase the
probability of stock market participation by 17%. This implies that with increased
30
sensitization more people can be pulled out of the excluded strand. Ezijiofor et
al.,(2014); Fatoki, 2014; and Agyei,(2014) opine that although book keeping allows
a business to file tax returns, compare its business performance with others and put in
place appropriate financial controls to prevent business failure most MSEs do not
keep proper business records due to lack of accounting knowledge. On the contrary,
Waweru (2007) asserts that failure to produce financial information by MSEs
particularly in the informal sector in Kenya is a strategy to avoid taxation although it
eventually impacts on their ability to access external finance due to information
opacity. These studies also reveal limited use of budgeting by MSE managers which
negatively impacts on business performance as well as personal money management
(FSD, 2009; Warue and Wanjira,2013; Fatoki,2014).Through business training, MSE
managers can acquire the right skills, knowledge and attitudes necessary to improve
financial management of their businesses and increase their uptake of financial
products to realize growth and transit to the next level of enterprise size.
2.6. Summary
The importance of financial literacy as a key life skill cannot be over emphasized.
This has been brought about by the changing social economic environmental factors
which place a higher responsibility of making financial decisions to an individual
both in terms of personal finances as well as business finance. Consequently, there is
need for individuals to strive to acquire financial management skills so as to be able
to make sound financial decisions in managing personal or business finances. A
dearth of literature on theories of enterprise growth mainly (Penrose, 1959;
Greiner,1972;Churchil and Lewis,1983) concur that skills and competencies of the
entrepreneur play a crucial role in attaining growth. Financial literacy education can
thus improve the growth of MSEs by equipping the entrepreneur with skills to make
sound financial decisions, raise the required capital and put in place appropriate
financial performance measurement systems to monitor and measure performance of
the business and take corrective action.
The high failure rate of MSEs can be attributed to the low level of financial literacy
of the entrepreneur which results to poor planning, limited access to finance and poor
31
financial management(Oluoch,2014;Agyei,2014; Njoroge,2012). Financially
illiterate individuals are more susceptible to over indebtness, vulnerable to fraudulent
schemes and are also likely to use expensive sources of finance which impact
negatively on their business profitability (Siekei et al., 2013; Fatoki, 2014).Such
individuals are likely to face more challenges with regard to debt management,
savings and credit, and are less likely to plan for the future.( Lusardi & Mitchell,
2008, 2011; FSD 2009). Financial illiteracy has also been attributed to credit card
behaviors that generate fees and interest charges. Lusardi and Tufano (2009a) found
that although illiterate customers account for just 28% of card holders, they account
for the bulk of money received by financiers from these fee inducing behaviors. On
the contrary, Acquisition of credit management skills through financial literacy
training enables MSEs to acquire loans and manage loan portfolios in a manner to
ensure that loan liability and interest expenses are minimized (Siekei et al.,2013).
Although a positive relationship exists between budgeting skills and improved
performance of MSEs in terms of increased sales and business profitability and better
money management by individuals; A number of MSEs in Kenya fail due to lack of
budgeting (Warue & Wanjira ,2013) and this poor budgeting skills are also common
among Kenyans since over 51.2%of Kenyans who are familiar with the budgeting
concept feel not in control of their finances.(FSD,2009). On the other hand,
acquisition of financial literacy results to positive outcomes which include; better
financial decisions with fewer management mistakes (Njoroge, 2014; Fatoki, 2014)
which reduces the need and cost of government intervention and support for those
who have made wrong financial decisions (Pisa,2013), improved quality of financial
products and stability of financial institutions in the market(Wachira & Kihiu,2012)
and enables a business to attract investors and access to loans (Wise, 2013; Mills &
McCarthy, 2014). Whereas these studies reveal a positive relationship between
financial literacy, household well being and business performance, most studies in
Kenya on financial literacy and business performance have dwelt on an impact
assessment of MSEs that have undergone Equity Foundation Financial literacy
training programme while others have focused on the relationship between financial
literacy and individual money management. No study has attempted to establish the
32
relationship between financial literacy of MSE managers in Kenya and the growth of
their businesses.
2.7. Research Gaps
Reviewed literature reveal that many studies especially in Kenya have mainly dwelt
on importance of financial literacy and its effects on household or personal financial
behavior with little effort to ascertain the role of financial literacy on the growth of
MSEs (FSD, 2008 & 2009; Mastercard, 2011). MSEs account for over 75% of the
private sector in Kenya which are expected to spur economic growth under the
devolved governance system. Although deliberate efforts have been made to avail
subsidized capital to this sector, the failure rate remains high. Very few micro and
small enterprises have been able to transit to medium scale. There is need to delve
further on how financial illiteracy inhibits growth, results to poor performance and
subsequent failure of MSEs in Kenya.
Njoroge (2013) sought to find out whether there is a relationship between financial
literacy and MSE success by interviewing a sample of seventy nine entrepreneurs
who are registered and operate in Nairobi County. The study concluded that there is a
positive relationship between financial literacy and entrepreneurial success in
Nairobi County. However, the study used respondents from MSEs with at least 3
employees, 5 years operation with a turnover of 5 million. This means that micro
enterprises with a lower turnover were left out yet these form the bulk of traders in
this sector. The current study mainly targeted MSEs with a turnover of less than
500,000 who are majority in the country. Siekei et al.,(2013) looked at the role of
financial literacy on performance of MSE enterprises whose managers had
undergone the Equity foundation financial literacy training in Njoro district. The
findings revealed a positive relationship between the financial literacy training and
the performance of the MSE managers that had been trained. However, for a
conclusive picture, It is necessary to measure the level of literacy of all MSEs and
how their level of literacy impacts on MSE performance so that those that have not
been reached by financial education training can be prioritized by future efforts.
Moreover, there is need to identify which of these variables are most significant in
influencing enterprise growth to inform future program design.
33
CHAPTER THREE
RESEARCH METHODOLOGY
3.1 Introduction
This chapter outlines the research methodology and data collection procedures that
were used in the study. It specifically addresses the study’s research design, target
population, sample design, sampling procedure and data collection instruments and
data analysis procedures.
3.2 Research Design
The study adopted a descriptive cross sectional survey design. This design was
deemed appropriate because in surveys the researcher is an outsider which increases
reliability and eliminates subjectivity. Samples are also mainly based on probability
sampling which allows for generalizability of data collected (Guthrie, 2012).The
design was also the most appropriate given the large number of respondents targeted
in the study. Other advantages include; generating standardized quantifiable
empirical data, confidentiality and anonymity of the respondents (O’leary, 2011).
3.3 Target Population
Target population is the collection of elements that possess the information sought by
the researcher (Guthrie, 2012). The Target population which represents the sampling
frame was entrepreneurs in MSEs registered by the Revenue Department under
single business permit with less than 20 employees and operating within Kakamega
Central Sub County. Records availed to the researcher by the Revenue department
of the County government of Kakamega indicate that as at March 2015 MSEs in this
category were 1300 from which a sample was drawn.
3.4 Sample and Sampling Technique
The researcher adopted a stratified proportionate sampling technique. MSEs were
first stratified into sectors; Service, Retail/Wholesale, Manufacturing and
Agribusiness. Proportionate sampling was then used to determine the number of
respondents from each strata to ensure equal representation hence reduce sampling
errors (Kombo & Tromp, 2006; Guthrie, 2012). The sample size was calculated
using Yamane’s formula (1967) on the basis of which a sample of 306 MSEs was
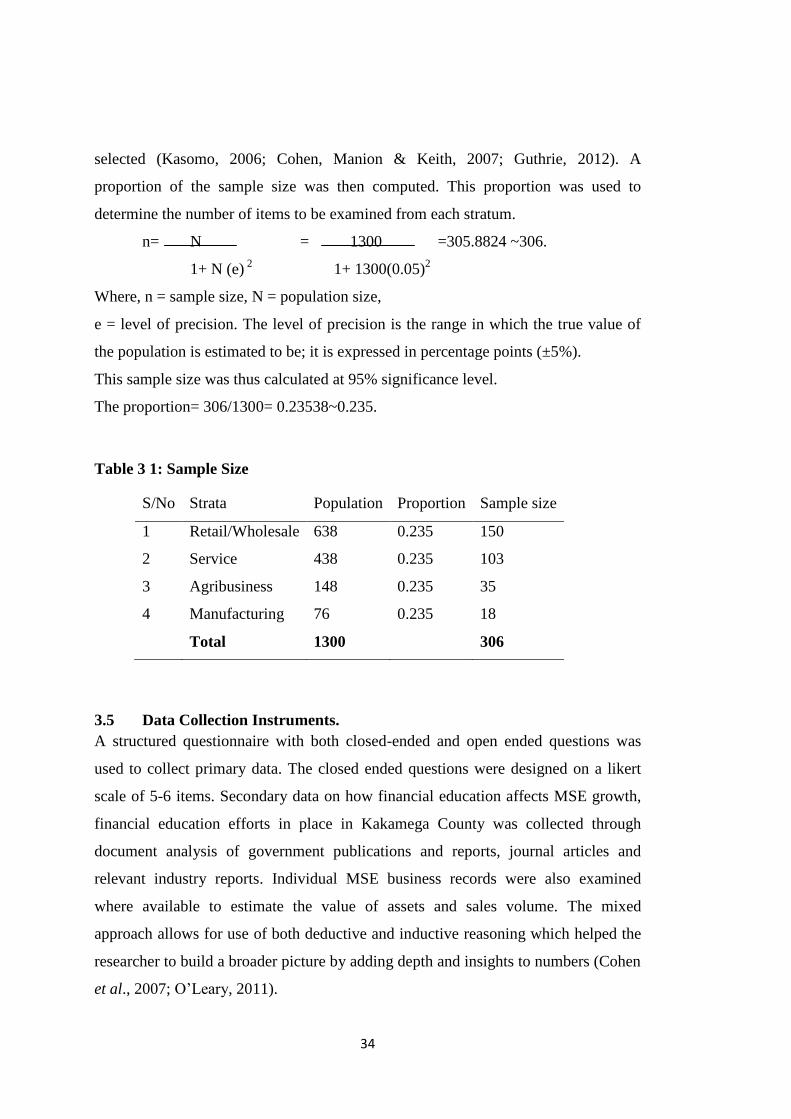
34
selected (Kasomo, 2006; Cohen, Manion & Keith, 2007; Guthrie, 2012). A
proportion of the sample size was then computed. This proportion was used to
determine the number of items to be examined from each stratum.
n= N = 1300 =305.8824 ~306.
1+ N (e) 2
1+ 1300(0.05)2
Where, n = sample size, N = population size,
e = level of precision. The level of precision is the range in which the true value of
the population is estimated to be; it is expressed in percentage points (±5%).
This sample size was thus calculated at 95% significance level.
The proportion= 306/1300= 0.23538~0.235.
Table 3 1: Sample Size
S/No Strata Population Proportion Sample size
1 Retail/Wholesale 638 0.235 150
2 Service 438 0.235 103
3 Agribusiness 148 0.235 35
4 Manufacturing 76 0.235 18
Total 1300 306
3.5 Data Collection Instruments.
A structured questionnaire with both closed-ended and open ended questions was
used to collect primary data. The closed ended questions were designed on a likert
scale of 5-6 items. Secondary data on how financial education affects MSE growth,
financial education efforts in place in Kakamega County was collected through
document analysis of government publications and reports, journal articles and
relevant industry reports. Individual MSE business records were also examined
where available to estimate the value of assets and sales volume. The mixed
approach allows for use of both deductive and inductive reasoning which helped the
researcher to build a broader picture by adding depth and insights to numbers (Cohen
et al., 2007; O’Leary, 2011).
35
3.6. Data collection Procedure
In collecting data, the researcher first obtained an introductory letter from the
Graduate school of Jomo Kenyatta University of Agriculture and Technology. The
researcher then sought permission from the Kakamega County director of trade to
allow the collection of data from MSEs in Kakamega Central Sub County and allow
access to business registration records from the county revenue department. The
researcher also pre-visited the study site to familiarize with the study area. After
obtaining the list of registered businesses sampling was done and questionnaires
administered to the selected respondents. The questionnaires were delivered on a
drop and pick basis by the researcher to increase the response rate as recommended
by Guthrie (2012).
3.7. Pilot Testing.
Good planning and development of research instruments is essential but not
sufficient. The only way to know if something is going to work is to give it a try(
O’leary, 2011). To ensure that the instruments are reliable and valid, a pilot study
involving thirty randomly selected respondents was carried out. Mugenda and
Mugenda(2003) recommends that a sample of 10% of the proposed sample size is
adequate for piloting. The respondents were drawn from MSEs at Lunza Market in
the neighboring Butere Sub County with characteristics similar to the target
population. The pilot study assisted the researcher in making the necessary
corrections on the instruments to ensure the questions were focused on the
objectives, accurate and consistent before carrying out the actual research.
3.8. Reliability of Research Instruments
Reliability is the degree of consistency, accuracy, stability and predictability of a
research instrument (Kumar, 2005). Kumar (2005) further asserts that a scale or test
is reliable to the extent that repeat measurements made by it under constant
conditions will give the same result. Internal consistency reliability of the research
instrument was measured using the Cronbach’s alpha which gave an overall alpha
value of α=0.944 for all the 23 items in the instrument. Reliability of the individual
scales was also computed which gave alpha values as shown in the table below.
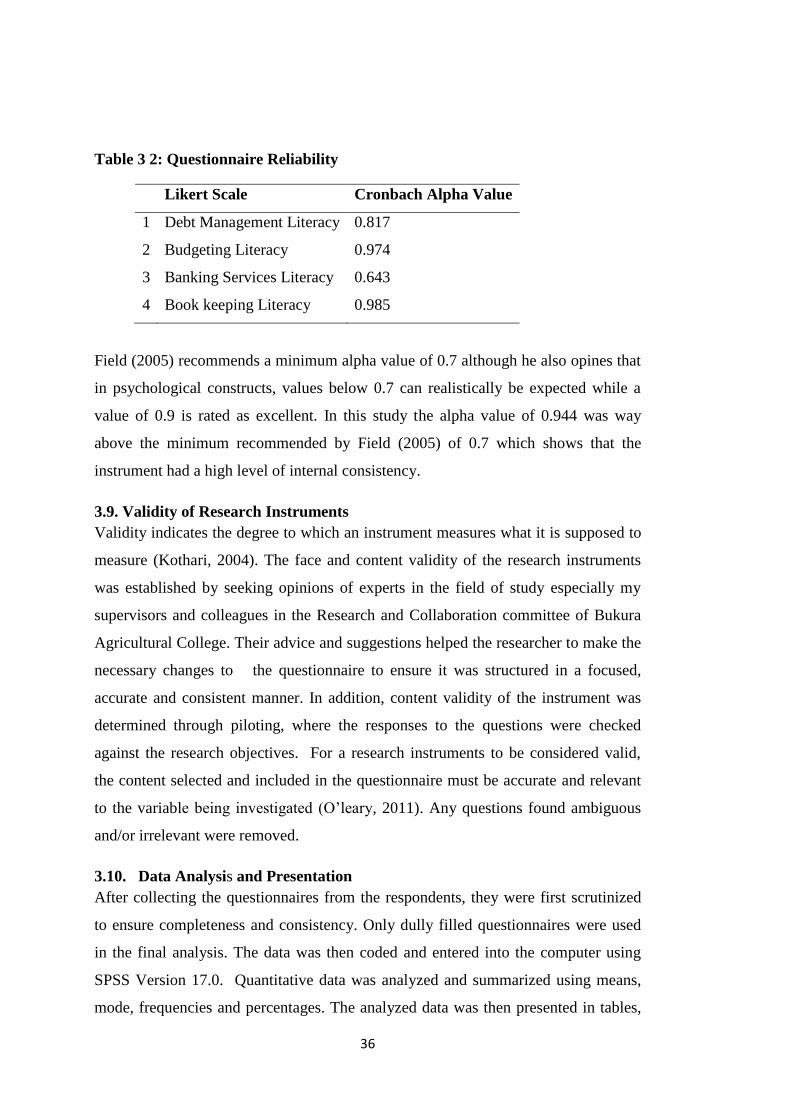
36
Table 3 2: Questionnaire Reliability
Likert Scale Cronbach Alpha Value
1 Debt Management Literacy 0.817
2 Budgeting Literacy 0.974
3 Banking Services Literacy 0.643
4 Book keeping Literacy 0.985
Field (2005) recommends a minimum alpha value of 0.7 although he also opines that
in psychological constructs, values below 0.7 can realistically be expected while a
value of 0.9 is rated as excellent. In this study the alpha value of 0.944 was way
above the minimum recommended by Field (2005) of 0.7 which shows that the
instrument had a high level of internal consistency.
3.9. Validity of Research Instruments
Validity indicates the degree to which an instrument measures what it is supposed to
measure (Kothari, 2004). The face and content validity of the research instruments
was established by seeking opinions of experts in the field of study especially my
supervisors and colleagues in the Research and Collaboration committee of Bukura
Agricultural College. Their advice and suggestions helped the researcher to make the
necessary changes to the questionnaire to ensure it was structured in a focused,
accurate and consistent manner. In addition, content validity of the instrument was
determined through piloting, where the responses to the questions were checked
against the research objectives. For a research instruments to be considered valid,
the content selected and included in the questionnaire must be accurate and relevant
to the variable being investigated (O’leary, 2011). Any questions found ambiguous
and/or irrelevant were removed.
3.10. Data Analysis and Presentation
After collecting the questionnaires from the respondents, they were first scrutinized
to ensure completeness and consistency. Only dully filled questionnaires were used
in the final analysis. The data was then coded and entered into the computer using
SPSS Version 17.0. Quantitative data was analyzed and summarized using means,
mode, frequencies and percentages. The analyzed data was then presented in tables,

37
bar graphs and pie charts from which statistical inferences as well as necessary
recommendations were made. Content analysis and tallying was used on qualitative
data. Chi square test of independence was used to determine the relationship between
financial literacy and the growth of MSEs while relationships between independent
and dependent variable was determined using cross tabulation (Kothari, 2005). The
tests were done at 95% level of significance.
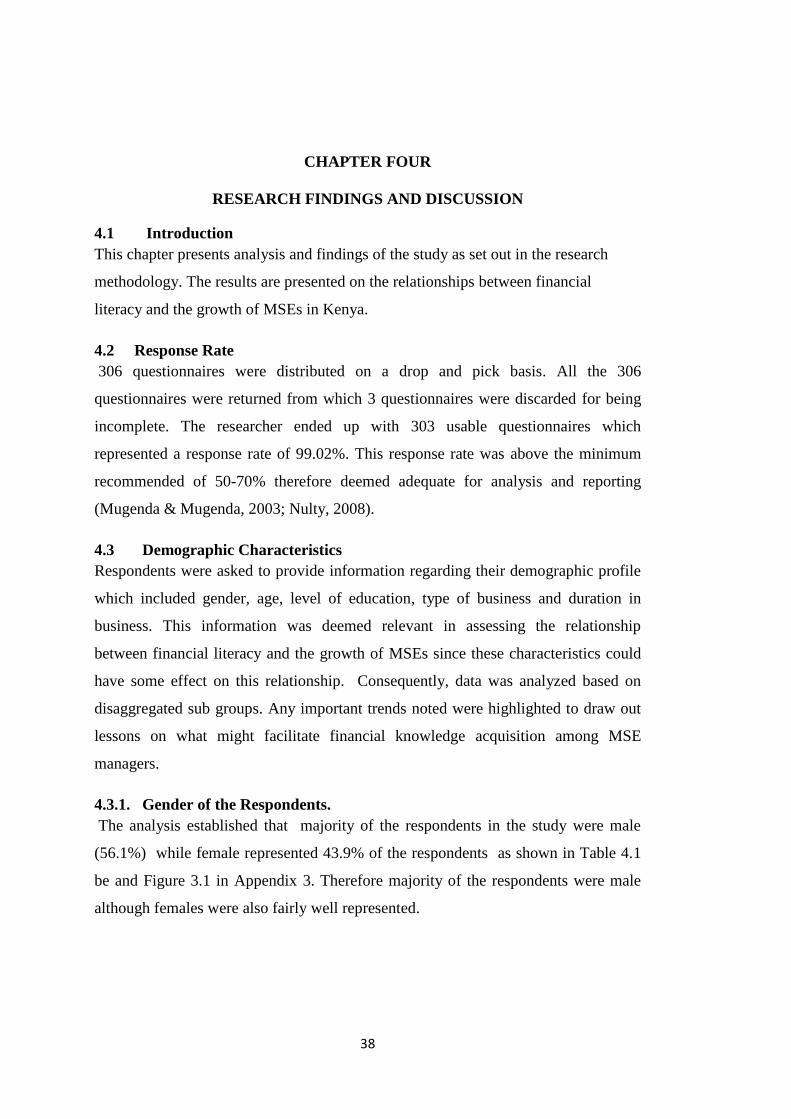
38
CHAPTER FOUR
RESEARCH FINDINGS AND DISCUSSION
4.1 Introduction
This chapter presents analysis and findings of the study as set out in the research
methodology. The results are presented on the relationships between financial
literacy and the growth of MSEs in Kenya.
4.2 Response Rate
306 questionnaires were distributed on a drop and pick basis. All the 306
questionnaires were returned from which 3 questionnaires were discarded for being
incomplete. The researcher ended up with 303 usable questionnaires which
represented a response rate of 99.02%. This response rate was above the minimum
recommended of 50-70% therefore deemed adequate for analysis and reporting
(Mugenda & Mugenda, 2003; Nulty, 2008).
4.3 Demographic Characteristics
Respondents were asked to provide information regarding their demographic profile
which included gender, age, level of education, type of business and duration in
business. This information was deemed relevant in assessing the relationship
between financial literacy and the growth of MSEs since these characteristics could
have some effect on this relationship. Consequently, data was analyzed based on
disaggregated sub groups. Any important trends noted were highlighted to draw out
lessons on what might facilitate financial knowledge acquisition among MSE
managers.
4.3.1. Gender of the Respondents.
The analysis established that majority of the respondents in the study were male
(56.1%) while female represented 43.9% of the respondents as shown in Table 4.1
be and Figure 3.1 in Appendix 3. Therefore majority of the respondents were male
although females were also fairly well represented.
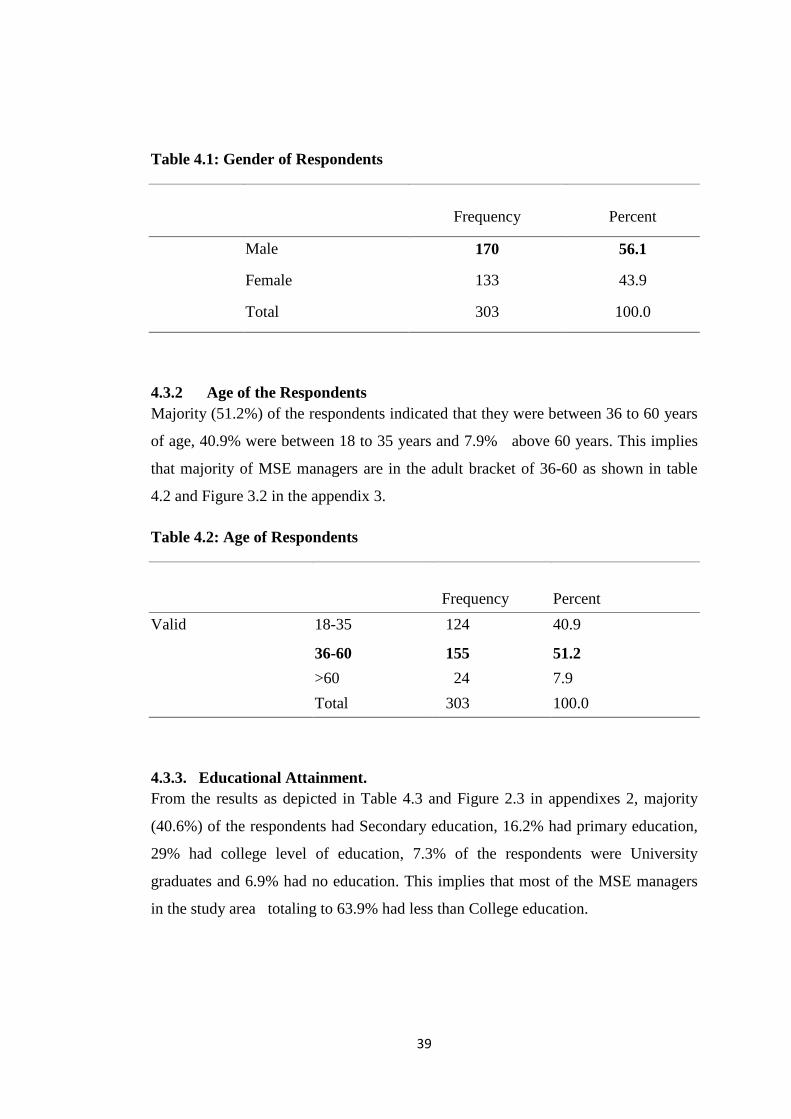
39
Table 4.1: Gender of Respondents
Frequency Percent
Male 170 56.1
Female 133 43.9
Total 303 100.0
4.3.2 Age of the Respondents
Majority (51.2%) of the respondents indicated that they were between 36 to 60 years
of age, 40.9% were between 18 to 35 years and 7.9% above 60 years. This implies
that majority of MSE managers are in the adult bracket of 36-60 as shown in table
4.2 and Figure 3.2 in the appendix 3.
Table 4.2: Age of Respondents
Frequency Percent
Valid
18-35 124 40.9
36-60 155 51.2
>60 24 7.9
Total 303 100.0
4.3.3. Educational Attainment.
From the results as depicted in Table 4.3 and Figure 2.3 in appendixes 2, majority
(40.6%) of the respondents had Secondary education, 16.2% had primary education,
29% had college level of education, 7.3% of the respondents were University
graduates and 6.9% had no education. This implies that most of the MSE managers
in the study area totaling to 63.9% had less than College education.
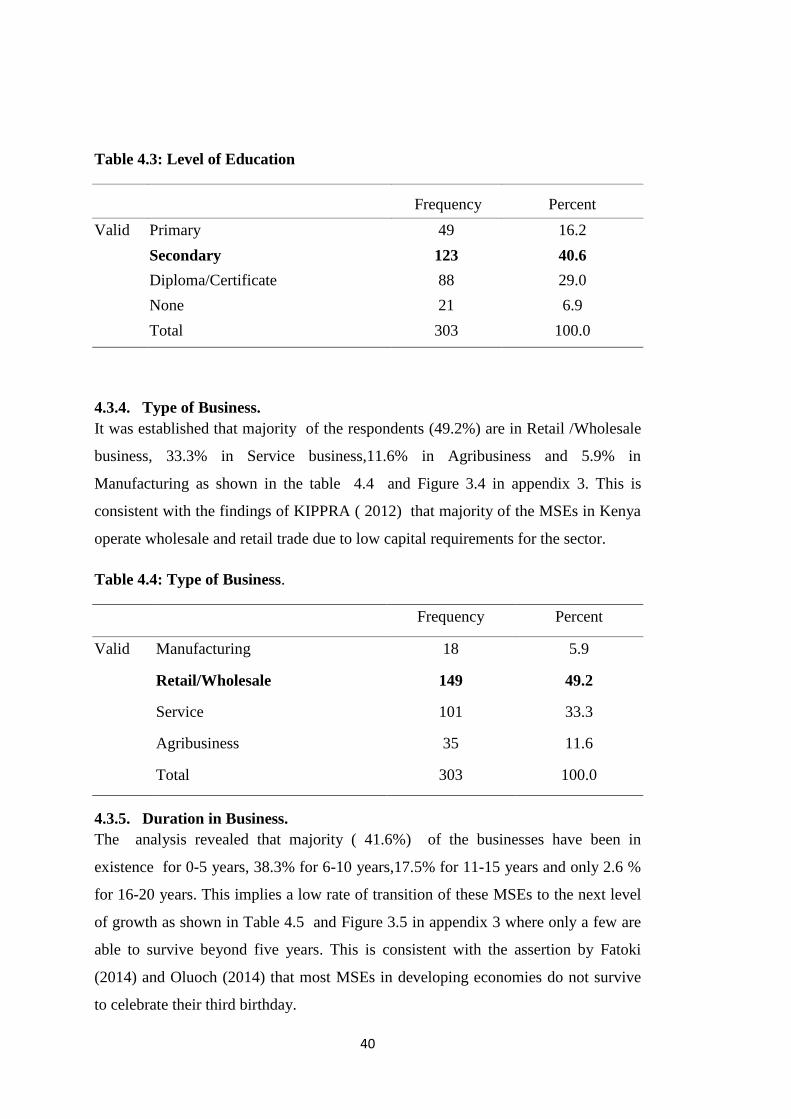
40
Table 4.3: Level of Education
Frequency Percent
Valid
Primary 49 16.2
Secondary 123 40.6
Diploma/Certificate 88 29.0
None 21 6.9
Total 303 100.0
4.3.4. Type of Business.
It was established that majority of the respondents (49.2%) are in Retail /Wholesale
business, 33.3% in Service business,11.6% in Agribusiness and 5.9% in
Manufacturing as shown in the table 4.4 and Figure 3.4 in appendix 3. This is
consistent with the findings of KIPPRA ( 2012) that majority of the MSEs in Kenya
operate wholesale and retail trade due to low capital requirements for the sector.
Table 4.4: Type of Business.
Frequency Percent
Valid Manufacturing 18 5.9
Retail/Wholesale 149 49.2
Service 101 33.3
Agribusiness 35 11.6
Total 303 100.0
4.3.5. Duration in Business.
The analysis revealed that majority ( 41.6%) of the businesses have been in
existence for 0-5 years, 38.3% for 6-10 years,17.5% for 11-15 years and only 2.6 %
for 16-20 years. This implies a low rate of transition of these MSEs to the next level
of growth as shown in Table 4.5 and Figure 3.5 in appendix 3 where only a few are
able to survive beyond five years. This is consistent with the assertion by Fatoki
(2014) and Oluoch (2014) that most MSEs in developing economies do not survive
to celebrate their third birthday.
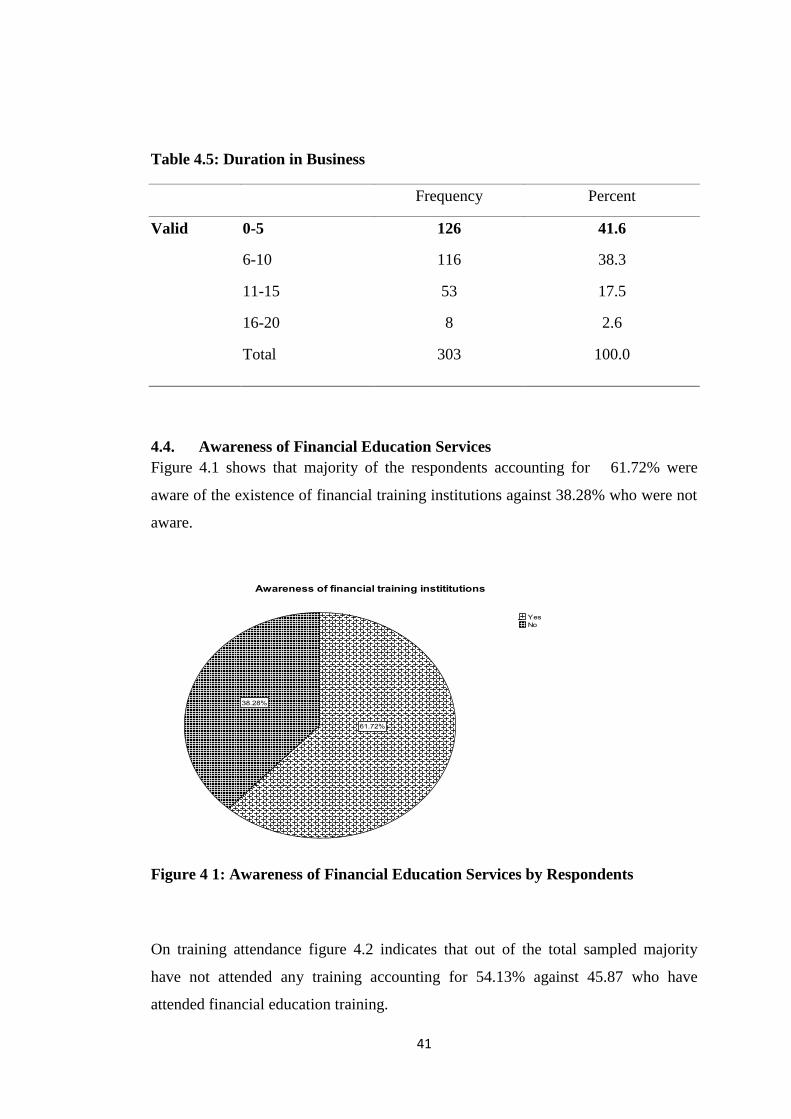
41
Table 4.5: Duration in Business
Frequency Percent
Valid
0-5 126 41.6
6-10 116 38.3
11-15 53 17.5
16-20 8 2.6
Total 303 100.0
4.4. Awareness of Financial Education Services
Figure 4.1 shows that majority of the respondents accounting for 61.72% were
aware of the existence of financial training institutions against 38.28% who were not
aware.
Figure 4 1: Awareness of Financial Education Services by Respondents
On training attendance figure 4.2 indicates that out of the total sampled majority
have not attended any training accounting for 54.13% against 45.87 who have
attended financial education training.
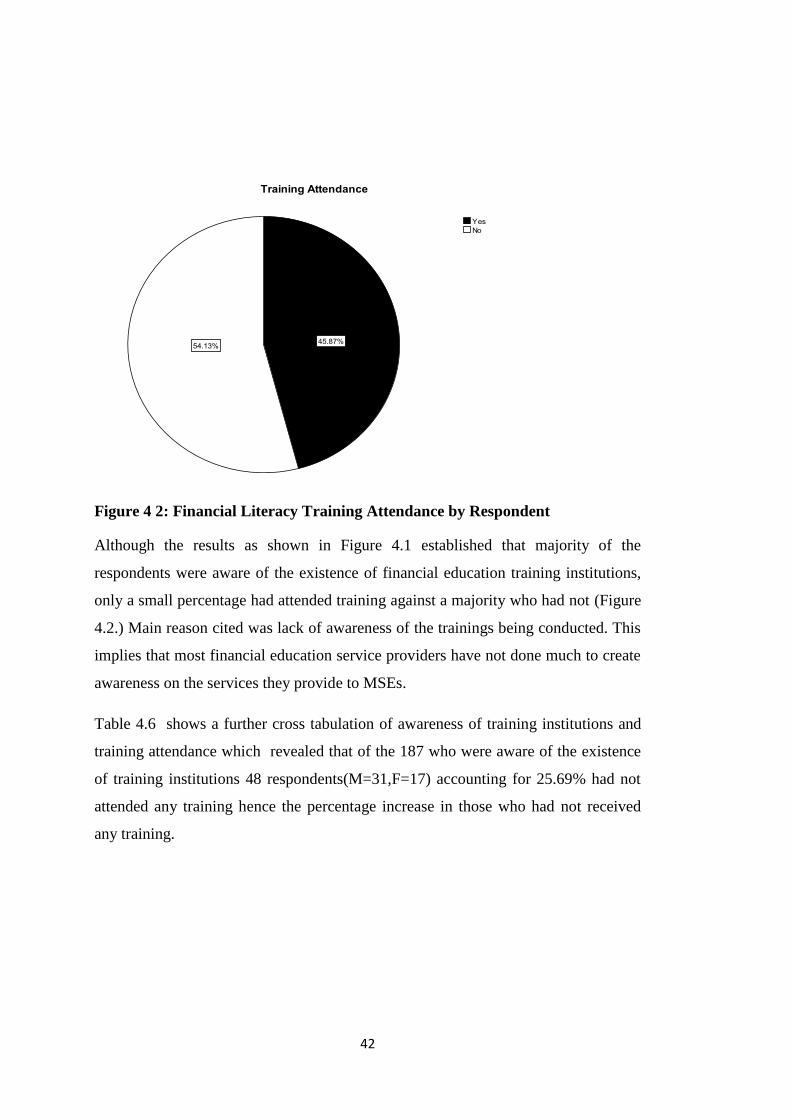
42
Figure 4 2: Financial Literacy Training Attendance by Respondent
Although the results as shown in Figure 4.1 established that majority of the
respondents were aware of the existence of financial education training institutions,
only a small percentage had attended training against a majority who had not (Figure
4.2.) Main reason cited was lack of awareness of the trainings being conducted. This
implies that most financial education service providers have not done much to create
awareness on the services they provide to MSEs.
Table 4.6 shows a further cross tabulation of awareness of training institutions and
training attendance which revealed that of the 187 who were aware of the existence
of training institutions 48 respondents(M=31,F=17) accounting for 25.69% had not
attended any training hence the percentage increase in those who had not received
any training.
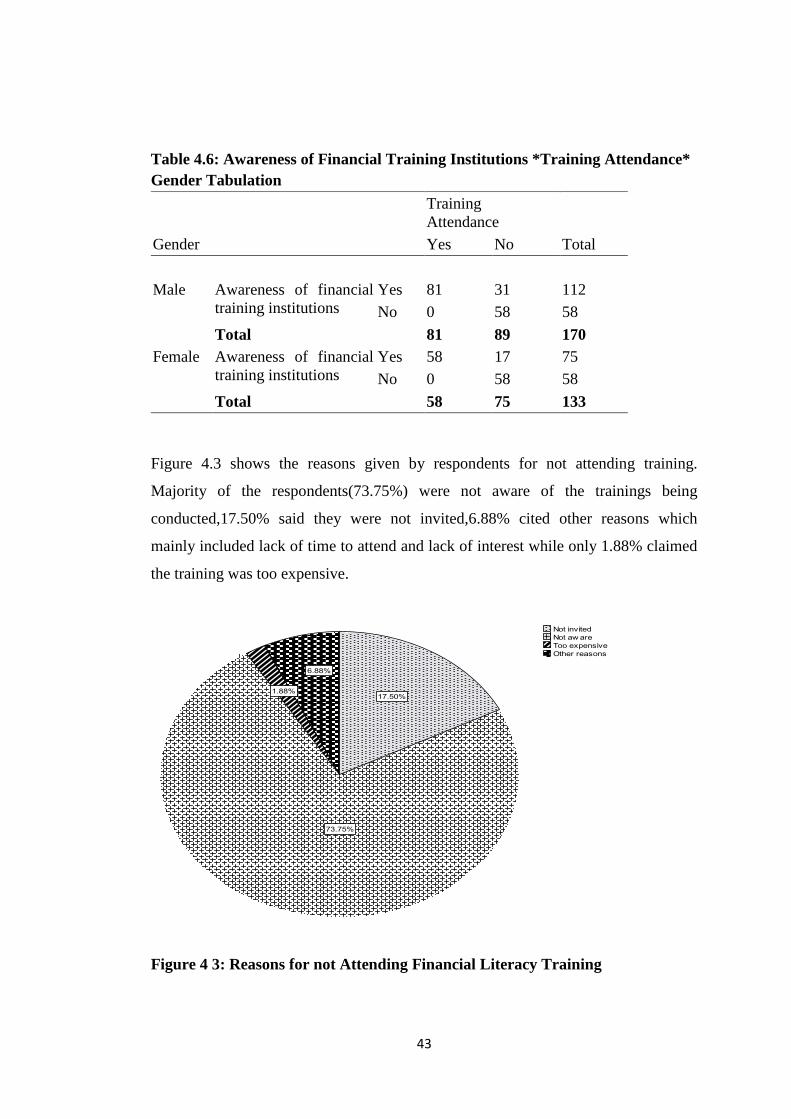
43
Table 4.6: Awareness of Financial Training Institutions *Training Attendance*
Gender Tabulation
Gender
Training
Attendance
Total Yes No
Male Awareness of financial
training institutions
Yes 81 31 112
No 0 58 58
Total 81 89 170
Female Awareness of financial
training institutions
Yes 58 17 75
No 0 58 58
Total 58 75 133
Figure 4.3 shows the reasons given by respondents for not attending training.
Majority of the respondents(73.75%) were not aware of the trainings being
conducted,17.50% said they were not invited,6.88% cited other reasons which
mainly included lack of time to attend and lack of interest while only 1.88% claimed
the training was too expensive.
Figure 4 3: Reasons for not Attending Financial Literacy Training
44
The study also asked respondents to list the organizations offering financial literacy
training in the Sub County. It was established that Faulu Micro finance and Equity
bank are the main institutions offering financial education in the Sub County as
shown in the Table 4.7.
Table 4.7: Financial Training Institutions in Kakamega County
Name of Organization Frequencies
1. Faulu Micro Finance 138
2. Equity Bank 136
3. Kenya Women Finance Trust 79
4. SMEP 59
5. Uwezo Fund 56
Whereas capacity building of MSEs is one of the main mandates of Government
agencies such as Women Enterprise Fund and Youth Enterprise Fund(ILO,2008), the
only agency mentioned was Uwezo fund which was ranked fifth which means that
these agencies have not done much on capacity building mandate. Moreover findings
reveal that most financial trainings were offered by financial institutions which were
ranked as the main service providers. These institutions offer training as a component
of their products and are mainly pre- financing trainings only accessible to those that
have qualified for loans (Mastercard, 2011).This limits access to financial education
by SME managers who may want to acquire financial knowledge but are not
interested in loans.
4.5. Financial Literacy of the Respondents
Financial literacy of the respondents was measured on four main sub scales namely;
debt literacy, budgeting literacy, banking services literacy and Book keeping literacy.
The scales were developed on a nominal and ordinal scaling and therefore the main
measure of central tendency used was the modal response as recommended by
O’Leary (2011) and Kothari (2004).
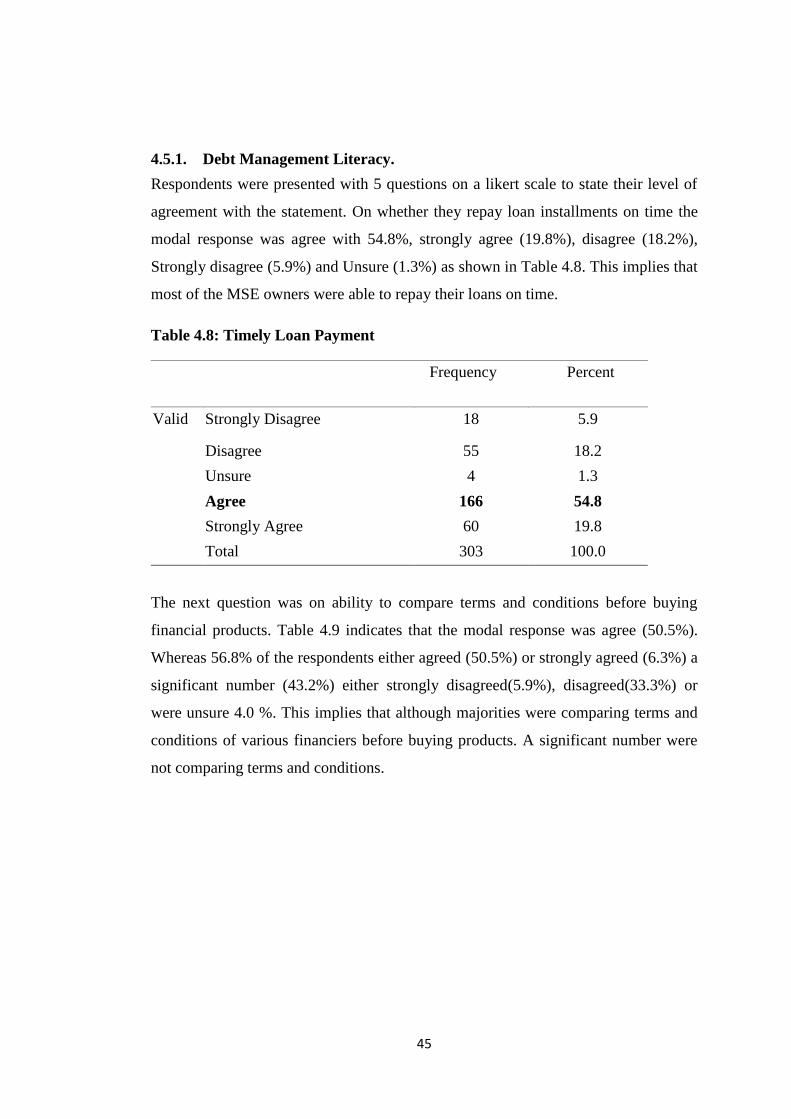
45
4.5.1. Debt Management Literacy.
Respondents were presented with 5 questions on a likert scale to state their level of
agreement with the statement. On whether they repay loan installments on time the
modal response was agree with 54.8%, strongly agree (19.8%), disagree (18.2%),
Strongly disagree (5.9%) and Unsure (1.3%) as shown in Table 4.8. This implies that
most of the MSE owners were able to repay their loans on time.
Table 4.8: Timely Loan Payment
Frequency Percent
Valid Strongly Disagree 18 5.9
Disagree 55 18.2
Unsure 4 1.3
Agree 166 54.8
Strongly Agree 60 19.8
Total 303 100.0
The next question was on ability to compare terms and conditions before buying
financial products. Table 4.9 indicates that the modal response was agree (50.5%).
Whereas 56.8% of the respondents either agreed (50.5%) or strongly agreed (6.3%) a
significant number (43.2%) either strongly disagreed(5.9%), disagreed(33.3%) or
were unsure 4.0 %. This implies that although majorities were comparing terms and
conditions of various financiers before buying products. A significant number were
not comparing terms and conditions.
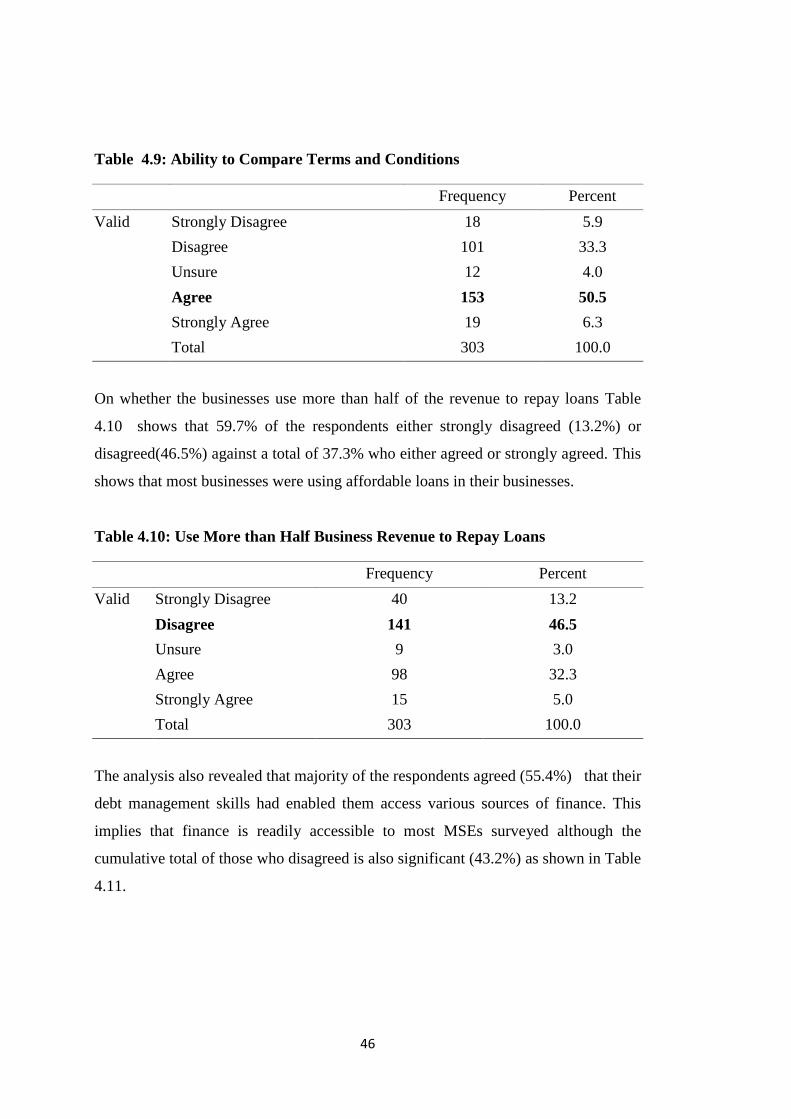
46
Table 4.9: Ability to Compare Terms and Conditions
Frequency Percent
Valid Strongly Disagree 18 5.9
Disagree 101 33.3
Unsure 12 4.0
Agree 153 50.5
Strongly Agree 19 6.3
Total 303 100.0
On whether the businesses use more than half of the revenue to repay loans Table
4.10 shows that 59.7% of the respondents either strongly disagreed (13.2%) or
disagreed(46.5%) against a total of 37.3% who either agreed or strongly agreed. This
shows that most businesses were using affordable loans in their businesses.
Table 4.10: Use More than Half Business Revenue to Repay Loans
Frequency Percent
Valid Strongly Disagree 40 13.2
Disagree 141 46.5
Unsure 9 3.0
Agree 98 32.3
Strongly Agree 15 5.0
Total 303 100.0
The analysis also revealed that majority of the respondents agreed (55.4%) that their
debt management skills had enabled them access various sources of finance. This
implies that finance is readily accessible to most MSEs surveyed although the
cumulative total of those who disagreed is also significant (43.2%) as shown in Table
4.11.
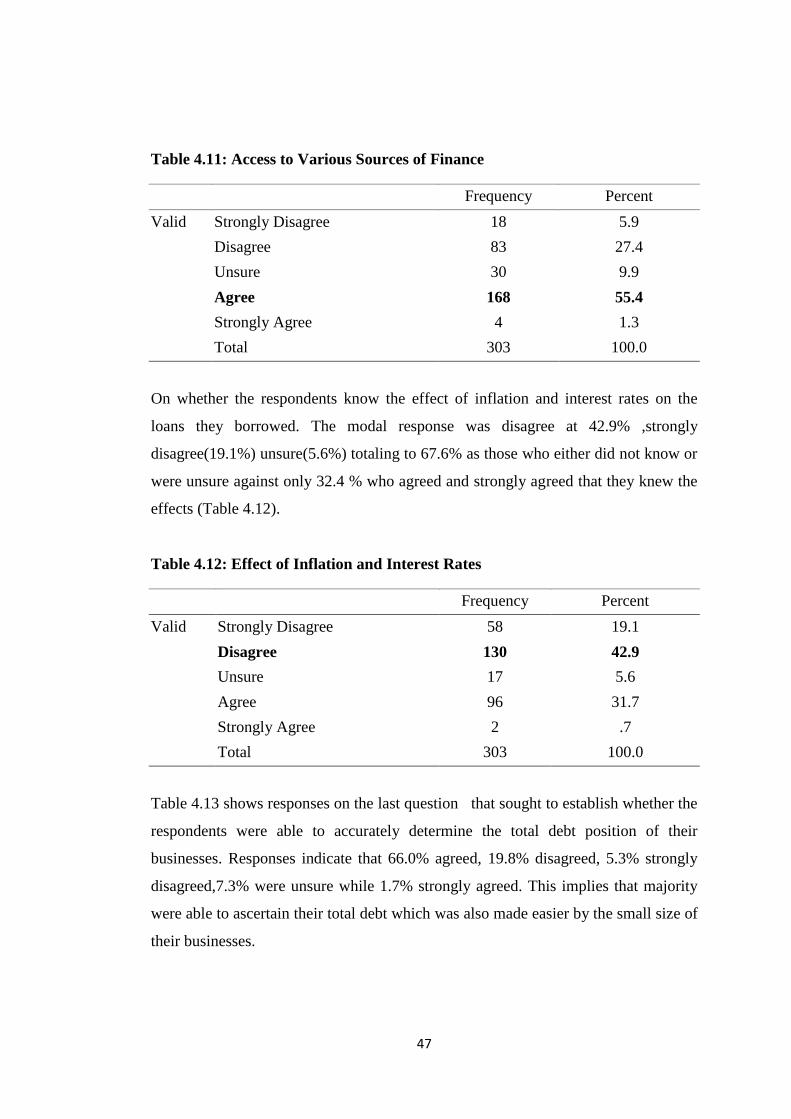
47
Table 4.11: Access to Various Sources of Finance
Frequency Percent
Valid Strongly Disagree 18 5.9
Disagree 83 27.4
Unsure 30 9.9
Agree 168 55.4
Strongly Agree 4 1.3
Total 303 100.0
On whether the respondents know the effect of inflation and interest rates on the
loans they borrowed. The modal response was disagree at 42.9% ,strongly
disagree(19.1%) unsure(5.6%) totaling to 67.6% as those who either did not know or
were unsure against only 32.4 % who agreed and strongly agreed that they knew the
effects (Table 4.12).
Table 4.12: Effect of Inflation and Interest Rates
Frequency Percent
Valid Strongly Disagree 58 19.1
Disagree 130 42.9
Unsure 17 5.6
Agree 96 31.7
Strongly Agree 2 .7
Total 303 100.0
Table 4.13 shows responses on the last question that sought to establish whether the
respondents were able to accurately determine the total debt position of their
businesses. Responses indicate that 66.0% agreed, 19.8% disagreed, 5.3% strongly
disagreed,7.3% were unsure while 1.7% strongly agreed. This implies that majority
were able to ascertain their total debt which was also made easier by the small size of
their businesses.
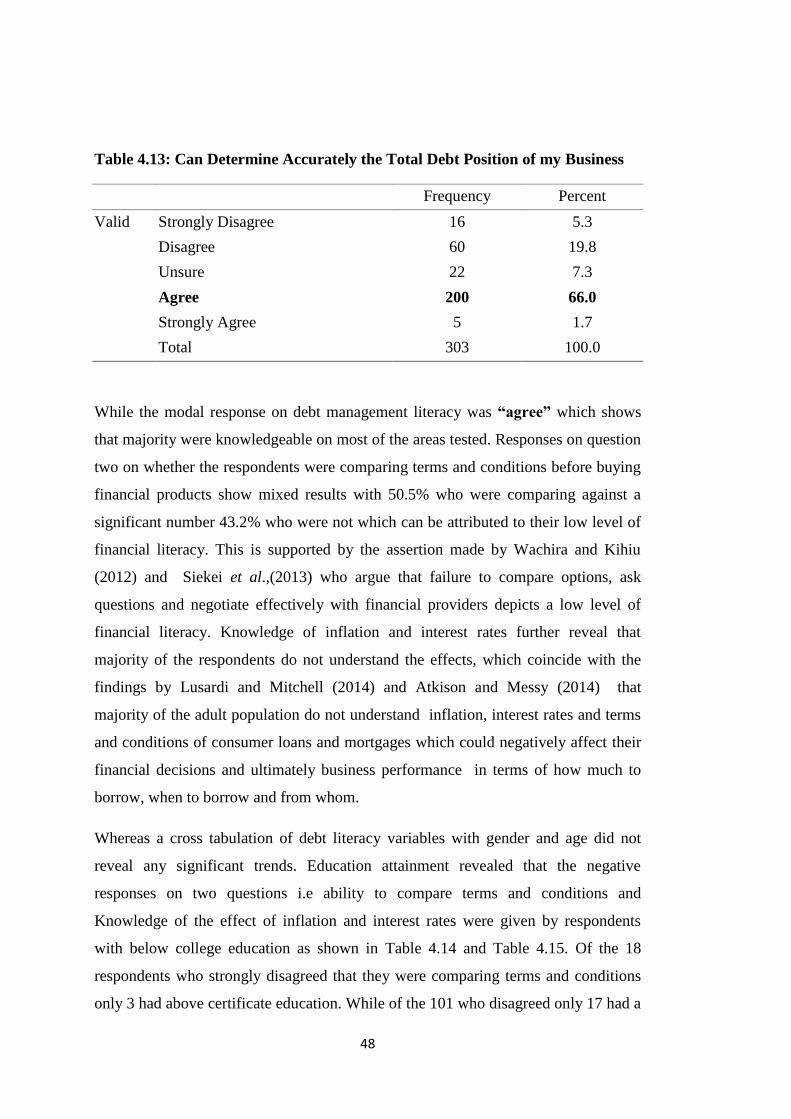
48
Table 4.13: Can Determine Accurately the Total Debt Position of my Business
Frequency Percent
Valid Strongly Disagree 16 5.3
Disagree 60 19.8
Unsure 22 7.3
Agree 200 66.0
Strongly Agree 5 1.7
Total 303 100.0
While the modal response on debt management literacy was “agree” which shows
that majority were knowledgeable on most of the areas tested. Responses on question
two on whether the respondents were comparing terms and conditions before buying
financial products show mixed results with 50.5% who were comparing against a
significant number 43.2% who were not which can be attributed to their low level of
financial literacy. This is supported by the assertion made by Wachira and Kihiu
(2012) and Siekei et al.,(2013) who argue that failure to compare options, ask
questions and negotiate effectively with financial providers depicts a low level of
financial literacy. Knowledge of inflation and interest rates further reveal that
majority of the respondents do not understand the effects, which coincide with the
findings by Lusardi and Mitchell (2014) and Atkison and Messy (2014) that
majority of the adult population do not understand inflation, interest rates and terms
and conditions of consumer loans and mortgages which could negatively affect their
financial decisions and ultimately business performance in terms of how much to
borrow, when to borrow and from whom.
Whereas a cross tabulation of debt literacy variables with gender and age did not
reveal any significant trends. Education attainment revealed that the negative
responses on two questions i.e ability to compare terms and conditions and
Knowledge of the effect of inflation and interest rates were given by respondents
with below college education as shown in Table 4.14 and Table 4.15. Of the 18
respondents who strongly disagreed that they were comparing terms and conditions
only 3 had above certificate education. While of the 101 who disagreed only 17 had a
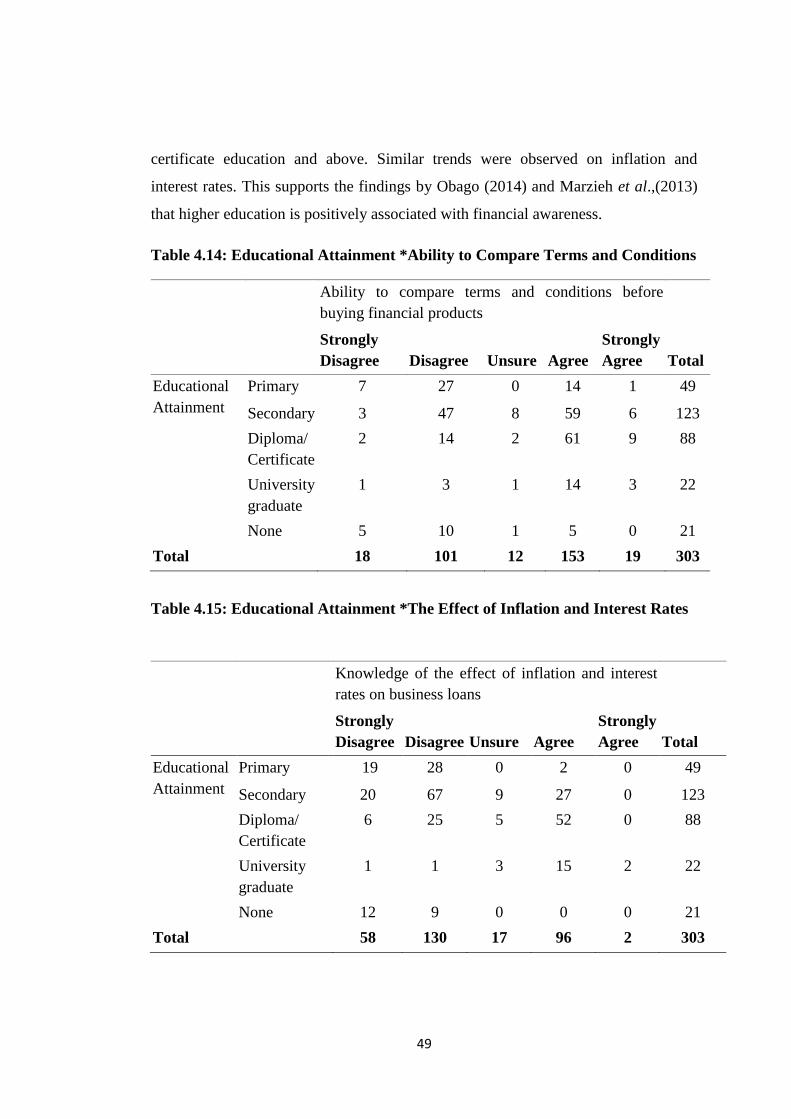
49
certificate education and above. Similar trends were observed on inflation and
interest rates. This supports the findings by Obago (2014) and Marzieh et al.,(2013)
that higher education is positively associated with financial awareness.
Table 4.14: Educational Attainment *Ability to Compare Terms and Conditions
Ability to compare terms and conditions before
buying financial products
Total
Strongly
Disagree Disagree Unsure Agree
Strongly
Agree
Educational
Attainment
Primary 7 27 0 14 1 49
Secondary 3 47 8 59 6 123
Diploma/
Certificate
2 14 2 61 9 88
University
graduate
1 3 1 14 3 22
None 5 10 1 5 0 21
Total 18 101 12 153 19 303
Table 4.15: Educational Attainment *The Effect of Inflation and Interest Rates
Knowledge of the effect of inflation and interest
rates on business loans
Total
Strongly
Disagree Disagree Unsure Agree
Strongly
Agree
Educational
Attainment
Primary 19 28 0 2 0 49
Secondary 20 67 9 27 0 123
Diploma/
Certificate
6 25 5 52 0 88
University
graduate
1 1 3 15 2 22
None 12 9 0 0 0 21
Total 58 130 17 96 2 303
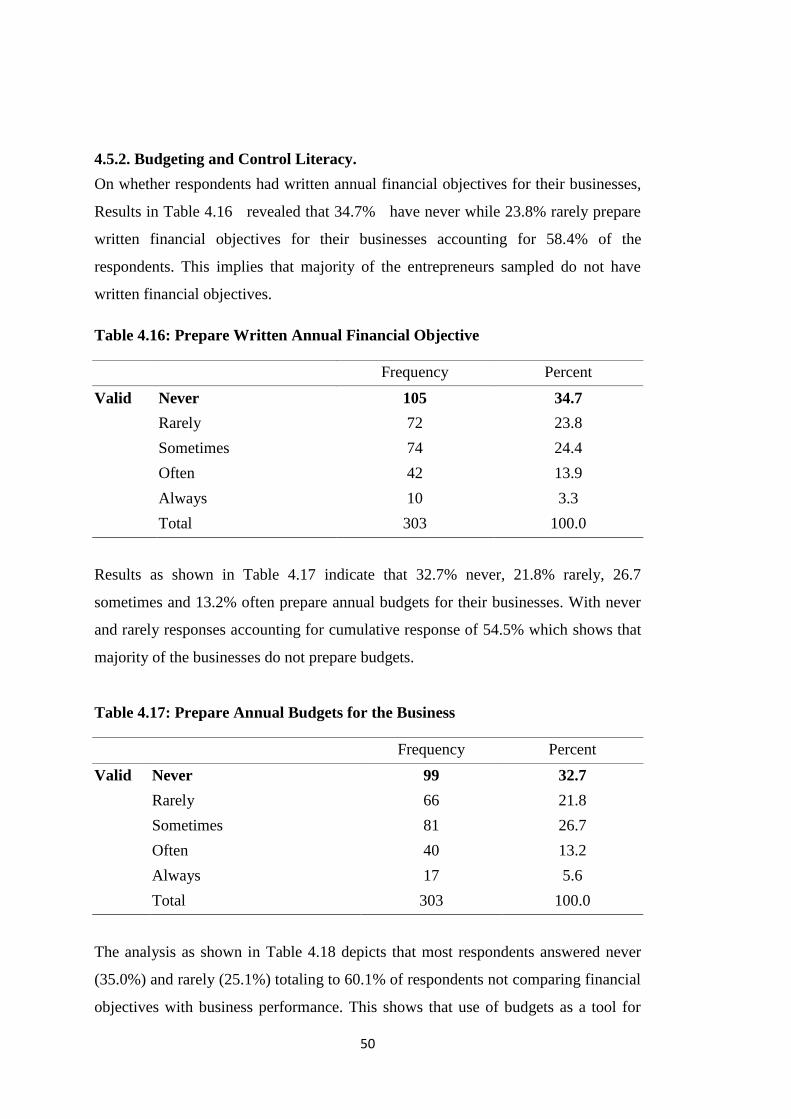
50
4.5.2. Budgeting and Control Literacy.
On whether respondents had written annual financial objectives for their businesses,
Results in Table 4.16 revealed that 34.7% have never while 23.8% rarely prepare
written financial objectives for their businesses accounting for 58.4% of the
respondents. This implies that majority of the entrepreneurs sampled do not have
written financial objectives.
Table 4.16: Prepare Written Annual Financial Objective
Frequency Percent
Valid Never 105 34.7
Rarely 72 23.8
Sometimes 74 24.4
Often 42 13.9
Always 10 3.3
Total 303 100.0
Results as shown in Table 4.17 indicate that 32.7% never, 21.8% rarely, 26.7
sometimes and 13.2% often prepare annual budgets for their businesses. With never
and rarely responses accounting for cumulative response of 54.5% which shows that
majority of the businesses do not prepare budgets.
Table 4.17: Prepare Annual Budgets for the Business
Frequency Percent
Valid Never 99 32.7
Rarely 66 21.8
Sometimes 81 26.7
Often 40 13.2
Always 17 5.6
Total 303 100.0
The analysis as shown in Table 4.18 depicts that most respondents answered never
(35.0%) and rarely (25.1%) totaling to 60.1% of respondents not comparing financial
objectives with business performance. This shows that use of budgets as a tool for
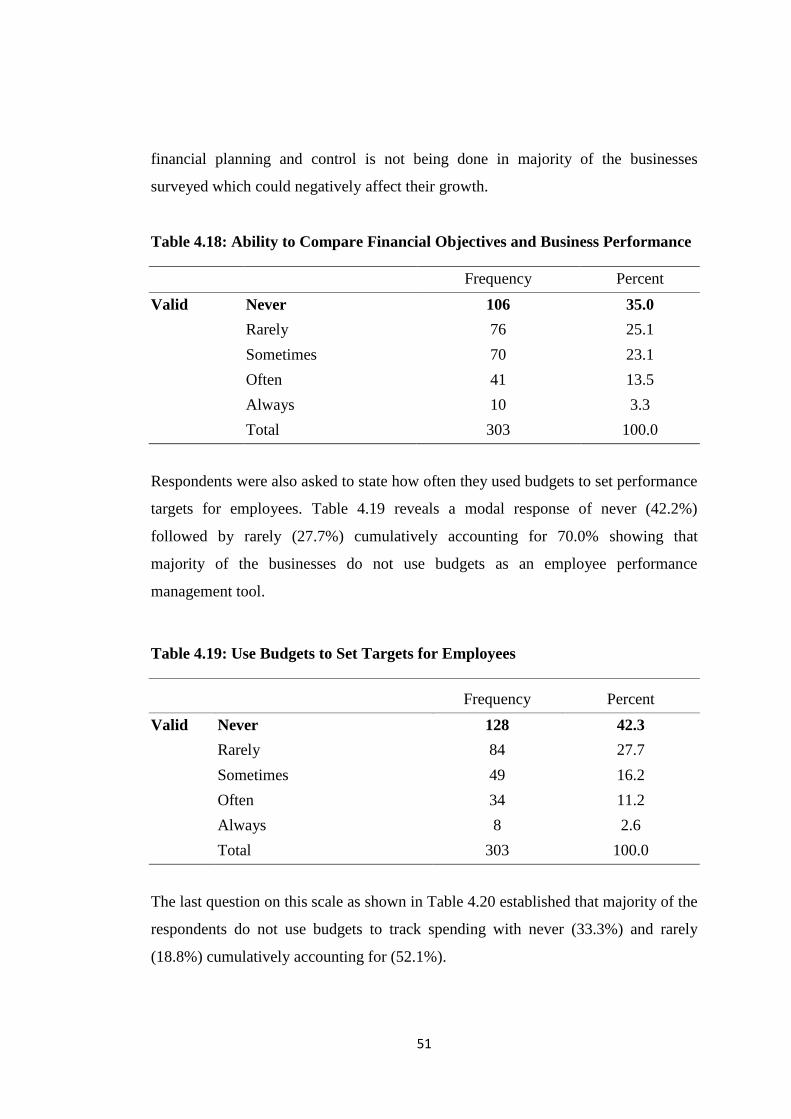
51
financial planning and control is not being done in majority of the businesses
surveyed which could negatively affect their growth.
Table 4.18: Ability to Compare Financial Objectives and Business Performance
Frequency Percent
Valid Never 106 35.0
Rarely 76 25.1
Sometimes 70 23.1
Often 41 13.5
Always 10 3.3
Total 303 100.0
Respondents were also asked to state how often they used budgets to set performance
targets for employees. Table 4.19 reveals a modal response of never (42.2%)
followed by rarely (27.7%) cumulatively accounting for 70.0% showing that
majority of the businesses do not use budgets as an employee performance
management tool.
Table 4.19: Use Budgets to Set Targets for Employees
Frequency Percent
Valid Never 128 42.3
Rarely 84 27.7
Sometimes 49 16.2
Often 34 11.2
Always 8 2.6
Total 303 100.0
The last question on this scale as shown in Table 4.20 established that majority of the
respondents do not use budgets to track spending with never (33.3%) and rarely
(18.8%) cumulatively accounting for (52.1%).
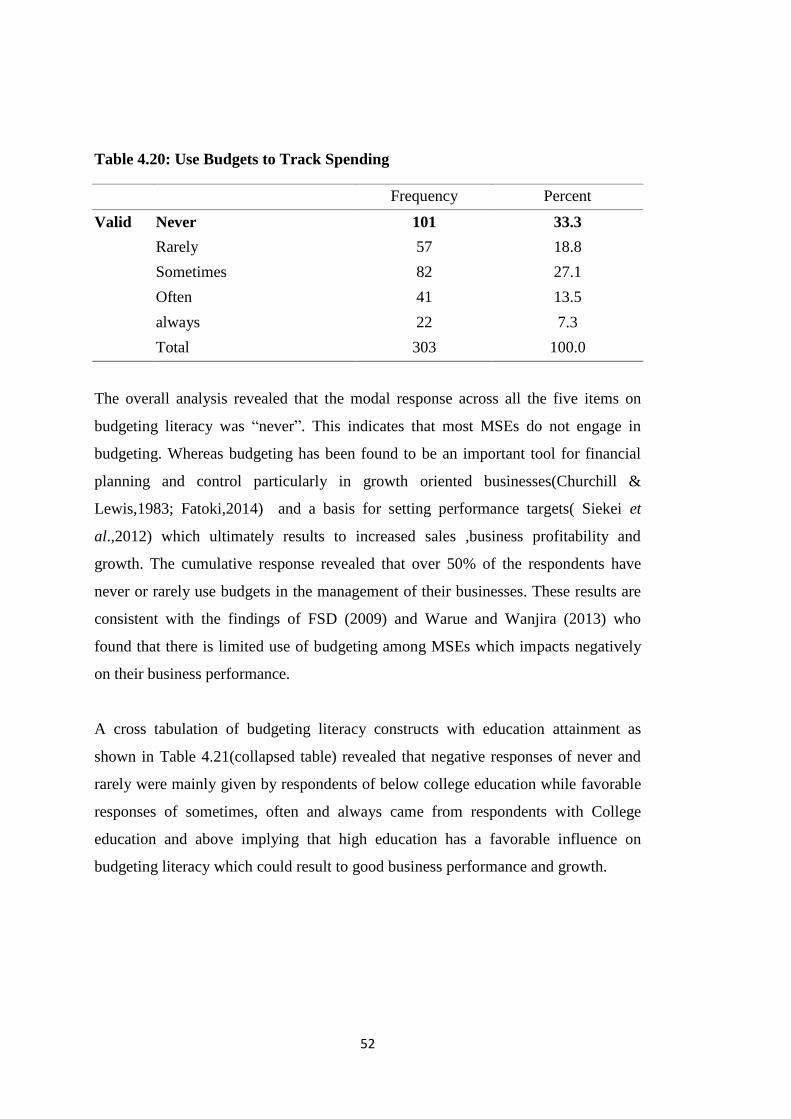
52
Table 4.20: Use Budgets to Track Spending
Frequency Percent
Valid Never 101 33.3
Rarely 57 18.8
Sometimes 82 27.1
Often 41 13.5
always 22 7.3
Total 303 100.0
The overall analysis revealed that the modal response across all the five items on
budgeting literacy was “never”. This indicates that most MSEs do not engage in
budgeting. Whereas budgeting has been found to be an important tool for financial
planning and control particularly in growth oriented businesses(Churchill &
Lewis,1983; Fatoki,2014) and a basis for setting performance targets( Siekei et
al.,2012) which ultimately results to increased sales ,business profitability and
growth. The cumulative response revealed that over 50% of the respondents have
never or rarely use budgets in the management of their businesses. These results are
consistent with the findings of FSD (2009) and Warue and Wanjira (2013) who
found that there is limited use of budgeting among MSEs which impacts negatively
on their business performance.
A cross tabulation of budgeting literacy constructs with education attainment as
shown in Table 4.21(collapsed table) revealed that negative responses of never and
rarely were mainly given by respondents of below college education while favorable
responses of sometimes, often and always came from respondents with College
education and above implying that high education has a favorable influence on
budgeting literacy which could result to good business performance and growth.
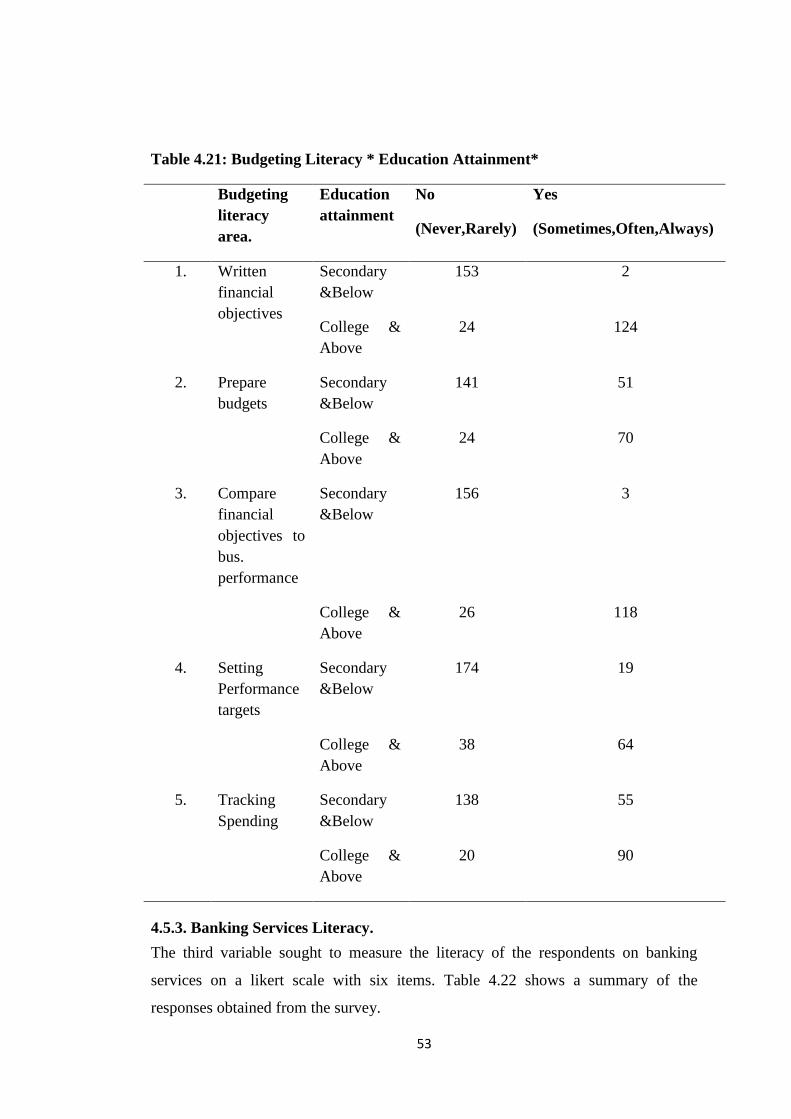
53
Table 4.21: Budgeting Literacy * Education Attainment*
Budgeting
literacy
area.
Education
attainment
No
(Never,Rarely)
Yes
(Sometimes,Often,Always)
1.
Written
financial
objectives
Secondary
&Below
153 2
College &
Above
24 124
2. Prepare
budgets
Secondary
&Below
141 51
College &
Above
24 70
3. Compare
financial
objectives to
bus.
performance
Secondary
&Below
156 3
College &
Above
26 118
4. Setting
Performance
targets
Secondary
&Below
174 19
College &
Above
38 64
5. Tracking
Spending
Secondary
&Below
138 55
College &
Above
20 90
4.5.3. Banking Services Literacy.
The third variable sought to measure the literacy of the respondents on banking
services on a likert scale with six items. Table 4.22 shows a summary of the
responses obtained from the survey.
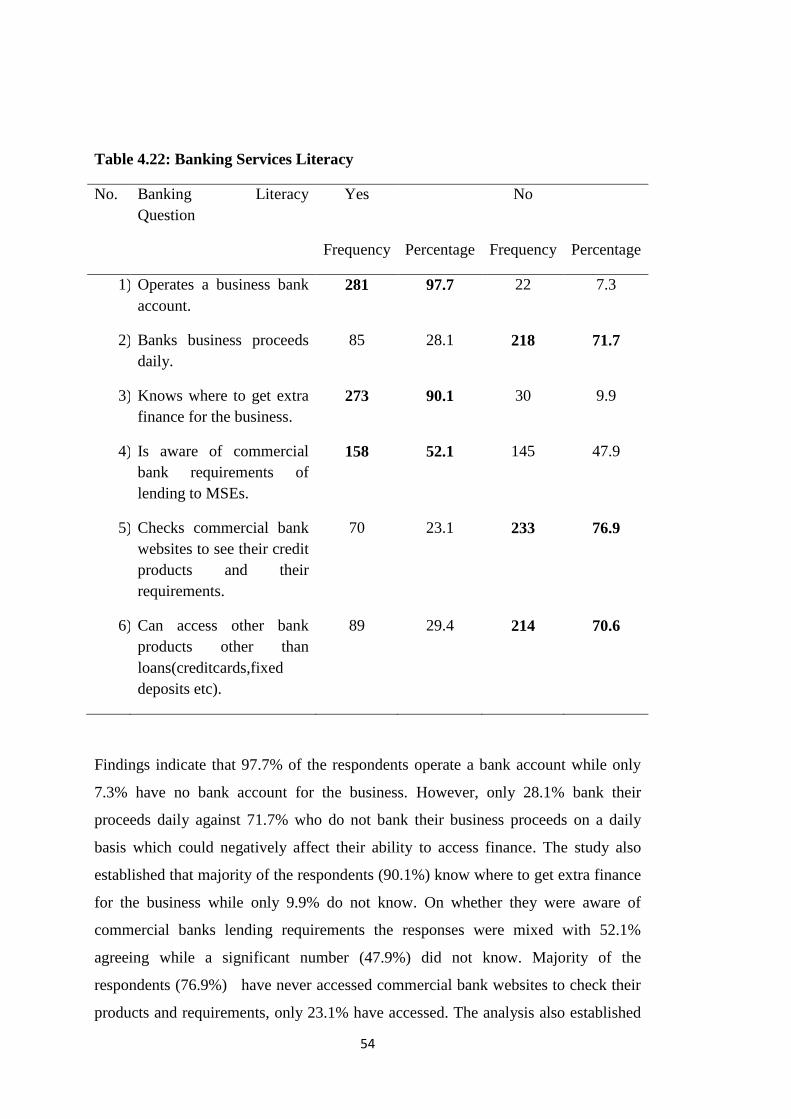
54
Table 4.22: Banking Services Literacy
No. Banking Literacy
Question
Yes No
Frequency Percentage Frequency Percentage
1) Operates a business bank
account.
281 97.7 22 7.3
2) Banks business proceeds
daily.
85 28.1 218 71.7
3) Knows where to get extra
finance for the business.
273 90.1 30 9.9
4) Is aware of commercial
bank requirements of
lending to MSEs.
158 52.1 145 47.9
5) Checks commercial bank
websites to see their credit
products and their
requirements.
70 23.1 233 76.9
6) Can access other bank
products other than
loans(creditcards,fixed
deposits etc).
89 29.4 214 70.6
Findings indicate that 97.7% of the respondents operate a bank account while only
7.3% have no bank account for the business. However, only 28.1% bank their
proceeds daily against 71.7% who do not bank their business proceeds on a daily
basis which could negatively affect their ability to access finance. The study also
established that majority of the respondents (90.1%) know where to get extra finance
for the business while only 9.9% do not know. On whether they were aware of
commercial banks lending requirements the responses were mixed with 52.1%
agreeing while a significant number (47.9%) did not know. Majority of the
respondents (76.9%) have never accessed commercial bank websites to check their
products and requirements, only 23.1% have accessed. The analysis also established
55
that only 29.4% of the respondents are able to access other bank products for their
businesses other than loans while 70.6 % of the respondents are not able.
The overall analysis on banking services reveals that MSE managers surveyed
generally portrayed a fair knowledge of banking services literacy. However, although
majority operated bank accounts for their businesses, very few MSEs bank their
proceeds on a daily basis which could affect their credit scoring hence ability to
access business loans. Low activity on a savings account reduces the internal data
available for credit scoring making banks to rely on external information from
credit reference bureaus which limits the maximum loan available to such a
client(Berger & Udell,2005;FSD,2009; Mills & McCarthy, 2014). While use of
information technology can significantly reduce the search costs for information, use
of bank websites was found to be limited. Most MSEs have not taken advantage of
commercial bank websites to check and compare product offers and their terms and
conditions. Moreover only 29.4 % are able to access other bank products other than
loans which imply that MSEs are still constraint in accessing banking services.
4.5.4 Book Keeping Literacy.
Results further revealed that majority of the respondents had no knowledge and
skills on all the book keeping skills tested. Specifically, on whether the respondents
were able to prepare financial statements accurately 31.4% had no knowledge and
skills, 23.4% unsatisfactory knowledge, 25.4% satisfactory knowledge while 18.8%
had good and excellent knowledge as shown in Table 4.23.
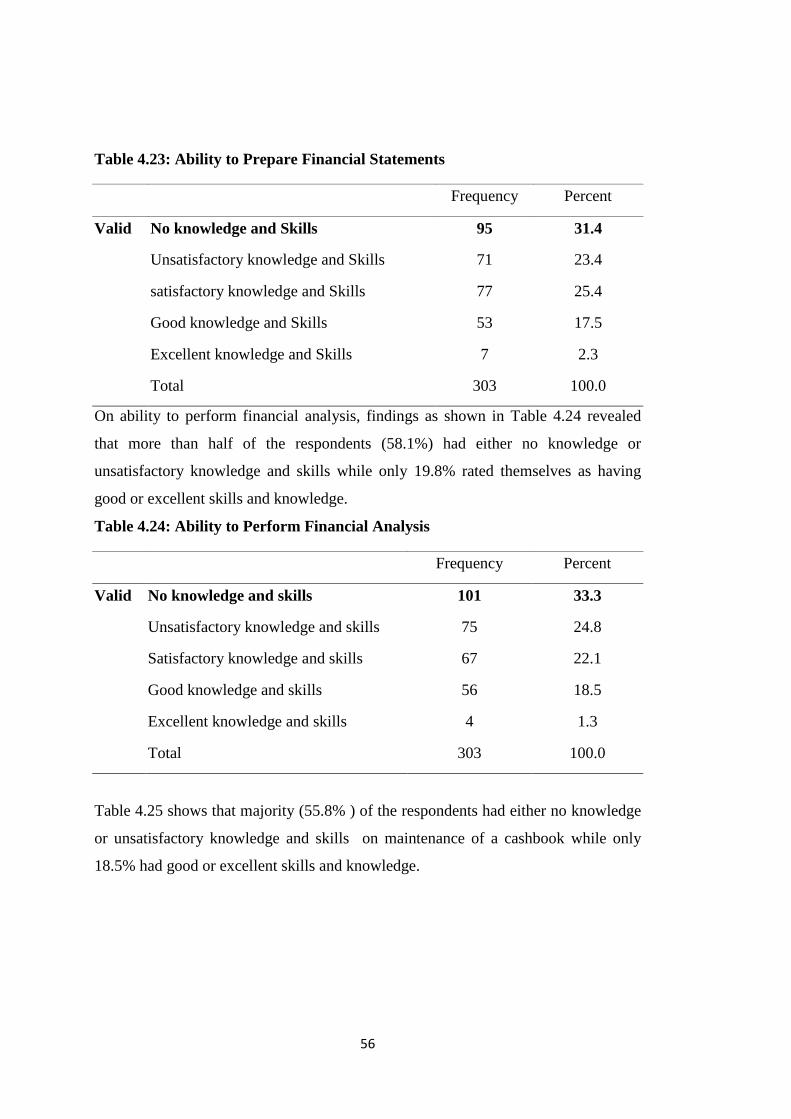
56
Table 4.23: Ability to Prepare Financial Statements
Frequency Percent
Valid No knowledge and Skills 95 31.4
Unsatisfactory knowledge and Skills 71 23.4
satisfactory knowledge and Skills 77 25.4
Good knowledge and Skills 53 17.5
Excellent knowledge and Skills 7 2.3
Total 303 100.0
On ability to perform financial analysis, findings as shown in Table 4.24 revealed
that more than half of the respondents (58.1%) had either no knowledge or
unsatisfactory knowledge and skills while only 19.8% rated themselves as having
good or excellent skills and knowledge.
Table 4.24: Ability to Perform Financial Analysis
Frequency Percent
Valid No knowledge and skills 101 33.3
Unsatisfactory knowledge and skills 75 24.8
Satisfactory knowledge and skills 67 22.1
Good knowledge and skills 56 18.5
Excellent knowledge and skills 4 1.3
Total 303 100.0
Table 4.25 shows that majority (55.8% ) of the respondents had either no knowledge
or unsatisfactory knowledge and skills on maintenance of a cashbook while only
18.5% had good or excellent skills and knowledge.
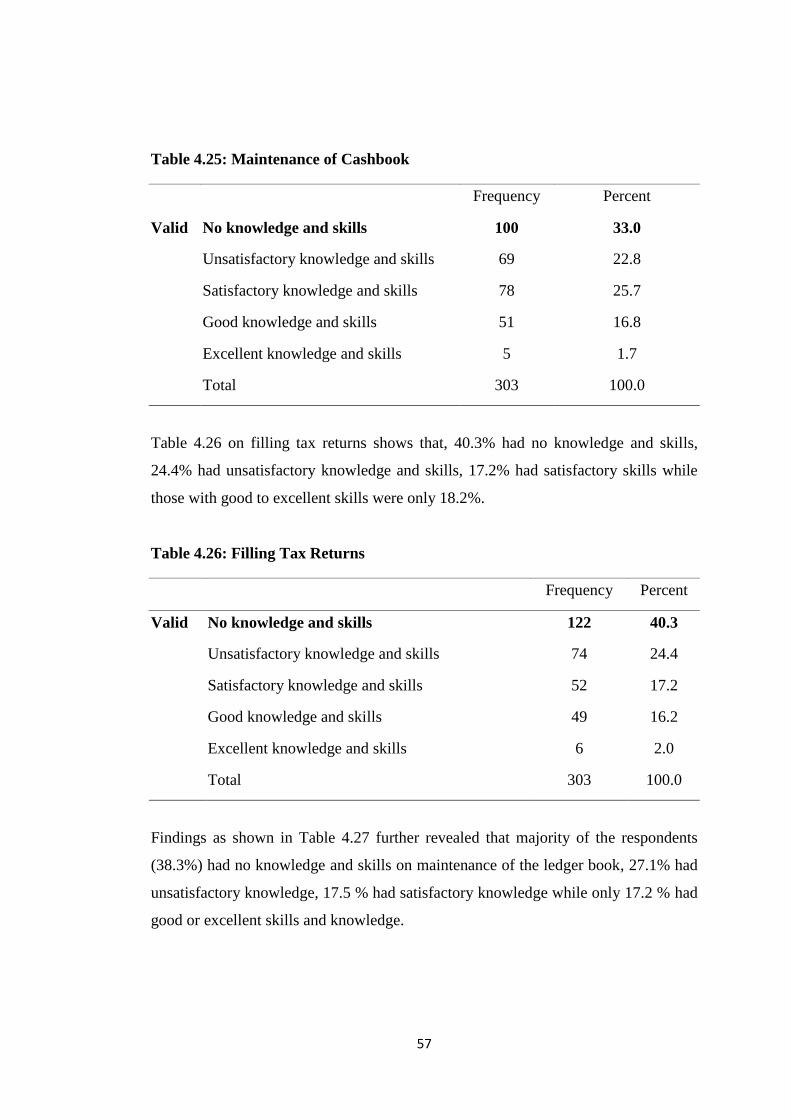
57
Table 4.25: Maintenance of Cashbook
Frequency Percent
Valid No knowledge and skills 100 33.0
Unsatisfactory knowledge and skills 69 22.8
Satisfactory knowledge and skills 78 25.7
Good knowledge and skills 51 16.8
Excellent knowledge and skills 5 1.7
Total 303 100.0
Table 4.26 on filling tax returns shows that, 40.3% had no knowledge and skills,
24.4% had unsatisfactory knowledge and skills, 17.2% had satisfactory skills while
those with good to excellent skills were only 18.2%.
Table 4.26: Filling Tax Returns
Frequency Percent
Valid No knowledge and skills 122 40.3
Unsatisfactory knowledge and skills 74 24.4
Satisfactory knowledge and skills 52 17.2
Good knowledge and skills 49 16.2
Excellent knowledge and skills 6 2.0
Total 303 100.0
Findings as shown in Table 4.27 further revealed that majority of the respondents
(38.3%) had no knowledge and skills on maintenance of the ledger book, 27.1% had
unsatisfactory knowledge, 17.5 % had satisfactory knowledge while only 17.2 % had
good or excellent skills and knowledge.
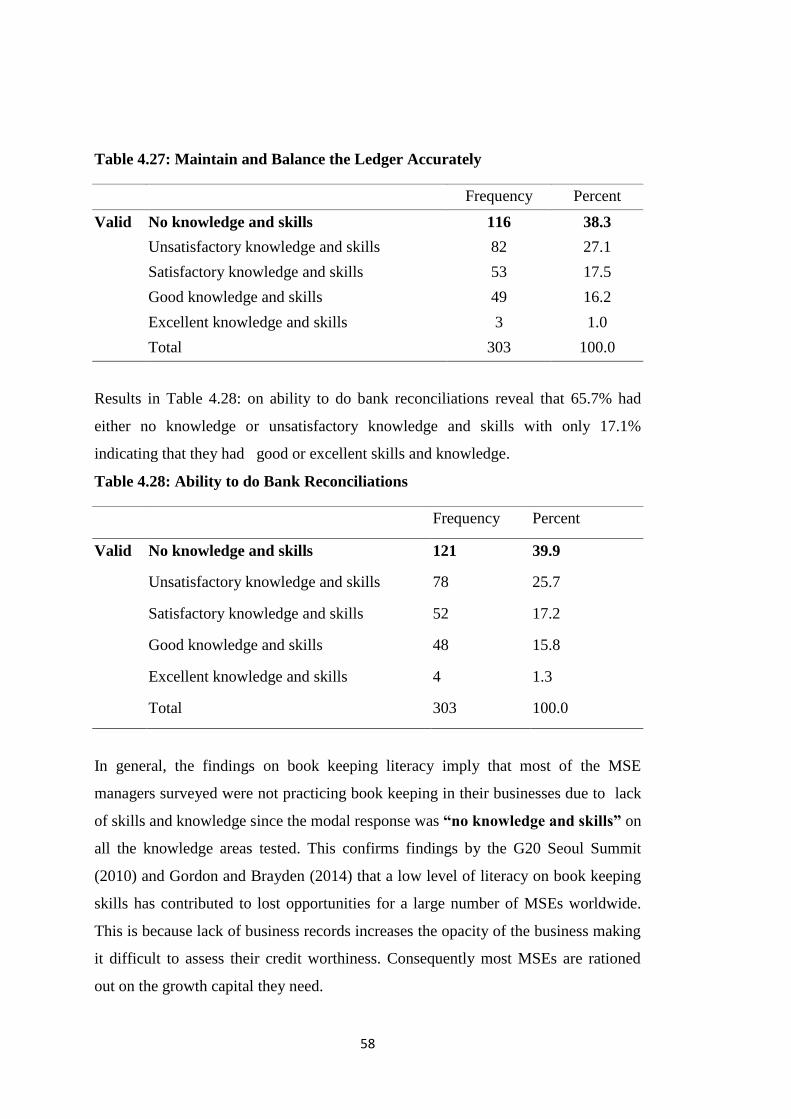
58
Table 4.27: Maintain and Balance the Ledger Accurately
Frequency Percent
Valid No knowledge and skills 116 38.3
Unsatisfactory knowledge and skills 82 27.1
Satisfactory knowledge and skills 53 17.5
Good knowledge and skills 49 16.2
Excellent knowledge and skills 3 1.0
Total 303 100.0
Results in Table 4.28: on ability to do bank reconciliations reveal that 65.7% had
either no knowledge or unsatisfactory knowledge and skills with only 17.1%
indicating that they had good or excellent skills and knowledge.
Table 4.28: Ability to do Bank Reconciliations
Frequency Percent
Valid No knowledge and skills 121 39.9
Unsatisfactory knowledge and skills 78 25.7
Satisfactory knowledge and skills 52 17.2
Good knowledge and skills 48 15.8
Excellent knowledge and skills 4 1.3
Total 303 100.0
In general, the findings on book keeping literacy imply that most of the MSE
managers surveyed were not practicing book keeping in their businesses due to lack
of skills and knowledge since the modal response was “no knowledge and skills” on
all the knowledge areas tested. This confirms findings by the G20 Seoul Summit
(2010) and Gordon and Brayden (2014) that a low level of literacy on book keeping
skills has contributed to lost opportunities for a large number of MSEs worldwide.
This is because lack of business records increases the opacity of the business making
it difficult to assess their credit worthiness. Consequently most MSEs are rationed
out on the growth capital they need.
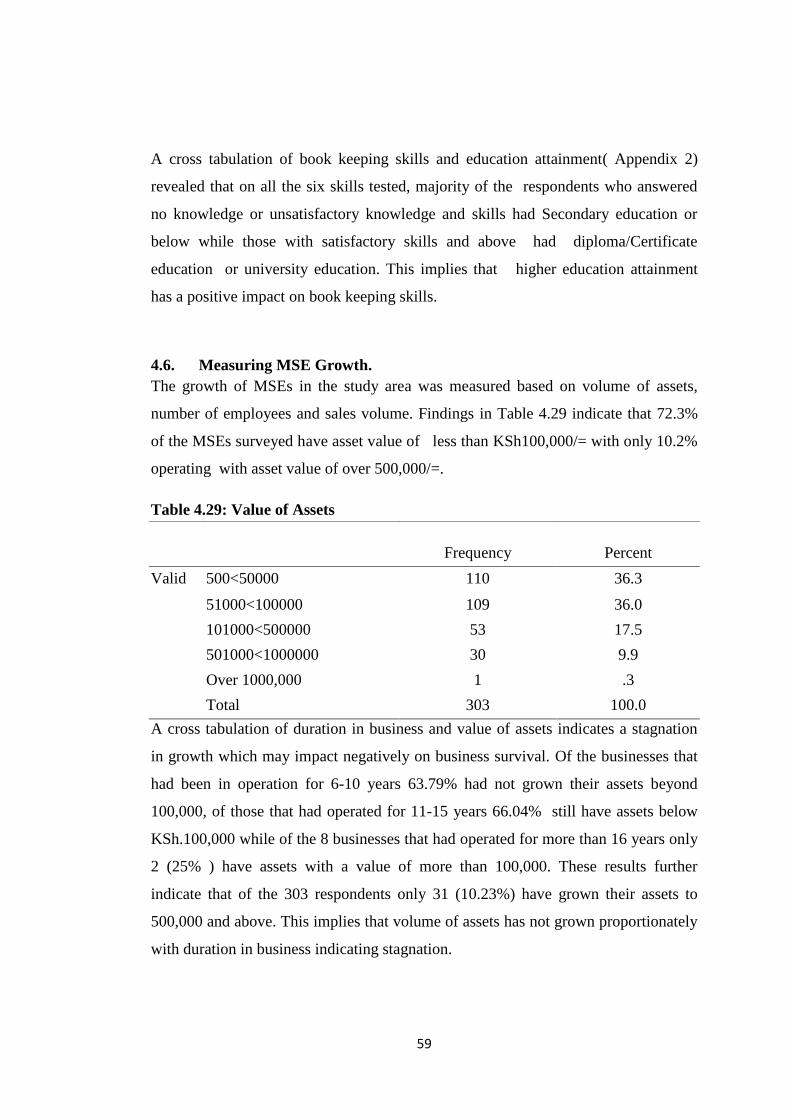
59
A cross tabulation of book keeping skills and education attainment( Appendix 2)
revealed that on all the six skills tested, majority of the respondents who answered
no knowledge or unsatisfactory knowledge and skills had Secondary education or
below while those with satisfactory skills and above had diploma/Certificate
education or university education. This implies that higher education attainment
has a positive impact on book keeping skills.
4.6. Measuring MSE Growth.
The growth of MSEs in the study area was measured based on volume of assets,
number of employees and sales volume. Findings in Table 4.29 indicate that 72.3%
of the MSEs surveyed have asset value of less than KSh100,000/= with only 10.2%
operating with asset value of over 500,000/=.
Table 4.29: Value of Assets
Frequency Percent
Valid 500<50000 110 36.3
51000<100000 109 36.0
101000<500000 53 17.5
501000<1000000 30 9.9
Over 1000,000 1 .3
Total 303 100.0
A cross tabulation of duration in business and value of assets indicates a stagnation
in growth which may impact negatively on business survival. Of the businesses that
had been in operation for 6-10 years 63.79% had not grown their assets beyond
100,000, of those that had operated for 11-15 years 66.04% still have assets below
KSh.100,000 while of the 8 businesses that had operated for more than 16 years only
2 (25% ) have assets with a value of more than 100,000. These results further
indicate that of the 303 respondents only 31 (10.23%) have grown their assets to
500,000 and above. This implies that volume of assets has not grown proportionately
with duration in business indicating stagnation.
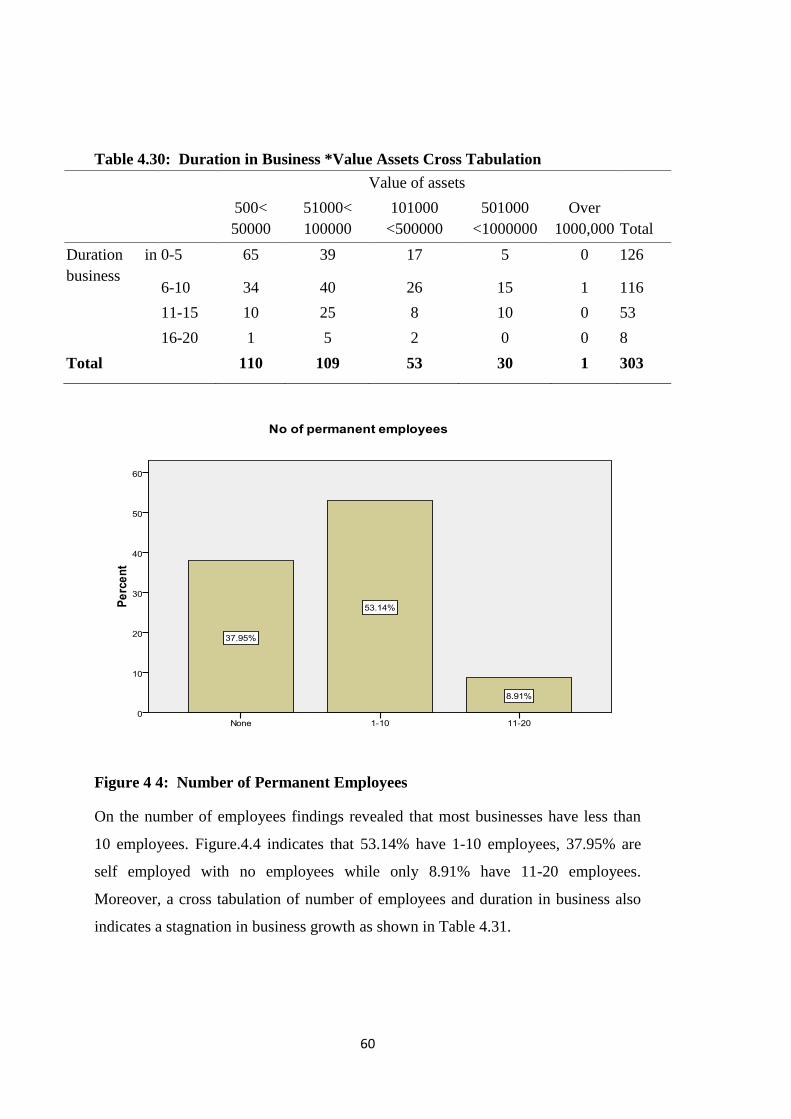
60
Table 4.30: Duration in Business *Value Assets Cross Tabulation
Value of assets
Total
500<
50000
51000<
100000
101000
<500000
501000
<1000000
Over
1000,000
Duration in
business
0-5 65 39 17 5 0 126
6-10 34 40 26 15 1 116
11-15 10 25 8 10 0 53
16-20 1 5 2 0 0 8
Total 110 109 53 30 1 303
Figure 4 4: Number of Permanent Employees
On the number of employees findings revealed that most businesses have less than
10 employees. Figure.4.4 indicates that 53.14% have 1-10 employees, 37.95% are
self employed with no employees while only 8.91% have 11-20 employees.
Moreover, a cross tabulation of number of employees and duration in business also
indicates a stagnation in business growth as shown in Table 4.31.
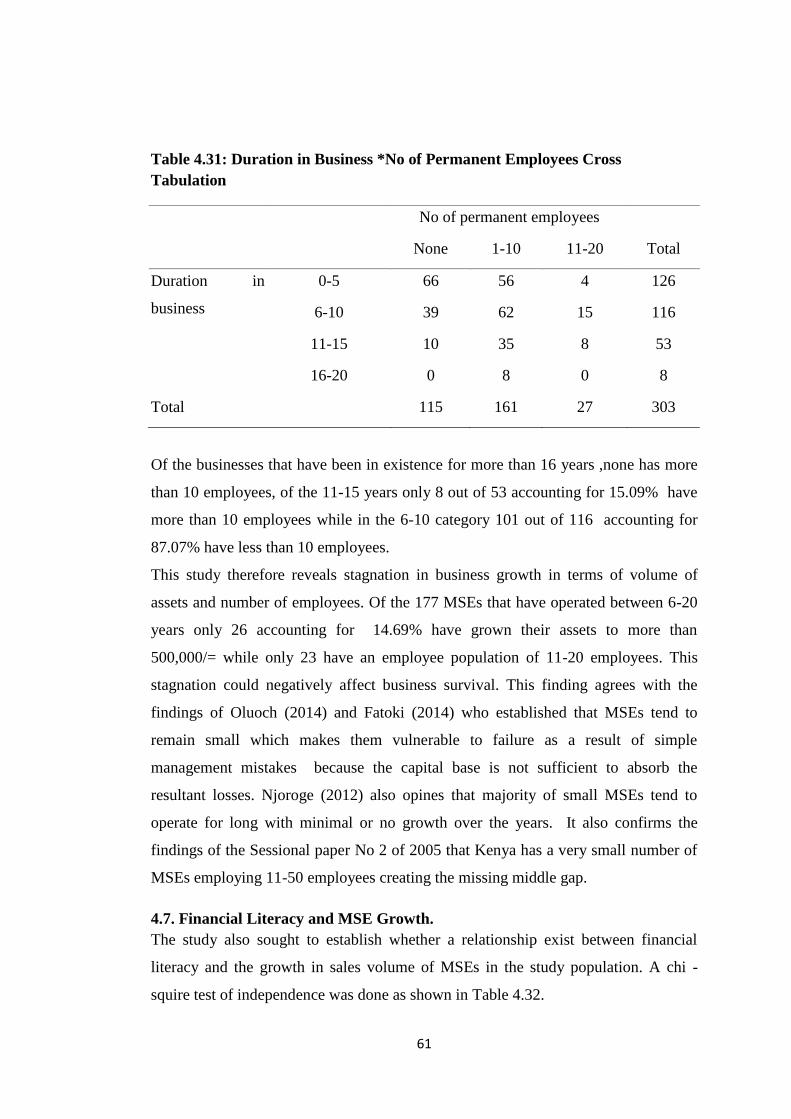
61
Table 4.31: Duration in Business *No of Permanent Employees Cross
Tabulation
No of permanent employees
Total None 1-10 11-20
Duration in
business
0-5 66 56 4 126
6-10 39 62 15 116
11-15 10 35 8 53
16-20 0 8 0 8
Total 115 161 27 303
Of the businesses that have been in existence for more than 16 years ,none has more
than 10 employees, of the 11-15 years only 8 out of 53 accounting for 15.09% have
more than 10 employees while in the 6-10 category 101 out of 116 accounting for
87.07% have less than 10 employees.
This study therefore reveals stagnation in business growth in terms of volume of
assets and number of employees. Of the 177 MSEs that have operated between 6-20
years only 26 accounting for 14.69% have grown their assets to more than
500,000/= while only 23 have an employee population of 11-20 employees. This
stagnation could negatively affect business survival. This finding agrees with the
findings of Oluoch (2014) and Fatoki (2014) who established that MSEs tend to
remain small which makes them vulnerable to failure as a result of simple
management mistakes because the capital base is not sufficient to absorb the
resultant losses. Njoroge (2012) also opines that majority of small MSEs tend to
operate for long with minimal or no growth over the years. It also confirms the
findings of the Sessional paper No 2 of 2005 that Kenya has a very small number of
MSEs employing 11-50 employees creating the missing middle gap.
4.7. Financial Literacy and MSE Growth.
The study also sought to establish whether a relationship exist between financial
literacy and the growth in sales volume of MSEs in the study population. A chi -
squire test of independence was done as shown in Table 4.32.
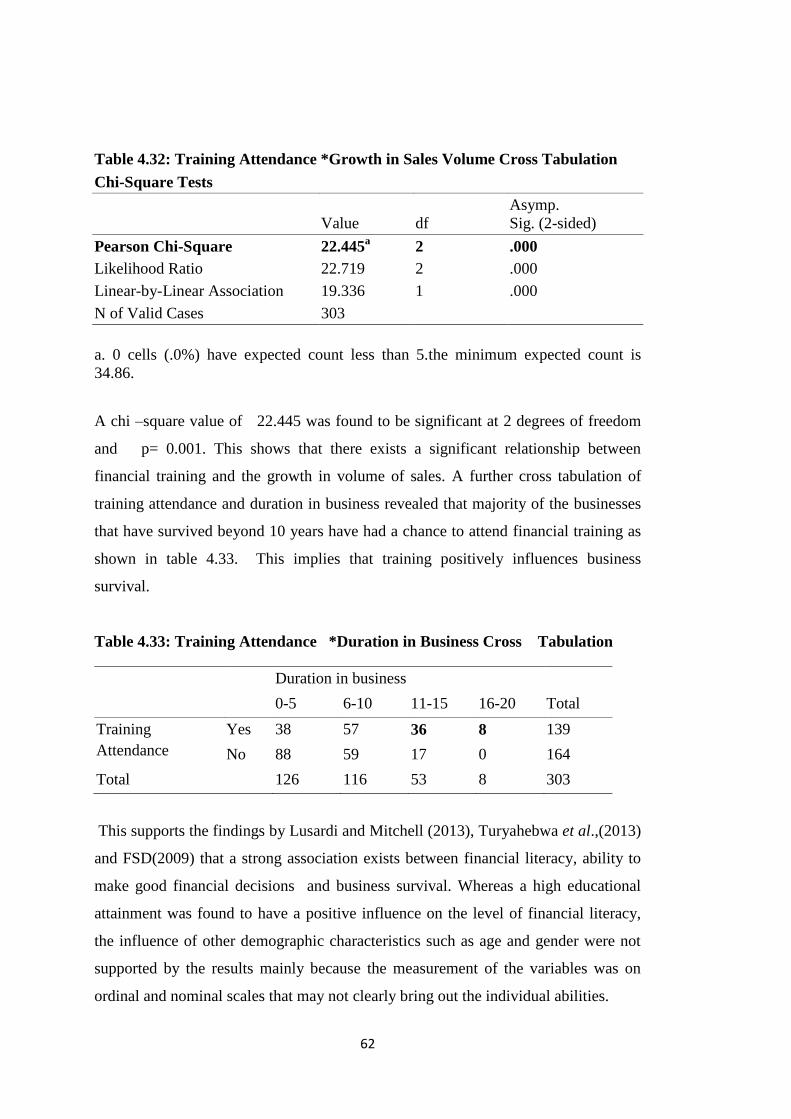
62
Table 4.32: Training Attendance *Growth in Sales Volume Cross Tabulation
Chi-Square Tests
Value df
Asymp.
Sig. (2-sided)
Pearson Chi-Square 22.445a 2 .000
Likelihood Ratio 22.719 2 .000
Linear-by-Linear Association 19.336 1 .000
N of Valid Cases 303
a. 0 cells (.0%) have expected count less than 5.the minimum expected count is
34.86.
A chi –square value of 22.445 was found to be significant at 2 degrees of freedom
and p= 0.001. This shows that there exists a significant relationship between
financial training and the growth in volume of sales. A further cross tabulation of
training attendance and duration in business revealed that majority of the businesses
that have survived beyond 10 years have had a chance to attend financial training as
shown in table 4.33. This implies that training positively influences business
survival.
Table 4.33: Training Attendance *Duration in Business Cross Tabulation
Duration in business
Total 0-5 6-10 11-15 16-20
Training
Attendance
Yes 38 57 36 8 139
No 88 59 17 0 164
Total 126 116 53 8 303
This supports the findings by Lusardi and Mitchell (2013), Turyahebwa et al.,(2013)
and FSD(2009) that a strong association exists between financial literacy, ability to
make good financial decisions and business survival. Whereas a high educational
attainment was found to have a positive influence on the level of financial literacy,
the influence of other demographic characteristics such as age and gender were not
supported by the results mainly because the measurement of the variables was on
ordinal and nominal scales that may not clearly bring out the individual abilities.
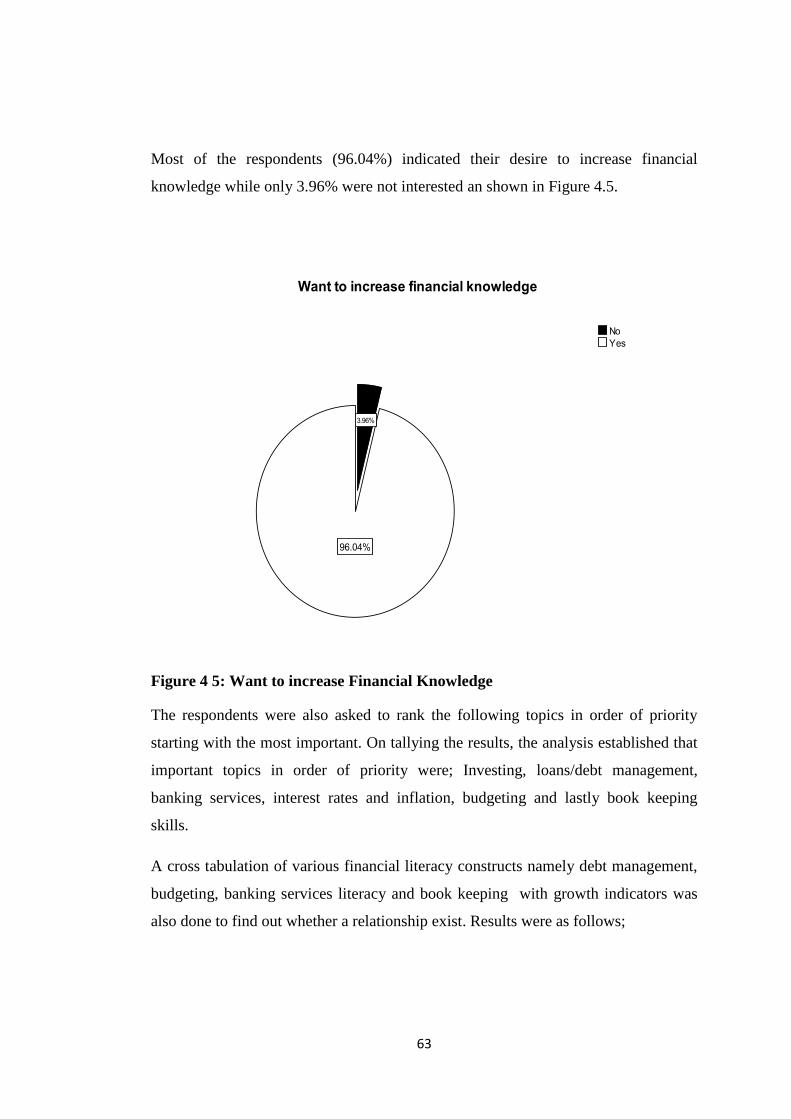
63
Most of the respondents (96.04%) indicated their desire to increase financial
knowledge while only 3.96% were not interested an shown in Figure 4.5.
Figure 4 5: Want to increase Financial Knowledge
The respondents were also asked to rank the following topics in order of priority
starting with the most important. On tallying the results, the analysis established that
important topics in order of priority were; Investing, loans/debt management,
banking services, interest rates and inflation, budgeting and lastly book keeping
skills.
A cross tabulation of various financial literacy constructs namely debt management,
budgeting, banking services literacy and book keeping with growth indicators was
also done to find out whether a relationship exist. Results were as follows;
64
Debt Literacy and MSE growth in value of Assets
Findings in Table 4.34 reveal that knowledge on debt management has a positive
influence on the growth in value of assets of MSEs. Specifically, of the 31 MSEs that
have grown their assets beyond 500,000/= only 6 disagreed that they are not able to
repay their loan installments on time while of the 77 MSEs that strongly disagreed,
disagreed or were unsure on timely loan repayments only 9 have a value of assets
above 100,000/=. This implies that timely loan repayments improve the ability of the
owner manager to access development finance for business expansion. On ability to
compare terms and conditions 131 MSE owners either strongly disagreed (18),
disagreed (101) or were unsure (12), Consequently only 8 out of 131 have assets
valued above 500,000/= implying that inability to compare terms and conditions has
a negative impact on the growth in assets since the owner manager may not purchase
the best products for his business. On whether MSEs use more than half business
revenue to repay loans 181 MSEs either strongly disagreed (40) or disagreed (141).
Although this implies that majority were using affordable loans in their businesses
only 14 out of 181 have grown their assets above 500,000/=. This could be because
of low maximum loan ceilings which limits access to large amounts of development
capital for MSEs. On ability to access various sources of finance, of the 131 MSEs
that either strongly disagreed(18), disagreed(83) or were unsure(30) only 7 have
grown their assets to at least 500,000/=. On the other hand, of the 30 MSEs with
assets above 500,000/= 23 agreed that they are able to access various sources of
finance which implies that access to finance accelerates business growth. 205 MSE
owners either strongly disagreed, disagreed or were unsure on knowledge of the
effect of inflation and interest rates, consequently only 10 out of the 205 have assets
valued above 500,000/= hence lack of knowledge on inflation and interest rates
negatively affects business growth.
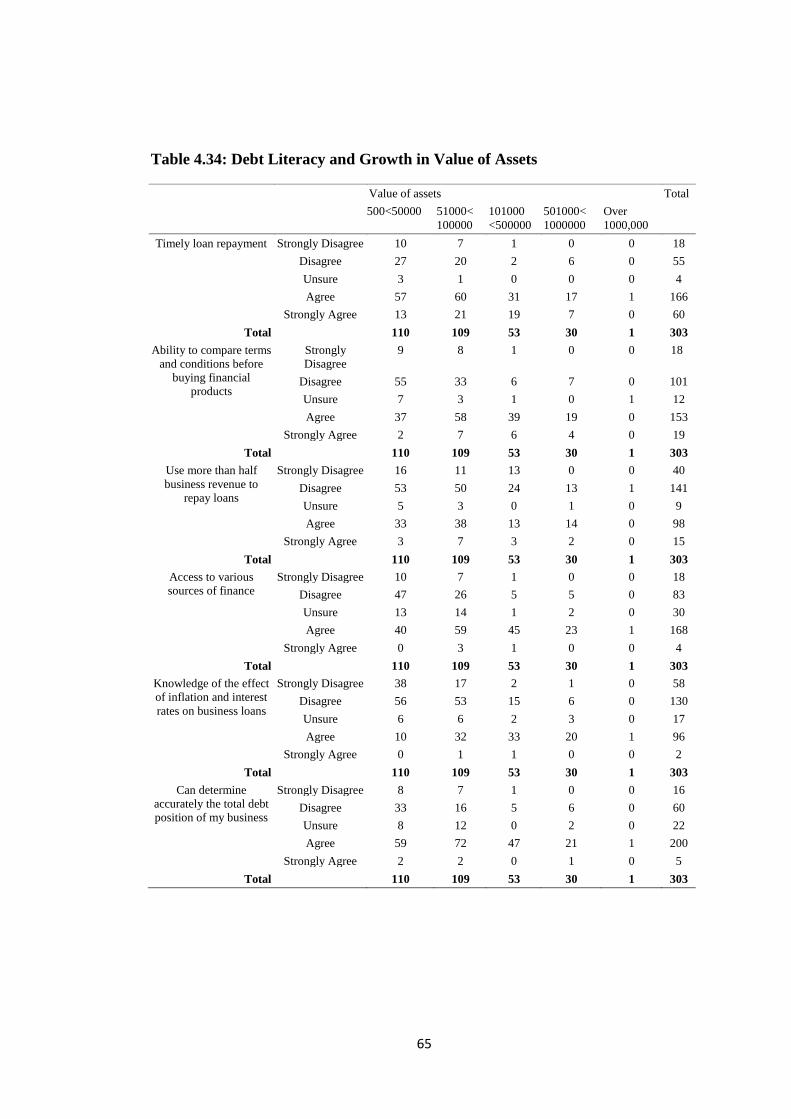
65
Table 4.34: Debt Literacy and Growth in Value of Assets
Value of assets Total
500<50000 51000<
100000
101000
<500000
501000<
1000000
Over
1000,000
Timely loan repayment Strongly Disagree 10 7 1 0 0 18
Disagree 27 20 2 6 0 55
Unsure 3 1 0 0 0 4
Agree 57 60 31 17 1 166
Strongly Agree 13 21 19 7 0 60
Total 110 109 53 30 1 303
Ability to compare terms
and conditions before
buying financial
products
Strongly
Disagree
9 8 1 0 0 18
Disagree 55 33 6 7 0 101
Unsure 7 3 1 0 1 12
Agree 37 58 39 19 0 153
Strongly Agree 2 7 6 4 0 19
Total 110 109 53 30 1 303
Use more than half
business revenue to
repay loans
Strongly Disagree 16 11 13 0 0 40
Disagree 53 50 24 13 1 141
Unsure 5 3 0 1 0 9
Agree 33 38 13 14 0 98
Strongly Agree 3 7 3 2 0 15
Total 110 109 53 30 1 303
Access to various
sources of finance
Strongly Disagree 10 7 1 0 0 18
Disagree 47 26 5 5 0 83
Unsure 13 14 1 2 0 30
Agree 40 59 45 23 1 168
Strongly Agree 0 3 1 0 0 4
Total 110 109 53 30 1 303
Knowledge of the effect
of inflation and interest
rates on business loans
Strongly Disagree 38 17 2 1 0 58
Disagree 56 53 15 6 0 130
Unsure 6 6 2 3 0 17
Agree 10 32 33 20 1 96
Strongly Agree 0 1 1 0 0 2
Total 110 109 53 30 1 303
Can determine
accurately the total debt
position of my business
Strongly Disagree 8 7 1 0 0 16
Disagree 33 16 5 6 0 60
Unsure 8 12 0 2 0 22
Agree 59 72 47 21 1 200
Strongly Agree 2 2 0 1 0 5
Total 110 109 53 30 1 303
66
Budgeting Literacy and Growth in Value of Assets
Findings as shown in Table 4.35 reveal that there exists a positive relationship
between budgeting literacy and the growth in value of assets in MSEs. In particular,
of the 177 MSEs that rarely or never prepare written financial objectives, only 4 have
grown their assets above 500,000/= while 161 have assets below 100,000/=. On the
contrary, of the 52 MSEs who often or always prepare written financial objectives 36
have assets above 100,000/=, 16 above 500,000/= and none below 50,000/=. Of the
165 who never or rarely prepare annual budgets for their businesses, only 5 have
assets above 500,000/=. Conversely, of the 57 who often or always prepare annual
budgets none has assets below 50,000/= while 20 have assets above 500,000/=. On
ability to compare financial objectives with business performance, 182 businesses
either never or rarely do. Consequently, only 6 of these MSEs have grown their
business assets above 500,000/=.However, of the 51 MSEs who often or always
compare financial objectives with business performance only 15 have assets below
100,000/= with none having assets below 50,000/=.On use of budgets to set
performance targets for employees, findings indicate that 212 MSEs never or rarely
use budgets. Consequently, 183 of these have assets less than 100,000/= while of the
42 who often or always use budgets to set targets 29 MSEs have assets valued above
100,000/=.Of the 31 businesses with assets over 500,000/=, 18 MSEs either often or
always use budgets to track spending in the business. These results therefore indicate
that improving the budgeting skills of MSE owners can have a positive impact on the
MSE growth in terms of value of assets which is consistent with the findings of
Warue and Wanjira (2013) that budgeting skills improve business performance in
terms of increased sales, better money management and increased profitability.
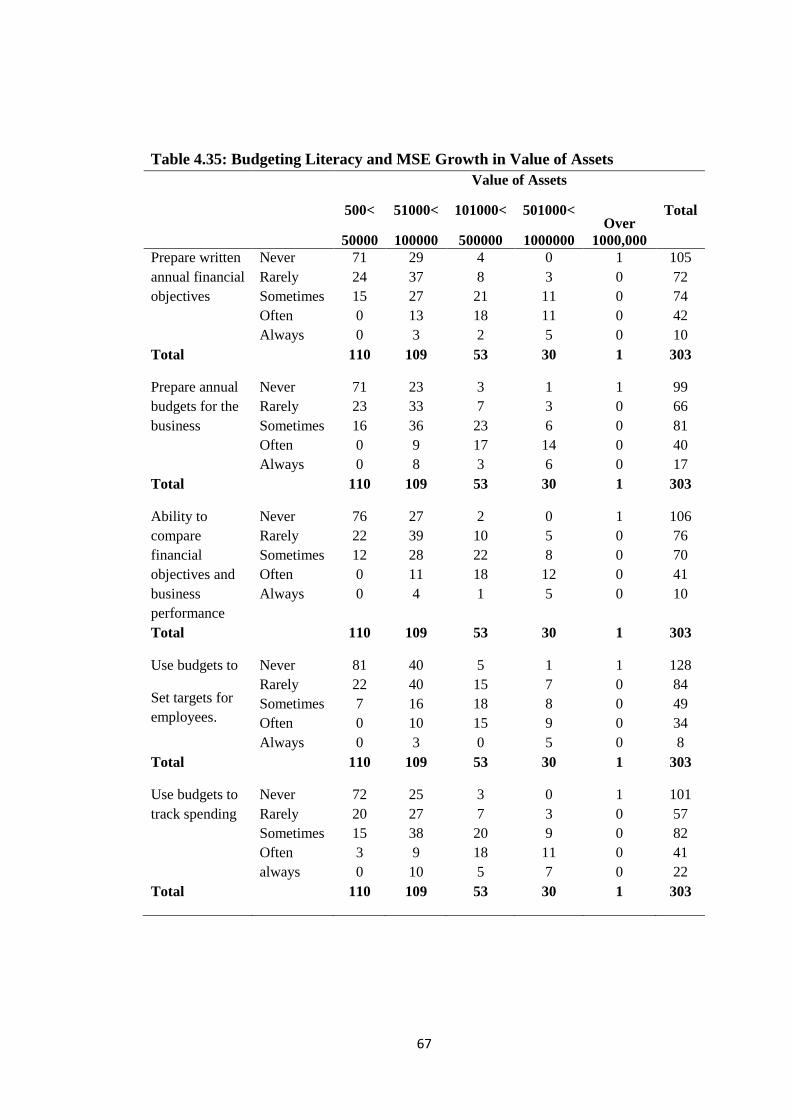
67
Table 4.35: Budgeting Literacy and MSE Growth in Value of Assets
Value of Assets
500<
50000
51000<
100000
101000<
500000
501000<
1000000
Over
1000,000
Total
Prepare written
annual financial
objectives
Never 71 29 4 0 1 105
Rarely 24 37 8 3 0 72
Sometimes 15 27 21 11 0 74
Often 0 13 18 11 0 42
Always 0 3 2 5 0 10
Total 110 109 53 30 1 303
Prepare annual
budgets for the
business
Never 71 23 3 1 1 99
Rarely 23 33 7 3 0 66
Sometimes 16 36 23 6 0 81
Often 0 9 17 14 0 40
Always 0 8 3 6 0 17
Total 110 109 53 30 1 303
Ability to
compare
financial
objectives and
business
performance
Never 76 27 2 0 1 106
Rarely 22 39 10 5 0 76
Sometimes 12 28 22 8 0 70
Often 0 11 18 12 0 41
Always 0 4 1 5 0 10
Total 110 109 53 30 1 303
Use budgets to
Set targets for
employees.
Never 81 40 5 1 1 128
Rarely 22 40 15 7 0 84
Sometimes 7 16 18 8 0 49
Often 0 10 15 9 0 34
Always 0 3 0 5 0 8
Total 110 109 53 30 1 303
Use budgets to
track spending
Never 72 25 3 0 1 101
Rarely 20 27 7 3 0 57
Sometimes 15 38 20 9 0 82
Often 3 9 18 11 0 41
always 0 10 5 7 0 22
Total 110 109 53 30 1 303
68
Banking Services literacy and MSE growth
Results in Table 4.36 indicate that there exists a positive relationship between
banking services literacy and growth in value of assets. In particular, all the 31
businesses with assets over 500,000/= have a business bank account while of the 22
who have no bank account 21 businesses have assets less than 50,000/=. Of the 219
businesses that do not bank their proceeds daily only 13 have grown their assets
above 500,000/=. Further, of the 31 MSEs with assets over 500,000/= 18 agreed that
they bank their proceeds daily which improves their credit scoring and access to
development finance. All the 31 MSEs with assets over 500,000/= know where to get
extra finance for their businesses while of the 30 MSEs who did not know where to
get extra finance none has grown their assets above 100,000/=.
On ability to access websites of commercial banks, 233 MSE managers answered
“No” out of which 191 have not grown their assets above 100,000/=. Conversely, of
the 70 who answered “yes” 42 MSEs have assets above 100,000/= with only 5
having assets below 50,000/=. Of the 145 MSE owners who are not aware of
commercial bank requirements of lending to MSEs 123 have assets below 100,000/=
with only 5 having grown their assets above 500,000/=. 26 out of 31 MSEs with
assets over 500,000/= are aware of commercial bank requirements of lending to
MSEs. On ability to access other bank products apart from loans 214 answered “No”
out of which only 6 have grown their assets above 500,000/= in the last 4 years while
of the 89 who can access other bank products 57 have grown their assets above
100,000/= while only 2 have assets below 50,000/=. These findings indicate that
MSEs with literacy on banking services are able to access adequate finance which
enables them to grow their businesses in terms of increasing the value of assets.
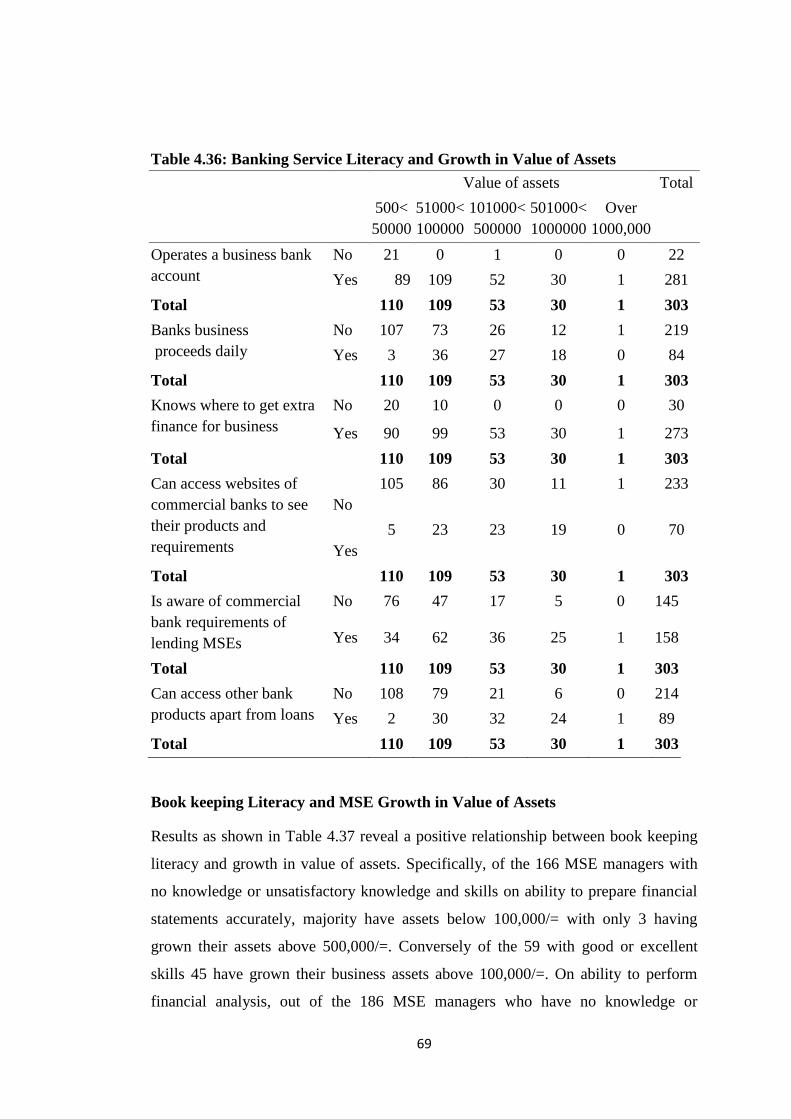
69
Table 4.36: Banking Service Literacy and Growth in Value of Assets
Value of assets Total
500<
50000
51000<
100000
101000<
500000
501000<
1000000
Over
1000,000
Operates a business bank
account
No 21 0 1 0 0 22
Yes 89 109 52 30 1 281
Total 110 109 53 30 1 303
Banks business
proceeds daily
No 107 73 26 12 1 219
Yes 3 36 27 18 0 84
Total 110 109 53 30 1 303
Knows where to get extra
finance for business
No 20 10 0 0 0 30
Yes 90 99 53 30 1 273
Total 110 109 53 30 1 303
Can access websites of
commercial banks to see
their products and
requirements
No
105 86 30 11 1 233
Yes
5 23 23 19 0 70
Total 110 109 53 30 1 303
Is aware of commercial
bank requirements of
lending MSEs
No 76 47 17 5 0 145
Yes 34 62 36 25 1 158
Total 110 109 53 30 1 303
Can access other bank
products apart from loans
No 108 79 21 6 0 214
Yes 2 30 32 24 1 89
Total 110 109 53 30 1 303
Book keeping Literacy and MSE Growth in Value of Assets
Results as shown in Table 4.37 reveal a positive relationship between book keeping
literacy and growth in value of assets. Specifically, of the 166 MSE managers with
no knowledge or unsatisfactory knowledge and skills on ability to prepare financial
statements accurately, majority have assets below 100,000/= with only 3 having
grown their assets above 500,000/=. Conversely of the 59 with good or excellent
skills 45 have grown their business assets above 100,000/=. On ability to perform
financial analysis, out of the 186 MSE managers who have no knowledge or
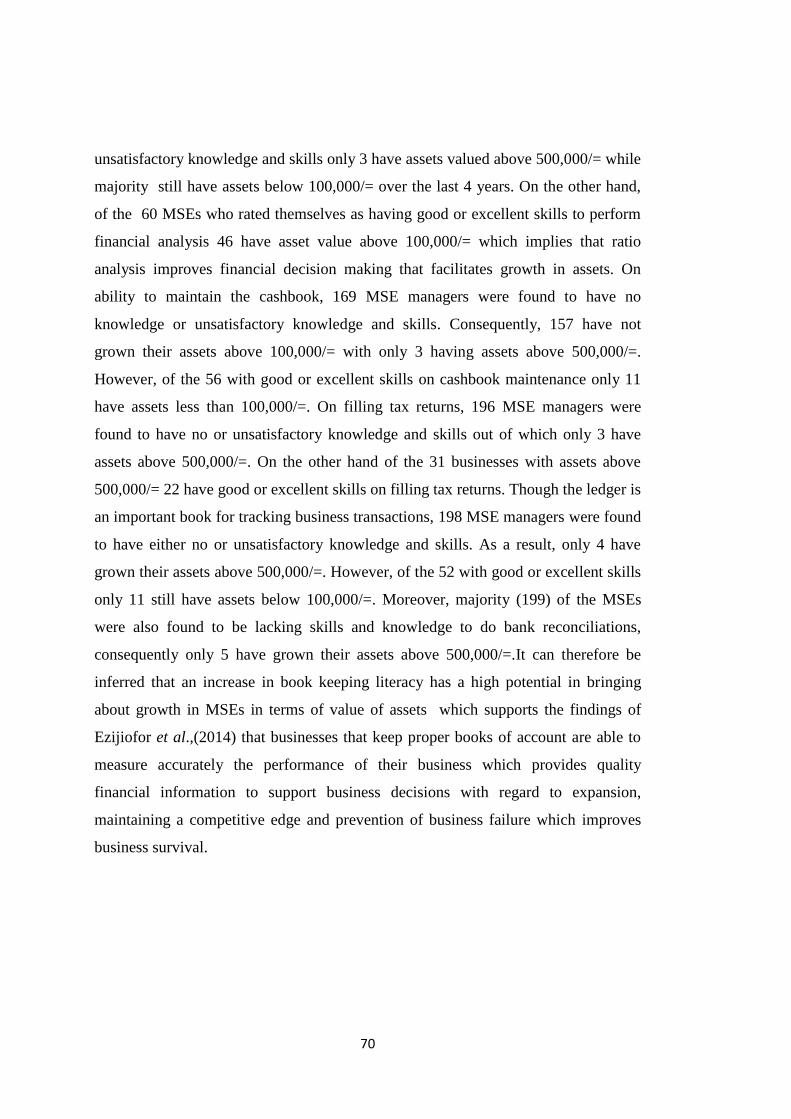
70
unsatisfactory knowledge and skills only 3 have assets valued above 500,000/= while
majority still have assets below 100,000/= over the last 4 years. On the other hand,
of the 60 MSEs who rated themselves as having good or excellent skills to perform
financial analysis 46 have asset value above 100,000/= which implies that ratio
analysis improves financial decision making that facilitates growth in assets. On
ability to maintain the cashbook, 169 MSE managers were found to have no
knowledge or unsatisfactory knowledge and skills. Consequently, 157 have not
grown their assets above 100,000/= with only 3 having assets above 500,000/=.
However, of the 56 with good or excellent skills on cashbook maintenance only 11
have assets less than 100,000/=. On filling tax returns, 196 MSE managers were
found to have no or unsatisfactory knowledge and skills out of which only 3 have
assets above 500,000/=. On the other hand of the 31 businesses with assets above
500,000/= 22 have good or excellent skills on filling tax returns. Though the ledger is
an important book for tracking business transactions, 198 MSE managers were found
to have either no or unsatisfactory knowledge and skills. As a result, only 4 have
grown their assets above 500,000/=. However, of the 52 with good or excellent skills
only 11 still have assets below 100,000/=. Moreover, majority (199) of the MSEs
were also found to be lacking skills and knowledge to do bank reconciliations,
consequently only 5 have grown their assets above 500,000/=.It can therefore be
inferred that an increase in book keeping literacy has a high potential in bringing
about growth in MSEs in terms of value of assets which supports the findings of
Ezijiofor et al.,(2014) that businesses that keep proper books of account are able to
measure accurately the performance of their business which provides quality
financial information to support business decisions with regard to expansion,
maintaining a competitive edge and prevention of business failure which improves
business survival.
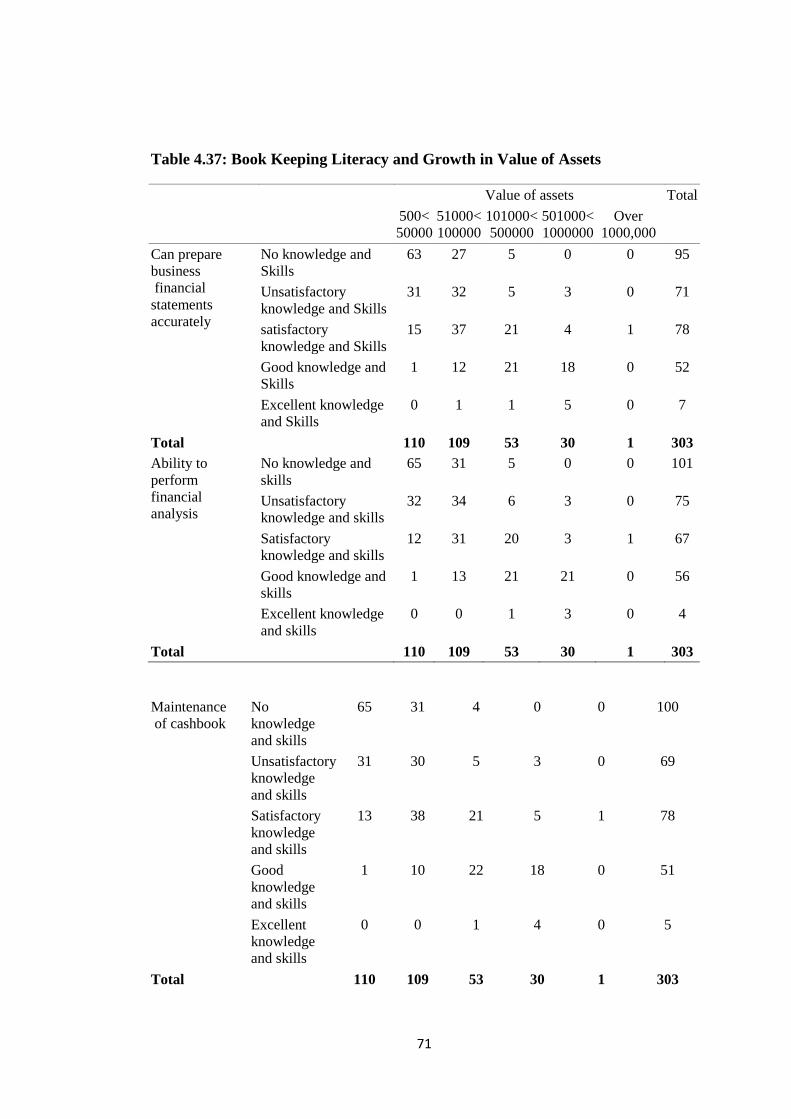
71
Table 4.37: Book Keeping Literacy and Growth in Value of Assets
Value of assets Total
500<
50000
51000<
100000
101000<
500000
501000<
1000000
Over
1000,000
Can prepare
business
financial
statements
accurately
No knowledge and
Skills
63 27 5 0 0 95
Unsatisfactory
knowledge and Skills
31 32 5 3 0 71
satisfactory
knowledge and Skills
15 37 21 4 1 78
Good knowledge and
Skills
1 12 21 18 0 52
Excellent knowledge
and Skills
0 1 1 5 0 7
Total 110 109 53 30 1 303
Ability to
perform
financial
analysis
No knowledge and
skills
65 31 5 0 0 101
Unsatisfactory
knowledge and skills
32 34 6 3 0 75
Satisfactory
knowledge and skills
12 31 20 3 1 67
Good knowledge and
skills
1 13 21 21 0 56
Excellent knowledge
and skills
0 0 1 3 0 4
Total 110 109 53 30 1 303
Maintenance
of cashbook
No
knowledge
and skills
65 31 4 0 0 100
Unsatisfactory
knowledge
and skills
31 30 5 3 0 69
Satisfactory
knowledge
and skills
13 38 21 5 1 78
Good
knowledge
and skills
1 10 22 18 0 51
Excellent
knowledge
and skills
0 0 1 4 0 5
Total 110 109 53 30 1 303
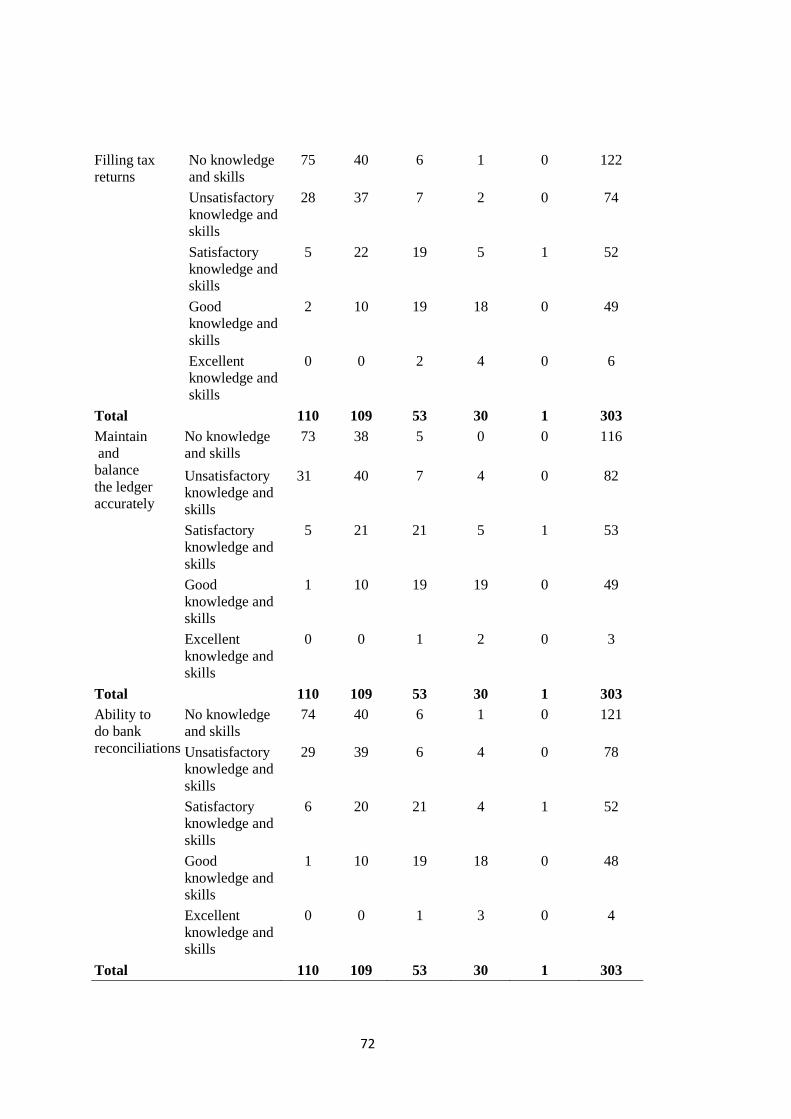
72
Filling tax
returns
No knowledge
and skills
75 40 6 1 0 122
Unsatisfactory
knowledge and
skills
28 37 7 2 0 74
Satisfactory
knowledge and
skills
5 22 19 5 1 52
Good
knowledge and
skills
2 10 19 18 0 49
Excellent
knowledge and
skills
0 0 2 4 0 6
Total 110 109 53 30 1 303
Maintain
and
balance
the ledger
accurately
No knowledge
and skills
73 38 5 0 0 116
Unsatisfactory
knowledge and
skills
31 40 7 4 0 82
Satisfactory
knowledge and
skills
5 21 21 5 1 53
Good
knowledge and
skills
1 10 19 19 0 49
Excellent
knowledge and
skills
0 0 1 2 0 3
Total 110 109 53 30 1 303
Ability to
do bank
reconciliations
No knowledge
and skills
74 40 6 1 0 121
Unsatisfactory
knowledge and
skills
29 39 6 4 0 78
Satisfactory
knowledge and
skills
6 20 21 4 1 52
Good
knowledge and
skills
1 10 19 18 0 48
Excellent
knowledge and
skills
0 0 1 3 0 4
Total 110 109 53 30 1 303
73
These findings indicate that debt literacy, banking services, budgeting literacy and
book keeping literacy have a positive relationship with growth in value of assets
since MSEs that were found to have these skills have managed to grow their assets
above 500,000/= while a majority of those without financial literacy skills have
remained below 100,000/=. This implies that financial literacy skills of the owner
managers has the potential to bring about growth in MSEs consistent with the
assertion by Turyahebwa et al., (2013) that sound financial management is critical
for business survival and growth.
74
CHAPTER FIVE
SUMMARY, CONCLUSIONS AND RECOMMENDATIONS
5.1. Introduction
This chapter presents the summary and conclusion of the study and offers
recommendations to MSE managers in Kenya, the County and National government
and other stakeholders in the MSE sector.
5.2. Summary of the Findings
This research set out to investigate the relationship between financial literacy and the
growth of MSEs in Kenya based on four main objectives of debt management
literacy, budgeting literacy, banking services literacy and book keeping literacy with
a view to establish the level of literacy of MSE managers and how it affected the
growth of their businesses.
5.2.1. Effect of Debt Management Literacy on the Growth of MSEs
Findings on objective one revealed that although MSE managers had a fair
knowledge of debt management with a modal response of agree on most knowledge
areas tested, majority do not understand the effect of inflation and interest rates on
loans they borrow and were not comparing terms and conditions before purchasing
financial products which could affect their financial decisions of when to borrow,
how much and from whom, leading to sub- optimal performance of their businesses.
The study also found out that MSE owners with good knowledge and skills on debt
management have grown their volume of assets above 500,000/= while majority of
those with low level of debt management skills have remained with business assets
below 100,000/= over the last four year period. Therefore debt management literacy
was found to have a positive influence on the growth in value of assets of MSEs.
75
5.2.2. Effect of Budgeting Literacy on the Growth of MSEs
Whereas budgeting skills have been found to improve business performance in terms
of increased sales, better money management and increased profitability, the analysis
revealed that the modal response across all the five items on budgeting literacy was
“never”. This indicates that most MSEs in the study area do not engage in budgeting
as a tool for business planning and control. Using descriptive statistics, it was further
established that there exists a positive relationship between budgeting literacy and
the growth in volume of assets. Specifically, for SMEs that often or always use
budgets in their businesses majority have grown their assets above 50,000/= while of
the 31 businesses with assets above 500,000/= at least 20 agreed that they use
budgets in their businesses. These results therefore indicate that improving the
budgeting skills of MSE owners can have a positive impact on the MSE growth in
terms of value of assets. The study further revealed that majority of the SME
managers with low budgeting literacy had below college education.
5.2.3. Effect of Banking Services Literacy on the Growth of SMEs
Findings on objective three indicate that the MSE managers surveyed generally
portrayed a low knowledge of banking services literacy. Although majority operated
bank accounts for their businesses, very few MSEs bank their proceeds on a daily
basis which could affect their credit scoring hence ability to access business loans.
While use of information technology can significantly reduce the search costs for
information, use of bank websites was found to be limited as most MSEs have not
taken advantage of commercial bank websites to check and compare product offers
and their terms and conditions. Moreover only 29.4 % are able to access other bank
products other than loans which imply that MSEs are still constraint in accessing
banking services. Results also established that there exists a positive relationship
between banking services literacy and growth in value of assets since at least 20 of
the 31 SMEs with assets above 500,000/= agreed that they were able to use various
banking services tested.
76
5.2.4. Effect of Book keeping Literacy on the Growth of SMEs
Results on objective four revealed that majority of the respondents had no knowledge
and skills on the book keeping skills tested. It was also established that a positive
relationship exists between book keeping literacy and growth in value of assets.
While over 50% SME managers rated themselves as having no knowledge or
unsatisfactory knowledge and skills only 3 SMEs in this category have grown their
assets above 500,000/= over the last four year period. On the contrary ,of those that
have good or excellent skills and knowledge on the Book keeping skills tested,
majority have grown their assets above 100,000/=. It was further established that
training impacts positively on business survival and higher education attainment
increases financial awareness.
5.3. Conclusions
In view of the findings as summarized above, this study concludes that a positive
relationship exist between enterprise growth and financial literacy. MSEs that are
more successful are run by entrepreneurs who have financial literacy and understand
key financial concepts that include, debt management, interest rates, budgeting and
control, knowledge on efficient use of banking services and book keeping. Whereas
efforts have been made to expose the public to financial education, financial literacy
among majority of MSE managers in Kakamega Sub County remains low implying
that financial literacy education is yet to achieve its objectives. In particular;
There is a low level of debt management literacy among MSE managers which may
negatively affect their financial decisions of when to borrow, how much and from
whom resulting to poor business performance. Most MSEs in the study area do not
engage in budgeting as a tool for business planning and control which can have a
negative impact on business survival. However, improving the budgeting skills of
MSE owners can have a positive impact on the MSE growth in terms of value of
assets.
Although most MSEs appreciate the need to operate business bank accounts, a
majority do not bank their proceeds daily which could affect their credit scoring and
ability to access bank loans. Also, a large majority have not taken advantage of bank
77
websites to access product information which can significantly reduce information
search costs and further only a small percentage are able to access other bank
products other than loans which depicts a low level of banking literacy.
The Study also concludes that most MSEs in the study area do not keep business
records that can enable them measure accurately the financial performance of their
businesses due to unsatisfactory knowledge and skills on Book keeping. Lack of
records increases their information opacity and may constraint their access to
finance.
Financial literacy was also found to go hand in hand with formal education;
entrepreneurs that scored high in financial literacy had at least a diploma/certificate
education, while in contrast, entrepreneurs with low level of formal education
demonstrated low level of financial literacy.
5.4. Recommendations
5.4.1. Recommendations for Policy and Practice.
In view of the conclusions made above, the following recommendations are made;
Micro Finance Institutions and government agencies including WEF, YEF and
Uwezo should organize financial education capacity building programs and financial
awareness campaigns on debt management and banking services literacy for SMEs
under their jurisdiction since they are in constant contact with SMEs. Such trainings
should be separated from financing since mixing training and financing has been
reported to be in effective (UNCTAD, 1997) as MSE participants are only interested
in the loan with little commitment to learning.
Book keeping skills and Budgeting skills require a longer duration for trainees to
master the skills. Accordingly, the Micro and Small Enterprise Authority charged
with a mandate to do capacity building of MSEs (MSE Act, 2012) should in
collaboration with village Youth polytechnics organize training on budgeting and
book keeping skills for MSEs on a Training of Trainer (TOT) approach whereby
instructors in the Youth Polytechnics can be used to train MSEs having been trained
78
by MSEA. Youth polytechnics are easily reachable and training programmes can be
organized at the convenience of the participants. This would help ensure that all
SMEs have basic book keeping and budgeting literacy.
Incorporate financial education in the school curriculum from Primary level so that
individuals are financially informed early in life. Business studies as a subject was
removed from primary school curriculum and is an elective at secondary level.
Business studies should be re- introduced at primary school and be compulsory
subject for the first two years of secondary education. The curriculum should teach
concepts on debt management, budgeting, book keeping and awareness on efficient
utilization of banking services.
Government agencies such as MSEA, WEF, YEF or Uwezo as well as MFIs should
develop easy to learn modules that can be downloaded by interested MSE operators
from their websites to reduce information search costs and take advantage of existing
technology platforms.
5.4.2. Areas for Further Research.
The following are recommended as areas of further research;
In order to improve the external validity in terms of generalization of the study
findings, it is recommended that this study be replicated in MSEs drawn from other
Counties in Kenya.
The FSD report of 2009 proposes six key areas of financial literacy. A study should
be undertaken to determine the effect of saving literacy and investment literacy on
the growth of MSEs. These variables were not included in the current study.
79
REFFERENCES.
Abanis T, Sunday A, Burani A, Eliabu B 2013. Financial Management Practices in
Small and Medium Enterprises in Selected Districts in Western Uganda.
Journal of Finance and Accounting, 4(2), 29-42.
Agyei, K. N.(2014): Small Scale Businesses Practice of Basic Financial Management
with Regards to Liquidity. International Journal of Research in Social
Agarwal, S., Driscoll, J., Gabaix, X & Laibson, D. (2007). The Age of
Reason. Financial Decisions over the Lifecycle. Harvard University.
Andoh, K.F. & Nunoo, J. (2005). Sustaining Small and Medium Enterprises through
Financial Service Utilization. Does Financial Literacy Matter? Department
of Economics, University of Cape Coast, Ghana
Atkison, A.; Messy, F.A. (2014). Assessing Financial Literacy in 12 Countries; An
PISA Pilot Exercise. Netspar.
Bhat, M.S; Rau A.V (2008). Managerial Economics and Financial Analysis. New
Delhli: BSP Publications.
Chan, C. S. R., & Park, H. D. (2013). The influence of dispositional affect and
cognition on venture investment portfolio concentration. Journal of Business
Venturing, 28(3), 397-412.
Chaston, I, & Mangles, T. (1997). Core Capabilities as Predictors of Growth
Potential in Small Manufacturing Firms. Journal of Small Business
Management, 35(1), 47-57
Churchill, N.C. & Lewis, V.L. (1983): The Five Stages of Small Business Growth.
Harvard Business Review, 61(3),
Cole, S., & Fernando, N. (2008). Assessing the importance of financial literacy. ADB
Finance for the Poor, 9(2), 1-6.
Ezejiofor, R. A., Emmanuel, E., & Olise, M. C. The Relevance of Accounting
Records in Small Scale Business: The Nigerian Experience. International
Journal of Academic Research in Business and Social Sciences, 1(4), 69-82
80
Fatoki O. (2014): The Financial Literacy of Micro Entrepreneurs in South Africa.
Journal of Social Science, 40(2), 151-158
Field, A. P.(2005). Discovering Statistics using SPSS. (2nd
Ed.). London : Sage
Publishers.
G20 Seoul summit (2010): Scaling up SME Access to Financial Services in the
Developing World. Washington DC: International Finance Corporation.
Gilbert, B. A., McDougall, P. P., & Audretsch, D. B. (2006). New venture growth: A
review and extension. Journal of management, 32(6), 926-950.
Glaser, M., & Walther, T. (2014). Run, walk, or buy? Financial literacy, dual-process
theory, and investment behavior. Financial Literacy, Dual-Process Theory,
and Investment Behavior (April 16, 2014).
GoK (2005): Sessional Paper No.2 of 2005; Development of Micro and Small
Enterprises for Wealth Creation, Employment Generation and Poverty
Reduction. Nairobi: Government Printers.
GoK (2007). Kenya Vision 2030: A Globally Competitive and Prosperous Kenya.
Nairobi: Government Printers.
Greenspan, A. (2002). Financial Literacy. A Tool for Economic Progress. The
Futurist Journal 36 (4), 37-41
Greiner, L. (1972). Evolution and revolution as organizations grow. Harvard
business review. Journal of Small Business Management, 472, 37–46.
Gupta,D.P.,Guha,S. & Shiva,S.K (2013). Firm’s Growth and its Determinants.
Journal of Innovation and Entrepreneurship 1 2(15), 2-14.
Guthrie, G. (2012): Basic Research Methods; An Entry to Social Science Research.
New York: Sage Publications.
Hilgert, M., Hogarth,J & Beverly ,S.(2003), Household Financial Management: The
Connection between Knowledge and Behavior. Federal Reserve Bulletin.
81
Horne,J.C.,Wachowicz, J.M(2009): Fundamentals of Financial Management.
London: Pearson Education.
ICCR (2014). Facilitating MSE financing through improved Credit Reporting.
Washington DC: World Bank.
Israel, D. (2009). Data analysis in business research: a step-by-step nonparametric
approach. New York: Sage Publications.
Kakamega County Government(2013).County Integreted Development Plan2013-
2017.
Kasomo,D (2006). Research Methods in Humanities and Education . Nairobi:
Egerton University Press.
Kenya, F. S. D. (2009). FinAccess National Survey, 2009: Dynamics of Kenya's
Changing Financial Landscape. FSD Kenya.
KIPPRA. (2012). Kenya Economic Report 2011:Transformative Institutions for
Delivering Kenya Vision 2030 . Nairobi: KIPPRA
KIPPRA. (2013). Kenya Economic Report 2012:Imperatives for Reducing the Cost
of Living in Kenya. Nairobi: KIPPRA
Kolvereid, L. & Bullvag, E. (1996). Growth intentions and actual growth: the impact
of entrepreneurial choice. Journal of Enterprising Culture, 4(01), 1–17.
Kombo,D.K & Tromp,D.A. (2006). Proposal and Thesis Writing: An Introduction .
Nairobi: Paulines Publications Africa.
Kothari, C. (2005). Research Methodology: Methods and Techniques, New Delhi,
New Age International (P) Ltd
Kumar, R.(2005). Research Methodology; A step by Step Guide for Beginners. (2nd
Ed.). New Dehli: Sage Publications.
Larry, W., & Skousen, C. (2009). Using Accounting Information . Ventures
Publishing House.
82
Lorunka, C, Kessler, A, Frank, H, & Lueger, M. (2011). Conditions for Growth in
One-Person Startups: A Longitudinal Study Spanning Eight Years.
Psicothema, 23(3), 446–452.
Lusardi, A., & Mitchell, O. S. (2011): Financial Literacy and Planning; Implications
for Retirement Well being. National Bureau of Economic Research.
Lusardi, A., & Mitchell, O. S. (2014). The economic importance of financial literacy:
Theory and evidence. Journal of Economic Literature, 52(1), 5-44.
Mandell, L. (2008). Financial literacy of high school students. Handbook of
consumer finance research, 163-183.
Maseko N, Manyani O 2011. Accounting Practices Of SMEs In Zimbabwe: An
Investigative Study of Record Keeping for Performance Measurement (A
case study of Bindura). Journal of Accounts and Tax, 3(8), 171-181.
Mastercard ( 2011). Taking Stock: Financial Education Initiatives for the Poor.
Ontario. CA: Mastercard Foundation
Mateev, M, & Anastasov, Y. (2010): Determinants of Small and Medium Sized Fast
Growing Enterprises in Central and Eastern Europe: A Panel Data Analysis.
Financial Theory and Practice, 34(3), 269–295.
Mckaskill,T (2010):Ultimate growth strategies; A practical Guide to Engineer High
Growth into Your Business. New York: Sage Publications.
Mills, K., & McCarthy, B. (2014). The state of small business lending: Credit access
during the recovery and how technology may change the game. Harvard
Business School General Management Unit Working Paper, (15-004).
Mugambi,N.,Njeru,A,Member,F & Tirimba, O.I.(2015).Effect of Cash Management
on the Financial Performance of deposit taking SACCOs in Mount Kenya
Region. Journal of Scientific and Research Publications, 5(2). 1238-1244.
Mugenda, O. M. &Mugenda, A. G. (2003). Research Methods: Quantitative and
Qualitative Approaches. Nairobi: Acts Press,
83
Muthaih, K, & Venkatesh, S. (2012). A Study on the Barriers Affecting the Growth
of Small and Medium Enterprises in India: International Journal of Research
in Computer Application Management, 02(1), 77–81.
Namusonge, G.S (2010). Determinant of Growth Oriented Small and Medium
Enterprises in Nairobi, (PhD. Thesis JKUAT), Nairobi, JKUAT.
Nganda,J.,Wanyonyi,K. & Kitili,E.(2014): Determinants of Growth of Small and
Medium Enterprises in Kakamega Central Sub- County Kenya. Journal of
Business Administration and Management Science Research Vol 3 (3),22-31.
Njoroge, R. M.(2013). Relationship Between Financial Literacy and Entrepreneurial
Success in Nairobi County Kenya. (MSC Dissertation University of Nairobi)
Nairobi: UON
O’ Leary, Z. (2011): The Essential guide to doing your research project. South Asia.
Sage Publications.
Obago, S. O. (2014). Effect of financial literacy on management of personal finances
among employees of commercial Banks in Kenya (Doctoral dissertation
University of Nairobi).
Oluoch, J. O. (2014). An Assessment Of The Impact Of Working Capital
Management Practices On The Performance Of Small And Medium
Enterprises: A Survey Of Smes In Eldoret Central Business District (Doctoral
Dissertation, Kisii University).
Osinde,K.S.,Iravo,M., Munene,C. & Omaiyo,D(2013). Effect of Business
Development Services on the Performance of Small enterprises in Kenya.
Interdisciplinary Journal of Cotemporary Research in Business 5(1), 292-
300.
Penrose, E. (1959). The Theory of the Growth of the Firm. Oxford University Press
Pisa, O. E. C. D. (2012). assessment and analytical framework: Mathematics,
reading, science, problem solving and financial literacy. 2013-2-21].
84
http://www. Pisa. org/pisa/pisaproducts/pisa2012 draftframeworks-
mathematicsproblemsolvingandfinancialliteracy. htm.
Rweyemamu, D. C., Kimaro, M. P., & Urassa, O. M. (2003). Assessing micro-
finance services in agricultural sector development: A case study of semi-
formal financial institutions in Tanzania. Economic and Social Research
Foundation, 4(2),1-46.
Siekei,J.,Wagoki, J. & Kalio, A., (2013). An Assessment of the role of financial
literacy on Performance of Small and Micro Enterprises: Case of Equity
Group Foundation Training Program on MSES in Njoro district Kenya.
Journal of Economics & Finance. September 1(7), 250-336.
Turyahebwa,A.,Sunday,A. & Ssekajugo,D.(2013):Financial Management Practices
and Business Performance of Small and Medium Enterprises in Western
Uganda. African Journal of Business Management. AcademicJournals.Vol.7(
38), 42-50.
UNCTAD (1997). Business Development Services for MSEs: Preliminary
Guidelines for Donor Funded Interventions. Geneva: UNCTAD
UNIDO, ( 1999). Tanzania Women Entrepreneurs. Vienna : United Nations
Industrial Development Organization.
Warue, B.N. & Wanjira, T.V (2013). Assessing Budgeting Process in Small and
Medium Enterprises in Nairobi’s Central Business District: A case of
Hospitality Industry. International Journal of Information Technology and
Business Management 17(1), 1-11
Waweru, M.G.(2007).Addressing the Different Tax Policy and Tax Administrative
Challenges of Micro, Small and Medium Enterprises. Presentation at the
International Tax Dialogue Global Conference (17-19th
October 2007)
Buenos Aires Argentina.
Wise, S. (2013). The Impact of Financial Literacy on New Venture Survival.
International Journal of Business and Management, 8(23), 30-39.
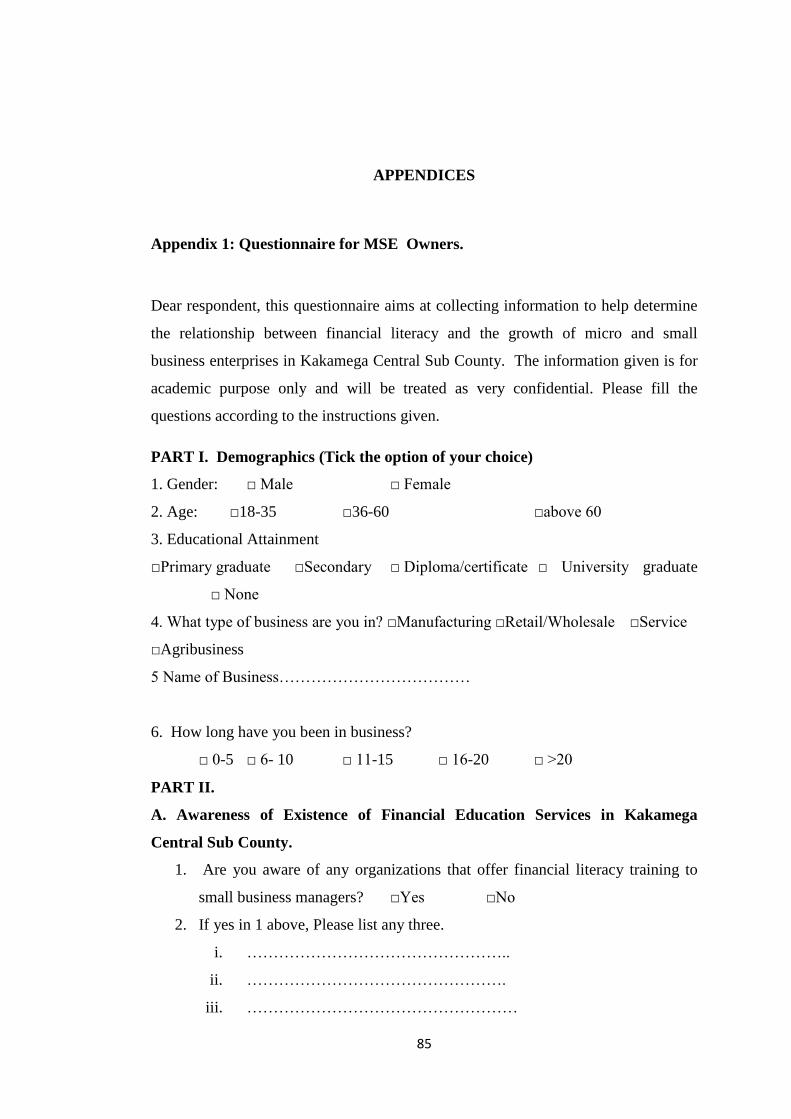
85
APPENDICES
Appendix 1: Questionnaire for MSE Owners.
Dear respondent, this questionnaire aims at collecting information to help determine
the relationship between financial literacy and the growth of micro and small
business enterprises in Kakamega Central Sub County. The information given is for
academic purpose only and will be treated as very confidential. Please fill the
questions according to the instructions given.
PART I. Demographics (Tick the option of your choice)
1. Gender: □ Male □ Female
2. Age: □18-35 □36-60 □above 60
3. Educational Attainment
□Primary graduate □Secondary □ Diploma/certificate □ University graduate
□ None
4. What type of business are you in? □Manufacturing □Retail/Wholesale □Service
□Agribusiness
5 Name of Business………………………………
6. How long have you been in business?
□ 0-5 □ 6- 10 □ 11-15 □ 16-20 □ >20
PART II.
A. Awareness of Existence of Financial Education Services in Kakamega
Central Sub County.
1. Are you aware of any organizations that offer financial literacy training to
small business managers? □Yes □No
2. If yes in 1 above, Please list any three.
i. …………………………………………..
ii. ………………………………………….
iii. ……………………………………………
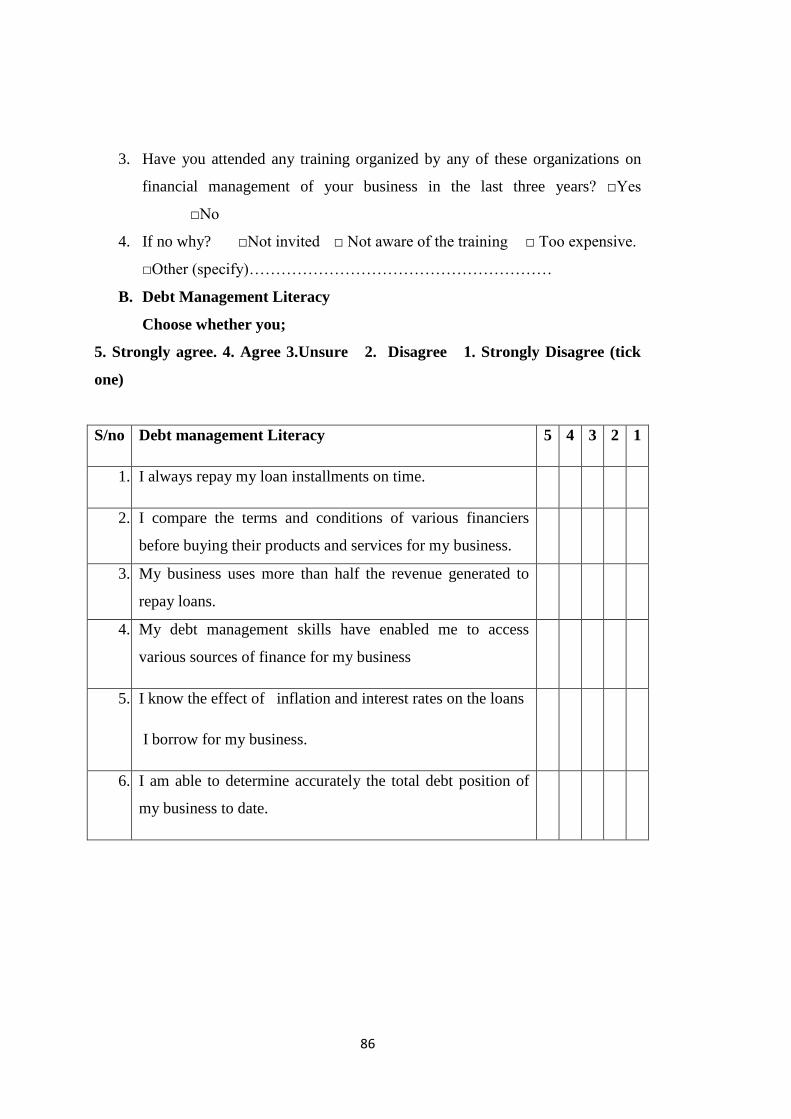
86
3. Have you attended any training organized by any of these organizations on
financial management of your business in the last three years? □Yes
□No
4. If no why? □Not invited □ Not aware of the training □ Too expensive.
□Other (specify)…………………………………………………
B. Debt Management Literacy
Choose whether you;
5. Strongly agree. 4. Agree 3.Unsure 2. Disagree 1. Strongly Disagree (tick
one)
S/no Debt management Literacy 5 4 3 2 1
1. I always repay my loan installments on time.
2. I compare the terms and conditions of various financiers
before buying their products and services for my business.
3. My business uses more than half the revenue generated to
repay loans.
4. My debt management skills have enabled me to access
various sources of finance for my business
5. I know the effect of inflation and interest rates on the loans
I borrow for my business.
6. I am able to determine accurately the total debt position of
my business to date.
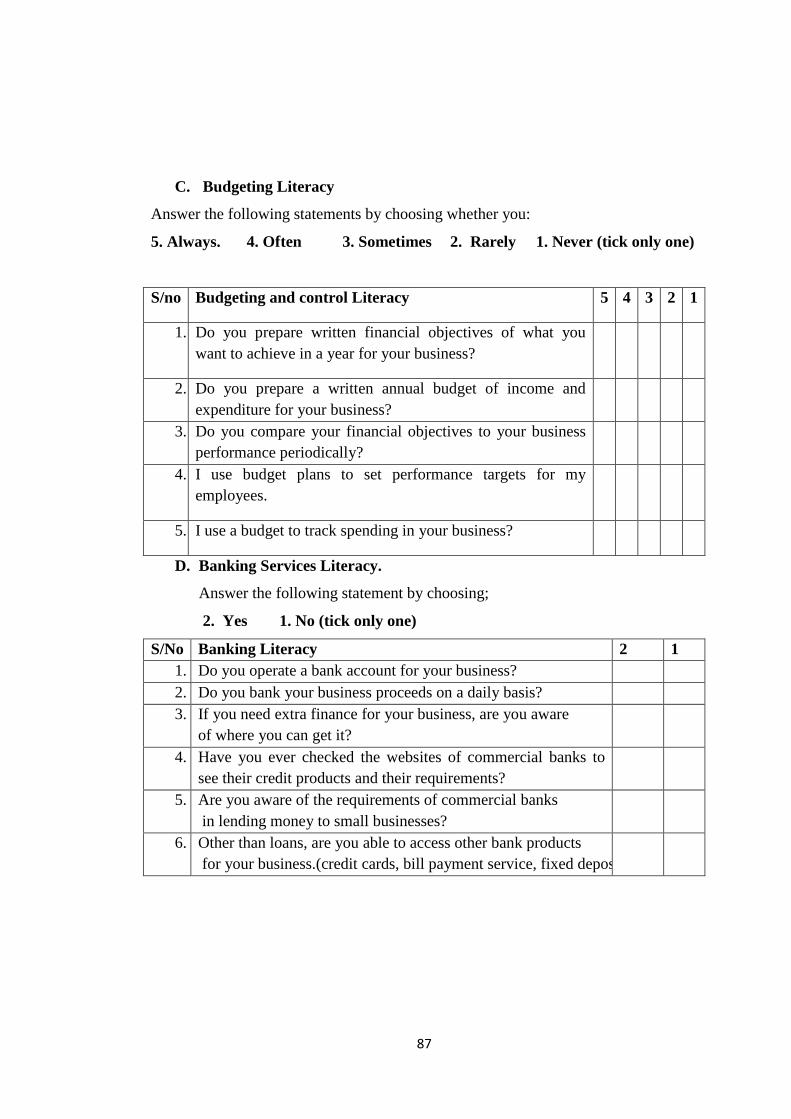
87
C. Budgeting Literacy
Answer the following statements by choosing whether you:
5. Always. 4. Often 3. Sometimes 2. Rarely 1. Never (tick only one)
S/no Budgeting and control Literacy 5 4 3 2 1
1. Do you prepare written financial objectives of what you
want to achieve in a year for your business?
2. Do you prepare a written annual budget of income and
expenditure for your business?
3. Do you compare your financial objectives to your business
performance periodically?
4. I use budget plans to set performance targets for my
employees.
5. I use a budget to track spending in your business?
D. Banking Services Literacy.
Answer the following statement by choosing;
2. Yes 1. No (tick only one)
S/No Banking Literacy 2 1
1. Do you operate a bank account for your business?
2. Do you bank your business proceeds on a daily basis?
3. If you need extra finance for your business, are you aware
of where you can get it?
4. Have you ever checked the websites of commercial banks to
see their credit products and their requirements?
5. Are you aware of the requirements of commercial banks
in lending money to small businesses?
6. Other than loans, are you able to access other bank products
for your business.(credit cards, bill payment service, fixed deposits)
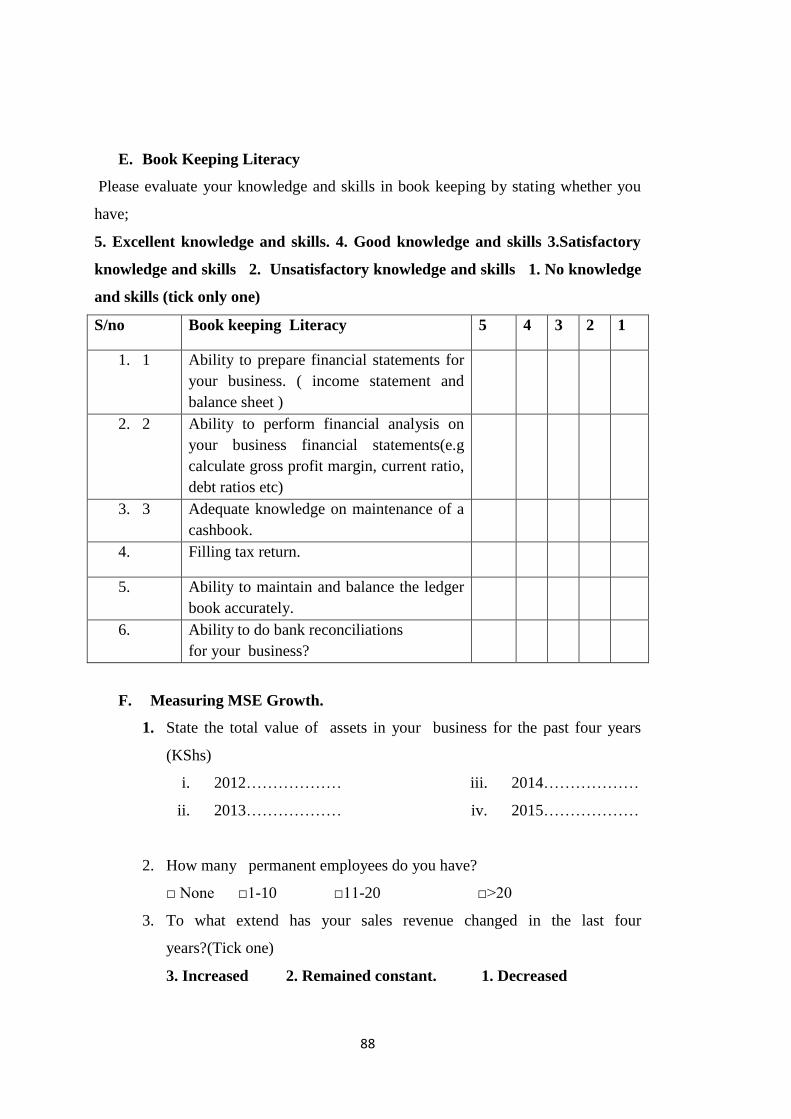
88
E. Book Keeping Literacy
Please evaluate your knowledge and skills in book keeping by stating whether you
have;
5. Excellent knowledge and skills. 4. Good knowledge and skills 3.Satisfactory
knowledge and skills 2. Unsatisfactory knowledge and skills 1. No knowledge
and skills (tick only one)
S/no Book keeping Literacy 5 4 3 2 1
1. 1 Ability to prepare financial statements for
your business. ( income statement and
balance sheet )
2. 2 Ability to perform financial analysis on
your business financial statements(e.g
calculate gross profit margin, current ratio,
debt ratios etc)
3. 3 Adequate knowledge on maintenance of a
cashbook.
4. Filling tax return.
5. Ability to maintain and balance the ledger
book accurately.
6. Ability to do bank reconciliations
for your business?
F. Measuring MSE Growth.
1. State the total value of assets in your business for the past four years
(KShs)
i. 2012………………
ii. 2013………………
iii. 2014………………
iv. 2015………………
2. How many permanent employees do you have?
□ None □1-10 □11-20 □>20
3. To what extend has your sales revenue changed in the last four
years?(Tick one)
3. Increased 2. Remained constant. 1. Decreased
90
4. Are you interested in increasing your financial Knowledge?
□Yes □No
5. If yes in 4 above, which topics would be of interest to you to promote the
growth of your business (Rank them in order of importance where 1-most
important to 6 least important).
□ Budgeting □Loans/Debt management □Investing
□Book keeping. □Banking services □Interest rates and inflation.
Thank you for your cooperation.
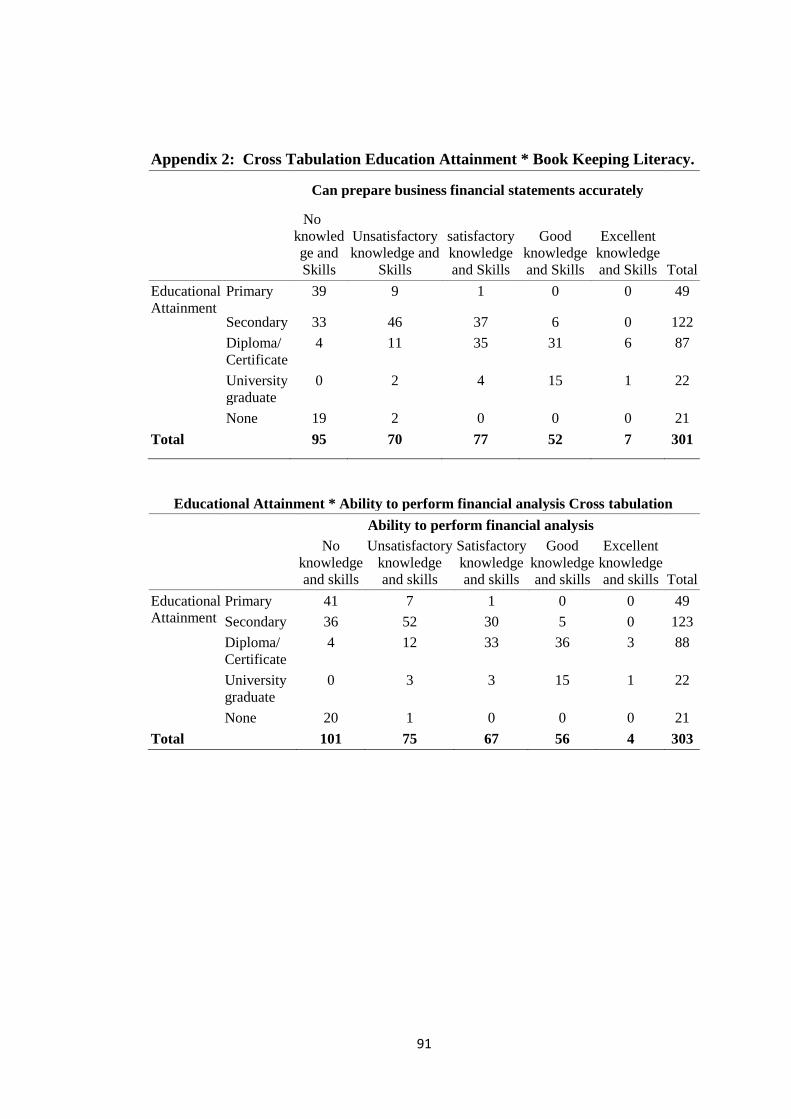
91
Appendix 2: Cross Tabulation Education Attainment * Book Keeping Literacy.
Can prepare business financial statements accurately
Total
No
knowled
ge and
Skills
Unsatisfactory
knowledge and
Skills
satisfactory
knowledge
and Skills
Good
knowledge
and Skills
Excellent
knowledge
and Skills
Educational
Attainment
Primary 39 9 1 0 0 49
Secondary 33 46 37 6 0 122
Diploma/
Certificate
4 11 35 31 6 87
University
graduate
0 2 4 15 1 22
None 19 2 0 0 0 21
Total 95 70 77 52 7 301
Educational Attainment * Ability to perform financial analysis Cross tabulation
Ability to perform financial analysis
Total
No
knowledge
and skills
Unsatisfactory
knowledge
and skills
Satisfactory
knowledge
and skills
Good
knowledge
and skills
Excellent
knowledge
and skills
Educational
Attainment
Primary 41 7 1 0 0 49
Secondary 36 52 30 5 0 123
Diploma/
Certificate
4 12 33 36 3 88
University
graduate
0 3 3 15 1 22
None 20 1 0 0 0 21
Total 101 75 67 56 4 303
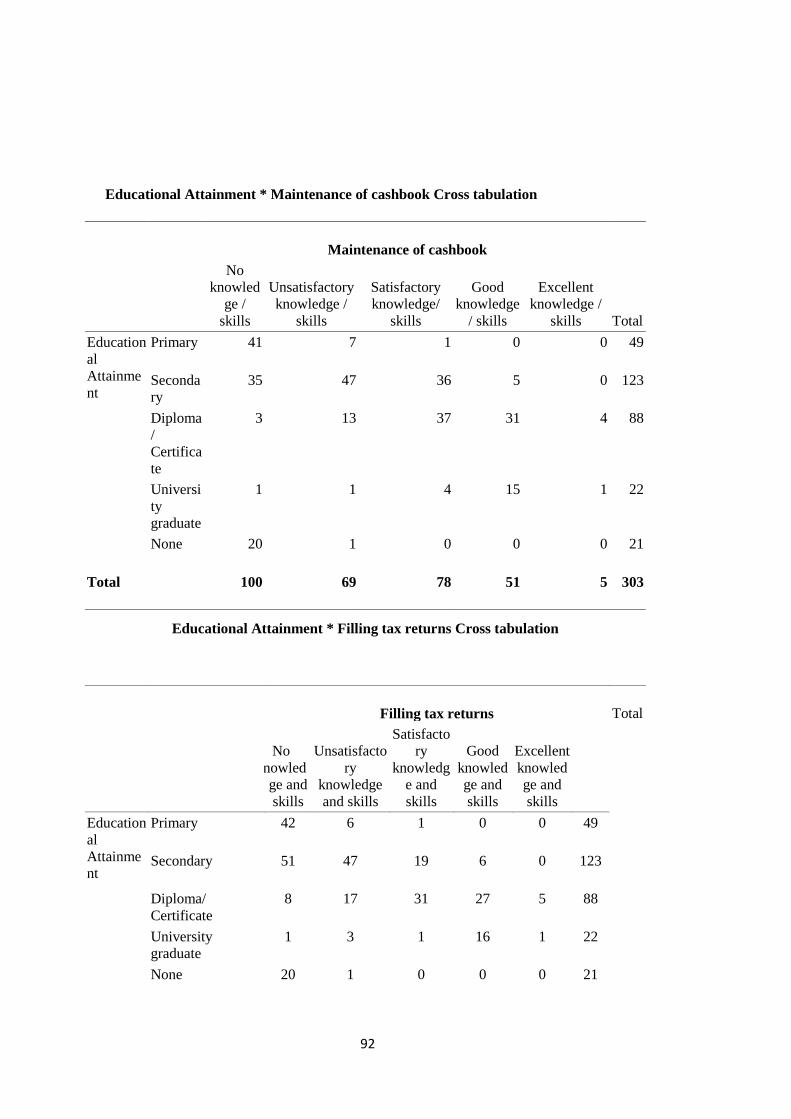
92
Educational Attainment * Maintenance of cashbook Cross tabulation
Maintenance of cashbook
Total
No
knowled
ge /
skills
Unsatisfactory
knowledge /
skills
Satisfactory
knowledge/
skills
Good
knowledge
/ skills
Excellent
knowledge /
skills
Education
al
Attainme
nt
Primary 41 7 1 0 0 49
Seconda
ry
35 47 36 5 0 123
Diploma
/
Certifica
te
3 13 37 31 4 88
Universi
ty
graduate
1 1 4 15 1 22
None 20 1 0 0 0 21
Total 100 69 78 51 5 303
Educational Attainment * Filling tax returns Cross tabulation
Filling tax returns Total
No
knowled
ge and
skills
Unsatisfacto
ry
knowledge
and skills
Satisfacto
ry
knowledg
e and
skills
Good
knowled
ge and
skills
Excellent
knowled
ge and
skills
Education
al
Attainme
nt
Primary 42 6 1 0 0 49
Secondary 51 47 19 6 0 123
Diploma/
Certificate
8 17 31 27 5 88
University
graduate
1 3 1 16 1 22
None 20 1 0 0 0 21
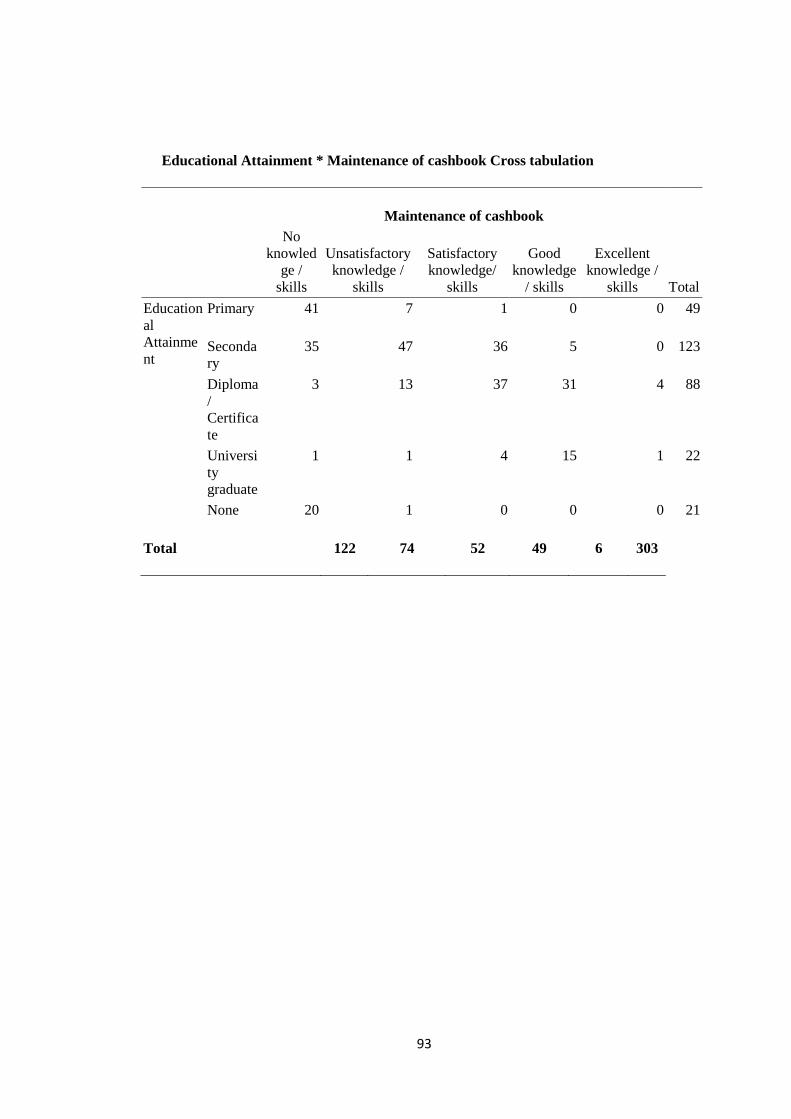
93
Educational Attainment * Maintenance of cashbook Cross tabulation
Maintenance of cashbook
Total
No
knowled
ge /
skills
Unsatisfactory
knowledge /
skills
Satisfactory
knowledge/
skills
Good
knowledge
/ skills
Excellent
knowledge /
skills
Education
al
Attainme
nt
Primary 41 7 1 0 0 49
Seconda
ry
35 47 36 5 0 123
Diploma
/
Certifica
te
3 13 37 31 4 88
Universi
ty
graduate
1 1 4 15 1 22
None 20 1 0 0 0 21
Total 122 74 52 49 6 303
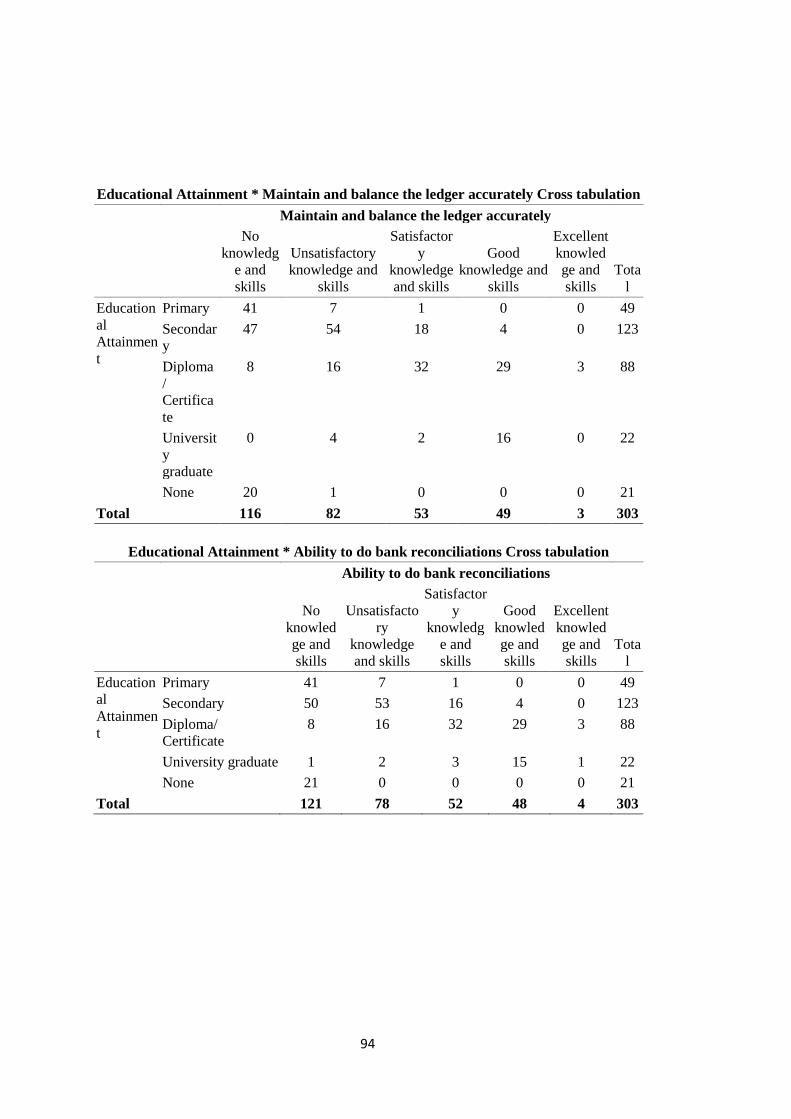
94
Educational Attainment * Maintain and balance the ledger accurately Cross tabulation
Maintain and balance the ledger accurately
Tota
l
No
knowledg
e and
skills
Unsatisfactory
knowledge and
skills
Satisfactor
y
knowledge
and skills
Good
knowledge and
skills
Excellent
knowled
ge and
skills
Education
al
Attainmen
t
Primary 41 7 1 0 0 49
Secondar
y
47 54 18 4 0 123
Diploma
/
Certifica
te
8 16 32 29 3 88
Universit
y
graduate
0 4 2 16 0 22
None 20 1 0 0 0 21
Total 116 82 53 49 3 303
Educational Attainment * Ability to do bank reconciliations Cross tabulation
Ability to do bank reconciliations
Tota
l
No
knowled
ge and
skills
Unsatisfacto
ry
knowledge
and skills
Satisfactor
y
knowledg
e and
skills
Good
knowled
ge and
skills
Excellent
knowled
ge and
skills
Education
al
Attainmen
t
Primary 41 7 1 0 0 49
Secondary 50 53 16 4 0 123
Diploma/
Certificate
8 16 32 29 3 88
University graduate 1 2 3 15 1 22
None 21 0 0 0 0 21
Total 121 78 52 48 4 303
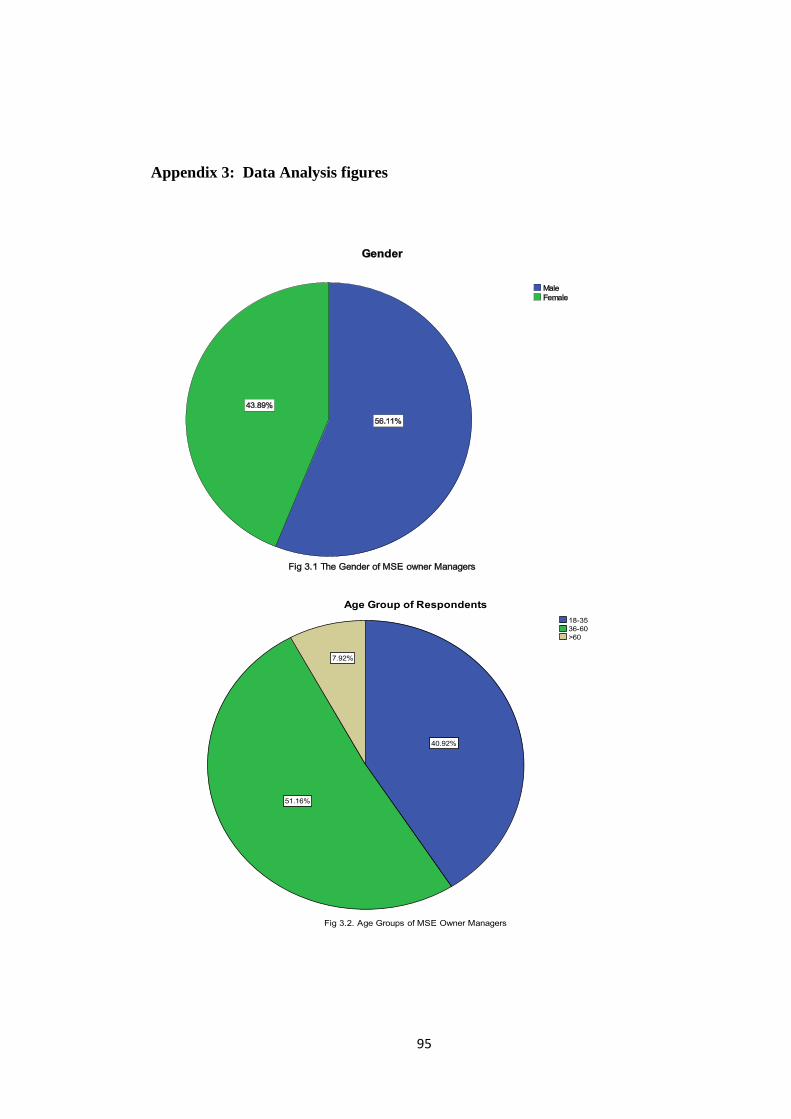
95
Appendix 3: Data Analysis figures
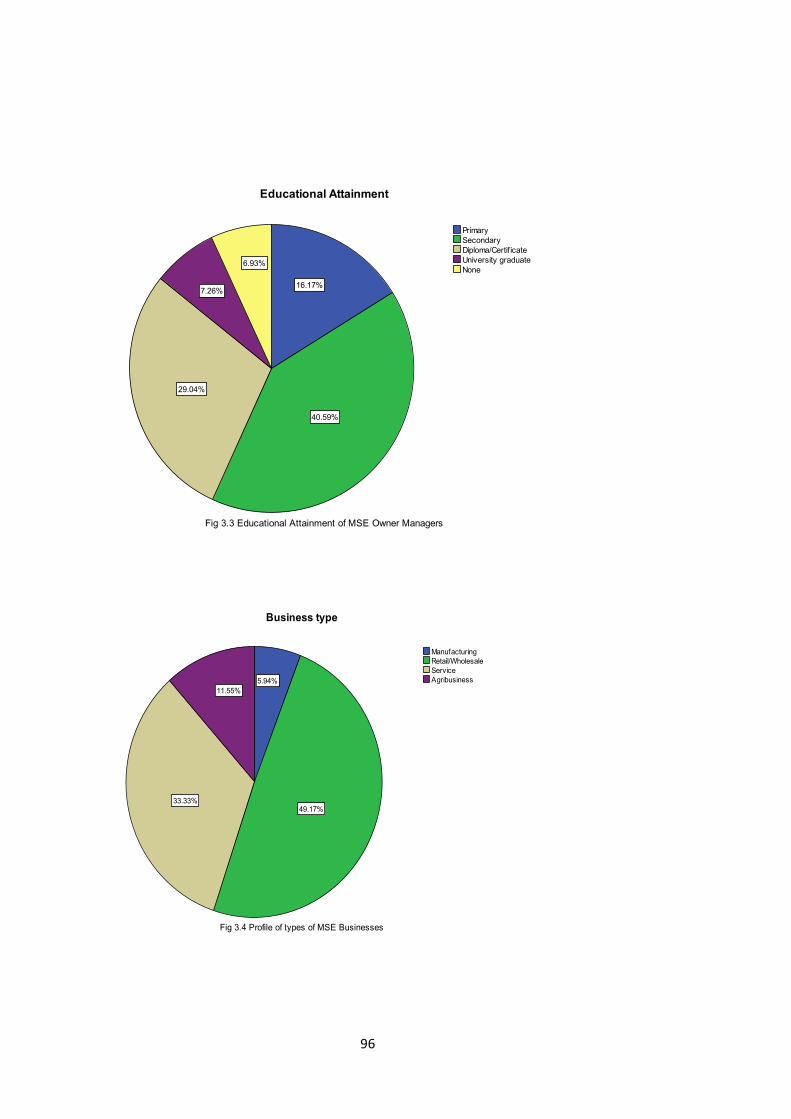
96
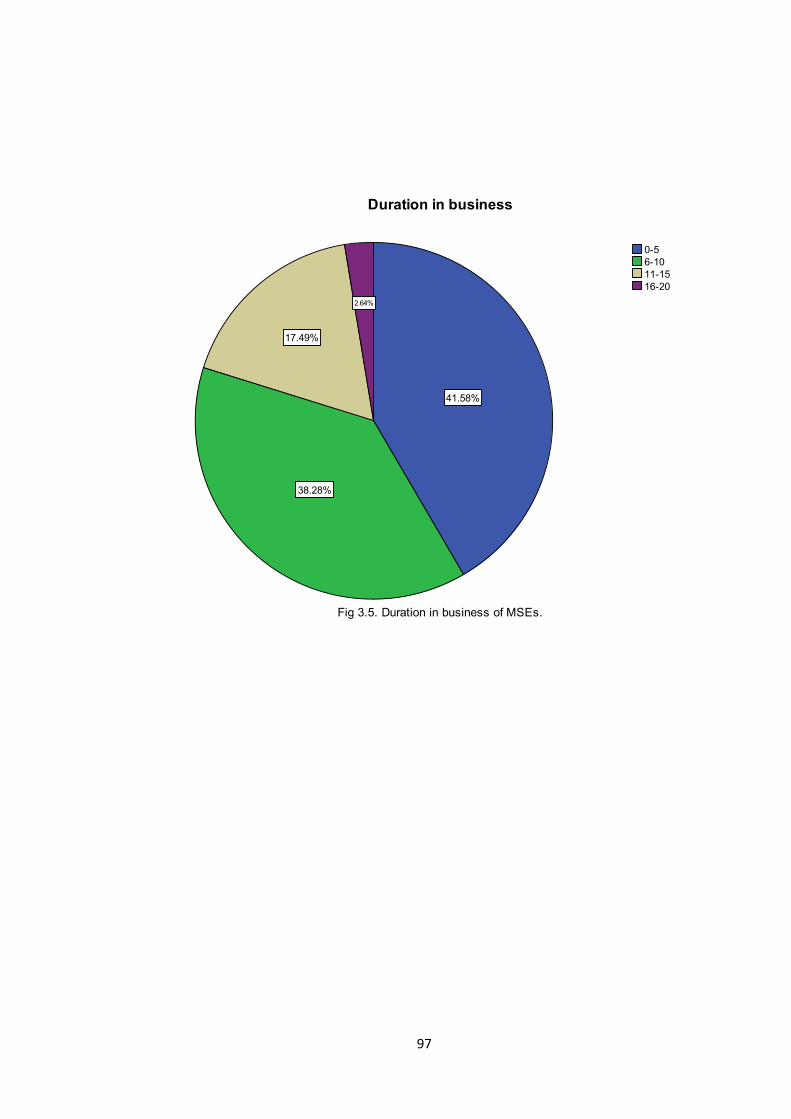
97
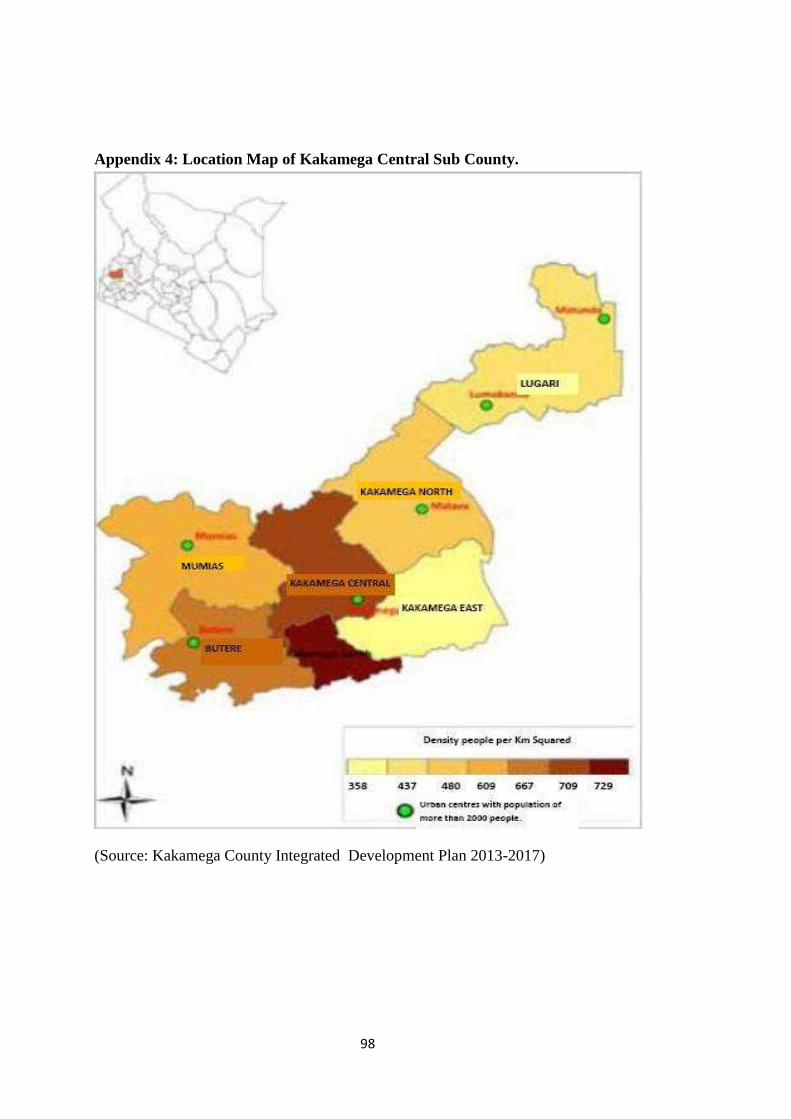
98
Appendix 4: Location Map of Kakamega Central Sub County.
(Source: Kakamega County Integrated Development Plan 2013-2017)

99
Appendix 5: Cover Letter