Embed Size (px)
Citation preview
http://rwe.sciedupress.com Research in World Economy Vol. 11, No. 6; 2020
Published by Sciedu Press 139 ISSN 1923-3981 E-ISSN 1923-399X
Relationship Between Governance and Trade: Evidence From
Sub-Saharan African Countries
Ali Madina Dankumo1, Suryati Ishak2, Yasmin Bani2 & Hanny Zurina Hamzah2
1 Department of Economics and Development Studies, Federal University of Kashere, Gombe, Gombe State, Nigeria
2 School of Business and Economics, Universiti Putra Malaysia, Serdang, Malaysia
Correspondence: Suryati Ishak, School of Business and Economics, Universiti Putra Malaysia, Serdang, Malaysia.
E-mail: [email protected]
Received: July 30, 2020 Accepted: September 23, 2020 Online Published: October 8, 2020
doi:10.5430/rwe.v11n6p139 URL: https://doi.org/10.5430/rwe.v11n6p139
Funding: This work was supported by the IPS Research Grant [grant number 9539700] from Universiti Putra
Malaysia
Abstract
This paper investigates the effect of governance in Sub-Saharan African towards trade. This study utilized panel data
from 1996-2017. This employed Pooled Mean Group approach by categorizing the Sub-Sharan African (SSA)
countries into Low Governance Index (LGI) and Very Low Governance Index (VLGI) countries, considering its
abundant resources. The results of the findings indicate that corruption does not affect trade in LGI countries but
increases that of VLGI countries, signifying that corruption “greases the wheels” of trade in countries with a high
rate of corruption. However, political instability reduces trade for LGI countries, whereas, in VLGI countries, it does
not affect trade, indicating that political instability only impacts in countries with relatively better governance.
Government expenditure, income, and population growth increase trade in LGI countries but does not show any
evidence of impacting trade in the VLGI countries. The study concludes that governance (corruption and political
instability) is a significant determinant of trade in the SSA; hence, the importance of dealing with corruption and
ensuring a stable political environment.
Keywords: governance, corruption, political instability, trade, SSA, PMG
JEL Classification: G30, D73, F55, F10 and C33
1. Introduction
This study investigates the problem of governance (corruption and political instability) in Sub-Saharan Africa (SSA)
that has affected the region via its effects on trade, which manifests its consequences in a high rate of poverty, as
maintained by World Bank, despite its abundantly endowed natural and human resources. Globally, governance
(corruption and political instability) has attracted attentions of governments of nations, international communities,
and organizations such as World Bank, IMF and Transparency International. In the SSA region, governance is
deemed bad when corresponded with other regions of the world as shall be seen later as attested by various
governance scores and measures by the World Bank, Transparency International, International Country Risk Guide
and other organizations that are governance minded.
Public sector corruption is one of the primary probable cause of corrupt governance (Acemoglu & Verdier, 2000) that
directly translates into sub-standard well-being of the society by affecting economic growth and development.
Corruption is also a strong determinant of poor institutional functioning, which, according to The World Bank and
International Monetary Fund, serves as a significant impediment to both economic growth and development. Several
studies share the same opinion that corruption negatively affects economic growth and development (Mauro, 1995;
Dankumo, Ishak, Bani & Hamza, 2019), decelerates inflow of foreign direct investment (Wei, 2001) and sometimes
distort tax revenues (Mauro, 1998). Similarly, corruption also hampers trade (such as Kaufmann & Wei, 1999; De
Jong & Bogmans, 2011; Ben Ali & Mdhillat, 2015). These views favour the "sands the wheels" school of thought
about corruption. On the other hand, some schools of thought favour "grease the wheels" perception that corruption
facilitates growth and efficiency under certain circumstances. For instance, it facilitates exchanges, thus enhancing
efficiency. Corruption stimulates foreign direct investment (Egger & Winner, 2005) and firm entry (Dreher &
http://rwe.sciedupress.com Research in World Economy Vol. 11, No. 6; 2020
Published by Sciedu Press 140 ISSN 1923-3981 E-ISSN 1923-399X
Gassebner, 2013), which is possible only in circumstances where stringent regulations and weak institutions
characterize the economic system. Bribes and inducements are payments to companies and individuals to avoid
stringent bureaucratic bottlenecks that may cause a delay for faster international trade (Beck & Maher 1986; De Jong
& Bogmans 2011; Horsewood & Voicu 2012). However, the effect of corruption on efficiency is detrimental in
countries with low active governance institutions and positive effect in countries with weak institutions (Meon &
Weil, 2010). Hence, the belief that the real impact of corruption will depend on the circumstances it operates.
Political stability is a propensity for change in government or institutional structure, and the incidence of violence or
political turmoil in a society which tends to increase corruption (Del Monte & Papagni (2007). Political instability
and other types of violence- ethnic and religious crisis, militancy and banditry- hurt economic growth and
development (Dankumo, Ishak, Oluwaseyi & Onisanwa, 2019) as it reduces the security of life and property.
Furthermore, political instability also discourages the capital formation that eventually discourages foreign
investment and capital inflow, thereby affecting the economic development of the region (Abu, Karim & Aziz, 2014).
Nonetheless, not all types of political stability are development unsupportive but rather depends on the degree at
which the stability converts its nature of governance into a good one (Hussaini, 2014). The effect of political
instability is more glaring in the trade as it discourages investment, production, and patronage due to the fear of loss,
which individuals strive to avoid.
However, Sub-Saharan Africa has a high rate of corruption and political instability as confirmed by the World Bank,
Transparency International and International Country Risks Guide, when compared to other regions of the world. For
instance, SSA’s control of corruption estimate is average at -0.634 with a very low estimate in 2004 at -0.68003, and
highest in 1996 at -0.56186 (World Bank, 2018). According to Transparency International, SSA countries form 42%
of the most corrupt countries scoring less than 20, constituting 32% of countries with scores between 21 and 40, with
only 17.9% between 50 to 70 on the Corruption Perception Index (CPI) (Transparency International, 2018).
Furthermore, only three out of the 30 countries of SSA that are included in the governance indicators by International
Country Risk Guide's (ICRG) have scored above average (Marleny, 2019). Due to its widespread in the region,
corruption is seen as a systematic way of doing daily life activities and even incorporated in the business of life, as a
respect for the region's local traditions by multinational corporations (Transparency International, 2017). Corruption
has also become part of the people (Hasty, 2005; Smith, 2007; Liedong, 2017), therefore making everyone in the
region to become used to it and as well tolerate it.
Political instability has been threatening the continued existence of most SSA countries which dates to the early
period of independence that witnessed coups and the coup de' tat by the military, leading to lack of consistency and
continuity in the act of governance. Even with the inception of democracy in most of the SSA nations, SSA countries
did not record any meaningful progress in ensuring a stable, violence and crisis-free nations (Muhammad, D'Souza &
Amponsah, 2011). The political stability indicator by the World Bank is average at -0.564 with a very low estimate of
-0.57175 in 2016 and highest at -0.51409 in 2004 (World Bank, 2018a). This estimate shows an unstable political
environment and an increased level of violence or terrorism in SSA that tends to affect trade.
Trade is a significant determinant of economic growth and development by making available goods and services,
technology transfer, economies of scale, efficient utilization of resources, reducing unemployment (e.g. Cain et al.,
2012; Le Goff & Singh, 2014; Tahir & Azid, 2015; Khobai et al., 2017; Shuaibu, 2017). Trade has recently received
considerable attention in the literature due to its role in the development of the global economy, thereby becoming
the most fastest-growing economic activity. For instance, the Asian Tiger countries such as Taiwan, Hong Kong,
South Korea and Singapore experienced economic growth as an outcome of integration and trade (Tahir,
Hasnu & Estrada, 2018). Furthermore, India and China performed economically well after the liberalization of
their trade (Irwin, 2009) via government intervention. The assistance provided by the government in the growth
of industries was through subsidies by paying part of the production cost of goods and services through tax credits or
reimbursement to reduce the cost that ought to be paid by the consumer. The reason is to encourage production and
consumption of commodities produced by industries, especially the export-based, to obtain costs advantages and
increase their international competitiveness. Thus, the products produced will be cheaper and increase the supply for
local consumption and surplus for export to earn foreign exchange, which would then create more jobs, raise income
and enhance well-being ( (Schwartz & Clements, 1999; De Castris & Pellegrini, 2012; Mariani & Mealli, 2018).
However, when subsidies are affected by bad governance- high corruption and political instability, the desired
objective would not be achieved, hence the need to improve governance in SSA countries.
However, SSA countries with abundant natural and human resources imports more, with less exports constituting
mainly primary products in exchange for capital goods needed for developmental purposes. Thereby, recording
current account deficits, making the trade not yielding the desired dividend. This may be due to its bad governance
institutions that affect the free movement of factors and goods into and outside the country. The high corruption and
http://rwe.sciedupress.com Research in World Economy Vol. 11, No. 6; 2020
Published by Sciedu Press 141 ISSN 1923-3981 E-ISSN 1923-399X
political instability distort trade, and affect domestic production through poor infrastructures. Highest volume of
trade was reported in 2008 at $74.25billion, which was due to the world financial crisis recovery measured by the
developed countries who require raw materials and intermediary commodities from the region. The lowest trade
recorded was of $52.58 billion in 2016, which was because of the political crisis that affected the region, leading to
the fall in the agricultural produce and mineral exploration activities (World Bank, 2018). Furthermore, despite
policies aimed at promoting trade, trade did not achieve the desired purpose, therefore, can we attribute the failure to
its nature of governance?
This paper discusses the trade fluctuation in Sub Saharan Africa that may be due to the nature of governance
characterized by a high corruption level, uncertainties, and instability. Hence, there is a need to pay attention to
understanding the role of governance on trade as the record of such varies within countries, with its impact indicating
a high correlation between trade and governance (Dollar & Kraay, 2002). The study achieved this by categorizing the
countries into Low Governance Index (LGI) and Very Low Governance Index (VLGI), to ascertain if the differences
in the level of governance can significantly be noticeable in determining trade in SSA, which is the first of its kind,
to the best of our knowledge.
This paper contains five sections. Section 1 introduces the study, Section 2 reviews the relevant previous literature
that investigates the determinants of trade, and Section 3 presents the methodology and data. Section 4 has the
empirical results, and Section 5 concludes the paper and makes policy recommendations.
2. Literature Review
Trade has continued to impact on many countries' income, right from the era of Mercantilist, Adam Smith, and David
Ricardo. Nonetheless, the theoretical literature on trade and growth are in abundance, while it is scanty for
governance-trade nexus. For instance, Kindleberger (1978) emphasized the magistracy in Adam Smith theory of
international trade which describes three government functions; (i) protection of the society from violence and
injustice (ii), to establish a thorough administration of justice, and (iii) supply of public goods. Whereas, Ricardo (as
quoted in Negishi, 1985) argued that once the security of capital is not under the owner's control, it is subjected to
laws of foreign government; thus, the owner is satisfied with a low rate of profits in his country, rather than to invest
in foreign nations. Therefore, factor movements are restricted, but not prevented by differences in governance factors,
and these limitations resolve itself into variation in trade gains of trade.
Balding (2011) found that governance tends to have a positive and statistically significant impact on trade in
countries with good governance as the country will have the capacity to produce more for export without any
distraction or uncertainty. In the same vein, the study by Ondo (2017) also discovered an optimal edge externally,
whereby a positive impact of democracy on trade was seen in Gabon, and the result shows a convex relationship
between them. At first, democracy decreases trade, and later increases when a hybrid threshold of democracy is more
than 4.576. On the businesses level study, Kaufmann and Wei (1999) argue that corruption impacts trade, as those
firms involved in corruption and bribery will spend longer time with officials in negotiating the amount paid as bribe.
Furthermore, Gil-pareja et al. (2019), suggest that variation between that Corruption Perception Index (CPI) and
Control of Corruption Index (CCI) with Structural Corruption Index (SCI) and the noticed impacts are responsive to
the nature of regional agreement on trade and the level of income of the countries involved in the trade. Mainly,
when using CCI, positive impact of corruption on trade in middle or low-income economy is obvious. However, with
the SCI index, the impact detected was negative in high-income countries.
Similarly, Ur-Rehman and Mohammad (2007) found that trade impact positively on environmental quality. However,
existing corruption level in the economy interferes with this relationship that the increased output level is always
associated with an increased request for environmental quality, which is also counterbalanced by the corruption.
According to Neeman, Paserman and Simhon (2006), corruption is disadvantageous to capital accumulation in open
economies than in closed economies that seems not to have such relationship through capital flight.
In the same vein, Musila and Sigué (2010) supported this view after obtaining a statistically significant and negative
relationship between corruption level in Africa and the volume of exports and imports of goods with their trading
partners. They concluded that if the average corruption index of Africa of 2.8 improved that of Botswana's 5.9, the
exports would increase by 15% while imports by 27%. In a related development, Ben Ali and Mdhillat (2015) argue
that, a high corruption level influences trade flows negatively, but that when it reduces, it improves trade relations.
This was identified after using a gravity model of trade to investigate the impact of corruption on international trade
for 37 countries of the Middle East, North Africa and the European Union for the period 2002-2012. They found that
the impact of corruption is worse in Middle East and North Africa (MENA).
Seyed (2011) argued that corruption was the result of the non-functionality of institutions that make investments
inflow to be unproductive. Hence, corruption affecting the cost of trade, thereby mitigates the quantum of trade. This
http://rwe.sciedupress.com Research in World Economy Vol. 11, No. 6; 2020
Published by Sciedu Press 142 ISSN 1923-3981 E-ISSN 1923-399X
negative impact is mostly seen in the activities of customs, whereby among intra-EU countries trade, corruption
might not have an impact. However, because of the endogeneity problem that arises from the addition of corruption
into gravity model, variable instrumental technique was applied. The level of corruption of those countries exporting
to significantly reduce their volume of trade flows, whereas that of importing countries will have no impact on
intra-EU 25 trade volume.
In line with "grease the wheels" hypothesis, Leff (1964) argued that corruption could upsurge private sector
investment which serves as a hedge over bad policy, thus enhancing economic development in countries with weak
governance institutions. Beck and Maher (1986) consider bribery and corruption generally to be a way of saving time
and effort, i.e. cutting corners, thereby increasing investment and growth. Moreover, corruption can ease
international trade. Most recently, De Jong and Bogmans (2011) found that generally, corruption hinders trade, while
bribe-taking by Customs improves imports (increase trade), especially in countries with ineffective customs service,
as waiting longer at the border decreases trade. By implication, corruption greases the wheel or serve as a lubricant to
trade. In the same vein, Horsewood and Voicu (2012) also argued that corruption tends to enhance international trade,
hence performing as a lubricant, especially in countries with bad governance or weak institutions.
On the other hand, political instability is another outcome of bad governance that generally affects a country's
economic potentials that majorly depends on either domestic or foreign investment. Investment channels hold more
significance for the SSA region since one of the significant increase from regional trade originates from the
stimulation of investment in producing for export-based industries (Jung, 2017). Abdella, Naghavi, Chan and Fah
(2018) found that in BRIC countries, corruption level does not significantly impact on FDI, while on the other hand,
trade and political stability have a significant impact on FDI, though all the relationships are positive.
Political stability is one of the major attractors of investors and donor, as it raises their trust in the particular country
and mobilization of more investment, as foreign businesses have the confidence of making a profit back to their
countries (Jung & Thorbecke, 2003). Therefore, a politically stable country will grow due to an increase in
investment as the investors feel secured of all their investment. The citizens of this country will benefit through
knowledge transfer from foreign investors.
In a similar study on the relationship between trade and political instability, Muhammad, D'Souza and Amponsah
(2011) studied on developed and developing countries, a case of Kenya's increased export to EU after the
post-election violence of 2007/2008 that led to political instability in the country. Rotterdam model was used to
estimate the increase in the demand by EU from Kenya and other rival countries, and they found a structural
variation in import growth level for Kenya, which is close to about 18.6% tariff. By this, political stability is vital to
the increase in the volume of trade in an open economy. In a related study, to explore the association between trade
and two types of political whirling, political instability and polarization, Grechyna (2017) considered both intensive
and extensive boundaries of trade measured by the volume of trade and the trade associates, respectively. They found
that political instability affects trade at both the intensive and extensive boundaries, whereas, political polarization
affects extensive boundaries negatively.
However, in a study recently conducted by Maruta (2018), a contrary view on the impact of governance on trade was
discovered, whereby the effect of trade aid on trade is higher and significantly positive when it interacts with
measures of institutional quality, which contradicts with other studies that suggest a negative relationship of
institutional qualities (corruption and political instability). The future of trade can be influenced by the degree at
which the political system is stable, as well as its policies and programmes, by effectively tackling growing issues of
social worries, such as unemployment, income inequality and poverty (WTO, 2013).
The result of this study shall add to the arguments on the determinants of trade, especially in developing countries
such as the SSA countries, by providing further explanation on whether governance is genuinely responsible for its
trade decline and as well adding to the literature on governance-trade, which is scanty with mixed results due to
methodologies and variables included in the model. The study utilized the Pooled Mean Group (PMG) since the
variables are heterogeneous across the region and exhibit the same behaviour in the long-run. Similarly,
policymakers will have more insight into the importance of governance in determining trade and the need to improve
its quality to attract foreign businesses and investments into the region.
3. Methodology and Data
3.1 Methodology
Most of the previous papers on trade's determinants used the gravity trade model that proceeds from its similarity to
the Newtonian physics. The basic form of gravity equation relates to the positive impact of government size and
negative impact of distance on bilateral trade. Nevertheless, it does not stop the inclusion of more variables affecting
the trade, such as corruption, political instability, income, and population. However, this study diverted for not
http://rwe.sciedupress.com Research in World Economy Vol. 11, No. 6; 2020
Published by Sciedu Press 143 ISSN 1923-3981 E-ISSN 1923-399X
including other variables such as distance, border, common language or trade agreement, because the regional data
were pooled, hence, the use of Pooled Mean Group (PMG) to control for heterogeneity among the countries.
This study shall adopt an econometric model used by previous cross-country studies, (such as Barro, 1991; Ben Ali
and Mdhillat, 2015) using a panel of 38 Sub Saharan African countries.
A model specification for the study, therefore, takes the form below;
𝑇𝑅𝑖𝑡 = 𝛽0 + 𝛽1𝐶𝐶𝑂𝑅𝑅𝑖𝑡 + 𝛽2𝑃𝑆𝑉𝑖𝑡 + 𝛽3𝐺𝐶𝐸𝑋𝑃𝑖𝑡 + 𝛽4𝐺𝐷𝑃𝐶𝐼𝑖𝑡 + 𝛽5𝑃𝑂𝑃𝑖𝑡 + 𝜀𝑖𝑡 (1)
The above equation (1) is without dynamics, therefore to capture the dynamic effect, it can be in an ARDL form,
with the assumption that all the variables included in the model are stationary at the first difference (I(1)) for all the
individual countries while the residual is an I(0) process for all i. Hence, equation (1) can thus be transformed into a
log-regression function as given below;
lnTRit = 𝛽0 + β1𝑙𝑛TRit−1 + β2CCORRit + 𝛽3 𝑃𝑆𝑉𝑖𝑡 + 𝛽4𝑙𝑛𝐺𝐶𝐸𝑋𝑃𝑖𝑡 + 𝛽5𝑙𝑛𝐺𝐷𝑃𝐶𝐼𝑖𝑡 + 𝛽6𝑙𝑛𝑃𝑂𝑃𝑖𝑡 + 𝜀𝑖𝑡 (2)
Where i represents a country and t the period with the variables in natural log form (ln). lnTR is the dependent
variable, which is the natural log of trade as a percentage of GDP. lnTR on the right-hand side of the equation is the
trade lagged by one period to reduce the endogeneity problem of dynamic models. CCORR represent control of
corruption, PSV, the political stability and absence of violence, lnGCEXP, the government consumption expenditure,
lnGDPCI is the per capita income while lnPOP is the population growth rate. All the variables are in their natural log
form, except the governance that is an index. The expected signs for all the explanatory variables are positive.
Based on the problem of heterogeneity bias in dynamic models of Eq (2), Pesaran and Smith (1995) and Pesaran, et
al. (1999) suggested two different estimators used in solving the problem. These are Mean Group (MG) and Pooled
Mean Group (PMG). In these two methods, T must be greater than N or both T & N be substantially large, typically
greater than 20. The main parameters of interest of this method are the long-run effects and as well the speed of
adjustment back to the long-run.
Furthermore, the countries of the region were categorised into two different levels of governance; (i) countries with
low governance index (LGI) and (ii) countries with very low governance index (VLGI). This was determined by
computing the regional average of the governance (proxies by control of corruption and political stability) index,
such that any country whose average governance index (in real terms) falls below it, is categorized as VLGI. In
contrast, countries with higher governance index are LGI countries because the comparison of the SSA data with
Cooray (2009) constructed governance index had informed the computation of the index. Below are the governance
index dummies computed by Cooray (2009).
𝜃 ≥ 1.5 = Very high governance 1.5 > 𝜃 > 0 = High governance
0 > 𝜃 > −1.5 = Low governance 𝜃 ≤ −1.5 = Very low governance
The SSA countries governance index was compared with the above, and the study found that only two countries;
Botswana and Mauritius have low governance, while the rest have very low governance. Hence, the need to use the
regional average to categorize the countries as follows:
𝜃 ≥ 𝐺𝑜�̂�𝑆𝑆𝐴 = Low governance and when 𝜃 < 𝐺𝑜�̂�𝑆𝑆𝐴 =Very low governance
Where 𝜃, is the governance index, and 𝐺𝑜�̂�𝑆𝑆𝐴 is given as 𝐺𝑜𝑣𝑆𝑆𝐴 = 𝐶𝐶𝑂𝑅𝑅𝑖𝑡+ 𝑃𝑆𝑉𝑖𝑡
𝑁,
𝐶𝐶𝑂𝑅𝑅𝑖𝑡 denotes the control of corruption index of the countries i at time t, 𝑃𝑆𝑉𝑖𝑡 depicts the political stability
index, while N is the total number of countries. The purpose of this categorization is to enable us to see whether the
little difference in governance level can explain the variation in trade.
The study conducted panel unit-root tests, using Levin, Lin and Chu (2002), and Im, Pesaran and Shin (2003) and
Augmented Dickey-Fuller (ADF) by Madalla and Wu (1999). Secondly, the descriptive statistics and the correlation
matrix presented paved the way for panel cointegration using Pedroni (2000; 2004). Thirdly, the short-run and
long-run coefficients were estimated using both the MG, PMG and DFE, followed by Hausman test to select the best
estimator (least biasedness). The null hypothesis (H0) is: PMG is more efficient (homogeneity slope is valid), and the
(H1) is MG, and is more efficient (homogeneity slope is invalid). Lastly, the study carried out some robustness check
using imports and exports as a dependent variable each.
3.2 Data
3.2.1 Trade
Trade measures the sum of exports and imports of both goods and services computed as the percentage share of the
http://rwe.sciedupress.com Research in World Economy Vol. 11, No. 6; 2020
Published by Sciedu Press 144 ISSN 1923-3981 E-ISSN 1923-399X
Gross Domestic Product (i.e. (export + import)/Gross Domestic Product) in percentage). This paper focused on the
impact of governance on trade, with other included variables such as income, public expenditure, and population.
3.2.2 Governance (Corruption and Political Instability)
The control of corruption and political stability from the WGI dataset of the World Bank as computed by Kaufmann,
Kraay and Mastruzzi (2008) was used to measure the level of governance. It is computed based on perceptions of a
large number of actors such as private businesses and experts and as well researches conducted by institutes,
non-governmental and international organizations. Control of corruption depicts the level of commitments by the
government to fight corruption. At the same time, political stability and absence of violence measure the level of
commitment by the government in ensuring political stability and a nation free of any form of violence. Governance
data is available for the year 1996-2017, with the score ranging between -2.5 (most corrupt or unstable) and 2.5
(most clean & stable) as used by Gil-Pareja et al. (2019), and Balding (2011) to investigate institutions-trade nexus.
The study also controlled some variables previously used by other studies, such as government expenditure as a
percentage of GDP (Hays et al., 2005), GDP income in constant USD (Tahir et al., 2018), and population growth in
annual percentage of the population (Nuroğlu, 2010; Mbogela, 2019). All these data are from the WDI dataset of the
World Bank spanned over the period 1996-2017.
4. Results and Discussions
The paper categorized the countries into two groups of 20 LGI countries with index less than the 38 selected
countries' average (i.e. LGI < -0.599) and 18 VLGI countries (i.e. VLGI > -0.599). The governance index (-0.599)
was computed by the average of control of corruption and political stability for the 38 selected countries in the
region.
4.1 Descriptive Statistics and Correlation Matrix
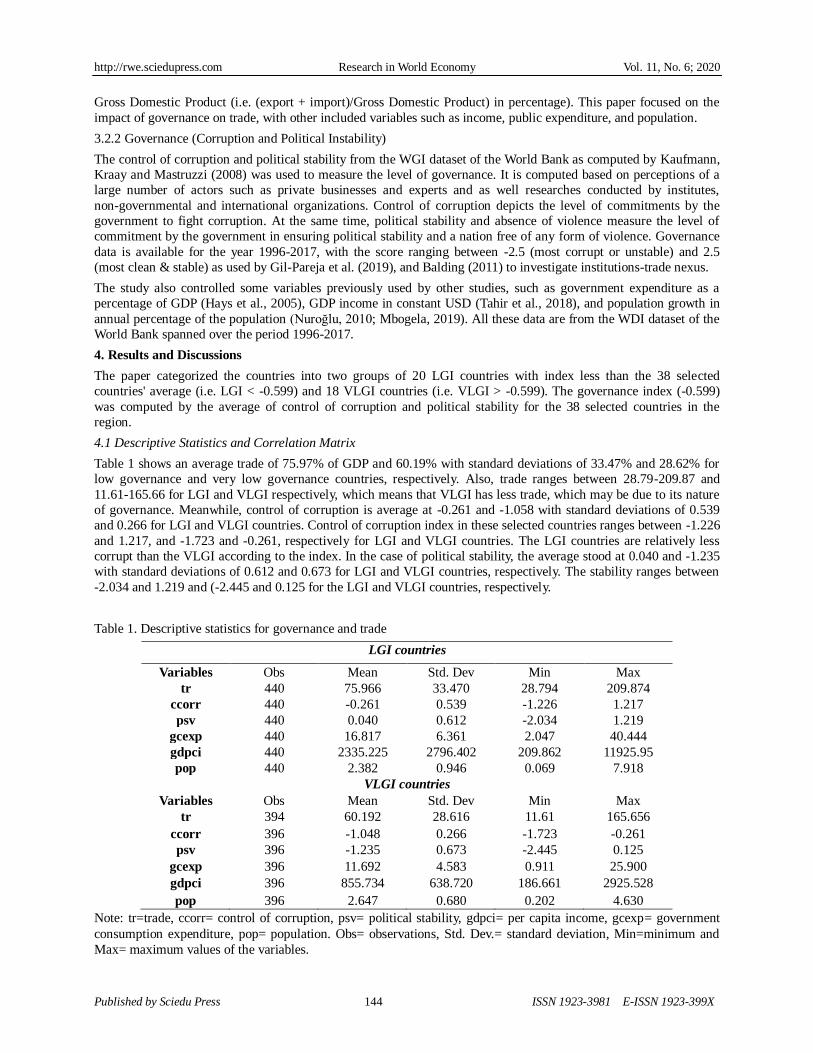
Table 1 shows an average trade of 75.97% of GDP and 60.19% with standard deviations of 33.47% and 28.62% for
low governance and very low governance countries, respectively. Also, trade ranges between 28.79-209.87 and
11.61-165.66 for LGI and VLGI respectively, which means that VLGI has less trade, which may be due to its nature
of governance. Meanwhile, control of corruption is average at -0.261 and -1.058 with standard deviations of 0.539
and 0.266 for LGI and VLGI countries. Control of corruption index in these selected countries ranges between -1.226
and 1.217, and -1.723 and -0.261, respectively for LGI and VLGI countries. The LGI countries are relatively less
corrupt than the VLGI according to the index. In the case of political stability, the average stood at 0.040 and -1.235
with standard deviations of 0.612 and 0.673 for LGI and VLGI countries, respectively. The stability ranges between
-2.034 and 1.219 and (-2.445 and 0.125 for the LGI and VLGI countries, respectively.
Table 1. Descriptive statistics for governance and trade
LGI countries
Variables Obs Mean Std. Dev Min Max
tr 440 75.966 33.470 28.794 209.874
ccorr 440 -0.261 0.539 -1.226 1.217
psv 440 0.040 0.612 -2.034 1.219
gcexp 440 16.817 6.361 2.047 40.444
gdpci 440 2335.225 2796.402 209.862 11925.95
pop 440 2.382 0.946 0.069 7.918
VLGI countries
Variables Obs Mean Std. Dev Min Max
tr 394 60.192 28.616 11.61 165.656
ccorr 396 -1.048 0.266 -1.723 -0.261
psv 396 -1.235 0.673 -2.445 0.125
gcexp 396 11.692 4.583 0.911 25.900
gdpci 396 855.734 638.720 186.661 2925.528
pop 396 2.647 0.680 0.202 4.630
Note: tr=trade, ccorr= control of corruption, psv= political stability, gdpci= per capita income, gcexp= government
consumption expenditure, pop= population. Obs= observations, Std. Dev.= standard deviation, Min=minimum and
Max= maximum values of the variables.
http://rwe.sciedupress.com Research in World Economy Vol. 11, No. 6; 2020
Published by Sciedu Press 145 ISSN 1923-3981 E-ISSN 1923-399X
Government’s consumption expenditure was average at 16.86% and 11.69% with standard deviations of 6.36% and
4.58% respectively for LGI and VLGI countries. It ranges between (.047% and 40.44%, and 0.911% and 25.90% for
the categories. Income in the region was average at $2335.23 and $855.73, with standard deviations of $2796.40 and
$638.72. Income in the selected countries ranges between $209.86 and $11925, and $186.66 and $2925.53 in the two
categories of selected countries. Lastly, in terms of population growth rate, the region has averagely experienced a
growth rate of 2.38% and 2.65% with standard deviations of 0.95% and 0.68%, respectively. The population growth
rate in the region ranges between 0.069% and 7.918%, and 0.202% and 4.630%, respectively.
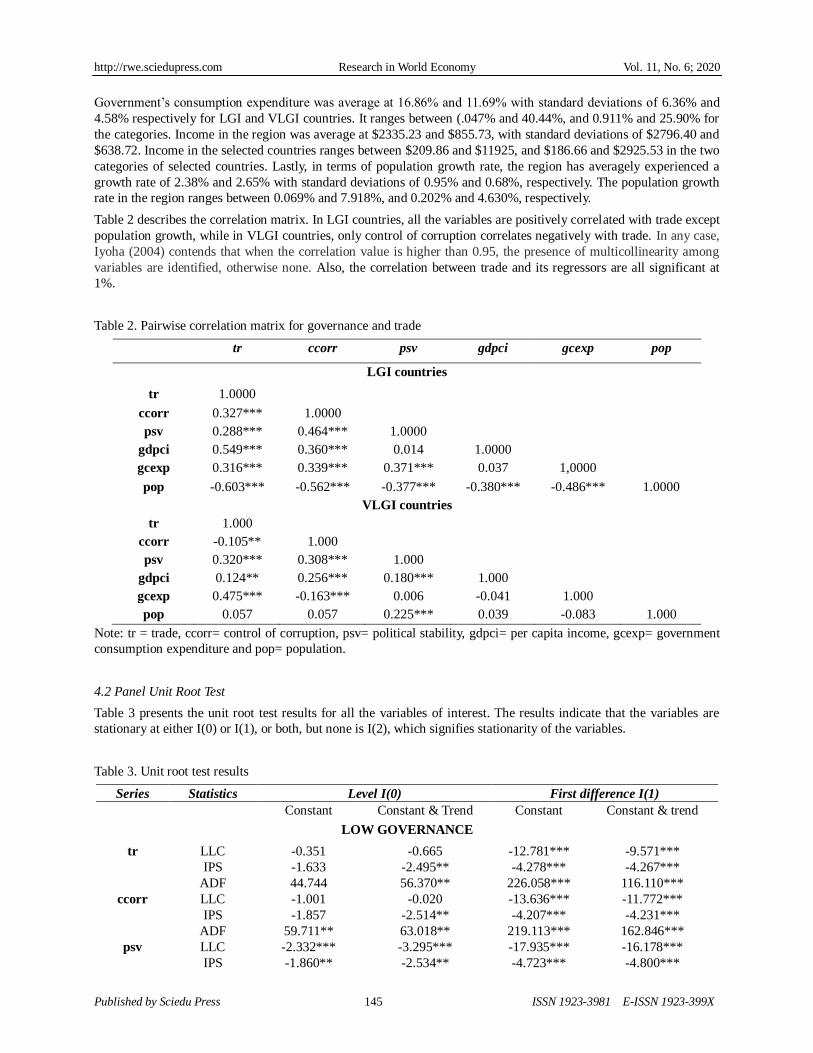
Table 2 describes the correlation matrix. In LGI countries, all the variables are positively correlated with trade except
population growth, while in VLGI countries, only control of corruption correlates negatively with trade. In any case,
Iyoha (2004) contends that when the correlation value is higher than 0.95, the presence of multicollinearity among
variables are identified, otherwise none. Also, the correlation between trade and its regressors are all significant at
1%.
Table 2. Pairwise correlation matrix for governance and trade
tr ccorr psv gdpci gcexp pop
LGI countries
tr 1.0000
ccorr 0.327*** 1.0000
psv 0.288*** 0.464*** 1.0000
gdpci 0.549*** 0.360*** 0.014 1.0000
gcexp 0.316*** 0.339*** 0.371*** 0.037 1,0000
pop -0.603*** -0.562*** -0.377*** -0.380*** -0.486*** 1.0000
VLGI countries
tr 1.000
ccorr -0.105** 1.000
psv 0.320*** 0.308*** 1.000
gdpci 0.124** 0.256*** 0.180*** 1.000
gcexp 0.475*** -0.163*** 0.006 -0.041 1.000
pop 0.057 0.057 0.225*** 0.039 -0.083 1.000
Note: tr = trade, ccorr= control of corruption, psv= political stability, gdpci= per capita income, gcexp= government
consumption expenditure and pop= population.
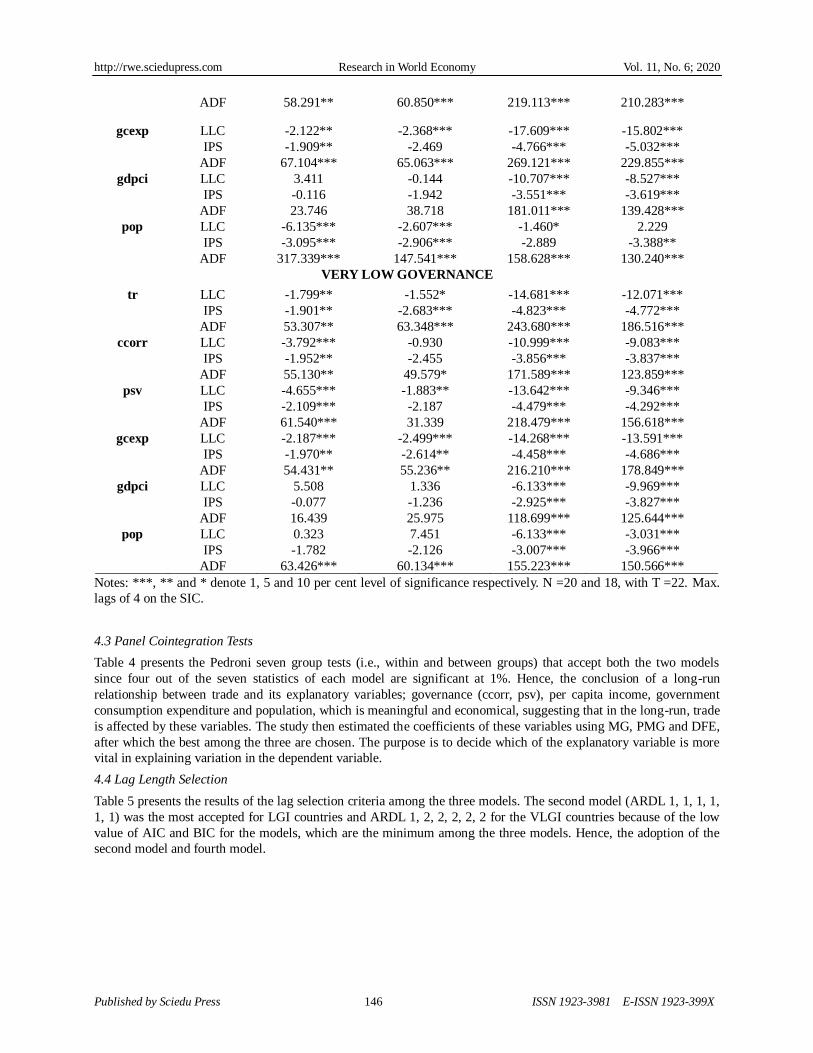
4.2 Panel Unit Root Test
Table 3 presents the unit root test results for all the variables of interest. The results indicate that the variables are
stationary at either I(0) or I(1), or both, but none is I(2), which signifies stationarity of the variables.
Table 3. Unit root test results
Series Statistics Level I(0) First difference I(1)
Constant Constant & Trend Constant Constant & trend
LOW GOVERNANCE
tr LLC
IPS
ADF
-0.351
-1.633
44.744
-0.665
-2.495**
56.370**
-12.781***
-4.278***
226.058***
-9.571***
-4.267***
116.110***
ccorr LLC
IPS
ADF
-1.001
-1.857
59.711**
-0.020
-2.514**
63.018**
-13.636***
-4.207***
219.113***
-11.772***
-4.231***
162.846***
psv LLC
IPS
-2.332***
-1.860**
-3.295***
-2.534**
-17.935***
-4.723***
-16.178***
-4.800***
http://rwe.sciedupress.com Research in World Economy Vol. 11, No. 6; 2020
Published by Sciedu Press 146 ISSN 1923-3981 E-ISSN 1923-399X
ADF 58.291** 60.850*** 219.113*** 210.283***
gcexp LLC
IPS
ADF
-2.122**
-1.909**
67.104***
-2.368***
-2.469
65.063***
-17.609***
-4.766***
269.121***
-15.802***
-5.032***
229.855***
gdpci LLC
IPS
ADF
3.411
-0.116
23.746
-0.144
-1.942
38.718
-10.707***
-3.551***
181.011***
-8.527***
-3.619***
139.428***
pop LLC
IPS
ADF
-6.135***
-3.095***
317.339***
-2.607***
-2.906***
147.541***
-1.460*
-2.889
158.628***
2.229
-3.388**
130.240***
VERY LOW GOVERNANCE
tr LLC
IPS
ADF
-1.799**
-1.901**
53.307**
-1.552*
-2.683***
63.348***
-14.681***
-4.823***
243.680***
-12.071***
-4.772***
186.516***
ccorr LLC
IPS
ADF
-3.792***
-1.952**
55.130**
-0.930
-2.455
49.579*
-10.999***
-3.856***
171.589***
-9.083***
-3.837***
123.859***
psv LLC
IPS
ADF
-4.655***
-2.109***
61.540***
-1.883**
-2.187
31.339
-13.642***
-4.479***
218.479***
-9.346***
-4.292***
156.618***
gcexp LLC
IPS
ADF
-2.187***
-1.970**
54.431**
-2.499***
-2.614**
55.236**
-14.268***
-4.458***
216.210***
-13.591***
-4.686***
178.849***
gdpci LLC
IPS
ADF
5.508
-0.077
16.439
1.336
-1.236
25.975
-6.133***
-2.925***
118.699***
-9.969***
-3.827***
125.644***
pop LLC
IPS
ADF
0.323
-1.782
63.426***
7.451
-2.126
60.134***
-6.133***
-3.007***
155.223***
-3.031***
-3.966***
150.566***
Notes: ***, ** and * denote 1, 5 and 10 per cent level of significance respectively. N =20 and 18, with T =22. Max.
lags of 4 on the SIC.
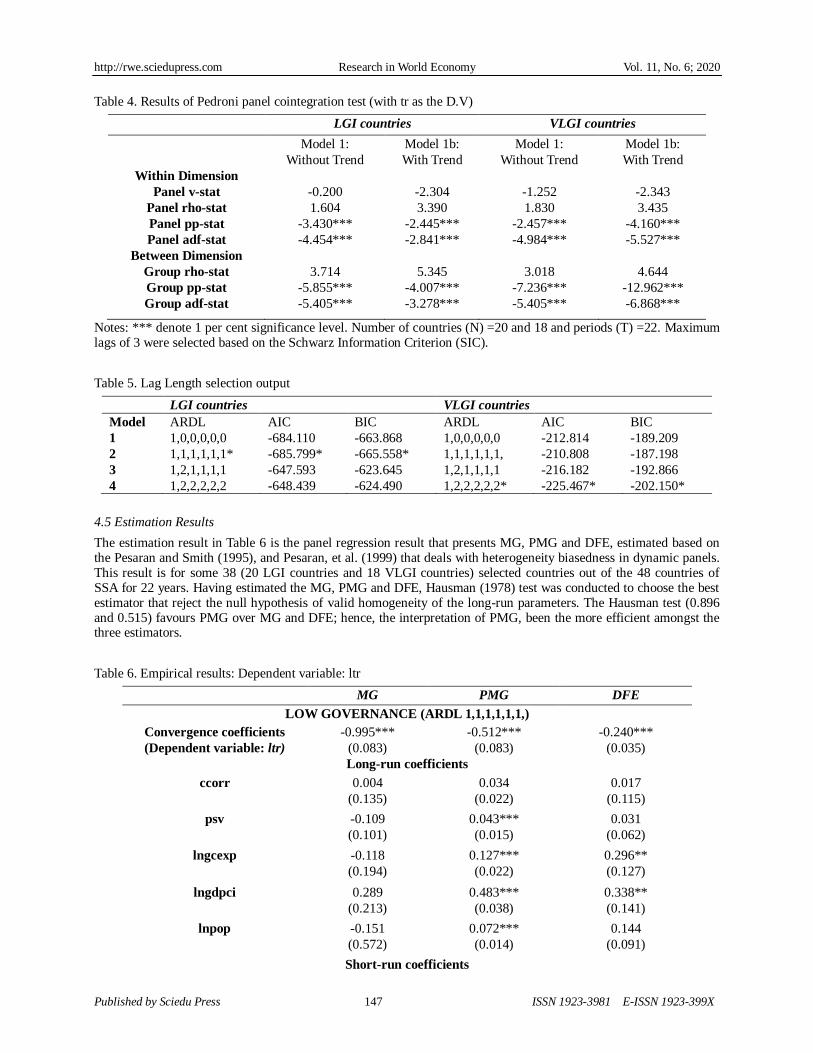
4.3 Panel Cointegration Tests
Table 4 presents the Pedroni seven group tests (i.e., within and between groups) that accept both the two models
since four out of the seven statistics of each model are significant at 1%. Hence, the conclusion of a long-run
relationship between trade and its explanatory variables; governance (ccorr, psv), per capita income, government
consumption expenditure and population, which is meaningful and economical, suggesting that in the long-run, trade
is affected by these variables. The study then estimated the coefficients of these variables using MG, PMG and DFE,
after which the best among the three are chosen. The purpose is to decide which of the explanatory variable is more
vital in explaining variation in the dependent variable.
4.4 Lag Length Selection
Table 5 presents the results of the lag selection criteria among the three models. The second model (ARDL 1, 1, 1, 1,
1, 1) was the most accepted for LGI countries and ARDL 1, 2, 2, 2, 2, 2 for the VLGI countries because of the low
value of AIC and BIC for the models, which are the minimum among the three models. Hence, the adoption of the
second model and fourth model.
http://rwe.sciedupress.com Research in World Economy Vol. 11, No. 6; 2020
Published by Sciedu Press 147 ISSN 1923-3981 E-ISSN 1923-399X
Table 4. Results of Pedroni panel cointegration test (with tr as the D.V)
LGI countries VLGI countries
Model 1:
Without Trend
Model 1b:
With Trend
Model 1:
Without Trend
Model 1b:
With Trend
Within Dimension
Panel v-stat
Panel rho-stat
Panel pp-stat
Panel adf-stat
-0.200
1.604
-3.430***
-4.454***
-2.304
3.390
-2.445***
-2.841***
-1.252
1.830
-2.457***
-4.984***
-2.343
3.435
-4.160***
-5.527***
Between Dimension
Group rho-stat
Group pp-stat
Group adf-stat
3.714
-5.855***
-5.405***
5.345
-4.007***
-3.278***
3.018
-7.236***
-5.405***
4.644
-12.962***
-6.868***
Notes: *** denote 1 per cent significance level. Number of countries (N) =20 and 18 and periods (T) =22. Maximum lags of 3 were selected based on the Schwarz Information Criterion (SIC).
Table 5. Lag Length selection output
LGI countries VLGI countries
Model ARDL AIC BIC ARDL AIC BIC
1 1,0,0,0,0,0 -684.110 -663.868 1,0,0,0,0,0 -212.814 -189.209
2 1,1,1,1,1,1* -685.799* -665.558* 1,1,1,1,1,1, -210.808 -187.198
3 1,2,1,1,1,1 -647.593 -623.645 1,2,1,1,1,1 -216.182 -192.866
4 1,2,2,2,2,2 -648.439 -624.490 1,2,2,2,2,2* -225.467* -202.150*
4.5 Estimation Results
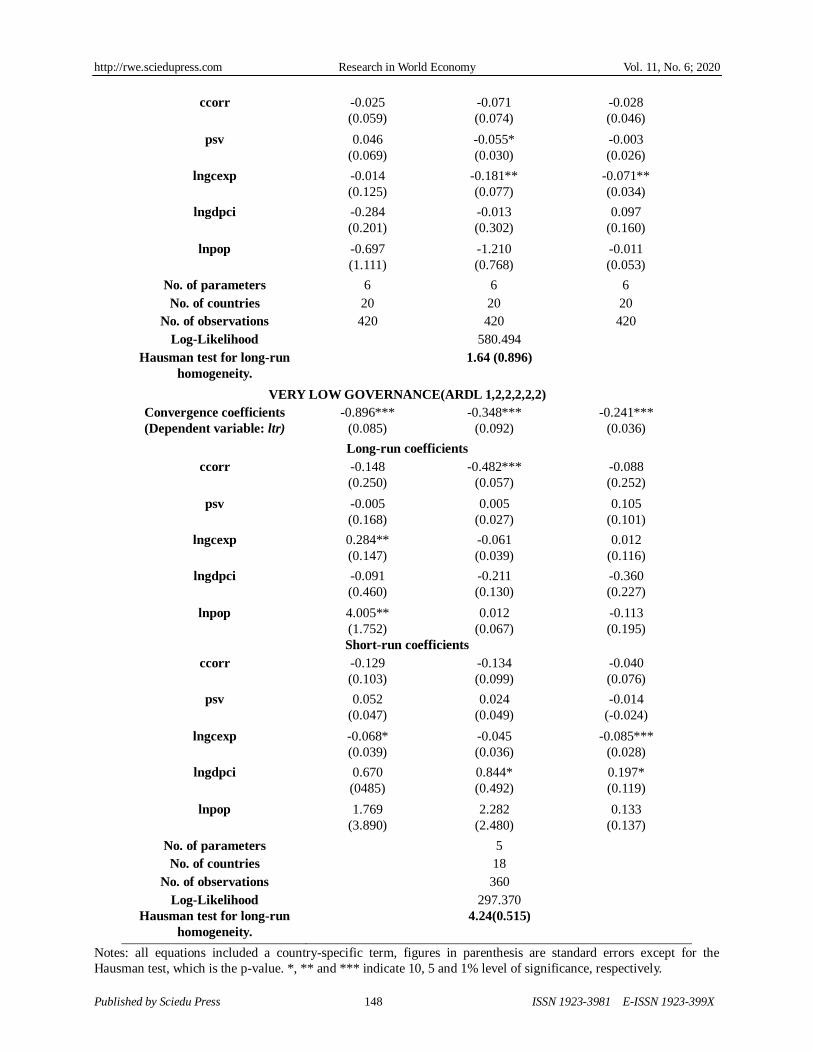
The estimation result in Table 6 is the panel regression result that presents MG, PMG and DFE, estimated based on the Pesaran and Smith (1995), and Pesaran, et al. (1999) that deals with heterogeneity biasedness in dynamic panels. This result is for some 38 (20 LGI countries and 18 VLGI countries) selected countries out of the 48 countries of SSA for 22 years. Having estimated the MG, PMG and DFE, Hausman (1978) test was conducted to choose the best estimator that reject the null hypothesis of valid homogeneity of the long-run parameters. The Hausman test (0.896 and 0.515) favours PMG over MG and DFE; hence, the interpretation of PMG, been the more efficient amongst the three estimators.
Table 6. Empirical results: Dependent variable: ltr
MG PMG DFE
LOW GOVERNANCE (ARDL 1,1,1,1,1,1,)
Convergence coefficients
(Dependent variable: ltr)
-0.995***
(0.083)
-0.512***
(0.083)
-0.240***
(0.035)
Long-run coefficients
ccorr 0.004
(0.135)
0.034
(0.022)
0.017
(0.115)
psv -0.109
(0.101)
0.043***
(0.015)
0.031
(0.062)
lngcexp -0.118
(0.194)
0.127***
(0.022)
0.296**
(0.127)
lngdpci 0.289
(0.213)
0.483***
(0.038)
0.338**
(0.141)
lnpop -0.151
(0.572)
0.072***
(0.014)
0.144
(0.091)
Short-run coefficients
http://rwe.sciedupress.com Research in World Economy Vol. 11, No. 6; 2020
Published by Sciedu Press 148 ISSN 1923-3981 E-ISSN 1923-399X
ccorr -0.025
(0.059)
-0.071
(0.074)
-0.028
(0.046)
psv 0.046
(0.069)
-0.055*
(0.030)
-0.003
(0.026)
lngcexp -0.014
(0.125)
-0.181**
(0.077)
-0.071**
(0.034)
lngdpci -0.284
(0.201)
-0.013
(0.302)
0.097
(0.160)
lnpop -0.697
(1.111)
-1.210
(0.768)
-0.011
(0.053)
No. of parameters 6 6 6
No. of countries 20 20 20
No. of observations 420 420 420
Log-Likelihood 580.494
Hausman test for long-run
homogeneity.
1.64 (0.896)
VERY LOW GOVERNANCE(ARDL 1,2,2,2,2,2)
Convergence coefficients
(Dependent variable: ltr)
-0.896***
(0.085)
-0.348***
(0.092)
-0.241***
(0.036)
Long-run coefficients
ccorr -0.148
(0.250)
-0.482***
(0.057)
-0.088
(0.252)
psv -0.005
(0.168)
0.005
(0.027)
0.105
(0.101)
lngcexp 0.284**
(0.147)
-0.061
(0.039)
0.012
(0.116)
lngdpci -0.091
(0.460)
-0.211
(0.130)
-0.360
(0.227)
lnpop 4.005**
(1.752)
0.012
(0.067)
-0.113
(0.195)
Short-run coefficients
ccorr -0.129
(0.103)
-0.134
(0.099)
-0.040
(0.076)
psv 0.052
(0.047)
0.024
(0.049)
-0.014
(-0.024)
lngcexp -0.068*
(0.039)
-0.045
(0.036)
-0.085***
(0.028)
lngdpci 0.670
(0485)
0.844*
(0.492)
0.197*
(0.119)
lnpop 1.769
(3.890)
2.282
(2.480)
0.133
(0.137)
No. of parameters 5
No. of countries 18
No. of observations 360
Log-Likelihood 297.370
Hausman test for long-run
homogeneity.
4.24(0.515)
Notes: all equations included a country-specific term, figures in parenthesis are standard errors except for the
Hausman test, which is the p-value. *, ** and *** indicate 10, 5 and 1% level of significance, respectively.
http://rwe.sciedupress.com Research in World Economy Vol. 11, No. 6; 2020
Published by Sciedu Press 149 ISSN 1923-3981 E-ISSN 1923-399X
The estimated result shown in the upper panel of Table 6 is for LGI countries, which confirmed the existence of a
long-run relationship, with the long-run adjustment coefficient of error correction term value of -0.512, significant at
1% level. This coefficient signifies the adjustment dynamism in trade, governance, and other explanatory variables in
the LGI countries of SSA. Furthermore, the speed of adjusting back to long-run equilibrium from short-run is 51.2%,
meaning that it will take one year ten months (1/0.512= 1.953) for trade to adjust back to the long-run state,
following the interpretation by Zubair, Abdul-rahim and Dankumo, (2020).
For these LGI countries, control of corruption has an insignificant impact on trade. This finding is contrary to most
cited studies on trade-corruption nexus (Abdella et al., 2018; Beck & Maher, 1986; Ben Ali & Mdhillat, 2015; De
Jong & Bogmans, 2011; Horsewood & Voicu, 2012; Kaufmann & Wei, 1999; Musila & Sigué, 2010) found a
significant impact of corruption on trade with the positive impact in countries having good governance (low
corruption) and a negative impact in countries with bad governance (high corruption). Though, this may be due to
country differences, proxies, other explanatory variables, and the estimation technique used by this study (PMG),
which is different from these previous studies that mostly used OLS, NLS and other techniques.
In LGI countries, political stability revealed a positively significant impact on trade at 1%. The result shows that a 1
unit increase in political stability results in a 4.3% increase in trade in the LGI countries. However, the increase in
political stability entails a decrease in political instability; by this, it then means trade increases with a reduction in
political instability and decreases when political instability rises, signifying a negative connection between trade and
political instability as both export and import are be affected by political instability. This outcome is in line with
previous studies (Abdella et al., 2018; Maruta, 2018; Muhammad, D'Souza & Amponsah, 2011) who found a
negative relationship between political instability with trade and FDI. This outcome indicates the significance of
political stability in the LGI countries for trade to thrive and improve both export and import of capital goods
through investment.
On other independent variables, such as government’s final consumption expenditure as a percentage of GDP is
positively and significantly related to trade at 1% level. This finding is as expected, as an increase in government
expenditure by 1% lead to an increase in the trade by 12.7%, ceteris paribus, and vice versa. Income has a positive
relationship with trade at a 1% level of significance in LGI countries of SSA, which is as expected and in line with
the theory, since the increase in per capita GDP increases the purchasing power of households that will increase
aggregate demand and enhance productivity in the economy, thereby increasing exports and imports ( Tahir et al.,
2018). The study finds that a 1% increase in income in the LGI countries leads to a 48.3% increase of trade and vice
versa. Lastly, population growth relates positively with trade at the 1% significance level, which means that a 1% rise
in population is associated with a 7.2% rise in trade. Alternatively, as the population declines by 1%, it influences
trade negatively by 7.2%, because as the population grow, the volume of trade also increases. Conversely, a higher
population in the long-run tends to reduce income per capita by making the people more dejected, fall in aggregate
demand, thereby causing production and exports to decrease.
The lower panel of Table 6 presents the regression results for VLGI countries of SSA. The results affirmed the
existence of a long-run relationship long-run adjustment coefficient of -0.348 significant at 1% level, signifying the
adjustment dynamism in trade, governance, and other explanatory variables in the VLGI countries of SSA.
Furthermore, the tendency of adjusting back to long-run steady-state from short-run is at a speed of 34.8%, meaning
that it will take two years nine months (1/0.3479= 2.88) for trade to return to the long-run state. Interestingly, this
speed of adjustment is rather high but relatively lower than that of the LGI countries, hence the importance of these
variables in determining trade of the VLGI countries.
In VLGI countries, control of corruption has a negative and significant impact on trade 1% level, indicating that a 1
unit increase in controlling corruption is associated with 48.2% decline in trade. However, increase in the control of
corruption is a decrease in corruption and vice versa. Therefore, it signifies that increase in the corruption in VLGI
countries of SSA increases trade and vice versa. This finding is in line with previous studies in trade-corruption
nexus (Beck & Maher, 1986; Ben Ali &Mdhillat, 2015; De Jong & Bogmans, 2011; Horsewood & Voicu, 2012;
Gil-pareja et al., 2019) who support "greases the wheels" hypothesis. In other words, it serves as a lubricant for trade
by reducing bureaucratic procedures and saving time resulting from bribery collection. This outcome is not a surprise
in VLGI countries of SSA bribe-taking by their Customs, especially in countries with ineffective customs service, as
waiting longer at the border decreases trade. However, political stability, government consumption expenditure,
income and population are not significant in explaining changes in the trade of the VLGI countries of SSA, which
shows that only corruption explains why trade varies for the period under study.
The empirical investigation of the impact of corruption on trade in SSA and other countries was analyzed using
http://rwe.sciedupress.com Research in World Economy Vol. 11, No. 6; 2020
Published by Sciedu Press 150 ISSN 1923-3981 E-ISSN 1923-399X
different techniques such as OLS, NLS and others. However, the results varied, whereby there are positive impact in
countries having good governance (low corruption), and a negative impact in countries with bad governance (high
corruption). The variation in the outcome may be due to the techniques used in estimation by this study (PMG),
which is different from these previous studies that used a different technique and as well as the use of gravity trade
models (GTM) by most of studies. Nonetheless, generally, corruption is discouraging to businesses, as it negates
some specific legal processes that concern trade, e.g. custom operations, which make trade between countries and
even domestic production to be difficult, discouraged, and unattractive, hence trade fails to achieve its desired
purpose of reducing poverty.
4.6 Robustness Check for Governance-Trade Relationship
The robustness of this result is verified by investigating if the governance indexes (corruption and political instability)
jointly and significantly affect trade in both LGI and VLGI countries. Interestingly, for LGI countries, the result
indicates that the governance indexes (corruption and political instability) are not jointly determinants of trade as
evident by the significant probability value of 0.000, which affirms earlier findings that only political instability
affects trade in LGI countries of SSA. Similarly, for VLGI countries, the results show that the indexes cannot jointly
influence trade as confirmed by the p-value of 0.00, which is in line with the findings of the study that show only
corruption to impact on trade, while political instability does not.
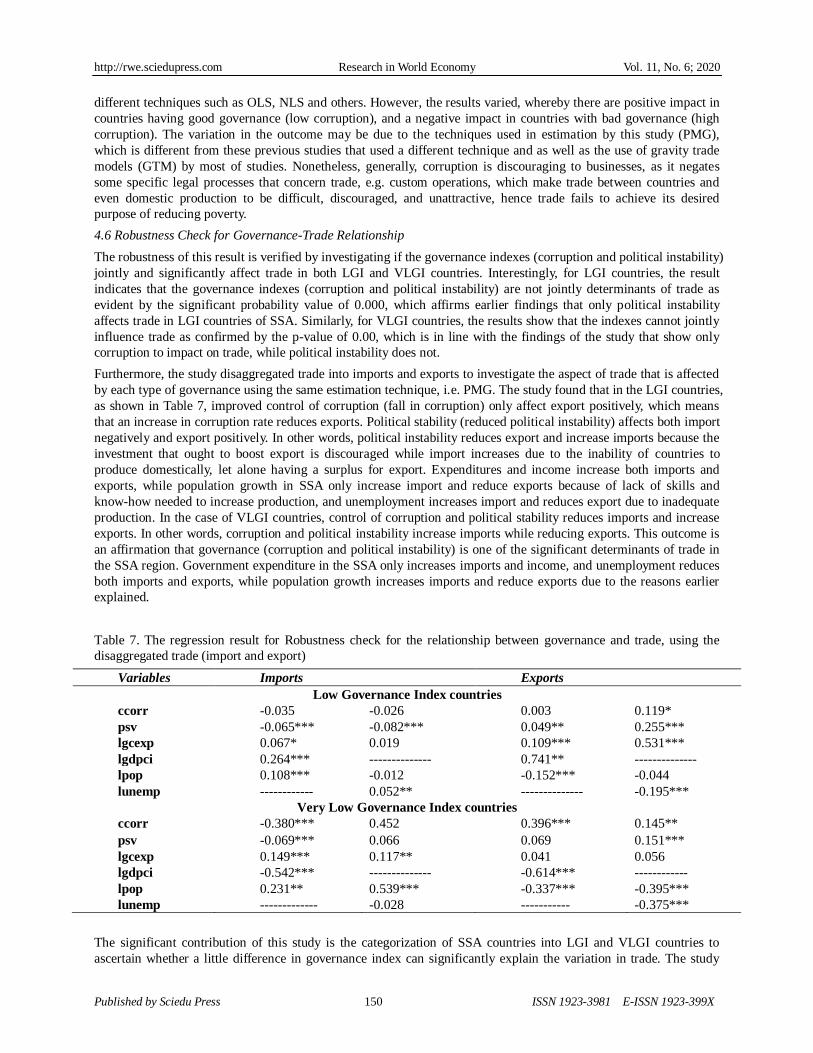
Furthermore, the study disaggregated trade into imports and exports to investigate the aspect of trade that is affected
by each type of governance using the same estimation technique, i.e. PMG. The study found that in the LGI countries,
as shown in Table 7, improved control of corruption (fall in corruption) only affect export positively, which means
that an increase in corruption rate reduces exports. Political stability (reduced political instability) affects both import
negatively and export positively. In other words, political instability reduces export and increase imports because the
investment that ought to boost export is discouraged while import increases due to the inability of countries to
produce domestically, let alone having a surplus for export. Expenditures and income increase both imports and
exports, while population growth in SSA only increase import and reduce exports because of lack of skills and
know-how needed to increase production, and unemployment increases import and reduces export due to inadequate
production. In the case of VLGI countries, control of corruption and political stability reduces imports and increase
exports. In other words, corruption and political instability increase imports while reducing exports. This outcome is
an affirmation that governance (corruption and political instability) is one of the significant determinants of trade in
the SSA region. Government expenditure in the SSA only increases imports and income, and unemployment reduces
both imports and exports, while population growth increases imports and reduce exports due to the reasons earlier
explained.
Table 7. The regression result for Robustness check for the relationship between governance and trade, using the
disaggregated trade (import and export)
Variables Imports Exports
Low Governance Index countries
ccorr -0.035 -0.026 0.003 0.119*
psv -0.065*** -0.082*** 0.049** 0.255***
lgcexp 0.067* 0.019 0.109*** 0.531***
lgdpci 0.264*** -------------- 0.741** --------------
lpop 0.108*** -0.012 -0.152*** -0.044
lunemp ------------ 0.052** -------------- -0.195***
Very Low Governance Index countries
ccorr -0.380*** 0.452 0.396*** 0.145**
psv -0.069*** 0.066 0.069 0.151***
lgcexp 0.149*** 0.117** 0.041 0.056
lgdpci -0.542*** -------------- -0.614*** ------------
lpop 0.231** 0.539*** -0.337*** -0.395***
lunemp ------------- -0.028 ----------- -0.375***
The significant contribution of this study is the categorization of SSA countries into LGI and VLGI countries to
ascertain whether a little difference in governance index can significantly explain the variation in trade. The study
http://rwe.sciedupress.com Research in World Economy Vol. 11, No. 6; 2020
Published by Sciedu Press 151 ISSN 1923-3981 E-ISSN 1923-399X
found that the effect is more severe in the VLGI than the LGI countries. Hence, the need to significantly improve the
quality of governance for increase in trade.
5. Conclusion
Based on the results, corruption does not affect trade in LGI countries but increases trade in the VLGI countries.
Which means that corruption greases the wheels of trade in countries with a high rate of corruption in the form of a
bribe that averts bureaucratic bottlenecks, though only applicable in nations whose bureaucratic bottlenecks are
cumbersome. However, political instability reduces trade of LGI countries only. It is therefore clear that corruption
impacts positively in countries with relatively bad governance than in countries with a relatively good one, while
political instability only impacts in countries with relatively good governance.
Interestingly, distortion in the long-run trade equilibrium adjusts faster in the LGI countries than the VLGI countries
at one year ten months and two years nine months, respectively. Furthermore, corruption does not affect either
imports or exports, but political instability increases import and reduce export in LGI countries. Furthermore, in the
VLGI countries, corruption increases both import and export, while political instability only decreases import. This
outcome confirmed the earlier relationship found between governance and trade. The study, therefore concludes that
corruption is a significant determinant of governance than political instability in this study, because of its higher
impact in the VLGI countries.
The study recommends dealing with corruption by strengthening anti-graft agencies and reformation of the
judiciaries with other oversight functions by the national assemblies to ensure compliance. Employment can be
generated to increase people's income, aggregate demand, and productivity by removing practices that fuel
corruption to create a conducive environment. Lastly, raft laws of punishing defaulters should be formulated, even as
they reform the educational system to inculcate students with the knowledge. In order to ensure political stability, the
SSA countries must be resilient, and include governance that accommodates many individualities and realities of its
citizens. Lastly, hygiene in politics is paramount, as it increases peoples' confidence in the government and lessens
crisis and demonstration. Once these recommendations are implemented, trade is perceived to be improved, that can
significantly contribute to growth and development.
References
Abdella, A. B., Naghavi, N., Chan, B., & Fah, Y. (2018). The effect of corruption, trade openness and political
stability on foreign direct investment : Empirical evidence from BRIC countries. International Journal of
Advanced and Applied Sciences, 5(3), 32–38.
Abu, N., Karim, M. Z. A., & Aziz, M. I. A. (2014). Low savings rates in the Economic Community of West African
States (ECOWAS): The role of the political instability-income interaction. South-East European Journal of
Economics and Business, 8(2), 53–63.
Acemoglu, A., & Verdier, T. (2000). The choice between market failures and corruption. American Economic Review,
90(1), 194–211.
Balding, C. (2011). A re-examination of the Relation between democracy and international trade. Journal of
International Trade and Economic Development, 20(5), 585–603.
Barro, R. J. (1991). Economic growth in a cross-section of countries. Quarterly Journal of Economics, 106(2),
407-443.
Beck, P. J., & Maher, M. W. (1986). A Comparison of Bribery and Bidding in thin Markets. Economics Letters,
Elsevier Science Publishers, 20(1), 1–5.
Ben Ali, M. S., & Mdhillat, M. (2015). Does corruption impede international trade? New evidence from the EU and
the MENA countries. Journal of Economic Cooperation and Development, 36(4), 107–120.
Cooray, A. V. (2009). Government expenditure, governance and economic growth. Comparative Economic Studies,
51(3), 401–418.
Dankumo, A. M., Ishak, S., Bani, Y., & Hamza, H. Z. (2019). The Relationship between Public Expenditure,
Corruption and Poverty in Nigeria. Jurnal Ekonomi Study Dan Penbengunan, 10(4), 76–89.
Dankumo, A. M., Ishak, S., Oluwaseyi, Z. A., & Onisanwa, I. D. (2019). Does Okun’s Law Explain the Relationship
between Economic Growth and Unemployment in Nigeria?. Jurnal Ekonomi Malaysia • Malaysian Journal of
Economics, 53(3), 153-162.
De Castris, M., & Pellegrini, G. (2012). Evaluation of spatial effects of capital subsidies in the south of Italy.
http://rwe.sciedupress.com Research in World Economy Vol. 11, No. 6; 2020
Published by Sciedu Press 152 ISSN 1923-3981 E-ISSN 1923-399X
Regional Studies, 46, 525–538.
De Jong, E., & Bogmans, C. (2011). Does corruption discourage international trade?. European Journal of Political
Economy, 27(2), 385–398.
Del Monte, A., & Papagni, E. (2007). The determinants of corruption in Italy: Regional panel data analysis.
European Journal of Political Economy, 23(2), 379–396.
Dollar, D., & Kraay, A. (2002). Institutions, Trade, and Growth. Journal of Monetary Economics., 50, 133–162.
Dreher, A., & Gassebner, M. (2013). Greasing the wheels? The impact of regulations and corruption on firm entry.
Public Choice, 155(3/4), 413–432.
Egger, P., & Winner, H. (2005). Evidence on corruption as an incentive for foreign direct investment. European
Journal of Political Economy, 21, 932–952.
Gil-Pareja, S., Llorca-vivero, R., & Martínez-serrano, J. A. (2019). Corruption and international trade : a
comprehensive analysis with gravity. Applied Economic Analysis: Emerald Publishing Limited, 27(79), 3–20.
Grechyna, D. M. (2017). Trade Openness and Political Distortions. Munich Personal RePEc Archive, 79951.
Hasty, J. (2005). The pleasures of corruption: Desire and discipline in Ghanaian political culture. Cult. Anthropol..,
20(2), 271–301.
Hays, J., Ehrlich, S., & Peinhardt, C. (2005). Government Spending and Public Support for Trade in the OECD: An
Empirical Test of the Embedded Liberalism Thesis. International Organization, 59(2), 473–494.
Horsewood, N., & Voicu, A. (2012). Does Corruption hinder trade for the new EU members?. Economics: The
Open-Access, Open-Assessment E-Journal, 6(47), 1-28.
Hosseini, H. S. (2011). Does Corruption Mitigate Trade in the EU?. School of Economics and Management Lund
University.
Hussain, Z. (2014). Can political stability hurt economic growth?. Retrieved October 25, 2019, from
https://worldbank.org/endpovertyinsouthasia/can-political-stability-hurt-economic-growth
Im, K. S., Pesaran, M. H., & Shin, Y. C. (2003). Testing for Unit Roots in Heterogeneous Panels. Journal of
Econometrics, 115, 53–74.
Irwin, A. D. (2009). Free Trade Under Fire. Washington, DC.: Princeton University Press.
Jung, J. W. (2017). The Impact of Political Instability on Trade Agreements in Africa. Retrieved June 11, 2018, from
https://www.think-asia.org/bitstream/handle/11540/10760/KIEPopinions_no100.pdf?sequence=3
Jung, S. H., & Thorbecke, E. (2003). The impact of Public education expenditure on Human Capital, growth and
poverty in Tanzania and Zambia: A General Equilibrium Analysis. Journal of Policy Modelling; Elsevier, 25(8),
701–725.
Kaufmann, D., Kraay, A., & Mastruzzi, M. (2008). Governance matters VII: Governance indicators for 1996-2007,
World Bank Policy Research. Washington, DC.
Kaufmann, D., & Wei, S. J. (1999). Does “Grease Payment” Speed up the Wheels of Commerce? Does “Grease
Payment” Speed up the Wheels of Commerce? (Vol. 7093).
Khobai, H., Kolisi, N., & Khobai, H. (2017). The relationship between trade openness and economic growth: The
case of Ghana and Nigeria, (10679).
Kindleberger, C. P. (1978). Government and International Trade. Essays in International Finance, (129).
Le Goff, M., & Singh, R. J. (2014). Does trade reduce poverty? A view from Africa. Journal of African Trade, 1(1),
5-14.
Leff, N. H. (1964). Economic Development through Bureaucratic corruption. American Behavioural Scientist, 8(2),
8-14.
Levin, A., Lin, C. F., & Chu, C. (2002). Unit Roots Tests in Panel Data: Asymptotic and Finite Sample Properties.
Journal of Econometrics, 108, 1–24.
Liedong, T. A. (2017). Combating corruption in Africa through Institutional Entrepreneurship: Peering in from
business-government relations. African Journal of Management-Taylor & Frances Online, 3(3-4), 310-327.
Mariani, M., & Mealli, F. (2018). The effects of R&D subsidies to small and medium-sized enterprises: Evidence
http://rwe.sciedupress.com Research in World Economy Vol. 11, No. 6; 2020
Published by Sciedu Press 153 ISSN 1923-3981 E-ISSN 1923-399X
from a regional program. Italian Economic Journal, 4, 249-281.
Marleny, A. (2019). Corruption, weak governance hinders Sub-Saharan Africa’s economic growth – IMF. Retrieved
January 17, 2019, from
http://www.engineeringnews.co.za/article/corruption-weak-governance-hinders-sub-saharan-africas-economic-g
rowth-imf-2019-01-16/rep_id:4136
Maruta, A. A. (2019). Trade aid, Institutional quality, and trade. Journal of Economics and Business- Elsevier, 103,
25–37.
Mauro, P. (1995). Corruption and Growth. The Quarterly Journal of Economics, 110(3), 681-712.
Mauro, P. (1998). Corruption and the composition of government expenditure. Journal of Public Economics, 69,
263–279.
Mbogela, C. S. (2019). An Empirical Study on the determinants of trade openness in the African Economies.
Advances in Management and Applied Economics, 9(3), 1–2.
Mitra, D. (2016). Trade Liberalization and Poverty Reduction. IZA World of Labor, 1-10.
Muhammad, A., D’Souza, A., & Amponsah, W. A. (2011). Violence, Political Instability, and International Trade:
Evidence from Kenya’s Cut Flower Sector (1961207). Agricultural and Applied Economics Association.
Pittsburgh, Pennsylvania.
Musila, J. W., & Sigué, S. P. (2010). Corruption and international trade: An empirical investigation of African
Countries. World Economy, 33(1), 129–146.
Neeman, Z., Paserman, D., & Simhon, A. (2006). Corruption and Openness (No. 353). Department of Economics,
Hebrew University.
Negishi, T. (1985). Economic Theories in a Non-Walrasian Tradition. Cambridge: Cambridge University Press.
Nuroğlu, E. (2010). The Impact of Population on Bilateral Trade Flows in the case of OIC. In ETICC. Research
gate.net.
Ondo, A. (2017). Trade Openness and Democracy: The Case of Gabon. Modern Economy, 8(3), 191–198.
Pesaran, M. H., Shin, Y., & Smith, R. P. (1999). Pooled Mean Group Estimation of Dynamic Heterogeneous Panels.
Journal of American Statistical Association, 446(621), 621–634.
Pesaran, M. H., & Smith, R. (1995). Estimating long-run relationships from dynamic heterogeneous panels. Journal
of Econometrics, 68, 79–113.
Schwartz, G., & Clements, B. (1999). Government Subsidies. Journal of Economic Surveys, 13, 119–148.
Shuaibu, M. (2017). The Effect of Trade Liberalisation on Poverty in Nigeria: A Micro-Macro Framework.
International Economic Journal, 31(1), 68–93.
Smith, D. J. (2007). A Culture of Corruption: Everyday Deception and Popular Discontent in Nigeria (First).
Princeton, New Jersey, UK: Prince University Press.
Tahir, M., Hasnu, S., & Estrada, M. R. (2018). Macroeconomic determinants of trade openness: An empirical
investigation of SAARC region. Journal of Asia Business Studies, 12(2), 151–161.
Transparency International. (2017). Corruption Perception Index.
Transparency International. (2018). Corruption Perception Index.
Ur-Rehman, F., & Mohammad, N. (2007). Corruption, Trade Openness, and Environmental Quality: A Panel Data
Analysis of Selected South Asian Countries. Pakistan Development Review, 46(4), 673–688.
Wei, S. (2001). Corruption in Economic Transition and Development: “Grease or Sand.” In the Spring Seminar.
Geneva.
World Bank. (2018a). The Worldwide Governance indicators project; political stability and absence of
violence/terrorism.
World Bank. (2018b). World Development Indicators. Washington D.C.
World Bank. (2018c). Worldwide governance indicators: control of corruption.
WTO. (2013). World Trade Report: Factors shaping the future of world trade. Geneva, Switzerland.
http://rwe.sciedupress.com Research in World Economy Vol. 11, No. 6; 2020
Published by Sciedu Press 154 ISSN 1923-3981 E-ISSN 1923-399X
Zubair, O. A., Abdul-rahim, A., & Dankumo, A. M. (2020). Current Research in Environmental Sustainability Does
gross domestic income , trade integration, FDI in fl ows, GDP, and capital reduces CO2 emissions? An
empirical evidence from Nigeria. Current Research in Environmental Sustainability, 2, 1–9.
List of 38 countries included in the study
LGI countries (20): Benin, Botswana, Burkina Fasso, Cape Verde, Comoros, Eswatini, The Gambia, Gabon,
Lesotho, Madagascar, Malawi, Mali, Mauritania, Mauritius, Mozambique, Rwanda, Senegal, South Africa,
Tanzania, Zambia.
VLGI countries (18): Burundi, Cameroon, Central Africa Republic, Chad, Congo DR, Congo Brazzaville, Cote
d'Ivoire, Ethiopia, Guinea, Guinea Bissau, Kenya, Nigeria, Sierra Leone, Sudan, Togo, Uganda and Zimbabwe.
Copyrights
Copyright for this article is retained by the author(s), with first publication rights granted to the journal.
This is an open-access article distributed under the terms and conditions of the Creative Commons Attribution
license (http://creativecommons.org/licenses/by/4.0/).