Embed Size (px)
Citation preview
i
RELATIONSHIP BETWEEN MONETARY POLICY TOOLS AND
INFLATION IN KENYA
BY
NATHAN MWENDA MUTWIRI
A RESEARCH PROJECT SUBMITTED IN PARTIAL FULFILMENT OF THE
REQUIREMENTS FOR THE AWARD OF THE DEGREE OF MASTER OF
SCIENCE IN FINANCE, UNIVERSITYOF NAIROBI
OCTOBER 2013
ii
DECLARATION
This Research Project is my original work and has not been submitted for examination in
any other University.
Signed…………………………………………… Date ……………………………
Nathan Mwenda Mutwiri D63/80950/2012
This Research Project has been submitted for examination with my approval as
University Supervisor.
Signed………………………………………….. Date ……………………………………
Supervisor: Mirie Mwangi
Lecturer, Department of Finance and Accounting
iii
ACKNOWLEDGEMENT
I hereby wish to express my sincere gratitude to my project supervisor, my supervisor Mr.
Mirie Mwangi, Department of Finance and Accounting for his tireless guidance, selfless
dedication and encouragement in making this project a reality. I express my gratitude to the
department for having awarded me a scholarship to undertake the research project
Most important of all I extend my gratitude to the Almighty God for His unmerited favours
each and every stage of the research.

iv
DEDICATION
I dedicate this research project to my wife Deborah and my son Abel for your steadfast
inspiration through ought my endeavours.
v
ABSTRACT
Inflation is a critical aspect of every economy and presents a balancing act to most
governments through regulatory framework. Inflation can break or break the economy of a
nation. Hence policy makers in the government regulating bodies spend considerable time in
developing policies aimed at achieving set targets of inflation which are geared to supporting
the broader economic objectives of an economy. The Central Bank of Kenya (CBK), like
most other central banks around the world, is entrusted with the responsibility of formulating
and implementing monetary policy directed at achieving and maintaining low inflation as one
of its two principal objectives; the other being to maintain a sound market-based financial
system. This study set to establish the relationship of monetary policy tools and inflation in
Kenya. The study employed correlation research design. The study used time series empirical
data on the variables to describe and examine the relationships between monetary policy tools
and inflation. The study used secondary data on the Consumer Price Index, the measure for
inflation, 91-day Treasury bill rate, exchange rate, money supply (M3) and repo rate. The
analyses entailed the computation of the various coefficients of correlation denoted as „β‟ in
the model to determine the relationship of monetary policy tools in and inflation in Kenya.
The study established that inflation and the money supply were positively correlate with each
other. The study established that the general level of prices increase with the increase of
money supply. The study established the 91 Treasury bill rates have an impact on the level of
inflation. This is because the treasury bills rate forms the base of commercial banks interest
rates. Therefore an increase in treasury bills leads to an increase in commercial banks base
lending rate leading to reduction in liquidity therefore reducing the aggregate demand.
Fluctuations of foreign exchange rates were seen to have an effect on the prices. The study
recommends that the policy makers need critically evaluate and monitor the levels of money
supply in Kenya so as to ensure a stable retail price levels. The study also recommends that
the CBK to use 91-day Treasury bills rate in monitoring the level of prices because it has a
significant effect on the level of Inflation in Kenya.
vi
TABLE OF CONTENTS
CHAPTER ONE .......................................................................................................................................... 1
INTRODUCTION ....................................................................................................................................... 1
1.1 Background of the Study ................................................................................................................... 1
Monetary Policy Tools .................................................................................................................... 2
1.1.2 Inflation .................................................................................................................................. 3
1.1.3 Effects of Monetary Policy on Inflation .................................................................................. 4
1.1.4 Monetary Policy Tools and Inflation in Kenya ........................................................................ 5
1.1 Research Problem.................................................................................................................... 6
1.3 Research Objective ........................................................................................................................ 8
1.3.1 Main Objective ....................................................................................................................... 8
1.3.1Specific Objectives ................................................................................................................... 8
1.4 Value of the Study ......................................................................................................................... 9
CHAPTER TWO ....................................................................................................................................... 10
LITERATURE REVIEW ............................................................................................................................. 10
2.1 Introduction ................................................................................................................................. 10
2.2 Theoretical review ....................................................................................................................... 10
2.2.1 Keynesian Theory ................................................................................................................. 10
2.2.2 The Quantity Theory of Money .................................................................................................... 11
2.2.3 Monetarism Theory .............................................................................................................. 13
2.3 Monetary Policy Tools ................................................................................................................. 14
2.3.1 Interest Rates ....................................................................................................................... 14
2.3.2 Open Market Operations ..................................................................................................... 15
2.3.3 Repo Agreement Rate .......................................................................................................... 16
2.3.4 Central Bank Rate ................................................................................................................. 17
2.3.5 The Cash Reserve Ratio ........................................................................................................ 18
2.3.6 Foreign Exchange Market Operations .................................................................................. 18
2.3.7 Money Supply ....................................................................................................................... 19
2.4 Empirical Studies ......................................................................................................................... 20
2.5 Summary of Literature Review .................................................................................................... 23
CHAPTER THREE .................................................................................................................................... 25
RESEARCH METHODOLOGY ................................................................................................................... 25
vii
3.1 Introduction ................................................................................................................................. 25
3.2 Research Design .......................................................................................................................... 25
3.3 Data Collection ............................................................................................................................ 25
3.4 Data Analysis ............................................................................................................................... 26
3.5 Model Specification ..................................................................................................................... 26
CHAPTER FOUR ...................................................................................................................................... 28
4.1Introduction .................................................................................................................................. 28
Table 4.1 Descriptive Statistics .......................................................................................................... 28
4.2 Consumer Price Index .................................................................................................................. 29
Figure 4.1 Consumer Price Index(2008-2012) ............................................................................... 30
4.3 Money Supply .............................................................................................................................. 30
Table 4.2 Quarterly Average Money Supply(M3) ......................................................................... 31
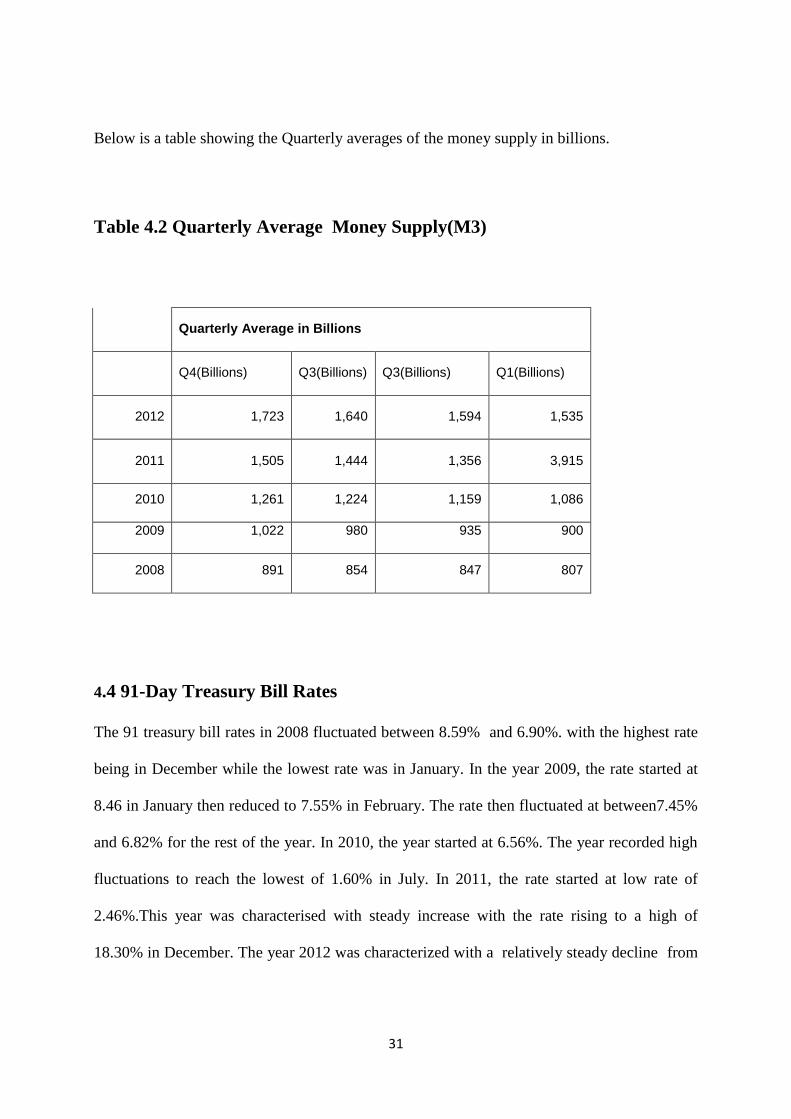
4.4 91-Day Treasury Bill Rates ........................................................................................................... 31
Table 4.3 Quarterly 91 day Treasury Bill average Rate ................................................................. 32
4.5 Exchange Rate (US dollar rate) .................................................................................................... 32
Figure 4.6 Exchange rates (USD rate) ............................................................................................ 33
4.6 Central Bank Rate ........................................................................................................................ 34
Table 4.4 CBR 2008-2012 .............................................................................................................. 34
4.7 Repo Rate .................................................................................................................................... 34
Figure 4.3 Quarterly Repo Rate ..................................................................................................... 35
4.8 Regression Analysis ..................................................................................................................... 36
4.9 Summary and Interpretation of the Findings .............................................................................. 40
CHAPTER FIVE ........................................................................................................................................ 41
SUMMARY, CONCLUSION AND RECOMMENDATIONS.......................................................................... 41
5.1 Introduction ................................................................................................................................. 41
5.2 Summary...................................................................................................................................... 41
5.3 Conclusion ................................................................................................................................... 42
5.4 Policy Recommendations ............................................................................................................ 42
5.5 Limitations of the Study .............................................................................................................. 43
5.6 Suggestions for Further Research ............................................................................................... 43
REFERENCES ...................................................................................................................................... 45
APPENNDIXES .................................................................................................................................... 49
viii
ABBREVIATIONS
CBK Central Bank of Kenya
CBR Central Bank Rate
CPI Consumer Price Index
CRR Reserve Requirement
GDP Gross Domestic product
IT Inflation Targeting
KNBS Kenya national Bureau of statistics
MPC Monetary Policy Committee
NBFIs Non bank Financial Institutions
OMO Open Market Operations
QTM Quantity Theory of Money
REPO Repurchase Agreement
1
CHAPTER ONE
INTRODUCTION
1.1 Background of the Study
The major goals of economic policies include high employment, stable prices and increased
growth. According to Friedman (1968) although there is no common concession that all the
goals are compatible, there is agreement on the roles various instruments can and should play
in aiding the realization of these goals. Monetary policy is one of the instruments that policy
makers use to achieve these desired economic goals. Woodford and Eggertsson (2006) argued
that monetary policies are formulation and execution policies aimed at guiding bank lending
rates to those consistent with supply elasticity with a goal of ensuring there is stable prices
and fostering of economic growth.
Monetary policy is a major policy adopted in many countries to help counter different
economic imbalances. In practice, monetary policies work in coordination with other
instruments, in achieving the stable price levels. The effectiveness of monetary policy tools
and instruments as a economic stabilisation varies across different economies and countries.
The difference in effectiveness is caused by variability of economic structures, financial
markets, and level of development of capital markets among others (Akhtar, 2006).
Jalali (2011) defines inflation as a progressive rise in price level, usually over a period of
time. Inflation is caused by continuous increase in the supply of money, a progressive
decrease for money or both. Governments sometimes increase the quantity of money supply.
If the demand for money was relatively fixed, the increase in price level would grow at the
same rate as money supply. Increase in level of incomes usually causes the demand for money
2
to increase over time. This tempers the inflationary effect of the money growth and the price
levels grows slowly than the money supply. Therefore a higher rate of money supply growth
is expected to cause a higher rate of inflation.
Nation‟s central bank is responsible for formulating and implementing monetary policy. The
formulation of monetary policy centre around developing a plan geared towards at pursuing
the goals of stable prices, full employment and, more generally, a stable financial environment
for the economy. In implementing those plans, Akhtar (1997) suggest that the central bank
uses the tools of monetary policy to induce changes in interest rates, and the amount of money
and credit in the economy. Through these financial variables, monetary policy actions
influence, with considerable time lags, the levels of spending, output, employment and prices
Monetary Policy Tools
The set of monetary instruments employment will always differ from state to state. This is due
to dynamics existing in different economies in respect to economic structures, statutory and
institutional procedures, political systems and ideals, the level of developments of capital
markets among others. The more advanced the economy, the more instruments the policy
makers will have at disposal to bring inflation to the desired levels. In capitalist countries,
monetary authorities use among others following instruments: changes in reserve ratio, open
market operations, discount rates, exchange rates regulations. Adam (2009) found out that
developing countries because of their different economic growth and outlook, different
patterns of production structures usually result to qualitative supervision. Whereas the success
of monetary policy does not necessarily depend on no of wide range of instruments used, it‟s
beneficial to use several coordinated instruments. Among most frequently used monetary
policy tools include: Money supply, repo rate, Open Market operations, Interest rates and
Exchange rates (Handa, 2005).
3
The last few years have been an extraordinary period for many central banks. There has been
a great expansion in breadth and scale of operations in many economies. In amidst these
developments the financial crisis of 2008 – 2010 brought into questions the stability of
markets and the preparedness of unpredicted events in the financial markets in periods of
down turns and instability. Events in the last few years of financial crisis have raised
questions about how central banks manage trade off between price stability, output stability
and financial stability in order to meet the macro economics objectives (King,2013).
Through the period of inflation, and inflation targeting by various governments, the
importance of the trade off between output and inflation stabilisation in the short term has
been well comprehended. Monetary policy is usually regarded as aiming at target inflation in
the long run. This is usually achieved by ensuring that inflation is brought back to the target
within a suitable time horizon in order to avoid excessive fluctuations in real variables such as
output and employment (King, 2013). Optimal monetary policy is seen as best ways of
navigating the short run tradeoffs while still ensuring the long term financial objectives are
met at the same time.
1.1.2 Inflation
Inflation is a subject that is most often discussed today. Politicians to economist usually
engage in endless debates and discussions with promises to fight inflation. However the
inflation is brought about by the same people through money policies and fiscal policies
(Hazlitt, 1960).Inflation is a condition of rising prices (Haberler, 1960). Inflation, always and
everywhere is caused by an increase in the amount of money in supply. Credit poses critical
economic problems of our time inflation management is one of the underlying fact of in any
economy setups. Its one aspect that every country and governments have to contend with in
the modern Economy. This makes in not only the dreaded but also misunderstood economic
phenomena. Inflation has been affecting mankind since the days of barter trade to the
4
developments of medium of exchange, like precious metal (Kasau & Marks, 2011).Whereas it
cannot be disputed that there is no full comprehension of inflation, it remains a threat to all
economies in the world form the developing nations to the super powers. This has led to
development of ways and policies to control inflation.
In periods of inflation there is a general increase in the amount f money in supply. People
have more money to offer for goods (Hazlitt, 1960) in the event that the quantity of goods
supplied does increase as much as the increase of money the price of goods are will generally
go up. This is because each individual unit currency becomes less valuable as there more unit
currencies. The price of goods will rise not because there is a scarce of good but because there
is surplus money available.
1.1.3 Effects of Monetary Policy on Inflation
Although price stability is a useful tool in helping achieve maximum sustainable output,
growth and employment over the long run, it may result to some tension in the short run
between the two goals. When employment levels are reduced, there is a tendency for the
pressure on prices to lessen, this is mainly due to the weakening of the labour market by
easing policy does not have adverse inflationary effects. There are instances where upward
pressure on pressure on price develops as output and employment are softening (Haberler,
1960). This occurs mainly when an adverse supply shock, such as a spike in energy prices has
occurred. In this scenario, any attempts to lower the inflation pressure only compound the
weakness in the economy or attempt to reverse employment losses aggravates inflation. This
poses great dilemma those tasked with monetary policies because they need to decide either to
reduce the rising pressure on prices or cushioning the loss of employment and output.
Before late 2007, there had been advances in both theoretical and empirical studies of
monetary economics had led to the academicians and policymakers to agree that there exist a
5
well defined and established art and science of effective monetary policies. It was generally
agreed that central banks central banks had proven to be effectively successful through their
monetary elements. This success at least in OECD countries had not only kept inflation
relatively but also cushioned against unusual variations. The period since 1980 was referred to
as ``Great Moderation‟‟. This stability made economist, bankers and policy makers to
appreciate their success because it was felt that they could control inflation (Mishkin, 2011).
However as from August 2007 (Mishkin, 2011) the world was hit by what Alan green span,
former Chairman of the Fed, called in congress testimony as a ``once-in-a century credit
tsunami‟‟. The financial crisis from 2007-2009 depleted economic activity in most countries,
led to severe worldwide economic contraction since the great depression. The financial crisis
eroded the confidence of economist, bankers and policy makers of ability to successfully
manage the economy.
1.1.4 Monetary Policy Tools and Inflation in Kenya
The deregulation of economic activities in 1990s established great milestone in the conduct of
monetary policy in Kenya. This is in terms of Objectives, monetary instruments in place and
policy and regulatory and institution framework. In 1996 the Central Bank of Kenya (CBK)
Act was amended to allow CBK more independence and greater operation autonomy in its
functions of formulating and implementing monetary policies. The Act stipulated the main
objective of CBK as formulation and implementation of monetary policy geared to achieving
stability in the general level of prices Rotich et al. (2007). The CBK is also by the Act
expected to foster liquidity, solvency and proper functioning of stable market-based financial
system.
Although economist universally agree that money supply in a market is the main determinant
of general level of prices and that therefore by extension surplus quantity of money supply is
6
the main cause of inflation, the monetary policy transmission mechanisms, which is a
transmission process staring with monetary policy statements, followed by monetary
instruments then real output and inflation, it is not very transparent and clear in most
economies or markets (Barnanke, 2005).
1.1 Research Problem
The quantity theory of money explained that increasing quantity of money supply would lead
to a almost equal percentage of the increase in price of commodities. The theory asserts that
general changes in price are primarily caused by changes in the money in circulation (Ricardo,
1817). The Keynesian theory on the other hand states savings have no positive effect on
investment as long as the economy suffers under employment Keynes explained that an
increase in the general price level or inflation is created caused by an increase in aggregate
demand which is above the aggregate supply. Monetary theory advocates for the idea that
market to regulate itself through market efficiency and reject most of government
intervention. Monetarist argue that an increase in money supply will only lead to increase in
output or production and employment levels in the short run and not in the long run.
Ricardo (1817) study revealed that in the short run expansionary monetary policies will lead
to a decrease in the natural rate of unemployment and increase the production but the
effectiveness of expansionary policies will be inhabited in the long run because they lead to
increase in inflation. Stanislaw et al. (1998) concludes that there is there is a positive linear
relationship between the money supply and inflation. The study found out that monetary
policy tools are very important in ensuring stable markets. Beggs (2010), study on the
relationship between the macroeconomic policies and inflation. found that in Australia. The
study however did not find a direct linear relationship between monetary policy and inflation.
7
The Monetary policies are geared towards achieving some specific set economical objectives
that are expressed in macroeconomic variables such as real output, employment and inflation.
In practice however the effects of the monetary policies are rather indirect than direct. Most
central banks have adopted certain formal inflation target. The target is not universal but
varies with the dynamics of the market in concern. The problem with inflation targeting is that
there is a tendency to ignore other variables of economy at the expense of inflation; this may
cause even more disastrous effects in the economy (Cheruyot, 2012).
Cheng (2006) study on the impact on monetary policy intervention in Kenya showed that
there were significant relationship between the monetary policy and inflation. However the
study established significant time lags. The Central bank Of Kenya (CBK), just like other
monetary controlling institutions in the world is entrusted with the task of formulating and
implementing monetary policies geared towards maintaining a relatively low inflation. In
additional CBK should ensure that there is regulation to maintain a sound based financial
system. In the recent years there has been increasing rate of inflation. Between 2008 and
2012 inflation has fluctuated despite frequent intervention by the central bank monetary
Committee. Most prices of goods have sky rocketed in the same period making the cost of
living unbearable to most Kenyans. The central bank is tasked with the responsibility to
intervene to ensure that inflation is kept at reasonable levels. Whereas CBK has to some
extent managed to intervene, mostly the intervention is too late when the damage is already
caused or the time lags between response and effect have been big or other adverse effect of
monetary policies meant to only controlling inflation.
8
The Keynesian theory suggests that inflation changes are a result of forces of aggregate
demand and supply. On the other hand Quantity of money theory suggests that Quantity of
Money in circulation has a direct impact on inflation. Past studies have showed varying
results on relationship between inflation and monetary policies. The central bank has in the
last few years has mainly focused on the treasury bill rate, the REPO rate, the exchange rate
and the money supply in trying to bring inflation to set levels. In the process of using these
instruments CBK has been met with mixed reactions by the markets and its participants. With
some questioning the impact of CBK tools on inflation .This paper therefore seeks to answer
the question what is the relationship between monetary policy and inflation in Kenya.
1.3 Research Objective
1.3.1 Main Objective
The objective of this research was to establish the relationship between monetary policy tools
employed by Central Bank of Kenya and inflation in Kenya.
1.3.1Specific Objectives
(i) Determine the relationship between the quantity of money supply and inflation rate in
Kenya
(ii) Determine the relationship between the 91 treasury bills rate and inflation rate in Kenya
(iii) Determine the relationship between the Repo rate and inflation rate in Kenya
(iv) Determine the relationship between the Central Bank Rate and inflation in Kenya
9
1.4 Value of the Study
This study is valuable to different stakeholders such as academicians, Scholars, the central
bank and other monetary policy makers. The scholars will benefit from the above study
because it contributes tom the body of knowledge about various monetary policies and their
effects on inflation. Learners are able to analyse how each of the monetary policy instruments
affects the rate of inflation. The research will fill some research gaps from the previous
research done in the past as well as identify new gaps which need to be filled by future
researchers.
Policy makers in regard to inflation will get various insights from the study. The study will
give a feedback to them on how effective the instruments that they use to manage inflation
works. Hence they will be able to narrow down to most effective and reliable instruments.
These can be used in cases where by immediate quick intervention are necessary. The study
will also highlight inefficiencies that may exist in monetary instruments which prevent a
quick response in the markets. This will help the policy makers consider the tag lags between
their actions and the tie the effects is felt in the markets.
The society at large will benefit from the study. Investors, business community, civil society
and mwanainchi at large will gain comprehensive knowledge of monetary policies and their
effects on price levels. This knowledge will help them make more informed decisions when it
comes to investments because they can easily forecast the trend of inflation based on the
policy tools the Central bank is employing at the moment.
10
CHAPTER TWO
LITERATURE REVIEW
2.1 Introduction
This chapter analysis the literature on monetary policy tools and inflation .It evaluates studies
and research papers done on both monetary policies and inflation. In the chapter an in-depth
study of the theoretical framework on which the study is based, measurements of inflation
rates, empirical literature and lastly the chapter summary.
2.2 Theoretical review
2.2.1 Keynesian Theory
This theory was developed by John Maynard Keynes (1883-1946). His ideas referred to as
Keynesianism became very influential to economic policy after great depression (Engelhardt,
2009). Keynes argued that increased savings will not lead to lower interest rates. Therefore
savings have no positive effect on investment as long as the economy suffers under
employment Keynes explained that an increase in the general price level or inflation is created
caused by an increase in aggregate demand which is above the aggregate supply. Keynes
argues that if the economy is at full employment output level, an increase in government
expenditure(G), an rise in private consumption(C) and a rise in private investment(I) will
cause a rise aggregate demand. This leads to a general increase in price levels. This inflation
pressure is due to the fact that at full employment of output with maximum utilization of
scarce resources, an economy is cannot increase its aggregate supply to match the increasing
aggregate demand.
11
Keynes established that there is a positive relationship between consumption(C) and
income(Y) as a function C= f(Y).
The national output (Ys), which is today measured as Gross Domestic Product (GDP), as the
sum of consumer spending (C) and all saving (S)
YS=C+S
To keep it simple, all quantities supplied for a set price and everything that is saved, but not
sold, contribute to GDP. From a demand-oriented perspective, John Maynard Keynes
explained that that aggregate demand (YD), as the expenditures for the above produced GDP,
is determined by consumer spending (C) and investor spending (I):
In open markets and economy, policy makers need to determine if the national output is
demanded in such a way: If national income as aggregate demand (YD) equals (YS), saving
(S)would equal investment (I)Keynes achievement was to demonstrate “that there might be a
disequilibrium that could lead to a later equilibrium with unemployment and price instability”
(Sherman & Gary, 1984). Keynes urged that governments should play a more active role in
the economy .He provides a more specific ways for government to intervene so as to manage
the economy targets especially to the level of employment and inflation.
2.2.2 The Quantity Theory of Money
This theory originated in the sixteenth century when Economist form Europe noticed higher
levels of inflation associated with gold or silver (Investopidia, 2009). This theory proposes a
positive relationship between changes in the money supply and the long- term price of goods.
The theory explained that increasing quantity of money supply would lead to a almost equal
percentage of the increase in price of commodities. The theory asserts that general changes in
price are primarily caused by changes in the money in circulation (Ricardo, 1817). The
12
quantity theory has provided a conceptual framework for interpretation in the contemporary
financial events.
The calculation of money n circulation is based upon the fisher Equation
Money in supply(M)X velocity of money(V)= The average price level(P) X The volume of
transactions in the Economy or simply the aggregate output( Q). Causation is assumed to run
from the left side of the right side the equation. Total spending impacted by changes in
monetary base. The real output growth varies over different periods.
Empirical research papers of the quantity theory of money (QTM) have focused directly on
the relationship between the rate of change of the money stock and inflation. In monetary
Economics, the quantity theory of money is the theory that money supply has a
direct,Proportional relationship with the price level. The theory was challenged by Keynesian
Economics, but updated and reinvigorated by the monetary school of economics. While
Mainstream economists agree that the quantity theory holds true in the long run, there is still a
disagreement about its applicability in the short run. Critics of the theory argue that money
velocity is not stable and, in the short-run, prices are sticky, so the direct relationship between
money supply and price level (Cheruyot, 2012)
The quantity theory of money, despite its affinity with monetarism in Western economics, has
long been one of the accepted doctrines of the socialist monetary authority. The version of the
quantity approach adopted is of course the classical, transactions-based, one rather than the
modern, Friedmanite extension which includes considerations on interest rates, assets and
wealth, and adaptive expectations, among other variables. An idealized scenario of using the
theory in centrally planned economies. (CPEs) is as follows: given the constancy of (or
reliable information on) the velocity of monetary circulation (V) and the level of real output
13
(y), the government could then automatically supply the appropriate amount of money (M) to
the economy to facilitate transactions and maintain stability in the price level (P). Hence
money is endogenous and passive, driven by socialist planning.
The theory therefore asserts that if the money supply growth rate, is greater than the growth of
real output, then velocity moves in the opposite direction in the short run. Excess money
supply growth causes velocity to slow down momentarily, until prices can adjust. Cosgrove
(2005) explains that in a socialist country, the money is influenced by a large number of
economic and political factors, this is more felt when the government is responsible for
providing the purchasing power, industrial and agriculture procurements, wage payments to
city workers and other state financing.
2.2.3 Monetarism Theory
Monetarists like Milton freedman advocates for the market to regulate itself through market
efficiency and reject most of government intervention. Friedman (2000) strongly opposes the
Keynesian view that government spending stimulates the national output. The monetarism
assume a crowding-out effect of governments spending on private investment, especially if
the latter is deficit-financed (Sherman and Evans 1984: 303). The whole monetarist
argumentation will be carefully policy is needed to have been mentioned at this point
(Engelhardt, 2009). According to the monetarist, the money supply though important is the
not the only exclusively determinant of both the level of output and prices in the short run
.However they argue that in the long run the prices are not influenced by the monetary policy.
The monetarist theory explains that when the money supply is increased in order to grow or
increase production and employment, creating an inflationary situation within an economy.
Monetarist argue that an increase in money supply will only lead to increase in output or
production and employment levels in the short run and not in the long run (Stanislaw &
14
Yergin, 1998). There is a positive linear relationship between the money supply and inflation.
They explain the relationship by the natural rate of unemployment.
The theory of natural rate of unemployment argues suggests that there will be a level of
equilibrium output, employment, and corresponding level of unemployment naturally decided
based on the features such as resources employment, and technology. This kind of un
employment is refereed to us the natural un employment. It also notes that there people who
are unemployment because they wish to be unemployed. These are people who are jobless but
are not looking for a job. In the short run expansionary monetary policies will lead to a
decrease in the natural rate of unemployment and increase the production but the effectiveness
of expansionary policies will be inhabited in the long run because they lead to increase in
inflation (Ricardo, 1817)
2.3 Monetary Policy Tools
Monetary policy tools refer to the instruments used by the CBK in line with achieving the
target inflation rates. CBK used several tools to achieve its economic objectives this include
measures aimed at influencing the interest rates and liquidity in the markets.
2.3.1 Interest Rates
The interest rate that concerns the central bank as a monetary policy is the 3 months‟ short-
term interest rate also called the Treasury bill rate which it influences through the sale of short
term government securities and forms the basis for the setting of commercial bank lending
rates. Bernanke (2003) showed that very little of the market's reaction can be attributed to the
effect of monetary policy on the real rates of interest. Robinson (1952) argued that the
financial system does not spur economic growth and that, instead financial development
simply responds to developments in the real sector. Thus, many influential economists give a
15
very minor role, if any, to the role of financial system, particularly the stockmarket in
economic growth. Howells and Keith (2000) argue in their book that, equity prices just like
the price of all assets will respond to changes in interest rates. That is to mean, if the Central
Bank raises the interest rates, for instance, the rate available on the risk-free assets goes up
and if more can be earned on risk-free assets, then the holders of risky shares will want a
higher return as well. The share prices will also fall if the equity market as a whole becomes
more risk averse and demand a higher premium for any level of risk.
2.3.2 Open Market Operations
Open Market Operations (OMOs) refers to the purchase and sale of securities in the open
market by the central bank. Open markets is defined as a perfectly competitive market for
securities though congenitally it indicates the institutional framework of purchase and sale of
approved securities by the central bank (Dasri, 1991).Open markets Operations have been
used by the central banking the Kenya in the implementation of monetary policy. Usually the
central bank outlines the objectives of the OMOs. The central banks usually use the OMOs to
as to correct the supply of the reserve balances as well as adjust for the fluctuations of interest.
Akhtar (1997) argues that monetary policies have undergone significant shifts over the years.
He gives an example the Federal Reserve which in early 1980s places special emphasis on
objectives for the monetary aggregates as policy guides for indicating the state of the
economy and for stabilising price levels. However the ongoing and far reaching changes in the
financial have reduced the usefulness of monetary aggregates as policy guides. This has led
the bans to not only us monetary aggregates at policy guided as a control mechanism is
achieved pre set economic targets.
Monetary policies vary from country to country depending on various factors such as the legal
and institutional setting, the structure of financial system, stages of development in the
16
securities markets and the existence and efficiency of other monetary policy instruments
(Dasri, 1991).In Great Britain, and the United states and several open markets are applied
only to purchase or sale of government securities, both long and short term, and also only to
the outright purchase or sale thereof. This narrow definition is because the markets for
governments of bonds and treasury bills in these countries are sufficiently broad and active for
all the purpose of open market policy; the central bank and not the market took the initiative
in outright purchases or sales of government securities; and lastly because such operations
therefore reflect the deliberate credit policy of the central bank. The preparedness of the
central bank, for instance to buy such securities and acceptances at all times at or close to
market rates was based on its desire to develop and maintain an active money market. On the
contrary, in other countries where government also deals outright in the governments-
guaranteed securities or for other reasons, such transactions should be included under Open
market Operations (Dasri, 1991)
The central bank of Kenya open market operations refers to action by the CBK through
purchase and sales of eligible securities to regulate the monetary supply and their credit
conditions of the economy (Central Bank of kenya, 2011). OMO can be used to stabilise the
short term interest rates. This is because when the central bank buys securities on the open
markets, it leads to increase of the reserves of commercial banks, making it possible for them
to expand their loans. This leads further lead to increase of money supply so as to achieve the
desired level of money supply.
2.3.3 Repo Agreement Rate
Short term interest has not been the most important instruments in conducting monetary
policy in Kenya because of many interrelated factors. This has largely been caused by the
dynamics of the market and the inefficiencies which exist in the financial markets. The
competitiveness of the banking sector has also not made it easy for the central bank. This has
17
made the central bank to place a lot of weight on the attention to the quantity base instruments
to monetary control, exchange rate interventions and the changes in minimum reserve
requirements in conducting monetary policy (Rotich, Kathanje, & Maana, 2007). CBK has
therefore naturally resulted to using mainly monetary policy as the main tools in maintaining
the inflation to the preferred levels. McCallum (1999) argued that as a result of uncertainty in
measuring real interest rates and large external and domestic shock makes monetary
aggregates a preferred instruments Taylor (1993).
Repurchase Agreements (Repos) entail the sale of eligible securities by the CBK to reduce
commercial banks deposits held in CBK. Currently, Repos (often called Vertical Repos) have
a fixed tenor of 7days. Reverse Repos are purchases of securities from commercial banks by
the CBK during periods tighter than desired liquidity in the market. Horizontal Repos are
transactions between commercial banks based on signed agreements using government‟s
securities as collateral and have negotiated tenors and yields (Central Bank of kenya, 2011)
Commercial banks short of deposits at the CBK, borrow from banks with excess deposits on
the security of an appropriate asset, normally government securities. The horizontal repos help
banks to overcome the problem of credit limits hence promoting interbank liquidity.
2.3.4 Central Bank Rate
The level of the CBR is usually reviewed by the Monetary Policy Committee (MPC) at least
once after every two months. The level of CBR usually is seen to reflect or signal monetary
policy stance at the specific time.CBR can be argued to be the base for all monetary policy
operations in order to enhance clarity and certainty in monetary policy implementation.
Whenever the central banks are injecting liquidity through a reverse repo, the CBR is the
lowest acceptable rate. (Central Bank of kenya, 2011). On the other hand whenever the bank
intends to withdraw liquidity through a Vertical repo, the CBR is the highest rate that the
CBK will pay on any bid received (Central bank of kenya, 2012).
18
Movements in the CBR are reflected in the short-term changes in interest rates. When the
Monetary Policy Committee reduces the CBR it signals a easing monetary policy and a desire
for markets rates to move downwards. When there is lower markets interest rates, economic
activities are spurs hence more growth. When the interest rates decline, the quantity of credit
demanded by the market should increase. Efficiency in the repo and interbank is crucial for
transmission of the monetary policy decisions (Central bank of kenya, 2012).
2.3.5 The Cash Reserve Ratio
The Kenyan Banking law requires that a proportion of commercial banks deposit liability
must be deposited at the CBK. This proportion is referred to as the Cash Reserve Ratio
(CRR). The deposits are held at the CRR account. The current ratio stood at 5.25 percent of
total bank deposits both domestic and foreign currency deposit liabilies (Central bank of
kenya, 2012).To facilitate commercial banks liquidity management, commercial banks are
currently required to maintain their CRR based on an average from the 15th
of the previous
month to the 14th
of the current month and a minimum CRR of 3 percent on a daily basis.
When there is a reduction of the CRR leads to more liquidity levels by the commercial bank
thus enhancing their capacity to expand more credit to their customers. However an increase
the CRR tightens liquidity and could also reduce demand driven inflationary pressures.
2.3.6 Foreign Exchange Market Operations
CBK control liquidity in the banking system by engaging in foreign exchange transactions. A
sale of foreign exchange to banks withdraws liquidity from the system while the purchase of
foreign exchange injects liquidity into the system. Participation by the CBK in the foreign
exchange market is usually motivated by the desire to prevent excessive volatility in the rate
at which the Kenyan shilling exchange against various foreign currencies or to acquire
foreign exchange to service official debt and build its foreign exchange reserves where the
19
statutory requirement is to use the banks best endeavours to maintain a foreign reserves
equivalent to a three year average of four months import cover. The CBK does not
participate in the foreign exchange market to defend a particular vale of the Kenya shilling
but may intervene to stabilise excess volatility in the exchange market. (Central bank of
kenya, 2012)
The central bank of Kenya has among others implored the following measures to enhance the
stability of the exchange rate. First the bank has limited the tenor of swaps and Kenya
shilling borrowing where offshore banks are involved to a tenor of not less than one year.
The bank has limits the tenor of swaps between residents to not less than seven days. The
bank has reduced the foreign exposure ratio of the core capital from 20 percent to 10 percent.
The bank has made a requirement that local banks obtain supporting documents for all
transactions in the nostro accounts of the offshore banks. The banks also suspended the use
of the Electronic brokerage System (EBS) by the Central bank Kenya (2012).
2.3.7 Money Supply
Money supply can be defined as the sum of currency outside banks and deposit liabilities
commercial banks (Central bank of kenya, 2012). Deposit liabilities are defined in narrow
money(M1), broad money(M2) and extended broad money(M3). These are defined s below
M1 this refers to currency outside banking system + Demand Deposits
M2 = M1 + time and savings deposits +certificates of deposits + deposits liabilities of Non-
bank financial institutions (NBFIs).
M3 = M2 + Residents foreign currency deposits.
The Central banks majorly targets broad money (M3) in its policy targets and interventions.
20
2.4 Empirical Studies
Several studies have been done on monetary policy and inflation rates. (Chicheke, 2009)
Studies the relationship between monetary policy, inflation and un employment. The study
showed that the monetary authorities in South Africa put more weight in inflation than on
employment. This was because the monetary authorises were seen to abruptly respond to
inflation than to the rate of unemployment. The study suggested that the monetary authorities
take more public expectations when it comes to formulation policy statement. The study
showed that technological advancement has a bearing on the effectiveness of monetary policy.
The fact that technological trend variable was positive and significant. Hence financial
engineering was seen as critical in affecting the speed of monetary policy effects.
Vargas (2012)conducted a study on inflation targeting in Columbia through monetary policies
concluded that in Colombia, monetary policy converged fully fledged inflation targeting with
an independent floating regime. The performance of the strategy was found satisfactory
overall. Starting from a deep recession the study found that a policy stance which was
expansionary led to decline in inflation along the targets, the output had recovered and
international reserves had reached levels that limit the external vulnerability of the economy.
However the study found that drawbacks of substantial intervention were difficulty of
communicating policy to the public and the market. The study further found that fiscal
imbalances posed a credibility and power of the monetary policy through several political
channels.
Rasche and Williams (2005) did a study on the effectiveness of monetary policy. In their
analysis they addressed changing views of the role and effectiveness of the of monetary policy
in inflation targeting. The monetary policy influence of short run stabilisation was evaluated
together with challenges of implementing a short-run stabilization policy. The study found out
that central banks were successful in hitting targets for on the medium term horizon. However
21
the study revealed that it was not very clear of the marginal contribution of inflation targeting
beyond commitment to price stability. It was also established there were no clear what would
happen to low stable inflation if bad shocks were realized. The study also showed that the
central banks operate in the environment of many dimensions and uncertainty that it is
problematic for consistently short run money stabilization policies.
Adam (2009) in his study on the conduct of monetary policy in Uganda , evaluated aspects of
the conduct of monetary policy in Uganda with the starting point being the perception held by
some that while Uganda had been amongst the most consistently successful countries in
Africa in controlling inflation since the early 1990s,this had come at a high fiscal cost and that
the conduct of monetary policy had stifled rather than encouraged the development of the
financial sector.
Shehu (2008) researched on the open market operations as an instrument of monetary policy
in Nigeria in a view to establish the administration problems and prospects. The research
concluded that the policy measures and institution reform introduced under structural
adjustments programme had a large measure of success. The study concluded that the
motivation for the use of open market operations was the desire for efficient markets and that
the monetary tool had achieved significant success. However the study noted that that the
poor appetitive by banks towards government treasury was not in consistent with the sprit of
the monetary stability.
Mishkin (2012) studied about monetary policies in regard to lessons from the financial crisis.
The study was done to find out if monetary policies were any relevant and why the established
policies did not avert the financial crisis. The study concluded that the economist and
monetary economist did not have to go back to the drawing board because much of the
science of monetary policy remained intact. The study concluded that monetary policy were
22
still effective. However it was noted a stronger case for monetary policy to lean against credit
bubbles rather than just cleaning up after the bubble has burst.
Mohanty and Michela (2003) in their study found out that, out of the 13 leading emerging
economies, only two had not adopted inflation targeting (IT), a related type of rule- based
policy. The study found out inflation targeting leads to a more systematic reaction to inflation.
The study mainly concluded that in emerging economies, central banks, most of the time,
change short-term interest rate in response to deviations in inflation and exchange rate
movements. The study also noted that price stabilization remains a main objective of central
banks in emerging countries, other objectives such as output stabilization, stability of
exchange rate and few cases, stability of assets prices and current account deficit.
Beggs (2010), study on the relationship between the macroeconomic policies and inflation.
found that in Australia financial deregulation was not compatible with monetary targeting, it
was quite compatible with monetary policy and further facilitated a policy based on open
market operations and setting up of stable instrument for the future. The study found out that
monetary policy tools are very important in ensuring stable markets.
Rotich et al. (2007) did a study on monetary policy reaction function for Kenya. The study
established that the central bank of Kenya has been targeting broad money M3, when making
its monetary policy decisions. The results indicate that Central Bank of Kenya has been
successful in controlling inflation, at least for the greater period in the sample. At times of
high inflation or positive output, the CBK responded by reducing money supply. The CBK
followed a rule to target inflation with some allowance for output stabilization. The exchange
rate was established as a major concern of CBK behaviour. The study established that the
CBK was found to perform well in the implicit objective of short run interest rate
management. The study concluded that at times of high inflation the CBK increased the repo
23
interest rate in order to success in mopping up excess liquidity. The study also suggested that
a backward looking specification of the Taylor type were best foe Kenya. This implied that
the CBK to take into account past inflation when implementing monetary policy.
Rotich (2012) study to establish the effectiveness of monetary policy tools in countering
inflation in Kenya. The study used treasury bills rate, Repo rate, money supply and exchange
rates as the tools used by the central bank. The study showed treasury bill rate was found to
attracts more investors to lend money to the government thus reducing their immediate
purchasing power this reduces the amount of money in circulation this was found to reduces
inflation. The study also found a correlation between inflation and money supply. It was
established that more money supply lead to the increased inflation. This was because increase
in money supply leads to people spending the excess of their money supply over the money
demand. The study was established that exchange rate system has an important role in
minimizing the risk of fluctuations in exchange rates. An increase in exchange rates
accompanies higher rates on inflation. This is partly due to increase in the Diaspora
remittances. However, in general, exchange rates have limited effect on the levels of inflation
recorded in Kenya.
2.5 Summary of Literature Review
Many studies have been conducted in regard to money policies. This has been done because
the various theoretical models have been put forward in regard to the conduct of money policy
over the years. The theoretical developments emanate from propositions by diverse competing
schools of thoughts; the Monetarist, the Keynesians and the Classical. The different
approaches agree on some areas while differ on other concepts and reasoning. The fishers
classical quantity theory of money argued for neutrality of money in the economy and
consequently shins intervention by the governments in the markets. (Chicheke, 2009).The
Keynesians disagreed with the classical proposition, instead they embraced the Philips(1958)
24
idea of the trade off relationship between inflation and unemployment which they seeas an
justification of their policies.
The study has showed that as far as macroeconomics and the conduct of money policy in an
economy are concerned there seems to be areas of contentions. This is mainly in regard to
how economic functions and monetary policymakers should seek to achieve their target goals.
Whereas for instance many central banks in the worlds have developments a formal approach
to inflation by ensuring target inflation levels, the approach has proved to overlook other
economic aspects. Therefore its imminent there needs to develop an appropriate framework
that ensures that there is a focal point in order to fully understand the underlying relationships
between inflation and money supply instruments.
Cheng (2006) study established a weak link between output and monetary stance amid strong
link between price stability and monetary stance. The study showed that there seemed little
scope for balancing the two competing goals of output stabilization and price stability. The
study recommended that the near future, the overriding objective of monetary policy,
therefore, should be to maintain low inflation. Looking forward, the study suggested Kenyan
authorities should continue to undertake structural reforms aimed at addressing the
weaknesses in the financial sector, including improving governance of the CBK,
Strengthening regulatory framework, as well as enhancing legal framework, with a view to
improving the monetary transmission mechanism to the real sector.
Based on several studies the research paper seeks to form a clear picture of the Kenyan
perspective by evaluating the relationship between monetary policy and inflation in Kenya
by analysing the effect of various monetary policy instruments employed by the Central bank
of Kenya between 2008 and 2012.
25
CHAPTER THREE
RESEARCH METHODOLOGY
3.1 Introduction
This chapter describes the methodology that was undertaken in conducting the study to arrive
at the finding regarding the effectiveness of the monetary policy and inflation rates in Kenya.
The chapter covers research design, data collection, and data analysis and model specification.
3.2 Research Design
The study employed descriptive research design. The studies used time series empirical data
on the variables to describe and examine the effectiveness of the monetary policy tools in
countering inflation in Kenya for the period 2008 to 2012. This was done by establishing
correlation coefficients between the inflation and the monetary policy tools employment by
the central bank the period.
3.3 Data Collection
The study used secondary data on Money supply (M3), Consumer, Price Index, exchange
rate, 91-day treasury rate, Central bank rate and Repo rate. The money supply (M3), 91-day
treasury rate, exchange rate and REPO rate will be obtained from the CBK. The date for
inflation (CPI) will be obtained from the KNBS. The study will use the USD Kenya Shilling
exchange to measure the general strength of the exchange because the USD constitute the
main currency exchanged against the Kenya shilling. The study focused on five year period
between 2008 and 2012.The five year period date was analysed on quarterly basis. In the
analysis the study will make of monthly data in analysis of the relationship between inflation
and monetary policy tools.
26
3.4 Data Analysis
The study used SPSS18 version as well as graphical analysis. Because the study model was a
multivariate‟s one, the study used multiple regression technique in analyzing the relationship
between the inflation and the monetary policy tools. The study computed various coefficients
of correlation denoted as ß in the model to determine the relationship between the monetary
policy tools and inflation countering inflation in Kenya.
3.5 Model Specification
The variables of the study comprised the Consumer Price (CPI) index as the dependent
variable and 91-day Treasury bill, exchange rate, REPO rate and Money Supply as the
independent variables. The regression model was a multivariate model stating the CPI
index as a function of the stated monetary policy tools as follows:
Thus, the regression equation will appear as:
Y= ß0 + ß1X1+ ß2X2+ ß3X3+ ß4X4 + ß5X5 + ε
CPI(Inflation) = ß0 + ß191-T-billrate + ß2exchange rate + ß3reporate + ß4Money supply +
ß5 CBR +error term.
To simplify, Let:
Y =Consumer Price Index;
X1 = 91-day Treasury bill rate;
X2 = Exchange rate (US dollar);
X3 = Repo rate;
X4 = Money Supply (M3),
27
X5 = Central bank rate(CBR),
ε =be error term.
Consumer Price Index (CPI) represents the rate of inflation existing in Kenya for the period
under study. The percentage change in CPI will be taken to mean inflation. The KNBS takes
into consideration the typical weighted consumer basket. The Consumer price Index(CPI) is a
macroeconomic indicator showing the sate of the Kenyan economy and the impact of
inflation.
The error term stands for the effect of other factors other than monetary policy tools on
the CPI and helps in stabilizing the model. The data on above variables was collected
from secondary data contained in Central Bank reports.
The study tested at 95% Confidence level and 5% significant level. Therefore if the significant
values found was less than the set critical values then independent variables was concluded to
be relevant in explaining the relationship between the monetary policy and inflation.
Otherwise the independent variables were taken to be irrelevant in explaining the changes in
dependent variable.
28
CHAPTER FOUR
DATA ANALYSIS, FINDINGS AND DISCUSSION
4.1Introduction
This chapter evaluates the analysis and findings of the study as set out in the research
objective and methodology. The study presents a relationship between the monetary policy
tools as applied by the central bank and the rate of inflation in Kenya. The data used for the
purpose of this study was secondary data from records and publications from Central bank of
Kenya (CBK) and Kenya Bureau of Statistics (KNBS).
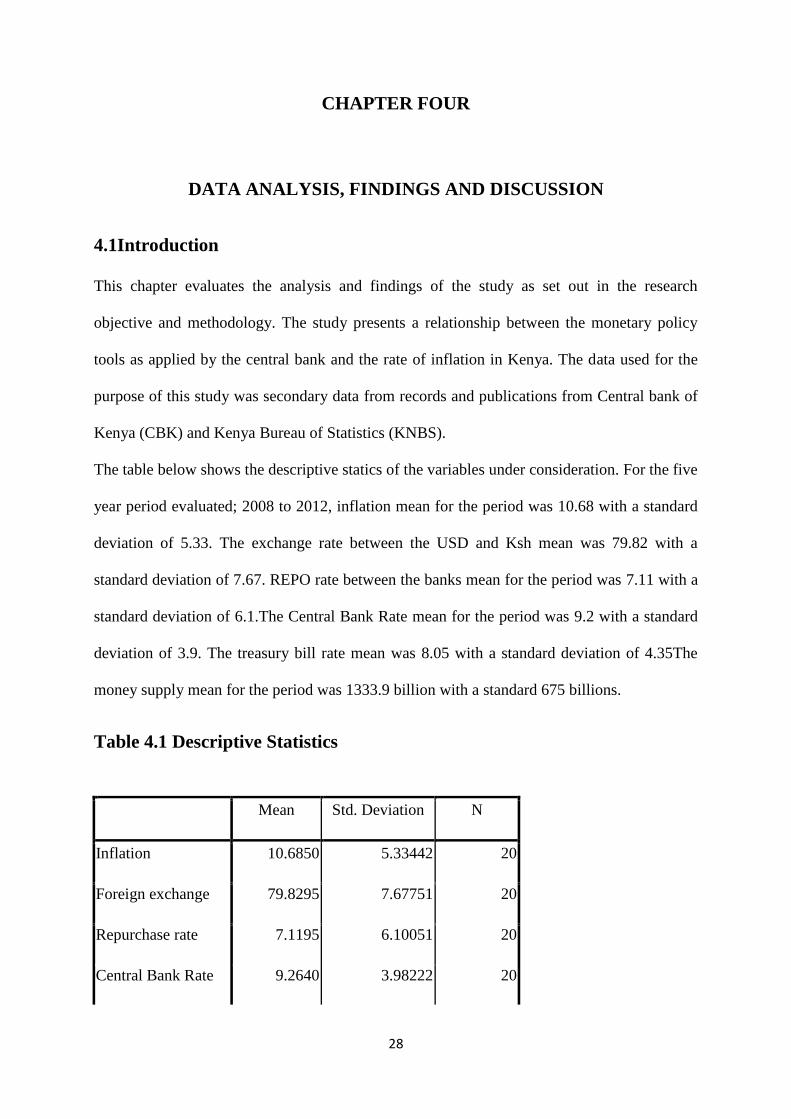
The table below shows the descriptive statics of the variables under consideration. For the five
year period evaluated; 2008 to 2012, inflation mean for the period was 10.68 with a standard
deviation of 5.33. The exchange rate between the USD and Ksh mean was 79.82 with a
standard deviation of 7.67. REPO rate between the banks mean for the period was 7.11 with a
standard deviation of 6.1.The Central Bank Rate mean for the period was 9.2 with a standard
deviation of 3.9. The treasury bill rate mean was 8.05 with a standard deviation of 4.35The
money supply mean for the period was 1333.9 billion with a standard 675 billions.
Table 4.1 Descriptive Statistics
Mean Std. Deviation N
Inflation 10.6850 5.33442 20
Foreign exchange 79.8295 7.67751 20
Repurchase rate 7.1195 6.10051 20
Central Bank Rate 9.2640 3.98222 20
29
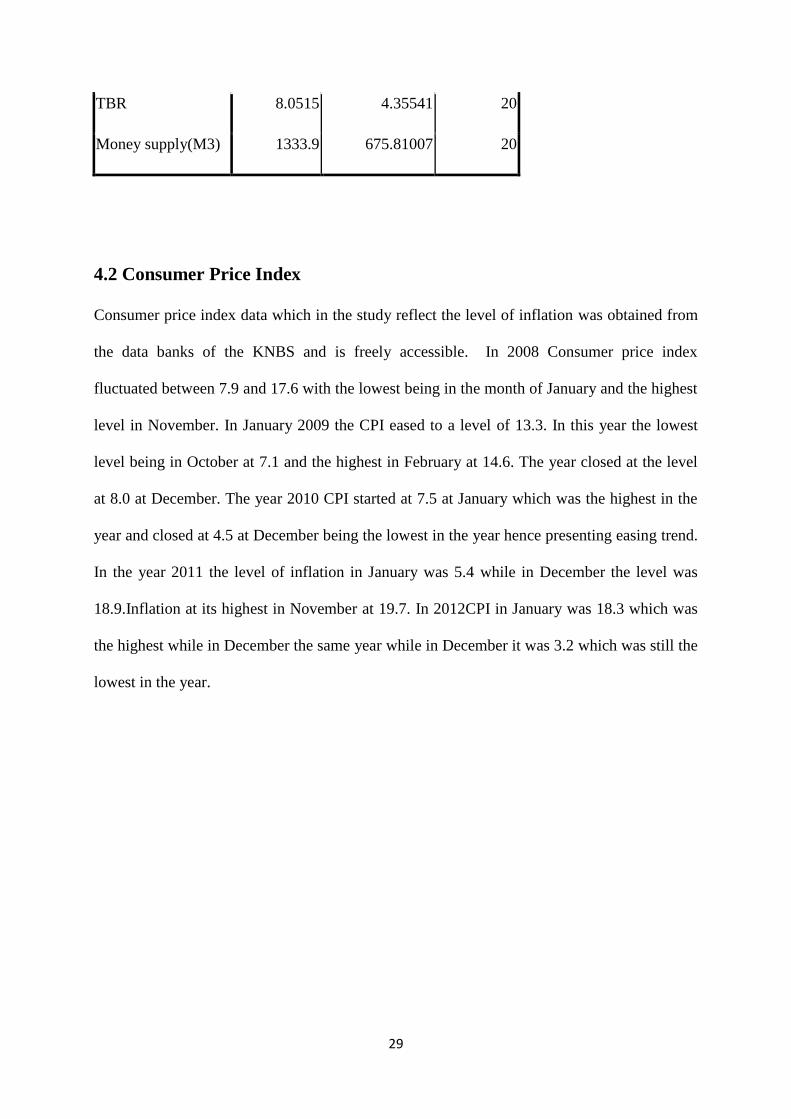
TBR 8.0515 4.35541 20
Money supply(M3) 1333.9 675.81007 20
4.2 Consumer Price Index
Consumer price index data which in the study reflect the level of inflation was obtained from
the data banks of the KNBS and is freely accessible. In 2008 Consumer price index
fluctuated between 7.9 and 17.6 with the lowest being in the month of January and the highest
level in November. In January 2009 the CPI eased to a level of 13.3. In this year the lowest
level being in October at 7.1 and the highest in February at 14.6. The year closed at the level
at 8.0 at December. The year 2010 CPI started at 7.5 at January which was the highest in the
year and closed at 4.5 at December being the lowest in the year hence presenting easing trend.
In the year 2011 the level of inflation in January was 5.4 while in December the level was
18.9.Inflation at its highest in November at 19.7. In 2012CPI in January was 18.3 which was
the highest while in December the same year while in December it was 3.2 which was still the
lowest in the year.
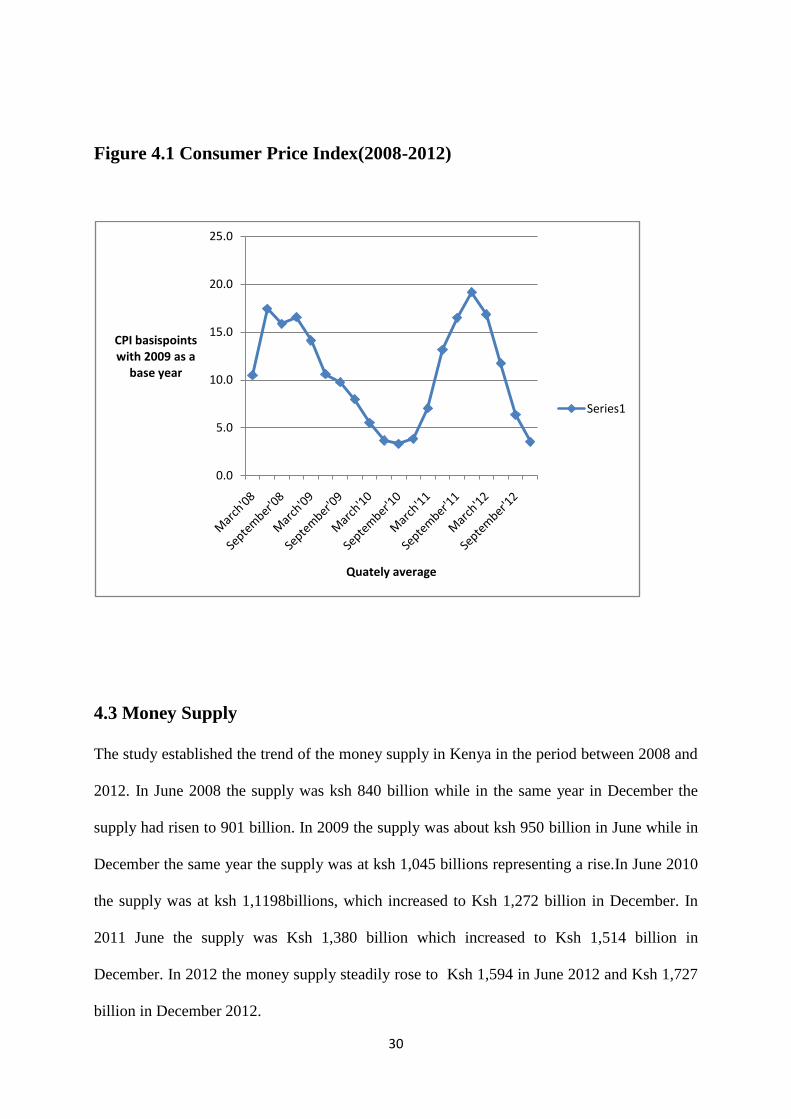
30
Figure 4.1 Consumer Price Index(2008-2012)
4.3 Money Supply
The study established the trend of the money supply in Kenya in the period between 2008 and
2012. In June 2008 the supply was ksh 840 billion while in the same year in December the
supply had risen to 901 billion. In 2009 the supply was about ksh 950 billion in June while in
December the same year the supply was at ksh 1,045 billions representing a rise.In June 2010
the supply was at ksh 1,1198billions, which increased to Ksh 1,272 billion in December. In
2011 June the supply was Ksh 1,380 billion which increased to Ksh 1,514 billion in
December. In 2012 the money supply steadily rose to Ksh 1,594 in June 2012 and Ksh 1,727
billion in December 2012.
0.0
5.0
10.0
15.0
20.0
25.0
CPI basispoints with 2009 as a
base year
Quately average
Series1
31
Below is a table showing the Quarterly averages of the money supply in billions.
Table 4.2 Quarterly Average Money Supply(M3)
Quarterly Average in Billions
Q4(Billions) Q3(Billions) Q3(Billions) Q1(Billions)
2012 1,723 1,640 1,594 1,535
2011 1,505 1,444 1,356 3,915
2010 1,261 1,224 1,159 1,086
2009 1,022 980 935 900
2008 891 854 847 807
4.4 91-Day Treasury Bill Rates
The 91 treasury bill rates in 2008 fluctuated between 8.59% and 6.90%. with the highest rate
being in December while the lowest rate was in January. In the year 2009, the rate started at
8.46 in January then reduced to 7.55% in February. The rate then fluctuated at between7.45%
and 6.82% for the rest of the year. In 2010, the year started at 6.56%. The year recorded high
fluctuations to reach the lowest of 1.60% in July. In 2011, the rate started at low rate of
2.46%.This year was characterised with steady increase with the rate rising to a high of
18.30% in December. The year 2012 was characterized with a relatively steady decline from
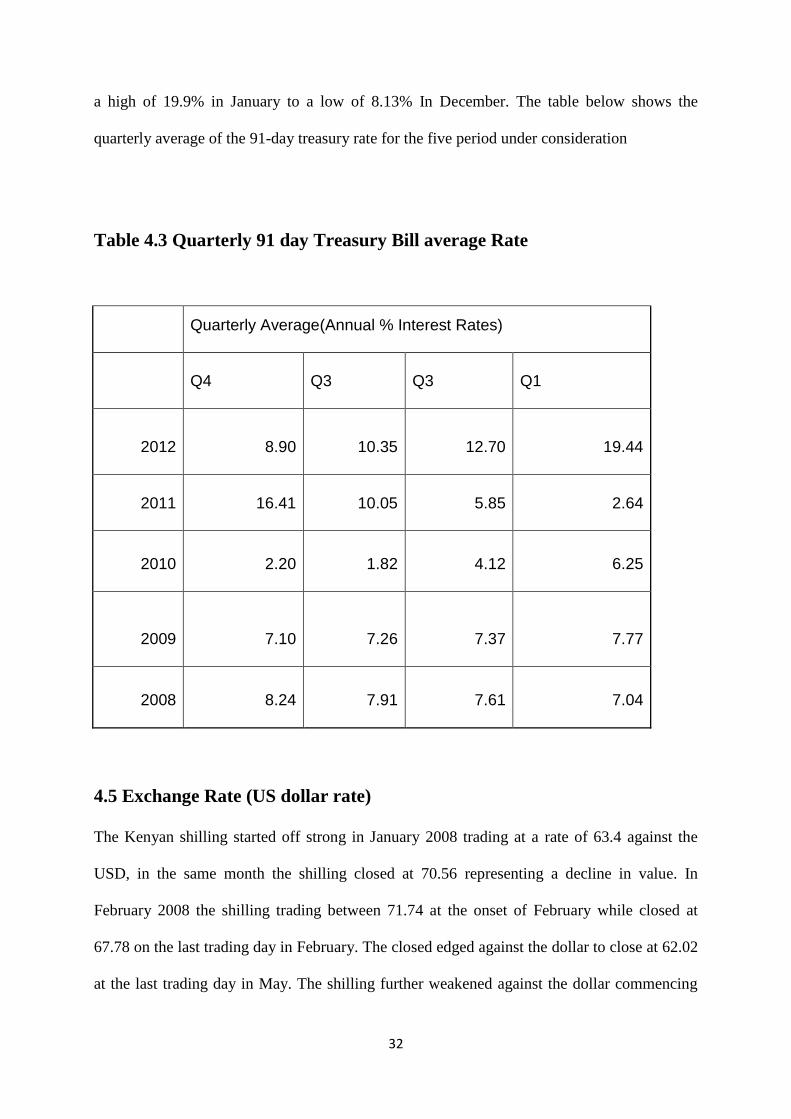
32
a high of 19.9% in January to a low of 8.13% In December. The table below shows the
quarterly average of the 91-day treasury rate for the five period under consideration
Table 4.3 Quarterly 91 day Treasury Bill average Rate
Quarterly Average(Annual % Interest Rates)
Q4 Q3 Q3 Q1
2012 8.90 10.35 12.70 19.44
2011 16.41 10.05 5.85 2.64
2010 2.20 1.82 4.12 6.25
2009 7.10 7.26 7.37 7.77
2008 8.24 7.91 7.61 7.04
4.5 Exchange Rate (US dollar rate)
The Kenyan shilling started off strong in January 2008 trading at a rate of 63.4 against the
USD, in the same month the shilling closed at 70.56 representing a decline in value. In
February 2008 the shilling trading between 71.74 at the onset of February while closed at
67.78 on the last trading day in February. The closed edged against the dollar to close at 62.02
at the last trading day in May. The shilling further weakened against the dollar commencing
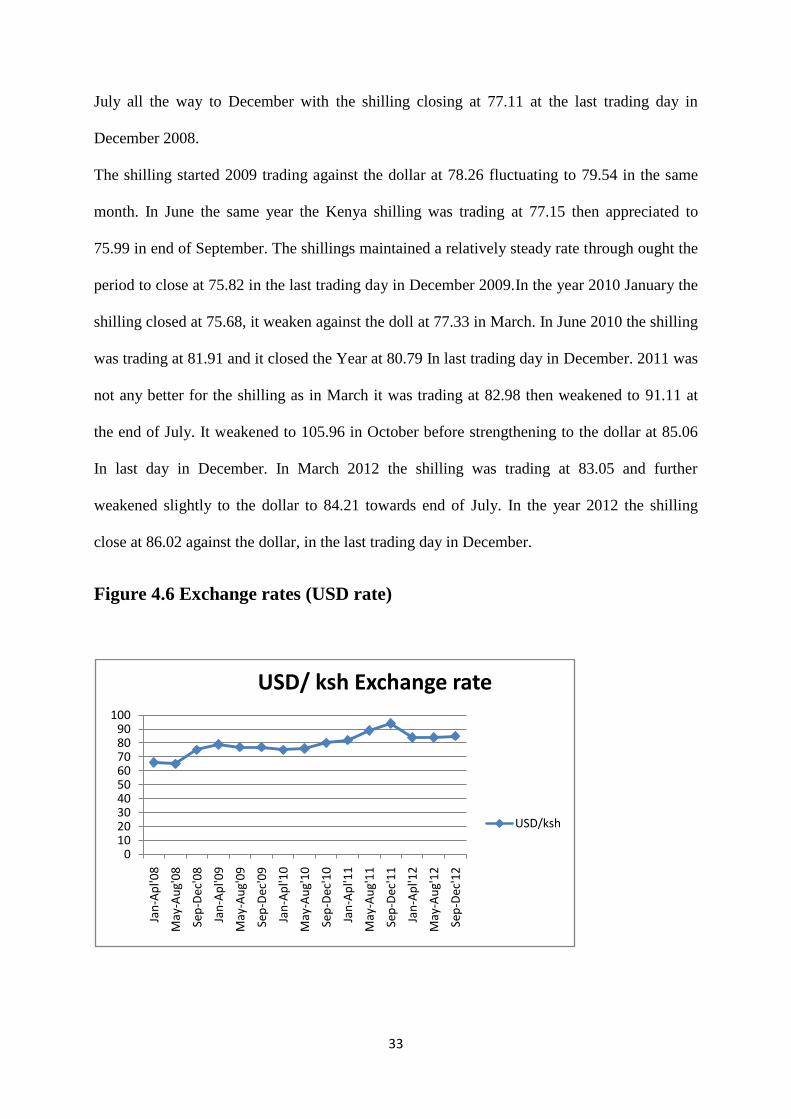
33
July all the way to December with the shilling closing at 77.11 at the last trading day in
December 2008.
The shilling started 2009 trading against the dollar at 78.26 fluctuating to 79.54 in the same
month. In June the same year the Kenya shilling was trading at 77.15 then appreciated to
75.99 in end of September. The shillings maintained a relatively steady rate through ought the
period to close at 75.82 in the last trading day in December 2009.In the year 2010 January the
shilling closed at 75.68, it weaken against the doll at 77.33 in March. In June 2010 the shilling
was trading at 81.91 and it closed the Year at 80.79 In last trading day in December. 2011 was
not any better for the shilling as in March it was trading at 82.98 then weakened to 91.11 at
the end of July. It weakened to 105.96 in October before strengthening to the dollar at 85.06
In last day in December. In March 2012 the shilling was trading at 83.05 and further
weakened slightly to the dollar to 84.21 towards end of July. In the year 2012 the shilling
close at 86.02 against the dollar, in the last trading day in December.
Figure 4.6 Exchange rates (USD rate)
0102030405060708090
100
Jan
-Ap
l'08
May
-Au
g'0
8
Sep
-Dec
'08
Jan
-Ap
l'09
May
-Au
g'0
9
Sep
-Dec
'09
Jan
-Ap
l'10
May
-Au
g'1
0
Sep
-Dec
'10
Jan
-Ap
l'11
May
-Au
g'1
1
Sep
-Dec
'11
Jan
-Ap
l'12
May
-Au
g'1
2
Sep
-Dec
'12
USD/ ksh Exchange rate
USD/ksh
34
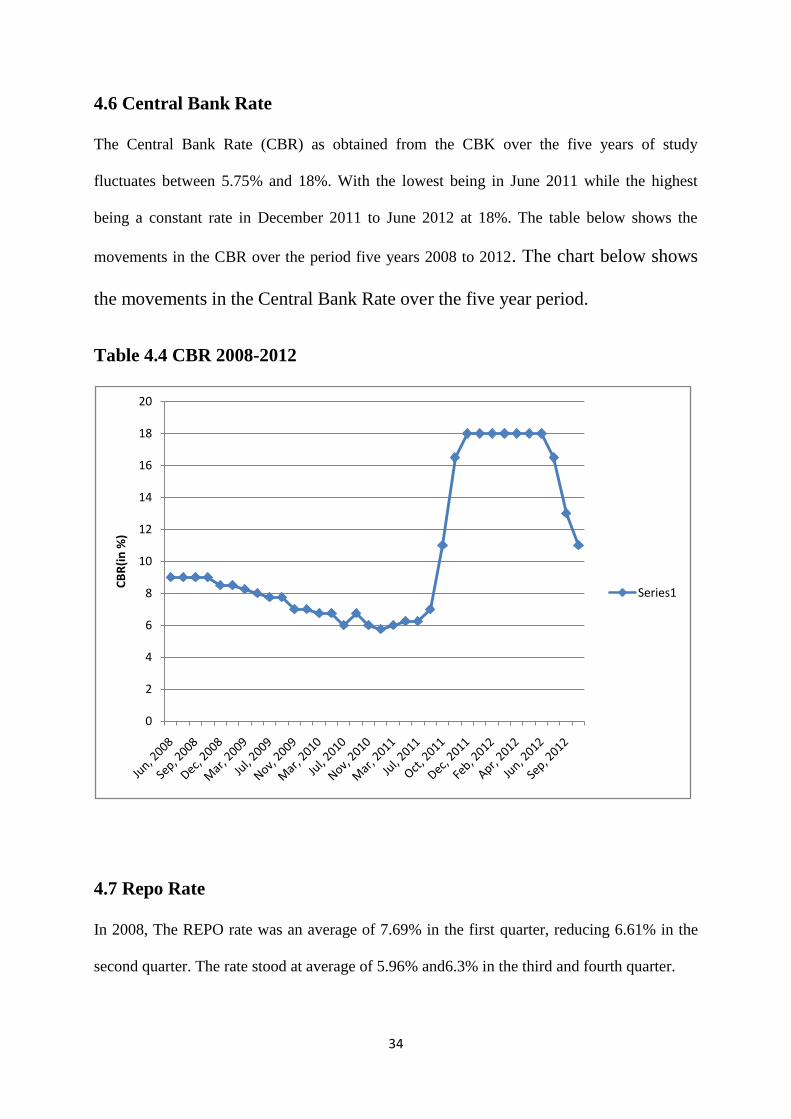
4.6 Central Bank Rate
The Central Bank Rate (CBR) as obtained from the CBK over the five years of study
fluctuates between 5.75% and 18%. With the lowest being in June 2011 while the highest
being a constant rate in December 2011 to June 2012 at 18%. The table below shows the
movements in the CBR over the period five years 2008 to 2012. The chart below shows
the movements in the Central Bank Rate over the five year period.
Table 4.4 CBR 2008-2012
4.7 Repo Rate
In 2008, The REPO rate was an average of 7.69% in the first quarter, reducing 6.61% in the
second quarter. The rate stood at average of 5.96% and6.3% in the third and fourth quarter.
0
2
4
6
8
10
12
14
16
18
20
CB
R(i
n %
)
Series1
35
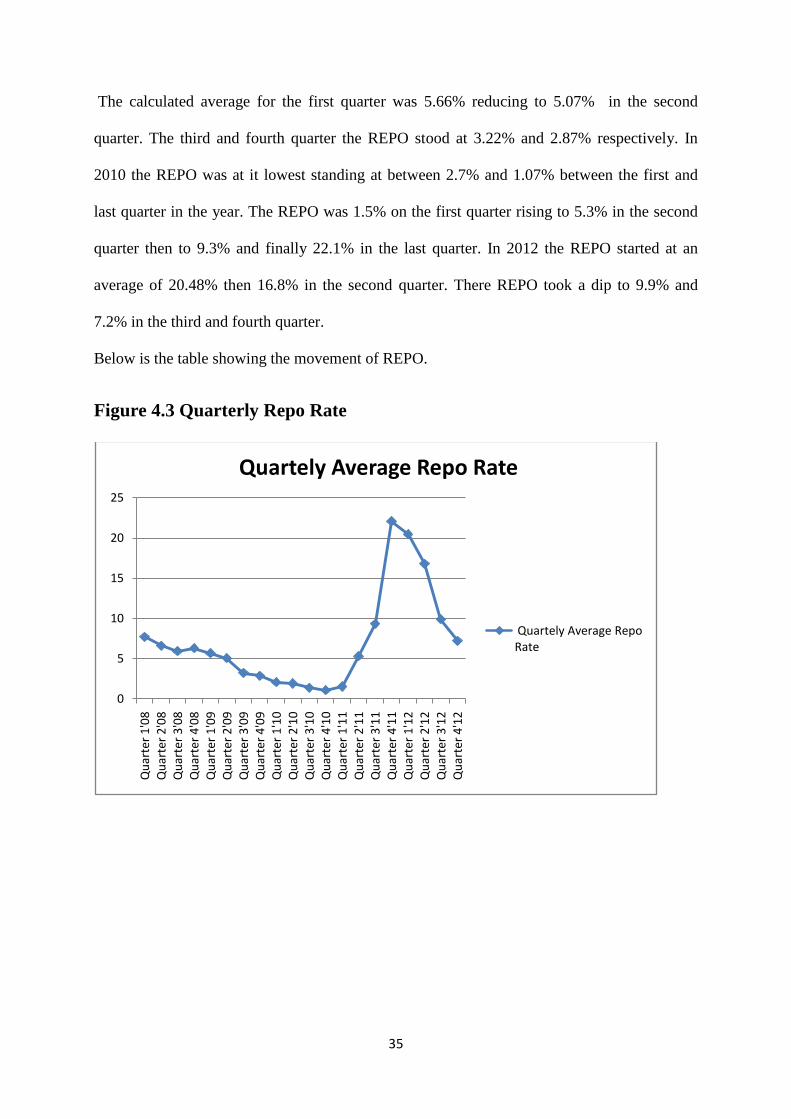
The calculated average for the first quarter was 5.66% reducing to 5.07% in the second
quarter. The third and fourth quarter the REPO stood at 3.22% and 2.87% respectively. In
2010 the REPO was at it lowest standing at between 2.7% and 1.07% between the first and
last quarter in the year. The REPO was 1.5% on the first quarter rising to 5.3% in the second
quarter then to 9.3% and finally 22.1% in the last quarter. In 2012 the REPO started at an
average of 20.48% then 16.8% in the second quarter. There REPO took a dip to 9.9% and
7.2% in the third and fourth quarter.
Below is the table showing the movement of REPO.
Figure 4.3 Quarterly Repo Rate
0
5
10
15
20
25
Qu
arte
r 1
'08
Qu
arte
r 2
'08
Qu
arte
r 3
'08
Qu
arte
r 4
'08
Qu
arte
r 1
'09
Qu
arte
r 2
'09
Qu
arte
r 3
'09
Qu
arte
r 4
'09
Qu
arte
r 1
'10
Qu
arte
r 2
'10
Qu
arte
r 3
'10
Qu
arte
r 4
'10
Qu
arte
r 1
'11
Qu
arte
r 2
'11
Qu
arte
r 3
'11
Qu
arte
r 4
'11
Qu
arte
r 1
'12
Qu
arte
r 2
'12
Qu
arte
r 3
'12
Qu
arte
r 4
'12
Quartely Average Repo Rate
Quartely Average Repo Rate
36
4.8 Regression Analysis
For the purposes of establishing the relationship among variables, the research conducted a
multiple regression analysis. The analysis applied the statistical package for social sciences(
SPSS) version 22 to compute the measurements of multiple regressions for the study. The
following tables summarises the findings
Model Summary
Model R
R
Square
Adjusted R
Square
Std. Error of the
Estimate
Change Statistics
R Square
Change
F
Change df1 df2
Sig. F
Change
1 .874
a .763 .679 3.02422 .763 9.023 5 14 .001
Coefficient of determination explains the extents to which changes in the dependent variable
in this case Consumer Price index can be explained by the independent variables. Coefficient
of determination will show the percentage of variation in the department that is explained by
all the five variables i.e. the money supply(M3), the 91-Day treasury bill rate, exchange rate,
repo rate and the Central bank rate.
The correlation and the coefficient of determination of the dependent variables (CPI) when all
the five on dependent variables are combined was measured and tested. from the findings the
67.9%.of the Consumer Price Index in Kenya was attributed to combination of the five
independent factors(Money supply, Repo, Central bank rate, 91-Day treasury bill rate,
37
exchange rate). This means that 32.1% Of the consumer price index changes are attributed to
other factors not taken into consideration in this study
Coefficients
Model
Unstandardized
Coefficients
Standardized
Coefficients
t Sig.
Collinearity Statistics
B
Std.
Error Beta Tolerance VIF
1 (Constant) 4.827 8.740 3.298 .005
MONEY
SUPPLY .0071 .001 .0006 .118 .908 .720 1.390
Foreign
exchnage .282 .113 .212
-
1.876 .082 .641 1.560
Repurchase rate .0043 .411 .0033 2.757 .015 .077 13.069
TBR .795 .515 .721 1.362 .195 .096 10.434
Central Bank
Rate -1.695 .398 -1.672
-
4.110 .001 .192 5.213
a. Dependent Variable: Infllation
ANOVAb
Model
Sum of
Squares df Mean Square F Sig.
1 Regression 412.622 5 82.524 9.023 .001a
Residual 128.043 14 9.146
Total
540.665 19
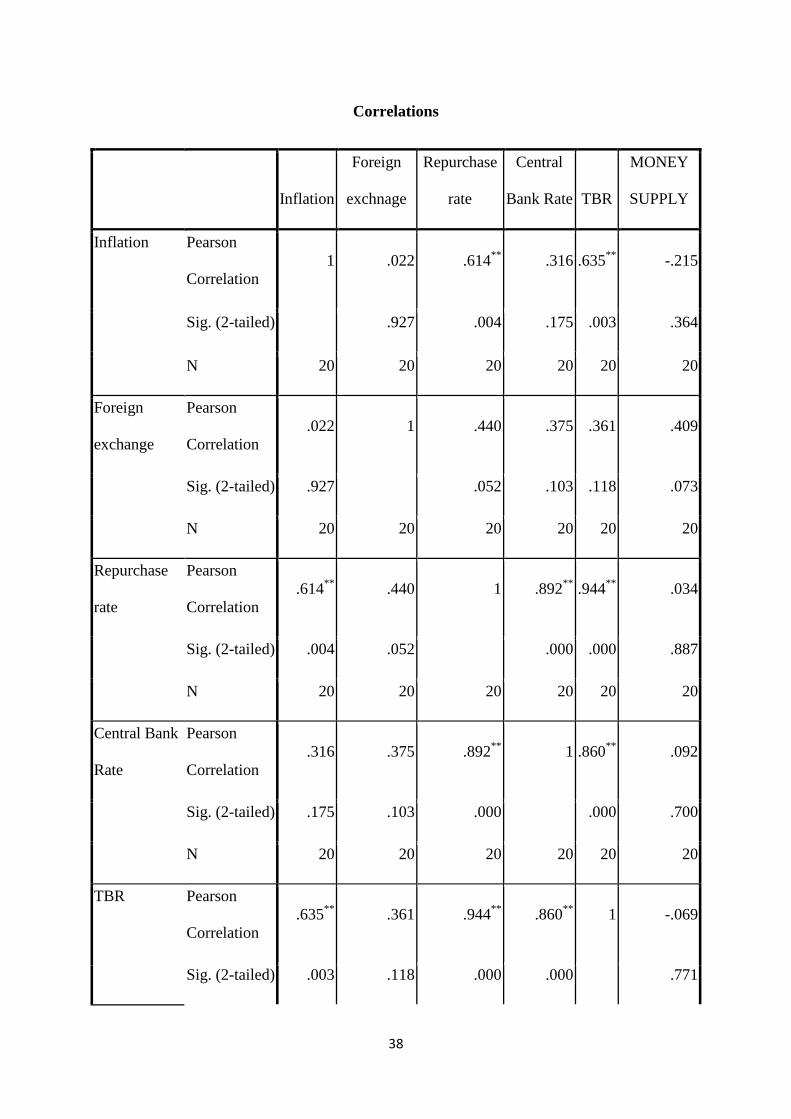
38
Correlations
Inflation
Foreign
exchnage
Repurchase
rate
Central
Bank Rate TBR
MONEY
SUPPLY
Inflation Pearson
Correlation
1 .022 .614**
.316 .635**
-.215
Sig. (2-tailed) .927 .004 .175 .003 .364
N 20 20 20 20 20 20
Foreign
exchange
Pearson
Correlation
.022 1 .440 .375 .361 .409
Sig. (2-tailed) .927 .052 .103 .118 .073
N 20 20 20 20 20 20
Repurchase
rate
Pearson
Correlation
.614**
.440 1 .892**
.944**
.034
Sig. (2-tailed) .004 .052 .000 .000 .887
N 20 20 20 20 20 20
Central Bank
Rate
Pearson
Correlation
.316 .375 .892**
1 .860**
.092
Sig. (2-tailed) .175 .103 .000 .000 .700
N 20 20 20 20 20 20
TBR Pearson
Correlation
.635**
.361 .944**
.860**
1 -.069
Sig. (2-tailed) .003 .118 .000 .000 .771
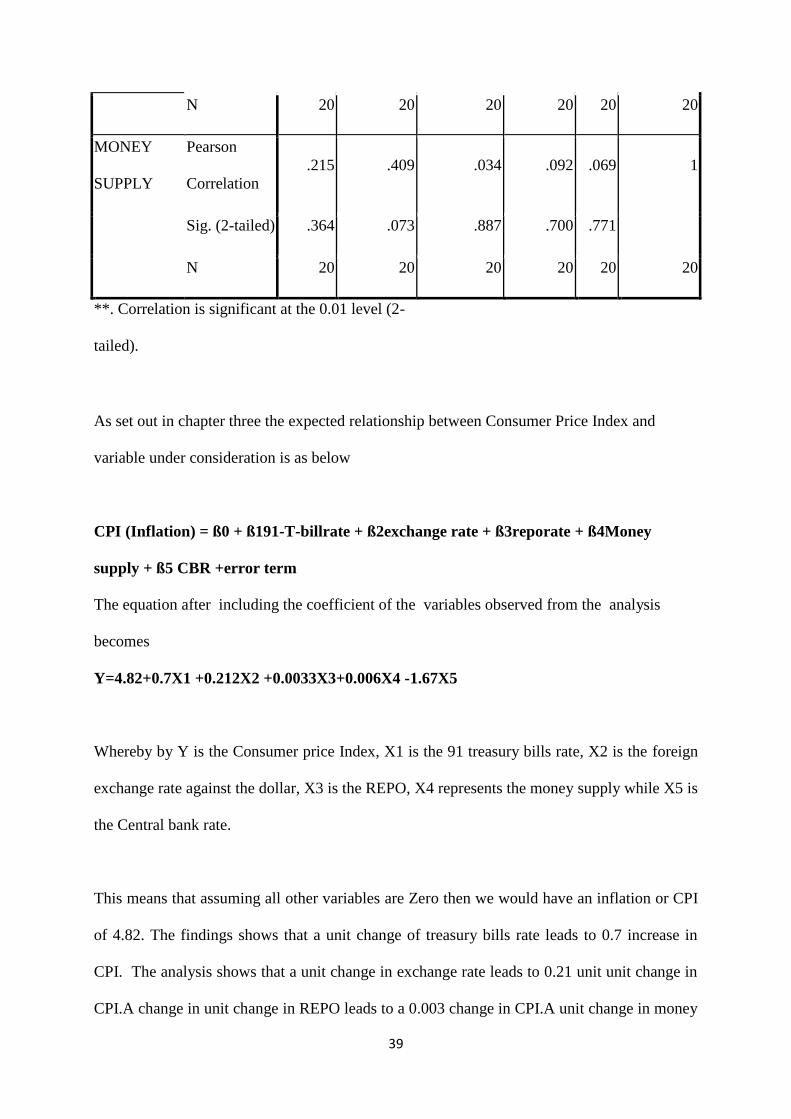
39
N 20 20 20 20 20 20
MONEY
SUPPLY
Pearson
Correlation
.215 .409 .034 .092 .069 1
Sig. (2-tailed) .364 .073 .887 .700 .771
N 20 20 20 20 20 20
**. Correlation is significant at the 0.01 level (2-
tailed).
As set out in chapter three the expected relationship between Consumer Price Index and
variable under consideration is as below
CPI (Inflation) = ß0 + ß191-T-billrate + ß2exchange rate + ß3reporate + ß4Money
supply + ß5 CBR +error term
The equation after including the coefficient of the variables observed from the analysis
becomes
Y=4.82+0.7X1 +0.212X2 +0.0033X3+0.006X4 -1.67X5
Whereby by Y is the Consumer price Index, X1 is the 91 treasury bills rate, X2 is the foreign
exchange rate against the dollar, X3 is the REPO, X4 represents the money supply while X5 is
the Central bank rate.
This means that assuming all other variables are Zero then we would have an inflation or CPI
of 4.82. The findings shows that a unit change of treasury bills rate leads to 0.7 increase in
CPI. The analysis shows that a unit change in exchange rate leads to 0.21 unit unit change in
CPI.A change in unit change in REPO leads to a 0.003 change in CPI.A unit change in money
40
supply leads to a 0.006 change in CPI. The findings also showed that a unit change in CBR
lead a 1.67 change CPI in the negative direction.
4.9 Summary and Interpretation of the Findings
Fluctuations in inflation distort the smooth functioning of the economy because of its effect of
the economic value of the local currency. Governments have mandated the Central Banks to
put up strategies that will ensure price stability. In Kenya, the inflation rate as measured by
the consumer price index has fluctuated over the period of study. There are several factors that
can be attributed to this cause.
The five factors studied in this project have contributed for about 67% of the reason for the
fluctuations of the consumer price index. This means that there other variables which
contributes to inflation but have not been considered in this study. From the findings the
inflations seems to be increasing with the increase in money supply, exchange rate and 91-day
Treasury bill rate. This means that is positive relationship between these variables and
inflations. Central bank of Kenya, which has been mandated with formulating strategies to
control inflation, therefore, needs align its policies so as to avoid excessive fluctuations which
distorts.
41
CHAPTER FIVE
SUMMARY, CONCLUSION AND RECOMMENDATIONS
5.1 Introduction
This chapter summarizes the study and makes conclusions based on the results highlighted
form the findings. The chapter outlines policy implications from the findings and areas of
where more research need to be carried out.
5.2 Summary
The study set to establish the relationship between monetary policy tools and inflation in
Kenya. In achieving this, the study used variables such as the REPO rate, Money supply,
Exchange rate (USD) and 91-day Treasury Bill rate. The independent variable was the
Consumer Price Index (CPI).From the findings outlined in chapter four, the study showed that
as that Inflation and money supply correlate with each other. The study showed that as the
money supply in circulation increased inflation also increased. This can because increase in
money supply leads to people having more disposable income. This causes the amount of
demand demanded to exceed the supply of goods hence leading to a rise in prices of goods.
The government therefore should in its policy application through the central bank monitor
the amount of money in circulation through its monetary policies. The government also
through its fiscal policies should ensure that wherever the money supply exceeds the set level,
appropriate measures to stimulate production to ensure demand does not exceed supply of
goods and services.
42
5.3 Conclusion
The 91-day treasury bills have been used as a tool by the CBK to wipe out excess liquidity in
the country. The study shows that there is Inverse relationship between an the Treasury rate
and the level of prices. This can be explained by the fact that when the Governments increases
the 91 treasury rates, the commercial banks short term interest rates increase, this reduces the
access of funds by the public. In this case even the citizens with more disposable incomes
tend to save to attract increasing levels of interest hence this leads to a down ward push on
general prices due to reduced aggregate demand.
The study also concludes that REPO rate has the little effect on the level of inflation in the
economy. This because the REPO is a short term facility that enables the commercial banks
meets their minimum statutory balances. Hence the rate has insignificant effect on the retail
prices. This in effect does not influence to a great extent the amount of money in supply
hence little affects on the prevailing rates of inflation. The little effect is attributed to the fact
that it only controls the balance in each individual bank‟s balances
The study concludes that exchange rates are critical element of general price levels in Kenya.
This is because Kenya has a negative balance of trade, therefore being a net importer which
means that in purchases more in foreign currency than it exports. The prices of imported
goods heavily correlate with the prevailing rates of foreign exchange.
5.4 Policy Recommendations
The study recommends that the policy makers mainly the Central Bank should make a critical
analysis of the intended inflation targets when setting the 91 Treasury bills rate. This is
because it was found that the rate has a significant impact on the price levels.
43
The Policy makers should align the money supply targets with the medium and long-term
economical goals. this is because the level of supply affects aggregate demand a key element
in any economical set up.
The study recommends that the policy makers involved in setting economic goals to ensure
that that there are geared towards maintaining a stable foreign exchange rate. Thus is because
Kenya being an net exporter the fluctuations of the exchange rate significantly affect the
general price level.
5.5 Limitations of the Study
The main limitation of the study was that the study relied on the secondary data mainly from
the Kenya National Bureau of Statistics and the Central Bank. Hence the data might not have
necessarily collected by the two institutions for the purposes of which same was used in this
study.
Consumer Price Index used has been used as the measure of inflation in this study is derived
by a weighted consumer basket. The weights as assigned by the KNBS may not reflect the
actual level of changes but are used as an indicator of the trend movement. The study also
assumed that the data used was objectively gathered and analysed by these institutions
without any bias.
5.6 Suggestions for Further Research
The study focused on relationship between the central bank monetary and inflation in Kenya.
Therefore studies need to be carried on other Fiscal policies and their effect on inflation. It is
also a common knowledge that there could be black markets and other factors that might
affect inflation hence more studies need to be carried to ensure all factors that affect inflation
are studied. The study also recommends that because inflation affect many other variables in
44
the economy study of effect of inflation on other elements of economy like economic stability
and growth.
The study also suggests a study on the action reaction time lapse between actions of the
monetary policies and time the actions are reflected effected in the financial markets. This
will provide an insight on how effective the central bank can timely intervene in the financial
markets.
45
REFERENCES
Adam, C. (2009). The conduct of monetery policy in Uganda: an assessment. Epric research
series No.65
Akhtar, M. A. (1997). Understanding Open Market operations. Publication Information
department federal reserve ban of New York.
Akhtar, S. (2006). Pakistan-Economic Outlook and Prospects,Speech Delivered at the Adam
Smith Institute, Thun, Switzerland June 27.
Barnanke, B. S. (2005). Inflation in Latin America-A new Era. Remarks at the Stanford
Institutre for economics Policy reserach Economics summit.
Beggs, M. (2010). Inflation and the making of macroeconomic policyin Astralia 1945-85.
Unpublished Phd thesis Faculty of Economics and Business, university of Sydney.
Bernanke, B. S. (2001). Inflation targeting: lessons from the International Experience.
Princeton University press.
Central Bank of kenya. (2011). Monetary Policy statement. Nairobi: Central bank.
Central bank of kenya. (2012). Monetary policy statemnt. Nairobi: Central bank.
Cheng, K. C. (2006). A VAR analysis of kenya's Monetary Policy Transmisiion mechanism:
how does the central bank's repo rate affect the Economy? IMF working paper
wp/11/97.
Cheruyot, J. (2012). Efferiveness Of Monetary Policy Tools In Countering Inflation In Kenya.
Unpublished MBA School Of Business University of Nairobi.
46
Chicheke, A. (2009). Monetary policy Inflation, Unemployment and the Philips curve in
South Africa. University of Fort Harare.
Cosgrove, M., & Marsh, D. (2005). Why the Quantity of money still Matters. Business &
Economic Research , 11.
Dasri, T. (1991). Open Market Operations Its nature and extent In the SEACEN Countries.
The South east asian central Banks(SEACEN) research and training center kuala
lumpar Malaysia.
Engelhardt, D. (2009). How china Shapes African trade, fuiscal and Monetary policy Towards
a New era of development Aid. Unpulished master ofArts University of Vienna.
Fendel, R. (2007). Monetary Policy, Interest rate Rules, and the Term Structure of Interest
rates:Theoretical Consideratins and Emperical implications,Vol.8.
Friedman, M. (2000). Canada and flexible exchange rates(PDF), speech delivered at
Revisiting the case for Flexible Exchange rates. Confrence sponsored by the Bank of
canada, Ottawaa, Ontario, November.
Friedman, M. (1968). The Role of Monetary Policy. The American Economic Review , 17, 1-
15
Froyen, R. T., & Guender, A. V. (2007). Optimal Monetery Policy under Uncertainty. Edward
Elgar Publishing.
Haberler, G. (1960). Inflation Its causes and Cures. Washington dC: American Enterprise
asssociation.
Handa, C. (2005). Irrelevance of Open Market Operations in Some Economies with
Government being Dominated in rateof return.
47
Hazlitt, H. (1960). What You Should Know About Inflation. Canada: D. Van Nostrand
Company.
Investopidia.(2009).Monetarypolicy Retrieved July10, 2013,
fromwww.investopedia.com/terms/m/monetraypolic
Jalali, T. (2011). Macroeconomic Theories of Inflation. International Conference on
Economics and Finance Reaersch Vol.5
Kasau, K., & Marks, C. (2011). Understanding Inflation and Controlling it.
King, M. (2013). Monetery policy: many targets, many instruments.where do we stand. IMF
Confrence on 'Rethinking macro Policy11: First Step. Washington: Bank Of England.
McCallum, B. T. (1999). Alternative Monetary policy Rules: A Comparison with Historical
settings for the united states, the United kingdom and japan.
Mishkin, F. S. (2011). Monetary Policy Strategy:Lessons from the crisis. Massachusetts:
National Bureau of economy Reasearch.
Mishkin, F. S. (2011, February). Monetay Policy Staretegy. Nber Working Papers Series .
Mohanty, M. S., & Michela, S. (2003). Countercyclical fiscal policy and central banks. Bank
for International Settlements(ed), Fiscal issues and ce ntarl bank emergind economies.
Rasche, R.M., (2005). „„The Effectiveness of monetary policy.'' Working paper 2005-048B
Ricardo, D. (1817). On the principles of political Econmy and taxation,Piero Sraffa(Ed.)
Works and correspondence of David Ricardo. Cambridge University Press, 1951.
Rotich, H., Kathanje, M., & Maina, I. (2007). An Monetary Policy Reaction Functiuon for
kenya. 13th Annual african Econometric Society Confrerence. Pretoria.
48
Schachter, A., Stone, M. R., & Zerma, M. (2000). Adopting Inflation Targeting;. International
Monetary Fund.
Shehu, M. A. (2008). Open market Operation as an instrument of Monetary Policy in
Sherman, H. J., & Gary, E. R. (1984). Macroeconomic-keynesian, Monetarist and Marxist
Views. New York: haper and Row.
Stanislaw, S., & Yergin, A. (1998).Economic polocy;Markets; Privitization: Deregulation
Economic history;Competition, International trade.
Taylor, J. B. (1993). Discretion Versus Policy rules in practice. Carnegie rochester Confrence
series on public policy 39, (pp. 195-214).
Vargas, H. H. (2005). Exchange rate Policy and Inflation targeting In Colombia. Inter-
American development bank Research Department working paper 539.
Woodford, M., & Eggertsson, g. (2006). The Zero Bond on Interest rates and Optimal
Monetery policy. princeton University & Intenational Monetery fund.
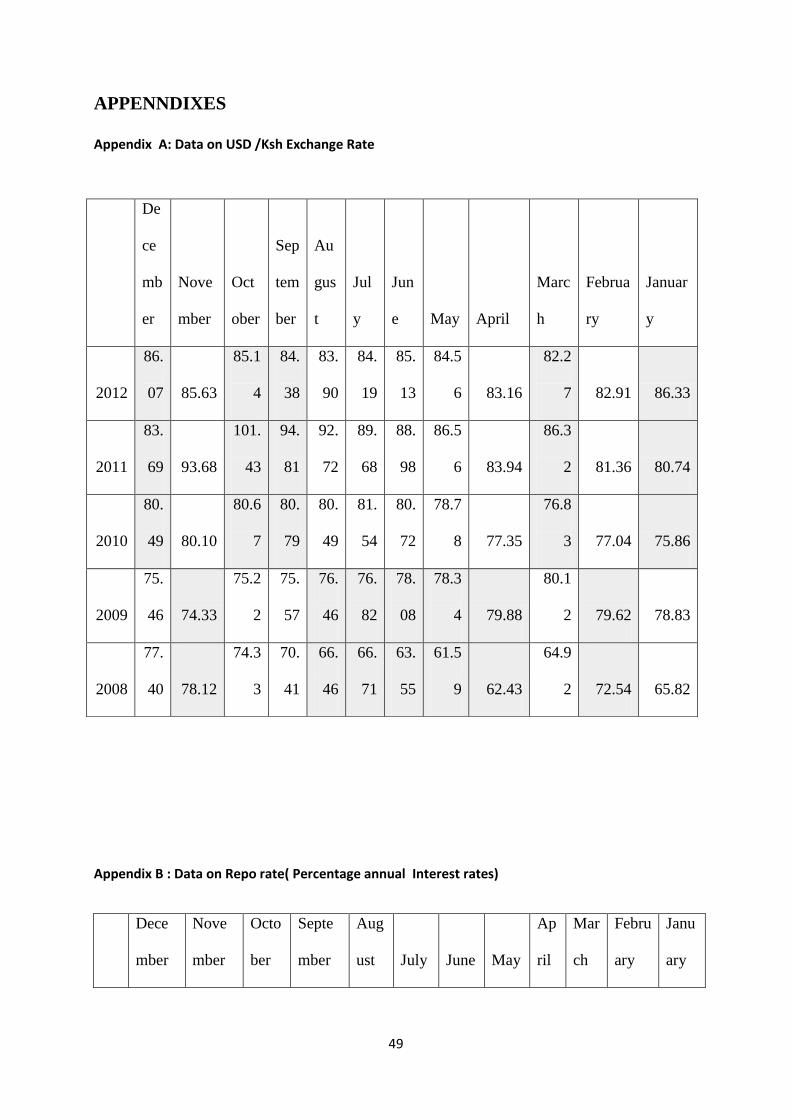
49
APPENNDIXES
Appendix A: Data on USD /Ksh Exchange Rate
Appendix B : Data on Repo rate( Percentage annual Interest rates)
Dece
mber
Nove
mber
Octo
ber
Septe
mber
Aug
ust July June May
Ap
ril
Mar
ch
Febru
ary
Janu
ary
De
ce
mb
er
Nove
mber
Oct
ober
Sep
tem
ber
Au
gus
t
Jul
y
Jun
e May April
Marc
h
Februa
ry
Januar
y
2012
86.
07 85.63
85.1
4
84.
38
83.
90
84.
19
85.
13
84.5
6 83.16
82.2
7 82.91 86.33
2011
83.
69 93.68
101.
43
94.
81
92.
72
89.
68
88.
98
86.5
6 83.94
86.3
2 81.36 80.74
2010
80.
49 80.10
80.6
7
80.
79
80.
49
81.
54
80.
72
78.7
8 77.35
76.8
3 77.04 75.86
2009
75.
46 74.33
75.2
2
75.
57
76.
46
76.
82
78.
08
78.3
4 79.88
80.1
2 79.62 78.83
2008
77.
40 78.12
74.3
3
70.
41
66.
46
66.
71
63.
55
61.5
9 62.43
64.9
2 72.54 65.82
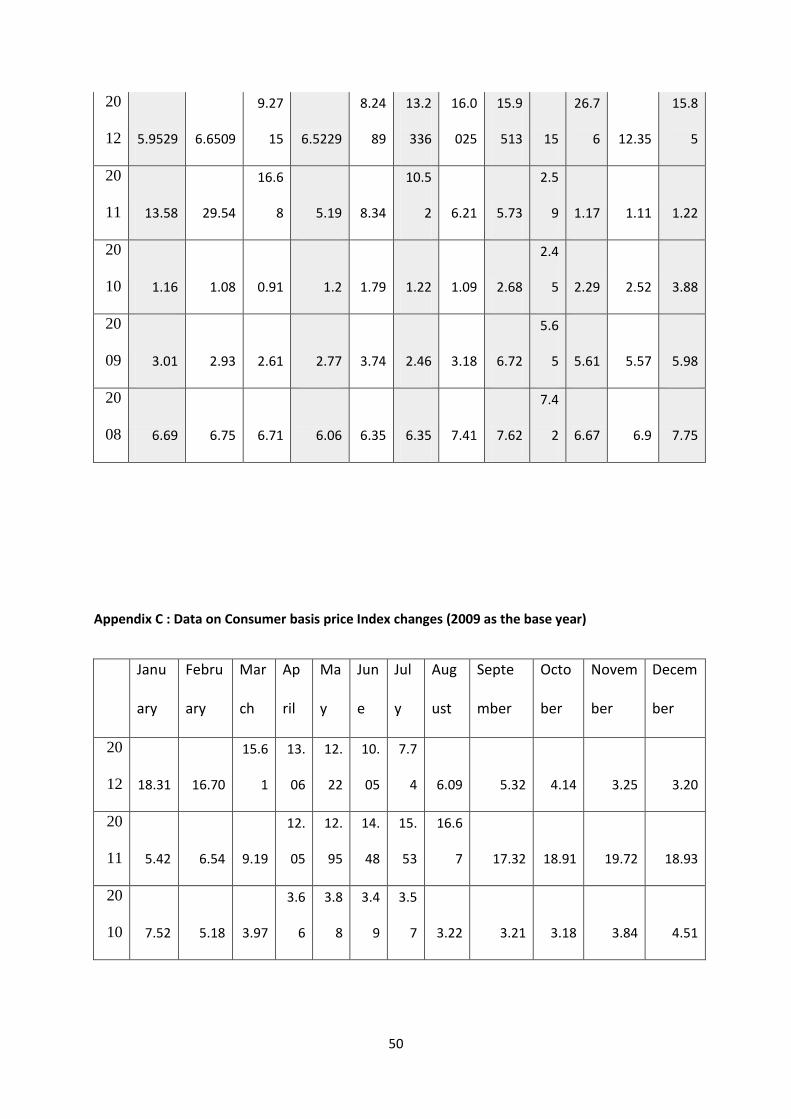
50
20
12 5.9529 6.6509
9.27
15 6.5229
8.24
89
13.2
336
16.0
025
15.9
513 15
26.7
6 12.35
15.8
5
20
11 13.58 29.54
16.6
8 5.19 8.34
10.5
2 6.21 5.73
2.5
9 1.17 1.11 1.22
20
10 1.16 1.08 0.91 1.2 1.79 1.22 1.09 2.68
2.4
5 2.29 2.52 3.88
20
09 3.01 2.93 2.61 2.77 3.74 2.46 3.18 6.72
5.6
5 5.61 5.57 5.98
20
08 6.69 6.75 6.71 6.06 6.35 6.35 7.41 7.62
7.4
2 6.67 6.9 7.75
Appendix C : Data on Consumer basis price Index changes (2009 as the base year)
Janu
ary
Febru
ary
Mar
ch
Ap
ril
Ma
y
Jun
e
Jul
y
Aug
ust
Septe
mber
Octo
ber
Novem
ber
Decem
ber
20
12 18.31 16.70
15.6
1
13.
06
12.
22
10.
05
7.7
4 6.09 5.32 4.14 3.25 3.20
20
11 5.42 6.54 9.19
12.
05
12.
95
14.
48
15.
53
16.6
7 17.32 18.91 19.72 18.93
20
10 7.52 5.18 3.97
3.6
6
3.8
8
3.4
9
3.5
7 3.22 3.21 3.18 3.84 4.51
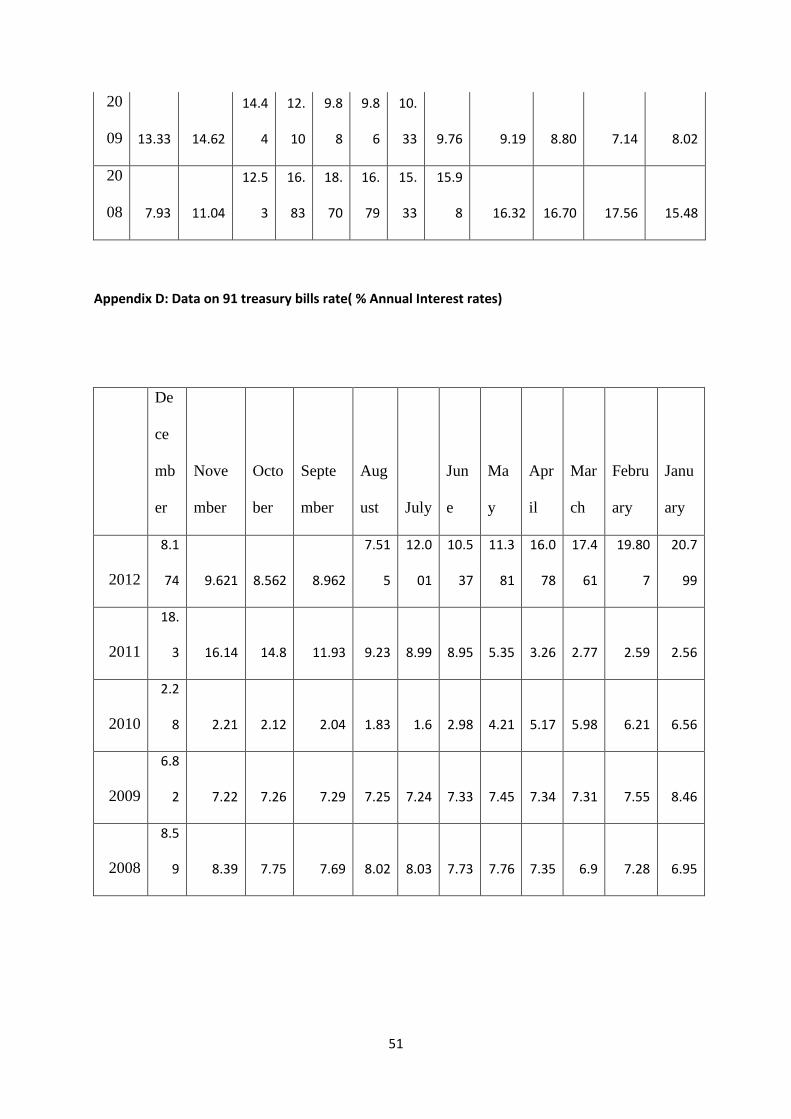
51
20
09 13.33 14.62
14.4
4
12.
10
9.8
8
9.8
6
10.
33 9.76 9.19 8.80 7.14 8.02
20
08 7.93 11.04
12.5
3
16.
83
18.
70
16.
79
15.
33
15.9
8 16.32 16.70 17.56 15.48
Appendix D: Data on 91 treasury bills rate( % Annual Interest rates)
De
ce
mb
er
Nove
mber
Octo
ber
Septe
mber
Aug
ust July
Jun
e
Ma
y
Apr
il
Mar
ch
Febru
ary
Janu
ary
2012
8.1
74 9.621 8.562 8.962
7.51
5
12.0
01
10.5
37
11.3
81
16.0
78
17.4
61
19.80
7
20.7
99
2011
18.
3 16.14 14.8 11.93 9.23 8.99 8.95 5.35 3.26 2.77 2.59 2.56
2010
2.2
8 2.21 2.12 2.04 1.83 1.6 2.98 4.21 5.17 5.98 6.21 6.56
2009
6.8
2 7.22 7.26 7.29 7.25 7.24 7.33 7.45 7.34 7.31 7.55 8.46
2008
8.5
9 8.39 7.75 7.69 8.02 8.03 7.73 7.76 7.35 6.9 7.28 6.95
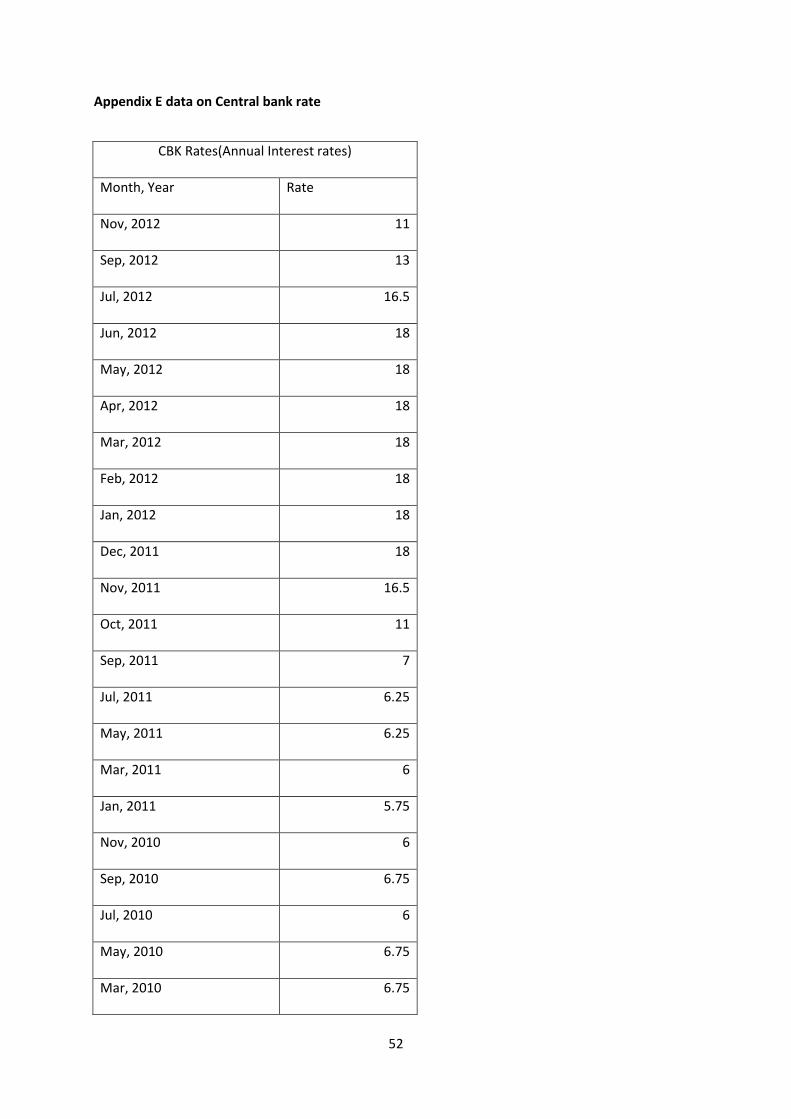
52
Appendix E data on Central bank rate
CBK Rates(Annual Interest rates)
Month, Year Rate
Nov, 2012 11
Sep, 2012 13
Jul, 2012 16.5
Jun, 2012 18
May, 2012 18
Apr, 2012 18
Mar, 2012 18
Feb, 2012 18
Jan, 2012 18
Dec, 2011 18
Nov, 2011 16.5
Oct, 2011 11
Sep, 2011 7
Jul, 2011 6.25
May, 2011 6.25
Mar, 2011 6
Jan, 2011 5.75
Nov, 2010 6
Sep, 2010 6.75
Jul, 2010 6
May, 2010 6.75
Mar, 2010 6.75
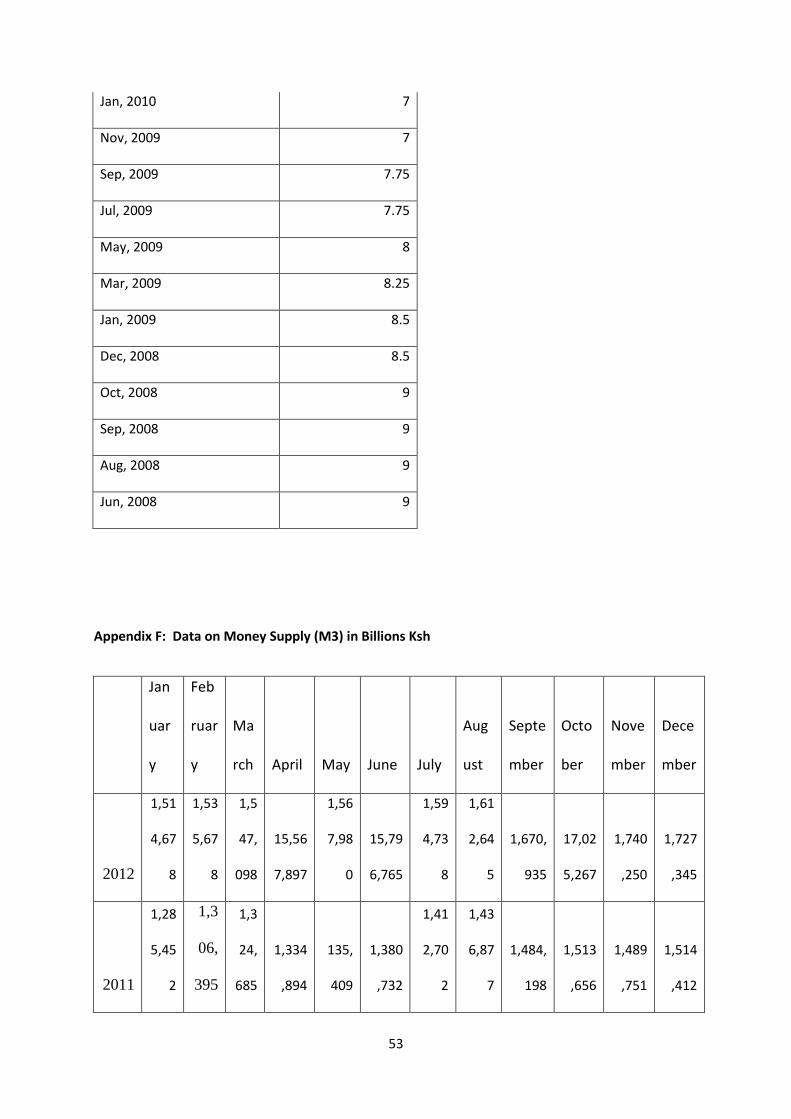
53
Jan, 2010 7
Nov, 2009 7
Sep, 2009 7.75
Jul, 2009 7.75
May, 2009 8
Mar, 2009 8.25
Jan, 2009 8.5
Dec, 2008 8.5
Oct, 2008 9
Sep, 2008 9
Aug, 2008 9
Jun, 2008 9
Appendix F: Data on Money Supply (M3) in Billions Ksh
Jan
uar
y
Feb
ruar
y
Ma
rch April May June July
Aug
ust
Septe
mber
Octo
ber
Nove
mber
Dece
mber
2012
1,51
4,67
8
1,53
5,67
8
1,5
47,
098
15,56
7,897
1,56
7,98
0
15,79
6,765
1,59
4,73
8
1,61
2,64
5
1,670,
935
17,02
5,267
1,740
,250
1,727
,345
2011
1,28
5,45
2
1,3
06,
395
1,3
24,
685
1,334
,894
135,
409
1,380
,732
1,41
2,70
2
1,43
6,87
7
1,484,
198
1,513
,656
1,489
,751
1,514
,412
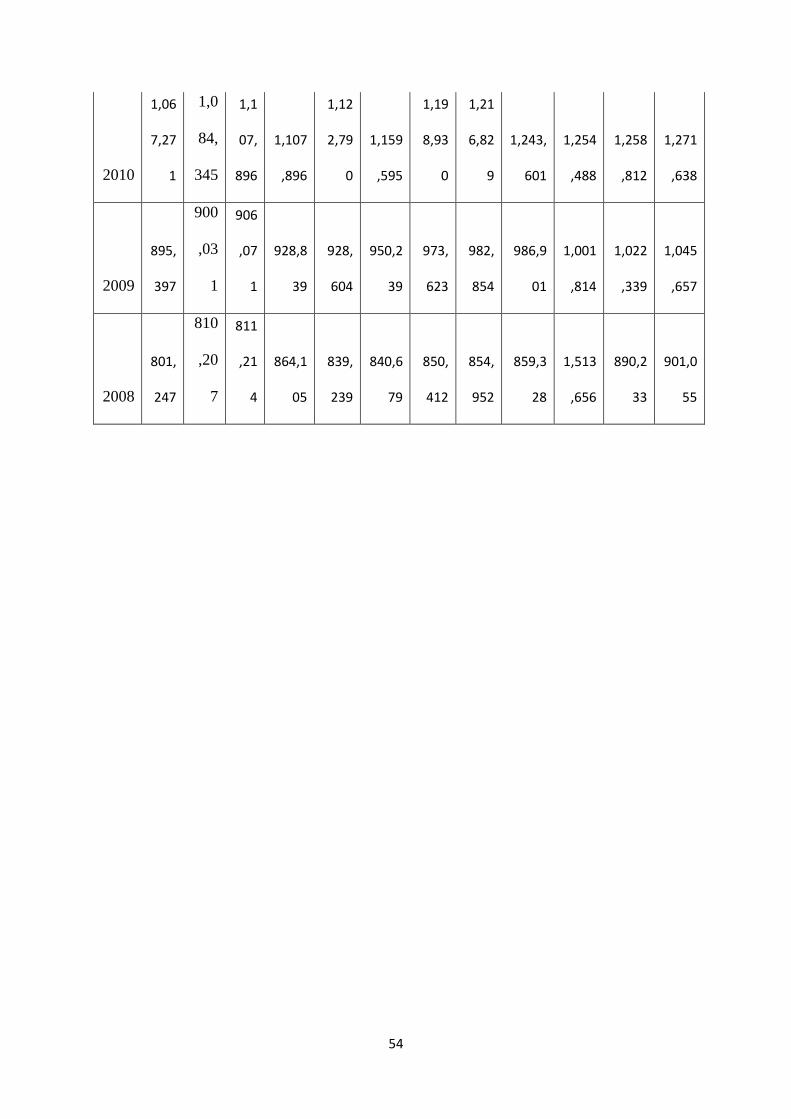
54
2010
1,06
7,27
1
1,0
84,
345
1,1
07,
896
1,107
,896
1,12
2,79
0
1,159
,595
1,19
8,93
0
1,21
6,82
9
1,243,
601
1,254
,488
1,258
,812
1,271
,638
2009
895,
397
900
,03
1
906
,07
1
928,8
39
928,
604
950,2
39
973,
623
982,
854
986,9
01
1,001
,814
1,022
,339
1,045
,657
2008
801,
247
810
,20
7
811
,21
4
864,1
05
839,
239
840,6
79
850,
412
854,
952
859,3
28
1,513
,656
890,2
33
901,0
55