Embed Size (px)
Citation preview

Relationship between perceived organizational support and
willingness to pursue a career in the hospitality industry
Maria Jokela
Bachelor’s thesis 2012
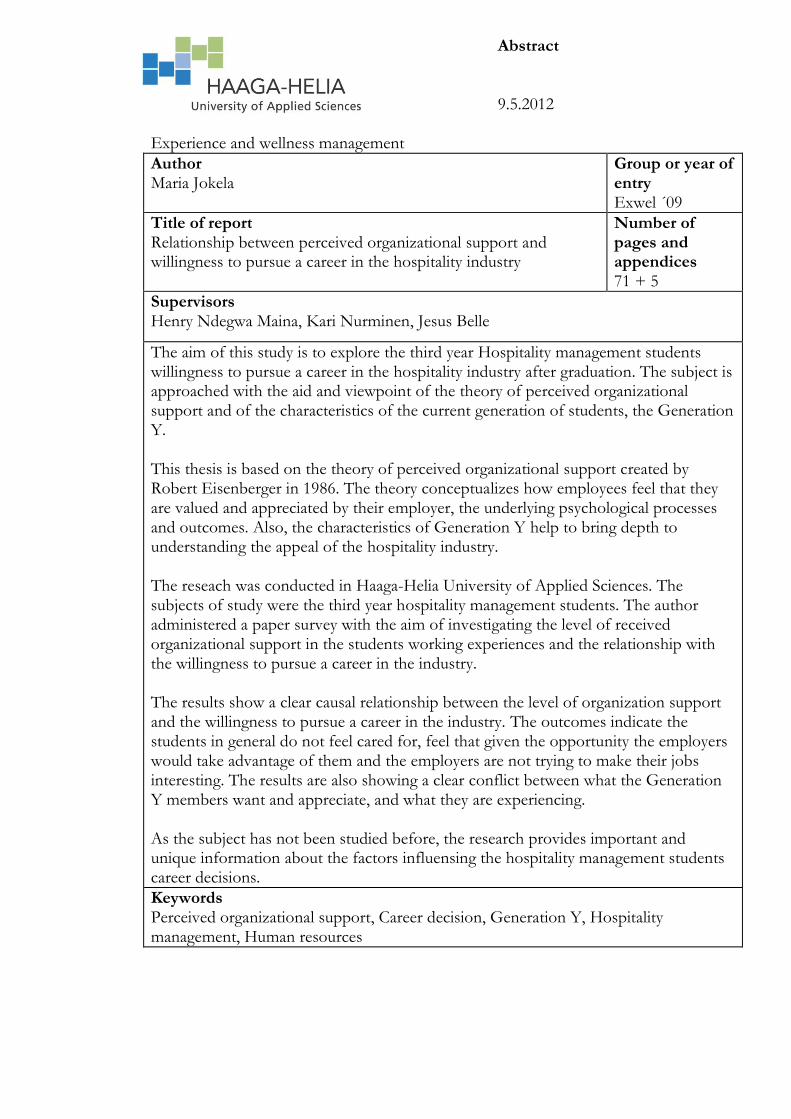
Abstract 9.5.2012 Experience and wellness management
Author Maria Jokela
Group or year of entry Exwel ´09
Title of report Relationship between perceived organizational support and willingness to pursue a career in the hospitality industry
Number of pages and appendices 71 + 5
Supervisors Henry Ndegwa Maina, Kari Nurminen, Jesus Belle
The aim of this study is to explore the third year Hospitality management students willingness to pursue a career in the hospitality industry after graduation. The subject is approached with the aid and viewpoint of the theory of perceived organizational support and of the characteristics of the current generation of students, the Generation Y. This thesis is based on the theory of perceived organizational support created by Robert Eisenberger in 1986. The theory conceptualizes how employees feel that they are valued and appreciated by their employer, the underlying psychological processes and outcomes. Also, the characteristics of Generation Y help to bring depth to understanding the appeal of the hospitality industry. The reseach was conducted in Haaga-Helia University of Applied Sciences. The subjects of study were the third year hospitality management students. The author administered a paper survey with the aim of investigating the level of received organizational support in the students working experiences and the relationship with the willingness to pursue a career in the industry. The results show a clear causal relationship between the level of organization support and the willingness to pursue a career in the industry. The outcomes indicate the students in general do not feel cared for, feel that given the opportunity the employers would take advantage of them and the employers are not trying to make their jobs interesting. The results are also showing a clear conflict between what the Generation Y members want and appreciate, and what they are experiencing. As the subject has not been studied before, the research provides important and unique information about the factors influensing the hospitality management students career decisions.
Keywords Perceived organizational support, Career decision, Generation Y, Hospitality management, Human resources
1
Table of contents 1 Introduction .......................................................................................................................... 5
2 Generation Y- The new workforce ................................................................................... 8
2.1 Defining Generation Y ............................................................................................... 8
2.2 Implications of generation on working life.............................................................. 9
2.3 What are Generation Y members like .................................................................... 10
2.4 What Generation Y members want ........................................................................ 13
2.5 The employers perceptions of Generation Y employees .................................... 15
2.6 What is so special about Generation Y .................................................................. 16
3 Human resource management- a tormenting issue for the Hospitality industry ...... 18
4 Perceptions of the Generation Y hospitality students .................................................. 21
4.1 Generation Y hospitality management students perceptions and attitudes
towards the hospitality industry ....................................................................................... 21
4.2 Pursuing a career in the hospitality industry- Yes, No, Maybe ........................... 24
4.3 Summary of Generation Y members charactaristics, perceptions of the
Hospitality industry and aspects that they want in organizations ................................ 26
5 Perceived organizational support ..................................................................................... 28
5.1 Psychological processes and factors influensing POS .......................................... 29
5.1.1 Personification of the organization ............................................................. 29
5.1.2 Organizational discretion ............................................................................. 30
5.1.3 Organization sincerity ................................................................................... 31
5.1.4 Organizational embodiment ........................................................................ 31
5.1.5 Felt oblication and expected reward for high effort ................................. 32
5.1.6 Socioemotional need fulfillment .................................................................. 33
5.1.7 Anticipated help ............................................................................................. 33
5.2 Behavioral outcomes of perceived organizational support- why caring is good
for business ......................................................................................................................... 34
5.2.1 Job performance ............................................................................................ 34
5.2.2 Withdrawal behaviour ................................................................................... 35
5.2.3 Reduced workplace deviance ....................................................................... 36
5.2.4 Creativity and Innovation ............................................................................. 36
5.2.5 Safety related behaviour ................................................................................ 36
2
5.2.6 Acceptance of information technology ...................................................... 37
5.2.7 Customer service ........................................................................................... 37
5.3 Are the employees merely a cost or the organizations biggest asset .................. 38
5.4 Why caring is good for business ............................................................................. 40
6 Research methodology ...................................................................................................... 42
6.1 Subjects of the study and data collection ............................................................... 42
6.2 Research instrument ................................................................................................. 44
6.2.1 Control variables ............................................................................................ 44
6.2.2 Independent variables ................................................................................... 45
6.2.3 Dependent variables ...................................................................................... 47
6.3 Testing of the questionnaire .................................................................................... 47
6.4 Limitations of the study............................................................................................ 47
6.5 Organizing the data ................................................................................................... 48
6.6 Data analysis ............................................................................................................... 49
6.6.1 Part A .............................................................................................................. 49
6.6.2 Part B .............................................................................................................. 50
7 Results .................................................................................................................................. 51
7.1 Characteristics of the respondents .......................................................................... 51
7.2 Part A- Exploration and discovery of patterns in POS ....................................... 53
7.2.1 Whole population .......................................................................................... 53
7.2.2 Gender ............................................................................................................ 54
7.2.3 Language of the degree program ................................................................. 55
7.2.4 Amount of work experience ........................................................................ 55
7.2.5 Likeliness to pursue a career in the hospitality industry ........................... 56
7.3 Part B- Causality between POS and the willingness to pursue a career in the
hospitality industry ............................................................................................................. 57
8 Discussion ........................................................................................................................... 60
8.1 Interpretation of the results ..................................................................................... 61
8.1.1 Part A- Patterns and trends in POS of the whole population and of
specific segments ....................................................................................................... 61
8.1.2 Part B- Causal relationship between the level of POS and willingness to
pursue a career in the hospitality industry ............................................................. 64
3
8.2 Reliability and validity of the results ....................................................................... 65
8.3 Suggestions for development................................................................................... 66
8.4 Suggestions for further research .............................................................................. 68
8.5 Asessment of thesis process and learning .............................................................. 68
Bibliography ............................................................................................................................. 70
Attachments ............................................................................................................................. 76
Attachment 1. Perceived organizational support questionnaire .................................. 76
Attachment 2. Abbreviations of questionnaire statements .......................................... 79
List of Tables
Table 1. Summary of the characteristics of Gen Y’s, what aspects they want in the
organizations and the perceptions of Gen Y students of the hospitality industry….. 26
Table 2. Marginal capital view versus Human capital view ………………………….39
Table 3. Calculated averages of responses to questions concerning POS……………53
Table 4. Calculated averages of responses to questions concerning POS according to
gender……………………………………………………………………………….54
Table 5. Calculated averages of responses to questions concerning POS according to
language of the degree program……………………………………………………..55
Table 6. Calculated averages of responses to questions concerning POS according to
the amount of work experience………………………………………………….......55
Table 7. Calculated averages of responses to question concerning the willingness to
pursue a career in the hospitality industry…………………………………………....56
Table 8. Willingness to pursue a career in the hospitality industry……………….......57
Table 9. Calculated averages of responses to questions concerning POS according to
the willingness of pursuing a career in the hospitality industry………………………58
4
List of Figures
Figure 1. Gender distribution of the respondents…………………………………... 51
Figure 2. Language of the degree program…………………………………………. 52
Figure 3. Amount of work experience in the hospitality industry…………………. 52
5
1 Introduction
Over decades, tourism and hospitality has experienced continuing growth and deepen-
ing diversification and has become one of the fastest growing economic sectors in the
world. At the same time the big generation of Baby Boomers (born 1946-1964) are
slowly retiring and the generation Y (born 1977-2000) is entering the industry. The
industry is suffering from high turnover rates and difficulties to attract and retain a
sufficient amount of skilled workers.
Studies have shown that the generation Y has distinct characteristics which differ from
the previous generations. Terjesen`s study conducted among university students in
2007 explored the perceptions of the most valued organizational attributes of Genera-
tion Y. The attributes were “Invest heavily in the training and development of their
employees, care about their employees as individuals, clear opportunities for long term
career progression and dynamic, forward looking approach to their business”. (Ter-
jesen, 2007) In another words, Generation Y seems to highly value organizational sup-
port.
Employees who are emotionally committed to the organization show heightened per-
formance, reduced absenteeism, and a lessened likelihood of quitting their job (Rhoad-
es, Eisenberger et al, 2002). Robert Eisenberger´s theory of Perceived organizational
support (from now on abbreviated as POS) “allows for an understanding of employ-
ees’ favorable reactions to positive treatment by the organization. In brief, the theory
holds that employees personify the organization, thinking of it as having lifelike quali-
ties, including benevolent or malevolent intentions toward them. Employees value
POS because it meets their socioemotional needs (e.g. approval, esteem, affiliation,
emotional support) and indicates the organization is ready to provide them help when
needed and reward their increased efforts.” (Eisenberger & Stinghamber 2011, 5)
Negative image of the industry, as held by some hospitality and tourism students ap-
pears to be developed in proportion to the increase in students´ exposure to working
life in the industry. (Barron, Maxwell & Broadbridge, Odgen, 2007). This is a serious
6
problem for the future of the hospitality industry. Human resource concerns are con-
sistently listed as the number one item of concern form hotel and restaurant operators
(Solnet & Hood 2008). This raises the question, if the Generation Y members value
highly organizational support, are they getting any?
This research explores Hospitality students’ views regarding POS in their
work/internship experiences within the hospitality industry. The aim of the research is
to study the relationship between POS and the willingness to pursue a career in the
hospitality industry.
The subjects of this study are the third year Hospitality Management students of Haa-
ga-Helia University of Applied Sciences. The third year students were chosen because
they possess already an adequate amount of work experience to have a view about the
level of POS. These students are also in their final year and thus graduating shortly.
This allows the valid examining of the reasons impacting the willingness to pursue a
career in the hospitality industry.
The author decided to study hospitality students because of personal previous work
experience. The author worked 10 years in the hospitality industry before starting to
study a wholly different profession and specializing in Human Resources. Within the
10 years in the industry the author witnessed the industry’s notoriously bad working
conditions and saw a lot of highly skilled professionals shifting industry.
The turnover rate in the hospitality industry is very high, and many graduating students
are changing careers before they have really even gotten started. This turnover is very
costly for the hospitality industry and has enormous financial impacts. Considerable
amount of students studying hospitality start studying something else or give up their
studies. These decisions have impacts first of all for the students themselves but also
for the educating institutions.
In their study of students studying hospitality and tourism degrees in Scotland, Barron
and Maxwell (1993) identified that impressions of working life in the industry changed
7
from being wholly positive to wholly negative as a consequence of the period of indus-
trial experience that was core to the students program studies (Barron, Maxwell,
Broadbridge & Odgen, 2007).
Maybe combining what the previous studies implicate of the values of the Generation
Y and the theory of POS, it could give some answers to the problems that the hospital-
ity industry has with attracting and maintaining work relationships with Generation Y
hospitality students.
This report first presents the theoretical framework to which the empirical part is
founded on. In the theoretical framework at first the subject matter of Generation Y
will be discussed followed by a description of the human relations issues of hospitality
industry. The theoretical framework part continues with depicting the Generation Y
hospitality students’ perceptions and attitudes towards the industry and is concluded
with detailed introduction of the theory of POS.
The theoretical framework is followed by the empirical part. The research methodolo-
gy and the results will be presented. After the results, the findings are being discussed
by combining theoretical framework and the author’s subjective insights. The report is
concluded with recommendations to both the educational institutions providing hospi-
tality management programs and to the hospitality industry.
8
2 Generation Y- The new workforce
As the largest generation in the current work force, known as the baby boomers (born
after the second World-War), are starting to retire, the next generation, the Generation
Y is entering the industry (Solnet & Hood 2008). They come with totally different
mindsets and values, whether or not the hospitality industry is prepared to adapt to
them. In the following chapter, the characteristics of the Generation Y, what they want
from their future careers and employers and how the employers see the new hospitality
apprenticies are discussed.
2.1 Defining Generation Y
According to Kupperschmidt (2000) a generation is an identifiable group of people
who share the same birth years, age location as well as share significant life events at
critical developmental stages (in Macky, Gardner & Forsyth 2008; Solnet & Hood
2008). We are now facing for the first time in the history of the modern work force, a
situation, where employees from many different generations are working in the same
organizations at the same time (Solnet & Kralj 2010).
The most recent demographic group which has entered the higher education and work
life has been named as Generation Y. The years of birth vary from starting years of
1977-1982 to ending years of 1994-2003 (Shaw & Fairhurst 2008). The debate about
the definition is on-going and the arguments surrounding the definition of the
Generation Y are problematic (Cairncross & Buultjens 2007). Nonetheless, finding an
undebatable definition of the birth years of Generation Y is beoynd the scope of this
thesis. Thus, in this study, the Generation Y is considered to include all birth years
starting from 1977.
9
2.2 Implications of generation on working life
The style of working, belief systems, values and attitudes of Generation Y members are
regarded as fundamentally different from any other group of young people in the last
50 years (O’Reilly and Vella-Zarb 2000 in McGuire, Todnem & Hutchinson 2007).
There are many studies, which have investigated how generational differences affect
the working life. Zemke, Raines and Filiczak (1999) suggested that “there is a growing
realization that the gulf of misunderstanding and resentment between older, not so old,
and younger employees in workplace is growing and problematic” (Chen & Choi
2008). This might be a consequence of differences in the work values of the different
generations.
White (2005) defines work values as underlying preferences and beliefs that should be
satisfied in people’s career choises and that affect the job behavior (in Chen & Choi
2008). According to Chen and Choi (2008) understanding the similarities and
differences in the work values of different generations is vital for effective human
resources strategies. Especially in the context of recruitment and employee retention
because Generation Y employees are starting to fill up managerial positions (Chen &
Choi 2008).
According to Kawana-Brown (2007) all industries are facing the same challenge, but
the need to understand the work values of Generation Y is especially important for
the tourism and hospitality industries which, in comparison to the other industries,
employ proportionately larger number of Generation Y employees. Interestingly, the
tourism and hospitality industries are currently facing significant shortages of skilled
labor, and will therefore require more Generation Y workers (Kawana-Brown 2007).
Research evidence shows that failures in acknowledging and adjusting to generational
differences may have effects on employee productivity, corporate citizenship and
innovativeness, leading to problems with employee turnover and retention (Westerman
& Yamamura 2007). McGuire, Todnem & Hutchinson (2007) argue that organizations
must seek a way to optimize the talents of all age groups, pay attention to reconciling
10
differences between generations and employees. McGuire et al. (2007) also state that
the organizations should take advantage of the diversity, not only for the benefit of the
organization, but also for the individual employees. This will consequently create an
organizational culture that is not threathened but instead values and fosters diversity
(McGuire et al. 2007).
In their research (2008), Chen and Choi found differences between work value
rankings of different generations, but on the other hand they also found similarities.
Some researchers such as Macky, Gardner and Forsyth (2008) and Kawana-Brown
(2007) have been critical, suggesting the differences of the generations are exaggerated
and are more in the field of pop culture than of social sciences. Macky et al.(2008)
argue that many of the empirical findings concerning the generational differences are
less consistent and stronger than the popular sentiment suggests. They also point out
that there is more variation among the members of a generation than between
generations (Macky et al. 2008).
On the contrary, Smola & Sutton (2002, 379) examined the differences in values
among the generations, and based on their findings argued that in fact work values are
more influenced by the generation than by the state of individual maturity or age. What
we have to keep in mind when talking about generations is as Patota (2007 in McGuire
et al. 2008) states: “Generational groups describe general characteristics and are not
mutually exclusive, homogenous categories; consequently, not all Baby Boomers
believe in lifetime employment, nor are all Generation Y individuals technologically
minded.”
2.3 What are Generation Y members like
Creating a holistic, undebateble definition of the Generation Y members characteristics
is almost impossible to create. All the following researches look at the Generation Y
members in a slighly different point of view. Nonetheless, from these studies we are
able to get a overview of the findings.
11
Howe and Strauss (2003, in Shih & Allen 2007) examined the characteristics of the
Generation Y and identified the following seven core traits reflecting the general
personality of Generation Y; special, sheltered, confident, team-oriented, conventional,
pressured, and achieving. The first five core traits Shih and Allen (2007) describe as
follows:
The first three traits are inextricably linked to the parents of Generation-D (synonym to
Generation Y) who are typically nurturing to a fault and personally and have
financially invested in their children, earning the title, Helicopter Parents, for their
frequent and intense involvement or hovering in many aspects of their children’s lives.
Since early childhood, Generation-D kids have been socializing in groups in the forms
of daycare, play groups and preschools. Group interaction is continued by primary and
secondary education where collaborative learning is an important pedagogical strategy.
Because of the close and positive relationships most Net Gens have with their parents,
the children of the Boomers share many of their parents’ values and perceive a smaller
generation gap than usual between themselves and their folks, resulting in general
acceptance of existing standards or conventions. (Shih & Allen 2007)
As Eubanks (2008) explains in the executive summary he wrote about Howe and
Strausses book Millennials go to College (2003) the two last traits; pressured and
achieving are reflecting the uncertainty and competitiveness of today’s working life. He
also states that there is less believe that one can rebound from failure among
Generation Y than among their predecessors, which leads to the need of constant
achievement (Eubanks 2008).
Rebecca Piekkari and Janne Tienari, two professors of Aalto University of Helsinki
have found very similar results in their study conducted in Finland (Knuutinen 2011).
The professors state that the new generation has the courage to demand, they say their
opinions fearlessly and that they have the audacity to ask for more humane treatment
in the working life (Knuutinen 2011). The new generation wants more meaning to their
work than just to increase the profits for the owners (Knuutinen 2011). And
interestingly, the professors Piekkari and Tienari (in Knuutinen 2011) state that time is
12
not linearic for Y’ers but more like “bursts” that comprise of intense periods of project
work and longer periods of leisure time.
Martin (2005) describes the Generation Yers as blunt, techno-savvy, a contradictory
generation that sees technology is as natural as the air they breathe, education is the key
to success and that corporate social responsibility is a must. Generation Y is also the
most technically literate generation and as an outcome of simultaneous surfing online,
text messaging, chatting and blogging this generation really knows how to multitask
(Cairncross & Buultjens 2007). The Generation Y is raised in an uncertain world with
environmental shocks and threats from terrorism with 24/7 news cycle and the ability
to be connected to the events real time through the advances in information
technology (Solnet & Hood 2008). According to Solnet & Hood (2008) this creates a
low tolerance for boredom.
For the Y’ers, work is not the whole life, and according to Saurama (in Paavola 2011),
meaningfulness is what the Generation Y is looking for from their work. Even though
the Generation Y is seen as confident, independent, individualistic, entrepreneurial and
at the same time socially active, team oriented and collaborative, they are seen as
emotionally needy and constantly seeking for praise, approval and feedback (Shaw &
Fairhurst 2008; Martin 2005).
In 2010 Psycon Oy conducted a joint research with the Finnish Junior Chamber
International about the expectations of the Generation Y members. The results were
very similar to the studies of other researchers, but in their study, contradicting the
others studies the results showed that within the Generation Y there is less desire to
become an entrepreuner than among the other generations (Psycon 2010). The
researchers also asked about the most important aspects of life. The results showed
that for the generation Y’ers they were; Family, Friends and Work, percicely in this order
(Psycon 2010). Allthough, this finding might also be because of the young age of the
generation.
13
2.4 What Generation Y members want
Terjesen, Vinnicombe and Freeman (2007) conducted a study measuring the most
important organizational attributes of 862 undergraduate Generation Y students in the
UK. As a result of the study, Terjesen et al. (2007) identified the following five most
important organizational attributes; invest heavily in the training and development of
their employees, care about their employees as individuals, clear opportunities for long
term career progression, variety of daily work and dynamic, forward-looking approach
to their business.
Sheahan (2005 in Kawana-Brown 2007) identified job attributes that employers hoping
to retain Generation Y employees should posses. These attributes were;
Inclusive management style that encourage participation and empowerment, responsibility,
encouragement for Generation Y employees to express their individuality and creativity
Mentoring- a combination of ‘telling’ and ‘asking’
Regular recognition and personal connection
Fair compensation and diverse material rewards
Opportunities for involvement and a feeling of being valued, a sense of purpose and meaning
in their work and ‘employability’
Training and career development (especially in ‘soft skills’)
Competent managers and supervisors and new challenges and experiences
Varied job role and opportunity for advancement
Saurama (in Paavola 2011) argues that the new generation will not tolerate bad
management like the previous generations, but will quickly move on to a new work
place. Saurama also continues by stating that the demands the Generation Y members
put on the management are highlighting the exact things, which are causing the lack of
well-being in the working environments (Paavola 2011). In their study conducted in
Finland, Piekkari and Tienari found that the Generation Y members want to have a
new aspect of well-being to work (Knuutinen 2011). They are hoping for more
individual treatment, opportunities to influence their own work and a more open and
creative working culture (Knuutinen 2011).
14
In their article “Engaging a new generation of graduates” based on a literature review
and studies regarding Generation Y, Shaw and Fairhurst (2008) suggested that the ideal
culture for a Generation Y organization should have the following characteristics;
It would be open to the benefits of technology and new ways of working
It would ask challenging questions and demand honest answers
Its employees would not be fixated on status and hierarchy
It would value an individual’s life outside work as much as it values their contribution to the
organization
It would genuinely care for its people and the communities in which it operates
As Terjesen et al. (2007) state, the importance of understanding these preferred
organizational attributes of Generation Y cannot be underestimated or ignored,
because rather sooner than later this generation will soon be replacing the retiring
Baby Boomers. As we will analyze some of the previous researches, which have
examined the perceptions that students have of the hospitality industry, we will see that
what the Generation Y students want is not what they are getting.
The hospitality industry as a whole should pay attention to the warning signs, and act
on them regardless of the perception of ‘who is wrong here’ (Kawana-Brown 2007).
When considering the pressures the hospitality industry is facing currently and in the
near future, the present strategies for attracting and retaining skilled, educated staff are
not enough (Kawana-Brown 2007). Kawana- Brown (2007) also states that
“Generation Y students’ perception that workplace realities fall significantly short of
their ideal, may be a bitter pill to swallow for employers who also perceive that these
Generation Y employees are not measuring up to their expectations.” This leads us to
ponder the next question of how do the employers see the Generation Y employees?
15
2.5 The employers perceptions of Generation Y employees
The supposed characteristics of Generation Y (also referred to as “Gen Y”) employees
are often seen as problematic by some employers. Despite being well educated, seeking
an intellectual challenge and being keen to make a difference, perceived character traits
such as a lack of respect for authority and a desire for immediate gratification are
viewed negatively by some employers. (Cairncross & Buultjens 2007)
Interestingly enough, there seems to be an obvious lack of scientific research
concerning how the Generation Y employees are seen by the employers. Most of the
literature found is either newspaper articles or pieces of literature that fall in to the
category of blogs or opinions.
In a study where 315 SME owners in Australia were surveyed, almost 90% of surveyed
employers stated that Generation Y employees are more demanding than other
employees, demanding pay raises, better office amenities and training (Preston 2007).
Preston (2007) found the issues the employers were mostly disappointed with were;
communication skills such as spelling and grammar, failure to understand what is
appropriate corporate behaviour and lack of acceptable technical skills.
Then again “A whopping 85% of SME owners report they are happy with their Gen-Y
employees’ technology skills, suggesting that older business owners are relying on their
younger employees to help them keep up with the latest technology trends.” (Preston
2007). Also, Preston (2007) found out that the employers appreciate the fast learning
and adopting skills of the Generation Y employees as well as their ability to handle
change.
Cairncross and Buultjens (2007) conducted a research by interviewing 30 Australian
hospitality employers concerning their views on Generation Y employees. 29 of the 30
employers indicated that they have some sort of problems or issues with Generation Y
employees (Cairncross & Buultjens 2007). Many of the respondents specifically
mentioned that in their opinion the Generation Y employees are not willing to ‘do the
16
hard yards’ in a job and that the Generation Y employees have unrealistic expectations
when it comes to promotions and remuneration (Cairncross & Buultjens 2007).
Though that Cairncross and Buultjens (2007) found the vast majority of employers had
a negative view of the Generation Y employees, four managers expressed very positive
attitudes. These four managers also reported that they see the Generation Y as an
opportunity and thus accommodated their needs such as social activities, training,
better pay and more flexible work hours (Cairncross & Buultjens 2007).
2.6 What is so special about Generation Y
Even though a common view about the birth years of the Generation Y members is
yet to be established, there is a consensus that the rise of the new generation is
anything but un-problematic. The Generation Y members are characterised as blunt,
techno-savvy, confident, team-oriented individualists that are more demanding then
any other generation before. As confident as they are, they are still looking for constant
feedback, appraisal and approval.
The new generation appreciates development opportunities, which indicates that this
generation does not even think, that a life long employee-employer relationship exists.
It is merely seen as an urban legend, but it also might not be what the Gen Y’ers would
desire anyways. The Generation Y wants more open organizational culture and clear
opportunities for career progression.
And one thing that they really want is good management. If one asks this generation,
they would say that the time for dictative hierachical management is over. They want to
be included, coached, mentored and empowered. As the Finnish Aalto University
professors Piekkari and Tienari said, this generation will not tolerate bad management
or unhuman treatment, they will vote with their feet and find another company to
work for (Knuutinen 2011). And it is about time for that as well if we look at the
current state in the working life.
17
The economy is nevertheless setting a challenge. When the economy is thriving there is
a good environment for democratic management but at the time of a downturn
authocratic leadership is in demand. While conducting this research the world
economy is in turmoil. The increased insecurity and bad forcasts of the future of the
world economy might not be in favor of the Gen Y’s management revolution. The sad
fact is that in times of recession or even depression when the competition for any job
is fierce, demanding for great management or voting with your feet is not at the top of
the things to do.
18
3 Human resource management- a tormenting issue for the
Hospitality industry
The human element is a critical one in the hospitality industry for service quality,
competitive advantage, customer satisfaction and loyalty and for the organizational
performance (Kusluvan, Kusluvan, Ilhan & Buyruk, 2010). Mathis and Jackson define
Human Resources Management as “design of formal systems in an organization to
ensure the effective and efficient use of human talent to accomplish organizational
goals” (in Kusluvan et al. 2010).
Human resources management issues have been found to be the number one concern
for the hospitality operators around the world, year after year (Enz, 2001; Enz, 2004;
Enz, 2009). The author also states that the issues of attraction, retention, training and
morale are the key areas of concern, which was also the case in her study conducted
eight years earlier (Enz, 2001).
According to Enz (2001) many of the managers interviewed mentioned that the
difficulty of attracting talented people is due to the industry’s “notoriously poor wages,
long working hours and seasonality”. The managers also reported troubles in retaining
the employees. The managers also reported of top managements failures to understand
the value of investing in people because of their emphasis on the bottom-line and that
the top management is undervaluing the staff by merely treating them as a short term
cost (Enz, 2001). Many of the respondents also stated that the industry has not made a
very good case on why talented and motivated individuals should enter or stay in the
hospitality industry. The managers were also expressing concern of the career paths
and training that the industry and operators have to offer (Enz, 2001; Enz, 2009).
The hospitality industry is highly competitive with customers demanding even more
high- class service quality (Enz, 2004). The author also states that keeping the
customers happy and loyal is highly dependent on the service quality. Several studies
have shown that if employees perceive the company’s human resources policies as
19
positive, customers perceive the quality of service more positively, which subsequently
leads to increased profitability (Enz, 2004). Hence, she continues that the unwillingness
or the failure to understand the importance of positive and functional human resources
policies leads to lower customer satisfaction and lowered profitability. Moreover, even
though the hospitality industry faces a lot of pressure to keep the costs as low as
possible, minimizing the labour costs results in an unmotivated, disloyal and unsatisfied
employees that will leave for a better paying job as soon as they can (Enz, 2004).
Although some companies are working hard to develop innovative human resources
strategies (Enz, 2001), still an overwhelming majority of the studies done show that
there is very little overall evidence the industry would be implementing progressive,
high-performance and high-involvement human resources strategies (Kusluvan et al.
2010). Kusluvan et al. (2010) continue stating that because of the latter the hospitality
industry has a bad reputation when it comes to human resource practices that manage
people in an old fashioned and exploitative way.
Some international hospitality firms such as Starbucks, Four Seasons and Marriot
International are listed in “100 best companies to work for list” in various business
magazines. There are companies that truly pay a lot of attention on how they treat their
employees (Kusluvan et al. 2012). Nevertheless, “a fundamental paradox of the
industry is that the people directly interacting with customers on a regular basis are the
ones being paid the least” (Magd, 2003 in Solnet & Hood, 2008). Thus, as a summary,
the industry is struggling to attract and retain a talented work force and acknowledges
that problems that the industry has with its image. The industry also acknowledges that
the working conditions might not be helpful in this endeavor. Still the majority of the
industry does not seem to do much about it. The future might look gloomy because
inevitably, the older generations will retire and the hospitality industry will need
Generation Y to fill the already existing shortage of labour force.
But how attractive is the hospitality industry for the new generation? Surely, if the
industry is suffering from ever increasing labour shortage and vast problems in
attracting and retaining, they should pay attention to the needs and values of the
20
Generation Y. Do they? It appears that the current working conditions in the
hospitality industry will not be able to provide the kind of a working environment
necessary to attract, inspire and to motivate the Generation Y (Solnet & Hood, 2008).
21
4 Perceptions of the Generation Y hospitality students
Previous chapters have discussed what the next generation of hospitality professionals
are like and what they want from their future careers and employers. Chapters have
also discussed the fact that year after year the hospitality industry ranks attracting and
retaining skilled labour force as the number one concern. In order to get a holistic
picture of the equation, in this chapter the author will discuss some of the previous
research done on the attitudes that the Generation Y hospitality management students
have towards a career in the hospitality industry.
Attitude can be defined as “an individual’s disposition to react with a certain degree of
favourableness or unfavourableness to an object, behaviour, person, institution or
event or to any other discernible aspect of the individual’s world” (Ajzen 1993, pp, 41
in Kusluvan & Kusluvan 2000). The understanding of attitudes is important because it
helps predicting and explaining behaviour (Kusluvan & Kusluvan 2000). The
relationship between attitudes and behaviour is then again not absolute, and attitudes
cannot predict behaviour in every situation because of the existing moderating
variables (Kusluvan & Kusluvan 2000). Nonetheless studying the attitudes of the
current hospitality management students can give us a good outlook of the general
popularity of the hospitality industry as a career choice and of the challenges that the
industry faces.
4.1 Generation Y hospitality management students perceptions and attitudes
towards the hospitality industry
In his 2008 research on the attitudes of the Australian hospitality students, Richardson
found that even though most respondents found work in the hospitality industry
interesting and that there are new things to learn each day, the majority of the
respondents found working in the hospitality industry stressful. Kusluvan and
Kusluvan (2000) reached very similar results in their research conducted in Turkey, but
22
also that even though the vast majority thinks that hospitality jobs are worth doing, the
job is exhausting. In addition they found that the students saw working hours to be too
long, family-life to be negatively affected by the nature of the work and that it is very
difficult to find a stable job because of the seasonal nature of the industry (Kusluvan &
Kusluvan 2000). Jiang and Tribe (2009) found in their study conducted among Chinese
students that hospitality jobs are considered as short lived professions which are best
suitable for young people pursuing another career options at a later point. In their
study, almost none of the respondents wanted their hospitality or tourism career to
become a permanent profession (Jiang and Tribe 2009).
Kusluvan and Kusluvan (2000) found also, that the majority of students stated that
they can use their skills and abilities in their work and enjoy seeing happy customers,
which is also congruent with Richardson’s (2008) research. Then again what is really a
noticeable point in both studies is that, the majority of respondents said that they felt
as a slave working in the industry (Kusluvan & Kusluvan 2000; Richardson 2008).
The issues of inadequate pay and the reward versus the effort was seen very negatively
by the students (Barron, Maxwell, Broadbridge & Odgen 2007; Jiang & Tribe 2009;
Kusluvan & Kusluvan 2000; Richardson 2008). In fact in Kusluvan’s and Kusluvan’s
(2000) research over 90% of the respondents said that the pay was too low for most
jobs and a staggering 78% said that the pay was too low to maintain a satisfactory
standard of living.
Another strong theme from these investigations (Barron, Maxwell, Broadbridge &
Odgen 2007; Jiang & Tribe 2009; Kusluvan & Kusluvan 2000; Richardson 2008) was
the students perceived poor treatment by the management and supervisory staff.
Autocratic, dictating management style, lack of appreciation, unfair treatment, poor
communication and lack of effort towards the job satisfaction of the employees were
common issues mentioned (Barron, Maxwell, Broadbridge & Odgen 2007; Jiang &
Tribe 2009; Kusluvan & Kusluvan 2000; Richardson 2008).
23
In Kusluvan and Kusluvan’s (2000) study over half of the students indicated that the
negative aspects of working in the industry outweigh the advantages, and over 40% are
unhappy to have chosen the hospitality industry as a career.
Perhaps though, the most worrying finding in these studies is, that new students in
general have positive views of the industry, where as more experienced students with
work experience generally have a negative view (Kusluvan & Kusluvan 2000; Barron et
al. 2007). In Richardson’s (2008) study 45.2% of the students claimed that work
experience in the industry left them with a negative view. Domote and Vaden (1987)
stated that work experience has the greatest influence on career decision of a potential
hospitality employee (in Richardson 2008). Also, interestingly, Kusluvan and Kusluvan
(2000) found that more than half of the students have chosen to study the industry
without sufficient information of the working conditions, characteristics and without
realistic knowledge of the career opportunities. Thus Kusluvan and Kusluvan (2000)
state:
If students were informed realistically and sufficiently about careers and working
conditions in the tourism industry they would form more realistic and lower
expectations with regard to jobs in the tourism industry. As a result they would be less
disappointed when they choose to study tourism and work in the tourism industry
which might prevent industry attrition.
Hospitality management students perceptions are alarmingly understudied in Finland.
Only very few researches come close to the subject of this thesis. Päivärinta (2011)
conducted a thesis research for Vaasa University of Applied Sciences on the topic How
the Hospitality Management degree in Vaasa University of Applied Sciences
corresponds to working life. In her thesis she shortly also studied the students
opinnions concerning mandatory practical training. She found that overall practical
training was found to be useful and as an important part of the studies (Päivärinta
2011, 43). Some students although were criticizing, that the companies use students as
free labor and are not committed to teaching the students according to the purpose of
the internship (Päivärinta 2011, 43). The interesting finding of Päivärinta’s (2011, 45)
thesis is that “even though the respondents themselves had a good image of the field in
24
general and felt secure about finding work also in the future, the overall respect of
tourism and hospitality business was estimated to be low.”
4.2 Pursuing a career in the hospitality industry- Yes, No, Maybe
So, we know what Generation Y students are like and what they want and we have an
idea of what kind of perceptions and attitudes they have towards the hospitality
industry. We also know that the industry has problems with attracting enough skillful
staff, so in theory these students are the ones that should fill the labour shortage, but
are they going to?
Richardson (2008) found in his research of the Australian hospitality and tourism
students attitudes, that of those with work experience within the hospitality industry
43.6% stated that they would definitely not or were unlikely to pursue a career in the
hospitality industry. Of these students, 96,3% stated work experience as the main
reason (Richardson 2008). Of the respondents with work experience, only 17,7%
stated that they will definitely pursue a career in hospitality after graduation
(Richardson 2008). Of all the respondents, both with and without work experience
33,7% claim, that they will not work in the hospitality industry (Richardson 2008).
Kusluvan and Kusluvan (2000) found very similar results, and came to the conclusion
that within the students surveyed, there was not a strong sense of commitment to the
industry.
Jenkins (2001) conducted a similar study in the Netherlands and in England and found
that from the students surveyed in the Netherlands only 36,25%, and 43,10% of the
students surveyed in England stated that they will definitely seek a job in the hospitality
industry. Jenkins (2001) also found that within the English students, 71% of the first –
year students stated that they will definitely seek a job in the industry, the same number
within the second-year students was 45% and only 13% of the fourth-year students.
25
These findings are in line with in the findings of Richardson (2008) and Barron (2008)
which suggest that the exposure to the work experience has a negative impact on the
students willingness to pursue a career in the hospitality industry. In contradiction to
the latter, Chuang and Dellmann-Jenkins (2010) found in their research conducted in
the United States, that the students currently working in the industry showed more
willingness to pursue a career in the industry than their peers currently not employed.
To conclude, a significant proportion of the students are not showing willingness to
pursue a career in the industry, which has implications to the already existing shortage
of skilful labour and problems of attracting and retaining employees. Also, the studies
seem to indicate that work experience has a negative impact on pursuing a career in the
hospitality industry. Not to say, that education would ever go to waste, but if for
example 40% of the students change the industry or start a completely different
education, one can say, that it has a price, for these students, their parents, educational
institutions and for the hospitality industry.
26
4.3 Summary of Generation Y members charactaristics, perceptions of the
Hospitality industry and aspects that they want in organizations
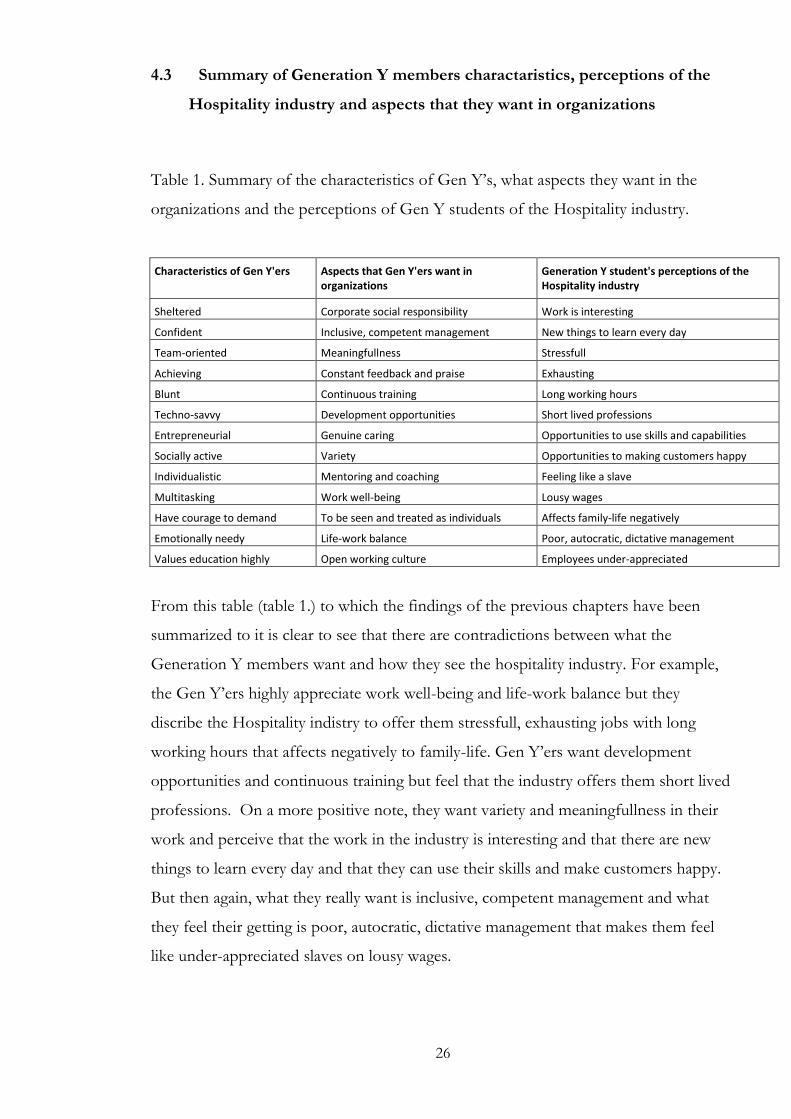
Table 1. Summary of the characteristics of Gen Y’s, what aspects they want in the
organizations and the perceptions of Gen Y students of the Hospitality industry.
Characteristics of Gen Y'ers Aspects that Gen Y'ers want in Generation Y student's perceptions of the
organizations Hospitality industry
Sheltered Corporate social responsibility Work is interesting
Confident Inclusive, competent management New things to learn every day
Team-oriented Meaningfullness Stressfull
Achieving Constant feedback and praise Exhausting
Blunt Continuous training Long working hours
Techno-savvy Development opportunities Short lived professions
Entrepreneurial Genuine caring Opportunities to use skills and capabilities
Socially active Variety Opportunities to making customers happy
Individualistic Mentoring and coaching Feeling like a slave
Multitasking Work well-being Lousy wages
Have courage to demand To be seen and treated as individuals Affects family-life negatively
Emotionally needy Life-work balance Poor, autocratic, dictative management
Values education highly Open working culture Employees under-appreciated
From this table (table 1.) to which the findings of the previous chapters have been
summarized to it is clear to see that there are contradictions between what the
Generation Y members want and how they see the hospitality industry. For example,
the Gen Y’ers highly appreciate work well-being and life-work balance but they
discribe the Hospitality indistry to offer them stressfull, exhausting jobs with long
working hours that affects negatively to family-life. Gen Y’ers want development
opportunities and continuous training but feel that the industry offers them short lived
professions. On a more positive note, they want variety and meaningfullness in their
work and perceive that the work in the industry is interesting and that there are new
things to learn every day and that they can use their skills and make customers happy.
But then again, what they really want is inclusive, competent management and what
they feel their getting is poor, autocratic, dictative management that makes them feel
like under-appreciated slaves on lousy wages.
27
How can the problems discussed in the previous chapters be solved? As the problems
are vastly complex, the answers are not simple either. It would be naive to suggest that
one theory might solve all the problems of the industry. In the effort at least a little bit
to relieve the problem, the next chapter will introduce Robert Eisenbergers (1986)
theory of POS, and the author will examine whether it could offer some answers to the
problems.

28
5 Perceived organizational support
Organizational support theory holds that employees personify the organization,
thinking of it as a powerful individual with a benevolent or malevolent orientation
toward them. To meet socioemotional needs (e.g. approval, esteem, affiliation,
emotional support) and assess the value of greater efforts on the organization’s behalf,
employees form a general perception concerning the degree to which the organization
values their contributions and cares about their well-being. (Eisenberger & Stinghamber
2011, 240)
In other words, employees form a general belief based on their experiences whether
the organization cares about them and appreciates them, thus they either develop high,
medium or low POS.
Because of the norm of reciprocity, POS increases the employees felt oblication to
help the organization to reach its goals (Eisenberger & Stinghamber 2011, 240), in
other words employees strive to pay back the high level of support by the organization
by increasing their own efforts (Aselange & Eisenberger 2003). Thus, employees with
high POS are more motivated, affective and more positively oriented toward the
organization (Eisenberger & Stinghamber 2011, 59).
The concept of POS was introduced by Eisenberger, Huntington, Hutchison and Sowa
in the article “Perceived organizational support” in 1986 (Eisenberger & Stinghamber
2011, 5). By the year 2002 Rhoades and Eisenberger found over 70 studies conducted
about POS for their review of the literature. In 2011 Eisenberger and Stinghamber
released a book Perceived organizational support; Fostering enthusiastic and productive employees,
where they present and summarize the findings of their 25 years of studies relating the
theory of POS. This book will be largely used as a source, for the reason, that it can be
seen as highly reliable source. In the following chapter, the key processes that
contribute to POS are discussed.

29
5.1 Psychological processes and factors influensing POS
5.1.1 Personification of the organization
“Employees tend to view their treatment by the organization not as the result of
organizational agents acting simply as individuals with their own motives but as
strongly influenced by the values and goals perpetuated by upper managers and
enacted by their supervisors.” (Eisenberger & Stinghamber 2011, 41) According to
Eisenberger and Stinghamber (2011, 41) employees in every level of organizational
hierarchy tend to experience the organization as a unitary force and view the
organization as possessing a personality. Through their everyday understanding of
personality employees try to understand why is the organization acting as it is by
ascribing traits and motives of the organization (Eisenberger & Stinhamber 2011, 41).
Employees are especially aware that the directive, evaluative and coaching tasks of e.g.
supervisor are carried out on behalf of the organization (Eisenberger, Karagonlar,
Neves, Becker, Gonzales-Morales, Stinghamber 2010) and thus are seen as acts of the
organization rather than acts by an individual.
Coyle-Shapiro and Shore (2007) make the argument that also cultural values play a role
in how strongly the employee experiences the organization as a unitary force
possessing a personality. They argue that in cultures that are more paternalistic, and
thus stress the importance of authorities protecting and supporting others in their care
the personification effect is stronger (Coyle-Shapiro & Shore 2007).
Because the employees personify the organization, they view their unfavorable or
favorable treatment as an indication that the organization disfavors or favors them as
an individual (Eisenberger & Stinghamber 2011, 42), as for example forming a
perception that the organization does not care about them. The view that the
organization favors the employee helps to fulfill socioemotional needs such as
approval, esteem and affiliation, and thus by the norm of reciprocity increases the
30
employees efforts to fullfill the needs of the organization (Eisenberger & Stinghamber
2011, 24).
5.1.2 Organizational discretion
According to Eisenberger & Stinghamber the favorable treatment from the
organization increases the employees perception of being supported, however the
context of the favorable treatment plays an important role (2011, 43). If the favorable
treatment is a result of for example government legistlation or union negotiations, the
favorable treatment will not positively affect POS (Eisenberger & Stinghamber 2011,
43). Gouldner (1960 in Eisenberger & Stinghamber 2011, 43) argued that the favorable
treatment received from others has a positive effect only if the treatment indicates a
genuine concern for the receiver. To simplify the concept one might say that if an
organization decided to give all the employees a payrise in result of good performance
that would have a positive impact on POS, but if the same payrise would be a result of
a bloody battle with the union, the impact on POS would be negative. Therefore,
highly discretiatory actions with positive causations on the employee, taken by the
employer, result in stronger psycological contract and felt obligation (Eisenberger,
Cummings, Armeli & Lynch 1997). Shore and Shore (1995) argue that managers and
supervisors can strengthen the employees perception that the organization is commited
to the employee by using descriatory actions, however small they are (in Eisenberger et
al. 1997). For example, Allen, Shore and Griffeth (2003), found a strong positive
relationship with supportive human resource practices and high POS.
The belief of the organization’s discretion matters also strongly in the case of
unfavorable treatment of employees (Eisenberger & Stinghamber 2011, 46). In for
example cases of pay reductions, if the employees believe that the organization is
forced to make a decision negative to the employees, but still making an effort to
employ as much as the organization is able to, the negative influence on POS is muted
(Eisenberger & Stinghamber 2011, 46).
31
5.1.3 Organization sincerity
According to Eisenberger and Stinghamber (2011, 47) expressions of positive regard
such as praise, concern and caring and approval of good work have also a positive
effect on POS, but only if the are sincere and have positive consequences. “ People
evaluate the kindness of an action not only by its consequenses, but also by its
underlying intention” (Falk & Fischbacher 2006). Eisenberger and Stinghamber (2011,
48) argue that the employees value expressions of positive regard to the extention to
which they think it is the genuine opinion of the representative of the organization and
not only a matter of politeness. For example, if a supervisor says “good job” to
everyone regardless of their performance, if a supervisor says “great idea” to an
employees suggestion but does not do anything to implement the idea, if a supervisor
is understanding and expresses sympathy towards an employee in a difficult situation
but does nothing to correct the situation or if the supervisor masks feedback on poor
performance by compliments to avoid discomfort, these actions have no positive
influence on how much the employees perceive that the organization cares about them
or values them (Eisenberger & Stinghamber 2011, 48-49). Also, if the organization is
communicating how they value their staff, but pay them minimum wages and allow
lousy working conditions, the employees form a general belief that the organization is
insincere (Eisenberger & Stinghamber 2011, 49).
5.1.4 Organizational embodiment
Eisenberger, Karagonlar, Neves, Becker, Gonzales-Morales and Stinghamber (2010)
suggest that employees form a perception concerning the amount of the supervisor’s
shared identity with the organization. This then determines the level of which the su-
pervisor is seen as organizational embodiment (Eisenberger, Karagonlar, Neves, Beck-
er, Gonzales-Morales and Stinghamber 2010). Supervisors that are strongly identified
with the organization and are seen to posses influencing power have stronger influence
on POS than supervisors that are seen not having a strong influencing power over the
32
employees (Eisenberger & Stinghamber 2011, 53-53). Eisenberger and Stinghamber
(2011, 53) also argue that because of the importance of the organizations favorable or
unfavorable treatment on the employees future, employees strive to understand to
which extend the treatment of the supervisor represents the orientation of the
organization and to which extend it represents primarily the supervisors own values
and motives. According to the organizational support theory, Eisenberger and
Stinghamber (2011, 53) state that organizational CEOs and high-level managers are
considered to embodi the organization strongly because of their power and influence
over the organizations values, culture and policies.
5.1.5 Felt oblication and expected reward for high effort
High POS acts as an evidence and insurance for the employees that the organization
can be expected also in the future to reward the employees efforts and to provide aid
when needed (Aselange & Eisenberger 2003). Eisenberger et al. `s theory (1986)
assumes that based on the norm of reciprocity that the employees perceived
organizational suport results in felt obligation to aid the organization to reach its goals.
Gouldner (1960 in Aselange & Eisenberger 2003) describes the norm of reciprocity as
follows: “The norm of reciprocity, obligating the reciprocation of favorable treatment,
serves as a starting mechanism for interpersonal relationship: aid can be provided to
another individual with the expectation that it will be paid back with resources desired
by the donor”. The exchange relationship is strengthened over time to the extend of
how both parties possess and are willing to supply the desired resources over time
(Aselange & Eisenberger 2003). This is in line with Adams’s Equity theory which states
that “Individuals compare their job inputs and outcomes with those of others and then
respond to eliminate any inequities.” (Robbins 2003, 171). Eisenberger, Fasolo and
Davis-LaMastro (1990) argue that POS has a positive relationship performance reward
expectation, and that employees with high POS expect to be rewarded on their high
performance and thus because of the norm of reciprocity increase their effort towards
meeting the organizations needs. Thus POS acts as an insurance that the investments
of the employee are reciprocated by the organization (Eisenberger & Stinghamber
33
2011, 57). Nevertheless, Coyle-Shapiro and Shore (2007) have raised some questions
about the following point. If the positive actions of the employee are not being
detected by the organization, because of situational factors such as working alone, are
there truly chanses for the norm of reciprocity to fully function (Coyle-Shapiro 2007).
5.1.6 Socioemotional need fulfillment
As the support from friends and family fulfill socioemotional needs outside work, POS
might meet the important socioemotional needs such as the need for approval and
need for esteem (praise and recognition), caring (consolence and sympathy in distress)
and affiliation (affection) in the workplace (Cobb 1976; Cohen & Wills 1985 in
Eisenberger & Stinghamber 2011, 57). The organization can reinforce POS and fulfill
the latter socioemotional needs by taking pride of the employees accomplishments,
wellcoming new members into the organization, supporting the employees under
distress and by showing appreciation when the employee is acting according to the
established norms and procedures (Eisenberger & Stinghamber 2011, 58). Eisenberger
and Stinghamber also state that by fulfilling socioemotional needs and increasing POS
the employee responds with affective commitment to the organization.
5.1.7 Anticipated help
Employees with high POS anticipate that because of the organizations appreciation
towards them, it is in the organizations best interest to provide help and assistment
specially during the times that the employee is experiencing a highly stressfull situation
(Eisenberger & Stinghamber 2011, 58-59). Walters and Raybould (2007) found
evidence that employees with high POS have less symptomps of burnout, were less
exhausted and less cynical.
34
5.2 Behavioral outcomes of perceived organizational support- why caring is
good for business
So how is all this caring and supporting relevant to the problems of the hospitality
industry we discussed previously? The answer lies in the behavioral outcomes of the
POS. If we keep in mind that the industry is suffering from high staff turnover, failure
to attract and retain staff. Also, we know that a significant proportion of the students
that do not wish to pursue a career in the industry, named work experiences as the
main reason and that it seems that the exposure to the working life in the hospitality
industry has a strong negative impact on the image of the industry, we might see that
caring and supporting could be very good for business.
Also, we know that the hospitality industry has to be able to attract Generation Y
employees to fill the gap that the retiring Baby Boomers leave. In order to do so, the
industry has to be able to offer Generation Y employees jobs that are more in line with
their expectations and values. If they do not, someone else sure will. If we keep in
mind that according to Terjesen, Vinnicombe and Freeman (2007) the Generation Y
members two highest ranked organizational attributes are that the organization invests
heavily in the training and development of their employees and that the organization
cares about their employees as individuals. Does that not sound a lot like POS?
In this chapter the author will discuss in detail the behavioral outcomes that are proven
to result from POS.
5.2.1 Job performance
“Results of numerous studies suggest that, overall, employees who feel supported by
their organization work harder at their jobs and perform better than those with low
perceived organizational support” (Eisenberger & Stinghamber 2011, 191). Eisen-
berger, Fasolo and Davis-LaMastro (1990) found evidence of a highly consistent posi-
35
tive relationship of job performance and employee attendance with POS. According to
Eisenberger and Stinghamber (2011) POS has a positive relationship to both in-role
performance, the tasks that the employee is expected to carry out as a standard part of
their job, and extra-role performance, which goes above and beyond what is expected
of the employee. Chow, Lo, Sha and Hong (2006) argued that the staff performance is
mostly a result of organizational support that enables the employees to give excellent
service that then leads to a sense of pride the employees take from their work. In this
research, that was studying hospitality industry, Chow et al. (2006) found that POS has
a significant effect on both pride in job and customer orientation.
5.2.2 Withdrawal behaviour
Withdrawal behaviour refers to the voluntary declining of the employees’ active partic-
ipation in the organization (Eisenberger & Stinghamber 2011, 194). Several researches
have shown that POS has a negative relationship with such withdrawal behaviours as
voluntary intention to leave (turnover intention), voluntary turnover, absenteeism and
tardiness (Eisenberger & Stinghamber 2011, 194; Eisenberger, Fasolo & Davis-
LaMastro 1990; Rhoades & Eisenberger 2002; Allen, Shore & Griffeth 2003). Allen,
Shore and Griffeth (2003) found evidence that supportive HR functions created POS
which thus in turn lead to decreased voluntary turnover. These findings are similar to
Eisenberger`s et al. (1990) findings that supposed that by the norm of reciprocity, the
employees with high POS are reciprocating the organizations support by being more
committed and less likely to seek out and accept jobs in alternative organizations. Ei-
senberger et al. (1990) also found that the employees with low POS had twice as much
absenteeism periods then the employees with high POS.
36
5.2.3 Reduced workplace deviance
Colbert, Mount, Harter, Witt and Barrick suggested (2004 in Eisenberger & Stingham-
ber 2011, 198) that POS, followed by the felt obligation to pay back the support and
caring of the organization would make the employees’ deviant and counterproductive
behaviour that goes against the organizations norms less likely. On the contrary, the
frustration that employees with low POS may feel because of the lack of caring and
support are more likely to engage in negative workplace behaviour (Eisenberger &
Stinghamber 2011, 198).
5.2.4 Creativity and Innovation
According to Mumford and Gustafson (1988 in Eisenberger & Stinghamber 2011,
199): “creative performance refers to behaviour that is novel and has high quality or
utility” as according to Scott & Bruce (1994 in Eisenberger & Stinghamber 2011, 199)
“innovation usually carries the additional implication that the creative idea has been
transformed into a useful product”. Eisenberger and Stinghamber (2011, 199) state
that employees that have high POS are more likely to make improvement suggestions
with the aim of helping the organization, because of their greater intrinsic interest in
their jobs, felt obligation and because their expectation of rewards of high effort.
5.2.5 Safety related behaviour
According to Eisenberger and Stinghamber (2011, 202) perceived organization support
appears to increase favourable behaviour and attitudes towards safety within the em-
ployees in the workplace, because of the felt obligation and the increased effort that
the employee might perform towards aiding the organization to help succeeding. If the
organizations actions towards the safety in the workplace are viewed by the employees
37
as voluntary, the actions might have a positive impact on POS, thus resulting in posi-
tive voluntary behaviour of the employees such as reporting the possible risks and
making suggestions on how the organization could improve the safety (Eisenberger &
Stinghamber, 2011, 201).
5.2.6 Acceptance of information technology
Eisenberger and Stinghamber (2011, 205) have stated that employees with high POS
are more acceptant towards the introducing of new technology, because they might
feel more supported in their learning process, better trained and feel more secure to get
the aid they need.
5.2.7 Customer service
Even though all the behavioural outcomes of POS presented above can be very bene-
ficial to the hospitality organizations, maybe this one has the most financial significance
to the organizations. Masterson (2001 in Eisenberger and Stinghamber 2011, 206)
found in his study evidence that the service employees that feel supported and cared
for (high POS) also reflect the same positive treatment to the customers by providing
better customer service, thus the employees with high POS were rated by the custom-
ers in the study conducted by Bell and Menguc (2002 in Eisenberger & Stinghamber
2011, 206) to be more attentive, courteous and concerned about the customers’ best
interest. Thus Eisenberger and Stinghamber (2011, 207) suggest that employees with
high POS reciprocate the positive treatment to the organization as good customer ser-
vice because of the felt obligation to help the organization but also because they feel
that the extra effort will be noticed and rewarded.
38
So as we can see from the positive behavioural outcomes of employees that feel sup-
ported and cared for, and we remember the current problems the hospitality organiza-
tions have with retention, attracting and motivating the employees. We can at least as-
sume that by trying to increase the employees POS, some of the problems could be
lessened. Caring is good for business.
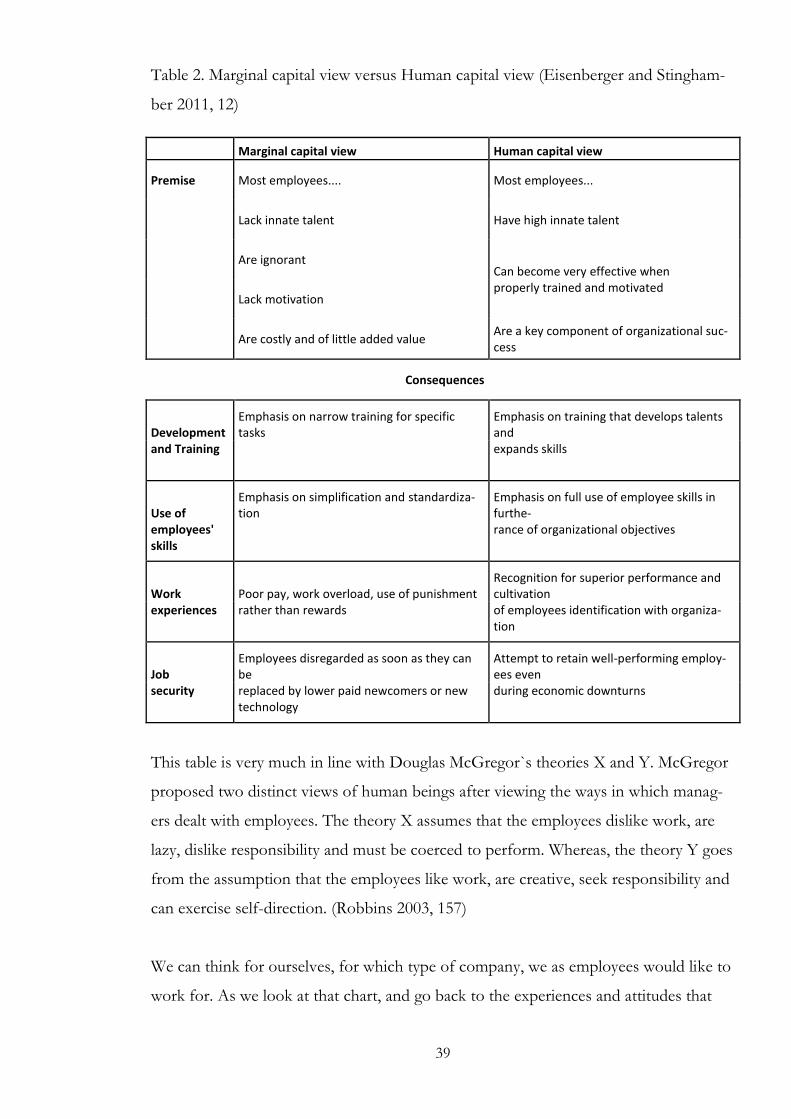
5.3 Are the employees merely a cost or the organizations biggest asset
Eisenberger and Stinghamber (2011, 10-12) present two opposite views that and or-
ganization can have towards their employees and these views, originating from the
company culture and way the top management sees the employees determine whether
to organization is supportive towards their employees and whether the employees have
high or low POS.
Marginal capital view characterises the employees as a commodity like good that has low
value, are easily replaceable and lack innate talent, when as in Human capital view the
employees sees the employees as assets to the organization and with the investment of
time and money will develop superior talent to help the organization to achieve its
goals (Eisenberger & Stinghamber 2011, 10-11). Obviously, based on the definitions,
Marginal capital view will not result in high POS when as Human capital view probably
will. In the following chart by Eisenberger and Stinghamber (2011, 12) one can see the
difference in these two views.
39
Table 2. Marginal capital view versus Human capital view (Eisenberger and Stingham-
ber 2011, 12)
Marginal capital view Human capital view
Premise Most employees.... Most employees...
Lack innate talent Have high innate talent
Are ignorant Can become very effective when
Lack motivation properly trained and motivated
Are costly and of little added value Are a key component of organizational suc-cess
Consequences
Development Emphasis on narrow training for specific tasks
Emphasis on training that develops talents and
and Training
expands skills
Use of Emphasis on simplification and standardiza-tion
Emphasis on full use of employee skills in furthe-
employees' skills
rance of organizational objectives
Work Poor pay, work overload, use of punishment Recognition for superior performance and cultivation
experiences rather than rewards of employees identification with organiza-tion
Job Employees disregarded as soon as they can be
Attempt to retain well-performing employ-ees even
security replaced by lower paid newcomers or new technology
during economic downturns
This table is very much in line with Douglas McGregor`s theories X and Y. McGregor
proposed two distinct views of human beings after viewing the ways in which manag-
ers dealt with employees. The theory X assumes that the employees dislike work, are
lazy, dislike responsibility and must be coerced to perform. Whereas, the theory Y goes
from the assumption that the employees like work, are creative, seek responsibility and
can exercise self-direction. (Robbins 2003, 157)
We can think for ourselves, for which type of company, we as employees would like to
work for. As we look at that chart, and go back to the experiences and attitudes that
40
the hospitality management students had regarding their employment in the hospitality
industry. They were such as the dissatisfaction caused by poor management, work
overload, low pay and feeling like a slave. There is a reason to assume, that in those
cases, and in most hospitality organizations (if I dare to say it), the marginal capital
view might still be alive and well, and that the employees are seen according to
McGregor’s theory X. Nonetheless, if we look at the Human capital view characteris-
tics, we can draw easily the assumption that the Generation Y members would thrive
in an organization that has understood the value of its human capital.
5.4 Why caring is good for business
For some, at first it sounds calculating that organizations should aim to maximize the
employees felt obligation towards the organization, but if we take a closer look we real-
ize that POS is about simple concepts that make sense. After all, it is also that employ-
ees are trying to increase the felt obligation of the organization by delivering good re-
sults, are they not?
Firstly, it is common sense, that employees form a general belief whether the organiza-
tion cares about them or not and they personify the organization. So if the employees
form a general belief of an organization can hospitality management students form a
general belief of the whole hospitality industry based on their working experiences?
Secondly, it is realism that employees that are cared for and feel good in their work
place tend to give better customer service. As stated already before, front line employ-
ees that interact with the customers have the most impact on customer satisfaction and
whether the customer decides to come back or not. Is that not the most profitable way
to do business in the hospitality industry that you have happy customers that keep
coming back? So why are the front line employees often the ones paid the least,
stressed and working long hours?
41
Thirdly, Corporate Sustainable Responsibility is increasing its importance and more
and more companies are talking about it, the people part of it seems to be left in the
shadow of environmental factors. Based on the previous researches and on my own
experience, a well taken cared for staff is a competitive advantage. This applies not on-
ly, when it comes to attracting the best workforce, but also attracting sustainability
conscious customers.
42
6 Research methodology
The aim of the research is to study the relationship between POS and the willingness
to pursue a career in the hospitality industry.
The design of the survey was based on the Survey of POS created by Robert Eisen-
berger et al. in 1986. The survey was tested by using fellow students as a focus group.
The collecting of the answers was conducted during November and December of 2011
by the author. The author personally went to the third year students classes and dis-
tributed the questionnaire and collected the answers. Following the collection of the
answers, the questionnaires were coded into a Microsoft Excel sheet for further analy-
sis. The data was organized and analyzed by using average calculations and cross tabu-
lations.
The nature of the research is positivist and the aim of the research is, as in positivist
research in general, to collect facts and to study the relationship of one set of facts to
another (Anderson 2004, 13). As Anderson (2004, 13) states in positivist research
quantitative data is collected and by using statistically valid techniques, quantifiable and
if possible generalizable conclusions are being produced. However, since the subject of
the study can be considered to be conceptually extensive and because POS has not
been studied in this context before the research approach must be seen also as explora-
tory in nature.
In the following chapter the subjects of the study and research instrument as well as
the questionnaire design, limitations and the data analysis will be discussed.
6.1 Subjects of the study and data collection
The subject population of the study is the third year Bachelor of Hospitality Manage-
ment students of Haaga-Helia University of Applied Sciences. The students chosen as
the subjects of the study are studying in Haaga campus located in Helsinki Finland.
43
Haaga-Helia UAS has a long an impressive history of educating Hospitality Manage-
ment professionals. Currently Haaga campus provides well recognized Hospitality
Management degree programs in two languages, Finnish and English.
The third year students were chosen as a sample because they have already enough
experience of the industry to form an opinion concerning POS. They are also reaching
the end of their studies and soon have to make their decision of whether to continue in
the hospitality industry or not. Both, the English-speaking students and the Finnish-
speaking students were included in the study.
All classes of finish-speaking day students of Bachelor of Hospitality Management
were surveyed as well as the day- and evening classes that are conducted in English. At
the time of the empirical research these classes have altogether 114 students that are
currently enrolled for courses.
All of the students were not present at the time of collecting the answers. Few ques-
tionnaires were filled incompletely or did not otherwise meet the requirements and
thus were eliminated from the study. The respondents eliminated were not members of
Generation Y or were studying in another degree program such as Experience and
Wellness Management. The response rate was 100% as none of the students declined
to fill the questionnaire. The final number of usable questionnaires was 77 (n=77). All
together that adds up to coverage of 67.5% of the enrolled students.
The data was collected during November and December of 2011. The method of
gathering the data was the author personally administering the collection of the an-
swers. The respondents were explained the purpose of the study briefly and were given
the possibility to refuse to fill out the questionnaire. The respondents were also in-
structed to ask for help if they would not understand the questions or if they would
have any other questions. The respondents were not given a time limit to complete the
questionnaire. Chosen method of using paper questionnaire and personally collecting
the answers was selected since the author wanted to obtain as high percentage of cov-
ering the population as possible thus increasing the reliability of the study.
44
6.2 Research instrument
“A survey is a positivistic methodology whereby a sample of subjects is drawn from a
population and studied to make inferences about the population.” (Collins & Hussey
2003, 66) The survey designed for the purpose of this study represents an analytical sur-
vey, where the intention is to examine whether any relationships between variables can
be found (Collins & Hussey 2003, 66). This particular study examines the relationship
between POS and willingness to pursue a career in the hospitality industry by utilizing a
paper survey.
The questionnaire (see Appendix 1.) was designed in three parts by using three types of
variables; control-, independent and dependent variables. A variable is an attribute of
the entity chose as the unit of analysis. The most important characteristic of a variable
is that it can change and take more than one value (Collins & Hussay 2003, 152).
6.2.1 Control variables
The questionnaire includes 4 control variables. The purpose of the control variables is
to give information about the characteristics of the sample. In this study, the control
variables are also used to segment the sample into critical areas that might reflect clear
differences when it comes to POS.
Question 1 is exploring the gender of the respondent. Question 2 inquires the year of
birth, and is used to eliminate the answers of the respondents that do not belong to the
Generation Y. Question 3 examines whether the respondent is studying in Finnish or
English degree program. This variable offers the possibility to compare the possible dif-
ferences among these two degree programs. Question 4 is concerning the amount of
work experience in the hospitality industry. The purpose of the question is to compare
45
whether the amount of work experience influences the level of POS or the willingness
to pursue a career in the industry.
6.2.2 Independent variables
Second part of the questionnaire comprises of independent variables that measure the
level of POS. The role of the independent variables in this study is to gain specific in-
formation about the different dimensions of POS. This information will be examined
to gain more concrete clues about areas that are causing a negative effect in the will-
ingness to continue in the industry.
The origin of the eleven (11) statements concerning POS is the Survey of POS created
by Eisenberger et. al in 1986. The survey that consists of 36 statements in its original
form has been used successfully by researchers for over 20 years. “Subsequent explora-
tory and confirmatory factor analyses with employees from diverse occupations and
organizations provide evidence for the high internal reliability and unidimensionality of
Eisenberger et al.’s scale (survey of POS), both in its original, 36-item form and subse-
quent, shorter versions” (Rhoades & Eisenberger 2002). Also, “ because of the simplic-
ity of the concept of POS and the excellent way the scale items fit the construct, over
95% of studies on POS use the Survey of perceived organizational support” (Eisen-
berger & Stinghamber 2011, 28).
For the purpose of this study, 11 statements that measure different aspects of POS
were chosen. In order to avoid an agreement response bias, six of the statements were
positively worded and five of the statements were worded negatively. A 4-point Likert
scale was chosen to indicate the extent of agreement. The neutral option of neither
agreeing nor disagreeing was not used for the purpose of the statistical analysis which
uses mainly averages but also because in the opinion of the author, such statements are
rarely responded neutrally.
46
The theory of POS is a complex, multilevel entity. According to Eisenberger´s theory
multiple elements influence the level of POS. All of the independent variables are con-
cerning the psychological processes and factors influencing POS. In the following list
the processes and factors that the question is measuring will be defined.
Question 5 The hospitality organization/organizations that I have worked for have strongly con-
sidered my goals and values as an employee measures the level of socioemotional need ful-
fillment that is described in chapter 5.1.6.
Question 6 The hospitality organization/organizations that I have worked for have failed to appre-
ciate any extra effort from me investigated the factor of expected reward for high effort
discussed in the chapter 5.5.1.
Question 7 The hospitality organization/organizations that I have worked for would have ignored
any complaint from me explores the factor of organizational discretion (chapter 5.1.2).
Question 8 The hospitality organization/organizations that I have worked for have really cared
about my well-being provides information about the socioemotional need fulfillment
(chapter 5.1.6.).
Question 9 The hospitality organization/organizations that I have worked for have made me feel
that even if I would do the best job possible, the organization would fail to notice considers the fac-
tor of expected reward for high effort discussed in chapter 5.1.5.
Question 10 The hospitality organization/organizations that I have worked for have cared about
my general satisfaction at work aims at exploring the fulfillment of socioemotional needs
(chapter 5.1.6).
Question 11 The hospitality organization/organizations that I have worked for have shown very lit-
tle concern for me measures the factor of organizational sincerity (chapter 5.1.3.) and or-
ganizational discretion (chapter 5.1.2).
Question 12 The hospitality organization/organizations that I have worked for have taken pride of
my accomplishment at work is aiming at comprehending the level of organizational sinceri-
ty (chapter 5.1.3) and expected reward for high effort (5.1.5.)
Question 13 The hospitality organization/organizations that I have worked for have made me feel
that, if the organization could, it would take advantage of me concerns organizational discretion
discussed in the chapter 5.1.2.
Question 14 The hospitality organization/organizations that I have worked for have tried to make
my job as interesting as possible explores socioemotional need fulfillment (chapter 5.1.6)
and organizational discretion (chapter 5.1.2).
47
Question 15 The hospitality organization/organizations that I have worked for have made me feel
that if I have a problem, help is always available aims at measuring the level of anticipated
help discussed in the chapter 5.1.7.
6.2.3 Dependent variables
The question 16 is measuring the likeliness to pursue a career in the hospitality industry. The
question has five options for answering; two positive ones definitely and more than likely,
one unsure and two negative options unlikely and definitely not.
Question 17 that asks for the reason for the decision was chosen for testing potential con-
tradictions in responses.
6.3 Testing of the questionnaire
The questionnaire was tested by using the author’s fellow students as a focus group in
October 2011. After filling out the questionnaire, the respondents were asked to give
opinions and improvement suggestion of the questionnaire. A few smaller changes
were made with the purpose of creating a clear wording and to avoid misunderstanding
of the questions.
6.4 Limitations of the study
The sample size of 67, 5% of the students studying in the degree programs is relatively
high and can be seen to give reliable answers to the hypothesis. The results must be
viewed in context. First it has to be considered that the research is conducted only in
one school. Additionally, these students have very different opportunities to work and
to find internships because they live in the capital region of Finland. If a similar study
would be conducted in rural part of Finland, the same results would probably not be
48
reached because of the considerably smaller amount of hospitality establishments. Fi-
nally the conclusions cannot be generalized as such to concern other countries because
of the differences in the hospitality industries and dissimilarities in working culture.
The original aim was to study students from two or more countries. This would have
made it possible to compare results within schools and working cultures and would
have produced more generalisable results. Unfortunately, neither the author nor the
supporting teachers were able to get participation from other schools abroad, because
of for example the strict privacy laws.
Furthermore, the language of the survey was English. It has to be taken into considera-
tion that English is neither the native language of the author nor the majority of the
respondents. Even though the language used in the questionnaire was not complicated
and the questionnaire was tested to avoid any unclear wordings, there still remains the
possibility of misinterpreting questions.
6.5 Organizing the data
Each completed questionnaire was manually typed into a database for data analysis.
The respondents were numbered and every variable was provided a name. Some of the
independent variables measuring POS were positively worded and some were worded
negatively. Letters P or N were added in front of the abbreviation in order to indicate
that element. For instance, the variable named PSATCARE is collected through the
statement “The hospitality organization/organizations I have worked for have cared
about my general satisfaction at work”. For the complete list of abbreviations see at-
tachment 2.
The surveys used a 4-point Likert scale to measure the attitudes of the respondents.
The quantifiers were converted into numbers 1 to 4. For the negatively worded state-
ments the scale was reversed for the data analysis. With all statements, 1 indicates the
most positive possible response and 4 the most negative possible response. This was
49
done to enable the measuring of coherence as calculating the averages. In case of the
dependent variable and the control variables, the answering choices of each question
were given a numerical value.
6.6 Data analysis
Frequency distributions were calculated on the control variables to gain descriptive
information of the population. The purpose of the main data analysis is twofold, and
for the aim for clarity the analysis was divided into parts A and B. For both parts the
data analysis was prepared by using cross tabulations and average calculations. The data
will be displayed by using graphs and tables.
The study is exploratory and its purpose is to identify the main elements of POS hav-
ing an impact in the willingness to pursue a career in the hospitality industry. Cross
tabulations were chosen because they allow an easy way to extract specific indicators
and trends. For further research a more sophisticated usage of statistical methods
would bring a great contribution to understanding the impacts of POS in this specific
subject. However, given that this study is conceptually extensive, adding statistical
depth would move too much beyond the exploratory nature of this thesis.
In the following chapter, the aim of the parts A and B will be discussed.
6.6.1 Part A
Part A of the analysis aims at exploring and discovering patterns and trends in the
whole population. Furthermore, it explores whether there are differences when it
comes to the level of POS in specific segments such as gender or language of the pro-
gram.
50
For the population as a whole the averages of the 11 independent variables were calcu-
lated.
Likewise, for the following segments; Gender (male and female), Language of the de-
gree program (Finnish and English) and the Length of work experience the averages
were calculated in a similar matter.
For the question “Are you likely to pursue a career in the hospitality industry after
graduating?” the averages were calculated for the population as a whole, but also for
the specific segments.
For the statements conserning POS the scale was from 1-4 and in the average value of
0.25 was considered to be of significant difference. The variables with significant dif-
ferences will be highlighted in the results chapter. The interpretations of these differ-
ences will be described in the conclusions chapter using subjective insights.
6.6.2 Part B
The intention of part B is to search for the potential causality between the level of POS
and the willingness to pursue a career in the hospitality industry.
The population was classified into segments, depending into the intensity of willing-
ness to pursue a career in the hospitality industry. Since the scale was from 1 to 5, the
population was divided into 5 segments. For each 5 segments the average values of the
11 independent variables were calculated. This provides a very visual and intuitive as-
sessment of correlation between the willingness to pursue a career in the hospitality
industry and each of the variables measuring specific elements of POS.
With the analysis it is possible to identify the variables whose averages move strongly
into the same direction as the willingness to pursue a career as well as identify the vari-
ables that have either no movement or non-conclusive movement.
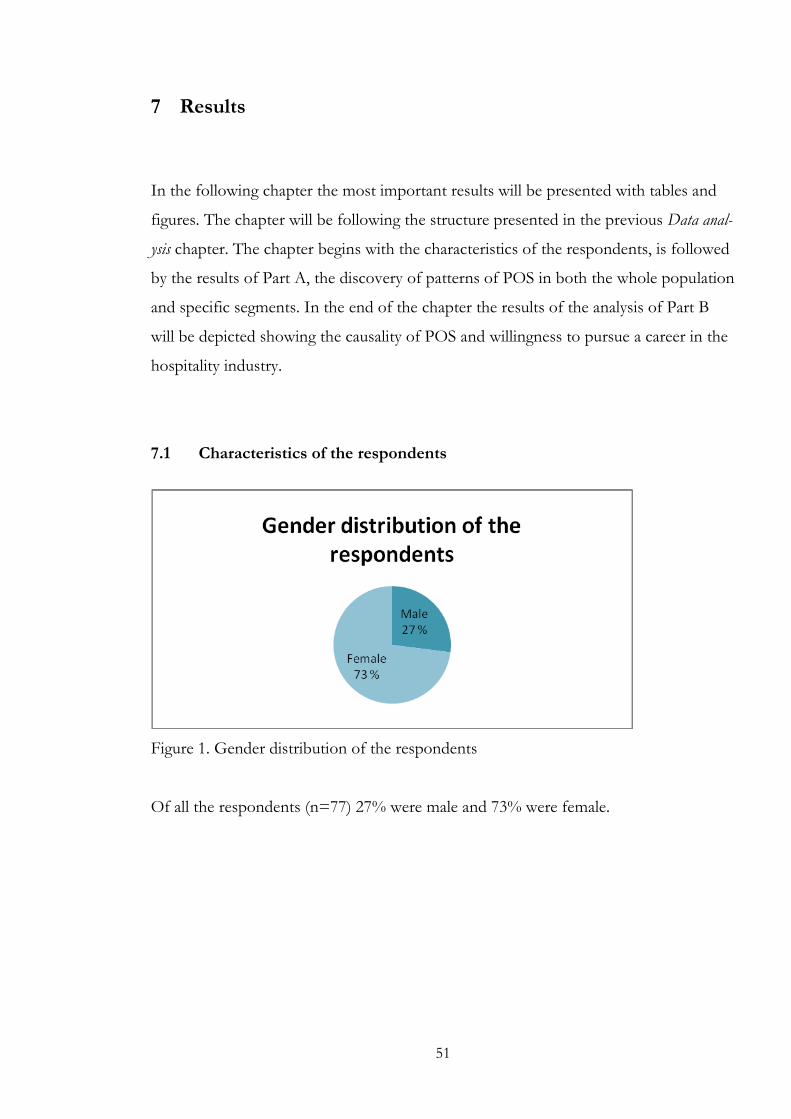
51
7 Results
In the following chapter the most important results will be presented with tables and
figures. The chapter will be following the structure presented in the previous Data anal-
ysis chapter. The chapter begins with the characteristics of the respondents, is followed
by the results of Part A, the discovery of patterns of POS in both the whole population
and specific segments. In the end of the chapter the results of the analysis of Part B
will be depicted showing the causality of POS and willingness to pursue a career in the
hospitality industry.
7.1 Characteristics of the respondents
Figure 1. Gender distribution of the respondents
Of all the respondents (n=77) 27% were male and 73% were female.

52
Figure 2. Language of the degree program
Of the 77 respondents 61% are studying in the Hospitality Management program
conducted in English and 39% are studying in the program conducted in Finnish.
Figure 3. Amount of work experience in the hospitality industry
48% of the respondents (n=77) had more than two years of work experience in the
hospitality industry. 13% had 19 to 12 months of work experience, 18% had 13-18
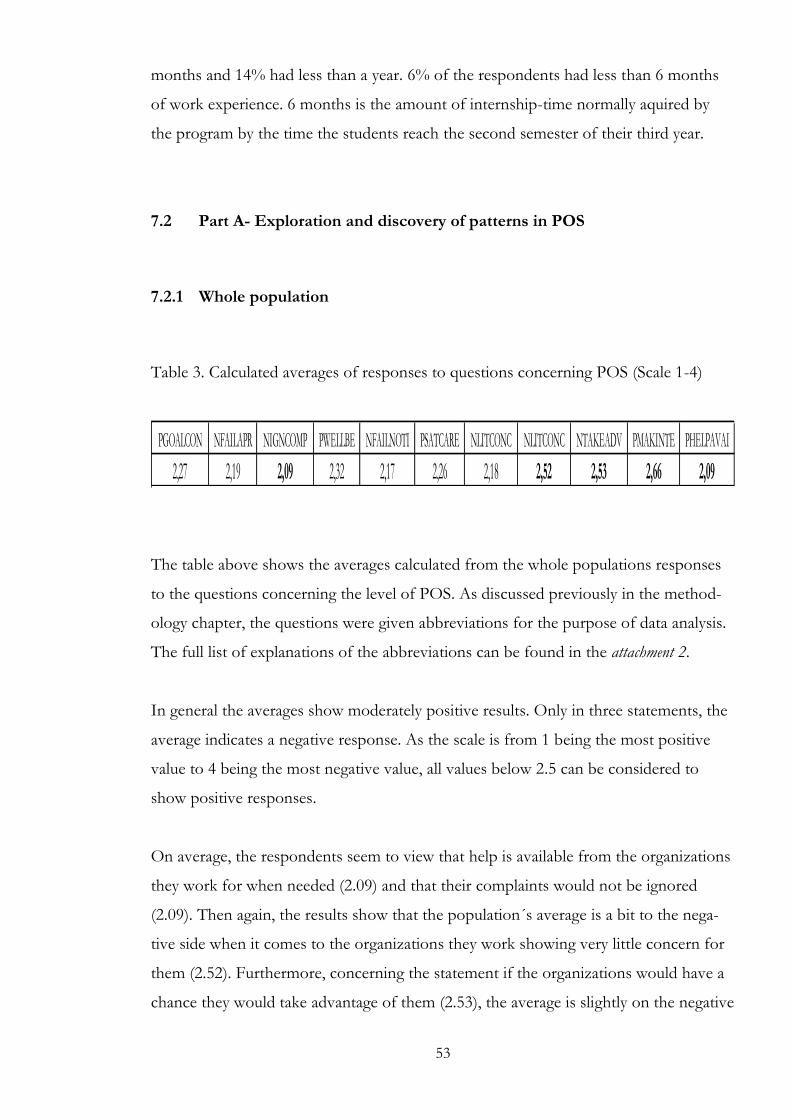
53
months and 14% had less than a year. 6% of the respondents had less than 6 months
of work experience. 6 months is the amount of internship-time normally aquired by
the program by the time the students reach the second semester of their third year.
7.2 Part A- Exploration and discovery of patterns in POS
7.2.1 Whole population
Table 3. Calculated averages of responses to questions concerning POS (Scale 1-4)
PGOALCON NFAILAPR NIGNCOMP PWELLBE NFAILNOTI PSATCARE NLITCONC NLITCONC NTAKEADV PMAKINTE PHELPAVAI
2,27 2,19 2,09 2,32 2,17 2,26 2,18 2,52 2,53 2,66 2,09
The table above shows the averages calculated from the whole populations responses
to the questions concerning the level of POS. As discussed previously in the method-
ology chapter, the questions were given abbreviations for the purpose of data analysis.
The full list of explanations of the abbreviations can be found in the attachment 2.
In general the averages show moderately positive results. Only in three statements, the
average indicates a negative response. As the scale is from 1 being the most positive
value to 4 being the most negative value, all values below 2.5 can be considered to
show positive responses.
On average, the respondents seem to view that help is available from the organizations
they work for when needed (2.09) and that their complaints would not be ignored
(2.09). Then again, the results show that the population´s average is a bit to the nega-
tive side when it comes to the organizations they work showing very little concern for
them (2.52). Furthermore, concerning the statement if the organizations would have a
chance they would take advantage of them (2.53), the average is slightly on the negative
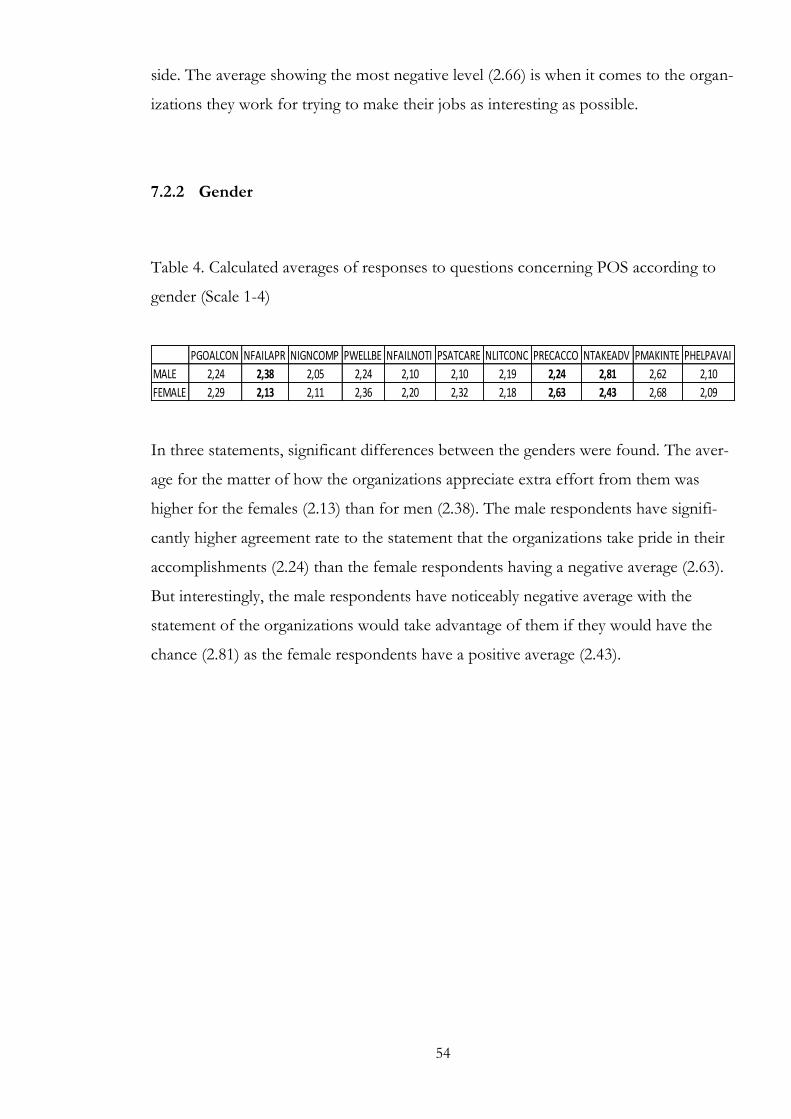
54
side. The average showing the most negative level (2.66) is when it comes to the organ-
izations they work for trying to make their jobs as interesting as possible.
7.2.2 Gender
Table 4. Calculated averages of responses to questions concerning POS according to
gender (Scale 1-4)
PGOALCON NFAILAPR NIGNCOMP PWELLBE NFAILNOTI PSATCARE NLITCONC PRECACCO NTAKEADV PMAKINTE PHELPAVAI
MALE 2,24 2,38 2,05 2,24 2,10 2,10 2,19 2,24 2,81 2,62 2,10
FEMALE 2,29 2,13 2,11 2,36 2,20 2,32 2,18 2,63 2,43 2,68 2,09
In three statements, significant differences between the genders were found. The aver-
age for the matter of how the organizations appreciate extra effort from them was
higher for the females (2.13) than for men (2.38). The male respondents have signifi-
cantly higher agreement rate to the statement that the organizations take pride in their
accomplishments (2.24) than the female respondents having a negative average (2.63).
But interestingly, the male respondents have noticeably negative average with the
statement of the organizations would take advantage of them if they would have the
chance (2.81) as the female respondents have a positive average (2.43).
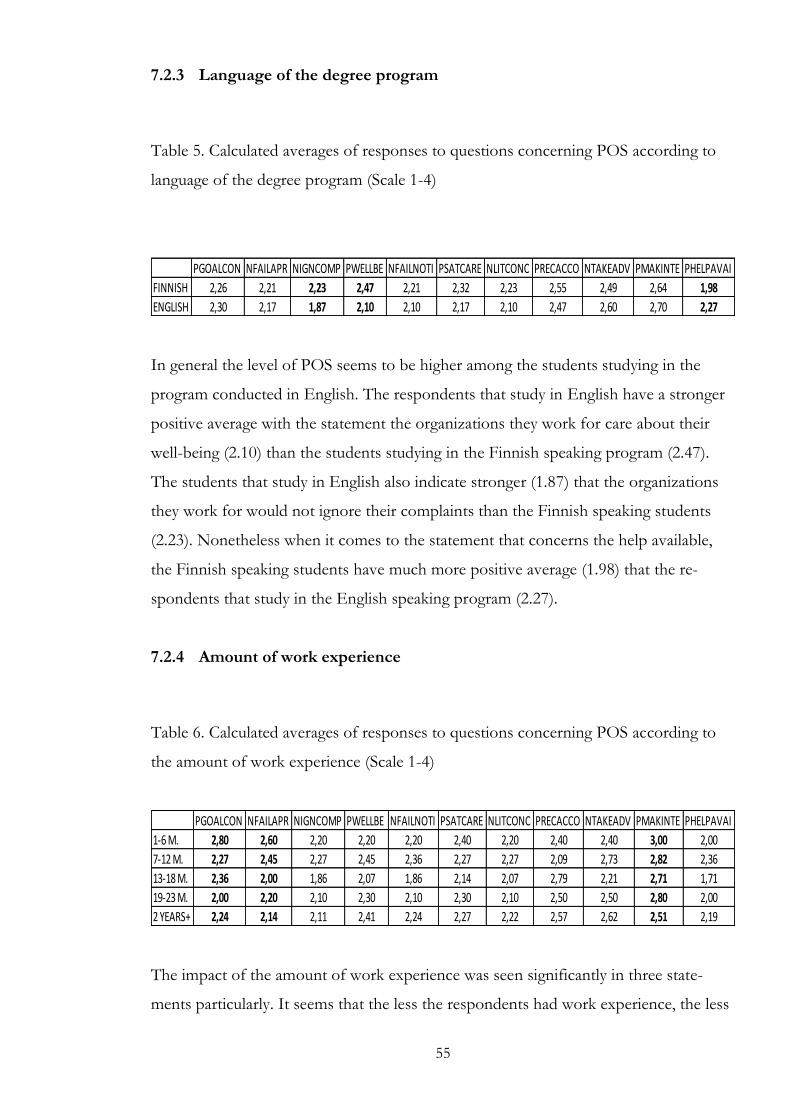
55
7.2.3 Language of the degree program
Table 5. Calculated averages of responses to questions concerning POS according to
language of the degree program (Scale 1-4)
PGOALCON NFAILAPR NIGNCOMP PWELLBE NFAILNOTI PSATCARE NLITCONC PRECACCO NTAKEADV PMAKINTE PHELPAVAI
FINNISH 2,26 2,21 2,23 2,47 2,21 2,32 2,23 2,55 2,49 2,64 1,98
ENGLISH 2,30 2,17 1,87 2,10 2,10 2,17 2,10 2,47 2,60 2,70 2,27
In general the level of POS seems to be higher among the students studying in the
program conducted in English. The respondents that study in English have a stronger
positive average with the statement the organizations they work for care about their
well-being (2.10) than the students studying in the Finnish speaking program (2.47).
The students that study in English also indicate stronger (1.87) that the organizations
they work for would not ignore their complaints than the Finnish speaking students
(2.23). Nonetheless when it comes to the statement that concerns the help available,
the Finnish speaking students have much more positive average (1.98) that the re-
spondents that study in the English speaking program (2.27).
7.2.4 Amount of work experience
Table 6. Calculated averages of responses to questions concerning POS according to
the amount of work experience (Scale 1-4)
PGOALCON NFAILAPR NIGNCOMP PWELLBE NFAILNOTI PSATCARE NLITCONC PRECACCO NTAKEADV PMAKINTE PHELPAVAI
1-6 M. 2,80 2,60 2,20 2,20 2,20 2,40 2,20 2,40 2,40 3,00 2,00
7-12 M. 2,27 2,45 2,27 2,45 2,36 2,27 2,27 2,09 2,73 2,82 2,36
13-18 M. 2,36 2,00 1,86 2,07 1,86 2,14 2,07 2,79 2,21 2,71 1,71
19-23 M. 2,00 2,20 2,10 2,30 2,10 2,30 2,10 2,50 2,50 2,80 2,00
2 YEARS+ 2,24 2,14 2,11 2,41 2,24 2,27 2,22 2,57 2,62 2,51 2,19
The impact of the amount of work experience was seen significantly in three state-
ments particularly. It seems that the less the respondents had work experience, the less
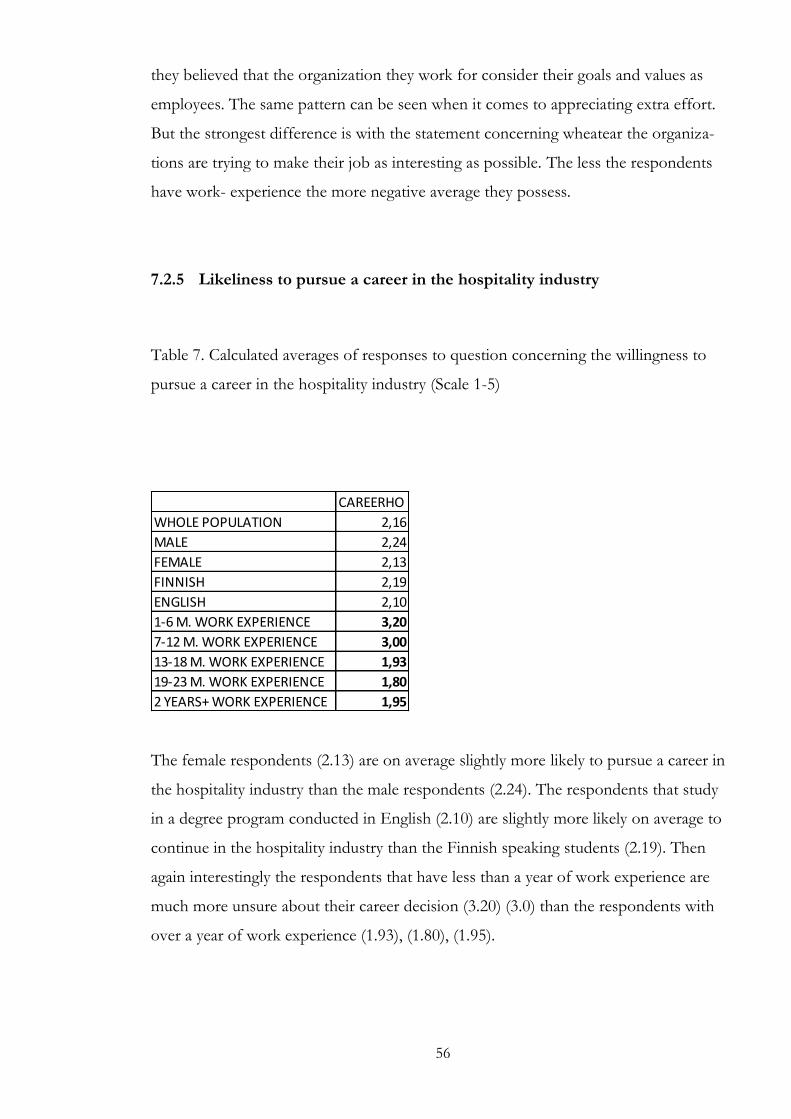
56
they believed that the organization they work for consider their goals and values as
employees. The same pattern can be seen when it comes to appreciating extra effort.
But the strongest difference is with the statement concerning wheatear the organiza-
tions are trying to make their job as interesting as possible. The less the respondents
have work- experience the more negative average they possess.
7.2.5 Likeliness to pursue a career in the hospitality industry
Table 7. Calculated averages of responses to question concerning the willingness to
pursue a career in the hospitality industry (Scale 1-5)
CAREERHO
WHOLE POPULATION 2,16
MALE 2,24
FEMALE 2,13
FINNISH 2,19
ENGLISH 2,10
1-6 M. WORK EXPERIENCE 3,20
7-12 M. WORK EXPERIENCE 3,00
13-18 M. WORK EXPERIENCE 1,93
19-23 M. WORK EXPERIENCE 1,80
2 YEARS+ WORK EXPERIENCE 1,95
The female respondents (2.13) are on average slightly more likely to pursue a career in
the hospitality industry than the male respondents (2.24). The respondents that study
in a degree program conducted in English (2.10) are slightly more likely on average to
continue in the hospitality industry than the Finnish speaking students (2.19). Then
again interestingly the respondents that have less than a year of work experience are
much more unsure about their career decision (3.20) (3.0) than the respondents with
over a year of work experience (1.93), (1.80), (1.95).
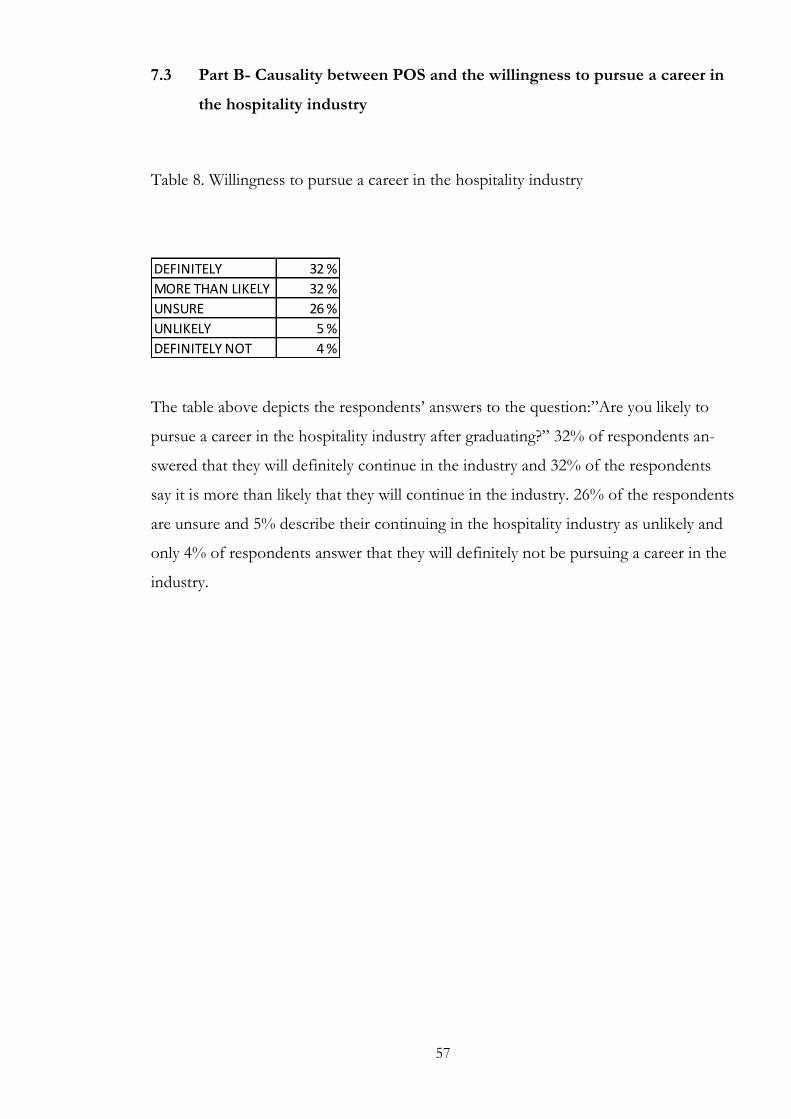
57
7.3 Part B- Causality between POS and the willingness to pursue a career in
the hospitality industry
Table 8. Willingness to pursue a career in the hospitality industry
DEFINITELY 32 %
MORE THAN LIKELY 32 %
UNSURE 26 %
UNLIKELY 5 %
DEFINITELY NOT 4 %
The table above depicts the respondents’ answers to the question:”Are you likely to
pursue a career in the hospitality industry after graduating?” 32% of respondents an-
swered that they will definitely continue in the industry and 32% of the respondents
say it is more than likely that they will continue in the industry. 26% of the respondents
are unsure and 5% describe their continuing in the hospitality industry as unlikely and
only 4% of respondents answer that they will definitely not be pursuing a career in the
industry.
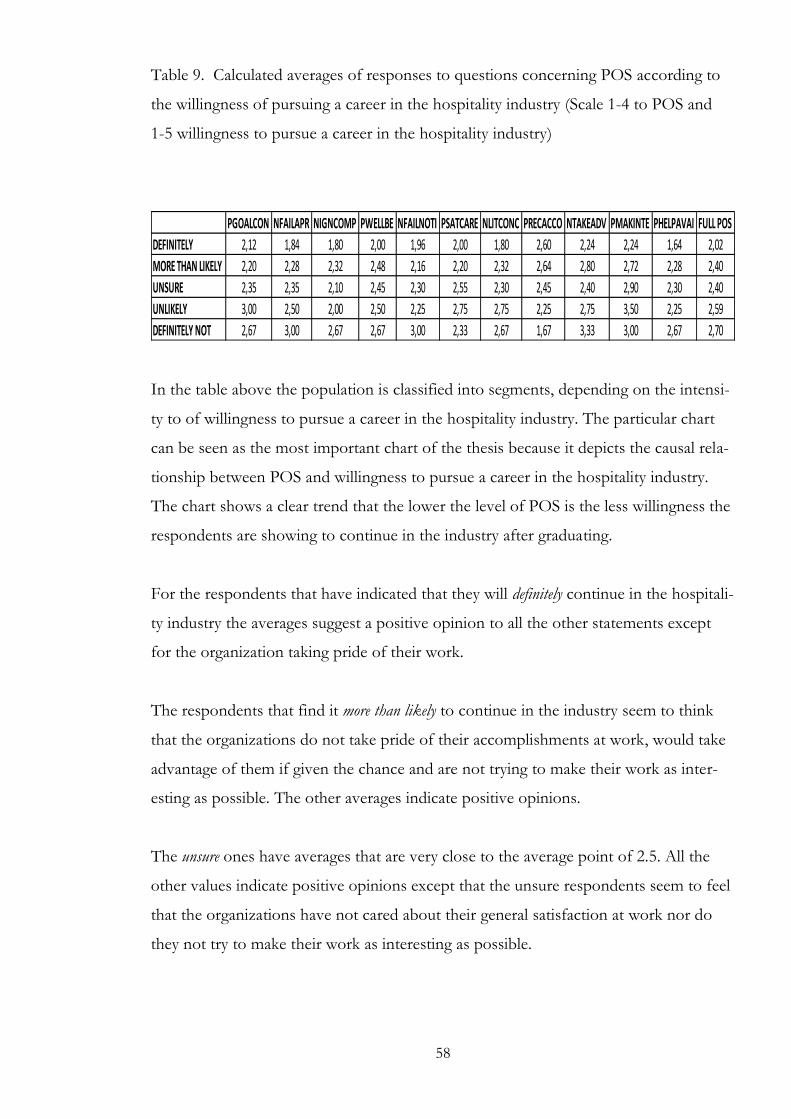
58
Table 9. Calculated averages of responses to questions concerning POS according to
the willingness of pursuing a career in the hospitality industry (Scale 1-4 to POS and
1-5 willingness to pursue a career in the hospitality industry)
PGOALCON NFAILAPR NIGNCOMP PWELLBE NFAILNOTI PSATCARE NLITCONC PRECACCO NTAKEADV PMAKINTE PHELPAVAI FULL POS
DEFINITELY 2,12 1,84 1,80 2,00 1,96 2,00 1,80 2,60 2,24 2,24 1,64 2,02
MORE THAN LIKELY 2,20 2,28 2,32 2,48 2,16 2,20 2,32 2,64 2,80 2,72 2,28 2,40
UNSURE 2,35 2,35 2,10 2,45 2,30 2,55 2,30 2,45 2,40 2,90 2,30 2,40
UNLIKELY 3,00 2,50 2,00 2,50 2,25 2,75 2,75 2,25 2,75 3,50 2,25 2,59
DEFINITELY NOT 2,67 3,00 2,67 2,67 3,00 2,33 2,67 1,67 3,33 3,00 2,67 2,70
In the table above the population is classified into segments, depending on the intensi-
ty to of willingness to pursue a career in the hospitality industry. The particular chart
can be seen as the most important chart of the thesis because it depicts the causal rela-
tionship between POS and willingness to pursue a career in the hospitality industry.
The chart shows a clear trend that the lower the level of POS is the less willingness the
respondents are showing to continue in the industry after graduating.
For the respondents that have indicated that they will definitely continue in the hospitali-
ty industry the averages suggest a positive opinion to all the other statements except
for the organization taking pride of their work.
The respondents that find it more than likely to continue in the industry seem to think
that the organizations do not take pride of their accomplishments at work, would take
advantage of them if given the chance and are not trying to make their work as inter-
esting as possible. The other averages indicate positive opinions.
The unsure ones have averages that are very close to the average point of 2.5. All the
other values indicate positive opinions except that the unsure respondents seem to feel
that the organizations have not cared about their general satisfaction at work nor do
they not try to make their work as interesting as possible.
59
For respondents that see continuing in the industry as unlikely or will definitely not con-
tinue, the most negative averages they seem to have are; companies appreciating their
extra effort, organizations failing to notice even if they do the best job possible, feeling
that if the organization could it would take advantage of them and making their work
as interesting as possible.
60
8 Discussion
As discussed in earlier chapters, the hospitality industry is struggling to find skilled,
motivated employees that are willing to commit. There are many institutions providing
education in hospitality management for students aiming to make a career in the indus-
try. But are these students willing to pursue a career in the industry after graduating? If
they are not, what are the underlying reasons?
The author has personally worked in the hospitality industry for almost 10 years and
changed to an entirely different profession. Within those 10 years a lot has altered
within the industry but some of the issues stubbornly remain. Still, there is dialogue in
the industry about the educational institutions not providing students who are motivat-
ed enough, who hold the required skills and who have a realistic idea of the demands
of their profession. On the other hand, there is concern within the educational institu-
tions about the level of internships the industry provides and about the treatment the
students’ experience. An experienced teacher of Haaga-Helia summarized the concern.
He said that when the students begin their studies, they are excited but after the first
internship they are hit by the reality so hard that a lot of them drop out.
Whose fault is this? Is the industry treating the students so poorly? Are the schools not
providing a realistic image of the industry or not telling the students that working in
the hospitality industry is demanding and not only glamour? Are the generation Y stu-
dents not used to hard work? Two things are for sure. First thing is that the blame
game does not help. Both the institutions and the industry should make improvements.
Second thing is that Generation Y students are the future employees of the industry.
Whether the industry wants it or not they have to start accommodating better the
wants and needs of this generation.
The theory of POS utilized in this thesis might help reveal some areas of improvement.
High POS has been proven to increase motivation, affection and positive orientation
towards the organization. By norm of reciprocity, high POS also increases the employ-
ee’s felt obligation towards helping the organization and increases loyalty. (Eisenberger
61
& Stinhamber 2011, 59, 240) By exploring the results in the light of the theory and its
different aspects, it is possible to identify the factors that might cause the students to
have negative orientation towards the industry.
In the following chapter the results are being discussed by using the author’s personal
insights, by reflecting the results to the theory of POS and by mirroring the results to
the characteristics of generation Y. To start with, the most important findings of part
A, patterns and trends in POS of the whole population and of specific segments are
discussed. The latter part of the discussion explores part B and the possible causal rela-
tionship between the level of POS and willingness to pursue a career in the hospitality
industry.
8.1 Interpretation of the results
8.1.1 Part A- Patterns and trends in POS of the whole population and of specif-
ic segments
At first glance the averages of the whole population do not seem alarming. Only three
of the eleven statements had averages that indicate negative values. But these there
negative values tell a strong message.
It seems that on average the students feel that the organizations show very little con-
cern for them. Keeping the norm of reciprocity in mind, if the organizations do not
show care for the students how can the students feel motivated on showing concern
for the organization. Even more so, on average the students seem to feel that if the
organization could, it would take advantage of them. The hospitality industry has a
culture of taking on unpaid interns. These interns are not in the position to demand for
better work or even sadly to demand obeying of labor law. Furthermore, the most neg-
ative indication is that the students do not feel that the organizations are trying to make
their job as interesting as possible.
62
Generation Y appreciates variety, continuous training, development opportunities and
genuine caring. There is a crystal clear conflict with what the Gen Y’ers want and what
they are getting. These factors according to the theory of POS are in relation to socio-
emotional need fulfillment, expected reward for high effort and organizational sinceri-
ty. If the organizations would dedicate time and effort on genuinely making sure the
internships and early career employment serve the purpose of learning and getting fa-
miliar with the industry, according to Theory of POS, they would have much more
productive and motivated interns and employees.
Another noticeable point is that the respondents feel that help is available if so needed
and that the organizations would not ignore their complaints. The latter ones were the
most positively responded statements. What is noticeable about these factors is that
they both tell about re-activeness more than pro-activeness.
The authors own experiences in the industry support these findings. The constant
strive for productivity which leads often to understaffing is not a combination that fos-
ters pro-activity. The interns are not properly orientated and the interns are given very
easy level, monotonous work that no-one else has time for. As resources are scarce, the
senior staff does not necessarily have the time to explain why things are done in a cer-
tain way. This does not assist the students or employees in an early state of their ca-
reers to grasp the big picture of the operations or add the meaningfulness that the Gen
Y’ers are longing for. The lack of pro-activeness can be seen as well in the lack of HR
functions in the industry, which then, the interns experience as the organization not
caring for them.
In some hospitality establishments by the authors own experience, the usage of interns
as free labor is so extensive that the regular staff does not even bother to memorize the
names of the interns. As one of the characteristics of Gen Y is that they want to be
seen and treated as individuals this kind of attitude towards them will not make hospi-
tality industry a lucrative prospective career.
63
When asked about the willingness to pursue a career in the hospitality industry, the
factor that had the biggest impact was the amount of work experience. Its influence
was much greater than for example the impact of gender of the language of the pro-
gram. According to the results, the less the respondent had work experience the more
unlikely it is that he/she will pursue a career in the industry. This result does not corre-
late directly with previous results of Richardson (2008) and Barron (2008) that suggest-
ed that exposure to work experience has a negative impact on the willingness to pursue
a career. Then again, the statistics gained from Haaga-Helia UAS depict that of all the
students that interrupt their Bachelor of Hospitality studies, 60% of the drop outs
(45% during the first year) happen within the first two years of the studies. There sta-
tistics are very much in line with the statement of the teacher of Haaga-Helia indicating
that the first encounters with the working life cause a significant amount of drop outs.
In other words, it seems that the risk of discontinuing the studies is the highest after
the first internship, which is very much in correlation with the results of Barron (2008)
and Richardson (2008).
All of the respondents are studying in their third year and have work experience. 48%
of the respondents have more than two years of work experience. It is safe to say that
the respondents possess enough work experience to know the characteristics of the
industry. Only 32% of the respondents stated that they will definitely pursue a career in
the hospitality industry and 32% are more than likely to. A staggering 26% are unsure.
This is a worrying finding, since these students are soon to graduate and are the ones
that are supposed to become the future employees of the hospitality industry when the
Baby Boomers are retiring at a rapid pace. 9% of the respondents indicate that they are
unlikely to or will definitely not enter the industry after graduating.
Can this be an indication that what the industry has to offer is not appealing to the new
generation of work force? Are the issues such as inadequate pay, poor management,
lack of appreciation and feeling like a slave etc. that Kusluvan & Kusluvan (2000) and
Richardson (2008) found in their studies, the reason why Gen Y’ers seek therefore
other professions.
64
The author’s personal experience is that professions in the industry can be very re-
warding. But there has to be a strong calling, since the negative sides are extensive such
as the inadequate pay, long hours and difficulties of combining work and family. Also
the physical nature of the work takes its toll. After working only a few years it is com-
mon that well educated professionals seek for another industry to work for. By system-
atically increasing the factors affecting POS positively, the negative aspects of the in-
dustry could be effectively reduced.
The subject has not been previously studied within this context and thus provides new
and extremely important information for the educational institutions and for the hospi-
tality industry. The author believes that the results of the study give a fair glimpse of
the possible reasons leading to discontinuation of studies and can be used to improve
the current problematic situation.
8.1.2 Part B- Causal relationship between the level of POS and willingness to
pursue a career in the hospitality industry
There is a clear positive causality between high POS and willingness to pursue a career
in the hospitality industry. Thus, it can be stated that the higher POS the student has
experienced during their work experience the more willing they are to stay in the indus-
try. This result supports Eisenberger’s theory of POS “Perceived organizational sup-
port is strongly related to employees’ affective organizational commitment and their
associated dedication to the organization´s objectives and job retention.” (Eisenberger
& Stinghamber 2011, 183) We know based on the theory, that the employees form a
general perception concerning the degree to which the organization values their con-
tributions and cares about their well-being (Eisenberger &Stinghamber 2011, 240).
This perception influences for example the choice of which employer to work for.
Could it be that the by following the formula, students that are in the situation of
choosing a career, form a general perception of an industry based on their experiences?
65
Organizational support plays a crucial role especially in the beginning of the career.
Students are often insecure, policies and practices are still uncommon and the ropes
are not learned. If the students feel that at this vulnerable point, they are not cared for
nor supported they might get overwhelmed by the fast paced industry.
Sectors of POS that seem to have the most important impacts on the willingness to
pursue a career in the hospitality industry seem to be appreciation of extra effort and
appreciation of doing the best job possible, not taken advantage of when possible and
making the job as interesting as possible. These factors fit also the characteristics of
Generation Y. They need constant feedback and appraisal, enjoy variety and demand
corporate social responsibility (Terjesen, Vinnicombe and Freeman 2007; Shaw &
Fairhurst 2008).
With all other statements except for the organization taking pride of their work, the
trend is clear. This is not a surprising result. Even with common sense it is possible to
grasp that if the students are not cared for or appreciated in their early experiences
with the industry, they do not wish to stay.
8.2 Reliability and validity of the results
The results can be viewed as reliable. It is reasonable based on the results to believe
that if the research would be duplicated, similar results would be obtained within the
same population. The survey instrument is based on Eisenberger’s Survey of perceived
organizational support, and is scientifically proven to be reliable and the questionnaire
was tested by using a focus group. The respondents were carefully instructed by the
author and the author personally administered the surveying.
Validity of the results can be considered to be high within the context of Haaga-Helia
University of Applied Sciences and possibly even in other institutions providing similar
education in the capital region of Finland. Nevertheless, the results cannot be general-
ized as such. Based on the results it can be argued that high POS correlates positively
66
to willingness to pursue a career in the hospitality industry. But it has to be considered
as one influencing factor and not as a determining aspect. In regions where employ-
ment opportunities are scarce, POS might not play such an important role. Further-
more, the economical surroundings and background as well as the culture and work
culture can alter the importance of POS. The positive outcomes of POS cannot be
argued, but for example in lower income countries, the possibility to earn income is a
far more determining factor than POS.
8.3 Suggestions for development
The author suggests that both the institutions and industry leaders open an honest dis-
cussion of the issue. First of all, the author suggests that Haaga-Helia emphasizes more
the importance of good quality internships. As a Leading Hotel School of the World
and a prestigious hospitality institution Haaga-Helia has the opportunity to lead the
way for the next generation of Hospitality. The author is concerned about the lack of
scrutinizing the quality of the internships. Even though Haaga-Helia conducts re-
search, the students’ internship experiences have not been studied or monitored at all.
As internships are mandatory and as the they are sometimes the first encounter with
everyday hospitality management work, mechanism have to be developed for maintain-
ing the same quality of teaching both in the internships as in the school.
Furthermore, the author suggests that Haaga-Helia would further develop their student
intake process. Currently all students selected must have some work experience. This
work experience however is not necessarily relevant or even from the hospitality indus-
try. The author strongly recommends that only students with relevant hands on work
experience are taken on to study to become Hospitality managers. This allows the stu-
dent to have a realistic view of the industry and thus also provides more motivated and
skilled interns for the industry.
Additionally, the author recommends that Haaga-Helia increases the courses in Human
Resources management. As the current students are the managers of the future, this
67
would allow that the next generation of managers would understand the importance of
good human resources management in the future. The author believes that the compa-
ny’s orientation towards the interns affects vastly the behavior and attitudes the intern
holds towards the company. In the theoretical framework, the paradigms of orientation
toward employees were discussed. Eisenberger and Stinghamber (2011, 12) presented
two different orientations, marginal capital view and human capital view (see table 2. p.
39). Marginal capital view is based on an assumption that most employees lack innate
talent, are ignorant and unmotivated. Thus they have to be closely monitored and can-
not be trusted with challenging tasks. Human capital view on the other hand is based
on the assumption that employees have high talent and can be very effective when
properly trained and motivated. Human capital view also sees the employees as a key
component of organizational success. These orientations are very close to McGregor´s
X and Y theories. If the companies treat the interns as unmotivated extra help that are
incapable of bearing any responsibility it will develop to subsist a self fulfilling prophe-
cy. In order to change these prevailing orientations towards the interns in a long run
the education of the future managers in HR related matters is crucially important.
The hospitality industry should insure better quality internships. In the current short-
age of employees in the industry, providing great internships is a definite competitive
advantage. The interns must be provided with adequate orientation. This is also bene-
ficial to the company since the student learns the ropes much quicker but it is especial-
ly beneficial for the student feeling appreciated and cared for. For example, a company
can name a mentor for each student to help and guide in the everyday work.
In addition, in the author’s point of view the internships should be paid. Even if the
amount of compensation would not be very high, the intern would get compensated
for the work and as now the intern would be a cost to the company, the company
would have to invest in the students learning.
The internships should be planned in at least some way. If for example the student and
the manager would agree in the beginning of the internship of the responsibilities and
68
the student’s aims, the work of the interns could be made far more interesting and mo-
tivating. Also, the student’s development and learning has to be monitored and dis-
cussed on a continuous basis allowing also constant feedback.
8.4 Suggestions for further research
The author suggests that this subject would be further researched. The minimum
would be that Haaga-Helia starts regular monitoring of the feedback that the students
give on their internships. This feedback must be recorded and given to the companies
providing the internships.
Furthermore, a similar study could be conducted in an international level providing
information about the differences between countries and importance of POS in differ-
ent working cultures. A similar type of study could be also conducted in a way that the
level of POS would be compared between different degree programs and industries
such as hospitality and business for example within Haaga-Helia UAS.
8.5 Asessment of thesis process and learning
This thesis has been a long process. The author started the thesis already in February
2011, over a year ago. Because of the complexity of the subject and the author’s per-
sonal experiences in the industry, the duration of the process has been an aid for the
development and maturation of the thesis.
The actual thesis process itself was challenging because of the lack of research and aca-
demic writing skills. The author had to learn most of the things from scratch. Looking
back, this thesis has been a learning experience never to forget. Many teachers and staff
members have provided priceless help and have not spared their efforts. The scope
and extensiveness of the thesis was quite large for a student without adequate research
69
skills and a significant part of the learning has happened in a trial-error basis. In retro-
spect, the author has learned a lot about research methods, statistics, academic writing
and most importantly about herself.
The most challenging aspect of the process was to maintain objectivity. Because of the
authors previous 10 year career in the industry, this objective was not easy to reach.
The author has seen all sides of this subject. At first, as a hospitality student in an early
age interring in numerous top restaurants of Helsinki, second of all, the author during
her career was training interns for over five years and thirdly as a HR-student and now
professional researching the subject. Doing the theoretical research was sometimes
heartbreaking and frustrating since the author can identify herself with the respondents
but also knows the reality of the industry.
On the other hand, the research was fascinating since there are very simple actions to
take in order to make the industry and internships better. All in all, the author herself
did not experience much of POS during her career, but with the input of both the edu-
cational institutions emphasizing the importance of human resources and the industry
reconsidering its values the author remains optimistic. In the future, as the Generation
Y occupies the managerial positions, we will see a better future and a lot higher per-
ceived organizational support.
70
Bibliography
Allen, D. G., Shore, L.M., Griffeth, R.W. 2003. The Role of Perceived organizational
support and Supportive Human Resource Practices in the Turnover Process. Journal
of Management, vol. 29, no. 1, pp. 99-118
Anderson, V. 2004. Research methods in Human Resource Management. Chartered
Institute of Personnel and Development. London
Aselage, J., Eisenberger, R. 2003. Perceived organizational support and psychological
contracts: a theoretical integration. Journal of Organizational Behavior, vol. 24, pp.
491-509
Barron, P. 2008. Education and talent management: implications for the hospitality
industry. International Journal of Contemporary Hospitality Management, vol. 20, no.
7, pp. 730-742
Barron, P., Maxwell, G., Broadbridge, A.,Odgen,S. 2007. Careers in Hospitality Man-
agement: Generation Y`s Experiences and Perceptions. Journal of Hospitality and
Tourism management, vol.14, no.2, pp 119-128
Cairncross, G., Buultjens, J. 2007. Generation Y and work in the tourism and hospitali-
ty industry: problem? What Problem? Centre for Enterprise Development and Re-
search Occasional Paper, no. 9, Southern Cross University, Coffs Harbour, NSW.
Chen, P-J., Choi, Y. 2008. Generational differences in work values: a study of hospitali-
ty management. International Journal of Contemporary Hospitality Management, vol.
20, no. 6, pp. 595-615
Chow, I.H., Lo, T.W., Sha, Z., Hong, J. 2006. The impact of developmental experi-
ence, empowerment, and organizational support on catering service staff performance.
International Journal of Management, vol. 25, pp. 478-495

71
Chuang, N-K., Dellmann-Jenkings, M. 2010. Career Decision Making and Intention: a
Study of Hospitality Undergraduate Students. Journal of Hospitality & Tourism Re-
search, vol. 34, no. 4, pp. 512-530
Collins, J., Hussey, R. 2003. Business Research; A practical guide for undergraduate
and postgraduate students. Second edition. Palgrave Macmillan. New York.
Coyle-Shapiro. J.A.M., Shore, L.M. 2007. The Employee-Organization Relationship:
Where do we go from here? Human Resource Management Review, vol. 17, no. 2, pp.
166-179
Eisenberger, R., Stinglhamber, F. 2011. Perceived organizational support; Fostering
Enthusiastic and Productive Employees. American Psychological Association. London.
Eisenberger, R. Karagonlar, G. Neves, P., Becker, T. E., Gonzales-Morales, G.M.,
Stinghamber, F. 2010. Leader-Member Exchange and Affective Organizational Com-
mitment: The Contribution of Supervisor`s Organizational Embodiment. Journal of
Applied Psychology, Advanced online publication,
http://www.psychology.uh.edu/faculty/Eisenberger/files/leader-member.pdf, Quot-
ed 10.9.2011
Eisenberger, R., Cummings, J., Armeli, S., Lynch, P. 1997. Perceived organizational
support, Discretionary Treatment, and Job Satisfaction. Journal of Applied Psychology,
vol. 82, no. 5, pp. 812-820
Eisenberger, R., Fasolo, P., Davis-Lamastro, V. 1990. Perceived organizational support
and employee diligence, commitment and innovation. Journal of Applied Psychology,
vol. 75, no. 1, pp. 51-59
Eisenberger, R., Huntington, R., Huchison, S.,Sowa, D.1986. Perceived organizational
support. Journal of Applied Psychology, vol. 71, no. 3, pp. 500-507
72
Enz, C.A. 2009. Human Resource Management: A Troubling Issue for the Global Ho-
tel Industry, Cornell Hospitality Quarterly, vol. 50, no. 4, pp. 578-583
Enz, C.A. 2004. Issues for concern for restaurant owners and managers. Cornell hotel
and restaurant administration quarterly, vol. 45, no. 4, pp. 315-332
Enz, C.A. 2001. What keeps you up at night? Cornell hospitality quarterly, vol, 42, no.
2, pp. 38-45
Eubanks, S. 2008. Millennials Go To College By Neil Howe and William Strauss; Ex-
ecutive summary. American Association of Collegiate Registrars and Admissions Of-
fices (AACRAO) and Life Course Associates. http://eubie.com/millennials.pdf.
Quoted 8.6.2011.
Falk. A., Fischbacher, U. 2006. A theory of reciprocity. Games and Economic behav-
ior, vol. 54, pp. 293-315
Jenkins, A. K. 2001. Making a career of it? International Journal of Contemporary
Hospitality Management, vol. 13, no. 1, pp.13-20
Jiang, B., Tribe, J. 2009. ‘Tourism jobs- short lived professions’: Student attitudes to-
wards tourism careers in China. Journal of Hospitality, Leisure, Sport & Tourism Edu-
cation, vol. 8, no. 1, pp. 4-19
Kawana-Brown, E. 2007. What do Y Expect and Why Should We Care? Generation
Y`s Experience of Industry Placement. Orion Journal of International Hotel Manage-
ment, issue 2, pp. 48-56
Knuutinen, L. 2011. Z ja Epäjohtaminen.
http://econ.aalto.fi/fi/current/news/view/2011-05-05/. Quoted 9.9.2011
73
Kusluvan, S., Kusluvan, Z., Ilhan, I., Buyruk, L. 2010. The Human Dimension: A re-
view of Human Resources Management Issues in the Tourism and Hospitality indus-
try. Cornell Hospitality Quarterly, vol. 51, no. 2, pp. 171-214
Kusluvan, S., Kusluvan, Z. 2000. Perceptions and attitudes of undergraduate tourism
students towards working in the tourism industry in Turkey. Tourism management, vol
21, pp. 251-269
Macky, K., Gardner, D., Forsyth, S. 2008. Generational differences at work: introduc-
tion and overview. Journal of Managerial Psychology, vol. 23, no. 8, pp. 857-861
Martin, C. A. 2005. From high maintenance to high productivity; what managers need
to know about Generation Y. Industrial and Commercial Training, vol 37, no. 1, pp.
39-44
McGuire, D., Todnem, R., Hutchinson, K. 2007. Towards a model of human resource
solutions for achieving intergenerational interaction in organizations. Journal of Euro-
pean Industrial Training, vol. 31, no. 8, pp. 592-608
Paavola, T. 2011. Y-sukupolvi haluaa uudenlaista johtamista.
http://www.fennia.fi/FenniaRyhma/Asiakaslehti/MuutAiheet/YsukupolviHaluaaUud
enlaistaJohtamista.htm. Quoted 9.9.2011
Preston, M. 2007. Who’d hire a Gen-Y?
http://www.smartcompany.com.au/hiring/who-d-hire-a-gen-y.html, Quoted
11.6.2011.
Psycon Oy. 2010. Poimintoja työelämän odotuksista. www.jci.fi/binary/file/-
/id/1/fid/5850. Quoted 9.9.2011
74
Päivärinta, P. 2011. How the hospitality management degree in Vaasa University of Ap-
plied Sciences corresponds to working life. UAS-thesis. Vaasa University of Applied
Sciences.
https://publications.theseus.fi/bitstream/handle/10024/29561/Petra_Paivarinta.pdf?s
equence=1
Rhoades, L., Eisenberger, R., 2002. Perceived organizational support: A Review of the
Literature. Journal of Applied Psychology, vol. 87, no. 4, pp. 698-714
Richardson, S. 2008.Undergraduate Tourism and Hospitality Students Toward a Career
in the Industry: A preliminary Investigation. Journal of Teaching in Travel & Tourism,
vol. 8, no.1, pp. 23-46
Robbins, S.P. 2003. Organizational Behaviour. Pearson education. New Jersey.
Shaw, S., Fairhurst, D. 2008. Engaging a new generation of graduates. Education +
Training, vol. 50, no. 5, pp. 366-378
Shih, W., Allen, M. 2007. Working with Generation-D: adopting and adapting to cul-
tural
learning and change. Library Management, vol. 28, no. 1/2, pp. 89-100
Smola, K., Sutton, D. 2002. Generational differences: revisiting generational work val-
ues for the
new millennium. Journal of Organizational Behavior, vol. 23, pp. 363–382
Solnet, D., Hood, A.2008. Generation Y as Hospitality employees: Framing a research
agenda. Journal of Hospitality and Tourism Management, vol.15, pp.59-68
Solnet, D., Kralj. A.L. 2010. Can`t Get No Satisfaction: An examination of Generation
Y work attitudes. International CHRIE Conference-Refereed Track. Paper 4.
75
Terjesen, S., Vinnicombe, S., Freeman, C. 2007. Attracting Generation Y graduates;
Organizational attributes, likelihood to apply and sex differences. Career Development
International, vol. 12, no. 6, pp.504 – 522
Walters, G., Raybould, M. 2007. Burnout and Perceived organizational support Among
Front- Line Hospitality Employees. Journal of Hospitality and Tourism Management,
vol. 14, no. 2, pp. 144-156
Westerman, J., Yamamura, H. 2007. Generational preferences for work environment
fit: effects on employee outcomes. Career Development International, vol. 12, no. 2,
pp. 150-161
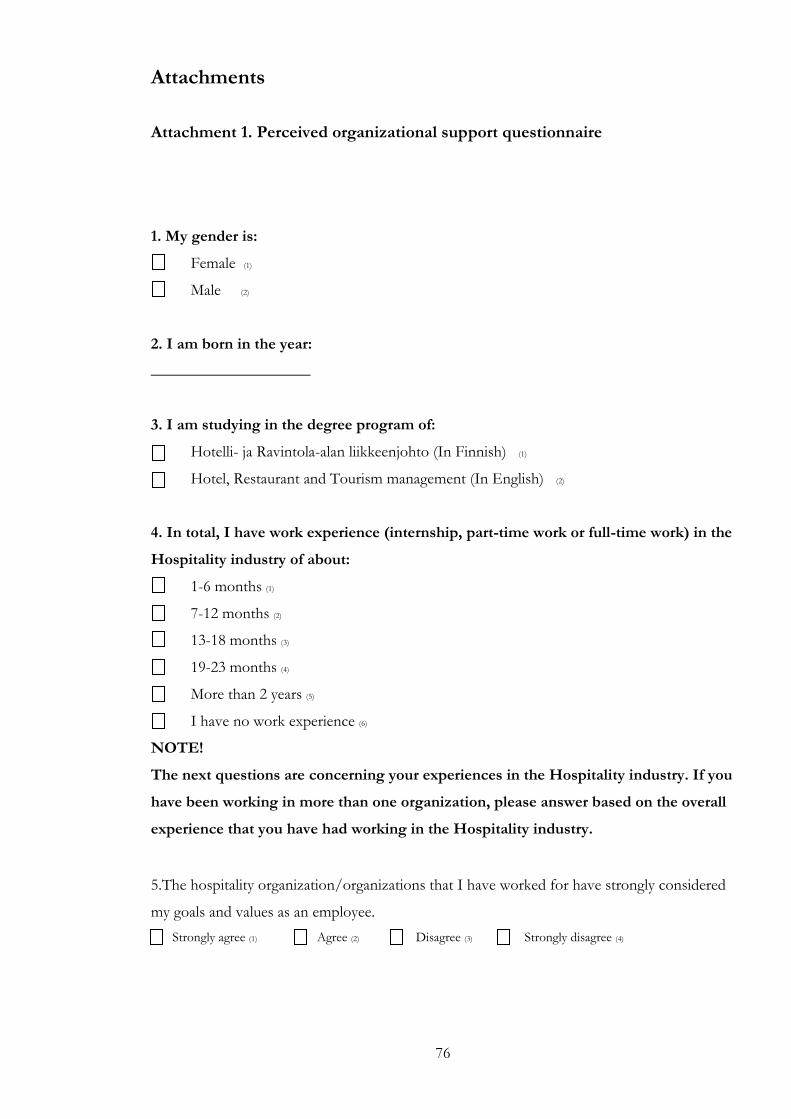
76
Attachments
Attachment 1. Perceived organizational support questionnaire
1. My gender is:
Female (1)
Male (2)
2. I am born in the year:
____________________
3. I am studying in the degree program of:
Hotelli- ja Ravintola-alan liikkeenjohto (In Finnish) (1)
Hotel, Restaurant and Tourism management (In English) (2)
4. In total, I have work experience (internship, part-time work or full-time work) in the
Hospitality industry of about:
1-6 months (1)
7-12 months (2)
13-18 months (3)
19-23 months (4)
More than 2 years (5)
I have no work experience (6)
NOTE!
The next questions are concerning your experiences in the Hospitality industry. If you
have been working in more than one organization, please answer based on the overall
experience that you have had working in the Hospitality industry.
5.The hospitality organization/organizations that I have worked for have strongly considered
my goals and values as an employee.
Strongly agree (1) Agree (2) Disagree (3) Strongly disagree (4)
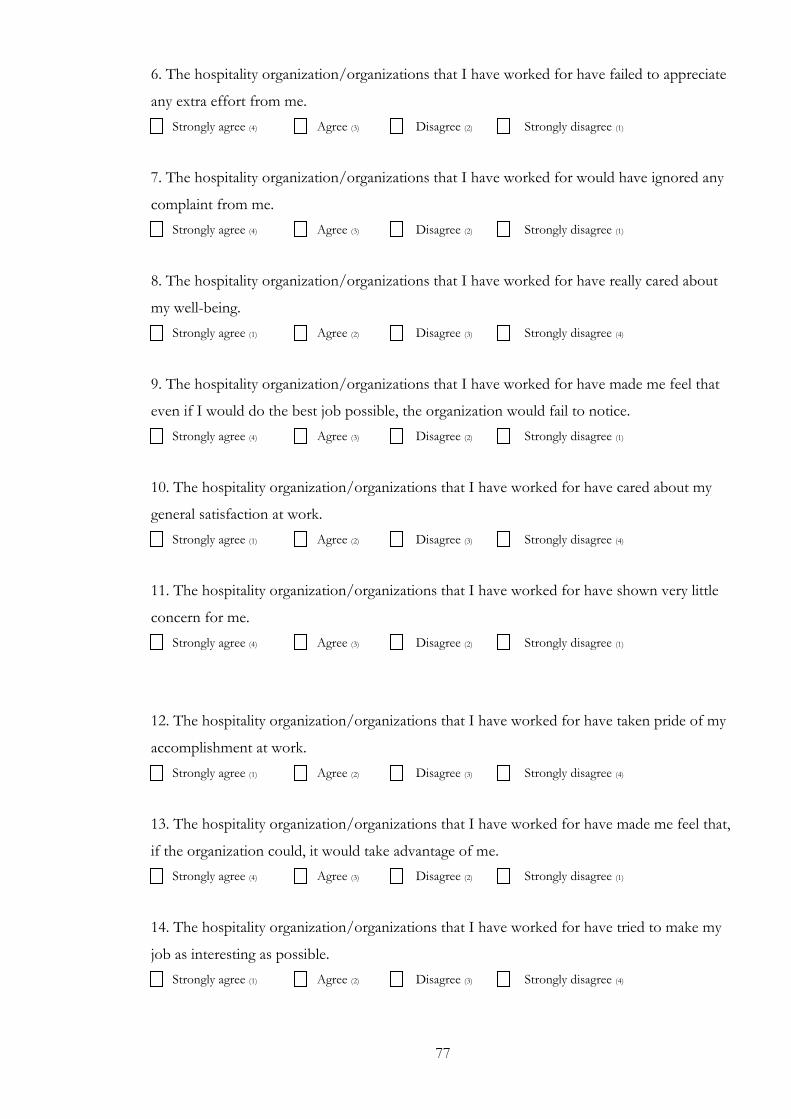
77
6. The hospitality organization/organizations that I have worked for have failed to appreciate
any extra effort from me.
Strongly agree (4) Agree (3) Disagree (2) Strongly disagree (1)
7. The hospitality organization/organizations that I have worked for would have ignored any
complaint from me.
Strongly agree (4) Agree (3) Disagree (2) Strongly disagree (1)
8. The hospitality organization/organizations that I have worked for have really cared about
my well-being.
Strongly agree (1) Agree (2) Disagree (3) Strongly disagree (4)
9. The hospitality organization/organizations that I have worked for have made me feel that
even if I would do the best job possible, the organization would fail to notice.
Strongly agree (4) Agree (3) Disagree (2) Strongly disagree (1)
10. The hospitality organization/organizations that I have worked for have cared about my
general satisfaction at work.
Strongly agree (1) Agree (2) Disagree (3) Strongly disagree (4)
11. The hospitality organization/organizations that I have worked for have shown very little
concern for me.
Strongly agree (4) Agree (3) Disagree (2) Strongly disagree (1)
12. The hospitality organization/organizations that I have worked for have taken pride of my
accomplishment at work.
Strongly agree (1) Agree (2) Disagree (3) Strongly disagree (4)
13. The hospitality organization/organizations that I have worked for have made me feel that,
if the organization could, it would take advantage of me.
Strongly agree (4) Agree (3) Disagree (2) Strongly disagree (1)
14. The hospitality organization/organizations that I have worked for have tried to make my
job as interesting as possible.
Strongly agree (1) Agree (2) Disagree (3) Strongly disagree (4)
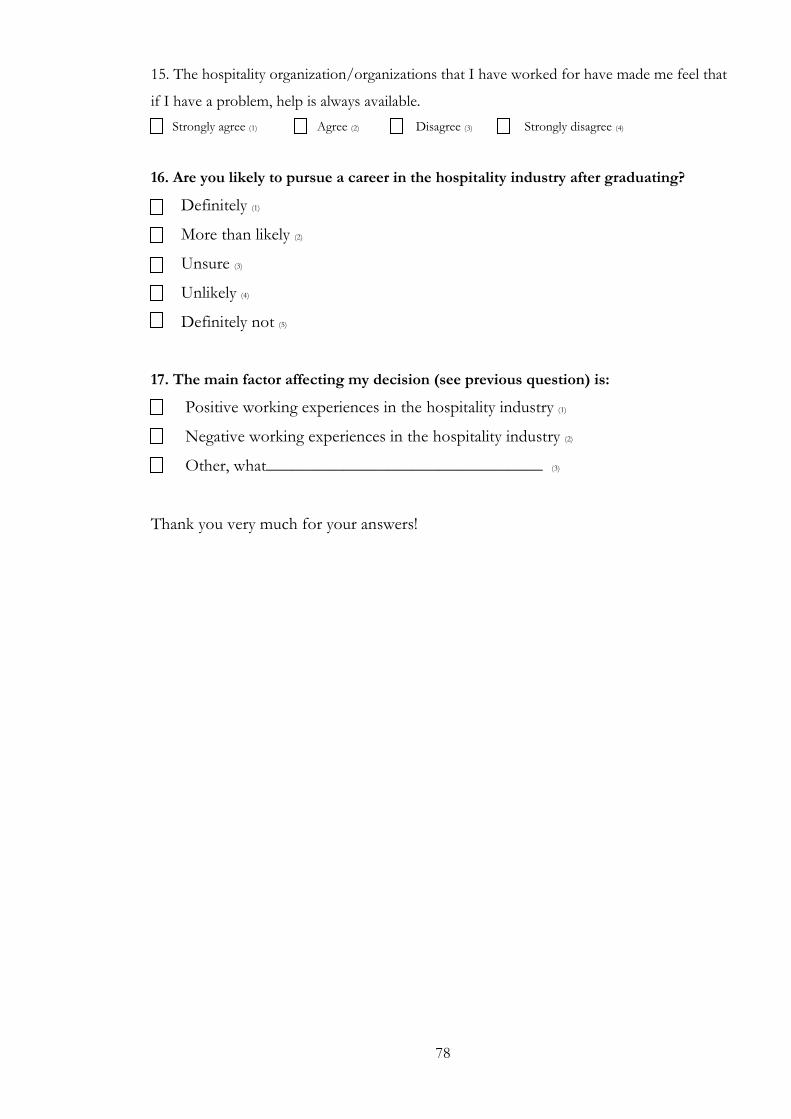
78
15. The hospitality organization/organizations that I have worked for have made me feel that
if I have a problem, help is always available.
Strongly agree (1) Agree (2) Disagree (3) Strongly disagree (4)
16. Are you likely to pursue a career in the hospitality industry after graduating?
Definitely (1)
More than likely (2)
Unsure (3)
Unlikely (4)
Definitely not (5)
17. The main factor affecting my decision (see previous question) is:
Positive working experiences in the hospitality industry (1)
Negative working experiences in the hospitality industry (2)
Other, what________________________________ (3)
Thank you very much for your answers!
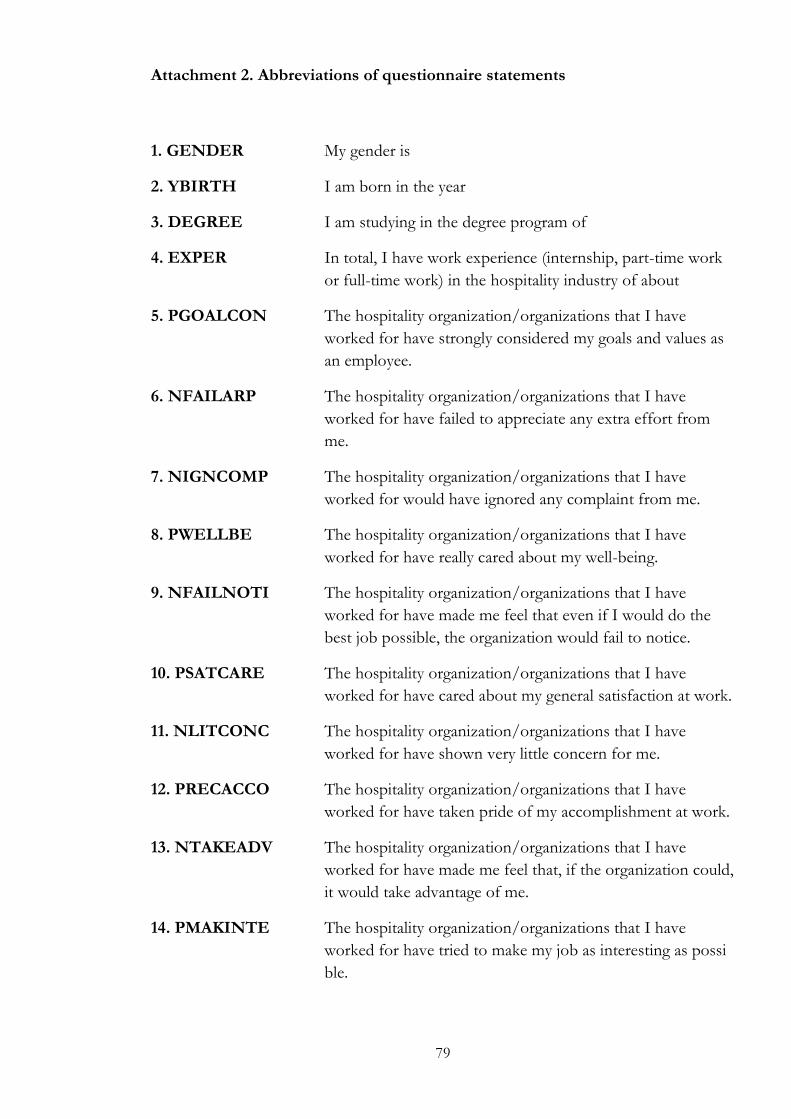
79
Attachment 2. Abbreviations of questionnaire statements
1. GENDER My gender is
2. YBIRTH I am born in the year
3. DEGREE I am studying in the degree program of
4. EXPER In total, I have work experience (internship, part-time work
or full-time work) in the hospitality industry of about
5. PGOALCON The hospitality organization/organizations that I have
worked for have strongly considered my goals and values as
an employee.
6. NFAILARP The hospitality organization/organizations that I have
worked for have failed to appreciate any extra effort from
me.
7. NIGNCOMP The hospitality organization/organizations that I have
worked for would have ignored any complaint from me.
8. PWELLBE The hospitality organization/organizations that I have
worked for have really cared about my well-being.
9. NFAILNOTI The hospitality organization/organizations that I have
worked for have made me feel that even if I would do the
best job possible, the organization would fail to notice.
10. PSATCARE The hospitality organization/organizations that I have
worked for have cared about my general satisfaction at work.
11. NLITCONC The hospitality organization/organizations that I have
worked for have shown very little concern for me.
12. PRECACCO The hospitality organization/organizations that I have
worked for have taken pride of my accomplishment at work.
13. NTAKEADV The hospitality organization/organizations that I have
worked for have made me feel that, if the organization could,
it would take advantage of me.
14. PMAKINTE The hospitality organization/organizations that I have
worked for have tried to make my job as interesting as possi
ble.
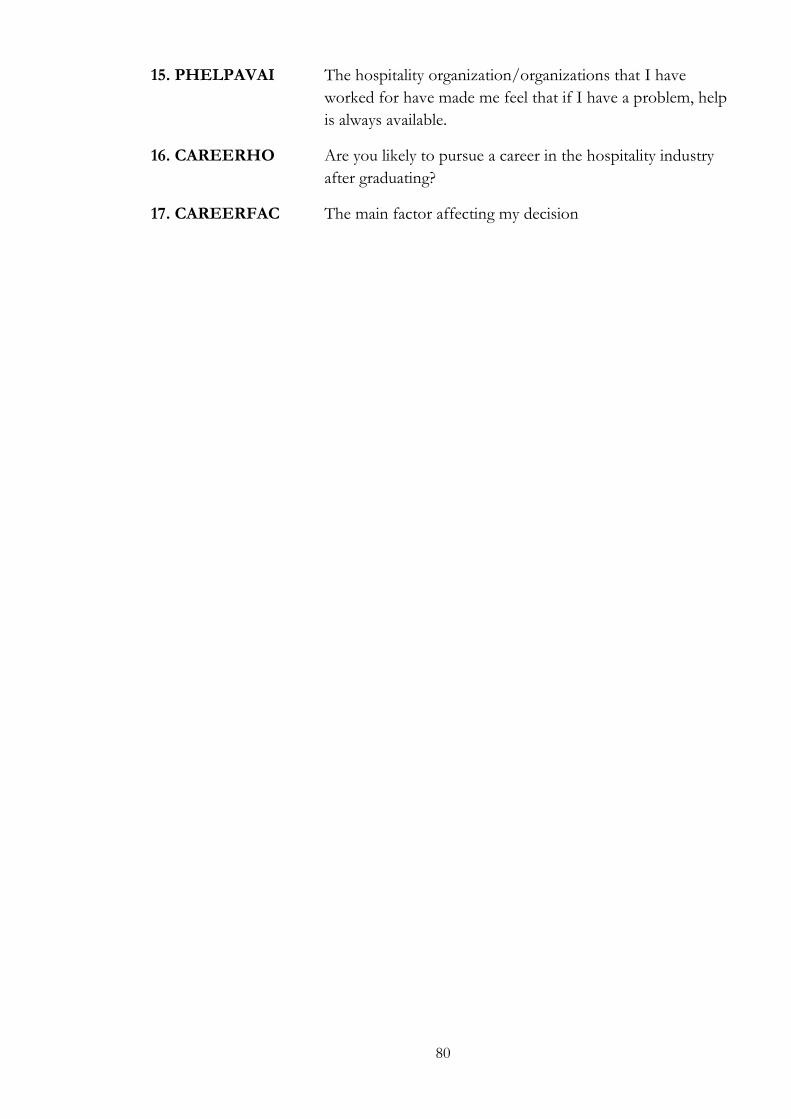
80
15. PHELPAVAI The hospitality organization/organizations that I have
worked for have made me feel that if I have a problem, help
is always available.
16. CAREERHO Are you likely to pursue a career in the hospitality industry
after graduating?
17. CAREERFAC The main factor affecting my decision