Embed Size (px)
Citation preview

Relationship Between Plasma Concentrationand Dose of Digoxin in Patients
With and Without Renal ImpairmentROBERT D. OKADA, M.D., W. DAVID HAGER, M.D.,
PENELOPE E. GRAVES, PH.D., MICHAEL MAYERSOHN, PH.D.,
DONALD G. PERRIER, PH.D., AND FRANK I. MARCUS, M.D.
SUMMARY The purpose of this study was to determine if there is a linear relationship between oral dosesof digoxin and various measurements of steady-state digoxin plasma concentration and urinary excretion inpatients with a wide range of renal function. Ten patients (mean age 58 years) with creatinine clearances > 50ml/min/1.73 m2 BSA (mean creatinine clearance 80 ml/min/1.73 m2 BSA) and nine patients (mean age 61years) with creatinine clearances < 50 ml/min/1.73 m2 BSA (mean creatinine clearance 20 ml/min/1.73 m2BSA) were given digoxin tablets orally at two or three different dose levels (dose range 0.0313-0.5 mg/day).After a dosing period equal to at least five half-lives, three to four consecutive daily digoxin plasma concen-trations were determined. Plasma concentrations and urinary digoxin excretion were measured during one 24-hour dosing interval at each dose level. Digoxin plasma and urine concentrations were determined in triplicateusing radioimmunoassay. Individual patient plots provided evidence of linearity for: digoxin 24-hour steady-state plasma concentration vs dose; digoxin 24-hour cumulative urinary excretion versus dose; and area underthe digoxin plasma concentration-time curve during a 24-hour dosing interval vs dose. Absolute values for thesevarious parameters indicated substantial interpatient variation probably due to patient differences in bothdigoxin absorption and digoxin total body clearance.
These results indicate that there is a linear relationship between digoxin plasma concentration and dose inpatients with normal and decreased renal function. This linearity is support for dose-independent phar-macokinetics of digoxin in man. We conclude from these data that a change in digoxin dose should result in a
proportional change in digoxin plasma concentration over the dose range examined.
THERE APPEARS TO BE a dose-response rela-tionship for digoxin. Further, it is desirable to obtainthe maximal total body dose consistent with minimalrisk of digitalis toxicity. Finally, it is generally agreedthat the incidence of digitalis toxicity increases sub-stantially when the serum digoxin level is above 2ng/ml in adults. These observations have led to anattempt to regulate serum digoxin levels to a rangesomewhat greater than 1 ng/ml, but less than 2 ng/mlfor most patients, with the realization that oc-casionally a patient may become toxic at these levelsand some patients may require a level in excess of 2ng/ml to adequately control ventricular response toatrial fibrillation or to achieve a needed inotropicresponse. A frequent problem arises when a digoxinlevel is found to be low on an initial dose of digoxin,since the exact increment in digoxin dose that is re-quired to raise the digoxin level to a desired value isunknown. Theoretically, there should be a linear
From the Section of Cardiology, Department of InternalMedicine, University of Arizona Health Sciences Center, the Tuc-son Veterans Administration Hospital, and the Ruth E. GoldingClinical Pharmacokinetics Laboratory, University of ArizonaCollege of Pharmacy, Tucson, Arizona.
Supported in part by grants from the Flinn Foundation, Phoenix,Arizona, and the Veterans Administration.
Address for reprints: Frank I. Marcus, M.D., Professor ofMedicine, Section of Cardiology, University of Arizona HealthSciences Center, Tucson, Arizona 85724.
Received May 31, 1978; revision accepted August 7, 1978.Circulation 58, No. 6, 1978.
relationship between increase in oral dose and increasein serum levels in the same patient if the following areconstant: rate and extent of absorption, serum half-life, volume of distribution, and dosing interval. It wasthe purpose of this study to define the relationshipbetween serum concentration and dose of digoxin inpatients with normal renal function and in patientswith varying degrees of renal function impairment.This relationship is of clinical importance, since thisinformation is needed in order to predict plasmadigoxin concentrations in response to changing digox-in doses.
Methods
The study population included 10 patients takingdigoxin for either mild congestive heart failure oratrial fibrillation who had creatinine clearances > 50ml/min/1.73 m2 BSA (group 1) (mean age 58 years)and nine patients with creatinine clearances < 50ml/min/ 1.73 m2 BSA (group 2) (mean age 61 years).The separation of patients into two groups based onarbitrary creatinine clearance values- was solely for thepurpose of assigning patients to one of two protocolsdesigned to avoid digoxin toxicity, since the final dataanalysis examined the entire spectrum of renal func-tion. Clinical data on the study patients are listed intable 1. Patients on a hemodialysis program, patientswith severe congestive heart failure as defined byelevated jugular venous pulsations, diffuse pulmonaryrales, an S3 gallop, and patients taking quinidine,
1196
by guest on July 5, 2018http://circ.ahajournals.org/
Dow
nloaded from

DIGOXIN AND RENAL FUNCTION/Okada et al.
TABLE 1. Clinical Data on Study Patients
Patient Wt (kg) Wt (kg) BSANo. Sex Age (actual) (ideal) (m2) Medications during study K+ Albumin
Group 1 (patients with creatinine clearance > 50 ml/min/1.73 m2 BSA)1 M 48 59.5 74.8 1.70 triamterene, hydrochlorothiazide 3.8 3.5
2 M 63 75.0 80.5 1.92 triamterene, hydrochlorothiazide 4.6 3.6
3 F 71 44.0 59.8 1.38 none 3.5 4.2
4 M 53 68.6 74.8 1.82 propranolol, isosorbide dinitrate, 4.2 4.2hydrochlorothiazide
5 M 63 57.7 69.4 1.62 furosemide, potassium chloride 4.5 3.9
6 M 65 74.1 74.8 1.88 none 4.5 4.3
7 M 71 79.5 81.6 2.00 isosorbide dinitrate, hydrochlorothiazide, 3.4 4.0potassium chloride
8 M 39 84.1 74.8 1.98 propranolol, triamterene 3.7 4.8
9 M 57 79.0 79.4 1.98 furosemide, potassium chloride, phenobarbital 4.6 3.9
10 M 50 93.2 78.9 2.10 isosorbide dinitrate, hydrochlorothiazide, 4.4 4.0potassium chloride
Group 2 (patients with creatinine clearances < 50 ml/min/1.73 m2 BSA)11 M 64 77.0 79.4 1.94 none 4.7 2.7
12 M 78 53.6 71.2 1.57 furosemide, potassium chloride 4.8 3.6
13 M 63 75.6 81.6 1.94 propranolol, furosemide, potassium chloride 4.2 3.0
14 M 58 63.6 81.6 1.78 propranolol, isosorbide dinitrate 4.7 4.3
15 M 58 83.6 87.1 2.10 prednisone, azathioprine, propranolol 4.5 3.2
16 M 60 48.2 71.9 1.55 warfarin 4.4 4.4
17 M 51 89.5 79.4 2.08 furosemide, methyldopa, potassium chloride 4.4 3.3
18 M 59 74.1 72.3 1.83 procainamide, propranolol, triamterene 4.5 3.8
19 M 58 73.6 79.8 1.92 propranolol, furosemide, potassium chloride, 4.1 2.0azathioprine
Abbreviations: Wt = weight (ideal weight determined from ref 4); BSA = body surface area; K+ = serum potassium concen-tration.
cholestyramine, kaolin-pectin, neomycin, or antacidswere excluded from the study. All patients had stablecreatinine clearance values for at least three monthsbefore the start of the study. Patients were selected inboth groups who had normal values for the followingtests: 1) liver function tests (serum glutamic ox-
aloacetic transaminase, alkaline phosphatase, totaland direct bilirubin, and serum glutamic pyruvictransaminase); 2) thyroid function tests (T3, T); and3) serum potassium. In addition, all patients had thefollowing obtained at the beginning of the study andbefore each new dosing period: 1) interview andphysical examination; 2) ECG with rhythm strip after5 minutes of rest and every 5 minutes during 30minutes; 3) creatinine clearance and serum creatinine;and 4) serum albumin. Creatinine concentration was
determined using a modification of the Techniconautoanalyzer adaption of the technique of Folin andWu, which increased the precision of the plasmacreatinine determination by expanding by threefoldthe 0-1 mg/100 ml reading range.' The within-dayprecision (coefficient of variation) for a 3 mg/dl con-
trol plasma solution was 2.07% (n = 10). The ac-
curacy was ± 0.015 mg/dl. The within-day precision
(coefficient of variation) for a 10 mg/dl control watersolution was 1.38% (n = 12). The accuracy was± 0.034 mg/dl. Informed consent and a chestradiograph were obtained at the beginning of thestudy.
Lanoxin brand digoxin (Burroughs Wellcome andCompany) from a single lot number (#330-W) wasused. In vitro dissolution tests performed byBurroughs Wellcome and Company on the study lotindicated that 85.5% of the dose dissolved within 1hour. Tablets were supplied as 0.0625 mg, 0.125 mg,and 0.25 mg tablets. Tablet counts were made toassure patient compliance. Blood samples were drawnfrom a forearm vein 24 hours after the preceding dose.A sample was obtained on each of three to four con-secutive days at each steady-state level. Half of theplasma from each sample was used for measurementof a digoxin plasma concentration for further doseadjustment, while the other half was frozen forsimultaneous analysis after the various doses had beengiven. Digoxin concentration was measured in plasmaand urine samples by radioimmunoassay as previouslydescribed.2 In the urine assay, 0.1 ml of concentrateddigoxin standard solution or 0.1 ml of urine was
1197
by guest on July 5, 2018http://circ.ahajournals.org/
Dow
nloaded from

VOL 58, No 6, DECEMBER 1978
diluted with 2 ml of phosphate-buffered saline. One-half-milliliter aliquots of each of these solutions wereassayed. All assays were performed in triplicate, andthe external standard channel ratio method was usedfor quench correction. All plasma and urine concen-trations for each patient were determined at the sametime using the appropriate standard curve. The assayprecision was determined by at least 20 measurementseach of three plasma pools of varying digoxin concen-trations. The coefficients of variation were: 9.1% at aplasma digoxin concentration of 0.55 ± 0.05 ng/ml,4.6% at a mean of 1.31 + 0.06 ng/ml, and 4.3% at amean of 2.66 ± 0.11 ng/ml. The between-day preci-sion measured on 12 different days was 3.4% with amean of 1.57 ± 0.05 ng/ml. The average minimaldetectable plasma concentration was 0.07 ng/ml. Thecoefficient of variation for the digoxin urine assay was3%, with a mean concentration of 46.5 ± 1.4 ng/ml.The patients were hospitalized to obtain a 24-hoururine collection and plasma samples were obtained at0, ½/2, 1, 2, 4, 6, 8, 12, and 24 hours during each dosinginterval at each steady-state. Blood samples were ob-tained from the arm using a small plastic cathetersealed on the distal end and flushed with heparin aftereach blood sample was withdrawn to prevent clotting.Patients in group 1 had plasma concentrationsmeasured after being given an equivalent maintenancedose of Lanoxin brand digoxin from the study lot for10 days. Subsequent doses were determined accordingto the initial steady-state plasma level as follows:The digoxin level on the initial maintenance dose is
shown in column 1. The subsequent digoxin doses areshown in columns 2 and 3.
A) Initial level between 0.6-0.7 ng/mlB) Initial level between 0.8-0.9 ng/mlC) Initial level between 1.0-1.4 ng/mlD) Initial level > 1.5 ng/ml
2
t dose by 50%1 dose by 50%~ dose by 50%
l dose by 75%(only if initialdose is > 0.25 mgqd)
3t dose byt dose byt dose byI dose by
100%100%
50%50%
Patients took the prescribed dose at each dosing in-terval for at least 10 days before digoxin level deter-minations. Patient compliance was determined by: 1)providing separate packages of tablets for each dosinginterval; 2) tablet counts; and 3) patient interviews ateach steady-state.
Patients in group 2 had the digoxin half-life deter-mined by measuring digoxin plasma concentrations inblood samples taken at 24, 48, 72 and 96 hours afteran initial oral dose of 0.5 mg of digoxin. Thesepatients were then started on a daily dose of 0.125 mgqd. This initial dose of digoxin, 0.125 mg each day,was selected for patients with renal failure based on
the studies of Doherty and associates.3 Subsequentdoses were determined according to the digoxin levelon the initial dose of 0.125 mg qd, as shown in column1. These doses are shown in columns 2 and 3.A
A) Initial level between 0.5-0.6 ng/mlB) Initial level between 0.7-0.9 ng/mlC) Initial level between 1.0-1.4 ng/mlD) Initial level .-1.5 ng/ml
20.25 mg qd0.0625 mg qd0.0625 mg qd0.0625 mg qd
30.375 mg qd0.25 mg qd0.1875 mg qd0.0625 mg qod
Patients took the prescribed dose at each dosinglevel for a period of time equal to at least five half-livesbefore digoxin level determinations. The sameprotocol for collection of blood and urine detailedabove for patients in group 1 was followed for patientsin group 2.The study was terminated if a digoxin level of 2
ng/ml or greater was associated with: 1) symptoms ofnausea, vomiting, diarrhea, depression, confusion,deliriums, neuralgias, alterations in color vision,scotomas, blurring, or shimmering, or 2) electrocar-diographic evidence of arrhythmias that could havebeen interpreted as evidence of toxicity, such as an in-crease in premature ventricular contractions, ven-tricular tachycardia, atrial tachycardia with block,Wenckebach phenomena, complete AV block or com-plex arrhythmias.
Renal clearance of digoxin was calculated accord-
ing to the formula Cldig = Au where Xu is the
24-hour urinary digoxin excretion during a dosinginterval at steady-state and AUC is area under theplasma concentration vs time curve (using the trape-zoidal rule) during a dosing interval at steady-state.Three patients with severe renal failure in group 2
who received a digoxin dose every 48 hours hadsteady-state plasma concentrations determined at 48hours just before the next dose. In these patients, theplasma concentration vs time curve after a single doseof digoxin at steady-state was constructed over 48hours and one-half of the value for the area under thecurve was recorded as the AUC.
ResultsGroup 1 consisted of 10 patientg with creatinine
clearances between 56-1 10 ml/min/1.73 m2 BSA(mean creatinine clearance 80 ml/min/1.73 m2 BSA).Group 2 consisted of nine patients with creatinineclearances between 7-38 ml/min/1.73 m2 BSA (meancreatinine clearance 20 ml/min/ 1.73 m2 BSA). Valuesfor creatinine clearance at the beginning and at theend of the study were not significantly different fromvalues obtained at least three months before the study.The study was terminated in the 20th patient after the
1198 CIRCULATION
by guest on July 5, 2018http://circ.ahajournals.org/
Dow
nloaded from

DIGOXIN AND RENAL FUNCTION/Okada et al.
FIGURE 1. Steady-state 24-hour plasmadigoxin concentration (ng/ml) plottedagainst daily digoxin dose corrected forbody weight (mg/day/kg body weight).Solid lines indicate patients from group Iwith creatinine clearances > 50 ml/minl1.73 m2 body surface area (BSA). Dashedlines indicate patients from group 2 withcreatinine clearances < SO ml/min/1.73 m2
BSA.
Digoxin Dose / Wt. (mg/day/kg body weight)
patient presented with rapidly deteriorating renalfunction requiring hemodialysis. It was not necessaryto terminate any patient study because of non-
compliance or digoxin toxicity. None of the patientshad a significant change in serum albumin level duringthe study.A plot of the steady-state 24-hour plasma digoxin
concentration vs digoxin dose (corrected for bodyweight) is presented in figure 1 for patients from groupand group 2. Normalization for body weight used
either actual body weight or ideal body weight,4whichever was the smaller value, since digoxin concen-tration is extremely low in adipose tissue. The lines foreach patient in both groups show a linear relationshipbetween steady-state plasma digoxin concentrationand digoxin dose. The data show steeper slopes for thepatients in group 2 with severe renal failure comparedwith the group 1 patients with normal or mildly im-paired renal function. However, within each groupthere is not a consistent relationship between thesteepness of the slope and the creatinine clearance.The results of the study for patients in groups 1 and
2 are presented in table 2. Steady-state 24-hourplasma digoxin concentration (C) has been nor-malized for dose of digoxin (XI) and for body weight
(wt) (i.e., normalized C = C/X°/wt). The same nor-
malization procedure has been used for steady-statearea under the plasma concentration vs time curve(AUC; normalized AUC = AUC/XO/wt).
Plots similar to figure 1 relating 24-hour urinarydigoxin excretion to dose, and area under the curve todose demonstrated a linear relationship between Xuand XO and between AUC and XI.
Figure 2 presents the relationship between the meanratio of digoxin steady-state plasma concentration todigoxin dose (C/XO) and the mean creatinineclearance corrected for body surface area (Clcrml/min/ 1.73 m2 BSA) for each patient. These datahave been fitted by nonlinear regression analysis,using a computer program,5 to an equation which has
the form, y = a + b'where "a" and "b" are con-
stants, "x" represents creatinine clearance, and "y"represents the ratio of C/XO. The solid curve in figure2 represents the line which best fits these data.Estimates of the constants "a" and "b" may be ob-tained from a plot of XO/C vs creatinine clearance. Aplot of the latter two parameters gives a straight linerelationship.
E1-.
cJ
0CZ
cirU
cm
C:0
C)
0C)'5E0~
Va-
1199
by guest on July 5, 2018http://circ.ahajournals.org/
Dow
nloaded from

VOL 58, No 6, DECEMBER 1978
TABLE 2. Laboratory Data on Study Patients
Cldig ClerAUC/XO/Wt (ml/min/ (ml/min/
Patient D)ose X° C (ng/ml) C/X°/Wt (X10-6) Xu (X10-6) 1.73 m2 BSA) 1.73 m2 BSA) TTPn10. (mg) mean SD (ml 1kg-1) (,g/24 hr) (hr/ml/kg) mean SD mean SD (min)
Group 1 (Patients with Cler > 50 ml/min/1.73 m2 BSA)1 0.125
0.2502 0.125
0.2500.375
3 0.1250.18750.250
4 0.2500.3750.500
5 0.1250.2500.375
6 0.2500.3750.500
7 0.1250.2500.375
8 0.1250.2500.500
9 0.1250.2500.375
10 0.2500.3750.4375
0.48 0.100.99 0.03
0.24 0.09
0.55 s 0.150.8 1) 0.170.37 0.03
0.47 + 0.050.68 0.05
0.53 0.04
0.72 0.060.86 0.08
0.44 0.06
0.82 i 0.061.14 0.15
0.62 i 0.010.86 0.150.97 0.05
0.38 A 0.05
0.88 i 0.081.12 0.02
0.36 0.02
0.71 0.13
1.44 0.110.48 0.04
1.04 - 0.04
1.61 - 0.080.49 - 0.09
0.62 0.140.85 0.16
0.06450.06660.02560.02930.03020.06730.05700.06180.03090.02800.02510.06100.05680.05270.03350.03090.02610.03820.04430.03760.03850.03800.03850.04860.05270.05430.02480.02090.0145
65
91
5086141487885105*
16859
1131549013721332907568
16232964*
189102137*
1.441.750.740.710.722.342.092.000.820.760.851.731.611.701.010.830.831.131.280.981.061.061.161.171.421.630.590.66ND
81 -31 68 -4.2 240
240240
103 5.9 73 - 5.6 240
120240
84-
8.7 102-
9.5 120
12060
105 - 19.8 71 + 16.9 60
4560
82 6.2 60 +4.6 60
60120
91 16 85 1.5 30
60120
46 i 7.8 56 3.5 120
12060
109 9 110 6.8 60
6060
69 16.3 81 3.5 12060120
108 + 16.9 84 i 14.8 60ND
Group 2 (Patients with Clcr < 50 ml/min/1.73 m2 BSA)11 0.0625
0.187512 0.0625
0.12500.1875
13 0.03130.06250.1250
14 0.06250.12500.2500
15 0.06250.12560.250
16 0.03130.0625
17 0.06250.09380.1250
18 0.12500.2500
19 0.12500.25000.3750
0.57 0.06
2.12 + 0.010.44 0.05
1.09 + 0.211.34 0.16
0.54 i 0.110.89 0.19
1.50 i 0.240.15 0.04
0.34 + 0.030.95 i 0.010.41 0.010.61 + 0.131.00 0.130.60 0.06
1.27 + 0.210.57 0.03
0.69 0.01
1.09 i 0.150.69 0.03
1.65 0.18
0.47 0.11
0.72 0.15
1.06 0.03
0.1180.1460.1300.1600.1310.2310.1900.1600.0380.0430.0590.0780.0580.0480.3980.4210.1150.0930.1100.0760.0910.0510.0390.038
9*
91527*
15*
13325936*
83
2112*
3556110*
51121
3.313.363.303.123.342.962.803.771.261.601.711.951.531.149.50
10.473.053.062.962.102.591.581.211.37
8 =0.8 7 0.4 60
60240
14 1.1 8 0.5 60
135180
17 - 1.1 11 0.8 12060120
39 3.8 24 1.2 60
6060
48 0.9 37 2.1 60
6012 - 0.8 10 - 2.1 120
120120
14 3.5 11 0.7 120120
39 =2.8 38 2.1 606090
42 9.1 37 =8.5 90
60
*Incomplete urine collection.Abbreviations: X° = daily digoxin dose; C = steady-state 24-hour plasma digoxin concentration (mean of three or four
determinations); Xu = 24-hour urinary digoxin excretion after a single dose at steady-state; AUC = area under plasmaconcentration vs time curve after a single dose at steady-state; Cldig = renal clearance of digoxin normalized for 1.73 squaremeters of body surface area (mean of three values at each dose); Clcr = creatinine clearance normalized for 1.73 square metersof body surface area (mean of three values at each dose); TTP = time to peak digoxin plasma concentration after oral dose;ND = not done.
l1200 CIRCULATION
by guest on July 5, 2018http://circ.ahajournals.org/
Dow
nloaded from

DIGOXIN AND RENAL FUNCTION/Okada et al.
A Group I. Group 11
A A
A A
A
FIGURE 2. Steady-state 24-hour plasmadigoxin concentration (C) normalized fordigoxin dose (X) vs creatinine clearance(Clcr) corrected for 1.73 m2 body surfacearea. The solid line represents the nonlinearregression fit of the data. The equation ofthe best fit line for these data is as follows:
I(ax + b) where a = 4.18 X10³
min/1.73 mi2; b = 4.8 X 10⁴ ml; x = creati-nine clearance in ml/min/l.73 m2.
20 40 60 80 100 120
Clcr (ml/min/1.73m2)
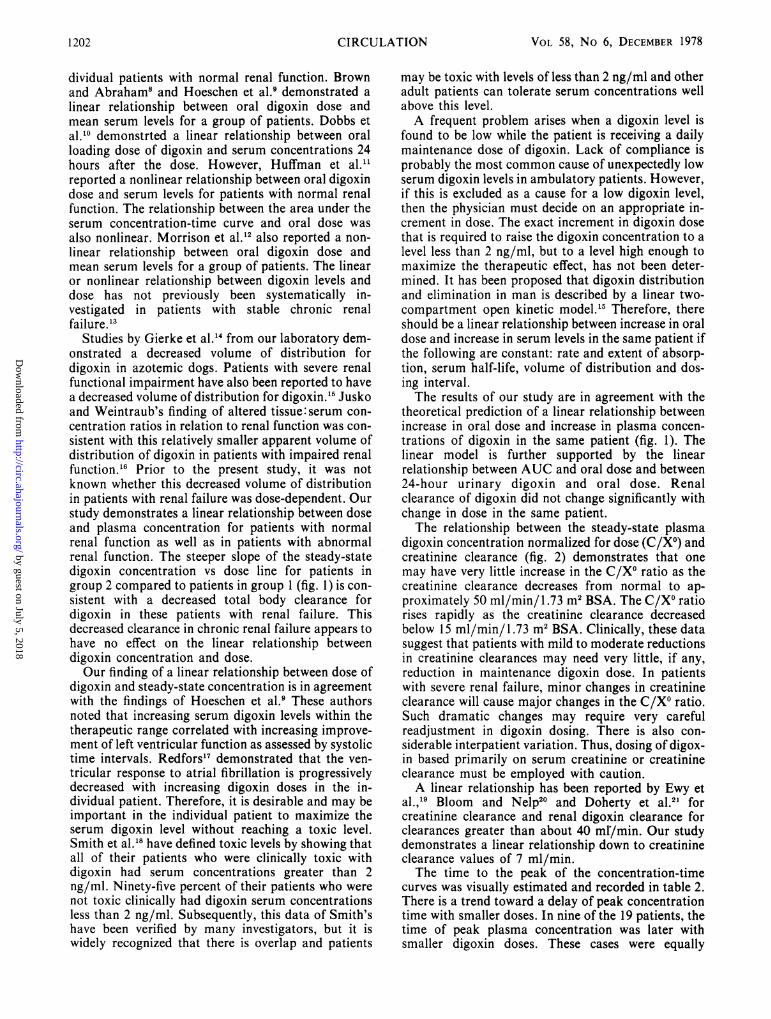
Figure 3 presents the relationship between Clcr(ml/min/1.73 m2 BSA) and the renal digoxinclearance Cldig (ml/min/1.73 m2 BSA). The formulafor the regression equation is y = (0.99)X + 7.36 witha correlation coefficient of r = 0.93. The correlationbetween the percent of a digoxin dose excreted in 24hours and creatinine clearance is not as good,r = 0.75. The square of the correlation coefficient is0.56. This means that 44% of the variation in urinarydigoxin excretion is not accounted for by creatinineclearance. This poorer correlation can be partly ex-
A Group I* Group 11
A v
AAA
plained by interpatient variability in digoxin absorp-tion and metabolism patterns. This demonstrates thelimitation of creatinine clearance in predicting the ex-cretion of digoxin.
DiscussionThere have been conflicting reports regarding the
linear or nonlinear relationship between digoxin levelsand dose. Redfors et al.,6' found a linear relationshipbetween dose and serum drug levels of digoxin in in-
A
A
A
A
0
Y = (.99)X + 7.36std error .097r= .93
FIGURE 3. Renal clearance of digoxin(Cldig) vs creatinine clearance (Clcr). Regres-sion equation y = (0.99)X + 7.36, withr = 0.93.
.20-
18-
.(0
0x7-
E0
0
cg-
16-
14-
12-
10-
8-
6-
4-
2-
.
0
0
UI0
-D
Er--
EE/
60
10
0-0 10 20 30 40 50 60 70 80 90 100 110
C0cr (ml/min/1.73m2)
r I
1201
by guest on July 5, 2018http://circ.ahajournals.org/
Dow
nloaded from
VOL 58, No 6, DECEMBER 1978
dividual patients with normal renal function. Brownand Abraham' and Hoeschen et al.9 demonstrated alinear relationship between oral digoxin dose andmean serum levels for a group of patients. Dobbs etal.10 demonstrted a linear relationship between oralloading dose of digoxin and serum concentrations 24hours after the dose. However, Huffman et al.11reported a nonlinear relationship between oral digoxindose and serum levels for patients with normal renalfunction. The relationship between the area under theserum concentration-time curve and oral dose wasalso nonlinear. Morrison et al.12 also reported a non-linear relationship between oral digoxin dose andmean serum levels for a group of patients. The linearor nonlinear relationship between digoxin levels anddose has not previously been systematically in-vestigated in patients with stable chronic renalfailure.'3
Studies by Gierke et al.'4 from our laboratory dem-onstrated a decreased volume of distribution fordigoxin in azotemic dogs. Patients with severe renalfunctional impairment have also been reported to havea decreased volume of distribution for digoxin.'5 Juskoand Weintraub's finding of altered tissue: serum con-centration ratios in relation to renal function was con-sistent with this relatively smaller apparent volume ofdistribution of digoxin in patients with impaired renalfunction.'6 Prior to the present study, it was notknown whether this decreased volume of distributionin patients with renal failure was dose-dependent. Ourstudy demonstrates a linear relationship between doseand plasma concentration for patients with normalrenal function as well as in patients with abnormalrenal function. The steeper slope of the steady-statedigoxin concentration vs dose line for patients ingroup 2 compared to patients in group 1 (fig. 1) is con-sistent with a decreased total body clearance fordigoxin in these patients with renal failure. Thisdecreased clearance in chronic renal failure appears tohave no effect on the linear relationship betweendigoxin concentration and dose.Our finding of a linear relationship between dose of
digoxin and steady-state concentration is in agreementwith the findings of Hoeschen et al.9 These authorsnoted that increasing serum digoxin levels within thetherapeutic range correlated with increasing improve-ment of left ventricular function as assessed by systolictime intervals. Redfors17 demonstrated that the ven-tricular response to atrial fibrillation is progressivelydecreased with increasing digoxin doses in the in-dividual patient. Therefore, it is desirable and may beimportant in the individual patient to maximize theserum digoxin level without reaching a toxic level.Smith et al.'8 have defined toxic levels by showing thatall of their patients who were clinically toxic withdigoxin had serum concentrations greater than 2ng/ml. Ninety-five percent of their patients who werenot toxic clinically had digoxin serum concentrationsless than 2 ng/ml. Subsequently, this data of Smith'shave been verified by many investigators, but it iswidely recognized that there is overlap and patients
may be toxic with levels of less than 2 ng/ml and otheradult patients can tolerate serum concentrations wellabove this level.A frequent problem arises when a digoxin level is
found to be low while the patient is receiving a dailymaintenance dose of digoxin. Lack of compliance isprobably the most common cause of unexpectedly lowserum digoxin levels in ambulatory patients. However,if this is excluded as a cause for a low digoxin level,then the physician must decide on an appropriate in-crement in dose. The exact increment in digoxin dosethat is required to raise the digoxin concentration to alevel less than 2 ng/ml, but to a level high enough tomaximize the therapeutic effect, has not been deter-mined. It has been proposed that digoxin distributionand elimination in man is described by a linear two-compartment open kinetic model." Therefore, thereshould be a linear relationship between increase in oraldose and increase in serum levels in the same patient ifthe following are constant: rate and extent of absorp-tion, serum half-life, volume of distribution and dos-ing interval.The results of our study are in agreement with the
theoretical prediction of a linear relationship betweenincrease in oral dose and increase in plasma concen-trations of digoxin in the same patient (fig. 1). Thelinear model is further supported by the linearrelationship between AUC and oral dose and between24-hour urinary digoxin and oral dose. Renalclearance of digoxin did not change significantly withchange in dose in the same patient.The relationship between the steady-state plasma
digoxin concentration normalized for dose (C/XO) andcreatinine clearance (fig. 2) demonstrates that onemay have very little increase in the C/XO ratio as thecreatinine clearance decreases from normal to ap-proximately 50 ml/min/ 1.73 m2 BSA. The C/XO ratiorises rapidly as the creatinine clearance decreasedbelow 15 ml/min/1.73 ma BSA. Clinically, these datasuggest that patients with mild to moderate reductionsin creatinine clearances may need very little, if any,reduction in maintenance digoxin dose. In patientswith severe renal failure, minor changes in creatinineclearance will cause major changes in the C/X° ratio.Such dramatic changes may require very carefulreadjustment in digoxin dosing. There is also con-siderable interpatient variation. Thus, dosing of digox-in based primarily on serum creatinine or creatinineclearance must be employed with caution.A linear relationship has been reported by Ewy et
al.,'9 Bloom and Nelp20 and Doherty et al.2' forcreatinine clearance and renal digoxin clearance forclearances greater than about 40 mr/min. Our studydemonstrates a linear relationship down to creatinineclearance values of 7 ml/min.The time to the peak of the concentration-time
curves was visually estimated and recorded in table 2.There is a trend toward a delay of peak concentrationtime with smaller doses. In nine of the 19 patients, thetime of peak plasma concentration was later withsmaller digoxin doses. These cases were equally
1 202 CIRCULATION
by guest on July 5, 2018http://circ.ahajournals.org/
Dow
nloaded from

DIGOXIN AND RENAL FUNCTION/Okada et al.
divided between the two groups. In eight patients,there was no change in the time to peak concentration.In two patients, 1 and 6, there was an inconsistentrelationship between time to peak concentration anddose. The reason for this apparent shortening of thetime to peak concentration after an oral dose withhigher doses in some patients is unclear and requiresfurther study.We have demonstrated a linear relationship
between the steady-state plasma digoxin concentra-tion and increasing doses of digoxin for patients withvarying degrees of renal function. This finding of alinear relationship can be clinically useful in predictingdigoxin level response to changing digoxin dosage. Aserum digoxin level of about 1.5 ng/ml should beassociated with a therapeutic effect without ap-preciable incidence of toxicity in the adult. Therefore,if a patient has a plasma or serum concentration ofdigoxin of 0.75 ng/ml, the physician can recommendthat the patient double the dose of digoxin to achievethe desired level. The optimal serum concentrationwill vary, depending on the clinical circumstance, anda level of 1.5 ng/ml is suggested only as a guide totherapy. However, in order to apply this dose concen-tration relationship properly and safely to a clinicalsituation, care must be taken to assure the accuracy ofthe initial digoxin level determination. Samples mustbe obtained from the patient at steady-state 24 hoursafter the previous dose. At least two determinationson successive days should be performed to assurereproducibility. Used in this fashion, changes in digox-in dosing based on the linear relationshipsdemonstrated by this study should decrease thelikelihood of digoxin toxicity.
AcknowledgmentsThe authors gratefully acknowledge the secretarial assistance of
Miss Ann C. Vallefuoco and the technical assistance of AnneGassmann, R.N., Kathy Bingham, R.N., and Virginia Gameros,R.N. We also thank Dr. Ronald Cresswell of the BurroughsWellcome Company, Research Triangle Park, N.C., for donatingthe digoxin used in this study.
References1. Folin 0, Wu H: A system of blood analysis. J Biol Chem 38:
81, 19192. Marcus Fl, Ryan JN, Stafford MG: The reactivity of
derivatives of digoxin and digitoxin as measured by Na-K-ATPase displacement assay and by radioimmunoassay. J LabClin Med 85: 610, 1975
3. Doherty JE, Flanagan WJ, Perkins WH, Ackerman GL:Studies with tritiated digoxin in anephric human subjects. Cir-culation 35: 298, 1967
4. Diem K, Lentener C: Documenta geigy scientific tables. Basel,Switzerland, JR Geigy, SA, 1970, p 711
5. Metzler CM: NONLIN: a computer program for parameter es-timation in nonlinear situations. Kalamazoo, Michigan, Up-john Co, Nov 25, 1969, Technical Report 7292/69/7292/005
6. Redfors A: Plasma digoxin concentration: its relation to digox-in dosage and clinical effects in patients with atrial fibrillation.Br Heart J 34: 383, 1972
7. Bertler A, Redfors A: Plasma levels of digoxin in relation totoxicity. Acta Pharmacol Toxicol 8: 281, 1971
8. Brown DD, Abraham GN: Plasma digoxin levels in normalhuman volunteers following chronic oral and intramuscular ad-ministration. J Lab Clin Med 83: 201, 1973
9. Hoeschen RJ, Cuddy TE: Dose response relation betweentherapeutic levels of serum digoxin and systolic time intervals.Am J Cardiol 35: 469, 1975
10. Dobbs SM, Parker J, Rodgers EM: Digoxin: linearity betweendose and serum concentration. Br J Clin Pharmacol 3: 940,1976
11. Huffman DH, Manion CV, Azarnoff DL: Absorption of digox-in from different oral preparations in normal subjects duringsteady-state. Clin Pharmacol Ther 16: 310, 1974
12. Morrison J, Killip T, Stason WB: Serum digoxin levels inpatients undergoing cardiopulmonary bypass. Circulation 42(suppl III): 111-110, 1970
13. Gault MH, Jeffrey JR, Chirito E, Ward LL: Studies of digoxindosage, kinetics, and serum concentrations in renal failure andreview of the literature. Nephron 17: 161, 1976
14. Gierke KD, Perrier D, Mayersohn M, Marcus FI: Digoxin dis-position kinetics in dogs before and during azotemia. J Phar-macol Exper Ther 205: 459, 1978
15. Reuning RH, Sams RA, Notari RE: Role of pharmacokineticsin drug dosage adjustment. Pharmacologic effect, kinetics, andapparent volume of distribution of digoxin. J Clin Pharmacol13: 127, 1973
16. Jusko WJ, Weintruab M: Myocardial distribution of digoxinand renal failure. Clin Pharmacol Ther 16: 449, 1974
17. Redfors A: Digoxin dosage and ventricular rate at rest and ex-ercise in patients with atrial fibrillation. Acta Med Scand 190:321, 1971
18. Smith TW, Butler VP, Haber E: Determination of therapeuticand toxic serum digoxin concentrations by radioimmunoassay.N Engl J Med 281: 1212, 1969
19. Ewy GA, Kapadia GG, Yao L, Lullin M, Marcus Fl: Digoxinmetabolism in the elderly. Circulation 39: 449, 1969
20. Bloom PM, Nelp WB: Relationship of the excretion of triateddigoxin to renal function. Am J Med Sci 39: 133, 1966
21. Doherty JE, Flanigan WJ, Dalrymple GV, Gammill J,Sherwood I: Tritiated digoxin XVII, excretion and turnovertimes in normal donors before and after nephrectomy and inpaired recipients of the kidney after transplantation. Am J Car-diol 29: 470, 1972
1203
by guest on July 5, 2018http://circ.ahajournals.org/
Dow
nloaded from

R D Okada, W D Hager, P E Graves, M Mayersohn, D G Perrier and F I Marcuswithout renal impairment.
Relationship between plasma concentration and dose of digoxin in patients with and
Print ISSN: 0009-7322. Online ISSN: 1524-4539 Copyright © 1978 American Heart Association, Inc. All rights reserved.
is published by the American Heart Association, 7272 Greenville Avenue, Dallas, TX 75231Circulation doi: 10.1161/01.CIR.58.6.1196
1978;58:1196-1203Circulation.
http://circ.ahajournals.org/content/58/6/1196the World Wide Web at:
The online version of this article, along with updated information and services, is located on
http://circ.ahajournals.org//subscriptions/
is online at: Circulation Information about subscribing to Subscriptions:
http://www.lww.com/reprints Information about reprints can be found online at: Reprints:
document. Permissions and Rights Question and Answer information about this process is available in the
located, click Request Permissions in the middle column of the Web page under Services. FurtherEditorial Office. Once the online version of the published article for which permission is being requested is
can be obtained via RightsLink, a service of the Copyright Clearance Center, not theCirculationpublished in Requests for permissions to reproduce figures, tables, or portions of articles originallyPermissions:
by guest on July 5, 2018http://circ.ahajournals.org/
Dow
nloaded from