Embed Size (px)
Citation preview
RELATIONSHIP BETWEEN POP MUSIC AND LYRICS
1
Note:
Thisisanacceptedmanuscript(pre-printversion)ofanarticlepublishedinPsychologyofMusiconlineon11January2020,availableonlineat:https://journals.sagepub.com/doi/full/10.1177/0305735619896409.
Thispaperisnotthecopyofrecordandmaynotexactlyreplicatetheauthoritativedocumentpublishedinthejournal.Pleasedonotcopyorcitewithoutauthors’permission.Thefinalarticleisavailable,uponpublication,at10.1177/0305735619896409.Youmaydownloadthepublishedversiondirectlyfromthejournal(homepage:https://journals.sagepub.com/home/pom).
Publishedcitation:
North,A.C.,Krause,A.E.,&Ritchie,D.(2020).Therelationshipbetweenpopmusicandlyrics:AcomputerizedcontentanalysisoftheUnitedKingdom’sweeklytop5singles,1999-2013.PsychologyofMusic,advancedonlinepublication.doi:10.1177/0305735619896409
RELATIONSHIP BETWEEN POP MUSIC AND LYRICS
2
The relationship between pop music and lyrics:
A computerized content analysis of the United Kingdom’s weekly top 5 singles, 1999-2013
Adrian C North School of Psychology, Curtin University,
GPO Box U1987, Perth, WA 6845 Australia, [email protected].
Amanda E Krause Melbourne Conservatorium of Music, The University of Melbourne,
Royal Parade Gate 12, Parkville, VIC, Australia, [email protected]
David Ritchie Vector Trustees Limited, PO Box 421, Richmond House, Ann’s Place, St Peter Port,
Guernsey, GY1 3WP, United Kingdom, [email protected]
RELATIONSHIP BETWEEN POP MUSIC AND LYRICS
3
The relationship between pop music and lyrics: A computerized content
analysis of the United Kingdom’s weekly top 5 singles, 1999-2013
Abstract
The majority of research on music aesthetics treats music and lyrics as discrete entities,
despite the artistic imperative that they should relate to one another in some way. The
present research computer-analyzed both the music and lyrics of the songs to have
reached the weekly United Kingdom top 5 singles chart from January 1999-December
2013 (N = 1,414). The findings indicate that the typicality of a given set of lyrics relative
to the corpus as a whole was associated with their popularity; that there were numerous
associations between each of six mood scores assigned to the music and various aspects
of the lyrics (e.g., passionate music was associated with lyrics addressing hardship and
less concern with precise numerical terms); and that the relative contribution of the lyrics
and music to overall popularity varied according to the means by which these were
operationalized so that, for instance, music and lyrics contributed equally to explaining
peak chart position, whereas music outperformed lyrics in explaining the number of
weeks spent on the top 5. Pop music and its lyrics are related to one another, and the
relationship can be explained to some extent via existing concepts in the aesthetics
literature.
Keywords: music, lyrics, typicality, aesthetics, mood
RELATIONSHIP BETWEEN POP MUSIC AND LYRICS
4
The relationship between pop music and lyrics:
A computerized content analysis of the United Kingdom weekly top 5 singles, 1999-2013
Recent advances in desktop computing power have facilitated a number of recent
studies concerning content analyses of music or the accompanying lyrics based on an
entire or large sample from a complete corpus. The great majority of this work (and other
research on music aesthetics) has treated the music per se and accompanying lyrics as
two discrete entities: in some cases this has lead experimental researchers to employ only
instrumental music, or to researchers in a number of specific fields simply neglecting the
possible relationship between music and lyrics. This seems to lack ecological validity,
particularly in the case of popular genres that usually do feature lyrics, and denies the
artistic reality that lyrics and music are often written in the belief that they in some way
complement one another, and that the lyrics must presumably therefore contribute to the
popularity of the track in question. The present research attempts to address this by
directly considering various relationships between music and accompanying lyrics across
all those 1,414 songs to have reached the United Kingdom top 5 singles chart between
1999 and 2013, and considering these from an explicitly psychological perspective.
Specifically, we aimed to identify whether the typicality of the lyrics can predict
popularity (as typicality can predict the popularity of music), to map the relationship
between musical and lyrical content and so determine what kinds of music tend to be
paired with what kinds of lyrics, and to assess the relative contribution of music and
lyrics to the popularity of a given track.
RELATIONSHIP BETWEEN POP MUSIC AND LYRICS
5
While the nascency of corpus-level work concerning music aesthetics means that
the literature is inevitably disparate, three themes have emerged to date. These concern
respectively content analyses that attempt to illustrate the psychological features of a
given musical corpus (e.g., de Clercq & Temperley, 2011; Czechowski, Miranda, &
Sylvestre, 2016; Everett, 1999; Gauvin, 2015; Kreyer & Mukherjee, 2009; Jackson &
Padgett, 1982; Petrie, Pennebaker, & Silverstein, 2011; Van Sickel, 2005); attempts to
predict the commercial success of music based on characteristics of the music and
musicians (e.g., Bradlow & Fader, 2001; Giles, 2007; Hong, 2012; Pettijohn II & Ahmed,
2010); and consideration of the relationship between particularly pop music and various
social psychological and socioeconomic indicators (DeWall, Pond, Campbell, & Twenge,
2011; McAuslan & Waung, 2018; Neuman, Perlovsky, Cohen, & Livshits, 2016;
Pettijohn II, Eastman, & Richard, 2012; Pettijohn II & Sacco Jr., 2009; Zullow, 1991).
In addition to the disparate nature of the subject matter of this existing work there
is a corresponding lack of theoretical coherence between these studies. However, some
indication of a possible fruitful theoretical approach is provided by a much larger body of
corpus-level research carried out by Dean Simonton. He has demonstrated that the extent
to which art works are original or typical of the corpus as a whole has implications for
various aesthetic outcomes (see review by Simonton, 1997). Much of Simonton’s work
concerning specifically music has focused on the concept of melodic originality, which
was operationalized as the statistical probability of the transitions between notes within a
given musical theme relative to the preponderance of these transitions across the corpus.
Simonton (1980), for example, found increasing levels of melodic originality over the
lifespan of 479 composers. The same research also found evidence of what he termed an
RELATIONSHIP BETWEEN POP MUSIC AND LYRICS
6
‘inverted backwards-J’ shaped relationship between melodic originality of the 15,618
themes by these composers and their popularity. In a similar vein, Hass’s (2016) analysis
of 500 early American popular songs found that melodic originality increased between
1916 and 1960, and that there was a curvilinear relationship between melodic originality
and the popularity of the music.
A reasonable body of experimental evidence published from the 1980s onwards
has taken a more theoretical approach in similarly indicating that positive aesthetic
responses are predicted by the extent to which the artistic works in question are typical of
the class from which they are drawn. Although various authors express this in slightly
different ways, the common thread to all is that typical instances are more easily
classified, and that it is this ease of classification that drives positive responses. In
support of this, Martindale and Moore’s (1989) experimental research showed that
typicality accounted for 51% of the variance in liking for music. On a larger scale, North,
Krause, Sheridan, and Ritchie (2017) analyzed a larger database (from which a subset is
employed here) showing that, among 143,353 pieces that had achieved any commercial
success in the United Kingdom, there was a positive relationship between the extent to
which each was typical of the corpus and the duration of commercial success. It is
notable, moreover, that these findings parallel other recent research by Nunes, Ordanini,
and Valsesia (2015) which presented experimental evidence that lyrics containing
repetition can be processed more fluently; and corpus level findings that such lyrics are
more likely to reach number 1 positions in music sales charts, and do so more quickly.
Therefore, the first hypothesis of the present research was that the typicality of any given
RELATIONSHIP BETWEEN POP MUSIC AND LYRICS
7
piece of music or set of lyrics relative to the corpus as a whole should each predict
popularity, such that higher typicality is associated with higher popularity.
Second, numerous autobiographies and similar non-empirical sources describe
attempts by musicians to compose lyrics and music that complement one another by
expressing similar themes and moods (although see Simonton, 2000). The notion here is
that musicians are subject to an artistic imperative to ensure that music and any lyrics in
some way align with one another in order to facilitate communication, although we are
not aware of any research on this. To provide just one well-known anecdotal example,
however, John Lennon and Paul McCartney (The Beatles, 2000) have described how
their early commercial releases (e.g., ‘From Me to You’) deliberately matched the
relatively simple musical structures with lyrics focussing on first person pronouns, with
the goal of maximizing immediate and direct communication with the listener. Given
this, Hypothesis 2 was simply that we might also expect to find a positive relationship
between the mood evoked by the music and the subject matter and mood evoked by the
lyrics (across a large number of specific variables). Confirmation of such would,
therefore, provide an initial mapping of the relationship between the content of music and
lyrics.
The present research also tests a third hypothesis concerning the relative
contribution of music and lyrics in predicting popularity, given that much of the literature
on music aesthetics explicitly ignores lyrics. Simonton (2000) considered this issue in the
case of opera, using 911 works by 59 composers. He argued that although there are well-
known exemplars of composers and librettists receiving equal credit for their work (e.g.,
Gilbert and Sullivan), opera audiences are often content to attend performances sung in a
RELATIONSHIP BETWEEN POP MUSIC AND LYRICS
8
foreign language that would be understood by presumably only a (potentially small)
proportion of them. In apparent concordance with this, Simonton showed that almost half
of the variance in the degree of aesthetic success of the operas he considered could be
explained by the identity of the composer, and that composers exerted a greater influence
on the success of the work than do librettists. However, although there is no reason to
doubt this conclusion in the context of the corpus of opera, music sales charts in many
countries are dominated typically by lyrics sung in the predominant language(s) of the
country in question, implying that these lyrics are important to listeners; and it seems
reasonable to make the working assumption that lyrics are so prevalent in best-selling
music partly because they provide an opportunity for direct and specific communication.
Indeed, there is a small literature which explicitly indicates that poetry can, of course,
elicit strong emotional responses and that these are analogous to responses to music (e.g.,
Zeman, Milton, Smith, & Rylance, 2013). As such, we might expect that when lyrics are
(typically) in the predominant language of the audience so the greater scope there is for
these to influence the popularity of the song in question. In short, the predominance of
music over lyrics in predicting popularity may not apply (at least as strongly as in opera)
to pop music sales charts, and the present dataset presents an opportunity to test this. As
such, Hypothesis 3a was that aspects of the music per se might predict popularity better
than do aspects of the lyrics, consistent with Simonton’s findings concerning opera;
although Hypothesis 3b was that this relationship might not be found, or even reversed, in
the pop music considered here, such that lyrics predict popularity better than does music.
These issues were investigated using a database of 1,414 pieces of music,
representing all those to have reached the top 5 on the weekly United Kingdom singles
RELATIONSHIP BETWEEN POP MUSIC AND LYRICS
9
sales charts between 1999 and 2013. Both the lyrics and the music were computer-
analyzed according to a number of variables, and in the case of H1 and H3 were
compared against four measures of popularity, given corresponding evidence in the
experimental aesthetics literature showing that different measures of ‘hedonic tone’ have
different relationships with various predictor variables (e.g., Marin et al., 2016).
Method
The present study employed a dataset featuring all those individual songs that
reached the weekly top 5 singles chart positions in the United Kingdom from January
1999 through to December 2013. The top 5 (rather than, for instance, the top 10) was
selected as the cut off simply to manage the workload associated with data collection.
While previous research has addressed the song lyrics in order to investigate different
hypotheses (e.g., Krause & North, 2017, 2019; North, Krause, Kane, & Sheridan, 2018),
the present study combines these with variables concerning the associated music per se
(detailed below). Chart data was sourced from www.officialcharts.com, and reflects the
charts used by the British Broadcasting Corporation (BBC): throughout the period in
question, the BBC had the majority of radio audience share, and the chart formed the
basis of the playlist employed in daytime music programming (by both the BBC and also
a large number of commercial radio competitors). Note that although 1,565 songs reached
positions 1-5 on the weekly UK charts from 1999 to 2013, data concerning both the lyrics
and the music was available for only 1,414 songs since, for example, a number were
instrumentals and for a small number of others it was not possible to reliably determine
RELATIONSHIP BETWEEN POP MUSIC AND LYRICS
10
which of several versions was that which had achieved greatest public prominence, such
that it is this set of 1,414 songs on which the analyses were run.
Lyrics variables
As detailed in North et al. (2017; 2018a,b), song lyrics were sourced from various
web sites (e.g., www.azlyrics.com), corroborated against a second source, checked for
completeness (i.e., through reinstatement of omitted redundancies arising from instances
of “chorus x2” or “repeat first verse”), and processed for language consistency (i.e., to
ensure correction of misspellings and consistent use of contractions and truncations).
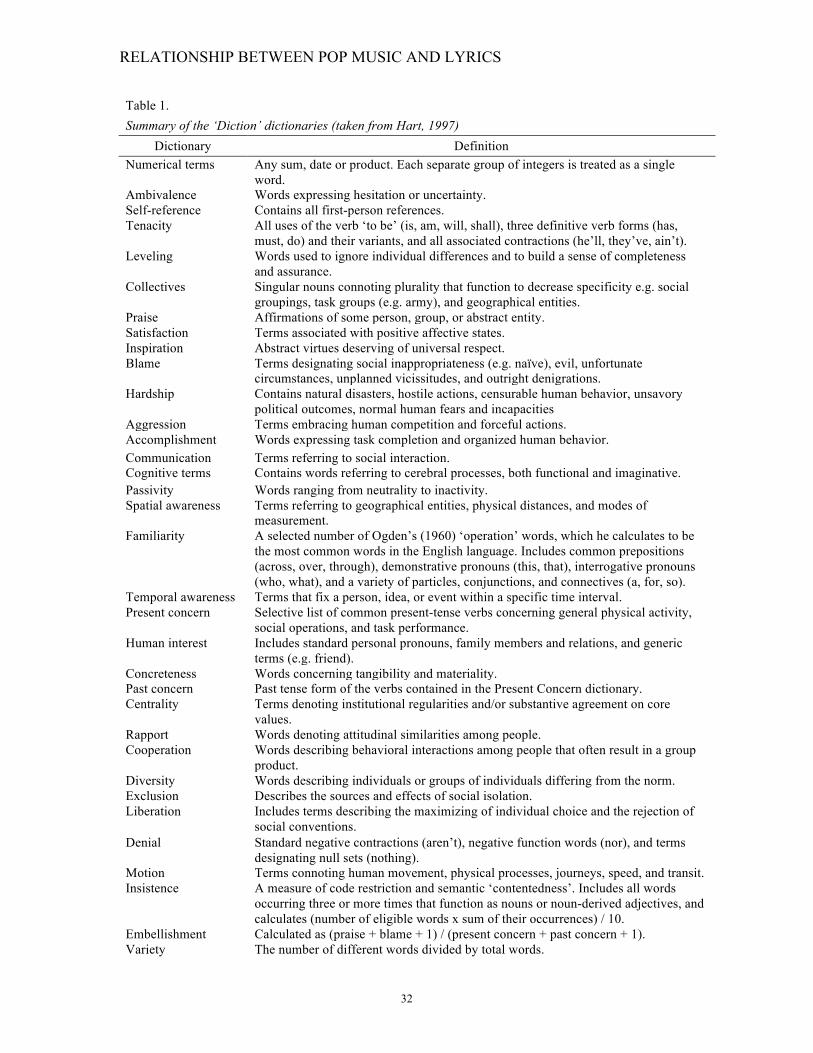
Computerized text analysis software, Diction 7.0 (Hart, Carroll, & Spiars, 2013), was
then used to analyze each set of lyrics. Diction compared each set of lyrics against a set
of approximately 10,000 words, organized into lists that serve respectively as 36
variables, that were originally developed via analysis of 20,000 texts (Abelman, 2014;
Sydserff & Weetman, 2002). For each instance of a word occurring in the lyrics that also
appeared in the word list for a given variable, 1 was added to the score for that variable.
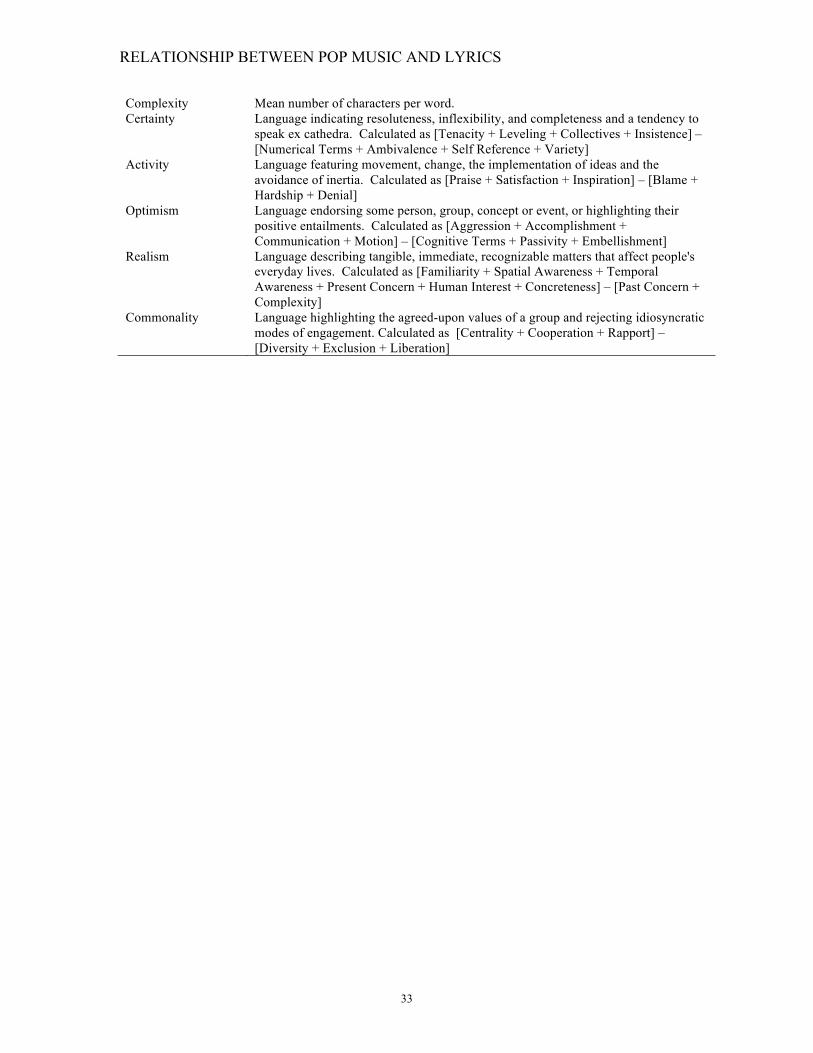
In addition to the 36 variables, Diction calculates five composite variables (known as
“master variables”, namely certainty, optimism, activity, realism, and commonality,
respectively) via combinations of the main variables (Huffaker & Calvert, 2005; Short &
Palmer, 2008): details of the calculation of the five composite variables and of the 36
discrete variables are presented in Table 1. For each song, the scores produced by Diction
on each variable were divided by the number of words in the text in question (to control
for this, given that the lyrics were of differing lengths), and then multiplied by 1000 to
facilitate presentation. Note that Cook and Krupar (2010) used Diction previously to
RELATIONSHIP BETWEEN POP MUSIC AND LYRICS
11
analyze song lyrics from the Great Depression era, and that the software has been
employed in over 300 published studies to date (www.dictionsoftware.com/published-
studies/), several of which have employed a variety of media texts.
The measure of the typicality of the lyrics was based on that used by North et al.
(2017; 2018b) and employed the five composite dictionaries, since in conjunction they
provide, “the most general understanding of a given text”, and were created explicitly to
facilitate comparison between texts (Hart et al., 2013, p. 4). In order to calculate
typicality, mean values were calculated across the corpus of lyrics from 1999-2013 for
each of the composite variables in turn. For each song, the difference was then calculated
between its score on each composite variable and the corpus mean score for that variable.
Any negative values were multiplied by -1 so that the score represented the magnitude of
difference from the corpus irrespective of the direction of this difference. The typicality
score for each set of lyrics was then calculated as the sum of the difference scores for
each of the composite variables in turn. Note, therefore, that high scores indicate
atypicality relative to the corpus and low scores indicate typicality relative to the
database.
- Table 1 here -
Music variables
Data concerning the musical component of each song was sourced from an
existing dataset, created in partnership with a private sector music organization (see
details in North et al., 2017; 2018a,b; 2019). As detailed in North et al. (2018a,b), a
RELATIONSHIP BETWEEN POP MUSIC AND LYRICS
12
trained AI process used algorithms to analyze and produce scores for each track
concerning its degree of energy, BPM, and the extent to which it represented each of six
mood clusters (namely, clean, simple relaxing; happy, hopeful, ambition; passion,
romance, power; mystery, luxury, comfort; energetic, bold, outgoing; and calm, peace,
tranquility). Energy and mood scores were based on analysis of each piece in terms of 69
differing combinations of 11 sonic properties (e.g., pitch, rhythm). In the case of energy
scores, the AI process was trained on the basis of 200 exemplar tracks containing what
were thought to be calming and energetic pieces, which the AI then learned to classify. In
the case of mood ratings, the AI was trained via human ratings of 300 seed tracks. In the
case of both energy and mood ratings, the AI then assigned values to each piece in the
database on the basis of its similarity with others in terms of the 69 combinations of 11
sonic properties. The process by which the AI was developed and validated is detailed in
U.S. Patent No. 20100250471 (2010) and U.S. Patent No. 20080021851 (2008). BPM
was analysed via an algorithm developed from an industry-standard, open source C++
library (see http://essentia.upf.edu): measures were taken every 30 seconds and the
average was calculated to produce a single score per track. The typicality score for each
piece of music was produced by first calculating a mean value across the corpus for each
of energy, BPM, and the six respective mood scores. As with the lyrics, for each song,
the difference was then calculated between its score on each variable in turn and the
corpus mean for that variable; any negative values were multiplied by -1; and the
typicality score for each piece of music was then calculated as the sum of the differences
on each variable from the corpus mean. Note, therefore, again that high scores indicate
atypicality relative to the corpus and low scores indicate typicality relative to the
RELATIONSHIP BETWEEN POP MUSIC AND LYRICS
13
database. There are four published papers (North, Krause, Sheridan, & Ritchie, 2017,
2018a, 2018b, 2019) which have previously employed the AI process adopted here to
quantify musical variables and the popularity of commercially released music: these used
204,506 pieces that had enjoyed commercial success in the USA and a further 143,353
pieces that had enjoyed commercial success in the UK, and showed that the popularity
and emotional content of this music were broadly consistent with theoretical predictions
based upon the literature in experimental aesthetics that has employed human
participants.
Popularity
Given Marin et al.’s (2016) argument that hedonic tone (i.e., the favorableness of
an aesthetic response) is not a unitary construct, the popularity of each track was
operationalized in four ways. Two measures were based on chart performance during
1999-2003, namely (a) the peak chart position reached (1-5) for each song and (b) the
cumulative number of weeks each song spent in positions 1-5. Additionally, two
popularity scores from the broader music dataset (North et al., 2017) were employed,
namely ‘United Kingdom hit popularity’ and ‘United Kingdom hit appearance’, which
aimed to provide a wider-ranging indication of the popularity of the songs. As detailed by
North et al. (2017), the hit popularity score is based on United Kingdom sales chart
information, incorporating charts that are general, genre-specific, format-specific (i.e.,
singles charts and charts concerning sales of albums on which the given song featured),
and regional (e.g., Scottish): in order to produce a single score for each song, these data
are weighted by the generality of the chart in question (e.g., the United Kingdom singles
RELATIONSHIP BETWEEN POP MUSIC AND LYRICS
14
chart was assigned a weighting of 1 whereas appearance of the song on an album that
featured in the United Kingdom albums chart was assigned a weighting of 0.5), and the
variable gives an overall picture of the popularity of the song in question across various
sales charts. For each track per chart, popularity was then operationalized by calculating
the sum of 1 divided by (peak chart position multiplied by chart weighting). The hit
appearance score is calculated as simply the number of weeks a song appeared on the top
40 charts, irrespective of numeric position, and provides an overall indication of the
duration of the commercial success of a given song. Note that while data concerning peak
chart position and number of weeks in positions 1-5 concern specifically the period from
1999-2013, the United Kingdom hit popularity and United Kingdom hit appearance
measures draw on chart information dating back to 1962 in order to provide a more
general overview of the cultural prominence of a given song over a very extended period
of time.
Results
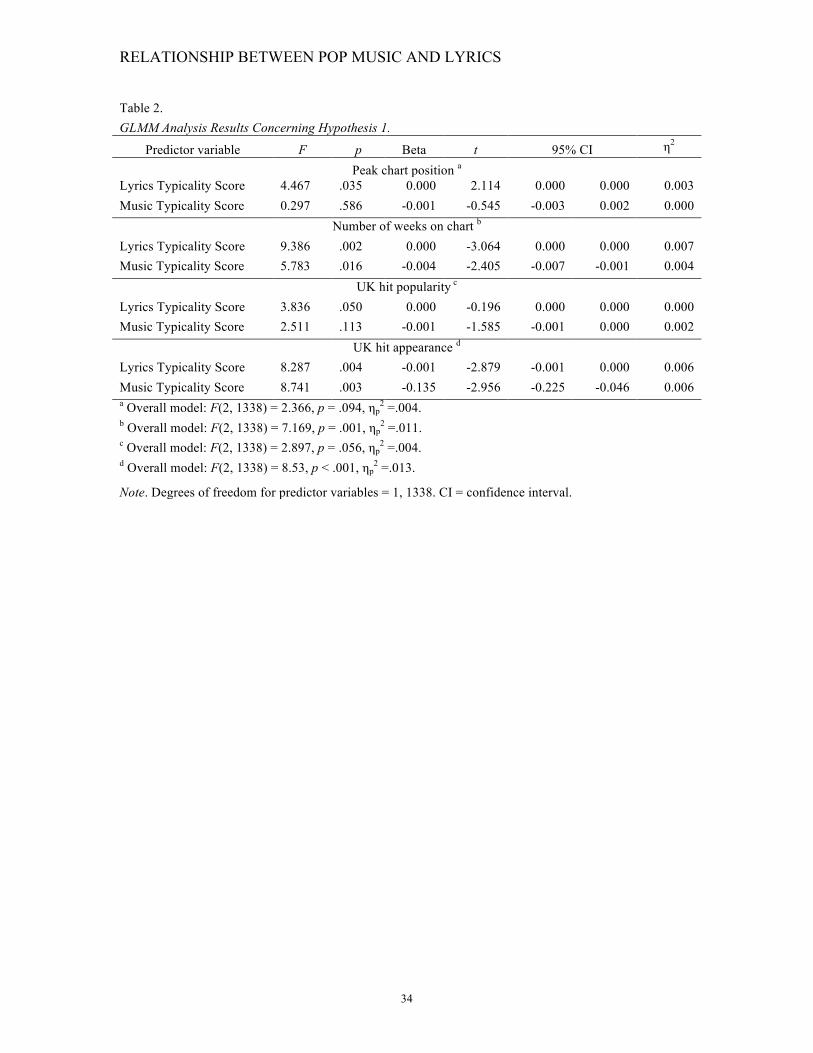
Hypothesis 1 was that the typicality of the music and lyrics should each predict
popularity. The lyrics typicality score and music typicality score were used to predict
each of the four popularity measures in turn, using one separate General Linear Mixed
Model (GLMM) analysis for each respective measure of popularity (α < .013, i.e., .05/4).
The results are shown in Table 2. This shows that in the case of the number of weeks in
the top 5 and United Kingdom hit appearance, the models were statistically significant,
and the typicality scores concerning both the lyrics and the music were related negatively
to popularity (and note the direction of scoring in the typicality variables, such that these
RELATIONSHIP BETWEEN POP MUSIC AND LYRICS
15
negative relationships indicate that more typical music and lyrics were more popular). In
the case of peak chart position, however, the GLMM model was non-significant although
the lyrics typicality scores were related positively to popularity; and in the case of United
Kingdom hit popularity, the model was non-significant, although typicality of the lyrics
was related negatively to popularity.
- Table 2 here -
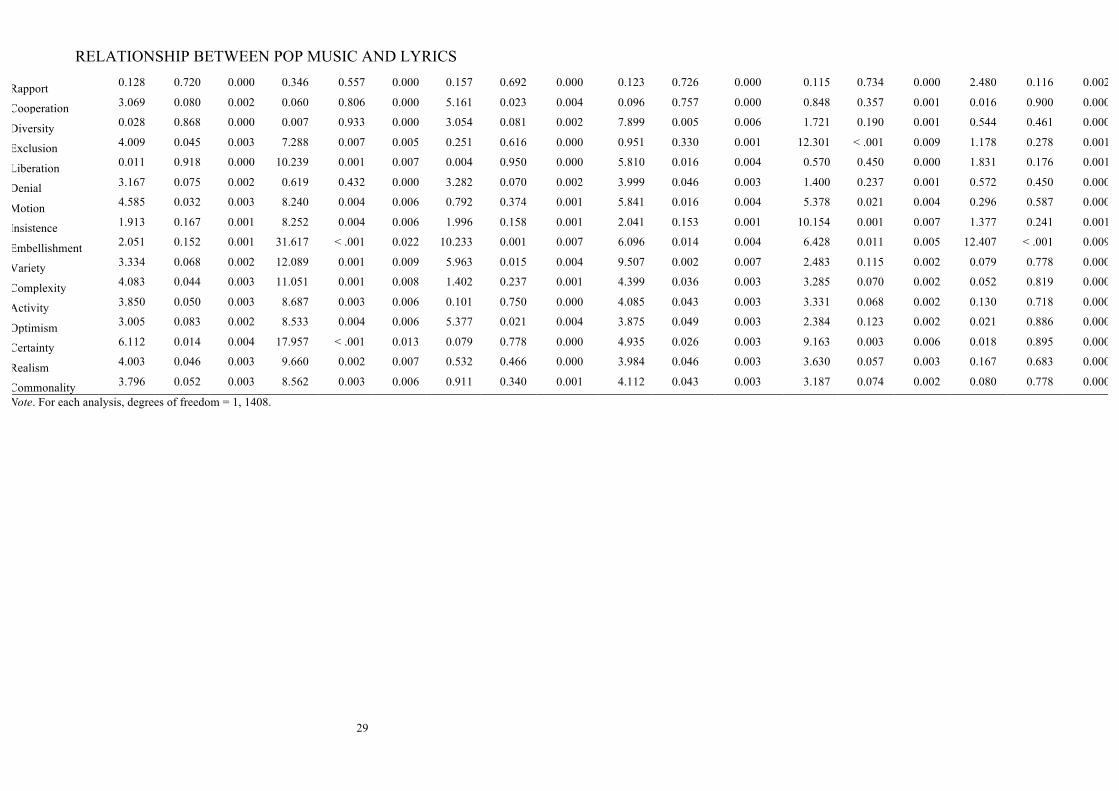
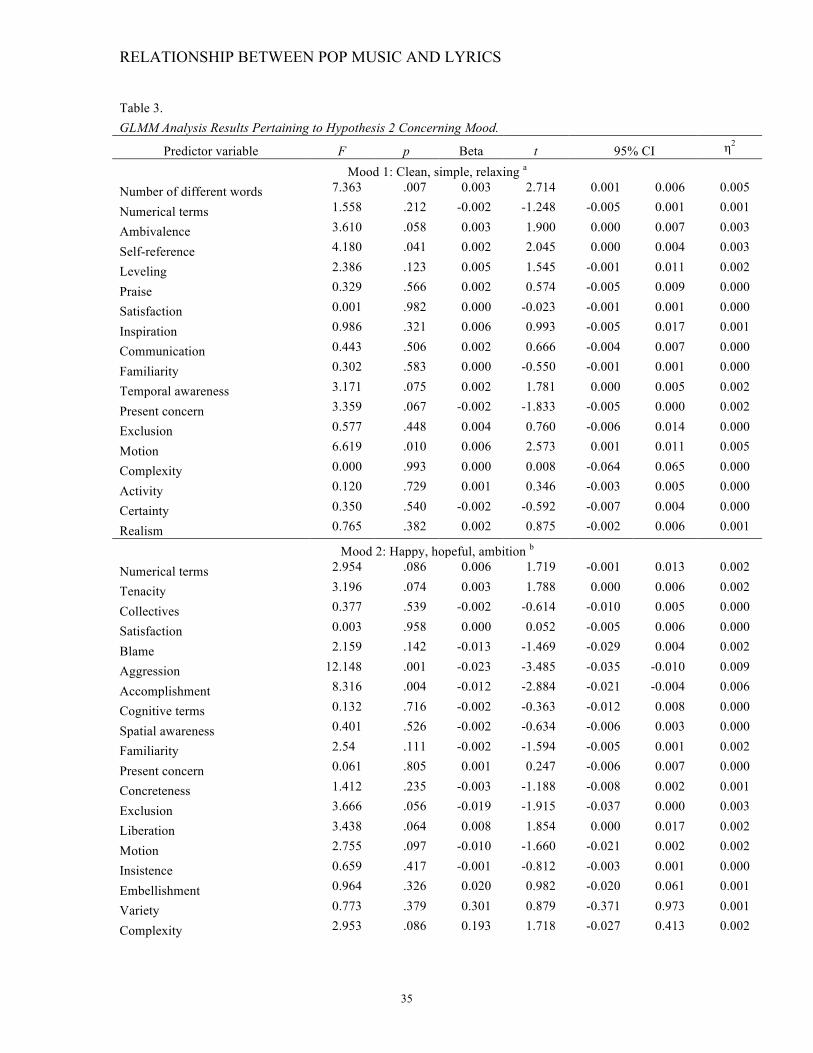
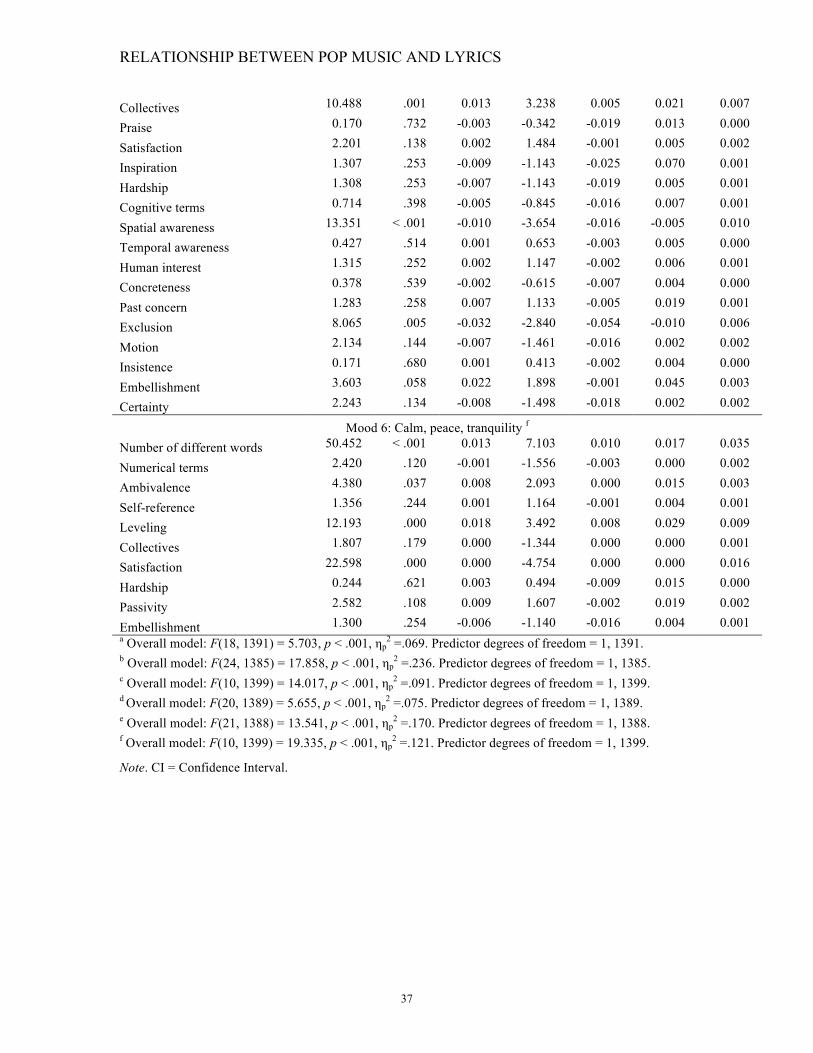
Hypothesis 2 was that we might expect to find a positive relationship between the
mood evoked by the music and the subject matter and mood evoked by the lyrics. To test
this, a series of GLMM analyses were carried out, with each analysis investigating the
extent to which each of the six respective music mood scores could be predicted by the
lyrics variables. For each of the music mood scores, firstly, separate GLMM analyses
were conducted employing each of the 41 Diction variables individually as predictor
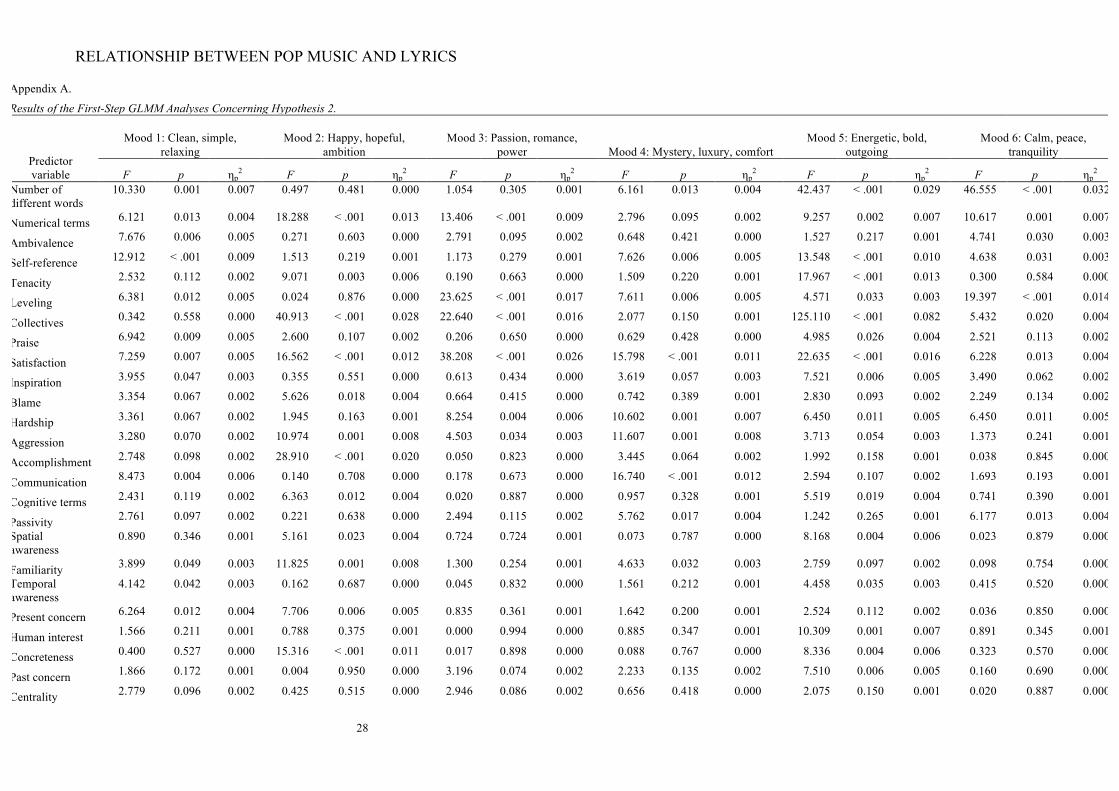
variables (see Appendix A). Only those Diction variables demonstrating a significant
relationship (α < .05) with the criterion variable were retained for the second step, and the
results of these analyses (α < .008, i.e., .05/6) are detailed in Table 3. These show that
scores for the music as ‘Clean, simple, relaxing’ were related positively to the number of
different words, self-reference (i.e., references to the first person), and motion (i.e., terms
concerning movement, physical processes, journeys, and speed). Scores for the music as
‘happy, hopeful, ambitious’ were related negatively to the lyrics demonstrating
aggression (i.e., depictions of competition and forceful action), accomplishment (i.e.,
words concerning task completion and organized behavior), and commonality (i.e.,
RELATIONSHIP BETWEEN POP MUSIC AND LYRICS
16
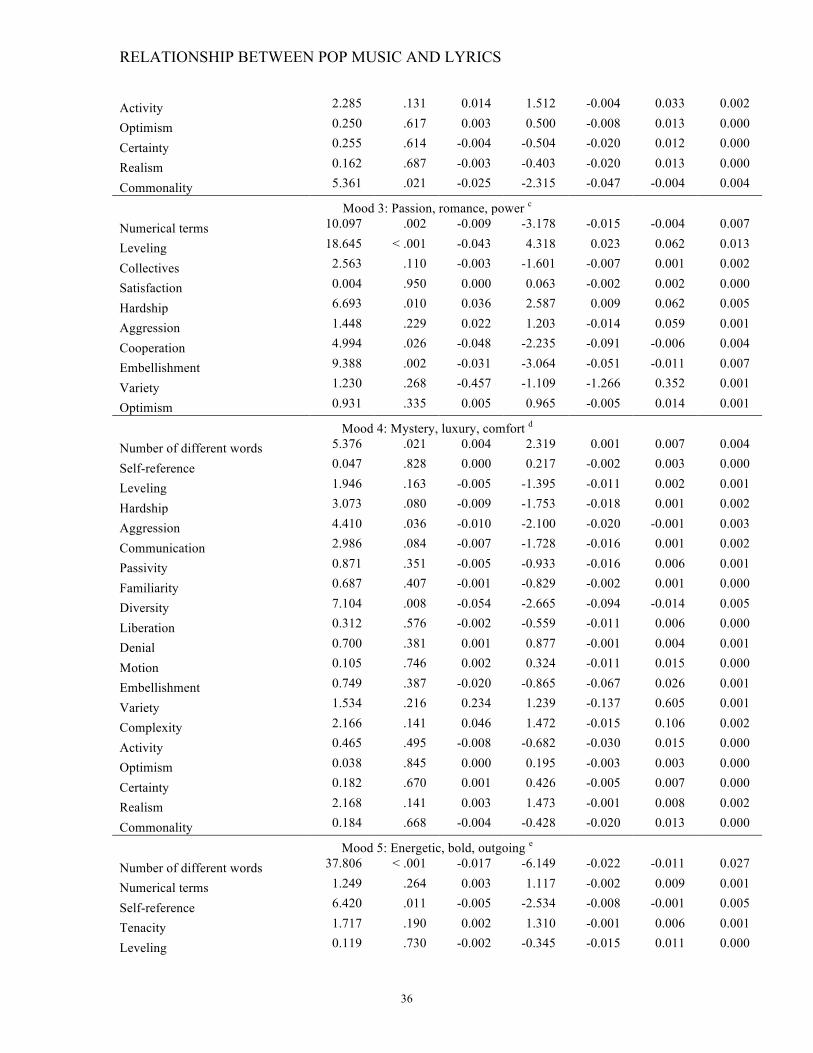
language concerning agreed upon values of a group). Scores for the music conveying
‘passion, romance, and power’ were related positively to lyrics containing instances of
leveling (i.e., words that ignore individual differences and which convey completeness
and assurance) and hardship (i.e., words concerning natural disasters, hostile action, and
censurable behavior), and negatively to lyrics containing instances of numerical terms
(i.e., instances of numbers, dates, arithmetical operations, and other quantitative terms),
cooperation (i.e., words concerning behavioral interactions leading to a group product),
and embellishment (i.e., a high ratio of adjectives to verbs). Scores for the music
conveying ‘mystery, luxury, and comfort’ were related positively to the number of
different words, and negatively to the lyrics containing instances of aggression and
diversity (i.e., words describing individuals or groups who differ from the norm). Scores
for the music as ‘energetic, bold, and outgoing’ were related positively to the lyrics
conveying instances of collectives (i.e., singular nouns concerning plurality concerning
social groups, task groups, and geographical entities), and negatively to the number of
different words in the lyrics, and to them containing instances of self-reference, spatial
awareness (i.e., words concerning geographical terms, physical distance, and
measurement), and exclusion (i.e., words concerning the causes and consequences of
social isolation). Finally, scores for the music conveying ‘calm, peace, and tranquility’
were related positively to the number of different words in the lyrics, instances of them
conveying ambivalence (i.e., words concerning hesitation or uncertainty) and leveling,
and negatively to instances of them conveying satisfaction (i.e., words denoting positive
affective states and nurturance).
RELATIONSHIP BETWEEN POP MUSIC AND LYRICS
17
- Table 3 here -
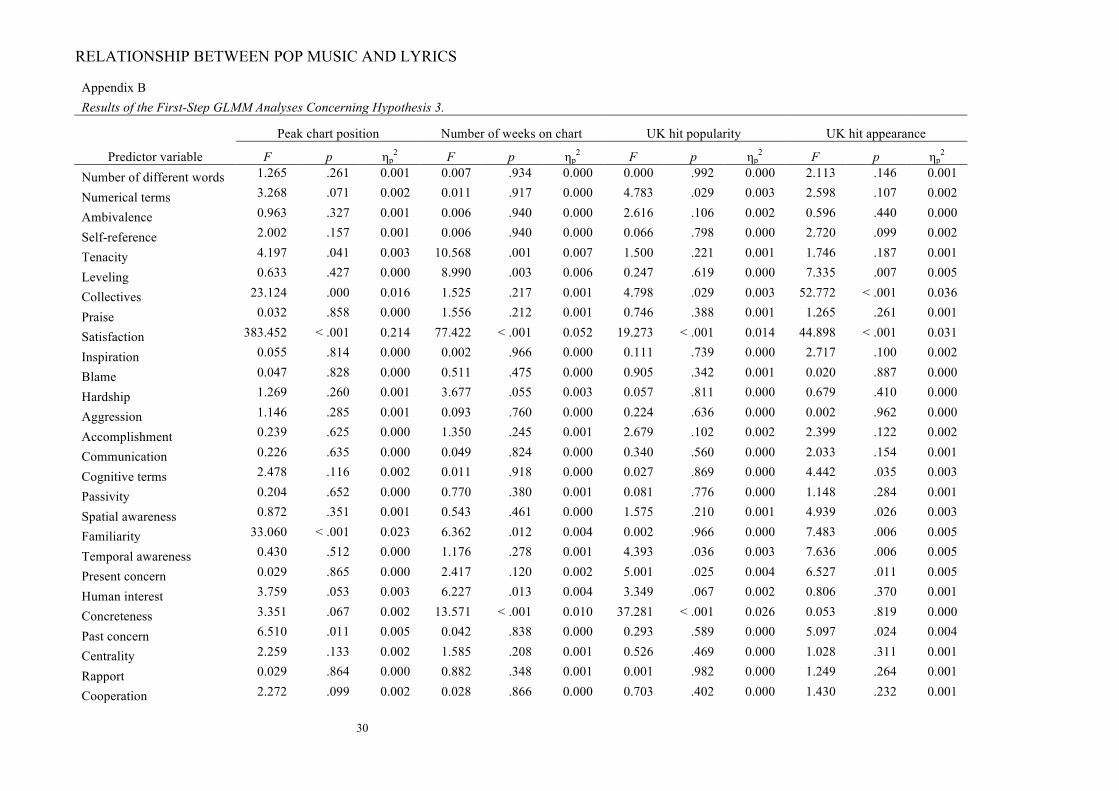
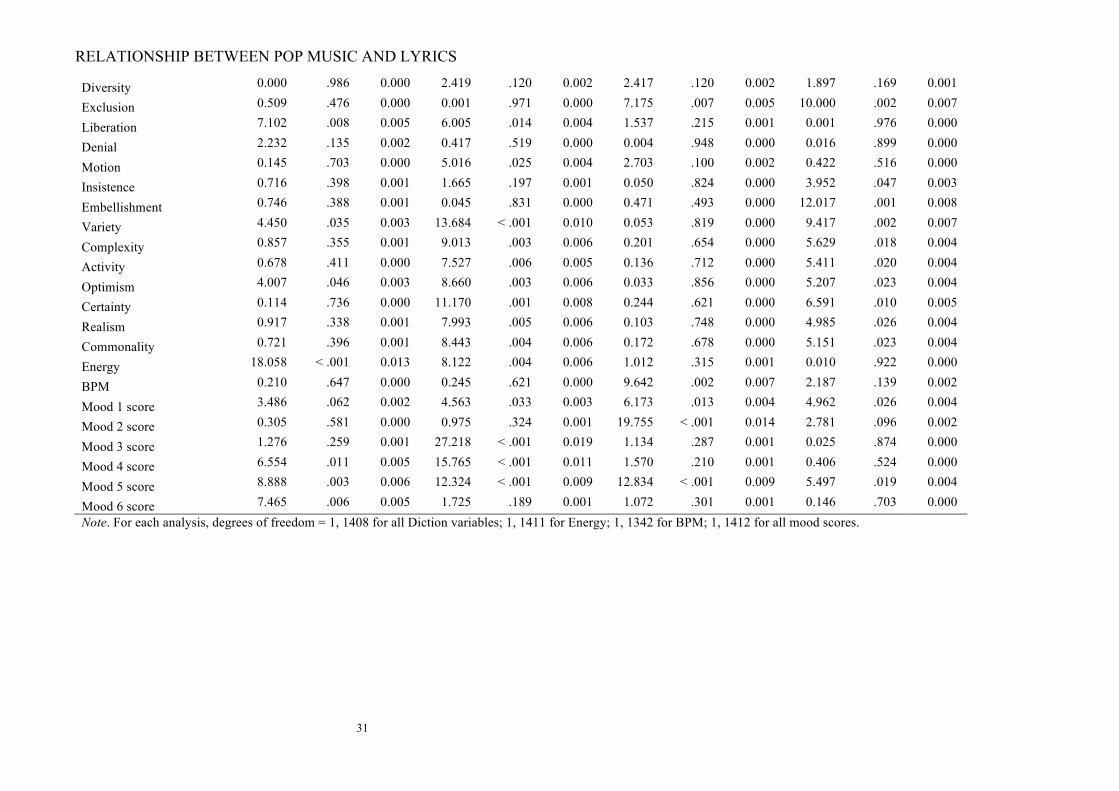
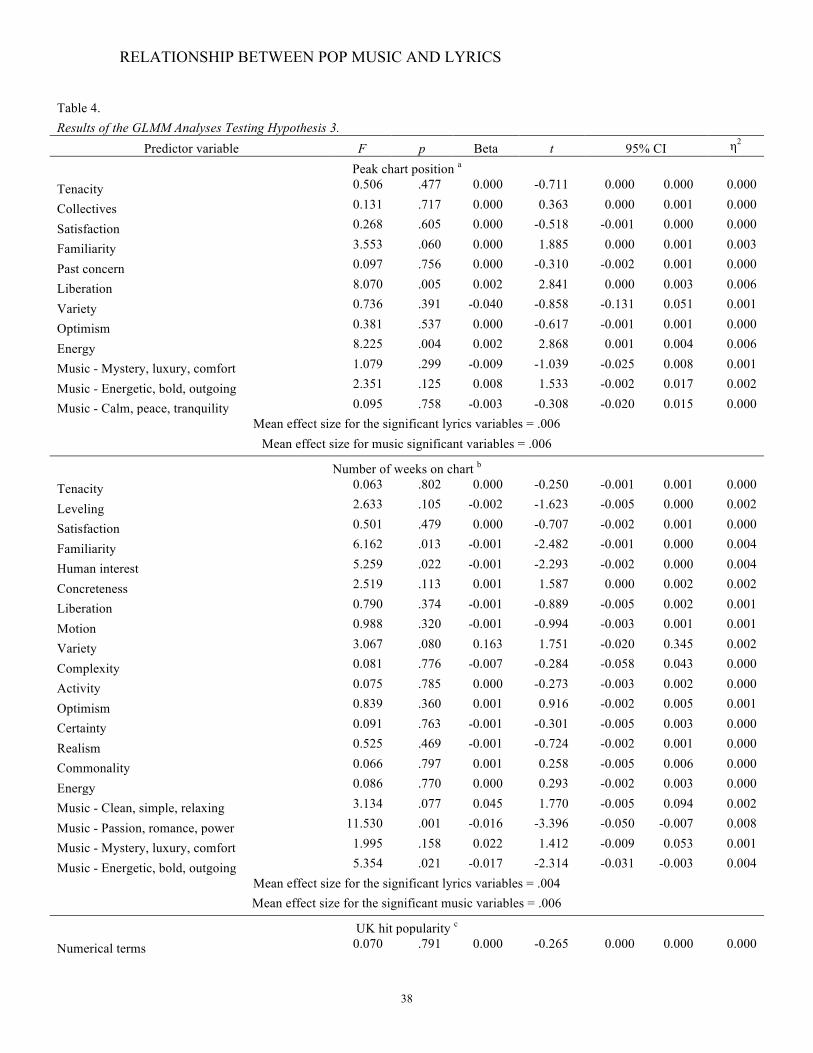
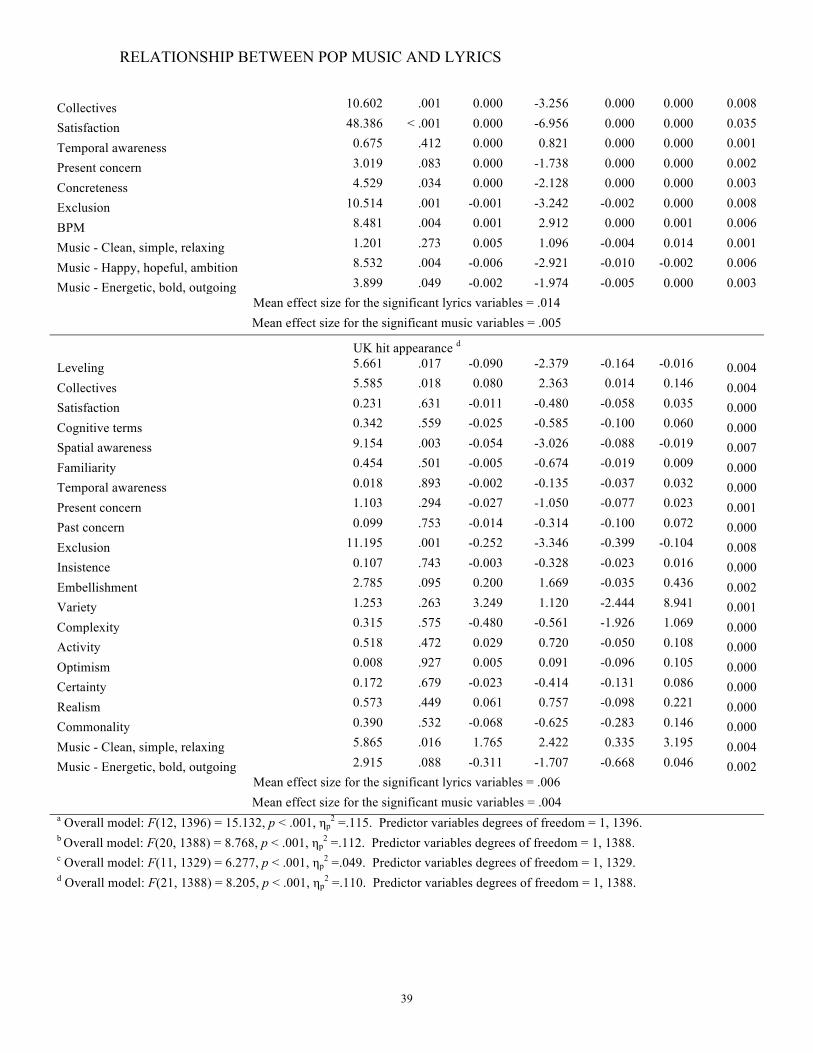
Hypotheses 3a and b concerned whether characteristics of the music predicted
popularity better than did the characteristics of the lyrics or vice versa. To test this, all the
variables concerning music and lyrics (excepting the typicality scores) were entered into
GLMM analyses using the same two-step method used to test Hypothesis 2 (step one
results are illustrated in Appendix B). Separate analyses were carried out for each of the
four measures of popularity (namely peak chart position, number of weeks in the top 5,
United Kingdom hit popularity, and United Kingdom hit appearance respectively), and
the results are detailed in Table 4 (α < .013, i.e., .05/4) along with the mean effect size for
the music and lyrics variables within each test respectively (based on the individual
predictor variable effect sizes), so that the mean effect sizes demonstrate the relative
utility of music and lyrics in predicting popularity. Music and lyrics contributed equally
to explaining peak chart position, music outperformed lyrics in explaining the number of
weeks spent on the top 5, lyrics outperformed music in explaining United Kingdom hit
popularity, and lyrics outperformed music in explaining United Kingdom hit appearance.
- Table 4 here -
Discussion
In summary, there was evidence that the typicality of a given set of lyrics relative
to the corpus as a whole was associated with their popularity; there were numerous
associations between each of six mood scores assigned to the music and various aspects
RELATIONSHIP BETWEEN POP MUSIC AND LYRICS
18
of the lyrics (e.g., passionate music was associated with lyrics addressing hardship and
less concern with precise numerical terms); and the relative contribution of the lyrics and
music to overall popularity varied according to the means by which these were
operationalized so that, for instance, music and lyrics contributed equally to explaining
peak chart position, whereas music outperformed lyrics in explaining the number of
weeks spent on the top 5. In the following paragraphs we unpack these findings in more
detail and address their theoretical consequences.
Hypothesis 1 stated that the typicality of the music and lyrics of any given song
relative to the corpus should predict each of the four measures of the popularity of the
song in question. This hypothesis was based on earlier, predominantly lab-based, research
indicating that typicality is related positively to aesthetic responses. Only the models
concerning the number of weeks on chart and United Kingdom hit appearance were
statistically significant. The pattern of results concerning these was consistent, however,
illustrating that within the individual tests, the typicality scores concerning both the
music and lyrics were negatively related to the popularity measure in question, so that
more typical music and lyrics enjoyed more popularity. Thus, these findings partially
support Hypothesis 1 and the lab-based findings of previous research that typicality
should promote popularity. They do so in the context of much more naturalistic musical
stimuli and measures of popularity than have been studied hitherto.
Hypothesis 2 stated that, as a consequence of artistic goals, we might expect that
the subject matter and mood of lyrics should reflect properties of the music in a manner
that implies that each is composed to complement the other. The results showed that each
of the six mood scores assigned to the music could be predicted by the lyrics variables.
RELATIONSHIP BETWEEN POP MUSIC AND LYRICS
19
Two aspects of these findings are particularly notable. First, there was clear evidence that
musicians employ lyrics that either complement or compensate for the mood of the music
in a rather literal manner. To provide some selective examples of this for the sake of
clarity, happy music was associated with lyrics containing lower levels of aggression;
passionate music was associated with lyrics addressing hardship and lower levels of
concern with precise numerical terms, cooperation, and embellishment; mysterious and
luxurious music was associated with lyrics containing a larger number of different words
(which increases potential ambiguity) and lower levels of aggression; music that was
energetic, bold, and outgoing was associated with lyrics that concerned collective groups
of people and associated negatively with lyrics addressing exclusion; and music that was
calm, peaceful, and tranquil was associated with lyrics that were ambivalent. The lack of
previous research makes it very difficult to comment on the theoretical implications of
this with any certainty. However, in the light of the findings concerning typicality
(Hypothesis 1) one possibility is a good candidate for further research. As noted earlier,
lab-based research on typicality has argued that this is positively related to aesthetic
responses because typical stimuli are more easily processed. We might expect that
complementary lyrics and music facilitate processing of one another and so enhance the
listener’s understanding of the intended message. For instance, if music and lyrics
complement one another then we might expect to find greater agreement between
listeners on the intended meaning of a given song, or that listeners would be able to reach
these judgements more quickly than when the music and lyrics did not complement one
another.
RELATIONSHIP BETWEEN POP MUSIC AND LYRICS
20
A second aspect of the findings concerning Hypothesis 2 is that there were also a
number of relationships concerning other variables that cannot be explained in terms of
musicians simply matching the qualities of the music to the qualities of the lyrics in a
rather literal manner. Instead, the results provide a clear indication of how musicians
have tended to match a number of specific musical properties to a number of specific of
lyrical properties in a more abstract, artistic manner. More simply, the quantity of
significant relationships provides some detailed insight into the creative process
concerning pop music by telling us which musical and lyrical properties musicians tend
to ‘feel’ are appropriately-matched to one another, even though these specific
relationships are not intuitive. For instance, Table 3 indicates that scores for the music as
clean, simple, and relaxing were related positively to scores for the lyrics on self-
reference; scores for the music as happy, hopeful, and ambitious were related negatively
to scores for lyrics on accomplishment; and scores for the music as expressing mystery,
luxury, and comfort were related negatively to scores for the lyrics on diversity. The
nascency of research on the relationship between music and lyrics makes it very difficult
to propose confident theoretical explanations as to why these relationships might exist,
but the sheer fact of their existence across such a large cohort and range of variables
which reflect the daily music listening of the United Kingdom means that these
relationships should be a candidate for future theorizing. For instance, some specific
hypotheses raised by the present findings, that may be tested by future work with
practicing musicians, are that the tendency to pair clean, simple, and relaxing music with
lyrics containing self-reference is because the undemanding nature of the music provides
a clear opportunity for complex self-reflection; the tendency to pair happy, hopeful and
RELATIONSHIP BETWEEN POP MUSIC AND LYRICS
21
ambitious music with lyrics addressing commonality of values between people reflects a
collectivist, utopian worldview on the part of musicians; the tendency to avoid pairing
passionate, romantic, and powerful music with lyrics containing numerical terms and
embellishment may reflect an attempt to convey a rousing call to action that lacks
sophistication and qualification; the tendency to avoid pairing music that conveys
mystery, luxury, and comfort with lyrics that address diversity may similarly reflect an
attempt to deliberately avoid acknowledging any subtlety of argument and instead focus
upon heterogeneity; the tendency to pair music that is energetic, bold, and outgoing with
lyrics concerning collective groups of people and lower numbers of different words again
arguably reflects a deliberate strategy for producing an unsophisticated, rabble-rousing
call to action; and the tendency to pair music conveying calm, peace, and tranquility with
lyrics containing a larger number of different words and lower levels of satisfaction
suggests that the song is used to produce an opportunity for expressing detailed and
complex concerns.
Hypothesis 3a, following Simonton’s (2000) earlier research on opera, was that
musical variables should outperform lyrical variables as predictors of popularity, whereas
Hypothesis 3b was that lyrical variables may perform much better in predicting
popularity given that the lyrics of United Kingdom's best-selling pop songs are usually in
English. Mean effect sizes demonstrated that music variables outperformed lyrics
variables in predicting the number of weeks spent in the top 5, and music and lyrics
variables performed equally in predicting peak chart position; whereas lyrics variables
were better than music variables in predicting United Kingdom hit appearance and United
Kingdom hit popularity. The relative importance of music and lyrics in predicting
RELATIONSHIP BETWEEN POP MUSIC AND LYRICS
22
popularity differs between the various predictor variables and according to the precise
operationalization of popularity, and so lends more weight to H3b rather than H3a.
Clearly, however, the greater importance of the lyrics in predicting the two longer-term
and more general measures of popularity (United Kingdom hit popularity and United
Kingdom hit appearance) than in the two popularity measures derived solely from top 5
singles sales charts suggests that lyrics have a longer-term relationship with general
popularity, whereas music per se is associated more closely with the shorter-term, very
high levels of popularity that are required for appearance of the song in the top 5 singles
chart.
Before concluding we should note a number of limits to the generalizability of the
present findings and the possibilities for further research that these raise. Music is of
course a cultural product and the present findings relate to only those songs that reached
the weekly United Kingdom top 5 singles chart between 1999 and 2013. They may not be
replicable in different countries or different historical periods. It is notable, however, that
the top 5 singles represented the basis of radio broadcasting in the United Kingdom
throughout the period in question, and so do provide good coverage of the music to have
reached public prominence in that country. As such, the findings may well have
relevance for market testing of new music prior to commercial release, and suggest that
this should overtly address (a) the typicality of both music and lyrics and (b) the extent to
which the vocabulary of the lyrics (and perhaps also the means of their delivery)
complements the characteristics of the music. Nonetheless, the discrepancy between the
present results and those of both Simonton (2000) concerning opera and lab-based
research on typicality indicate the need for work of this nature to be carried out via a
RELATIONSHIP BETWEEN POP MUSIC AND LYRICS
23
variety of research methods, on a number of different bodies of music, and potentially on
a culture-by-culture basis. The present findings are perhaps of more value as an early
indicator of what may be possible, rather than as an explicit guide concerning what
should immediately be done by those working in the music industry. We note also that
the means of measuring typicality employed here, which is reasonably novel except for
North et al. (2017; 2018b), may be a fruitful technique for the music industry to adopt,
given that commercially-available music is already digitised.
We should also highlight the small effect sizes associated with the significant
results reported here. These seem tolerable for three reasons. First, a range of commercial
factors distort the market for pop music, and mitigate against finding any relationships at
all among the variables considered here: even small effect sizes are potentially very
interesting in this commercial context. Second, given the complexity of music, it seems
highly plausible that a very large number of variables could be implicated in the issues
investigated here: when investigating the relationship between any two specific variables
it would be surprising if anything but small effect sizes resulted. Third, the reliance of the
present research on pre-existing data sources inevitably limits the adequacy with which
more general theoretical concepts can be captured. For instance, the operationalization of
typicality drew on only those variables described here, rather than the broader number of
factors upon which any typicality influence is based during everyday music listening:
given this limitation, we again feel it is appropriate to prioritize statistical significance
over effect size. Nonetheless, the small effect sizes identified by the present research
again suggest the need for considerable refinement of the conclusions, and our hope is
RELATIONSHIP BETWEEN POP MUSIC AND LYRICS
24
that the present findings and arguments provide some guidance for future research in this
nascent field.
In the meantime, the present findings indicate that the typicality of the lyrics
relative to the corpus can predict their popularity; that there are a number of associations
between various aspects of the music and lyrics, and that these are readily-interpretable;
and that the relative contribution of music and lyrics to the popularity of commercially-
successful songs varies according to the precise means by which these are
operationalized. There is a relationship between pop music and the lyrics of that music
that is intuitive and which may be explicable to some extent through existing theoretical
concepts in the literature on psychological aesthetics.
RELATIONSHIP BETWEEN POP MUSIC AND LYRICS
25
References Abelman, R. (2014). Reviewing and revising the institutional vision of U.S. higher
education. Review of Communication Research, 2(1), 30-67. Alcalde, V., Ricard, J., Bonet, A., Llopis, A., & Marcos, J. (2008). U.S. Patent No.
2008/0021851. Washington, DC: U.S. Patent and Trademark Office. Alcalde, V., Ricard, J., Bonet, A., Llopis, A., & Marcos, J. (2010). U.S. Patent No.
2010/0250471. Washington, DC: U.S. Patent and Trademark Office. Bradlow, E. T., & Fader, P. S. (2001). A Bayesian lifetime model for the “Hot 100”
Billboard Songs. Journal of the American Statistical Association, 96(454), 368-381.
Cook, S. L., & Krupar, K. (2010). Defining the twentieth century and impacting the twenty-first: semantic habits created through radio and song. ETC.: A Review of General Semantics, 67(4), n.p.
Czechowski, K., Miranda, D., & Sylvestre, J. (2016). Like a rolling stone: A mixed-methods approach to linguistic analysis of Bob Dylan’s lyrics. Psychology of Aesthetics, Creativity, and the Arts, 10(1), 99-113. doi:10.1037/aca0000045
de Clercq, T., & Temperley, D. (2011). A corpus analysis of rock harmony. Popular Music, 30(1), 47-70. doi:10.1017/S026114301000067X
DeWall, C. N., Pond, R. S. J., Campbell, W. K., & Twenge, J. M. (2011). Tuning in to psychological change: Linguistic markers of psychological traits and emotion over time in popular U.S. song lyrics. Psychology of Aesthetics, Creativity, and the Arts, 5(3), 200-207. doi:10.1037/a0023195
Everett, W. (1999). The Beatles as musicians: Revolver through the Anthology. Oxford, UK: Oxford University Press.
Gauvin, H. L. (2015). “The times they were a-changin’”: A database-driven approach to the evolution of harmonic syntax in popular music from the 1960s. Empirical Musicology Review, 10(3), 215-238.
Giles, D. E. (2007). Survival of the hippest: Life at the top of the Hot 100. Applied Economics, 39(15), 1877-1887. doi:10.1080/00036840600707159
Hart, R. P., Carroll, C. E., & Spiars, S. (2013). Diction 7.0: The text analysis program. Austin: Digitext.
Hass, R. W. (2016). An exploration of the relationship between melodic originality and fame in early 20th-century American popular music. Psychology of Music, 44(4), 710-729. doi:10.1177/0305735615590429
Hong, S. B. (2012). A comment on survival of the hippest: Life at the top of the Hot 100. Applied Economics Letters, 19(11), 1101-1105. doi:10.1080/13504851.2011.615722
Huffaker, D. A., & Calvert, S. L. (2005). Gender, identity, and language use in teenage blogs. Journal of Computer-Mediated Communication, 10(2), n.p. doi:10.1111/j.1083-6101.2005.tb00238.x
Jackson, J. M., & Padgett, V. R. (1982). With a little help from my friend: Social loafing and the Lennon-McCartney songs. Personality and Social Psychology Bulletin, 8(4), 672-677. doi:10.1177/0146167282084011
Krause, A. E., & North, A. C. (2017). Pop music lyrics are related to the proportion of female recording artists: Analysis of the United Kingdom weekly top five song
RELATIONSHIP BETWEEN POP MUSIC AND LYRICS
26
lyrics, 1960– 2015. Psychology of Popular Media Culture, Advance online publication. doi:10.1037/ppm0000174
Krause, A. E., & North, A. C. (2019). Collaboration, cognitive effort, and self-reference in United Kingdom top 5 pop music lyrics 1960–2015. Psychology of Aesthetics, Creativity, and the Arts, advance online publication. doi:10.1037/aca0000214
Kreyer, R., & Mukherjee, J. (2009). The style of pop song lyrics: A corpus-linguistic pilot study. Anglia - Zeitschrift für englische Philologie, 125(1), 31-58. doi:10.1515/ANGL.2007.31
Martindale, C., & Moore, K. (1989). Relationship of musical preference to collative, ecological, and psychophysical variables. Music Perception, 6(4), 431-445. doi:10.2307/40285441
McAuslan, P., & Waung, M. (2018). Billboard Hot 100 Songs: Self-promoting over the past 20 years. Psychology of Popular Media Culture, 7(2), 171-184. doi:10.1037/ppm0000118
Neuman, Y., Perlovsky, L., Cohen, Y., & Livshits, D. (2016). The personality of music genres. Psychology of Music, 44(5), 1044-1057. doi:10.1177/0305735615608526
North, A. C., Krause, A. E., Kane, R., & Sheridan, L. P. (2018). United Kingdom ‘top 5’ pop music lyrics. Psychology of Music, 46(5), 638-661. doi:10.1177/0305735617720161
North, A. C., Krause, A. E., Sheridan, L. P., & Ritchie, D. (2017). Energy, typicality, and music sales: A computerized analysis of 143,353 pieces. Empirical Studies of The Arts, 35(2), 214-229. doi:10.1177/0276237416688063
North, A. C., Krause, A. E., Sheridan, L. P., & Ritchie, D. (2018a). Energy, popularity, and the circumplex: A computerized analysis of emotion in 143,353 musical pieces. Empirical Studies of The Arts, 36(2), 127-161. doi:10.1177/0276237417704339
North, A. C., Krause, A. E., Sheridan, L. P., & Ritchie, D. (2018b). Popularity, mood, energy, and typicality in music: A computerised analysis of 204,506 pieces. Psychology of Aesthetics, Creativity, and the Arts, Advance online publication. doi:10.1037/aca0000165
North, A. C., Krause, A. E., Sheridan, L. P., & Ritchie, D. (2019). Comparison of popular music in the United States and the United Kingdom: Computerized analysis of 42,714 pieces. Psychology of Music, online first. doi:10.1177/30575619830185
Nunes, J. C., Ordanini, A., & Valsesia, F. (2015). The power of repetition: Repetitive lyrics in a song increase processing fluency and drive market success. Journal of Consumer Psychology, 25(2), 187-199. doi:10.1016/j.jcps.2014.12.004
Petrie, K. J., Pennebaker, J. W., & Sivertsen, B. (2008). Things we said today: A linguistic analysis of the Beatles. Psychology of Aesthetics, Creativity, and the Arts, 2(4), 197.
Pettijohn II, T. F., & Ahmed, S. F. (2010). Songwriting loafing or creative collaboration?: A comparison of individual and team written Billboard hits in the USA. Journal of Articles in Support of the Null Hypothesis, 7(1), 1-5.
Pettijohn II, T. F., Eastman, J. T., & Richard, K. G. (2012). And the beat goes on: Popular Billboard song beats per minute and key signatures vary with social and economic conditions. Current Psychology: A Journal for Diverse Perspectives on Diverse Psychological Issues, 31(3), 313-317. doi:10.1007/s12144-012-9149-y
RELATIONSHIP BETWEEN POP MUSIC AND LYRICS
27
Pettijohn II, T. F., & Sacco Jr., D. F. (2009). Tough times, meaningful music, mature performers: Popular Billboard songs and performer preferences across social and economic conditions in the USA. Psychology of Music, 37(2), 155-179.
Short, J. C., & Palmer, T. B. (2008). The Application of DICTION to Content Analysis Research in Strategic Management. Organizational Research Methods, 11(4), 727-752. doi:10.1177/1094428107304534
Simonton, D. K. (1980). Thematic fame, melodic originality, and musical zeitgeist: A biographical and transhistorical content analysis. Journal of Personality and Social Psychology, 38(6), 972-983.
Simonton, D. K. (1997). Products, persons, and periods: Historiometric analyses of compositional creativity. In D. J. Hargreaves & A. C. North (Eds.), The social psychology of music (pp. 107-122). Oxford, UK: Oxford University Press.
Simonton, D. K. (2000). The music or the words? Or, how important is the libretto for an opera’s aesthetic success? Empirical Studies of The Arts, 18, 105-118.
Sydserff, R., & Weetman, P. (2002). Developments in content analysis: a transitivity index and DICTION scores. Accounting, Auditing & Accountability Journal, 15(4), 523-545. doi:10.1108/09513570210440586
The Beatles (2000). Anthology. London: Apple Corps. Van Sickel, R. W. (2005). A world without citizenship: On (the absence of) politics and
ideology in country music lyrics, 1960–2000. Popular Music and Society, 28(3), 313-331. doi:10.1080/03007760500105164
Zeman, A., Milton, F., Smith, A., & Rylance, R. (2013). By heart: An fMRI study of brain activation by poetry and prose. Journal of Consciousness Studies, 20(9-10), 132-158.
Zullow, H. M. (1991). Pessimistic rumination in popular songs and newsmagazines predict economic recession via decreased consumer optimism and spending. Journal of Economic Psychology, 12, 501-526.
RELATIONSHIP BETWEEN POP MUSIC AND LYRICS
28
Appendix A. Results of the First-Step GLMM Analyses Concerning Hypothesis 2.
Predictor variable
Mood 1: Clean, simple, relaxing
Mood 2: Happy, hopeful, ambition
Mood 3: Passion, romance, power Mood 4: Mystery, luxury, comfort
Mood 5: Energetic, bold, outgoing
Mood 6: Calm, peace, tranquility
F p ηp2 F p ηp
2 F p ηp2 F p ηp
2 F p ηp2 F p ηp
2 Number of different words
10.330 0.001 0.007 0.497 0.481 0.000 1.054 0.305 0.001 6.161 0.013 0.004 42.437 < .001 0.029 46.555 < .001 0.032
Numerical terms 6.121 0.013 0.004 18.288 < .001 0.013 13.406 < .001 0.009 2.796 0.095 0.002 9.257 0.002 0.007 10.617 0.001 0.007
Ambivalence 7.676 0.006 0.005 0.271 0.603 0.000 2.791 0.095 0.002 0.648 0.421 0.000 1.527 0.217 0.001 4.741 0.030 0.003
Self-reference 12.912 < .001 0.009 1.513 0.219 0.001 1.173 0.279 0.001 7.626 0.006 0.005 13.548 < .001 0.010 4.638 0.031 0.003
Tenacity 2.532 0.112 0.002 9.071 0.003 0.006 0.190 0.663 0.000 1.509 0.220 0.001 17.967 < .001 0.013 0.300 0.584 0.000
Leveling 6.381 0.012 0.005 0.024 0.876 0.000 23.625 < .001 0.017 7.611 0.006 0.005 4.571 0.033 0.003 19.397 < .001 0.014
Collectives 0.342 0.558 0.000 40.913 < .001 0.028 22.640 < .001 0.016 2.077 0.150 0.001 125.110 < .001 0.082 5.432 0.020 0.004
Praise 6.942 0.009 0.005 2.600 0.107 0.002 0.206 0.650 0.000 0.629 0.428 0.000 4.985 0.026 0.004 2.521 0.113 0.002
Satisfaction 7.259 0.007 0.005 16.562 < .001 0.012 38.208 < .001 0.026 15.798 < .001 0.011 22.635 < .001 0.016 6.228 0.013 0.004
Inspiration 3.955 0.047 0.003 0.355 0.551 0.000 0.613 0.434 0.000 3.619 0.057 0.003 7.521 0.006 0.005 3.490 0.062 0.002
Blame 3.354 0.067 0.002 5.626 0.018 0.004 0.664 0.415 0.000 0.742 0.389 0.001 2.830 0.093 0.002 2.249 0.134 0.002
Hardship 3.361 0.067 0.002 1.945 0.163 0.001 8.254 0.004 0.006 10.602 0.001 0.007 6.450 0.011 0.005 6.450 0.011 0.005
Aggression 3.280 0.070 0.002 10.974 0.001 0.008 4.503 0.034 0.003 11.607 0.001 0.008 3.713 0.054 0.003 1.373 0.241 0.001
Accomplishment 2.748 0.098 0.002 28.910 < .001 0.020 0.050 0.823 0.000 3.445 0.064 0.002 1.992 0.158 0.001 0.038 0.845 0.000
Communication 8.473 0.004 0.006 0.140 0.708 0.000 0.178 0.673 0.000 16.740 < .001 0.012 2.594 0.107 0.002 1.693 0.193 0.001
Cognitive terms 2.431 0.119 0.002 6.363 0.012 0.004 0.020 0.887 0.000 0.957 0.328 0.001 5.519 0.019 0.004 0.741 0.390 0.001
Passivity 2.761 0.097 0.002 0.221 0.638 0.000 2.494 0.115 0.002 5.762 0.017 0.004 1.242 0.265 0.001 6.177 0.013 0.004
Spatial awareness
0.890 0.346 0.001 5.161 0.023 0.004 0.724 0.724 0.001 0.073 0.787 0.000 8.168 0.004 0.006 0.023 0.879 0.000
Familiarity 3.899 0.049 0.003 11.825 0.001 0.008 1.300 0.254 0.001 4.633 0.032 0.003 2.759 0.097 0.002 0.098 0.754 0.000
Temporal awareness
4.142 0.042 0.003 0.162 0.687 0.000 0.045 0.832 0.000 1.561 0.212 0.001 4.458 0.035 0.003 0.415 0.520 0.000
Present concern 6.264 0.012 0.004 7.706 0.006 0.005 0.835 0.361 0.001 1.642 0.200 0.001 2.524 0.112 0.002 0.036 0.850 0.000
Human interest 1.566 0.211 0.001 0.788 0.375 0.001 0.000 0.994 0.000 0.885 0.347 0.001 10.309 0.001 0.007 0.891 0.345 0.001
Concreteness 0.400 0.527 0.000 15.316 < .001 0.011 0.017 0.898 0.000 0.088 0.767 0.000 8.336 0.004 0.006 0.323 0.570 0.000
Past concern 1.866 0.172 0.001 0.004 0.950 0.000 3.196 0.074 0.002 2.233 0.135 0.002 7.510 0.006 0.005 0.160 0.690 0.000
Centrality 2.779 0.096 0.002 0.425 0.515 0.000 2.946 0.086 0.002 0.656 0.418 0.000 2.075 0.150 0.001 0.020 0.887 0.000
RELATIONSHIP BETWEEN POP MUSIC AND LYRICS
29
Rapport 0.128 0.720 0.000 0.346 0.557 0.000 0.157 0.692 0.000 0.123 0.726 0.000 0.115 0.734 0.000 2.480 0.116 0.002
Cooperation 3.069 0.080 0.002 0.060 0.806 0.000 5.161 0.023 0.004 0.096 0.757 0.000 0.848 0.357 0.001 0.016 0.900 0.000
Diversity 0.028 0.868 0.000 0.007 0.933 0.000 3.054 0.081 0.002 7.899 0.005 0.006 1.721 0.190 0.001 0.544 0.461 0.000
Exclusion 4.009 0.045 0.003 7.288 0.007 0.005 0.251 0.616 0.000 0.951 0.330 0.001 12.301 < .001 0.009 1.178 0.278 0.001
Liberation 0.011 0.918 0.000 10.239 0.001 0.007 0.004 0.950 0.000 5.810 0.016 0.004 0.570 0.450 0.000 1.831 0.176 0.001
Denial 3.167 0.075 0.002 0.619 0.432 0.000 3.282 0.070 0.002 3.999 0.046 0.003 1.400 0.237 0.001 0.572 0.450 0.000
Motion 4.585 0.032 0.003 8.240 0.004 0.006 0.792 0.374 0.001 5.841 0.016 0.004 5.378 0.021 0.004 0.296 0.587 0.000
Insistence 1.913 0.167 0.001 8.252 0.004 0.006 1.996 0.158 0.001 2.041 0.153 0.001 10.154 0.001 0.007 1.377 0.241 0.001
Embellishment 2.051 0.152 0.001 31.617 < .001 0.022 10.233 0.001 0.007 6.096 0.014 0.004 6.428 0.011 0.005 12.407 < .001 0.009
Variety 3.334 0.068 0.002 12.089 0.001 0.009 5.963 0.015 0.004 9.507 0.002 0.007 2.483 0.115 0.002 0.079 0.778 0.000
Complexity 4.083 0.044 0.003 11.051 0.001 0.008 1.402 0.237 0.001 4.399 0.036 0.003 3.285 0.070 0.002 0.052 0.819 0.000
Activity 3.850 0.050 0.003 8.687 0.003 0.006 0.101 0.750 0.000 4.085 0.043 0.003 3.331 0.068 0.002 0.130 0.718 0.000
Optimism 3.005 0.083 0.002 8.533 0.004 0.006 5.377 0.021 0.004 3.875 0.049 0.003 2.384 0.123 0.002 0.021 0.886 0.000
Certainty 6.112 0.014 0.004 17.957 < .001 0.013 0.079 0.778 0.000 4.935 0.026 0.003 9.163 0.003 0.006 0.018 0.895 0.000
Realism 4.003 0.046 0.003 9.660 0.002 0.007 0.532 0.466 0.000 3.984 0.046 0.003 3.630 0.057 0.003 0.167 0.683 0.000
Commonality 3.796 0.052 0.003 8.562 0.003 0.006 0.911 0.340 0.001 4.112 0.043 0.003 3.187 0.074 0.002 0.080 0.778 0.000
Note. For each analysis, degrees of freedom = 1, 1408.
RELATIONSHIP BETWEEN POP MUSIC AND LYRICS
30
Appendix B Results of the First-Step GLMM Analyses Concerning Hypothesis 3.
Predictor variable
Peak chart position Number of weeks on chart UK hit popularity UK hit appearance
F p ηp2 F p ηp
2 F p ηp2 F p ηp
2 Number of different words 1.265 .261 0.001 0.007 .934 0.000 0.000 .992 0.000 2.113 .146 0.001
Numerical terms 3.268 .071 0.002 0.011 .917 0.000 4.783 .029 0.003 2.598 .107 0.002
Ambivalence 0.963 .327 0.001 0.006 .940 0.000 2.616 .106 0.002 0.596 .440 0.000
Self-reference 2.002 .157 0.001 0.006 .940 0.000 0.066 .798 0.000 2.720 .099 0.002
Tenacity 4.197 .041 0.003 10.568 .001 0.007 1.500 .221 0.001 1.746 .187 0.001
Leveling 0.633 .427 0.000 8.990 .003 0.006 0.247 .619 0.000 7.335 .007 0.005
Collectives 23.124 .000 0.016 1.525 .217 0.001 4.798 .029 0.003 52.772 < .001 0.036
Praise 0.032 .858 0.000 1.556 .212 0.001 0.746 .388 0.001 1.265 .261 0.001
Satisfaction 383.452 < .001 0.214 77.422 < .001 0.052 19.273 < .001 0.014 44.898 < .001 0.031
Inspiration 0.055 .814 0.000 0.002 .966 0.000 0.111 .739 0.000 2.717 .100 0.002
Blame 0.047 .828 0.000 0.511 .475 0.000 0.905 .342 0.001 0.020 .887 0.000
Hardship 1.269 .260 0.001 3.677 .055 0.003 0.057 .811 0.000 0.679 .410 0.000
Aggression 1.146 .285 0.001 0.093 .760 0.000 0.224 .636 0.000 0.002 .962 0.000
Accomplishment 0.239 .625 0.000 1.350 .245 0.001 2.679 .102 0.002 2.399 .122 0.002
Communication 0.226 .635 0.000 0.049 .824 0.000 0.340 .560 0.000 2.033 .154 0.001
Cognitive terms 2.478 .116 0.002 0.011 .918 0.000 0.027 .869 0.000 4.442 .035 0.003
Passivity 0.204 .652 0.000 0.770 .380 0.001 0.081 .776 0.000 1.148 .284 0.001
Spatial awareness 0.872 .351 0.001 0.543 .461 0.000 1.575 .210 0.001 4.939 .026 0.003
Familiarity 33.060 < .001 0.023 6.362 .012 0.004 0.002 .966 0.000 7.483 .006 0.005
Temporal awareness 0.430 .512 0.000 1.176 .278 0.001 4.393 .036 0.003 7.636 .006 0.005
Present concern 0.029 .865 0.000 2.417 .120 0.002 5.001 .025 0.004 6.527 .011 0.005
Human interest 3.759 .053 0.003 6.227 .013 0.004 3.349 .067 0.002 0.806 .370 0.001
Concreteness 3.351 .067 0.002 13.571 < .001 0.010 37.281 < .001 0.026 0.053 .819 0.000
Past concern 6.510 .011 0.005 0.042 .838 0.000 0.293 .589 0.000 5.097 .024 0.004
Centrality 2.259 .133 0.002 1.585 .208 0.001 0.526 .469 0.000 1.028 .311 0.001
Rapport 0.029 .864 0.000 0.882 .348 0.001 0.001 .982 0.000 1.249 .264 0.001
Cooperation 2.272 .099 0.002 0.028 .866 0.000 0.703 .402 0.000 1.430 .232 0.001
RELATIONSHIP BETWEEN POP MUSIC AND LYRICS
31
Diversity 0.000 .986 0.000 2.419 .120 0.002 2.417 .120 0.002 1.897 .169 0.001
Exclusion 0.509 .476 0.000 0.001 .971 0.000 7.175 .007 0.005 10.000 .002 0.007
Liberation 7.102 .008 0.005 6.005 .014 0.004 1.537 .215 0.001 0.001 .976 0.000
Denial 2.232 .135 0.002 0.417 .519 0.000 0.004 .948 0.000 0.016 .899 0.000
Motion 0.145 .703 0.000 5.016 .025 0.004 2.703 .100 0.002 0.422 .516 0.000
Insistence 0.716 .398 0.001 1.665 .197 0.001 0.050 .824 0.000 3.952 .047 0.003
Embellishment 0.746 .388 0.001 0.045 .831 0.000 0.471 .493 0.000 12.017 .001 0.008
Variety 4.450 .035 0.003 13.684 < .001 0.010 0.053 .819 0.000 9.417 .002 0.007
Complexity 0.857 .355 0.001 9.013 .003 0.006 0.201 .654 0.000 5.629 .018 0.004
Activity 0.678 .411 0.000 7.527 .006 0.005 0.136 .712 0.000 5.411 .020 0.004
Optimism 4.007 .046 0.003 8.660 .003 0.006 0.033 .856 0.000 5.207 .023 0.004
Certainty 0.114 .736 0.000 11.170 .001 0.008 0.244 .621 0.000 6.591 .010 0.005
Realism 0.917 .338 0.001 7.993 .005 0.006 0.103 .748 0.000 4.985 .026 0.004
Commonality 0.721 .396 0.001 8.443 .004 0.006 0.172 .678 0.000 5.151 .023 0.004
Energy 18.058 < .001 0.013 8.122 .004 0.006 1.012 .315 0.001 0.010 .922 0.000
BPM 0.210 .647 0.000 0.245 .621 0.000 9.642 .002 0.007 2.187 .139 0.002
Mood 1 score 3.486 .062 0.002 4.563 .033 0.003 6.173 .013 0.004 4.962 .026 0.004
Mood 2 score 0.305 .581 0.000 0.975 .324 0.001 19.755 < .001 0.014 2.781 .096 0.002
Mood 3 score 1.276 .259 0.001 27.218 < .001 0.019 1.134 .287 0.001 0.025 .874 0.000
Mood 4 score 6.554 .011 0.005 15.765 < .001 0.011 1.570 .210 0.001 0.406 .524 0.000
Mood 5 score 8.888 .003 0.006 12.324 < .001 0.009 12.834 < .001 0.009 5.497 .019 0.004
Mood 6 score 7.465 .006 0.005 1.725 .189 0.001 1.072 .301 0.001 0.146 .703 0.000 Note. For each analysis, degrees of freedom = 1, 1408 for all Diction variables; 1, 1411 for Energy; 1, 1342 for BPM; 1, 1412 for all mood scores.
RELATIONSHIP BETWEEN POP MUSIC AND LYRICS
32
Table 1. Summary of the ‘Diction’ dictionaries (taken from Hart, 1997)
Dictionary Definition Numerical terms Any sum, date or product. Each separate group of integers is treated as a single
word. Ambivalence Words expressing hesitation or uncertainty. Self-reference Contains all first-person references. Tenacity All uses of the verb ‘to be’ (is, am, will, shall), three definitive verb forms (has,
must, do) and their variants, and all associated contractions (he’ll, they’ve, ain’t). Leveling Words used to ignore individual differences and to build a sense of completeness
and assurance. Collectives Singular nouns connoting plurality that function to decrease specificity e.g. social
groupings, task groups (e.g. army), and geographical entities. Praise Affirmations of some person, group, or abstract entity. Satisfaction Terms associated with positive affective states. Inspiration Abstract virtues deserving of universal respect. Blame Terms designating social inappropriateness (e.g. naïve), evil, unfortunate
circumstances, unplanned vicissitudes, and outright denigrations. Hardship Contains natural disasters, hostile actions, censurable human behavior, unsavory
political outcomes, normal human fears and incapacities Aggression Terms embracing human competition and forceful actions. Accomplishment Words expressing task completion and organized human behavior. Communication Terms referring to social interaction. Cognitive terms Contains words referring to cerebral processes, both functional and imaginative. Passivity Words ranging from neutrality to inactivity. Spatial awareness Terms referring to geographical entities, physical distances, and modes of
measurement. Familiarity A selected number of Ogden’s (1960) ‘operation’ words, which he calculates to be
the most common words in the English language. Includes common prepositions (across, over, through), demonstrative pronouns (this, that), interrogative pronouns (who, what), and a variety of particles, conjunctions, and connectives (a, for, so).
Temporal awareness Terms that fix a person, idea, or event within a specific time interval. Present concern Selective list of common present-tense verbs concerning general physical activity,
social operations, and task performance. Human interest Includes standard personal pronouns, family members and relations, and generic
terms (e.g. friend). Concreteness Words concerning tangibility and materiality. Past concern Past tense form of the verbs contained in the Present Concern dictionary. Centrality Terms denoting institutional regularities and/or substantive agreement on core
values. Rapport Words denoting attitudinal similarities among people. Cooperation Words describing behavioral interactions among people that often result in a group
product. Diversity Words describing individuals or groups of individuals differing from the norm. Exclusion Describes the sources and effects of social isolation. Liberation Includes terms describing the maximizing of individual choice and the rejection of
social conventions. Denial Standard negative contractions (aren’t), negative function words (nor), and terms
designating null sets (nothing). Motion Terms connoting human movement, physical processes, journeys, speed, and transit. Insistence A measure of code restriction and semantic ‘contentedness’. Includes all words
occurring three or more times that function as nouns or noun-derived adjectives, and calculates (number of eligible words x sum of their occurrences) / 10.
Embellishment Calculated as (praise + blame + 1) / (present concern + past concern + 1). Variety The number of different words divided by total words.
RELATIONSHIP BETWEEN POP MUSIC AND LYRICS
33
Complexity Mean number of characters per word. Certainty Language indicating resoluteness, inflexibility, and completeness and a tendency to
speak ex cathedra. Calculated as [Tenacity + Leveling + Collectives + Insistence] – [Numerical Terms + Ambivalence + Self Reference + Variety]
Activity Language featuring movement, change, the implementation of ideas and the avoidance of inertia. Calculated as [Praise + Satisfaction + Inspiration] – [Blame + Hardship + Denial]
Optimism Language endorsing some person, group, concept or event, or highlighting their positive entailments. Calculated as [Aggression + Accomplishment + Communication + Motion] – [Cognitive Terms + Passivity + Embellishment]
Realism Language describing tangible, immediate, recognizable matters that affect people's everyday lives. Calculated as [Familiarity + Spatial Awareness + Temporal Awareness + Present Concern + Human Interest + Concreteness] – [Past Concern + Complexity]
Commonality Language highlighting the agreed-upon values of a group and rejecting idiosyncratic modes of engagement. Calculated as [Centrality + Cooperation + Rapport] – [Diversity + Exclusion + Liberation]
RELATIONSHIP BETWEEN POP MUSIC AND LYRICS
34
Table 2. GLMM Analysis Results Concerning Hypothesis 1.
Predictor variable F p Beta t 95% CI η2
Peak chart position a Lyrics Typicality Score 4.467 .035 0.000 2.114 0.000 0.000 0.003 Music Typicality Score 0.297 .586 -0.001 -0.545 -0.003 0.002 0.000
Number of weeks on chart b Lyrics Typicality Score 9.386 .002 0.000 -3.064 0.000 0.000 0.007 Music Typicality Score 5.783 .016 -0.004 -2.405 -0.007 -0.001 0.004
UK hit popularity c Lyrics Typicality Score 3.836 .050 0.000 -0.196 0.000 0.000 0.000 Music Typicality Score 2.511 .113 -0.001 -1.585 -0.001 0.000 0.002
UK hit appearance d Lyrics Typicality Score 8.287 .004 -0.001 -2.879 -0.001 0.000 0.006 Music Typicality Score 8.741 .003 -0.135 -2.956 -0.225 -0.046 0.006 a Overall model: F(2, 1338) = 2.366, p = .094, ηp
2 =.004. b Overall model: F(2, 1338) = 7.169, p = .001, ηp
2 =.011. c Overall model: F(2, 1338) = 2.897, p = .056, ηp
2 =.004. d Overall model: F(2, 1338) = 8.53, p < .001, ηp
2 =.013. Note. Degrees of freedom for predictor variables = 1, 1338. CI = confidence interval.
RELATIONSHIP BETWEEN POP MUSIC AND LYRICS
35
Table 3. GLMM Analysis Results Pertaining to Hypothesis 2 Concerning Mood.
Predictor variable F p Beta t 95% CI η2
Mood 1: Clean, simple, relaxing a Number of different words 7.363 .007 0.003 2.714 0.001 0.006 0.005
Numerical terms 1.558 .212 -0.002 -1.248 -0.005 0.001 0.001
Ambivalence 3.610 .058 0.003 1.900 0.000 0.007 0.003
Self-reference 4.180 .041 0.002 2.045 0.000 0.004 0.003
Leveling 2.386 .123 0.005 1.545 -0.001 0.011 0.002
Praise 0.329 .566 0.002 0.574 -0.005 0.009 0.000
Satisfaction 0.001 .982 0.000 -0.023 -0.001 0.001 0.000
Inspiration 0.986 .321 0.006 0.993 -0.005 0.017 0.001
Communication 0.443 .506 0.002 0.666 -0.004 0.007 0.000
Familiarity 0.302 .583 0.000 -0.550 -0.001 0.001 0.000
Temporal awareness 3.171 .075 0.002 1.781 0.000 0.005 0.002
Present concern 3.359 .067 -0.002 -1.833 -0.005 0.000 0.002
Exclusion 0.577 .448 0.004 0.760 -0.006 0.014 0.000
Motion 6.619 .010 0.006 2.573 0.001 0.011 0.005
Complexity 0.000 .993 0.000 0.008 -0.064 0.065 0.000
Activity 0.120 .729 0.001 0.346 -0.003 0.005 0.000
Certainty 0.350 .540 -0.002 -0.592 -0.007 0.004 0.000
Realism 0.765 .382 0.002 0.875 -0.002 0.006 0.001
Mood 2: Happy, hopeful, ambition b Numerical terms 2.954 .086 0.006 1.719 -0.001 0.013 0.002
Tenacity 3.196 .074 0.003 1.788 0.000 0.006 0.002
Collectives 0.377 .539 -0.002 -0.614 -0.010 0.005 0.000
Satisfaction 0.003 .958 0.000 0.052 -0.005 0.006 0.000
Blame 2.159 .142 -0.013 -1.469 -0.029 0.004 0.002
Aggression 12.148 .001 -0.023 -3.485 -0.035 -0.010 0.009
Accomplishment 8.316 .004 -0.012 -2.884 -0.021 -0.004 0.006
Cognitive terms 0.132 .716 -0.002 -0.363 -0.012 0.008 0.000
Spatial awareness 0.401 .526 -0.002 -0.634 -0.006 0.003 0.000
Familiarity 2.54 .111 -0.002 -1.594 -0.005 0.001 0.002
Present concern 0.061 .805 0.001 0.247 -0.006 0.007 0.000
Concreteness 1.412 .235 -0.003 -1.188 -0.008 0.002 0.001
Exclusion 3.666 .056 -0.019 -1.915 -0.037 0.000 0.003
Liberation 3.438 .064 0.008 1.854 0.000 0.017 0.002
Motion 2.755 .097 -0.010 -1.660 -0.021 0.002 0.002
Insistence 0.659 .417 -0.001 -0.812 -0.003 0.001 0.000
Embellishment 0.964 .326 0.020 0.982 -0.020 0.061 0.001
Variety 0.773 .379 0.301 0.879 -0.371 0.973 0.001
Complexity 2.953 .086 0.193 1.718 -0.027 0.413 0.002
RELATIONSHIP BETWEEN POP MUSIC AND LYRICS
36
Activity 2.285 .131 0.014 1.512 -0.004 0.033 0.002
Optimism 0.250 .617 0.003 0.500 -0.008 0.013 0.000
Certainty 0.255 .614 -0.004 -0.504 -0.020 0.012 0.000
Realism 0.162 .687 -0.003 -0.403 -0.020 0.013 0.000
Commonality 5.361 .021 -0.025 -2.315 -0.047 -0.004 0.004
Mood 3: Passion, romance, power c Numerical terms 10.097 .002 -0.009 -3.178 -0.015 -0.004 0.007
Leveling 18.645 < .001 -0.043 4.318 0.023 0.062 0.013
Collectives 2.563 .110 -0.003 -1.601 -0.007 0.001 0.002
Satisfaction 0.004 .950 0.000 0.063 -0.002 0.002 0.000
Hardship 6.693 .010 0.036 2.587 0.009 0.062 0.005
Aggression 1.448 .229 0.022 1.203 -0.014 0.059 0.001
Cooperation 4.994 .026 -0.048 -2.235 -0.091 -0.006 0.004
Embellishment 9.388 .002 -0.031 -3.064 -0.051 -0.011 0.007
Variety 1.230 .268 -0.457 -1.109 -1.266 0.352 0.001
Optimism 0.931 .335 0.005 0.965 -0.005 0.014 0.001
Mood 4: Mystery, luxury, comfort d Number of different words 5.376 .021 0.004 2.319 0.001 0.007 0.004
Self-reference 0.047 .828 0.000 0.217 -0.002 0.003 0.000
Leveling 1.946 .163 -0.005 -1.395 -0.011 0.002 0.001
Hardship 3.073 .080 -0.009 -1.753 -0.018 0.001 0.002
Aggression 4.410 .036 -0.010 -2.100 -0.020 -0.001 0.003
Communication 2.986 .084 -0.007 -1.728 -0.016 0.001 0.002
Passivity 0.871 .351 -0.005 -0.933 -0.016 0.006 0.001
Familiarity 0.687 .407 -0.001 -0.829 -0.002 0.001 0.000
Diversity 7.104 .008 -0.054 -2.665 -0.094 -0.014 0.005
Liberation 0.312 .576 -0.002 -0.559 -0.011 0.006 0.000
Denial 0.700 .381 0.001 0.877 -0.001 0.004 0.001
Motion 0.105 .746 0.002 0.324 -0.011 0.015 0.000
Embellishment 0.749 .387 -0.020 -0.865 -0.067 0.026 0.001
Variety 1.534 .216 0.234 1.239 -0.137 0.605 0.001
Complexity 2.166 .141 0.046 1.472 -0.015 0.106 0.002
Activity 0.465 .495 -0.008 -0.682 -0.030 0.015 0.000
Optimism 0.038 .845 0.000 0.195 -0.003 0.003 0.000
Certainty 0.182 .670 0.001 0.426 -0.005 0.007 0.000
Realism 2.168 .141 0.003 1.473 -0.001 0.008 0.002
Commonality 0.184 .668 -0.004 -0.428 -0.020 0.013 0.000
Mood 5: Energetic, bold, outgoing e Number of different words 37.806 < .001 -0.017 -6.149 -0.022 -0.011 0.027
Numerical terms 1.249 .264 0.003 1.117 -0.002 0.009 0.001
Self-reference 6.420 .011 -0.005 -2.534 -0.008 -0.001 0.005
Tenacity 1.717 .190 0.002 1.310 -0.001 0.006 0.001
Leveling 0.119 .730 -0.002 -0.345 -0.015 0.011 0.000
RELATIONSHIP BETWEEN POP MUSIC AND LYRICS
37
Collectives 10.488 .001 0.013 3.238 0.005 0.021 0.007
Praise 0.170 .732 -0.003 -0.342 -0.019 0.013 0.000
Satisfaction 2.201 .138 0.002 1.484 -0.001 0.005 0.002
Inspiration 1.307 .253 -0.009 -1.143 -0.025 0.070 0.001
Hardship 1.308 .253 -0.007 -1.143 -0.019 0.005 0.001
Cognitive terms 0.714 .398 -0.005 -0.845 -0.016 0.007 0.001
Spatial awareness 13.351 < .001 -0.010 -3.654 -0.016 -0.005 0.010
Temporal awareness 0.427 .514 0.001 0.653 -0.003 0.005 0.000
Human interest 1.315 .252 0.002 1.147 -0.002 0.006 0.001
Concreteness 0.378 .539 -0.002 -0.615 -0.007 0.004 0.000
Past concern 1.283 .258 0.007 1.133 -0.005 0.019 0.001
Exclusion 8.065 .005 -0.032 -2.840 -0.054 -0.010 0.006
Motion 2.134 .144 -0.007 -1.461 -0.016 0.002 0.002
Insistence 0.171 .680 0.001 0.413 -0.002 0.004 0.000
Embellishment 3.603 .058 0.022 1.898 -0.001 0.045 0.003
Certainty 2.243 .134 -0.008 -1.498 -0.018 0.002 0.002
Mood 6: Calm, peace, tranquility f Number of different words 50.452 < .001 0.013 7.103 0.010 0.017 0.035
Numerical terms 2.420 .120 -0.001 -1.556 -0.003 0.000 0.002
Ambivalence 4.380 .037 0.008 2.093 0.000 0.015 0.003
Self-reference 1.356 .244 0.001 1.164 -0.001 0.004 0.001
Leveling 12.193 .000 0.018 3.492 0.008 0.029 0.009
Collectives 1.807 .179 0.000 -1.344 0.000 0.000 0.001
Satisfaction 22.598 .000 0.000 -4.754 0.000 0.000 0.016
Hardship 0.244 .621 0.003 0.494 -0.009 0.015 0.000
Passivity 2.582 .108 0.009 1.607 -0.002 0.019 0.002
Embellishment 1.300 .254 -0.006 -1.140 -0.016 0.004 0.001 a Overall model: F(18, 1391) = 5.703, p < .001, ηp
2 =.069. Predictor degrees of freedom = 1, 1391. b Overall model: F(24, 1385) = 17.858, p < .001, ηp
2 =.236. Predictor degrees of freedom = 1, 1385. c Overall model: F(10, 1399) = 14.017, p < .001, ηp
2 =.091. Predictor degrees of freedom = 1, 1399. d Overall model: F(20, 1389) = 5.655, p < .001, ηp
2 =.075. Predictor degrees of freedom = 1, 1389. e Overall model: F(21, 1388) = 13.541, p < .001, ηp
2 =.170. Predictor degrees of freedom = 1, 1388. f Overall model: F(10, 1399) = 19.335, p < .001, ηp
2 =.121. Predictor degrees of freedom = 1, 1399.
Note. CI = Confidence Interval.
RELATIONSHIP BETWEEN POP MUSIC AND LYRICS
38
Table 4. Results of the GLMM Analyses Testing Hypothesis 3.
Predictor variable F p Beta t 95% CI η2
Peak chart position a Tenacity 0.506 .477 0.000 -0.711 0.000 0.000 0.000
Collectives 0.131 .717 0.000 0.363 0.000 0.001 0.000
Satisfaction 0.268 .605 0.000 -0.518 -0.001 0.000 0.000
Familiarity 3.553 .060 0.000 1.885 0.000 0.001 0.003
Past concern 0.097 .756 0.000 -0.310 -0.002 0.001 0.000
Liberation 8.070 .005 0.002 2.841 0.000 0.003 0.006
Variety 0.736 .391 -0.040 -0.858 -0.131 0.051 0.001
Optimism 0.381 .537 0.000 -0.617 -0.001 0.001 0.000
Energy 8.225 .004 0.002 2.868 0.001 0.004 0.006
Music - Mystery, luxury, comfort 1.079 .299 -0.009 -1.039 -0.025 0.008 0.001
Music - Energetic, bold, outgoing 2.351 .125 0.008 1.533 -0.002 0.017 0.002
Music - Calm, peace, tranquility 0.095 .758 -0.003 -0.308 -0.020 0.015 0.000 Mean effect size for the significant lyrics variables = .006
Mean effect size for music significant variables = .006
Number of weeks on chart b Tenacity 0.063 .802 0.000 -0.250 -0.001 0.001 0.000
Leveling 2.633 .105 -0.002 -1.623 -0.005 0.000 0.002
Satisfaction 0.501 .479 0.000 -0.707 -0.002 0.001 0.000
Familiarity 6.162 .013 -0.001 -2.482 -0.001 0.000 0.004
Human interest 5.259 .022 -0.001 -2.293 -0.002 0.000 0.004
Concreteness 2.519 .113 0.001 1.587 0.000 0.002 0.002
Liberation 0.790 .374 -0.001 -0.889 -0.005 0.002 0.001
Motion 0.988 .320 -0.001 -0.994 -0.003 0.001 0.001
Variety 3.067 .080 0.163 1.751 -0.020 0.345 0.002
Complexity 0.081 .776 -0.007 -0.284 -0.058 0.043 0.000
Activity 0.075 .785 0.000 -0.273 -0.003 0.002 0.000
Optimism 0.839 .360 0.001 0.916 -0.002 0.005 0.001
Certainty 0.091 .763 -0.001 -0.301 -0.005 0.003 0.000
Realism 0.525 .469 -0.001 -0.724 -0.002 0.001 0.000
Commonality 0.066 .797 0.001 0.258 -0.005 0.006 0.000
Energy 0.086 .770 0.000 0.293 -0.002 0.003 0.000
Music - Clean, simple, relaxing 3.134 .077 0.045 1.770 -0.005 0.094 0.002
Music - Passion, romance, power 11.530 .001 -0.016 -3.396 -0.050 -0.007 0.008
Music - Mystery, luxury, comfort 1.995 .158 0.022 1.412 -0.009 0.053 0.001
Music - Energetic, bold, outgoing 5.354 .021 -0.017 -2.314 -0.031 -0.003 0.004 Mean effect size for the significant lyrics variables = .004 Mean effect size for the significant music variables = .006
UK hit popularity c Numerical terms 0.070 .791 0.000 -0.265 0.000 0.000 0.000
RELATIONSHIP BETWEEN POP MUSIC AND LYRICS
39
Collectives 10.602 .001 0.000 -3.256 0.000 0.000 0.008
Satisfaction 48.386 < .001 0.000 -6.956 0.000 0.000 0.035
Temporal awareness 0.675 .412 0.000 0.821 0.000 0.000 0.001
Present concern 3.019 .083 0.000 -1.738 0.000 0.000 0.002
Concreteness 4.529 .034 0.000 -2.128 0.000 0.000 0.003
Exclusion 10.514 .001 -0.001 -3.242 -0.002 0.000 0.008
BPM 8.481 .004 0.001 2.912 0.000 0.001 0.006
Music - Clean, simple, relaxing 1.201 .273 0.005 1.096 -0.004 0.014 0.001
Music - Happy, hopeful, ambition 8.532 .004 -0.006 -2.921 -0.010 -0.002 0.006
Music - Energetic, bold, outgoing 3.899 .049 -0.002 -1.974 -0.005 0.000 0.003 Mean effect size for the significant lyrics variables = .014 Mean effect size for the significant music variables = .005
UK hit appearance d Leveling 5.661 .017 -0.090 -2.379 -0.164 -0.016 0.004 Collectives 5.585 .018 0.080 2.363 0.014 0.146 0.004 Satisfaction 0.231 .631 -0.011 -0.480 -0.058 0.035 0.000 Cognitive terms 0.342 .559 -0.025 -0.585 -0.100 0.060 0.000 Spatial awareness 9.154 .003 -0.054 -3.026 -0.088 -0.019 0.007 Familiarity 0.454 .501 -0.005 -0.674 -0.019 0.009 0.000 Temporal awareness 0.018 .893 -0.002 -0.135 -0.037 0.032 0.000 Present concern 1.103 .294 -0.027 -1.050 -0.077 0.023 0.001 Past concern 0.099 .753 -0.014 -0.314 -0.100 0.072 0.000 Exclusion 11.195 .001 -0.252 -3.346 -0.399 -0.104 0.008 Insistence 0.107 .743 -0.003 -0.328 -0.023 0.016 0.000 Embellishment 2.785 .095 0.200 1.669 -0.035 0.436 0.002 Variety 1.253 .263 3.249 1.120 -2.444 8.941 0.001 Complexity 0.315 .575 -0.480 -0.561 -1.926 1.069 0.000 Activity 0.518 .472 0.029 0.720 -0.050 0.108 0.000 Optimism 0.008 .927 0.005 0.091 -0.096 0.105 0.000 Certainty 0.172 .679 -0.023 -0.414 -0.131 0.086 0.000 Realism 0.573 .449 0.061 0.757 -0.098 0.221 0.000 Commonality 0.390 .532 -0.068 -0.625 -0.283 0.146 0.000 Music - Clean, simple, relaxing 5.865 .016 1.765 2.422 0.335 3.195 0.004 Music - Energetic, bold, outgoing 2.915 .088 -0.311 -1.707 -0.668 0.046 0.002
Mean effect size for the significant lyrics variables = .006 Mean effect size for the significant music variables = .004
a Overall model: F(12, 1396) = 15.132, p < .001, ηp2 =.115. Predictor variables degrees of freedom = 1, 1396.
b Overall model: F(20, 1388) = 8.768, p < .001, ηp2 =.112. Predictor variables degrees of freedom = 1, 1388.
c Overall model: F(11, 1329) = 6.277, p < .001, ηp2 =.049. Predictor variables degrees of freedom = 1, 1329.
d Overall model: F(21, 1388) = 8.205, p < .001, ηp2 =.110. Predictor variables degrees of freedom = 1, 1388.
Minerva Access is the Institutional Repository of The University of Melbourne
Author/s:
North, AC; Krause, AE; Ritchie, D
Title:
The relationship between pop music and lyrics: A computerized content analysis of the
United Kingdom’s weekly top five singles, 1999–2013
Date:
2020
Citation:
North, A. C., Krause, A. E. & Ritchie, D. (2020). The relationship between pop music and
lyrics: A computerized content analysis of the United Kingdom’s weekly top five singles,
1999–2013. Psychology of Music, 49 (4), https://doi.org/10.1177/0305735619896409.
Persistent Link:
http://hdl.handle.net/11343/233792
File Description:
Accepted version