Embed Size (px)
Citation preview
RELATIONSHIP BETWEEN RELIGIOSITY AND HAPPINESS: THE MEDIATING ROLE OF SELF-
CONTROL, SELF-REGULATION, AND LIFE SATISFACTION
ABDUL AZIZ RUSMAN
UNIVERSITI SAINS MALAYSIA
2019
RELATIONSHIP BETWEEN RELIGIOSITY AND HAPPINESS: THE MEDIATING ROLE OF SELF-
CONTROL, SELF-REGULATION, AND LIFE SATISFACTION
by
ABDUL AZIZ RUSMAN
Thesis submitted in fulfillment of the requirements for the degree of
Doctor of Philosophy
August 2019

ii
ACKNOWLEDGEMENT
All praise is due to Allah, the Beneficent the Merciful. I am very grateful to
everyone who has made this study of reverie crystallized. It would not have been
possible without the incredible support that I received. First, I would like to express
my special appreciation and thanks to my main supervisor Dr. Intan Hashimah
Mohd. Hashim and my co-supervisor Dr. Norzarina Mohd. Zaharim for their
guidance, knowledge, and encouragement, who helped me to find my voice through
the thesis process.
I would like to recognize my family for all of their love and assistance. I am
grateful for my family’s strength, guidance, and support to follow my reverie. I am
thankful that my parents, Rusman Hasibuan and Naslah Daulay, blessed me with the
appreciation for reverie that led to this dissertation. Thank you also to my mother-in-
law, Berliana Nasution, that encouraged my enjoyment in reverie. I owe a special
thanks to my wife, Fauziah Nasution, and my two ‘menjeng”, Shafi and Shifa, for
tough-love, sympathy, and comedic.
Special thanks also reserved for Universiti Sains Malaysia which facilitated
the completion of this thesis, and for Islamic State University of North Sumatera
which permitted the study. Last and not least, my warmest thanks to administrative
staff at Postgraduate Office of the School of Social Science.
iii
TABLE OF CONTENTS
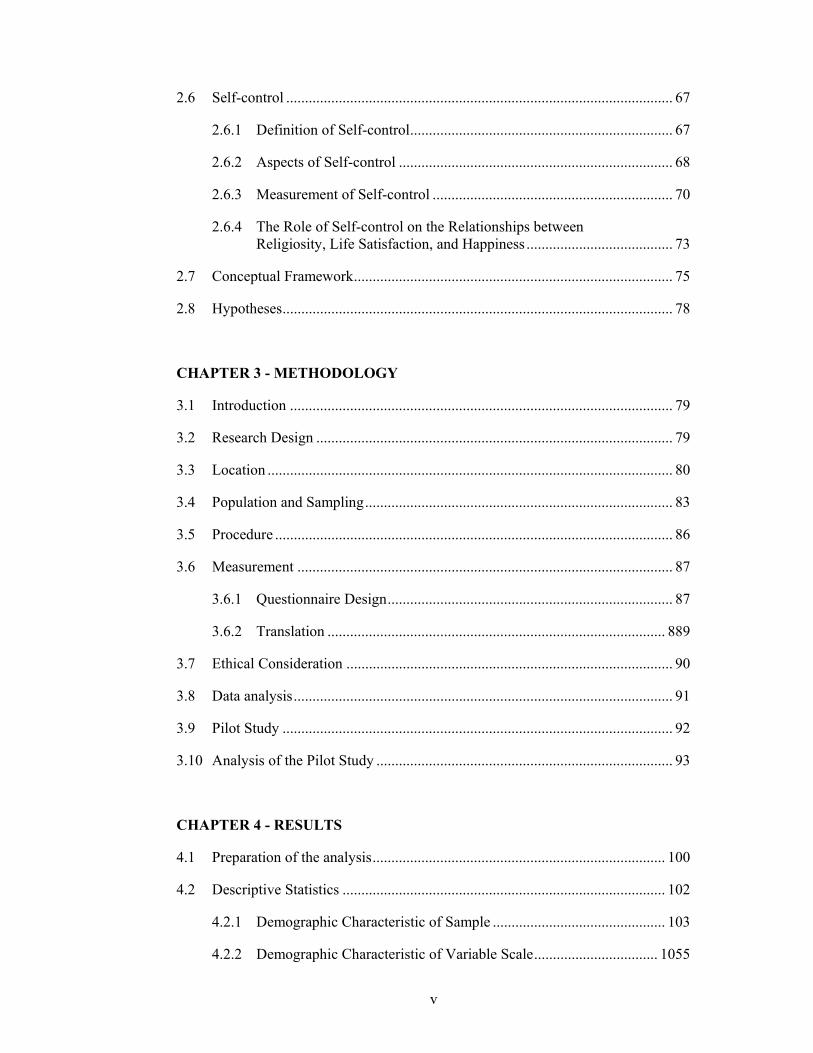
ACKNOWLEDGEMENT ......................................................................................... ii
TABLE OF CONTENTS .......................................................................................... iii
LIST OF TABLES .................................................................................................. viii
LIST OF FIGURES ................................................................................................... x
ABSTRAK ................................................................................................................. xi
ABSTRACT ............................................................................................................. xiii
CHAPTER 1 - INTRODUCTION
1.1 Introduction ........................................................................................................ 1
1.2 Problem Statement .............................................................................................. 3
1.3 Research Objectives ........................................................................................... 6
1.4 Research Questions ............................................................................................. 7
1.5 Significance of Study .......................................................................................... 7
1.6 Scope of the Study .............................................................................................. 9
1.7 Organization of the Chapter ............................................................................... 9
1.8 Summary ........................................................................................................... 11
CHAPTER 2 - LITERATURE REVIEW
2.1 Introduction ...................................................................................................... 12
2.2 Happiness .......................................................................................................... 12
2.2.1 Historical Development of Happiness .................................................. 12
2.2.2 Conceptualizing of Happiness .............................................................. 14
2.2.2(a) Hedonic Tradition ................................................................ 14
2.2.2(b) Eudaimonic Tradition ........................................................... 15
2.2.2(c) Islamic Tradition .................................................................. 16
iv
2.2.3 Theories of Happiness .......................................................................... 17
2.2.4 Happiness in this study ......................................................................... 20
2.2.5 Measurements of Happiness ................................................................. 21
2.2.6 Determinants of Happiness ................................................................... 26
2.2.6(a) The Person’s Genetic Set Point ............................................ 27
2.2.6(b) The Person’s Current Circumstances ................................... 30
2.2.6(c) The Person’s Current Intentional Activities ......................... 32
2.2.7 Consequences of Happiness .................................................................. 36
2.2.7(a) Creativity and Productivity .................................................. 37
2.2.7(b) Longevity ............................................................................. 40
2.2.7(c) Social Relationships and Pro-social Behavior ..................... 41
2.3 Life Satisfaction ................................................................................................ 41
2.3.1 Definition of Life Satisfaction .............................................................. 41
2.3.2 Components of Life Satisfaction .......................................................... 42
2.3.3 Measurement of Life Satisfaction ......................................................... 44
2.3.4 Happiness and Life Satisfaction ........................................................... 47
2.4 Religiosity ......................................................................................................... 49
2.4.1 Definition of Religiosity ....................................................................... 49
2.4.2 Religiosity in Islamic Context. ............................................................. 49
2.4.3 Aspects of Religiosity ........................................................................... 51
2.4.4 Measurement of Religiosity .................................................................. 53
2.4.5 Religiosity, Life Satisfaction, and Happiness ....................................... 55
2.5 Self-regulation .................................................................................................. 59
2.5.1 Definition of Self-regulation ................................................................. 59
2.5.2 Aspects of Self-regulation .................................................................... 60
2.5.3 Measurement of Self-regulation ........................................................... 63
2.5.4 The Role of Self-regulation on the Relationships between Religiosity, Life Satisfaction, and Happiness ....................................... 64
v
2.6 Self-control ....................................................................................................... 67
2.6.1 Definition of Self-control ...................................................................... 67
2.6.2 Aspects of Self-control ......................................................................... 68
2.6.3 Measurement of Self-control ................................................................ 70
2.6.4 The Role of Self-control on the Relationships between Religiosity, Life Satisfaction, and Happiness ....................................... 73
2.7 Conceptual Framework ..................................................................................... 75
2.8 Hypotheses ........................................................................................................ 78
CHAPTER 3 - METHODOLOGY
3.1 Introduction ...................................................................................................... 79
3.2 Research Design ............................................................................................... 79
3.3 Location ............................................................................................................ 80
3.4 Population and Sampling .................................................................................. 83
3.5 Procedure .......................................................................................................... 86
3.6 Measurement .................................................................................................... 87
3.6.1 Questionnaire Design ............................................................................ 87
3.6.2 Translation .......................................................................................... 889
3.7 Ethical Consideration ....................................................................................... 90
3.8 Data analysis ..................................................................................................... 91
3.9 Pilot Study ........................................................................................................ 92
3.10 Analysis of the Pilot Study ............................................................................... 93
CHAPTER 4 - RESULTS
4.1 Preparation of the analysis .............................................................................. 100
4.2 Descriptive Statistics ...................................................................................... 102
4.2.1 Demographic Characteristic of Sample .............................................. 103
4.2.2 Demographic Characteristic of Variable Scale ................................. 1055
vi
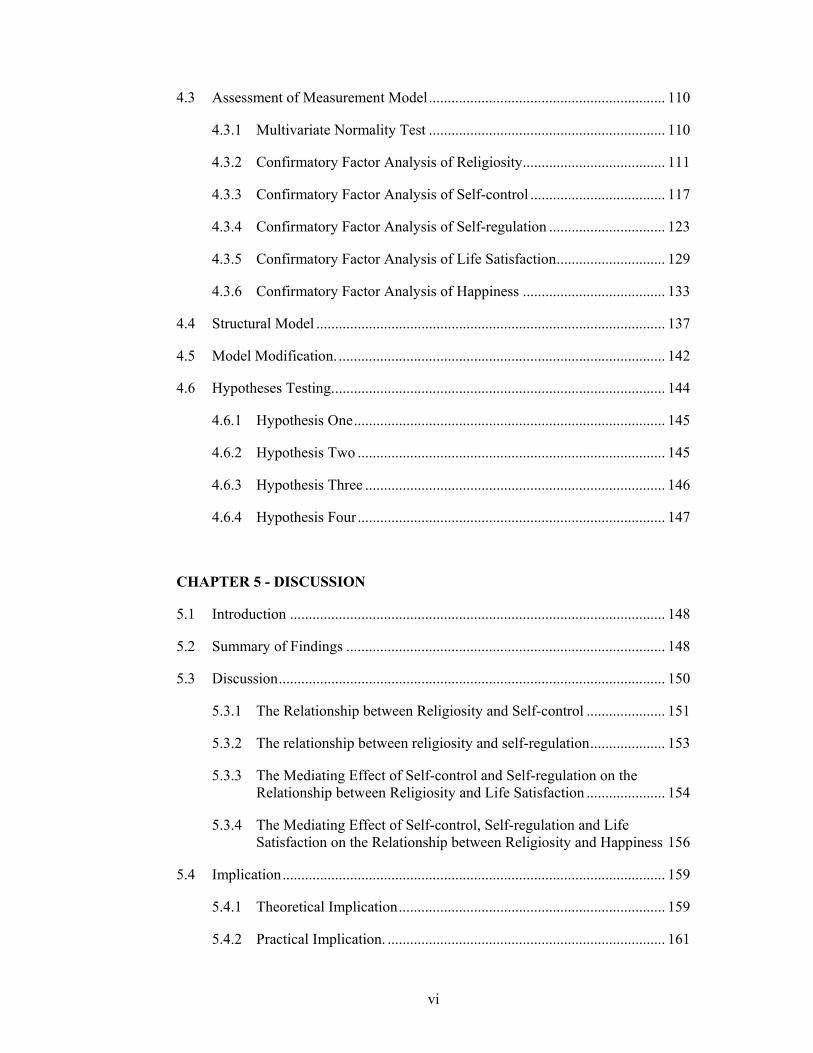
4.3 Assessment of Measurement Model ............................................................... 110
4.3.1 Multivariate Normality Test ............................................................... 110
4.3.2 Confirmatory Factor Analysis of Religiosity. ..................................... 111
4.3.3 Confirmatory Factor Analysis of Self-control .................................... 117
4.3.4 Confirmatory Factor Analysis of Self-regulation ............................... 123
4.3.5 Confirmatory Factor Analysis of Life Satisfaction ............................. 129
4.3.6 Confirmatory Factor Analysis of Happiness ...................................... 133
4.4 Structural Model ............................................................................................. 137
4.5 Model Modification. ....................................................................................... 142
4.6 Hypotheses Testing. ........................................................................................ 144
4.6.1 Hypothesis One ................................................................................... 145
4.6.2 Hypothesis Two .................................................................................. 145
4.6.3 Hypothesis Three ................................................................................ 146
4.6.4 Hypothesis Four .................................................................................. 147
CHAPTER 5 - DISCUSSION
5.1 Introduction .................................................................................................... 148
5.2 Summary of Findings ..................................................................................... 148
5.3 Discussion ....................................................................................................... 150
5.3.1 The Relationship between Religiosity and Self-control ..................... 151
5.3.2 The relationship between religiosity and self-regulation .................... 153
5.3.3 The Mediating Effect of Self-control and Self-regulation on the Relationship between Religiosity and Life Satisfaction ..................... 154
5.3.4 The Mediating Effect of Self-control, Self-regulation and Life Satisfaction on the Relationship between Religiosity and Happiness 156
5.4 Implication ...................................................................................................... 159
5.4.1 Theoretical Implication ....................................................................... 159
5.4.2 Practical Implication. .......................................................................... 161

vii
5.5 Limitations and Future Direction ................................................................... 162
5.6 Conclusion ...................................................................................................... 163
REFERENCES ....................................................................................................... 164
APPENDICES
viii
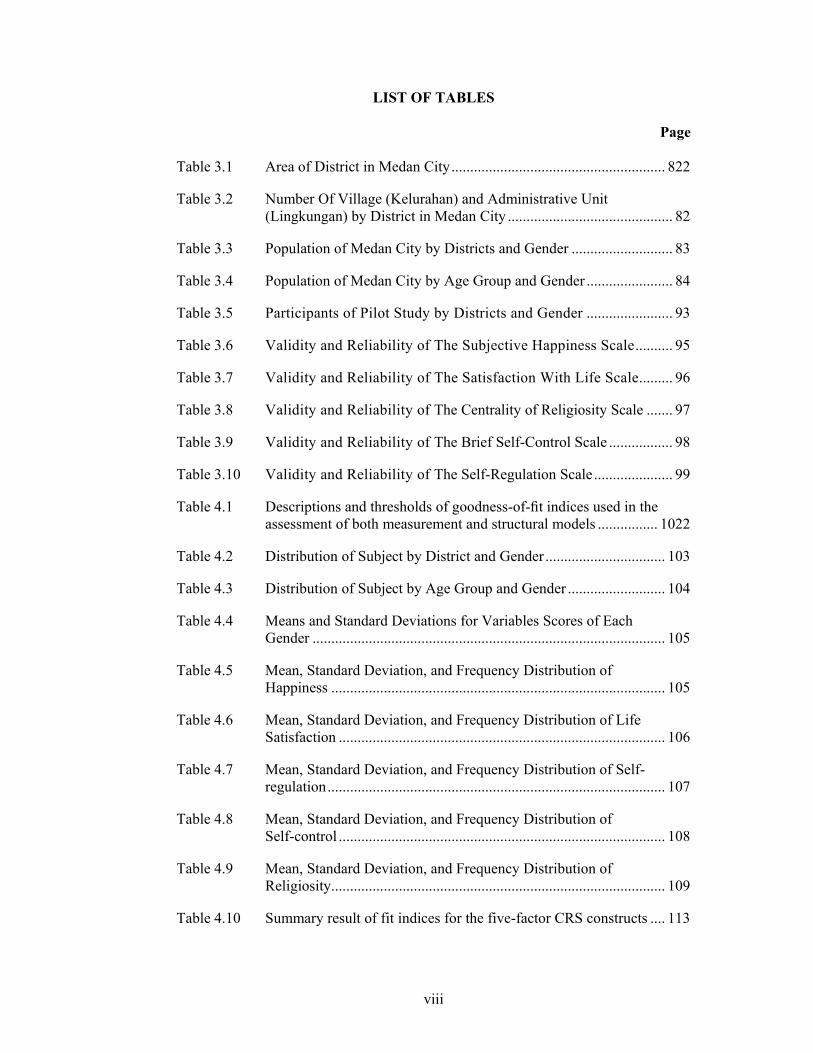
LIST OF TABLES
Page
Table 3.1 Area of District in Medan City ......................................................... 822
Table 3.2 Number Of Village (Kelurahan) and Administrative Unit (Lingkungan) by District in Medan City ............................................ 82
Table 3.3 Population of Medan City by Districts and Gender ........................... 83
Table 3.4 Population of Medan City by Age Group and Gender ....................... 84
Table 3.5 Participants of Pilot Study by Districts and Gender ....................... 93
Table 3.6 Validity and Reliability of The Subjective Happiness Scale .......... 95
Table 3.7 Validity and Reliability of The Satisfaction With Life Scale ......... 96
Table 3.8 Validity and Reliability of The Centrality of Religiosity Scale ....... 97
Table 3.9 Validity and Reliability of The Brief Self-Control Scale ................. 98
Table 3.10 Validity and Reliability of The Self-Regulation Scale ..................... 99
Table 4.1 Descriptions and thresholds of goodness-of-fit indices used in the assessment of both measurement and structural models ................ 1022
Table 4.2 Distribution of Subject by District and Gender ................................ 103
Table 4.3 Distribution of Subject by Age Group and Gender .......................... 104
Table 4.4 Means and Standard Deviations for Variables Scores of Each Gender .............................................................................................. 105
Table 4.5 Mean, Standard Deviation, and Frequency Distribution of Happiness ......................................................................................... 105
Table 4.6 Mean, Standard Deviation, and Frequency Distribution of Life Satisfaction ....................................................................................... 106
Table 4.7 Mean, Standard Deviation, and Frequency Distribution of Self-regulation .......................................................................................... 107
Table 4.8 Mean, Standard Deviation, and Frequency Distribution of Self-control ....................................................................................... 108
Table 4.9 Mean, Standard Deviation, and Frequency Distribution of Religiosity......................................................................................... 109
Table 4.10 Summary result of fit indices for the five-factor CRS constructs .... 113
ix
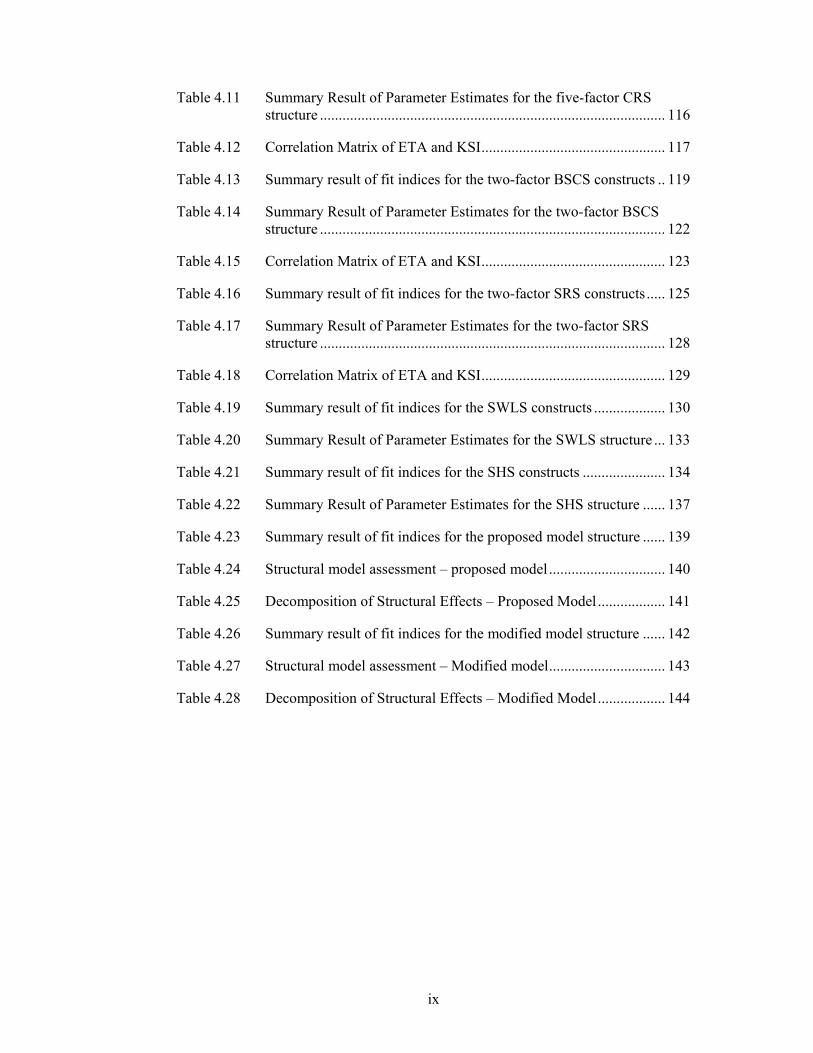
Table 4.11 Summary Result of Parameter Estimates for the five-factor CRS structure ............................................................................................ 116
Table 4.12 Correlation Matrix of ETA and KSI ................................................. 117
Table 4.13 Summary result of fit indices for the two-factor BSCS constructs .. 119
Table 4.14 Summary Result of Parameter Estimates for the two-factor BSCS structure ............................................................................................ 122
Table 4.15 Correlation Matrix of ETA and KSI ................................................. 123
Table 4.16 Summary result of fit indices for the two-factor SRS constructs ..... 125
Table 4.17 Summary Result of Parameter Estimates for the two-factor SRS structure ............................................................................................ 128
Table 4.18 Correlation Matrix of ETA and KSI ................................................. 129
Table 4.19 Summary result of fit indices for the SWLS constructs ................... 130
Table 4.20 Summary Result of Parameter Estimates for the SWLS structure ... 133
Table 4.21 Summary result of fit indices for the SHS constructs ...................... 134
Table 4.22 Summary Result of Parameter Estimates for the SHS structure ...... 137
Table 4.23 Summary result of fit indices for the proposed model structure ...... 139
Table 4.24 Structural model assessment – proposed model ............................... 140
Table 4.25 Decomposition of Structural Effects – Proposed Model .................. 141
Table 4.26 Summary result of fit indices for the modified model structure ...... 142
Table 4.27 Structural model assessment – Modified model ............................... 143
Table 4.28 Decomposition of Structural Effects – Modified Model .................. 144
x
LIST OF FIGURE
Page
Figure 2.1 Hypothesized Structural model ........................................................ 77
Figure 4.1 Second-Order SEM Model of CRS ................................................ 112
Figure 4.2a Standardized Solution of item and five-factor CRS structure ........ 114
Figure 4.2b t-Value of item and five-factor CRS structure ............................... 115
Figure 4.3 Second-Order SEM Model of BSCS .............................................. 118
Figure 4.4a Standardized Solution of item and two-factor BSCS structure ...... 120
Figure 4.4b t-Value of item and two-factor BSCS structure ............................. 121
Figure 4.5 Second-Order SEM Model of SRS ................................................ 124
Figure 4.6a Standardized Solution of item and two-factor SRS structure ........ 126
Figure 4.6b t-Value of item and two-factor SRS structure ................................ 127
Figure 4.7 First-Order SEM Model of SWLS ................................................. 129
Figure 4.8a Standardized Solution of item SWLS structure ............................. 131
Figure 4.8b t-Value of item for SWLS structure ............................................... 132
Figure 4.9 First Order SEM of SHS ................................................................ 134
Figure 4.10a Standardized Solution of item SHS structure................................. 135
Figure 4.10b t-Value of item for SHS structure .................................................. 136
Figure 4.11 Path diagram for structural equation model with one latent predictor variable ξ1, three mediator variables η1, η2, η3 and one criterion variable η4 ................................................................. 138
Figure 4.12 Completely Standardized Path Coefficient for the Proposed Structure Model .............................................................................. 140
Figure 4. 13 Completely Standardized Path Coefficient for the Modified Structure Model .............................................................................. 143
xi
HUBUNGAN ANTARA KEAGAMAAN DAN KEGEMBIRAAN: PERANAN
PENGANTARA KAWALAN KENDIRI, PERATURAN KENDIRI, DAN
KEPUASAN HIDUP
ABSTRAK
Keagamaan telah dikaitkan dengan kegembiraan tetapi laluan sebenar yang
menggariskan hubungan tersebut masih kabur. Satu mekanisme yang mungkin dapat
menerangkan hubungan antara keagamaan dan kegembiraan adalah peranan
keagamaan dalam mempromosikan kawalan dan peraturan kendiri. Kawalan dan
peraturan kendiri kemudiannya mempengaruhi kepuasan hidup dan seterusnya
kegembiraan. Tujuan kajian ini adalah untuk mengkaji hubungan antara keagamaan,
kawalan kendiri, peraturan kendiri, kepuasan hidup dan kegembiraan. Lebih khusus
lagi, kajian ini mengkaji (1) hubungan antara keagamaan dan kawalan kendiri; (2)
hubungan antara keagamaan dan peraturan kendiri; (3) kesan pengantaraan kawalan
kendiri dan peraturan kendiri terhadap hubungan antara keagamaan dan kepuasan
hidup; dan (4) kesan pengantaraan kawalan kendiri, peraturan kendiri, dan kepuasan
hidup terhadap hubungan di antara keagamaan dan kegembiraan. Peserta kajian
terdiri daripada enam ratus dua puluh lapan orang dewasa pertengahan di Medan,
Indonesia. Mereka direkrut melalui persampelan bertujuan dan berstrata. Kajian ini
menggunakan reka bentuk rentas dan pendekatan kuantitatif. Data dikumpul
menggunakan lima soal selidik laporan kendiri, iaitu Skala Kegembiraan Subjektif /
Subjective Happiness Scale (Lyubomirsky et al., 1999); Skala Kepuasan dengan
Kehidupan / Satisfaction with Life Scale (Diener, et al, 1985); Skala Keutamaan
Keagamaan / Centrality of Religiosity Scale (Huber, 2003); Skala Ringkas Kawalan
Kendiri / The Brief Self-Control Scale (Tangney, et al., 2004); dan Skala Peraturan

xii
Kendiri / Self-Regulation Scale (Schwarzer, et al, 1999). Data dianalisis dengan
menggunakan Model Persamaan Struktur / Structual Equation Model (menggunakan
perisian LISREL 8.80) yang penelitian varians antara pembolehubah dalaman
(endogenous) dan luaran (exogenous) dilakukan serentak. Keputusan menunjukkan
bahawa (a) keagamaan berkait secara positif dengan kawalan kendiri (.287, p <.01),
dengan magnitud hubungan saiz kesan adalah .083; (b) keagamaan mempunyai
kaitan positif dengan peraturan (.283, p <.01), dengan magnitud hubungan saiz kesan
adalah .174; (c) kawalan kendiri dan peraturan kendiri menunjukkan kesan
pengantara secara positif untuk hubungan di antara keagamaan dan kepuasan hidup
(.131, p < .05 untuk keagamaan; .283, p < .01 untuk kawalan kendiri; dan .299, p <
.01 untuk peraturan kendiri), magnitud hubungan menunjukkan saiz kesan 0.333; dan
(d) kawalan kendiri, peraturan kendiri, dan kepuasan hidup menunjukkan kesan
pengantara secara positif untuk hubungan di antara keagamaan dan kegembiraan
(.188, p < .01 untuk keagamaan; .275, p < .01 untuk kawalan kendiri; .439, p < .01
untuk peraturan kendiri; dan .240, p < .01 untuk kepuasan hidup) dengan magnitud
hubungan yang diperkali menunjukkan saiz kesan .794. Penemuan ini memberikan
bukti tentang peranan penting kawalan diri dan peraturan kendiri dalam menjelaskan
hubungan di antara keagamaan dan kegembiraan dan menyumbang kepada
pemahaman yang lebih baik mengenai mekanisme yang menggariskan hubungan di
antara pembolehubah - pembolehubah ini.
xiii
RELATIONSHIP BETWEEN RELIGIOSITY AND HAPPINESS: THE
MEDIATING ROLE OF SELF-CONTROL, SELF-REGULATION, AND
LIFE SATISFACTION
ABSTRACT
Religiosity has been associated with happiness but the exact pathway
outlining the relationship remains unclear. One possible mechanism explaining the
relationship between religiosity and happiness is the role of religiosity in promoting
self-control and self-regulation. Self-control and self-regulation subsequently
influence life satisfaction and consequently happiness. The aim of this study is to
examine further the relationships between religiosity, self-control, self-regulation,
life satisfaction and happiness. More specifically, this study examines (1) the
relationship between religiosity and self-control; (2) the relationship between
religiosity and self-regulation; (3) the mediating effect of self-control and self-
regulation on the relationship between religiosity and life satisfaction; and (4) the
mediating effect of self-control, self-regulation, and life satisfaction on the
relationship between religiosity and happiness. Participants were six hundred and
twenty-eight of middle adults in Medan, Indonesia. They were recruited through
purposive stratified sampling. This explanatory research employed a cross-sectional
design and a quantitative approach. Data were collected using five self-report
questionnaires, namely the Subjective Happiness Scale (Lyubomirsky et al., 1999);
the Satisfaction with Life Scale (Diener, et al., 1985); the Centrality of Religiosity
Scale (Huber, 2003); the brief Self-control Scale (Tangney, et al., 2004); and the
Self-regulation Scale (Schwarzer, et al., 1999). Data were analyzed by applying
Structural Equation Model (using the LISREL software 8.80) which provides
xiv
simultaneous examination of variance between endogenous and exogenous variables.
The results revealed that (a) religiosity was positively related to self-control (.287, p
< .01), the magnitude of the relationship had an effect size of .083; (b) religiosity was
positively related to self-regulation (.283, p < .01), the magnitude of the relationship
had an effect size of .174; (c) self-control and self-regulation positively mediated the
relationship between religiosity and life satisfaction (.131, p < .05 for religiosity;
.283, p < .01 for self-control; and .299, p < .01 for self-regulation), the magnitude of
the relationship had an effect size of 0.333; and (d) self-control, self-regulation, and
life satisfaction were positively mediated the relationship between religiosity and
happiness (.188, p < .01 for religiosity; .275, p < .01 for self-control; .439, p < .01 for
self-regulation; and .240, p < .01 for life satisfaction) the magnitude of the
relationship by squaring the coefficient had an effect size of .794. The finding
provides evidence for the important role of self-control and self-regulation in
explaining the relationship between religiosity and happiness and contributes to
better understanding about the mechanisms outlining the relationship between these
1
CHAPTER 1
INTRODUCTION
1.1 Introduction
The quest to live a happy life is the fundamental drive of human natural
instinct. Whatever the behaviors people may conduct, they are all motivated to move
toward ever-greater personal happiness (Lyubomirsky, 2008). Indeed, many
substantial evidences have elucidated that happiness is associated with and precedes
desirable life outcomes. For example, happiness has led to greater longevity
(Danner, et al., 2001; Ostir, et al., 2000), better social life and more cooperation with
others (Diener & Seligman, 2004; Schimmack, et al., 2004), stronger relationships
(Feeney & Collins, 2015), less depression (Smith, et al., 2003), and even less chances
to engage in criminal activity (Baier & Wright, 2001).
Recently, the concept of happiness is almost indistinguishable from life
satisfaction that leads for them to be used interchangeably (Lucas, et al., 2003; Staw
& Barsade, 1993). Despite these terms are interconnected concepts, however, both
terms comprised different meanings that are often mixed up. Life satisfaction
requires cognitive processing of the conditions of life as a whole (Diener, et al.,
2004), whereas happiness concerns the sum of emotional experiences as time passes
(Lyubomirsky, et al., 2005). Thus, it is possible for a person to be satisfied with life
even if he or she experiences little pleasant affect, and vice versa (Diener, et al.,
2004). The present study proposes this conceptual differences between happiness
and life satisfaction, in which life satisfaction may lead to the happiness (Heller et
al., 2004; Pearson, 2008).
2
There is a long history of scientific studies from a multitude of disciplines
pointing out that religiosity has a positive link to happiness (Inglehart, 2010). A
huge amount of published researches have generated almost similar conclusions that
religiosity is positively and consistently related to life satisfaction and happiness
(Sillick, et al., 2013; Diener, et al., 2011; Inglehart, 2010). Although it seems fair
established and well documented, but the mechanism of how religiosity shapes life
satisfaction and effects happiness remains not fully understood. This leads to the
need to investigate this link and examine whether there are any mediating variables
explaining the relationships between these three constructs. This study proposes a
model outlines the relationship between religiosity, life satisfaction and happiness.
One possible mechanism is that the link from religiosity to happiness stems
partly from religion’s capability to enhance self-control and self-regulation. Carver
& Scheier (1998) have denoted that self-control is a part of the wider phenomenon of
self-regulation, associated with the process by which one adjusted behavior to
conform to the expected norms. They further explained that while self-regulating,
one is leading and modifying one’s behavior in pursuit of some preferred results or
goals. In addition, self-regulation often arises outside of awareness or without
requiring any meaningful effort (Fitzsimmons & Bargh, 2004). Perhaps through this
self-regulatory process, religious constructs can be triggered in an automatic fashion
or effortlessly (Shariff & Norenzayan, 2007) and thus foster one’s satisfaction with
life and happiness.
However, the proposed interrelations of the constructs need further empirical
inquiry. Additionally, almost all existing studies conducted in western culture such
as documented by Ano & Vasconcelles (2005), Layard (2005), and Stutzer & Frey
(2002). In relation to this issue, not many studies have done in the Indonesian

3
context, especially in North Sumatera. Thus, the present study is interested in
investigating happiness and life satisfaction among people of North Sumatera based
on how religiosity influences both self-control and self-regulation and -in turn-
affects life satisfaction and happiness. Data analysis used in this research is
Structural Equation Model (SEM). The research phenomenon further describes and
explains through this model.
1.2 Problem Statement
Indonesia with a total population of considerably more than 240 million
people, of which over 200 million identifying themselves as Muslim (BPS, 2016),
contains the world’s largest Muslim population. Although there is only less pressure
from some groups in Indonesia to incorporate Islamic law into the judicial code than
in many other Muslim majority countries (Davis & Robinson, 2006), however,
excitement over Islamic religious rituals is a widespread social and cultural
phenomenon in this country. Every year an increasing number of Indonesian
Muslims perform Umrah and hope to be shortlisted in Indonesia’s annual Hajj quota
with waiting list getting longer by the year (Agung, 2015). Religion is a huge part of
everyday’s lives in Indonesia in which television programs are interrupted for the
call to daily prayers (adzan). People also fast the month of Ramadan, and engage in
various forms of religious rituals, such as assembly of dhikr (Hafiz, 2015). Even
non-practicing Muslims are likely to be influenced by Islamic values as these
become intertwined with cultural norms and values (French, 2008). For example,
non-Muslims in Indonesia might refrain from drinking alcohol because it is not
customary to serve it at meals and social events because of religious prohibitions.
4
However, this widespread excitement over religious ritual is still not
accompanied by an increase in people’s happiness. Based on the world happiness
report 2018 (Helliwell, et al., 2018), published by UN SDSN (United Nation
Sustainable Development Solutions Network), Indonesia’s people happiness has
decreased from 2012 to 2017. The report provides that happiness index of Indonesia
fell gradually from 5.35 index 2012 to 5.09 index in 2017. Furthermore, the report
also reveals a decline of Indonesia’s happiness ranks, of the 156 countries surveyed
over the year 2015-2017, Indonesia was ranked 74th in 2015, declined to 79th in 2016,
and dropped further to rank 96th in 2017 with a score 5.09 on the 0 to 10 scale. Even
when compared to the average score for Southeast Asia (mean = 5.280), Indonesia
has a happiness level below average. It is further reported that Indonesia’s happiness
index from 2008-2010 to 2015-2017 has decreased by -0.160. This low level of
people’s happiness in Indonesia also reflected in various phenomena. To note a few,
the growth of various violence and intolerance behaviors -whether it relates to
religion, ethnicity, state or community, have been reported in Indonesia (Umi, 2010;
Yenni, 2016; Christophe, 2017). According to Setara Institute, there were 117 cases
of violence conducted by community social organization in 2010, and increased to
244 cases in 2011 (Sutowo & Wibisono, 2013). However, despite the high level of
excitement or enthusiasm in performing religious rituals in Indonesia, but issues of
unhappiness and violence remain intrinsic parts of Indonesian lives.
Nevertheless, researches conducted to look at the link between religiosity and
happiness are firmly well known within the scientific literature. Several excellent
studies have found a positive relationship between the two (Krause, et al., 2018;
Sillick, et al., 2013; Diener, et al., 2011; Inglehart, 2010). Despite the apparent
consistency of these findings, however, this relationship still presents a curious
5
dilemma, especially when looking at real live community samples such as Indonesia.
Thus, it is important to unpack the mechanism of how religiosity can be linked to life
satisfaction and happiness, especially in the context of Indonesia where religious
euphoria is high and yet happiness is low.
As mentioned previously, many researches have been using the concept of
happiness and life satisfaction interchangeably. Although these two are interrelated,
however, they have different meanings. Lumpkin & Hunt (1989) describe life
satisfaction as the way in which a person perceives how one’s life has been up to
now and how one feels one’s life is going to be in the future. Meanwhile, happiness
may be as the result of a person’s perception of experiencing positive emotions
including life satisfaction. If happiness and life satisfaction are of the same latent
variable, accordingly the same independent variables should validate them
identically. Unfortunately, a study conducted by Gundelach & Kreiner (2004)
provided evidence that the two variables actually are different and that their
relationships to macro-social variables differ radically. Thus, even though there is a
strong correlation between the two, they should not considered as the same latent
variable. Hence, additional empirical evidence for these conceptual differences
between happiness and life satisfaction is highly indispensable, in which life
satisfaction conceptualized as influencing the feeling of happiness.
A broad empirical study supports the notion that religiosity effectively fosters
self-regulation and self-control (McCullough & Willoughby, 2013). It is worth
noting that the association may be one route in which religiosity is able to fosters
self-regulation and self-control and thereby influence happiness. The present study
tries to extend this line of thinking by suggesting that religiosity is robustly
associated with self-regulation and self-control during the course of life, then these
6
associations could explain further the religiosity’s relationship with life satisfaction
and happiness. Hence, further empirical scrutiny of the interconnections among
these concepts is required to address this issue.
In addition, most researches that looked at the inter-relatedness of different
variables have focused on Western populations. Thus, scientific psychological
investigation on Eastern populations with different social and cultural considerations,
particularly in Indonesia, is required. This is a part of the attempt to capture a
broader understanding of psychological knowledge that applicable across a wider
range of populations.
1.3 Research Objectives
This study intends to explore how religiosity influences people’s life
satisfaction and happiness in Medan, North Sumatera, Indonesia. As such, mediator
variables are the main consideration of this study. To address this purpose, research
objectives are formulated to test serial mediation of the relationship between
religiosity and happiness through self-control, self-regulation, and life satisfaction;
and to provide an overview whether or not this indirect serial mediation effect
accounts for the relationship between religiosity and happiness. Specifically, this
study aims to investigate:
1. The relationship between religiosity and self-control.
2. The relationship between religiosity and self-regulation.
3. The mediating effect of self-control and self-regulation on the relationship
between religiosity and life satisfaction.
4. The mediating effect of self-control, self-regulation, and life satisfaction on
the relationship between religiosity and happiness.
7
1.4 Research Questions
As initially reflected on research objectives mentioned above, this study is
part of the attempt to investigate religiosity and its possible influence on happiness
through mediating role of self-control, self-regulation, and life satisfaction. That is,
it sought to answer the questions formulated as follow:
1. Does religiosity positively relate to self-control?
2. Does religiosity positively relate to self-regulation?
3. Do self-control and self-regulation mediate the relationship between
religiosity and life satisfaction?
4. Do self-control, self-regulation, and life satisfaction mediate the relationship
between religiosity and happiness?
1.5 Significance of Study
This study is significant in a number of ways. First, it can contribute a
comprehensive look into why -for some people- a high level of enthusiasm or
excitement in performing religious rituals does not always lead them to a happier life
and it does so by providing better understanding about how religiosity to be more
useful for adherents. However, the whole of religious rituals is based around self-
control. Whatever the acts of worship and rituals commanded is to build in a person
the kind of restraint, discipline, and sabr (patience). One of the reasons for praying
five times a day is to gain discipline; fasting in the month of Ramadan in order to
“learn self-restraint” (Qur’an, 2:183); partaking in Hajj, partly, is to practice
fortitude; and “lowering gaze” (Qur’an, 24:31) is to resist temptation. As well as the
pursuit of happiness offered by religion. Religiosity is stringent about examining the
8
how and why of whatever to earn and spend (17:26); regulating what to consume;
regulating speech; and constantly exerting control over thoughts and feelings. Thus,
the secret behind performing religious rituals is the practice of self-control and self-
regulation. When religious rituals are done so, then happiness in this life and in the
life to come is warranted.
Second, it can unpack the specific mechanism of the way religiosity affects
life satisfaction and happiness. Evidences that religiosity is linked to self-control
(Baumeister, et. al., 2007) is well established. Results from some personality
researches have provided evidence that dimensions of personality that linked to the
capability to regulate one’s behavior in a way in line with one’s purpose or out of
concern for the wishes and feelings of others (e.g., high Agreeableness, high
Conscientiousness, and low Psychoticism) related to religiosity (Saroglou, 2002;
Lodi-Smith & Roberts, 2007; Francis & Katz, 1992). These outcomes deliver
tentative endorsement for the suggestion that religiosity is related to self-control.
Furthermore, religion potentially has an effect on the chosen goals that people decide
on (Roberts & Robins, 2000; Saroglou, et al., 2004), effect the importance relevant to
those goals, minimize conflict between all those goals (Emmons, 1999), and as well,
persuade the process by which religious teachings are transformed into personally
substantial values (Ryan, et al., 1993). This religious relationship with goals
endorses some essential paths by which religion has the potential impact on self-
regulation. In brief, the study may help to elucidate well-established relationships
between religiosity and happiness. Better elucidating of the way that religiosity
shape people’s conduct in their pursuit of happiness would fill an important gap in
understanding of this correlation.
9
Third, this research has significant potential to advance understanding for the
unclear concept of the similarities and differences between happiness and life
satisfaction, and to improve consideration of how they are interconnected.
Therefore, the present research findings could provide the evidence of how to better
distinguish between life satisfaction and happiness.
Finally, this line of researches so far has almost entirely used Western and
Christian samples. More attention to Indonesian and Muslim samples will truly
widen the spectrum of this line of researches and make the findings in this field of
study more generalizable to a wider range of sample.
1.6 Scope of the Study
The center of interest in this inquiry is limited to studying happiness and
religiosity, and the mediating role of self-control, self-regulation, and life
satisfaction. The included participants were citizens of Medan, North Sumatera,
Indonesia, who aged 40 years or older (middle adults and above). Lastly, although
the Indonesian government has recognized six official religions (namely Islam,
Protestantism, Catholicism, Hinduism, Buddhism and Confucianism), only Muslim
(as the predominant religion) were included in this study.
1.7 Organization of the Chapter
This study includes five chapters. Chapter one provides an introduction of
the study, which consists of background, problem statement, objectives, questions,
and significance of study. In the last part, the scope of study is presented as well.
Chapter two outlines the key concepts that are examined in this study. It,
therefore, reviews the literature on happiness, life satisfaction, self-control, self-
10
regulation, and religiosity. The chapter discusses past theoretical and empirical
studies related to those concepts, and then presents a model that serves as the
conceptual framework for this study. Subsequently the chapter ends by building
several hypotheses to be tested.
Next is chapter three. It includes explanations of research design, sampling
method, sample and location, as well as preferred measurements and procedure used
in this study. Data gathering method and statistical technique used also elaborated
herein. This chapter ends by presentation of the results of the pilot study, especially
related to research instruments.
Chapter four is data analysis. This chapter begins with a review of several
preparations made before the analyzed data. Descriptive statistics then presented to
provide a complete picture and to allow proper interpretation of relevant results.
Furthermore, an investigation of the measurement model performed using
confirmatory factor analysis (CFA) was also presented. This was followed by the
structural model tests with Structural Equation Modeling (SEM) that served as a
confirmatory assessment. Then, the chapter ends by examining the study’s
hypotheses, in which the mediation analyses conducted under the principles of
Structural Equation Modeling (SEM) to assess the relationship between
religiosity, self-control, self-regulation, life satisfaction and happiness.
Finally, chapter five presents the summary of findings that drawn out from
the present research. These findings then discussed according to research questions,
followed by discussion on theoretical and practical implications. Chapter five also
discusses limitations of the current study and recommendations for further research,
and subsequently ends with conclusions.
11
1.8 Summary
As an introduction to the study, this chapter serves an insight into the whole
research by providing brief description about the role of self-control, self-regulation,
and life satisfaction on the relationship between religiosity and happiness.
Specifically, it explicated in the background of study and problem statement.
Research objectives, research questions, and significance of the study have presented
based on the problem statement. Scope of the study and organization of the chapter
have set and then concluded by summary. The following chapter discusses literature
review as related to each variable, and then followed by the presentation of
conceptual framework of the study.
12
CHAPTER 2
LITERATURE REVIEW
2.1 Introduction
This chapter presents the literatures related to the variables in this study.
Initially, the chapter discusses happiness and its role as the goal of human life and
satisfaction with life as the basis for achieving happiness. This is followed by a
discussion of religiosity as a variable that has an important role in guiding human
behavior toward life satisfaction and happiness. Further, literature and studies
concerning self-control and self-regulation as the mediating variables in explaining
how religiosity related to happiness becomes the next focus. This is followed by a
discussion of the theoretical framework that supports the link among these variables.
This is the model adopted in the study. Lastly, the proposed hypotheses of this study
are presented at the end of this chapter.
2.2 Happiness
2.2.1 Historical Development of Happiness
Throughout history, the idea of happiness has always been an intricate one.
Democritus (460 BC - 370 BC) was considered as the first philosopher to discuss
happiness. According to him, being happy is not a product of external
circumstances, but rather of a human’s expression of thoughts. Nevertheless, this
subjectivist view proposed by Democritus was not endorsed by Socrates and Plato
who conceptualized happiness in more absolute and objective terms. On the other
hand, Aristotle has emphasized that happiness was not beyond one’s reach, but is
attainable for any person desiring to live in harmony with the most valued virtues

13
(Tatarkiewicz, 1976). McMohan (2006) further explained that the ancient Greeks, as
well as the Romans, have viewed that pleasure and virtue was interdependent. As
such, living pleasantly was not possible without living honorably, prudently, and/or
justly. However, a man possessed a life of virtue, even being tortured, could still be
happy.
In the medieval times, Christian philosophers have also considered that the
good life is consisting life of virtue. On the other hand, virtue was deemed
insufficient for happiness, but has shifted to spiritual matter; can only achieved
through dedicated faith and God’ grace. In other words, happiness lay in God’s hand
(Tatarkiewicz, 1976).
In the Enlightenment, as it called “the Age of Reason”, the notion of
happiness has shifted to place more emphasis on earthly explanation and less on the
other-worldly. There was an increase emphasis on pleasure as a pathway to attain
happiness. In the early 19th century, Jeremy Bentham as a utilitarian philosophy has
illustrated these changes that happiness amount to utility while utility considered
come from the maximum pleasure. According to Jeremy Bentham, the prime aim of
human is to fight for the surplus pleasure over pain. He further encouraged that
morals and legislation should be based on the maximum happiness of the highest
amount of people (Tatarkiewicz, 1976).
In recent centuries, the notions that human have the ability to attain and
pursue happiness has received widespread appreciation. Conception of happiness
shifted to feeling good than being good (McMohan, 2006). Thus, the concept of
happiness adopted in the Classical and Medieval as perfection or virtue has been
largely ignored and considered unused. In this era, as Haybron (2007) noted, both
social and behavioral sciences have initiated to offer significant attention to the topic,

14
so as conception of happiness based on philosophical treatments are fewer than in
centuries past.
2.2.2 Conceptualizing of Happiness
Contemporary conceptualization of happiness can be divided into three
different approaches. The first is hedonic tradition whereas the second has its roots
in Aristotle’s concept of eudaimonia, and the last is related to Islamic perspective.
Below is the discussion of these approaches.
2.2.2(a) Hedonic Tradition
Hedonism point of view defines happiness as searching for pleasure and
anticipating of pain. The term of happiness is assumed to be related to the presence
of positive emotions and the degree of satisfaction with life (Diener, 2000).
Throughout the history of psychology and philosophy, this approach which is rooted
to Greek philosophers has had many adherents (Kahneman, et al., 1999). This
happiness model is come of Bentham’s theory of hedonistic that everyone’s behavior
is based on utility’s principle, by means of calculating the estimated pleasure and
pain of behaviors (Bentham, 1907). In other words, pain or pleasure human gained is
the outcomes of what has been done before.
For Bentham (1907), this human nature is impossible to be changed. This
nature drives every individual to make calculation in order to maximize his or her
utility. In addition to the individual, however this is also true for society since it is
formed by individuals. Therefore, lawmaker as well as policy-maker should also
refer this human’s nature principle to maximize people utilities. For both legal and
illegal, good and bad, right and wrong should be determined by pleasure and pain.
15
Whatever people conducted is to please these masters. According to Bentham,
reaching for pleasure and avoiding pain are the essence of human nature.
Similarly, Fordyce (1988) has defined happiness as the whole evaluation of
pleasure and pain that the individual has experienced in his recent past. In a parallel
vein, Kahneman (1999) has also defined happiness as the average of pleasant and
unpleasant experiences. Another analogous view is offered by Lyubomirsky et al.
(2005) who defined happiness as experiencing positive emotions most frequently
over time. However, all these definitions involve the notion of affect balance, so that
is very close to definition of happiness proposed by Jeremy Bentham as the
summation of pleasures and pains.
2.2.2(b) Eudaimonic Tradition
Eudaimonic tradition is another approach to happiness. It has risen out of the
philosophical solution. The principle point of this tradition on happiness is realizing
one’s full potential. As mentioned earlier by Aristotle, happiness is the full potential
actualization, or eudaimonia (Waterman, 1990). Thus, gaining the true happiness
does not come from fulfilling appetites, but rather originates from performing what is
morally appropriate to do, that is, manifestation of virtue and kindness. Although in
some instances, fulfillment of appetites and needs seems to lead happiness, but on the
contrary, this pleasure seeking may also prevent happiness (Ryff & Keyes, 1995).
According to Ryan & Deci (2008), happiness involves three basic
psychological needs, namely autonomy or to choose what to do, competency or to do
confidently what should be done, and relatedness or to have good quality of human
relationship. Ryan and Deci further asserted that fulfilling these needs would
enhance happiness. Subsequently, this tradition has gained support from many

16
religious movements, and spiritual as well, because of its similarity with some
religious values.
Another eudaimonic approach is authentic happiness model proposed by
Seligman (2011). Seligman introduced five fundamental elements to describe
happiness, namely pleasure, engagement, relationships, meaning, and
accomplishment. However, distinguishing between the pleasant life and meaningful
life makes this model seem as an attempt to reconcile both hedonic and eudaimonic
traditions, because pleasant life can be paralleled with hedonic tradition whereas
meaningful life equaled eudaimonic.
Nevertheless, most scholars describe happiness as comprising of three
components: more positive affect, less negative affect, and more satisfaction with life
(Diener et al., 1995). Positive affect involves good feelings (e.g., pleased, delighted,
and enthusiastic), whereas negative affect is related to bad feelings (e.g., tense,
stressed, irritable, and miserable). Conversely, life satisfaction is broader, relating to
a cognitive evaluation of how contented a person is with his or her state of life.
People with greater satisfaction with life would agree that his/her life conditions are
wonderful (Diener, et al., 1985).
2.2.2(c) Islamic Tradition
Islam is one of the celestial religions that provide a perfect way of life. Every
single word of God’s commandments taught in religion, aimed to provide true
happiness of its adherents in every aspect of human life, for both worldly-life and the
hereafter. As al-Qarni (2003) stated, be at peace, remain positive, rejoice, and be
happy. These Islamic values conveyed through the Prophet Muhammad has
highlighted that people who is true believer and work righteousness, whether male or

17
female, will accept a good life and reward the best of what they have done (Quran,
16:97).
Mufti (2016) has described that happiness in Islam is peacefulness arises
from faith in God. The possible way to achieve happiness is being upon the truth by
submitting and worshiping Him, and accelerating in virtuous deeds. Even the
smallest charity or any little acts of kindness have the potential for a person to
become happier. Islamic values asserted that earthly life is nothing but a means to
achieve eternal life in the Hereafter. Thus, being happy is only possible by following
this guideline. This is due to following Islamic teaching and remaining submissive
to God’s worship could be the best reminder to raise awareness that this life is a
stopover to eternal life after. Thus, the true happiness is only be found by
worshiping God because it was manifestations of God’s love and mercy.
There are numerous ways that religiosity may possibly have an effect on
happiness including promises of spiritual and material compensation (Abdel-Khalek,
2011). As taught in Islam, remembering Allah, reciting Qur’an, asking God’s
forgiveness, fasting at Ramadan, taking ablutions, and prayer, have a stimulating
unconscious effect on Muslims, and as well supporting them to possess better self-
regulatory capability. However, all these Islamic teachings and submissive to God’s
worship have an effect on how Muslims regulate thoughts and behavior to stay in
accordance with religious values and, in turn, can certainly help clarify life
satisfaction and happiness that religious individuals often enjoy.
2.2.3 Theories of Happiness
There are three well-known theories of happiness: Set-Point Theory,
Comparison Theory, and Affect Theory.
18
The Set-Point Theory views happiness as a stable attitude towards life that is
biologically encoded in humans (Lykken, 1999). This happiness “base-line” is
largely independent of circumstances. According to Lykken (1999), Set-Point
Theory asserts that any major life event will only alter the acute level of happiness
experienced by an individual and that over time, the individual will return to their
base-line level of happiness. Set-Point Theory suggests that no matter what a person
does, he or she ends up staying within a certain, stable level of happiness (Cummins,
et al., 2002).
Comparison Theory expresses happiness as a continuous judgment process
involving the comparison of life as it relates to a perceived “ideal life” (McDowell &
Newell, 1996). In this sense, happiness is mainly the product of mental evaluation
rather than the circumstances. An individual compares life as it is, with his or her
perceived standard of how it should be. Comparison Theory goes beyond Set-Point
Theory in how it defines happiness. According to McDowell and Newell (1996),
happiness depends on both the adequacy of material circumstances and people’s
feelings about these circumstances. In this regard, a personal assessment of one’s
condition compared to an external reference standard or to one’s aspirations may be
called life satisfaction.
Affect Theory defines happiness as an emotion determined by the subjective
assessment of how a person feels after taking everything into consideration
(Kahneman & Tversky, 2000). This theory seems quite similar to Bentham’s
definition of happiness and its modern version of “objective happiness” as the sum of
experienced pleasures and pains. Affect Theory suggests that a person computes the
balance of pleasant and unpleasant experiences based on an estimate of frequency
and duration. It proposes that this accounting occurs automatically and is reflected in
19
an individuals’ active state of “mood” (Veenhoven, 2006). In other words, mood is
like an inner happiness calculator computing one’s level of happiness. Affect Theory
argues that gratification of needs and wants are the determinant factors behind
happiness. Veenhoven (2006) attempts combining the Comparison and Affect
Theories by defining overall happiness as the total of its components. Overall
happiness is defined as “the degree to which an individual judges the overall quality
of his life-as-a-whole favorably”.
Each of the three theories outlined above captures some part of reality about
happiness. However, they do not tell a complete story. Even if all the three
integrated, would still not see the whole picture because each individually, and all the
three collectively, leave out some important aspect of happiness.
Set-Point Theory underestimates the impact of external factors on happiness.
It implies that there is virtually no value in striving for happiness mainly because a
person is hard-wired to stay within a certain level of happiness no matter what he or
she does. Set-Point Theory does not really offer any explanation as to why a person
is happy. It simply points to a biological “Black Box” that determines a human
being’s level of happiness. Set-Point Theory predicts that over time, a person is
equally happy regardless of life circumstances. There is ample evidence showing
that an individual’s level of happiness in life does indeed change depending on
internal or external factors (Diener, et al., 1997; Frey & Stutzer, 2000).
Comparison Theory implies that if a person simply lowers the standards, he
or she will be happy. It does not set any minimum standards for “a good life”. In
this sense, if one could lower the standards enough he or she would not need to strive
for happiness. Conversely, if one continuously raises the comparison yardstick, he or
she would never reach happiness. Like Set-Point Theory, Comparison Theory
20
underestimates the impact of external factors. The theory implies that happiness is
determined by an intellectual yardstick as opposed to life events or circumstance.
Affect Theory views happiness as a positive emotion that reflects an appraisal
of how an individual feels. However, this theory does not really capture the
qualitative aspect of life experiences. For instance, if a human rates his/her life as
good, and if an animal does the same thing, there is no way to say which good is
better. Comparison and Affect Theories are ambiguous about establishing what
constitutes a “good” life (Mill & Crisp, 1998).
2.2.4 Happiness in this study
Regardless of the considered happiness models discussed above, the three
‘hallmarks’ serves to delineate the general concept. First, happiness is subjective in
nature; it is an expression of individual experience. External objective factors or
conditions are not included in the definition of happiness. Second, happiness is a
frequency of positive experiences, not only a lack of negative influences. Third,
happiness is a global assessment, not only a single life domain.
Therefore, the construct of happiness is broadly subjected to the individual’s
perceptual interpretation of events and experiences. As such, it cannot be inferred
directly from objective circumstances, but rather should be understood from the
individual’s perspective. Furthermore, happiness is subject to be moderately stable
over time and to show sensitivity to ongoing experience and changing circumstances.
Following Islamic teaching, happiness can be viewed as an inner state of the
heart, characterized by peace in mind, tranquility, and a relaxed disposition.
Incorporating Lyubomirsky’s subjective happiness theory (2008), happiness is also
part of the joyful experience, positive well-being, or contentment, integrated with a
21
meaningful sense, that life is good and worthwhile. Thus, this research refers to
happiness as an inner state of heart resulted from sense that life is good, meaningful,
and worthwhile.
2.2.5 Measurements of Happiness
Based on the literature review, happiness has been measured with several
different instruments. In choosing the best instrument, it depends on the intended
population, the quantity of items, the accessibility of the scale, and the psychometric
property of the measure. The following is the brief summary of the measures that
have used to quantify happiness.
The Affect Balance Scale (ABS) defines happiness as the magnitude of the
gap between positive affective states and negative affective state. These conditions
occur in a relatively short duration and they usually generated from events that occur
around the environment (Bradburn & Caplovitz, 1965). The relationship between the
two components of affect (positive and negative) is orthogonal or perceived as not
related to each other (independent to one another). Thus, although the increase in
happiness may have a relationship with a decrease in negative affect but it is not
necessary lead to an increase in positive affect (Kozma, et al., 1991). This scale
consists of ten items, five items for each of the two components of affect (positive
and negative).
Several studies on young and middle-aged samples have been carried out to
validate this scale. For example, Kozma, et al., (1991) have found that the main
weakness of the Affect Balance Scale as a measure of happiness is indicated by alpha
of the total scale as below .65, which means quite low reliability for internal
consistency of the scale. However, by separating subscales that have positive and
22
negative affect, Stock and Okun (1982) have found internal consistency ranged from
.53 to .61 for positive affect and ranged from .64 to .65 for negative affect. Bearing
in mind that each subscale possesses the small number or items, this result may be
acceptable. Further, study employed elderly persons with a varied sample made up
of rural, urban, and institutional residents as conducted by Kozma and Stone (1980)
has reported an alpha of .59, and test–retest reliability for a 12 month interval was
only r = .27. In addition, a subgroup study conducted by Himmel and Murrel (1983)
has provided an alpha coefficient of .65 for community samples and of .75 for
clinical samples.
Other measure of happiness developed by Kosma and Stones in 1980 is
MUNSH. This scale combined the best features of other scales and intended to
measure happiness in older people. As noted above, the low reliability of internal
consistency and temporal stability of the Affect Balance Scale is due to measures
affective state in a short-term. Therefore, the MUNSH is intended to assess aspects
of happiness in short- and long-term. This scale contains ten affects (consist of five
items for each of positive and negative affects) and fourteen experiences (consist of
seven positive experiences and seven negative experiences). Internal consistency
reliability of this measure is indicated by an alpha of .86 (Kozma & Stones, 1980).
One clear bipolar factor has generated using a principal components analysis with
positive and negative dimensions, accounting for 50% of the variance. Moreover,
although affect items of the scale was the lower loading than experience items, but
the distinction between short and long-term states is not clear. In addition, as a
bipolar factor with positive and negative items, happiness score is unreliable with
Bradburn’s conceptualization of affect, morale, and satisfaction. Thus, whether or
23
not the MUNSH in fact assesses the short-term affective states or the long-term one
remains unclear and requires for a longitudinal study to determine it.
The other measurement of happiness is The Oxford Happiness Inventory
(OHI). Designed in the late 1980s, this cross-culturally scale consist of 29 items to
measures personal happiness. The design and format of the scale was based on the
Beck Depression Inventory. Each item has four alternatives that differ for each item
in four incremental levels, numbered from 0 to 3. Hills and Argyle (2002) from
Department of Experimental Psychology of the University of Oxford originally
developed this scale. Later, Francis, et al., (1998) have employed this inventory to
compare college students in the United States, the United Kingdom, Canada, and
Australia. In Israel, Francis and Katz (2000) employed this scale in a Hebrew
translation. Based on this inventory, Lu and Shih (1997) formed the Chinese
Happiness Inventory (CHI) to use in Taiwan.
Next is The Chinese Happiness Inventory (CHI). As aforementioned, this
measurement was designed based on the Oxford Happiness Inventory. In total, the
scale involves thirteen subscales. Of all subscales, seven (namely: positive affect,
optimism, fitness, social commitment, contentment, self-satisfaction, and mental
alertness) were from the Oxford Happiness Scale which formed 28 items. Another
six subscales of the Chinese Happiness Inventory were originated from a study in
Taiwan (namely: peace of mind, praise and respect from others, downward social
comparisons, satisfaction of material needs, achievement at work, and harmony of
interpersonal relationships) and consisted of 20 items. The total number of items of
the scale consists of 48 items (Lu & Shih, 1997). In addition, each item of the
Chinese Happiness Inventory represents different levels of experienced subjective
happiness from four alternative responses to choose. These choices are coded as 0,
24
1, 2, and 3. Based on study conducted by Lu, et al., (2001), result has provided alpha
coefficients of .93 for British students, and of .94 for Taiwanese students.
Furthermore, Hills and Argyle (2002) have developed The Oxford Happiness
Questionnaire at Oxford University. They found that respondents endorse the two
central items. The answers to these items were not normally distributed and this is
evidenced from the mean scores of less than corresponding standard deviation. They
point out that these items might not fully contribute to the measured happiness.
Hence, the Oxford Happiness Questionnaire was designed to use only single
statement on a six-point Likert scale, so it becomes easier to administer. Construct
validity of this scale is strongest, indicated by its relationship with the Depression–
Happiness scale, the life regard index, and the self-esteem (.90; .77; and .81
respectively). However, this scale is less susceptible to the bias of respondent than
other scales and is more comprehensive (Hills & Argyle, 2002).
In 1993, McGreal and Joseph also established The Depression–Happiness
Scale. They argued that literatures of the measurement involve two kinds of scales:
literatures related to life satisfaction and happiness; and literatures assessed
depression and loneliness. In addition, they stated that aspects of depression do not
included in the most used assessment of happiness. However, employed depression
scales, such as the Beck Depression Inventory, have tendency toward a floor effect
for the normal population. That is, the potential range of scores is from 0 to 63 and
is from 0 to 9 for non-depressed individuals. Although one has a score of zero, it is
not automatically indicates the sign of happiness, but it may be only an indication of
no depression.
In 1999, Lyubomirsky and Lepper have established The Subjective
Happiness Scale (SHS). This short scale involved only four items and intended not
25
to overload respondents, as well not to intimidate the unidimensionality structure of
happiness with frequent items. Some studies conducted have indicated the strong
validity and reliability of this scale. Development of the scale refers to the literatures
that did not contain an assessment of global subjective happiness, such as overall
subjective measurement of whether or not one is happy. They further noticed that
even with personal tragedy, obstacles, lack of prosperity, welfare, or love, some
people may perceived them as happy person; whereas some other people considered
them as unhappy even though being enclosed by all contentment and pleasant of life.
Statistical analysis employed to assess validity of the scale such as total correlation
of the items. Result of the study has provided alpha coefficients for internal
consistency ranging from .84 to .92.
Measurements of happiness have also used with single-item. According to
Kozma, et al., (1991), the rating scale varies from a three to an eleven point. The
inability to measure how consistently they assess their basic construct is the major
deficiencies of this type of scale.
From what have reviewed so far, most of the scales intended to assess
samples from the young and middle-aged person so as the sample employed was
mostly younger adults. There are only two measures that have evaluated happiness
in elderly people, the Subjective Happiness Scale developed by Lyubomirsky and
Lepper (1999) and the MUNSH developed by Kozma and Stones (1980). However
as to the MUNSH has some issues related to the scale being dichotomous and the
scale has no clear distinction whether it measures short- or long-term aspects of
happiness. Whereas the 4-item Subjective Happiness Scale (SHS) from Lyubomirsky
& Lepper (1999) has been used for a very wide range of age of 14–94 years old. In
addition, this 4-item Subjective Happiness Scale (SHS) uses Likert-type scale with
26
seven possible options ranges from 7 (more happy) to 1 (less happy), participants
asked to specify how much they agree for each of the 4-items offered. Therefore,
this multiple-item scale provides a broader variety of information and with greater
specificity. Furthermore, Some studies conducted have indicated the strong validity
and reliability of this scale. Statistical analysis employed to assess validity of the
scale such as total correlation of the items. Result of the study has provided alpha
coefficients for internal consistency ranging from .84 to .92. Thus, Subjective
Happiness Scale is selected for this research.
2.2.6 Determinants of Happiness
The issue of whether or not people can become happier and what makes them
become so has remained a debate. Firstly, many scholars were unsure about the
possibility to attain happiness due to several considerations, including personality
factors (McCrae & Costa, 1991; Diener & Lucas, 1999), genetic influences (Nes, et
al., 2006; Lykken & Tellegen, 1996), and the tendency of human being to become
accustomed to any positive life changes (Lyubomirsky, 2011; Frederick &
Loewenstein, 1999). According to them, any efforts to improve happiness would be
futile. They argued that following both favorable and unfavorable experience,
people would simply return to the ‘‘baseline’’ of their determined happiness
(McCrae & Costa, 1991). It may be better off for people by simply accepting their
current happiness levels rather than chasing it.
Nevertheless, some other researchers promote that happiness can indeed be
boosted and sustained. They argued that although happiness comprise genetic
element and people adjust to positive life events, however it does not mean
someone’s level of happiness could not be increased. Roberts, et al., (2006) have
27
found evidence that the relationship between personality trait (i.e., neuroticism) and
happiness can shift in adulthood. Fujita and Diener (2005) have also indicated that
happiness is changeable across a person’s lifetime. In addition, Walsh (2011) has
found that happiness could increase through lifestyle change, such as improving
nutrition or performing new exercise regularly. Furthermore, Sin and Lyubomirsky
(2009) have evidenced that people’s happiness may improve when engaging in
positive behavior, such as practicing optimism, becoming more grateful, or
performing acts of kindness.
According to Sustainable Happiness Model offered by Lyubomirsky, et al.,
(2005), level of happiness depends on three major factors: (1) genetically based set
point; (2) life circumstances; and (3) intentional activities. This model takes into
account the above debate by proposing that some part of the happiness are pre-
determined but some part of it can still be changed. More specifically, while around
50% of variance in happiness defined by genetically based set point, approximately
10% can be explained by life circumstance, and the remaining 40 % accounted for
intentional activities. These three factors have attracted attention of the majority in
the varied literatures (Lyubomirsky, et al., 2005; Seligman, 2002; Diener, et al.,
1999) and further discussion is provided below.
2.2.6(a) The Person’s Genetic Set Point
Genetically based set point represents the basic temperament and personality
traits of people in which one’s level of happiness is fixed. The set point is assumed
to remain stable, or not likely to change across the lifespan. For some people, this set
point is higher, while for others it may be lower. Due to people having different set
points for happiness, there are people who are generally unhappy and there are those
28
who always seem to be in good spirits. At least, there are three considerations
underlie the depth of this relationship.
First is the role of heredity. Happiness has a high heritability. Nes, et al.,
(2006) have found evidence that some people, due to genetic factor, are happier than
others. In other words, the baseline level of happiness for some people is higher than
for others. Furthermore, although a more widely established figure is 50% of
variance in people’s happiness defined by the role of heredity (Diener, et al., 1999),
however, referring to the long-term research on identical twins and fraternal, Lykken
& Tellegen (1996) have found that the heritability of happiness may be as high as
80%. Their study provides evidence identical twins share height, intelligence, and
level of happiness. Also, in a four-wave panel study conducted by Heady and
Wearing (1989), participants tended to keep returning to their own reference point
over time. This finding, however, is consistent with the idea that people’s set point
for happiness is based on genetic factor. Thus, people perhaps cannot help in the
long term but return to the middle of their set range or to their set point.
The second explanation for genetic-based happiness is related to personality
trait. Happiness has a relationship with several personality traits. Traits are
cognitive, affective, and behavioral complexes, account for part of the stability of the
set point. Thus, by definition, traits are stable across situations and across the life
span. Based on this assumption, Diener and Lucas (2004) have found evidence that
highly neurotic people have a tendency to be less happy, and extravert people are
disposed to be happier than introvert is. Similarly, McCrae and Costa (1991) have
argued that people generally do not change much in where they stand on neuroticism,
extraversion, and so forth. Traits such as these relatively fixed throughout the life
span. According to this close relation, they further explained that people have also a
29
tendency to preserve the same relative level of happiness over the time. However,
based on these findings, it appears that some researchers have preferred to consider
happiness as an unaffected factor by any kind of meaningful change.
Third is the hedonic treadmill. According to Diener, et al., (2006), the
hedonic treadmill is the tendency for the emotional impact to diminish over time,
both positive and negative events. There are evidences that people get used to a
varied events. To note a few, people adjust to the end of a romantic relationship
(Wortman, et al., 1993), the effect of winning the lottery (Brickman, et al., 1978),
being diagnosed with a serious illness (Sieff, et al., 1999), and so on. These studies
advocate that emotional responses such as facing excitement or sorrow are often
surprisingly short-lived. Thus, even though some new conditions that surround
people may lead temporarily to be happier or unhappier, they quickly adapt, and the
result of these new surroundings on happiness then also reduces quickly or slowly or
maybe vanishes totally. The conception of a person fighting against the effects of
adaptation brings to mind an image of a pedestrian walking up a descending
escalator. Although the improved living conditions may boost someone rising
toward greater happiness, the results of adapting push back to the initial state
(Lykken & Tellegen, 1996). In other words, effort to change life circumstance to be
happier is likely not a succeed way in the long-term. Together, these reasons
advocate that any exertion to become happier may be fruitless as trying to be taller.
Other than reasons explained above, McCrae and Costa (1991) have proposed
that traits influence happiness in two ways, instrumental and temperamental causal.
The instrumental causal sequence demonstrated by empirical evidence such as study
examining the relationship between happiness and extraversion (Tkach &
Lyubomirsky, 2006). Result of the study revealed that the relationship between
30
happiness and extraversion partially mediated by active leisure activities and social
affiliation. This finding, however, is in line with the idea that a person’s particular
traits influence the tendency to behave towards certain situations, which in turn,
cause to later happiness or unhappiness.
Conversely, the temperamental causal sequence based on the idea that a
person’s particular traits influence how a person interprets events in a compatible
way by which a trait cause to a mood, and then, in turn, both trait and mood leading
to happiness. Therefore, positive judgments and attitudes of happy people push them
to interpret experiences of life journey in a fashion that sustains their positive moods
(Lyubomirsky, 2011), such as by construing value in daily life events or by
perceiving control in their actions. Similarly, experimental study examining the
temperamental sequence for both extraversion and neuroticism conducted by Larsen
& Ketelaar (1989) has evidenced that people high in neuroticism seem to experience
negative events more intensely negative than do their more emotionally stable peers,
whereas people high in extrovert seem to experience positive events more positively
than do introverts.
2.2.6(b) The Person’s Current Circumstances
Current circumstance of the person encompasses contextual, geographic, and
demographic factors. All those factors can either weaken from or add to the stable
set point. Even so, happiness literatures have noticed the robust finding that a happy
disposition is more important than demographic, geographic, and contextual or so-
called ‘‘external blessings’’ factor. In addition to this, Argyle (1999) has learned that
only 10% of people’s happiness is explained by life circumstances. Although having
more money may lead people to feel happier, better looking, or lived in a warmer
31
climate, but this is generally not the case. He further concluded that changing life
circumstance to increase happiness is not a promising way.
Similarly, several studies have evidenced that people adapt quickly to
changes in income and marital status (Lucas, et al., 2003), people who are more
attractive is not happier (Diener, et al., 1995), as well as rich people are only slightly
happier than their less wealthy counterparts (Diener, et al., 1985). In addition,
Lyubomirsky (2008) has revealed correlations -smaller than expected- between
happiness and objective variables such as gender, race, education, age, children,
occupation, and life events in both younger and older adults. Moreover,
geographical location, housing, and weather have short-term positive effects on
happiness. Ulrich et al., (1991) have found that people living in particular
geographic areas that have beautiful panoramic, easy to get water and vegetation
reported positive feelings.
Further, Diener (2000) has revealed that people’s relative wealth in many
different countries may reflect their happiness level. This is probably due to people
in poorer countries having informed through various media that the more luxuries
widely offered in the wealthier countries. In addition, Triandis (2000) has found that
specific cultural plays an important role in deciding happiness. People in countries
with social equality culture have higher levels of happiness. In addition, that
happiness is lower in collectivist cultures than in individualist cultures.
In general, life circumstance is not strongly related to happiness. This may be
due to adaptation process that allows people to adapt to both positive and negative
circumstances. This might be the reason that life circumstances is not strongly
influenced happiness.
32
2.2.6(c) The Person’s Current Intentional Activities
As discussed above, life circumstance and heredity do appear to make people
happier but only in a limited way and for a limited short-term. However, there is
40% of unexplained remaining happiness, which gives hope about the possibility of
increasing happiness. This portion of happiness constitutes people’s intentional
activities.
The intentional activities are thoughts or behaviors that people prefer to
become involved in. These thoughts (such as thinking positively) or behaviors (such
as acting kindness) change standpoint on self and the world in general. People can
actually make themselves happier when they involve in preferred intentional
activities. An increasing number of researches in psychology has shown several
proven activities that may effectively increase happiness, they are:
a. Expressing gratitude
Sheldon and Lyubomirsky (2006) have shown that cultivating a grateful
attitude can lead to rises in happiness. However, to increase happiness and to reap
the benefits gratitude brings, requires more than reflexively saying ‘‘thank you’’.
Nevertheless, it also should accompanied by focused attention on the positive things
in life and truly savor them. This kind of good deed is also an effective way to
increased happiness.
There are several reasons offered to explain how expressing gratitude may
increase happiness. First, sense of gratitude for all that has possessed will helps to
reduce the role of adaptation effects. Another consideration for the benefit of
expressing gratitude is that it may encourage the increase of quantity and quality of

33
social relations. Myers (2000) revealed that having close relationship and strong
social support are characteristics of happy people.
b. Visualizing of best possible self
King (2001) stated that thinking of the future and visualizing of best possible
self would lead to increasing in happiness. He further described that visualizing of
best possible self is more than a daydream or a fantasy, but intended to be an exercise
in self-deception. This visualizing should be based on the visions and goals set, and
must be possible and achievable. Essentially, activities of the best possible self are
nurturing a positive outlook. Because it consists of assuming, that one will attain his
or her most valued goals in the future that lead to an enriched sense of purpose,
meaning, and efficacy, and as well developing a positive image of his future self.
Indeed, an optimist tends to stay afloat when faced various challenges and
temptations because of the strong belief that the planned goals are within reach. The
same with a person who considered the goals planned are within reach, this exercise
should encourage better preparation and more effort to deal with obstacles (Scheier
& Carver, 1993). When the expected future is managed in a structured and
consistent manner, then the steps required to reach it possibly seem more controlled
and clearer.
c. Doing act of kindness
Another considered approach that is able to produce an increased happiness is
performing acts of kindness. It often assumed as wasting-time, tiring, and
unrewarding because such behaviors can easily interpreted as self-sacrifice. Piliavin
34
(2003) has found that pro-social activities have positive consequences, both for those
who do it as well for those who benefit it.
Performing acts of kindness serve a strategy to increase happiness. It allows
one to change self-perception, to see him or herself as a capable person, kind, and
helpful (Tkach, 2006). Performing acts of kindness also provide a learning
experience on personal talent or strengths (Seligman, 2002). Seligman (2002) has
noticed that making use of personal talent and abilities produce a sense of
truthfulness that is closely associated with happiness. In addition, performing acts of
kindness may support to rise an ‘‘upward spiral’’ of social benefits and shape robust
social bonds. As explained by Algoe and Haidt (2009), when people receive an act
of benevolence they often feel a reinforced positive feelings and relationship to the
benefactor so that make stronger relation.
Furthermore, performing something for someone else often require direct
interaction. Like volunteers work at a nursing home, they are able to learn and take
lessons from the patient’s life history. In such a manner, pro-social behavior can
build a sense of appreciative for the recipients (Putnam, 2000). Thus, it makes sense
that volunteer people reported feeling greater ties to the community.
d. Physical exercise
Argyle (2001) found that exercise leads to positive mood states in the short-
term, which in turn induces greater happiness in the long-term. He further explained
that in short term, the effects of exercise lead to free of morphine and endorphins,
such as chemical substances produced in the brain. While in long term, the effects of
exercise are due to regular exercise tend to diminish anxiety and depression. In

35
addition, the risk of cancer and heart disease reduce throughout regular exercise and
is associated with longevity (Sarafino, 2002).
e. Religiosity
Myers (2000) described underlying reasons that people engaged in religion
may be happier than others may. At least, there are three considerations within
psychology. First, determined belief system in religion lets people to find meaning
in life so that offer future in a hopeful manner (Seligman, 2002). Adversities that
happen over the course of the lifespan may well understood more easily due to be
optimistic about a life after death in which these difficulties would well fixed.
Second, being part of a religious community and routine attendance at religious
services provides community support. Third, participation in religion is related to a
healthier lifestyle physically and psychologically which characterized by pro-social
behavior; marital fidelity; commitment to hard work; and moderation in drinking and
eating. Further discussion about religion and religiosity as part of the intentional
activity to increase happiness will be discussed further in later section.
f. Life satisfaction
Commonly, happiness is conceived a meaning for a summative of the
satisfaction with life and the balance of affect (Myers & Diener, 1995). Thus, it is
not surprising that satisfied people with their lives demonstrate happy individuals.
Furthermore, happiness literatures have evidenced the robust correlation between
happiness and specific domains of life satisfaction such as health, recreation,
friendship, marriage, and work (Diener, et al., 1999). It advocates that happiness
36
generated in part from a summary of satisfaction domains. This aspect will be
explained further in section 2.3.
In addition, several activities have been found to be the barriers to happiness
include the propensity to get used to the pleasurable situations and to compare the
self and others, as discussed following:
1) Habituation to pleasurable
Human designed to get used to the situations that give pleasures of any gains.
People consider to being happy when they have new type of clothing, house, car, or
food, but as soon as they got it for a while, they adapt and habituate and feel the need
to have something better or bigger (Buss, 2000).
2) Negative social comparison
Other factor that often interfere happiness is comparison with one’s current
situations, as well with other people. Referring to Wood (1996), people do a
comparison of themselves to others in many terms including their children, partners,
personal attractiveness, social status, and in various aspects, such as wealth, health,
academic achievement, and so forth. In some instances, the fictional standards lead
people to comparing negatively to others.
2.2.7 Consequences of Happiness
Typically, the focus of happiness research is on the determinants of
happiness. However, there is also a number of studies emphasized that happiness
facilitates a plethora of positive outcomes, some of which are discussed below.
37
2.2.7(a) Creativity and Productivity
The broaden theory of positive emotions developed by Fredrickson (2002)
intended to describe how the experienced of positive affective is not only a sign of
happiness but also function in contributing to individual development and growth.
Negative affective such as anger or anxiety may limits the treasuries of momentary
thought-action of people, so that they are prepared to do something by means of
certain self-protective. In contrast, positive emotions widen treasuries of people’s
momentary thought-action. This widening of momentary thought-action treasuries
provides chances to develop durable personal resources, which in turn provides the
possible for personal development and transformation by creating positive or
adaptive spirals of cognition, emotion, and action. For example, joy produces the
strong desires to play and create in social and intellectual or artistic ways. Thus,
through play, joy can make stronger social support networks; and through creativity,
joy can lead to creative problem solving in day-to-day life or to the production of art
and science. Successful problem-solving experiences and improved social support,
scientific and artistic productions are all durable results of joy and may possibly
contribute to personal development and transformation. This, in turn, may lead to
emotions that are more positive. Another positive emotion such as contentment may
also generate a desire to anticipate life surroundings. These all positive emotions
may cause ways of viewing the self and the world around that are more positive and
new.
These new and enduring insights and practices may increase positive
emotions. Fredrickson (2002) has conducted clinical and laboratory study which
evidence significant support for the broaden-and-build theory of positive emotions.
Her study further presents worthy evidence that thought-action repertoires may
38
enlarge by positive mood states. The study presented that bipolar patients treated
successfully with lithium display reduced creativity, and manic and hypomanic states
related to over inclusive thinking. In the laboratory study, a variety of methods have
been found to consistently generate positive mood states for up to 15 minutes. These
methods include asking participants to read positive self-statements; to read an
arousing story; to watch an arousing film; and to remember a positive event; to get a
positive feedback; to receive an unexpected gift (e.g. a bar of chocolate); to listen to
music; and to have positive social interaction with a cheerful person.
These methods of mood induction have been employed in laboratory settings
to demonstrate the positive happiness effects on social interaction, cognition and
perception. Similar studies have shown that a bias on the way to global visual
processing and extended attention presented by people who receive success feedback
or people with positive mood states on laboratory tasks. In contrast, people who
receive failure feedback or people with negative mood states on laboratory tasks
display a bias towards processing of local visual. Studies relating to the induced
positive mood on laboratory have confirmed that such induced mood states produce
thought and behavior that are more flexible and creative. Frederickson (2002) has
done a sequence of researches that gave evidence to theory of broaden-and-build. In
one set of studies, participants were shown film clips to induce negative emotions
such as fear and anger, and positive emotions such as joy and contentment. After
each film clips, participants itemized as many things as they could think of that they
would like to do if they had these emotions in real life. Positive emotions led to a far
broader repertoire of thought-action tendencies.
Laboratory and developmental studies confirmed the support of positive
mood states for people to produce durable personal resources. Developmental
39
studies exploring on attachment of children have revealed that securely attached
children solve the given problem with greater persistence, resourcefulness, and
flexibility than those with insecurely attached children. Further, securely attached
children also demonstrate greater in exploratory behavior in novel situations and in
developing superior cognitive maps. Similarly, adult with secure attachment styles
are more open and curious to new information than those with insecure attachment.
In educational study, an investigation has discovered that children with
positive mood learn faster when compared to children with negative mood states
(Frederickson, 2002). The result further explained that over time positive emotions
and broad-minded coping mutually build upon each other. Broad-minded coping
entails considering a wide thought-action repertoire of responses.
Study conducted by Block and Kremen (1996) has also shown differences of
people’s capacity to cope with stressful circumstances based on the use of positive
emotions. Result of the study evidenced that people scored higher on ego-resilience
demonstrate faster on cardiovascular recovery following stress than people scored
lower on ego-resilience. The study further proved that experiencing positive
emotions mediated this recovery.
All these evidences show that creativity and problem solving facilitated by
positive emotions. In similar vein, happiness as well rises people’s productivity on
work. Staw, et al., (1994) conducted a study in over an 18-month period on over 200
workers. The result revealed that happier people obtained higher pay and better
evaluations compared to their less happy counterparts.
40
2.2.7(b) Longevity
Longitudinal studies provide evidences that happiness has significant effects
on longevity. Danner, et al., (2001) conducted a carefully controlled study of 180
nuns in the USA. They were working as teachers, unmarried, did not smoke or
drink, and ate a simple balanced diet throughout their adult life. All of the
participants (nuns) had similar lifestyles. Danner, et al., (2001) found that happiness
(the nuns wrote an essay as they entered the order) was related to longevity. The
nuns are not aware that they involved in a study of happiness and longevity. A
biographical sketch given to nuns when they wrote an essay, and asked to specify for
the future they expected. The positive emotions in the essays further judged in more
than half a century later by trained raters, which the age of the participants was
unknown to the raters. The result shown that of the happiest quarter 90 per cent lived
past the age of 85 compared with only 34 per cent of the least happy quarter.
Almost similar study was conducted by Maruuta, et al. (2000) on over 800
patients, 200 of whom had died. These participants answered questions of the
assessment to show whether their outlook was pessimistic or optimistic. Forty years
before, the participants had joined the Mayo Clinic. The results of the study found
19% of the optimists have greater longevity than pessimists have. Therefore,
participants who stated that they were optimistic when they first joined clinic, lived
significantly longer than those who did not. In another longitudinal study, Ostir, et
al., (2000) examined Mexican Americans over 65 years of age in more than 2000
people. Two years later, after controlling for socioeconomic status, age, diseases,
and drug use, they found that happy participants were twice as likely to survive and
to remain functionally independent compared with their unhappy counterparts.
41
2.2.7(c) Social Relationships and Pro-social Behavior
However, happiness appears to make humans more social, more ethical, more
cooperative, and even bring out the best in them. A study conducted by Diener and
Seligman (2004) have provided evidence that people with increased positive affect
were more interested in social interaction, evaluate other people they have lately seen
in more positive terms, and also turn into more predisposed to self-disclosure.
Similarly, Brehm and Rahn (1997) have reported that people with higher level of
satisfaction with life show more generalized trust in others. James and Chymis
(2004) have also provided evidence that people with higher level of happiness react
in ways that are more ethical. In addition, study conducted by Tov and Diener
(2007) has also found positive correlation between happiness and socially expected
results on a national level. They found that there was a tendency to score higher on
democratic attitudes, volunteerism, and generalized trust in happier countries.
Based on above discussion, happiness can produce a plethora of positive
endings. More specifically, happiness enhances creativity, productivity, longevity,
social relations, and to more ethical behavior.
2.3 Life Satisfaction
2.3.1 Definition of Life Satisfaction
Shin, et al., (1978) described life satisfaction as an overall assessment of a
person’s quality of life in accordance with his/her preferred criteria. The appraisal of
satisfaction depends on circumstances of a person compared with some appropriate
standard; importantly, the standard for satisfaction resides within the individual, and
it is not externally imposed.
42
Life satisfaction has also defined as the difference between what one has and
what one wants; i.e., between ideal and one’s reality (Campbell, et al., 1976). The
judgment of life satisfaction, therefore, involves the application of personal standards
and expectations for self and an assessment thereof. Similarly, Alex (1986) defines
life satisfaction as a person’s perception in assessing the gap between how things are
and how they should be. Evaluations about what one has, one need, one want, one
expects, one feels, one deserves, and what others have. All these combine of
comparison conclude life satisfaction. Thus, the smaller the discrepancies found in
these variables the greater one’s life satisfaction; conversely, large discrepancies
result in greater life dissatisfaction. Sirgy (1998) suggests that expectations represent
the comparisons individuals make when evaluating their overall life satisfaction.
Examples of such comparisons include expectations related to their capabilities, what
they feel, they deserve, their ideals and past circumstances, and their minimal
requirements for contentment.
Essentially, all definitions mentioned above concerning life satisfaction as an
overall assessment of a person’s quality of life in accordance with his/her preferred
criteria. Thus, following Shin, et al., (1978), the present research defines life
satisfaction as a cognitive appraisal of a person’s quality of life according to the
preferred standards.
2.3.2 Components of Life Satisfaction
Significant research has been conducted to establish whether satisfaction with
life is an enduring, stable trait as opposed to a variable influenced by life
circumstances and external events. Examples of such events include birth, death,
marriage, divorce, and balancing daily demands. Alternatively, an individual’s
43
responses to life events may determine life satisfaction such that one remains static
their satisfaction regardless of changes in their environment.
Studies indicate that people have a tendency to express similar levels of
satisfaction through many life domains and across time. This implies that satisfied
people with the marriage bond also tend to be satisfied with their children, their
work, and their monetary condition. However, it is possible to be dissatisfied with
one’s marriage but not their job. It was discovered in one study that the proportion
of negative to positive life events in one year predicts life satisfaction in the next,
suggesting that such external influences do affect overall life satisfaction.
A longitudinal investigation administered by Suh, et al., (1996) may help
illuminate such conflicted results. The researchers followed recent college graduates
to measure overall life satisfaction every six months for two years. The results show
that particular life events for these graduates correlated with variations in their life
satisfaction even these impacts did not endure. In other words, the effect of these life
events is transient since people make adjustments in the face of changes that occur
from time to time. This implies environmental and personality explanations alone
cannot predict changes in life satisfaction. That is to say that life satisfaction has the
two components: trait-like components (reflecting personality influences) and state-
like components (reflecting environmental influences).
However, due to one’s life events affected by one’s personality, it may not be
possible to discriminate between these components. For example, extraverted people
may place themselves in social situations or seek opportunities to gain broader
experiences of life. Definitely, study conducted by Plomin and Nesselroade (1990)
have provided evidence that genetics plays a role in influencing life experiences.
44
The correlation of life satisfaction has also found with variable related to
personality, such as assertiveness, extraversion, openness to experience,
psychological resilience, internal locus of control, and empathy. Based on
longitudinal study, Magnus, et al., (1993) have provided evidence that four years
subsequent to the study that personality predicted life satisfaction. The study implies
a dispositional component to life satisfaction or one that influences life satisfaction
through the environment. Individuals that are “satisfied” tend to be so in several
areas. Taken together, these studies confirm that life satisfaction is genetic-based
component, thus consistent across situations and stable over time.
Presently, the literature recommends that personality is an important part in
evaluating the satisfaction of individual’s life. However, immediate factor of an
individual’s environment (e.g., recent life events) may also affect the judgments
relating to satisfaction with life. In conclusion, the elements that comprise life
satisfaction have subsumed in two categories: nature (i.e., personality) and nurture
(i.e., environment).
2.3.3 Measurement of Life Satisfaction
Life satisfaction is considered as an individual’s judgment. Thus, in variety
of social studies, self-reporting method is the widely employed to measure it. Most
of researchers consider that self-reporting is the most accurate and direct method to
assess people’ satisfaction with life. The use of self-report requires respondent to
select a symbol (i.e., an amount or a facial expression) on a Likert-type scale (e.g.,
from 1 to 5) that specify the perceived level of satisfaction a person feels with life.
The following is summary of three primary measures that have used to assess life
satisfaction:
45
Firstly, Satisfaction with Life Scale (SWLS). This scale was established by
Diener, et al., (1985) to assess global satisfaction with life. They constructed this
scale on the consideration of life satisfaction as the cognitive component of
subjective well-being. The scale made up of five statement items and asked
participants to judge on a Likert-type scale with seven possible options offered.
Currently, this scale is the dominant multiple-item and has validity evidence in more
than hundreds of studies (Pavot & Diener, 2008).
Secondly, Cantril’s Self-anchoring Scale. The scale was developed by
Cantril (1965) and often refers to as Cantril ladder. This measurement used to assess
general life satisfaction, and asked participants to select one rung of a ladder. The
ladder extends from the bottom rung (worst possible life for you) to the top rung
(best life for you) as a sign of their satisfaction with life. The growing popularity of
the scale stems from its “friendly” design and its use in Gallup’s World Poll. The
scale has good convergent validity and reliability.
Thirdly, Delighted–Terrible Scale. It was developed by Frank Andrews and
Stephen Withey (1976) at the University of Michigan. This single-item
measurement asked participants to select seven moods adjectives as responses. The
moods ranging from “delighted” to “terrible” that represent how they feel about their
life as a whole.
Of various self-report mentioned, some researchers measure with a single
question while others oblige participants to respond to multiple items. Due to
multiple and single-item scales well correlated, some researchers speculate that
single-item scales are adequate. In addition, multiple-item scale requests a broader
variety of information and with greater specificity so that single-item scale is more
susceptible to the bias of social desirability.
46
Despite these concerns, some scholars have approved that assessing life
satisfaction using multi-item scales is most preferable when compared to single-item
scales. Even though single-item scales show a strong relationship with other
measures that are similar (sufficient convergent validity) and measure in the same
way over time (adequate reliability), however, identification of the errors associated
with wording and measurement as well as assessment of internal consistency only
provided by multiple-item scales. Overall, this may be due to higher reliability and
validity of multi-item scales exhibit than the single-item scale (Diener, 1985).
From what have reviewed so far, Satisfaction with Life Scale (SWLS) is the
most validated measure of life satisfaction. It was established by Diener, et al.,
(1985) to assess evaluative judgment of individual consciousness with life as a whole
by using one’s own criteria. Furthermore, the scale uses a relatively broad and
nonspecific language for the items so that enable participants to perform subjective
evaluation. In addition, Satisfaction with Life Scale (SWLS) uses Likert-type scale
with seven possible options ranges from 7 (strongly agree) to 1 (strongly disagree),
participants asked to specify how much they agree for each of the five-items offered.
Therefore, this multiple-item scale provides a broader variety of information and
with greater specificity. Another consideration is that the scale has been used across
gender, ethnicity, and age and shows a high reliability and internal consistency, and
suitable for a varied group of age. In addition, the scale also show a good
relationship with clinical ratings of satisfaction, informant reports of satisfaction, a
memory measure of satisfaction, and self-esteem scales. Therefore, the scale
(Satisfaction with Life Scale) is selected for this research.
47
2.3.4 Happiness and Life Satisfaction
Life satisfaction has been used synonymously with happiness. Based on the
literatures, there are two perspectives that debate about the relationship between
happiness and life satisfaction. Some argue they are the same whereas others
propose them as related but different constructs. Some scholars suggest that the term
and the measurement of happiness measures and life satisfaction can be used are
interchangeably (Veenhoven, 1991; Frey, 2008). According to Veenhoven (1991),
the terms happiness and life satisfaction are synonymous. Similarly, Lane (2000)
theoretically differentiates between the concepts of happiness and life satisfaction but
the difference is not used in research. All these authors work based on the
assumption that these two concepts are identical and that any distinction between
them would have no analytical impact.
Conversely, several authors claim significant differences between the concept
of life satisfaction and happiness, both theoretical and empirical data analysis
(Gundelach & Kreiner, 2004). Campbell, et al., (1976) argue that happiness is an
experience or feeling of affect, whereas life satisfaction refers to a judgmental or
cognitive experience. Similarly, Lane (2000) defends that life satisfaction is a
judgment that is more cognitive, whereas happiness is a mood. Kozma, et al., (1991)
denote happiness as a state of mind related to attainment in fulfilling needs or wishes,
whereas satisfaction with life is similar to happiness but has no reference to the state
of mind of the individual. In other words, a positive mental state may be arise
because of happiness and negative mental state or feeling due to the absence of
success. However, feeling or mental state of an individual is not an attribute that
determine satisfaction. Thus, it is possible for an individual to be satisfied or
48
dissatisfied with finances, housing, health, family, etc., whereas happiness is a
construct that is broader one (Kozma, et al., 1991).
On these illuminations, it clarifies that life satisfaction and happiness cannot
consider as one and the same. These two variables are not the same in the sense that
they should not treated as the same latent variable. Indeed these two variables
strongly correlated but partly influenced by different variables (Gundelach &
Kreiner, 2004). Further explained that if happiness and life satisfaction were the
same latent variable, then these two variables should identically confirmed by the
same independent variables; however, outcome contradicts the resulted analysis.
Drummond (2000) argues that satisfaction with life is a more cognitive while
happiness is a more emotional. Thus, happiness is general expression of feeling,
whereas satisfaction is relating to life that is more specific event, thus it is more
concrete. People may declare they are happy yet not be satisfied with some elements
of their life. Due to this dissimilarity, satisfaction should be expected to relate more
strongly to specific experiences in the individual’s life situation. Other than that,
happiness more closely correlated with the emotional climate (Vitterso, 2013). This
observation supports claim of Diener, et al., (2004) that the association between life
satisfaction and happiness is not perfect and varies across sample populations. One
may feel satisfied with life despite experiencing only a little bit of happiness and thus
the opposite.
Based on described above, happiness and life satisfaction are two distinct
variables in this research because although they are strongly correlated, they cannot
be reduced to a same latent variable. Conceptualized relationships between them
will further be debated in the later sections in this chapter.
49
2.4 Religiosity
2.4.1 Definition of Religiosity
People perceive religion and religiosity in different ways, depending on social
and cultural contexts. Even within the same religion, it may mean different things to
different people. James (1958) defines religiosity as any experiences and
expressions that arise from awareness of supernatural entities role in life’s journey.
These experiences and expressions include cognition, affection, and behavior that
come from individual’s perception of the interaction with divinity that considered
playing an important role in all the things that human do. Almost similarly,
religiosity has been defined as a belief in God’s presence and obedience of the rules
set by God (McDaniel & Burnett, 1990). Religiosity has also been explained as the
extent to which a person submits and obeys following religious beliefs, values,
practices in everyday life (Worthington, 2003).
Refers to definitions offered by James (1998), which is also almost similar as
definition formulated by McDaniel and Burnett (1990), this research defines
religiosity as experiences and expressions include cognitive, affective, and behavior
those come from awareness of God’s presence that considered playing an important
role in human daily life.
2.4.2 Religiosity in Islamic Context.
The word Islam refers to “Peace” and “submission to the Will of Allah”
(Yousaf, 2006). As a religion, Islam has a holy book that has been the main ultimate
source of the principles of the Muslim’s life. It covers a complete code of Muslim’s
conduct, both individual and collective aspects as well. As described in the Holy
Quran, all thoughts and deeds should be performed with God consciousness. Hence,

50
Islam is a set of value systems established by the God Almighty to guide human
beings live a life in this world and to gain rewards from it and to save them from its
punishment. Therefore, Islam is not only a religion but also a way of life for its
adherents.
Belief in Allah the only one God is the most fundamental creed in Islam.
This is related to the recognition or testimony that all exists is the creation of Him.
The second fundamental creed is the belief that Muhammad is the prophet and the
last messenger of Allah to humankind by revealing the Qur’an. However, the first
fundamental creed that is belief in Allah would become a mere theoretical
proposition without belief in the second fundamental creed that is belief in the
Prophet Muhammad. The third fundamental creed is belief in Al-Akhira (the
hereafter). Even though one may have belief in Allah, in the Prophet Muhammad,
and in the Holy Qur’an, but denial of the hereafter is denial of Islam. Everyone is
responsible to Allah for one’s own actions on Day of Judgment. For Muslims, the
belief in the hereafter becomes a great moral force, and a permanent guard stationed
to help them develop a stable character within themselves. Thus, the quality and
character of the true Muslim are not limited to the surroundings of prayer halls, but
extended to every sphere of his work as a way of life (Maududi, 1984). These
fundamental creeds of Islam embodied in the five pillars of Islam. Namely: 1)
“Shahadah” which means as testimony or the declaration of faith; 2) “Shalat” or
Prayers; 3) “Shaum” or Fasting during the month of Ramadan; 4) “Zakah” or Alms
giving; and 5) Pilgrimage (Hajj) to the Ka’bah in Mecca at least once in a lifetime
for those who have the financial ability.
51
2.4.3 Aspects of Religiosity
Psychologists and sociologists have been concerned with various aspects of
religiosity. Hill and Hood (1999) have proposed three aspects for the systematic
study of religiosity, including (a) beliefs of the God’s existence and His role in every
human life movement; (b) quality of every action taken is driven by consciousness of
the role and intervention of supernatural entities; and (c) the strength of commitment
refers to the religious belief system.
These aspects of religiosity are often interchangeable due to so strongly
interrelated (D’Onofrio, et al., 1999). Furthermore, Ryan, et al., (1993) note that it is
possible for two persons to follow the same religious belief system with not the same
ways, as well as for different reasons, so that may also result in different behavioral
and motivational consequences.
In sociology of religion, Glock and Stark (1965) have contributed to the study
of religiosity by proposing five aspects of religiosity that are general reference frame
for conducting research empirically: Intellect, Ideology, Private Practice, Religious
Experience and Public Practice. The following is a brief description of the five
aspects:
1) Intellect refers to body of knowledge, hermetical skill, subjects of interest,
interpretation, and thinking styles. The frequency in thinking about matters
relating to religious issues is a common indicator for this aspect. It specifies
how often a person renews or updates issues related to religious contents
through the medium of thought that cause into the heart of the intellectual
dimension.

52
2) Ideology refers to patterns of plausibility, unquestioned convictions, and
beliefs. The existence of a transcendent reality that credible is general
indicators of this aspect.
3) Private Practice refers to a person’s style of dedication to the Almighty and
patterns of action. It emphases some basic forms of practice addressing to
transcendence, such as prayer, worship, fasting, and pilgrimage.
4) Religious Experience refers to religious feelings, experiences, and patterns of
religious perceptions in the form of joyfulness, humility, peace, fear, and
exaltation. Experiencing the transcendence may be done in two basic forms:
‘experiences of being at one’ and ‘one-to-one experiences’. Experiences of
being at one” refers to a participative one, and one-to-one experiences relates
to a dialogical spirituality pattern.
5) Public Practice refers to forms of deed, a sense of belonging and
responsibility concerning a certain transcendence ritual imagination and a
certain social body. This aspect offers information on how much individual
religiosity is rooted socially and illustrates subjective and frequency of the
involvement in public religious services.
Although the five core aspects above established from a perspective of
sociological, but they also encompass religious study from a perspective of
psychological as they indicate the representation of religious contents from
distinguishable psychological modes. Ideology and Intellect relate to thought,
Private Practice and Public Practice relate to action, and Religious Experience relates
to perception and emotion.
Huber and Huber (2012) denote that the model forms to represent the
common of religious life and establishes the importance of religion for both
53
theoretical and individual. This kind of religiosity model consists of five aspects that
refer to the ideas of Kelly (1955) concerning personality psychology perspective and
the Glock and Stark (1965) notions regarding the multidimensional model of
religiosity.
Huber and Huber (2012) further explain that the construct-system of the
personal religious developed based on the combined of the core of religiosity aspects
to unify psychological entity. Kelly`s (1995) personality theory denotes that a
personal construct is representation of a person’s inner world, a blueprint and pattern
of meaning that allow to anticipate events and human’s behaviors and experiences
structure.
The constructs of personal religiosity system composed of all individual
construction associated with personal religiosity, thus it may interpreted as a
superstructure in personality. Once a person expects something then a religious
meaning will activate a personal religiosity construct. Subsequently, the five main
aspects considered as modes or channels to shape and activate the construct of
personal religiosity. The personal religiosity activated constructs is considerably as a
valid measure for the degree of individual religiosity (Huber & Huber, 2012).
2.4.4 Measurement of Religiosity
To measure religiosity, early researchers have depended upon unidimensional
measures or single indices in which religious attendance is the most commonly
measured element. Bergan, et al., (2001) have argued that a measure of religiosity
may lead to be insufficient and improper ends when the measure relies only on
religious attendance. A young Muslim may be present at the mosque praying for
several motives, may be to keep off social isolation or to give pleasure to their
54
parent. Thus, the act of attending the mosque is limited only to a routine action, not
to a devotional act. Therefore, employing multi dimensions and multi items to
conceptualize and measure religiosity is more preferred and appropriated.
Religious Orientation Scale (ROS) developed by Allport, et al., (1967) is one
of the most frequently used measures of religiosity. They differentiated religiosity
based on motivation into intrinsic and extrinsic of religiousness. The intrinsically
motivated person lives his religion, whereas the extrinsically motivated person uses
his religion. Extrinsic religiousness views religious practice as an avenue to a social
or personal end (e.g. acceptance, comfort) while intrinsic religiousness sees religious
practice for its own sake. Donahue (1985) has evidenced that the Religious
Orientation Scale is a reliable measure of religiosity. Even though the scale has been
broadly used, it has to consider that the scale has been utilized on Christian subjects
and from a Christian perspective.
Wilkes et al. (1986) have developed another measurement of religiosity. This
popular measurement operationalized based on four items, they are importance of
religious values, church attendance, self-perceived religiousness, and confidence in
religious values. They further claimed that measuring religiosity employing multi
items has achieved high validity for almost research.
Worthington et al. (2003) have also established measurement of religiosity
named the Religious Commitment Inventory (RCI-10). The scale comprises of two
dimensions, cognitive dimension associated with religiosity of intrapersonal and
behavioral dimension associated with religiosity of interpersonal. Cognitive
dimension refers to personal religious experience or individual’s belief while
behavioral dimension concerns with the activities in organized religious ritual and
events. Six items employed to express intrapersonal religiosity (cognitive
55
dimension) while four items for expressing interpersonal religiosity (behavioral
dimension).
Other measurement of religiosity is the Centrality of Religiosity Scale (CRS).
The scale established by Huber and Huber (2012) to evaluate the centrality, the
importance of personality religious constructs or salience. According to Huber and
Huber (2012), this scale has applied in sociology of religion and psychology of
religion for more than 100 studies in more than 25 countries, and totally with more
than 100,000 participants. This Centrality of Religiosity Scale (CRS) operationalizes
five core aspects of religiosity from Glock and Stark (1965): intellect, ideology,
private practice, religious experience, and public practice. The scale consists of five
subscales, each subscale contains of three items, with totally 15 items (Huber &
Huber, 2012). The sum of the subscales’ result is the total Centrality. Scored high in
the subscale denote a high level of its dimension while scored high in the total result
indicates a high Centrality level.
2.4.5 Religiosity, Life Satisfaction, and Happiness
There is definitely an ample evidence that religiosity relates to life
satisfaction significantly (Koenig, et al., 2001; Bergan & McConatha, 2001; Kortt, et
al., 2015; Sinnewe, et al., 2015). Study conducted by Koenig, et al., (2001) has
explored 100 researches to investigate the effect of religiosity on life satisfaction.
An important conclusion drawn is people’s attendance at religious services and
religiousness beliefs appear to be predictors of satisfaction with life.
Correspondingly, Bergan and McConatha (2001) have examined the
relationships between religiosity (religious affiliation and private religious devotion)
and life satisfaction. Outcome of the study shows the fact that religious affiliation is
56
more strongly associated with life satisfaction when compared with private religious
devotion.
Furthermore, working with panel data from the 2004, 2007, and 2010 waves
of the Household Income and Labor Dynamics in Australia (HILDA) survey, Kortt,
et al., (2015) looked into the association of religiosity with life satisfaction in the
Australian social setting. The study result provides strong proof for the relationship
between religious’ services attendance and life satisfaction. The study has
additionally unraveled that social resources mediate this kind of correlation, and the
direct effect of religious’ services attendance on life satisfaction has found
significantly as well.
In a similar vein, Sinnewe, et al., (2015) have also explored the relationship
between religiosity and satisfaction with life implementing the German Socio-
Economic Panel data drawn from the wave of 2003, 2007, and 2011. Statistical
result of the study provides suggestion for the significant correlation of religious’
services attendance with life satisfaction. In addition, the finding has provided
evidence that social networks mediate partially this kind of correlation. On those,
religious people considerably possess higher satisfaction with life as they definitely
regularly enroll in religious services and make social networks in their
congregations. Folks have so-called 'need to belong' and religious belief really helps
to satisfy it (Lim & Putnam, 2010). Krause (2008) further described that religious
social resources offer several gains by suggesting people with a better impression of
convenience, belonging, and so identity.
Likewise, previous studies have also identified religiosity as one factor that
may enhance happiness, but a determining factor of happiness as well (Sander, 2017;
Sillick, et al., 2016; Cohen-Zada & Sander, 2011). Based on data from the National
57
Opinion Research Center’s “General Social Survey” in the United States, Sander
(2017) examines the influence of religion on happiness. His study gives particular
attention to the direct outcome of religion on attending religious services and the
indirect result on happiness. The important outcomes encompass the fact that
engagement in religious activities is positively relating to higher degrees of
happiness, and participants without having any religion are much less happy.
A related study reported by Tekke, et al., (2018) exploring the relationship
between religiosity and happiness. The study employs the students at the
International Islamic University in Malaysia. A sample of 189 Sunni Muslim
administered the short-form of Eysenck Personality Questionnaire Revised, the
Oxford Happiness Inventory, and the Sahin-Francis Scale of Attitude toward Islam.
Subsequent to consider sex and personality of individual variations, the study
recorded statistically significant correlation between religiosity and happiness.
According to Abdel-Khalek (2011), there are numerous ways that religiosity may
possibly have an effect on happiness including promises of spiritual and material
compensation. As taught in Islam, remembering Allah, reciting Qur’an, asking
God’s forgiveness, fasting at Ramadan, taking ablutions, and prayer, have a
stimulating unconscious effect on Muslims, and as well supporting them to
momentarily relieve earthly worries.
On the other hand, the association between life satisfaction and happiness has
also attracted attention by some scholars (Shahrooz & Farnaz, 2016; Lyubomirsky, et
al., 2006; Borooah, 2006). For example, in a research using the method of structural
equation modeling to look at the association of life satisfaction with happiness
mediated by resiliency, Shahrooz and Farnaz (2016) have found evidence that the
exogenous variable of life satisfaction has a direct influence on happiness

58
significantly. The results indicate the direct influence of life satisfaction on
happiness and the indirect influence of resiliency as the mediated variable.
Similarly, Lyubomirsky, et al., (2006) have also revealed that global life satisfaction
was the preferred predictors of happiness. Furthermore, working with data on more
than 3000 people in Northern Ireland, Borooah (2006) performs a study into what
exactly makes people happy. The results of study reveal that the higher level of life
satisfaction is going to be a factor for attaining happiness.
Based on studies mentioned above, religious people considerably possess
higher satisfaction with life as they regularly enroll in religious activities such as
praying five times, fasting at Ramadan, paying Zakat, and performing Hajj. This
perceived relationship with God has a stimulating unconscious effect on Muslims to
relieve any worries and as well supporting them to be more sincere for everything
that is lived. In addition, involvement in religious services can also make social
networks in their congregations. This perceived religious social resource offers
several gains by suggesting people with a better impression of convenience,
belonging, and so identity. Thus, the greater the individual enrollment in religious
activities and services, the more they are satisfied in their life. While life satisfaction
is the way in which people perceive how the life has been up to now and how the
feeling of life is going to be in the future, happiness may be the result of ones
perception of experiencing positive emotions of life satisfaction. Therefore, it could
be argued that the association between religiosity and happiness might be due to the
influence of religiosity in increasing the degree of people satisfaction with life.

59
2.5 Self-regulation
2.5.1 Definition of Self-regulation
McCullough, et al., (2013) outlined self-regulation concerning process by
which a system utilizes information regarding its current state to modify that state.
As for Karoly (1993), self-regulation is the term for those particular processes, both
internal and/or transactional, that may make it possible for a person to lead goal-
directed behaviors along with time and as well across varying conditions. More
specifically, Barkley (1997) identified self-regulation as just like any kind of
reaction, as well sequence of reactions, by a person that assists to improve the
possibility of the individual’s upcoming reaction to an event and then, in doing so,
benefits to change the chances of a subsequent end result associated with that event.
When individuals self-regulate, they are simply leading or modifying all of their
action on the search for some preferred end state or target (Carver, et al., 1998).
Self-regulation does not require a considerate or attempt, it mostly happens in a
somewhat effortless and auto pilot process (Fitzsimmons & Bargh, 2004).
Tice and Bratslavsky (2000) make use of self-regulation to refer to the
attempt by a person to switch responses, override desires, and substitute them with an
alternative response which turns the person’s behavior closer to a certain goal.
Whereas according to Baumeister, et al., (2004), self-regulation relates to how a
person asserts control over his or her own reactions in an attempt to reach possible
goals and live up to expectations. The definition of “goal” utilized to depict mental
representations of preferred results to which people are focused (Fujita, 2011). Even
though people may interest or perhaps choose to achieve an outcome, however,
before they are willing to invest cognition, affect, and behavior in reaching it, they
are actually not even committed to that as being an end goal. Austin and Vancouver
60
(1996) further explain that goal intentions related to an expected end state, while
commitment to the goal suggests exactly the extent to which that end state is
definitely preferred and drives behavior. However, achieving a goal is inadequate
simply having an intention. People generally always have the desire and intention to
improve the quality of their particular behavior, but those often only last for a
moment by violating some rules in realizing that intention. Following Baumeister, et
al., (2004), present research defined self-regulation as how a person applies
regulation of his or her own responses to be able to pursue goals and live up to
expectations.
2.5.2 Aspects of Self-regulation
Self-regulation allows individuals to lead their goal-directed behaviors
throughout varying situations and over time (Zimmerman, 1995). As a result, it
could be seen as an attribute associated with the person that allows control over
behaviors. Behavior control comes with dealing with annoying emotions, preventing
attention to distractors, so that enabling to concentrate to a particular attention around
the task. Self-regulation primarily could be improved by means of attention
regulation and emotion regulation.
a) Attention regulation
Attention regulation is the term used for being able to deal with incoming
stimuli as a way to build and maintain a calming way of thinking, tolerate
modification, and generate any specific responses that are cognitive and behavioral
to preferred stimuli definitely. Procedures associated with regulation of attention
rely on characteristics of the central nervous system and mind’s capabilities to

61
convert sensory information easily into structured neural impulses, which
additionally suggest that the attention regulation may be a relatively constant
characteristic of a person (Kandel, et al., 2000). Nevertheless, attention regulation
will not refer to sustained attention, that is, paying attention to an activity over an
extended period will be a common issue of attention-deficit/hyperactivity disorder
(Hooks, et al., 1994). It refers rather to selective attention, that is, ability to focus on
important (voluntarily chosen) environmental stimuli and capability to stay
undistracted by means of unrelated stimuli. This kind of selective aspect of attention,
relating to both environmental and self-related resources, is usually a backbone of
self-regulation of goal-directed behaviors across varying conditions.
b) Emotion regulation
Self-regulation associated with emotions refers to modification of subjective
experience of emotions in a way relating to enhance some specific goals (Lawton,
2001). Emotion regulation considered to require circumstances selection and
modification (selecting or perhaps adjusting an environment so that it turns into
mainly beneficial for some mood). Perhaps it is expected that because of poor self-
regulation concerning negative emotions, people are no longer able to prevent
suffering from negative emotions, are highly preoccupied using their recent
emotions, and also have difficulties with disengagement using their recent emotional
state. They may be driven more close to recent emotional states, particularly when
subjected to unfavorable situations. Conversely, people with high self-regulation
have an understanding of their emotions and therefore are qualified to regulate the
period or strength of their emotions. This kind of regulation could possibly be
gained by means of attention regulation (e.g., concentrating on behaviors that is
62
certainly worked to proximate any achievement of the goal). Results on
experimental study have evidenced that the successful in getting health-related goals
(Tice & Bratslavsky, 2000) and overall performance of cognitive tasks (Baumann, et
al., 2002) essentially predicted by the self’s ability to regulate unfavorable emotions.
Prior and during goal selection as well soon after post-intentional, self-
regulation might possibly require volitional and behavioral processes (Kuhl &
Fuhrmann, 1998). When people are in the stage of goal pursuit, they often
experience troubles to maintain most of their behavior. Concentrating the attention
around the task available and continuing to keep a positive emotional stability can
assist to take care of initiated behavior. Strong self-regulation could possibly assist
in the continued engagement during conducting a task soon after initial failures. In
various periods of goal pursuit, whether the goal is self-compelled or is compelled by
some other person, everyone needs to pay particular attention and stick with the task
available. They should completely focus; even though obstacles come up and
interventions attend to additional tasks arise. However, it is usually a very difficult
self-regulatory process to focus on the present goal priority and reduce temptations.
Self-regulation according to volition’s theory relates to the ability of a
person to make sure the accomplishment of predetermined goals even with
distractions and opposing demands (Corno, 1994; Kuhl, 1992; Kuhl & Beckmann,
1994; Kuhl & Fuhrmann, 1998; Kuhl & Kraska, 1989; Zimmerman, 1995). Thus,
the term of self-regulation commonly considered as a control over emotions and
attention, a parsimonious information processing, an exercising control over the
environment, and a broad range of post-intentional processes.
63
2.5.3 Measurement of Self-regulation
There are several instruments intended for measuring self-regulation. The
most beneficial measure to employ is dependent upon various factors, such as the
population of desired use, the psychometric properties belonging to the measure, as
well as, scale availability.
The Self-Regulation Scale (SRS). The self-regulation scale established by
Schwarzer, et al., (1999) and intended to investigate the ability of a person to take
care of the concentrated attention while attempting to get a goal and preventing
problems found during the process of goal reaching. Schwarzer, et al., (1999) further
explain that such a management problem requires a person to maintain a positive
emotional balance while to concentrate attention around the task available.
Therefore, all of the Self-Regulation Scale’s items definitely built to reveal
regulation of attention and emotional. Score of each item ranges on a 4-point Likert-
type scale, starting from 1 (not at all true) to 4 (completely true), and responses are
summed into an overall score. The higher the score achieved by a person suggesting
increased capability to continue controlling and maintaining one’s attention. The
Self-regulation Scale has exhibited an internal consistency with an alpha Cronbach of
.76 (Schwarzer et al., 1999). While investigation on cross-cultural study has
evidenced that, the Self-regulation Scale produces internal consistency coefficients
of .75 in Costa Rica, of .74 in Finland, and of .73 in Poland (Luszczynska, et al.,
2004).
64
2.5.4 The Role of Self-regulation on the Relationships between Religiosity, Life
Satisfaction, and Happiness
As discussed previously, people who report themselves as religious are
typically more satisfied with their whole lives. Prior researches have offer evidences
that religiosity is significantly associated with life satisfaction (Koenig, et al., 2001;
Bergan & McConatha, 2001; Kortt, et al., 2015; Sinnewe, et al., 2015). What is
more, researches have also revealed religiosity as one factor that may increase
happiness (Sander, 2017; Sillick, et al., 2016; Cohen-Zada & Sander, 2011).
However, this well-known is remarkably plausible, mainly because self-regulation,
like religiosity, is in addition relevant to life satisfaction and happiness (Fox, 2015;
Praskova, et al., 2015).
To note a few, study performed by Fox (2015) among a sample of 63 older
adults in which participants answered the Satisfaction with Life Scale (SWLS) and
the Self-Regulation Inventory (SRI). The study has provided evidence that the older
adult’s self-regulation (SRI) correlates significantly with life satisfaction (SWLS)
scores. The result has provided a correlation coefficient r = .339 (p < .05). In the
same vein, a study has been conducted by Praskova, et al., (2015) to examine a
mediation model of career calling employing a sample of 664 emerging adults
(74.8% female, mean age = 20.2 years). The result provided evidence that career-
calling associate positively with life satisfaction and perceptions of future
employability. They further showed that the associations appear to be the
consequence of the self-regulatory mechanisms of work effort, career strategies, and
emotional regulation. The study also discovered that the self-regulatory mechanisms
(work effort, emotional regulation, and career strategies) mediate the relationship
between career calling and perceived employability while career calling and life
65
satisfaction correlate through work effort and emotional regulation of the self-
regulatory mechanisms.
Additionally, evidence suggesting a positive relationship between self-
regulation and happiness has offered by other studies as well (Mehrangiz, et al.,
2013; Brajsa-Zganec, et al., 2017). To note a few, Mehrangiz, et al., (2013) have
investigated the relationship between happiness, meta-cognitive skills (one of its sub-
scales associated with self-regulation skills) and educational achievement of college
students at state universities in Tehran among sample of 100 students both of gender.
Outcomes suggested substantially positive relationship between happiness, academic
achievement & problem solving, and self- regulation of Students. In addition,
Brajsa-Zganec, et al., (2017) have conducted a study employing 411 nursing part-
time students in which 79% was female (M=25 years) to explore the relationship
between subjective well-being (life satisfaction, happiness) and set of personal (self-
esteem, affect regulation strategies) and social variables (family cohesion, social
support). The study found that the need for self-esteem and affect regulation
strategies (set of personal variables) as well as for family cohesion and social support
(social variables) in predicting life satisfaction and happiness among nursing
students.
Despite the fact that highly religious people possess better self-regulatory
capability (Watterson & Giesler, 2012) even so, many of the links of religiosity with
life satisfaction and happiness, as previously mentioned, may be due to influences of
religiosity on self-regulation. As a result, it might be argued that religiosity has an
effect on how people regulate thoughts and behavior to stay in accordance with
religious values and, in turn, can certainly help clarify life satisfaction and happiness

66
that religious individuals often enjoy. However, further research is needed to
scrutinize the relationships.

67
2.6 Self-control
2.6.1 Definition of Self-control
Conceptualization of self-control was built from control theory, in which a
person modifies, or preserves behavior in reaction to environmental requirements
(Carver & Scheier, 1982). It actually stands for the ‘operate phase’ within the self-
regulatory procedure. For that reason, it involves array of reactions from overriding
desires to intentional behavior (Carver, 2005).
Ainslie (1975) viewed self-control in relation to selection of a postponed but
considerably more beneficial end result over a significantly more immediate end
result that may be ultimately of reduced benefits. This is exactly in accordance with
postponement of gratification and evenly stresses the importance of managing
immediate impulses as well as responses. In addition, self-control has been
referenced as part of the reflective system or cool-cognitive that leads behavior to
goal-directed and usually needs an intentional control or willpower to be effective
(Metcalfe, et al., 1999 & Mischel, et al., 1989). The cool system refers to having
evolved to override pre-potent impulses and habits and to provide long-term self-
regulatory purposes. As opposed, the hot system works with a feeling principle
(“doing thing for feeling good”) and it most typically related to the possibility of
impulsive behavior and poor self-control.
Likewise, some scholars point out that self-control requires a person to end
up with decisions as well to respond in line with long-term instead of short-term
benefits (Logue, 1988; Gottfredson, et al., 1990; Rachlin, 2000). Self-control
according to Tangney, et al. (2004) refers to the ability of self to simply modify or
override one’s inner reactions, and also to stop unwanted propensities of behavior
and to stay away to behave on them. Further denoted that self-control considered
68
definitely not merely a process, it is like a property of systems that contain effective
self-control function. This means that, when people self-controlling they may reach
one particular goal that may pre-potent or conflict with another. However, due to
people are not the same in the effectiveness with which the systems regulating self-
control work, they also vary in self-control.
Essentially, all models discuss the definition concerning self-control as the
self's ability to promote appropriate reactions and prevent unfavorable responses
could possibly occur because of physiological functions, habit, learning, or maybe
the drive associated with the circumstance, for several significant or preferred goal.
They often expect that: a) self-control allows enhancing advisable behavior and
restricting unfavorable behavior; (b) self-control must be necessary for a wide range
of behaviors; (c) self-control is a mindful and effortful type of management behavior;
and (d) self-control has an effect on exact behavior (instead of imagined behavior).
Therefore, the word of self-control employed in this study is the term for the inner
resources accessible to prevent, override, or modify responses that may likely occur
due to physiological processes, habit, learning, or maybe the drive from the
circumstance.
2.6.2 Aspects of Self-control
Tangney et al. (2004) recommend two aspect of self-control: the inhibited of
unwanted behavior and the initiated of preferred behavior. His model illustrates that
experiencing the conflicted self-control between the long-term benefits and the short-
term or present temptations is a requirement to be able to be involved in self-control.
Hofmann and Van Dillen (2012) denote that whenever temptations came
across, self-control demonstrates the battle of the power of influence between
69
impulses or desires on the one side and inhibitory pushes on the other side.
Inhibitory control makes it possible for individuals to put away the tendencies of
impulsive response to enables numerous additional reactions that are consistent with
particular long-term goals (Inzlicht, et al., 2014). To that end, self-control is in many
cases considered as a struggle between two rivaling forces: the force that may drives
manifestation associated with an impulse (i.e., impulse strength) and countervailing
drive that may override or modify the impulse (i.e., self-control strength). Failure in
self-control may originate from strong impulses, poor control, or possibly a mixture
of both factors, while self-control is successful whenever the impulse strength is poor
and the control strength is relatively strong, or with the aid of some mixture of these
two factors.
Differentiating between both aspects of self-control is also in accordance with
Gray’s (1994) concept regarding the Behavioral Inhibition System (BIS) vs. the
Behavioral Activation System (BAS). This theory -also known as Reinforcement
Sensitivity Theory- recognizes the differences between the two systems with
references to responding either to goal-conflict (BIS) or signs of reward (BAS) and
therefore focuses on the difference between inhibition and initiation as separate
approach to attain goals (Corr, 2008).
Almost similar, an examination of the factor structure of the Brief Self-
Control Scale performed by Maloney, et al., (2012) uncovered a structure composing
of two related factors, referred to as restraint (the tendency to endure attraction) and
impulsivity (performing on spontaneous feelings and thoughts). In addition, Carver
(2005) identified restraint as the propensity to be disciplined or become deliberative
and takes part in effortful control; while impulsivity denotes the inclination to
become spontaneous and act on intuition. As indicated by Carver, both of these
70
aspects work in tandem, and they remain competitive against each other to have an
impact on behavioral results. Even so, this 2-factor structure as exhibited by means
of restraint and impulsivity is identical to the differentiation formed between self-
discipline and impulse-control, and as well between inhibition and initiation, which
has wide theoretical support from literatures related to biological, cognitive,
psychodynamic, trait, and developmental literatures as well (Carver, 2005).
Compared to the theoretical recommendations that have been intended to
differentiate between aspects of self-control, this current study employs self-control
construct that consist of restraint as the propensity to stand against distraction or
perhaps temptation, and impulsivity as behaving on spontaneous thoughts and
feeling. However, restraint may perhaps function to override impulses, but it may
additionally function in the lack of any existing environmental signs that prime
impulses.
2.6.3 Measurement of Self-control
There are various scales applied to measure people’s self-control. Duckworth
& Kern (2011) ascertained in excess of 100 measurements have been used to assess
self-control. Nearly all of scales target in explicit people and on a defined aspect of
self-control such as purpose in particular behaviors (e.g., health behavior; Brandon,
et al., 1990) or ego under-control (Letzring, et al., 2005) rather than measuring
personal distinctions in self-control across domains of broad behavioral in
populations as a whole (Baumeister et al., 1994). The following describe three scales
of self-control that have been operated moderately and commonly with various types
of behavioral results, and in a different people: the Low Self Control Scale from
71
Grasmick, et al., (1993); the Barratt Impulsiveness Scale from Patton, et al., (1995);
and the Self-Control Scale from Tangney, et al., (2004).
The Self-Control Scale consists of 36-item, developed by Tangney, et al.,
(2004) to investigate people’s capability to disrupt unnecessary behavioral
propensities and to override or modify inner reactions and to stay away from
performing on them. The study conducted by Tangney, et al. (2004) indicated that
the scale produces a coefficient alpha Cronbach of .89 and a coefficient correlation
of .89 for test-retest reliability over 3 weeks, which means good reliability. In
addition, they have modified the scale into a short scale which consists of 13-item.
Correlation between the short scale and the full scale exhibited a strong relationship
(r = .93) and good psychometric characteristics. The scale published in 2004 and has
employed among diverse populations. For example, Finkel and Campbell’s (2001)
study employs the scale among adult romantic partners; Finkenauer, et al., (2005) use
for young adolescents; and Gailliot (2007) administers the scale for student samples.
The Barratt Impulsiveness Scale comprises of 30 items, designed by Patton,
et al., (1995) to measure people’s behaving without thinking, deficiency of
preparation, and spontaneous decision making. Despite the fact that trait
impulsiveness stresses poor self-control, trait self-control aims at ignoring an
impulse. Therefore, this kind of scale apparently considers that (poor) self-control
and impulsiveness definitely symbolize the two end-points of the same dimension,
thus they are similar constructs (Tangney, et al., 2004; Duckworth & Kern, 2011).
Duckworth and Kern (2011) denote that the scale is one of the most broadly
employed measures of self-control and utilized like a generic way of measuring
impulsiveness. Furthermore, the study conducted by Patton, et al., (1995) has

72
demonstrated that The Barratt Impulsiveness Scale possesses proper reliability of
Cronbach’s coefficient alpha greater than .80.
The Low Self-Control Scale involved 24 items, developed by Grasmick, et
al., (1993). This scale extracted from self-control theory suggested by Gottfredson
and Hirschi (1990). This theory opposes that difference among people in their
capability to practice self-control when confronted with attraction accounts for
individual variations in improper behavior. The Scale is attempting to get on six
different elements of low self-control: impulsivity, desire for simple instead of
complicated tasks, risk seeking, self-centered orientation, poor tolerance for inability,
and inclination for physical instead of cerebral activities. Based on Pratt and
Cullen’s (2000) study, the Low Self-Control Scale has demonstrated good reliability
of Cronbach’s coefficient alpha greater than .80. The scale frequently employed in
studies on deviant behavior in both community samples and student samples.
Considering the above discussion, self-control in this study was measured by
the Brief Self-Control Scale from Tangney, et al., (2004). Even though it is actually
a shortened version of a longer, multifactorial instrument, the Brief Self-Control
Scale has demonstrated to provide significant psychometric properties. There are at
least two causes intended for doing so. First, the Brief Self-Control Scale has
already been utilized relatively generally in many different populations as well with
many varieties of behavioral results. Second, concerning several other instruments,
Brief Self-Control Scale is the most widely recognized models of the self-control
design in the literature.
73
2.6.4 The Role of Self-control on the Relationships between Religiosity, Life
Satisfaction, and Happiness
Self-control is among the most important portions of self-regulation (Hagger,
et al., 2010), this is because it enables people to remain following up on a targeted
goal, although the majority of doing so is intricate. In different phrase, people with
better self-control are generally greater at self-regulation and then more liable to
attain most of their goals, particularly those linked to life satisfaction and happiness.
Consequently, the same as self-regulation previously discussed, self-control has also
the link with life satisfaction and happiness.
As for instance, Li, et al., (2016) conducted a study on self-control, coping,
and life satisfaction in the Chinese context. The study aimed to examine that the
relationship between self-control and life satisfaction as mediated by positive coping.
The study included two type of sample, the first employing university student as
many as five hundred and twenty-five people and the second using employee as
many as two hundred ninety-four people. The study discovered that self-control is
positively related to life satisfaction in both samples and this relation mediated
partially by positive coping. Additionally, Hoffmann, et al., (2013) also examine the
effect of trait self‐control (TSC) on life satisfaction and affective well‐being. Result
of the study has provided evidence that people with greater self-control are more
likely to be satisfied with their lives. In addition, the more self-control people
reported, the more likely they are to be happy in the long-term. They additionally
described that the ability to resist temptations and impulses are the important cause
for people to be more satisfied with their lives.
Almost the same results have been found in happiness as well, such as study
conducted by Wiese, et al., (2017). They examined the relationship between self-
74
control and happiness to identify whether a curvilinear relationship exists between
both. The study conducted across six phases with a total 5,318 participants uses
multiple metrics that include questionnaires and behavioral ratings, sources consist of
self‐report, and methods encompass cross‐sectional measurement and experience
sampling method. After statistically controlling for demographics and other
psychological confounds, result of the study presented that self‐control increases
happiness with little to no apparent downside of too much self‐control. Furthermore,
Converse, et al., (2018) have examined the effect of self-control levels and slopes on
the work, relationship, and domains of well-being across adolescence and young
adulthood. The employed data was from the National Longitudinal Study of
Adolescent to Adult Health. The study explored two possibilities: high levels of self-
control or increasing levels of self-control across this developmental period may be
important to these outcomes. The study revealed more consistent with the
proposition that the high levels of self-control across this developmental period may
be important to the outcomes examined. In addition, Ramezani, et al., (2015) reports
a study that explores the relationships between happiness, self-control and locus of
control. This correlational study employed 200 students of university aged between
18 and 28 years old and used three questionnaires, the Oxford Happiness Inventory,
Self-control Scale of Nikmanesh and Rotter's Locus of Control Scale. The study has
found a positive and significant correlation between happiness, self-control and locus
of control. The study has also suggested that the strongest predictor for happiness is
self-control.
On this basis, religiosity appears to influence behaviors that people select,
influence the choice of response to various stimuli, reduce conflict, and to impact the
development by way of religious holy tenets are transformed into personally
75
meaningful values, and certainly allow people to possess greater self-regulatory
ability. Thus, however, the associations between religiosity and self-control propose
some significant paths for religiosity to effect life satisfaction and happiness.
2.7 Conceptual Framework
This study sets to address the relationship between religiosity and happiness
through self-control, self-regulation, and life satisfaction. The basic notions for the
emergence of many interconnections among these concepts based on consideration
that some forms of religiosity (belief and behavior) promote self-control and self-
regulation, and through its association, religiosity obtains its association with life
satisfaction and happiness. The following provides evidences and supports
surrounding these basic ideas.
The finding that religiosity is linked to self-reported self-control (Baumeister,
et. al., 2007) is well established. Results from some personality researches have
provided evidence that people who scored higher on self-control measurement and
personality dimensions that subsume self-control also have a tendency to become
significantly more religious (Saroglou, 2002; Lodi-Smith & Roberts, 2007; Francis
& Katz, 1992). In summary, dimensions of personality that linked to the capability
to regulate one’s behavior in a way in line with one’s purpose or out of concern for
the wishes and feelings of others (e.g., high Agreeableness, high Conscientiousness,
and low Psychoticism) related to religiosity. These outcomes deliver tentative
endorsement for the suggestion that religiosity is related to self-control.
Religion may potentially has an effect on the chosen goals that people decide
on (Roberts & Robins, 2000; Saroglou, et al., 2004), effect the importance relevant to
those goals, minimize conflict between all those goals (Emmons, 1999), and as well,
76
persuade the process by which religious teachings are transformed into personally
substantial values (Ryan, et al., 1993). This religious relationship with goals
endorses some essential paths by which religion has the potential impact on self-
regulation.
Peterson, et al., (2005) have conducted a study that attempted to define the
effect of the three happiness orientations (pleasure, meaning, and engagement) on
people’s level of life satisfaction using Satisfaction with Life Scale from Diener, et
al., (1985). Result of the study revealed incompatibility of the three orientations;
rather, they are simultaneous. Relating to this result, it may perhaps indicate the
presence of a relationship between the three orientations that enables for feedback
between them. Another study conducted by Martin, et al., (2010) has evidenced the
relationship between orientation to happiness and satisfaction with life. They further
explained that the pleasure orientation contributes smaller when compared to the
other two orientations. In addition, people who scored high on the three scales
achieved life satisfaction at greater level, the contrary result also found for people
scored low on the three subscales. Diener (2000), Haybron (2013), and Schwartz, et
al., (2002) also illustrate the conceptual difference between happiness and life
satisfaction, meanwhile Lyubomirsky, et al., (2005) found that satisfaction with life
influences people’s feeling of happiness.
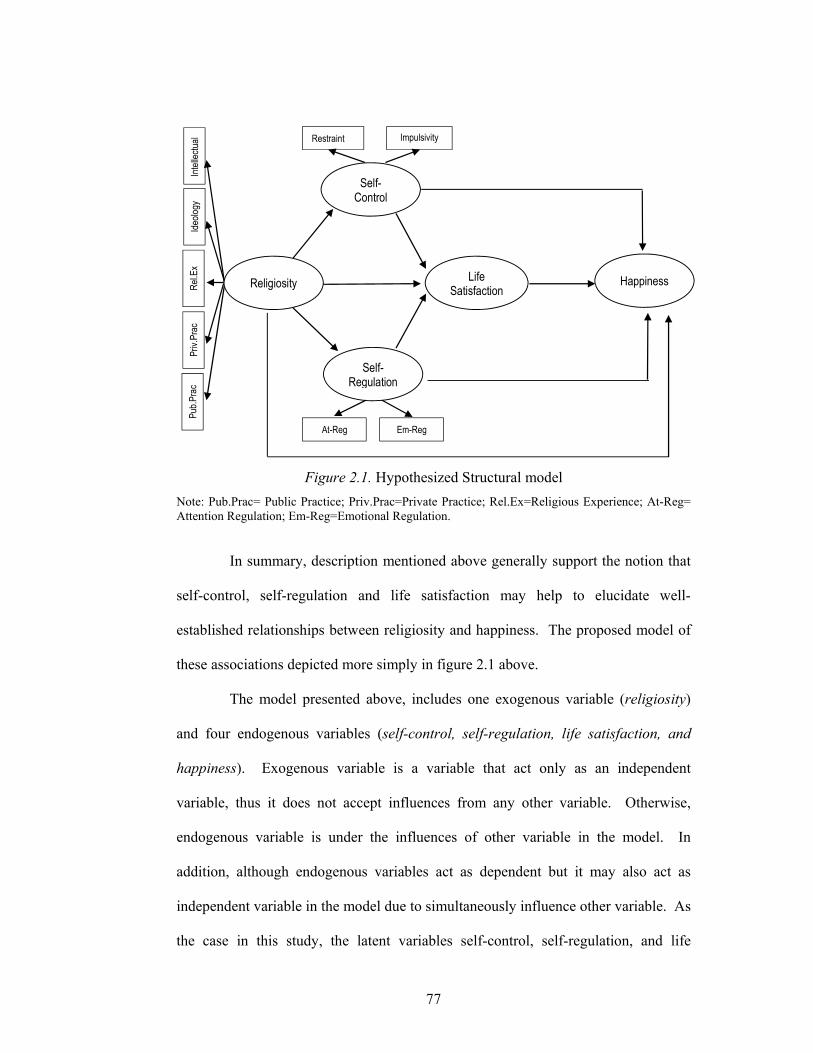
77
Figure 2.1. Hypothesized Structural model
Note: Pub.Prac= Public Practice; Priv.Prac=Private Practice; Rel.Ex=Religious Experience; At-Reg= Attention Regulation; Em-Reg=Emotional Regulation.
In summary, description mentioned above generally support the notion that
self-control, self-regulation and life satisfaction may help to elucidate well-
established relationships between religiosity and happiness. The proposed model of
these associations depicted more simply in figure 2.1 above.
The model presented above, includes one exogenous variable (religiosity)
and four endogenous variables (self-control, self-regulation, life satisfaction, and
happiness). Exogenous variable is a variable that act only as an independent
variable, thus it does not accept influences from any other variable. Otherwise,
endogenous variable is under the influences of other variable in the model. In
addition, although endogenous variables act as dependent but it may also act as
independent variable in the model due to simultaneously influence other variable. As
the case in this study, the latent variables self-control, self-regulation, and life
Ideo
logy
R
el.E
x Pr
iv.P
rac
Pub.
Prac
In
telle
ctua
l
Self-Regulation
Self-Control
Restraint Impulsivity
Em-Reg At-Reg
Religiosity Life Satisfaction
Happiness
78
satisfaction are endogenous variables because each of these variables influences
others and influenced by others as well.
The central construct in this study’s model is the endogenous and latent
variable happiness. As for latent variables religiosity, self-regulation, and self-control
work as determinants for happiness, both directly and indirectly. Latent variable life
satisfaction only affects happiness directly but also acts as mediator variable for the
influences exerted by other latent variables in the model. As figured in the model,
life satisfaction is the mediator for the influence of religiosity and self-control on
happiness, as well as mediates the influence of variables religiosity and self-
regulation on happiness.
However, the combined model proposed in this study have gain evidences
empirically from the literatures as discussed aforementioned to ensure that they are
based on established and authoritative knowledge, and corresponds to the following
research hypotheses.
2.8 Hypotheses
Based on previous description of conceptual framework, the present research
proposes several hypotheses below:
1. Religiosity is positively related to self-control.
2. Religiosity is positively related to self-regulation.
3. Self-control and self-regulation mediate the relationship between religiosity
and life satisfaction.
4. Self-control, self-regulation and life satisfaction mediate the relationship
between religiosity and happiness.
79
CHAPTER 3
METHODOLOGY
3.1 Introduction
This chapter discusses the research methodology used in the study in order to
gather empirical evidence and test the hypotheses. The aims of the chapter are to
describe, clarify, and provide rationalizations for the method used in this study. The
chapter begins with an explanation of research design. Subsequently, location,
population and sampling, procedure, measurement, and ethical consideration are
discussed and this is followed by a description of data analysis. In the last part, the
pilot study and its result are presented.
3.2 Research Design
The present study examines how the exogenous variables are related to the
endogenous variables. Specifically, it scrutinizes whether or not the relationship
between religiosity and happiness are mediated by self-control, self-regulation, and
life satisfaction. This analysis involves developing a causal explanation. As such, an
explanatory research is appropriate for the present research.
The unit of analysis of this study is individual from a population who were
asked to complete a set of psychometric instruments at only one point in time in
order to get enough responses for the study. Therefore, a cross-sectional design is
appropriate to describe the present research (Rosnow & Rosenthal, 2008).
A quantitative approach is employed for data collection. The overarching
consideration of using quantitative approach is to allow greater objectivity and
accuracy of results and to elude subjectivity or personal bias by keeping a distance
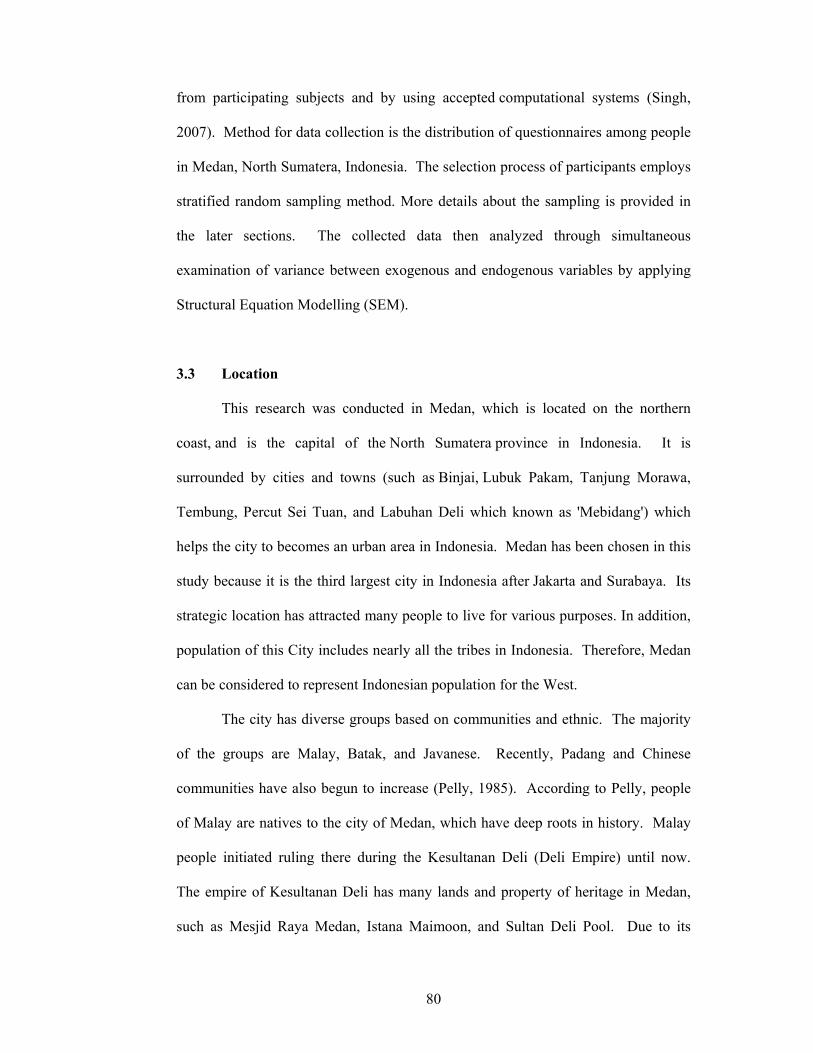
80
from participating subjects and by using accepted computational systems (Singh,
2007). Method for data collection is the distribution of questionnaires among people
in Medan, North Sumatera, Indonesia. The selection process of participants employs
stratified random sampling method. More details about the sampling is provided in
the later sections. The collected data then analyzed through simultaneous
examination of variance between exogenous and endogenous variables by applying
Structural Equation Modelling (SEM).
3.3 Location
This research was conducted in Medan, which is located on the northern
coast, and is the capital of the North Sumatera province in Indonesia. It is
surrounded by cities and towns (such as Binjai, Lubuk Pakam, Tanjung Morawa,
Tembung, Percut Sei Tuan, and Labuhan Deli which known as 'Mebidang') which
helps the city to becomes an urban area in Indonesia. Medan has been chosen in this
study because it is the third largest city in Indonesia after Jakarta and Surabaya. Its
strategic location has attracted many people to live for various purposes. In addition,
population of this City includes nearly all the tribes in Indonesia. Therefore, Medan
can be considered to represent Indonesian population for the West.
The city has diverse groups based on communities and ethnic. The majority
of the groups are Malay, Batak, and Javanese. Recently, Padang and Chinese
communities have also begun to increase (Pelly, 1985). According to Pelly, people
of Malay are natives to the city of Medan, which have deep roots in history. Malay
people initiated ruling there during the Kesultanan Deli (Deli Empire) until now.
The empire of Kesultanan Deli has many lands and property of heritage in Medan,
such as Mesjid Raya Medan, Istana Maimoon, and Sultan Deli Pool. Due to its

81
strategic location and the rapid development of the city have attracted many people
(such as ethnic Toba, Sibolga, and Tanah Karo) to come to visit for various
purposes. Batak people with their typical rude and strong character are more
dominant for a memorable image of the city. They have established in Medan for
many years, so that sometimes outsiders think that they are the Medan natives.
However, Batak’s people were respected as they support Medan to be a competitive
city. Javanese people are transmigrants, many of them were forced to move there by
the government during transmigration programs. Javanese people represent hard
working class and the warm people of Medan. Almost the core of the Medan
economy has controlled by Chinese and Minangkabau people since they run most of
Medan industries and trading. Chinese people run factories and grocery stores, while
Minangkabau people run garment, food and retail businesses.
Administration of Medan City, with the total area of 265.10 km2, led by a
mayor (Walikota) and divided into 21 districts with 151 sub-districts (village) and
2001 administrative units. The following tables describe in detail the distribution of
the land area, district and villages.
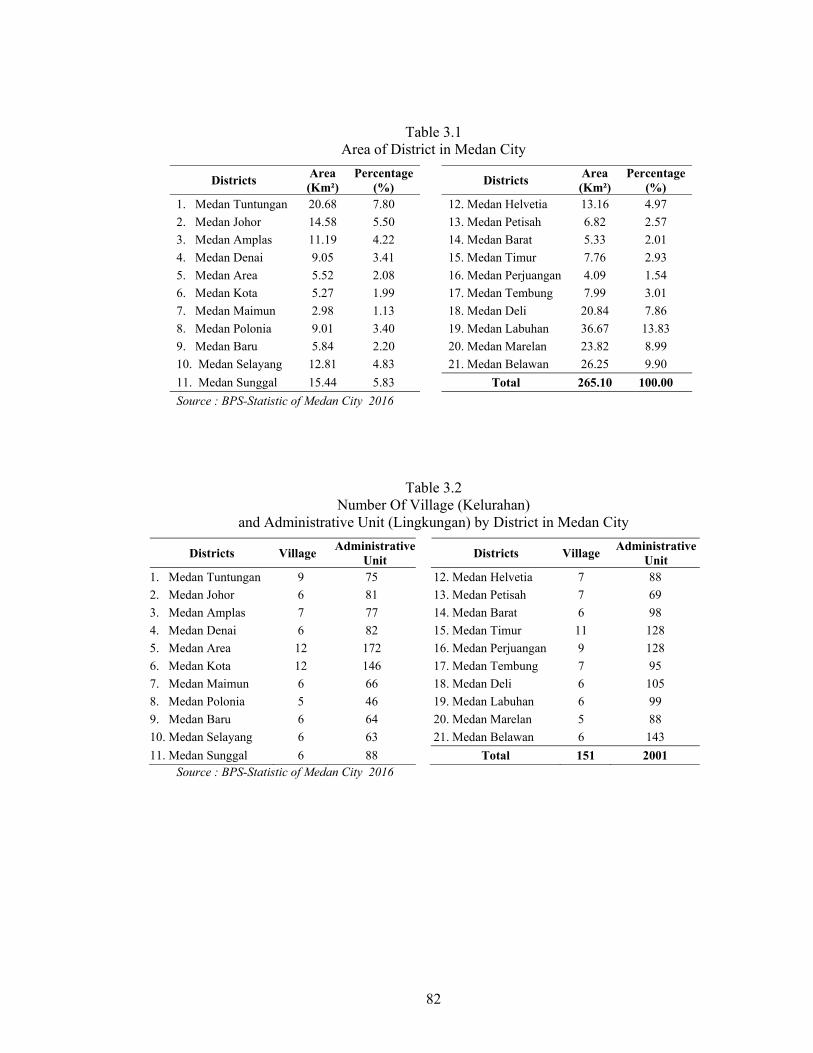
82
Table 3.1 Area of District in Medan City
Districts Area (Km²)
Percentage (%)
Districts Area (Km²)
Percentage (%)
1. Medan Tuntungan 20.68 7.80 12. Medan Helvetia 13.16 4.97
2. Medan Johor 14.58 5.50 13. Medan Petisah 6.82 2.57
3. Medan Amplas 11.19 4.22 14. Medan Barat 5.33 2.01
4. Medan Denai 9.05 3.41 15. Medan Timur 7.76 2.93
5. Medan Area 5.52 2.08 16. Medan Perjuangan 4.09 1.54
6. Medan Kota 5.27 1.99 17. Medan Tembung 7.99 3.01
7. Medan Maimun 2.98 1.13 18. Medan Deli 20.84 7.86
8. Medan Polonia 9.01 3.40 19. Medan Labuhan 36.67 13.83
9. Medan Baru 5.84 2.20 20. Medan Marelan 23.82 8.99
10. Medan Selayang 12.81 4.83 21. Medan Belawan 26.25 9.90
11. Medan Sunggal 15.44 5.83 Total 265.10 100.00
Source : BPS-Statistic of Medan City 2016
Table 3.2 Number Of Village (Kelurahan)
and Administrative Unit (Lingkungan) by District in Medan City
Districts Village Administrative
Unit Districts Village
Administrative Unit
1. Medan Tuntungan 9 75 12. Medan Helvetia 7 88
2. Medan Johor 6 81 13. Medan Petisah 7 69
3. Medan Amplas 7 77 14. Medan Barat 6 98
4. Medan Denai 6 82 15. Medan Timur 11 128
5. Medan Area 12 172 16. Medan Perjuangan 9 128
6. Medan Kota 12 146 17. Medan Tembung 7 95
7. Medan Maimun 6 66 18. Medan Deli 6 105
8. Medan Polonia 5 46 19. Medan Labuhan 6 99
9. Medan Baru 6 64 20. Medan Marelan 5 88
10. Medan Selayang 6 63 21. Medan Belawan 6 143
11. Medan Sunggal 6 88 Total 151 2001 Source : BPS-Statistic of Medan City 2016

83
3.4 Population and Sampling
Population in this research is the people who live in Medan, North Sumatera,
Indonesia. From the Central Bureau of Statistics of Medan City (BPS, 2016), the
population of city has reached 2,135,516 inhabitants. The following tables describe
in details of the population by districts, age group, and sex.
Table 3.3
Population of Medan City by Districts and Gender
Districts Male Female Total 1. Medan Tuntungan 40,097 42,437 82,534 2. Medan Johor 62,331 64,336 126,667 3. Medan Amplas 57,918 59,004 116,922 4. Medan Denai 71,750 71,100 142,850 5. Medan Area 48,054 49,200 97,254 6. Medan Kota 35,422 37,700 73,122 7. Medan Maimun 19,524 20,379 39,903 8. Medan Polonia 26,460 27,413 53,873 9. Medan Baru 17,667 22,150 39,817 10. Medan Selayang 49,525 51,532 101,057 11. Medan Sunggal 55,717 57,927 113,644 12. Medan Helvetia 71,586 74,805 146,391 13. Medan Petisah 29,526 32,701 62,227 14. Medan Barat 34,931 36,406 71,337 15. Medan Timur 52,906 56,539 109,445 16. Medan Perjuangan 45,405 48,683 94,088 17. Medan Tembung 65,761 68,882 134,643 18. Medan Deli 86,937 85,014 171,951 19. Medan Labuhan 57,635 55,679 113,314 20. Medan Marelan 75,066 73,131 148,197 21. Medan Belawan 49,175 47,105 96,280
Total 1,053,393 1,082,123 2,135,516 Source : BPS-Statistic of Medan City 2016
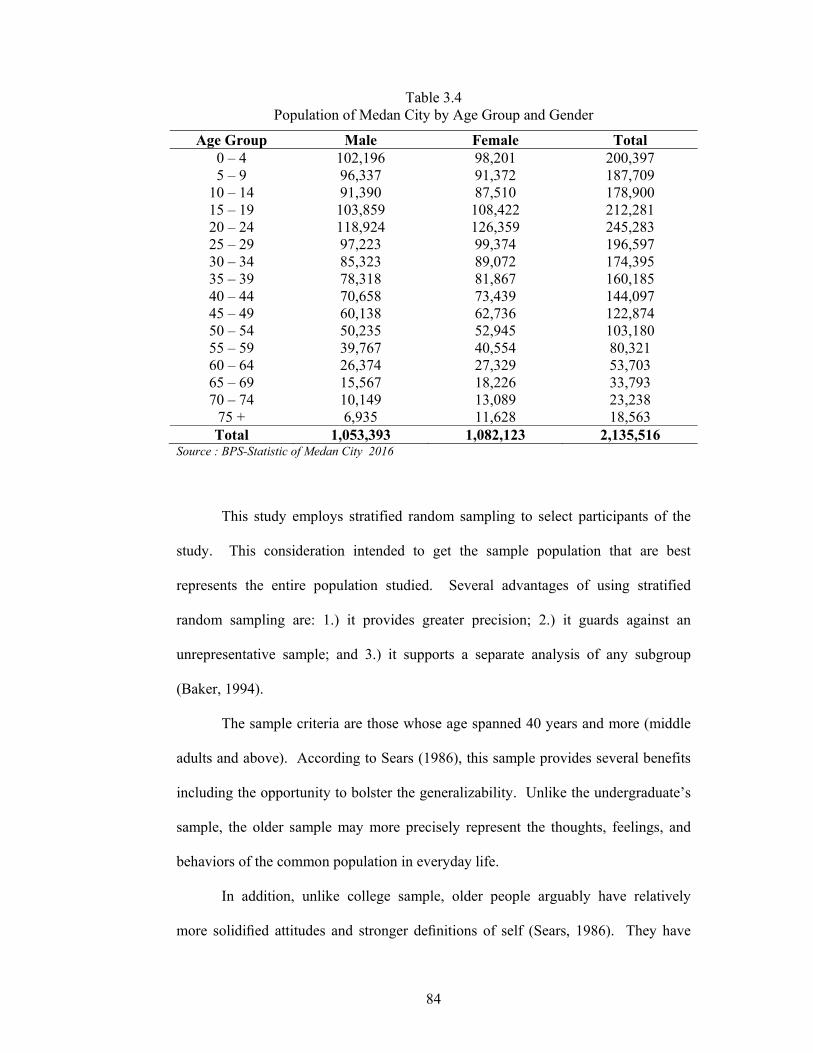
84
Table 3.4 Population of Medan City by Age Group and Gender
Age Group Male Female Total 0 – 4 102,196 98,201 200,397 5 – 9 96,337 91,372 187,709
10 – 14 91,390 87,510 178,900 15 – 19 103,859 108,422 212,281 20 – 24 118,924 126,359 245,283 25 – 29 97,223 99,374 196,597 30 – 34 85,323 89,072 174,395 35 – 39 78,318 81,867 160,185 40 – 44 70,658 73,439 144,097 45 – 49 60,138 62,736 122,874 50 – 54 50,235 52,945 103,180 55 – 59 39,767 40,554 80,321 60 – 64 26,374 27,329 53,703 65 – 69 15,567 18,226 33,793 70 – 74 10,149 13,089 23,238
75 + 6,935 11,628 18,563 Total 1,053,393 1,082,123 2,135,516
Source : BPS-Statistic of Medan City 2016
This study employs stratified random sampling to select participants of the
study. This consideration intended to get the sample population that are best
represents the entire population studied. Several advantages of using stratified
random sampling are: 1.) it provides greater precision; 2.) it guards against an
unrepresentative sample; and 3.) it supports a separate analysis of any subgroup
(Baker, 1994).
The sample criteria are those whose age spanned 40 years and more (middle
adults and above). According to Sears (1986), this sample provides several benefits
including the opportunity to bolster the generalizability. Unlike the undergraduate’s
sample, the older sample may more precisely represent the thoughts, feelings, and
behaviors of the common population in everyday life.
In addition, unlike college sample, older people arguably have relatively
more solidified attitudes and stronger definitions of self (Sears, 1986). They have
85
conceivably lived a longer life to reflect on and judge their personality, feelings, and
beliefs – e.g., whether they have achieved their cherished goals, how happy or
positive or neurotic they truly are, or how much they really agree to take and like
themselves, their activities, and/or their friends. These older people may have lived a
long enough to be eligible to assess their happiness, and many other characteristics
more accurately.
Referring to mentioned consideration, populations in this study are those who
live in Medan and whose age spanned 40 years and more, hence there are 579,769
people in accordance with the criteria. A sample size of 628 people is drawn from
those people. Lodico, et al., (2006) suggest that sample sizes of 350 to 500 people
are often sufficient for large population. Almost similar, Sekaran (2003) denotes that
in between 30 and 500 is an appropriate size of sample for most research. In
addition, according to Yamane’s (1967) formula, for a 95% confidence level and
p=.05 sample sizes needed are 400 people [n=N/1+N(e)2 = 579,769/1+579,769(.05)2
= 399.724].
Referring to analyze using structural equation modeling, determination of
appropriate sample is often considered in accordance with the number of observed
variables. Bentler and Chou (1987) denote sufficient size for latent variable
possessed multiple indicator is 5 cases per variable. Roscoe (1975) proposes at least
5 to10 times of the variables of the study. Hair, et al., (2006) furthermore explained
that the minimum sample size to use maximum likelihood (ML) and to considerate
validating for the causal relationship should be at least 100 to 150. However, a size
of 10 observations per indicator of variable is an adequate sample size and accepted
rule of thumb. Since there are forty-seven observations (4 from happiness; 5 from
life satisfaction; 15 from religiosity; 13 from self-control; and 10 from self-
86
regulation) in this study, then the minimum sample size should be 47 x 10 = 470
people. Hence, the employed sample size in this study considered sufficient in
representing the population of the study and it is appropriate to be analyzed using
structural equation modeling (SEM).
3.5 Procedure
To reach to the community samples, the distribution of the questionnaires
employed the assistance of community religious teachers or so-called ‘ustadz’.
Ustadz is an honorific title for a male teacher used in Indonesia, as well in other
Islamic world. They often provide religious recitation and teaching in various social
group activities at both workplaces and/or residential areas. They often have well-
respected and well-trusted positions in the community and these criteria are
important to reach to the targeted sample and to facilitate the process of data
collection.
Once ustadz were identified and agreed to assist, the researcher went with
ustadz when they went to the communities to teach. Questionnaires were distributed
after the teaching session by the ustadz was over. The researcher gave an
introduction and guidance to questionnaires before passing out the five self-rating
questionnaires of the study. The researcher also read the Informed Consent (IC)
notice to all participants. The IC notice provided participants with the various
information. The researcher also provided answers of the participants have any
questions. After the IC notice was read and any questions answered, the respondents
were asked to complete questionnaires if they were willing to participate. The
instruments and pens were provided to respondents and they were asked to complete
instruments voluntarily and were not compensated for their time.
87
3.6 Measurement
Data were gathered using questionnaires that have been developed and
accessed freely. Several benefits was gained using a questionnaire as an instrument
for data collection, such as obtaining data more efficiently relating to time, energy,
and researcher cost.
3.6.1 Questionnaire Design
This study employs self-report questionnaires that consist of seven sections.
Section one is Informed Consent (IC); section two is demographic background
(name, age, gender, and residence); section three is Subjective Happiness Scale;
section four is Satisfaction with Life Scale; section five is Central of Religiosity
Scale; section six is Self-Regulation Scale; and last section is Self-Control Scale.
The brief overview of each scale is as follows:
The Subjective Happiness Scale (SHS; Lyubomirsky, et al., 1999) was
designed to assess subjective happiness. It consists of four items, each item is
completed by selecting one of seven choices that finish a given sentence
fragment. The choices are different for each of the four statements. Research
has established acceptable psychometric properties for the Subjective
Happiness Scale. Result of the study across samples of varying ages,
occupations, languages, and cultures has provided alpha coefficients for
internal consistency ranging from .79 to .94. The scale has also demonstrated
stability over time (ranged from 3 weeks to 1 year) which the results of the
test-retest reliability ranged from .55 to .90 (Lyubomirsky, et al., 1999).
The Satisfaction with Life Scale (SWLS; Diener, et al., 1985) was designed to
measure overall cognitive judgments of one’s life satisfaction. It consists of
88
five items, each item is completed by selecting one of seven choices which
indicate how much participant agree or disagree with each of the five-items.
Items are added up in order to yield a total score of life satisfaction. The
possible range of scores is between 5 and 35, with greater scores signifying
higher satisfaction with life. Research has established acceptable psychometric
properties for the SWLS. The two month test-retest correlation coefficient was
.82 and coefficient alpha was .87 (Diener, et al., 1985).
The Centrality of Religiosity Scale (CRS; Huber, S., & Huber, O. W., 2012)
was developed to measure the centrality or the importance of the meaning of
religiosity in personality considered as characteristic for the total of religious
live. It consists of five subscales, namely intellectual, ideology, religious
experience, private practice, and public practice. Each subscale has three items
and is completed by choosing one of five options. The sum of the subscales’
results is the total result of Centrality. High score in the subscale means a high
level of its dimension while high score in the total result means a high level of
Centrality. Research has established acceptable psychometric properties for
the Centrality of Religiosity Scale. In three studies, reliabilities of the
individual dimensions ranged from 0.80 to 0.93, and from 0.92 to 0.96 for the
whole CRS-15 (Huber, S., & Huber, O. W., 2012).
The Brief Self-Control Scale (BSCS; Tangney, et al., 2004) was established to
measure people’s self-control and conceptualized based on contemporary
theoretical perspectives. It refers to post-intentional behavior when people are
in the period of goal-pursuit and face difficulties in maintaining their action. It
consists of thirteen items, which utilize a five-point Likert-type response
format with response options ranging from 1 (Not at all like me) to 5 (Very
89
much like me). Research has established acceptable psychometric properties
for the Brief Self-Control Scale. In two studies, alphas for the Brief Self-
Control Scale were highly reliable (.83 and .85 in Studies 1 and 2,
respectively). In addition, the scale has also demonstrated stability over time
(roughly three weeks) which the result of the test-retest reliability was .87
(Tangney, et al., 2004).
The Self-Regulation Scale (SRS; Schwarzer, et al., 1999) was designed to
measure focus of attention on the task and emotional balance. The scale
contains two subscales, attention regulation and emotion regulation, and
consisting of ten items. It utilizes a four-point Likert-type response format
with response options ranging from ‘Not at all true’ to ‘Exactly true’, thus the
score is ranging from 10 to 40 points. Higher scores reflecting greater ability
to maintain one’s attention (e.g., self-regulation) and lower score indicate
lower self-regulation. Responses are calculated up to get a total score. The
scale designed for the use of general adult population. Research has
established acceptable psychometric properties for the Self-Regulation Scale.
In a sample of N = 442 persons the scale has obtained an internal consistency
of Cronbach's alpha = .76; and the scale yielded a retest stability of .62 after six
weeks (Schwarzer, et al., 1999).
3.6.2 Translation
Instruments of the employed variables in this study adapted from previous
works that was not originally in Indonesian language (Bahasa Indonesia). Hence, it
is very important to carefully translate the instruments, because mistakes caused by
careless in translation may misrepresent the original intent of the instrument
90
(Yamkovenko, et al., 2007). Thus, to permit feasibility and avoid blunders in
collecting data from the Indonesian context, this study employs the forward-then-
backward translation approach from Chen and Bates (2005).
Initially, two professionals in Bahasa Indonesia and English separately
conducted the forward translation of the English version of the questionnaire items
into Bahasa Indonesia version. The two experts who did the translation were
English lecturers at State Islamic University of North Sumatera, in Medan,
Indonesia. After that, the two other experts separately back-translated questionnaire
into English. Later, the four interpreters met and concurred on the appropriate
wordings of the translation to ensure no discrepancies in meaning between the
original questionnaire items and translated version. According to Deutscher (1973),
to deal with language problems, this technique is employed broadly.
3.7 Ethical Consideration
The researcher complied with ethical consideration in standard psychological
research. An informed consent letter attached to the distributed instrument package
was read out to the respondents at the time of survey administration. As can be seen
in the informed consent letter, respondents were informed concerning the research
purpose, were given anonymity, and were offered voluntary participation with no
cost or harm. Respondents were further informed that if they choose to participate,
they could simply fill out the survey and return it to the researcher.
There was no deception in this study. There were also no protected or
vulnerable populations targeted as the focus of the study. If a member of one of the
protected groups was selected for the sample, participation was not seen to increase
his or her risk in any way by answering these questions. Although notice was not
91
given to this, when any respondent reported not having reached the age of
requirement (40 years and more), the entire response set for that respondent was
removed from the final dataset.
3.8 Data analysis
The employed data analysis in this study is Structural Equation Modelling.
This consideration is due to several causes. First, structural equation model accounts
for the effect of measurement and structural errors, thus it is more appropriate than
multiple linear regressions. Secondly, Structural Equation Modelling determines the
acceptable model based on overall model fit. Thirdly, Structural Equation Modelling
assesses each link (both direct and indirect) between the hypothesized variables and
explains such complex relationship, while multiple linear regressions only allow the
assessment of direct relationship.
The overall strategy regarding data analysis used in this study comprised of
two sub-models: it begins with analysis on the measurement model, and then
proceeds to the structural model. On the measurement model, each indicator
measures its latent variable, or, in other words, how each construct is
operationalized. While the latter (the structural model) characterizes the relationship
between exogenous and endogenous variables, exhibits the path and statistical
significance of each relationship, as well as the amount of variance in the
endogenous variables explained by the respective proposed determinants. Refers to
Anderson and Gerbing (1988), the two components (measurement and structural
model) have the complexity so they should be analyzed separately to attain better
outcomes. The assessment begins with the measurement model that consists of
dimensionality, validity, and reliability tests, subsequently moving on to the
assessment of the structural model (using the LISREL software 8.80). This model
92
describes and explains the phenomenon of research. Latent variables of the
hypothesized model were religiosity, self-control, self-regulation, life satisfaction,
and happiness.
3.9 Pilot Study
Before data for the main research study collected, a pilot study was conducted
to ensure the research instruments employed in gathering the needed data for the
main study are valid and reliable (Baker, 1994). He further explained that a pilot
study used to try-out a research instrument is often a sample size of 10-20% of the
sample size for the main study. On the other hand, Lodico, et al., (2006) stated that
the sample size for pilot study in social science should be at least 30 participants.
This amount is a reasonable number of participants for a pilot study.
One of the purposes of this pilot study is to make sure that respondents have
correctly understood all instructions and content of research instruments employed in
the study. In order to yield the kind of information needed, both researcher and
respondent should have the common understanding of the questionnaires. In this
case, questionnaires pre-tested to 10 respondents in accordance with the criteria of
the main research.
Furthermore, reliability and validity tests were conducted to determine
whether the psychometric used in the present study produces consistent and valid
data. This is done by distributing questionnaires to 50 pilot respondents. Several
analyses were undertaken with the data to assess various aspects relating to reliability
and validity.
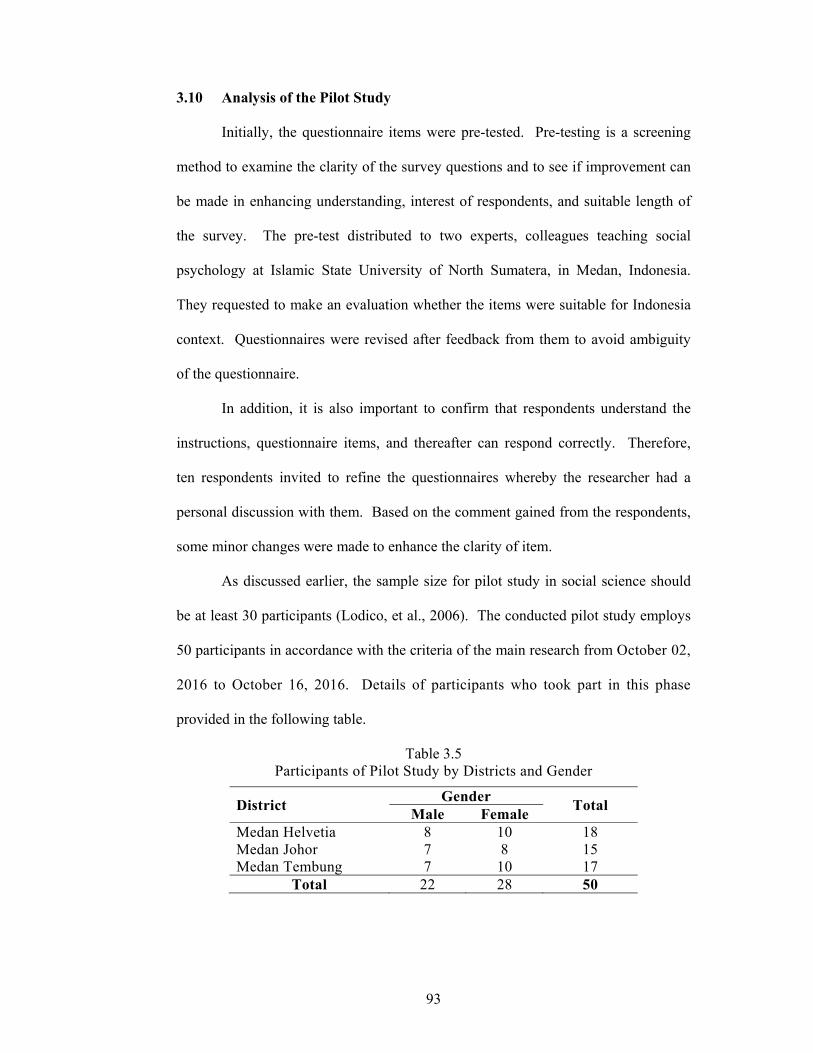
93
3.10 Analysis of the Pilot Study
Initially, the questionnaire items were pre-tested. Pre-testing is a screening
method to examine the clarity of the survey questions and to see if improvement can
be made in enhancing understanding, interest of respondents, and suitable length of
the survey. The pre-test distributed to two experts, colleagues teaching social
psychology at Islamic State University of North Sumatera, in Medan, Indonesia.
They requested to make an evaluation whether the items were suitable for Indonesia
context. Questionnaires were revised after feedback from them to avoid ambiguity
of the questionnaire.
In addition, it is also important to confirm that respondents understand the
instructions, questionnaire items, and thereafter can respond correctly. Therefore,
ten respondents invited to refine the questionnaires whereby the researcher had a
personal discussion with them. Based on the comment gained from the respondents,
some minor changes were made to enhance the clarity of item.
As discussed earlier, the sample size for pilot study in social science should
be at least 30 participants (Lodico, et al., 2006). The conducted pilot study employs
50 participants in accordance with the criteria of the main research from October 02,
2016 to October 16, 2016. Details of participants who took part in this phase
provided in the following table.
Table 3.5 Participants of Pilot Study by Districts and Gender
District Gender
Total Male Female
Medan Helvetia 8 10 18 Medan Johor 7 8 15 Medan Tembung 7 10 17
Total 22 28 50
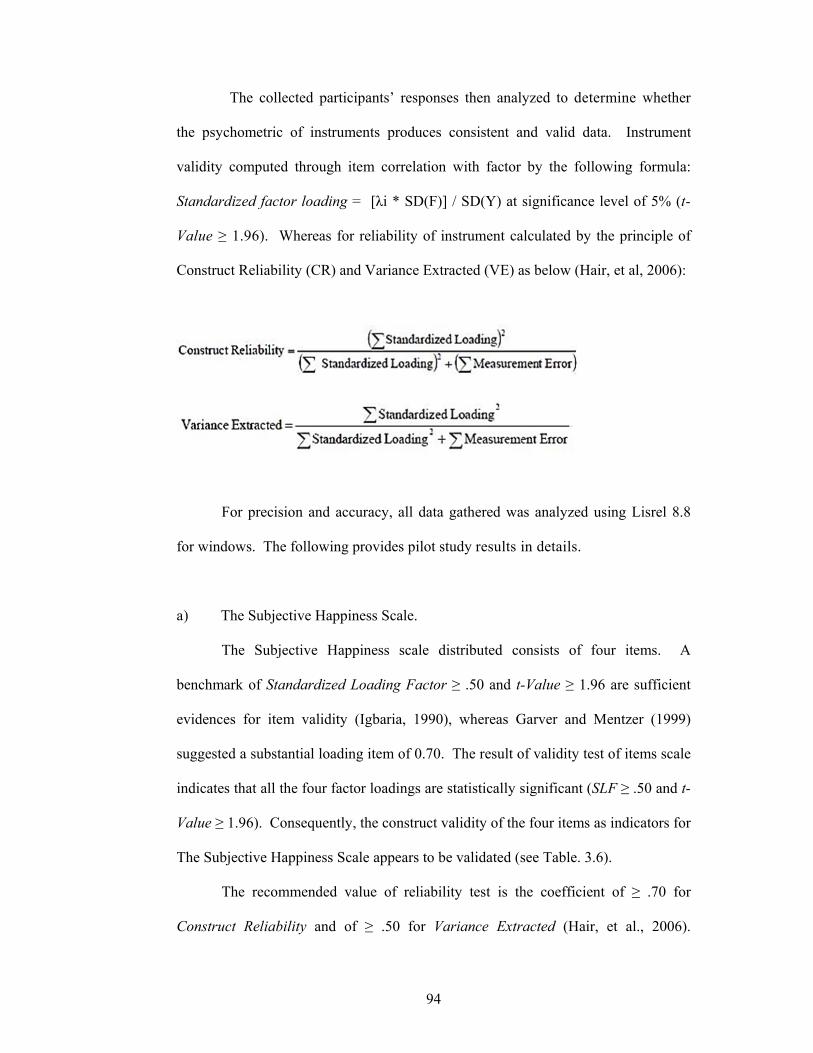
94
The collected participants’ responses then analyzed to determine whether
the psychometric of instruments produces consistent and valid data. Instrument
validity computed through item correlation with factor by the following formula:
Standardized factor loading = [λi * SD(F)] / SD(Y) at significance level of 5% (t-
Value ≥ 1.96). Whereas for reliability of instrument calculated by the principle of
Construct Reliability (CR) and Variance Extracted (VE) as below (Hair, et al, 2006):
For precision and accuracy, all data gathered was analyzed using Lisrel 8.8
for windows. The following provides pilot study results in details.
a) The Subjective Happiness Scale.
The Subjective Happiness scale distributed consists of four items. A
benchmark of Standardized Loading Factor ≥ .50 and t-Value ≥ 1.96 are sufficient
evidences for item validity (Igbaria, 1990), whereas Garver and Mentzer (1999)
suggested a substantial loading item of 0.70. The result of validity test of items scale
indicates that all the four factor loadings are statistically significant (SLF ≥ .50 and t-
Value ≥ 1.96). Consequently, the construct validity of the four items as indicators for
The Subjective Happiness Scale appears to be validated (see Table. 3.6).
The recommended value of reliability test is the coefficient of ≥ .70 for
Construct Reliability and of ≥ .50 for Variance Extracted (Hair, et al., 2006).
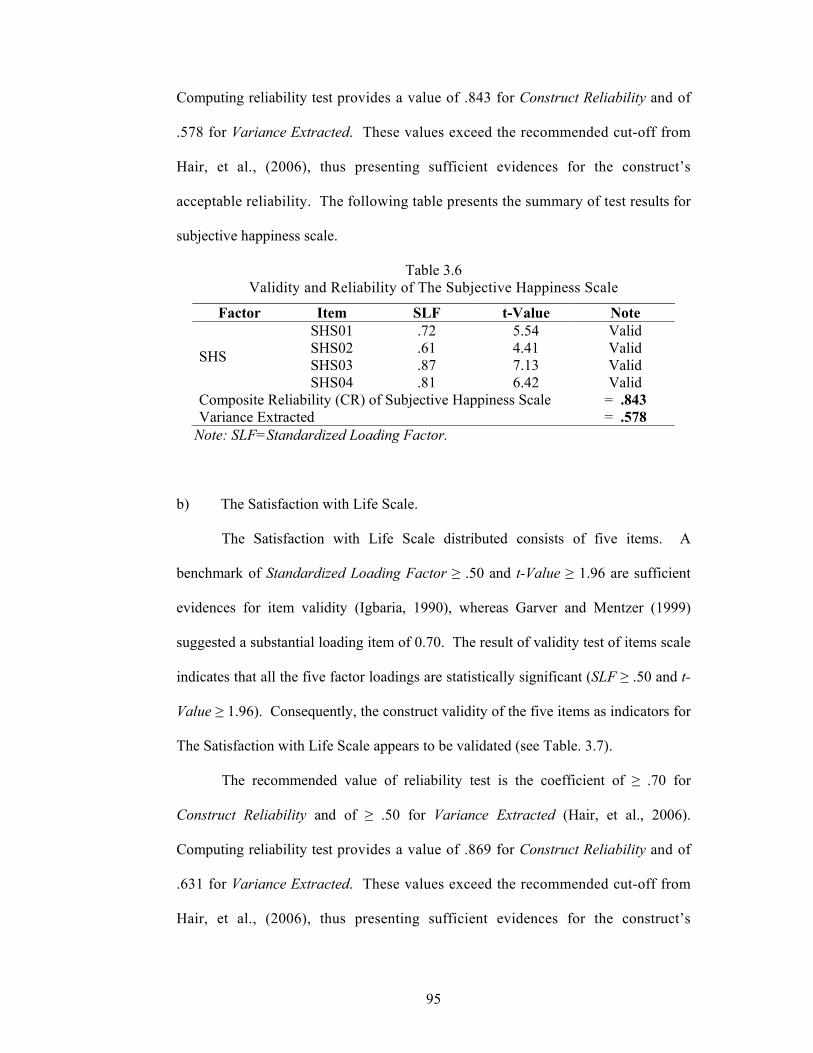
95
Computing reliability test provides a value of .843 for Construct Reliability and of
.578 for Variance Extracted. These values exceed the recommended cut-off from
Hair, et al., (2006), thus presenting sufficient evidences for the construct’s
acceptable reliability. The following table presents the summary of test results for
subjective happiness scale.
Table 3.6 Validity and Reliability of The Subjective Happiness Scale
Factor Item SLF t-Value Note
SHS
SHS01 .72 5.54 Valid SHS02 .61 4.41 Valid SHS03 .87 7.13 Valid SHS04 .81 6.42 Valid
Composite Reliability (CR) of Subjective Happiness Scale = .843 Variance Extracted = .578
Note: SLF=Standardized Loading Factor.
b) The Satisfaction with Life Scale.
The Satisfaction with Life Scale distributed consists of five items. A
benchmark of Standardized Loading Factor ≥ .50 and t-Value ≥ 1.96 are sufficient
evidences for item validity (Igbaria, 1990), whereas Garver and Mentzer (1999)
suggested a substantial loading item of 0.70. The result of validity test of items scale
indicates that all the five factor loadings are statistically significant (SLF ≥ .50 and t-
Value ≥ 1.96). Consequently, the construct validity of the five items as indicators for
The Satisfaction with Life Scale appears to be validated (see Table. 3.7).
The recommended value of reliability test is the coefficient of ≥ .70 for
Construct Reliability and of ≥ .50 for Variance Extracted (Hair, et al., 2006).
Computing reliability test provides a value of .869 for Construct Reliability and of
.631 for Variance Extracted. These values exceed the recommended cut-off from
Hair, et al., (2006), thus presenting sufficient evidences for the construct’s
96
acceptable reliability. The following table presents the summary of test results for
satisfaction with life scale.
Table 3.7 Validity and Reliability of The Satisfaction With Life Scale
Factor Item SLF t-Value Note
SWLS
SWLS01 .81 6.63 Valid SWLS02 .83 6.82 Valid SWLS03 .74 5.85 Valid SWLS04 .78 6.30 Valid SWLS05 .81 6.64 Valid
Composite Reliability (CR) of Satisfaction With Life Scale = .869 Variance Extracted = .631 Note: SLF=Standardized Loading Factor
c) The Centrality of Religiosity Scale.
The Centrality of Religiosity Scale distributed consists of fifteen items. A
benchmark of Standardized Loading Factor ≥ .50 and t-Value ≥ 1.96 are sufficient
evidences for item validity (Igbaria, 1990), whereas Garver and Mentzer (1999)
suggested a substantial loading item of 0.70. The result of validity test of items scale
indicates that all the fifteen factor loadings are statistically significant (SLF ≥ .50 and
t-Value ≥ 1.96). Consequently, the construct validity of the fifteen items as
indicators for The Centrality of Religiosity Scale appears to be validated (see Table.
3.8).
The recommended value of reliability test is the coefficient of ≥ .70 for
Construct Reliability and of ≥ .50 for Variance Extracted (Hair, et al., 2006).
Computing reliability test provides a value of .818 for Construct Reliability and of
.472 for Variance Extracted. These values exceed the recommended cut-off from
Hair, et al., (2006), thus presenting sufficient evidences for the construct’s
acceptable reliability. The following table presents the summary of test results for
the centrality of religiosity scale.
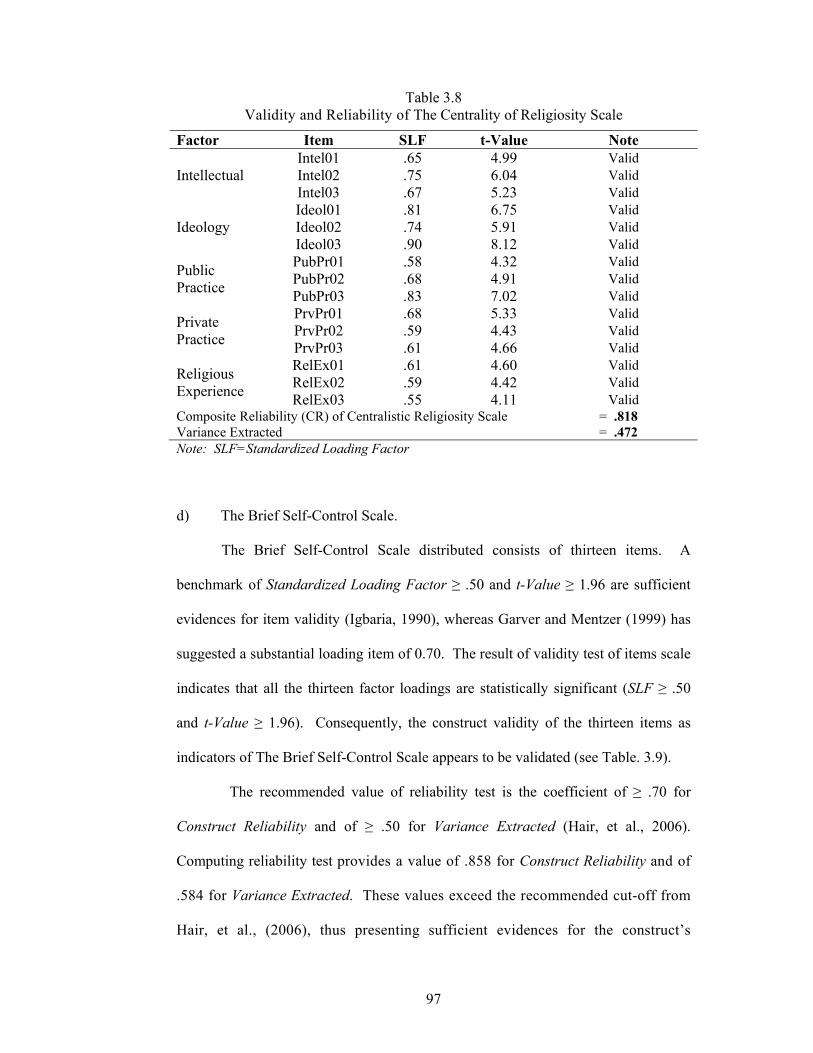
97
Table 3.8 Validity and Reliability of The Centrality of Religiosity Scale
Factor Item SLF t-Value Note
Intellectual Intel01 .65 4.99 Valid Intel02 .75 6.04 Valid Intel03 .67 5.23 Valid
Ideology Ideol01 .81 6.75 Valid Ideol02 .74 5.91 Valid Ideol03 .90 8.12 Valid
Public Practice
PubPr01 .58 4.32 Valid PubPr02 .68 4.91 Valid PubPr03 .83 7.02 Valid
Private Practice
PrvPr01 .68 5.33 Valid PrvPr02 .59 4.43 Valid PrvPr03 .61 4.66 Valid
Religious Experience
RelEx01 .61 4.60 Valid RelEx02 .59 4.42 Valid RelEx03 .55 4.11 Valid
Composite Reliability (CR) of Centralistic Religiosity Scale = .818 Variance Extracted = .472 Note: SLF=Standardized Loading Factor
d) The Brief Self-Control Scale.
The Brief Self-Control Scale distributed consists of thirteen items. A
benchmark of Standardized Loading Factor ≥ .50 and t-Value ≥ 1.96 are sufficient
evidences for item validity (Igbaria, 1990), whereas Garver and Mentzer (1999) has
suggested a substantial loading item of 0.70. The result of validity test of items scale
indicates that all the thirteen factor loadings are statistically significant (SLF ≥ .50
and t-Value ≥ 1.96). Consequently, the construct validity of the thirteen items as
indicators of The Brief Self-Control Scale appears to be validated (see Table. 3.9).
The recommended value of reliability test is the coefficient of ≥ .70 for
Construct Reliability and of ≥ .50 for Variance Extracted (Hair, et al., 2006).
Computing reliability test provides a value of .858 for Construct Reliability and of
.584 for Variance Extracted. These values exceed the recommended cut-off from
Hair, et al., (2006), thus presenting sufficient evidences for the construct’s
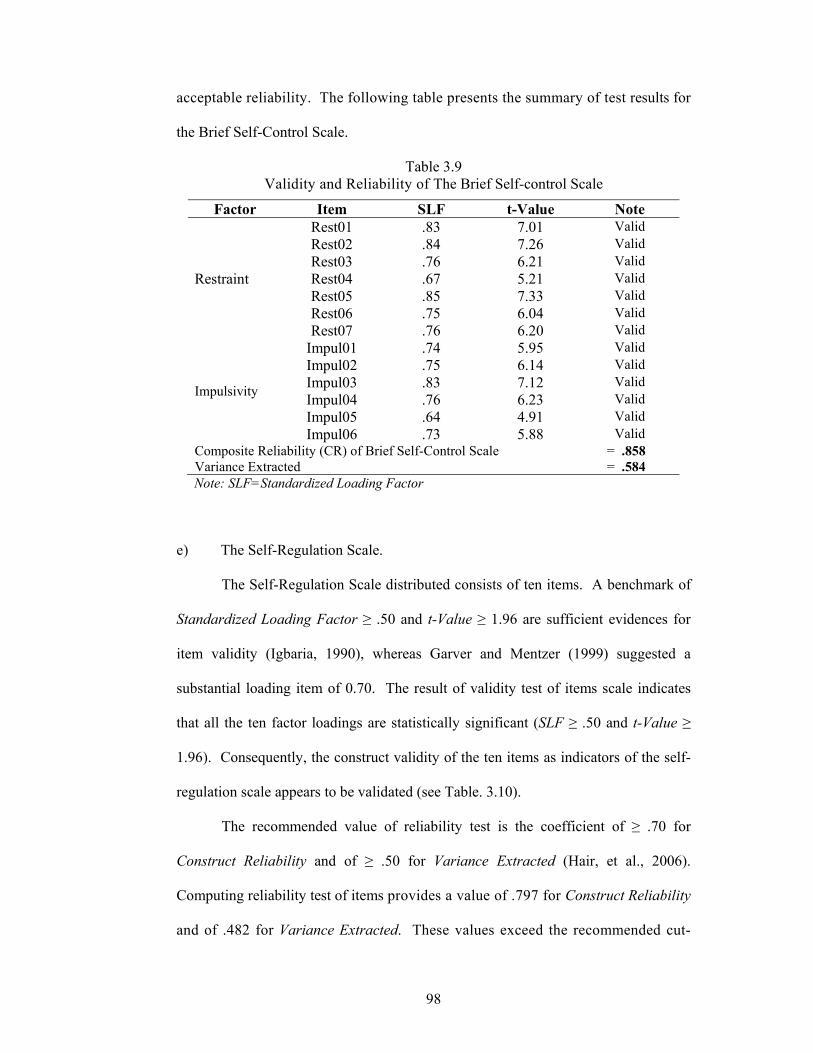
98
acceptable reliability. The following table presents the summary of test results for
the Brief Self-Control Scale.
Table 3.9 Validity and Reliability of The Brief Self-control Scale
Factor Item SLF t-Value Note
Restraint
Rest01 .83 7.01 Valid Rest02 .84 7.26 Valid Rest03 .76 6.21 Valid Rest04 .67 5.21 Valid Rest05 .85 7.33 Valid Rest06 .75 6.04 Valid Rest07 .76 6.20 Valid
Impulsivity
Impul01 .74 5.95 Valid Impul02 .75 6.14 Valid Impul03 .83 7.12 Valid Impul04 .76 6.23 Valid Impul05 .64 4.91 Valid Impul06 .73 5.88 Valid
Composite Reliability (CR) of Brief Self-Control Scale = .858 Variance Extracted = .584 Note: SLF=Standardized Loading Factor
e) The Self-Regulation Scale.
The Self-Regulation Scale distributed consists of ten items. A benchmark of
Standardized Loading Factor ≥ .50 and t-Value ≥ 1.96 are sufficient evidences for
item validity (Igbaria, 1990), whereas Garver and Mentzer (1999) suggested a
substantial loading item of 0.70. The result of validity test of items scale indicates
that all the ten factor loadings are statistically significant (SLF ≥ .50 and t-Value ≥
1.96). Consequently, the construct validity of the ten items as indicators of the self-
regulation scale appears to be validated (see Table. 3.10).
The recommended value of reliability test is the coefficient of ≥ .70 for
Construct Reliability and of ≥ .50 for Variance Extracted (Hair, et al., 2006).
Computing reliability test of items provides a value of .797 for Construct Reliability
and of .482 for Variance Extracted. These values exceed the recommended cut-
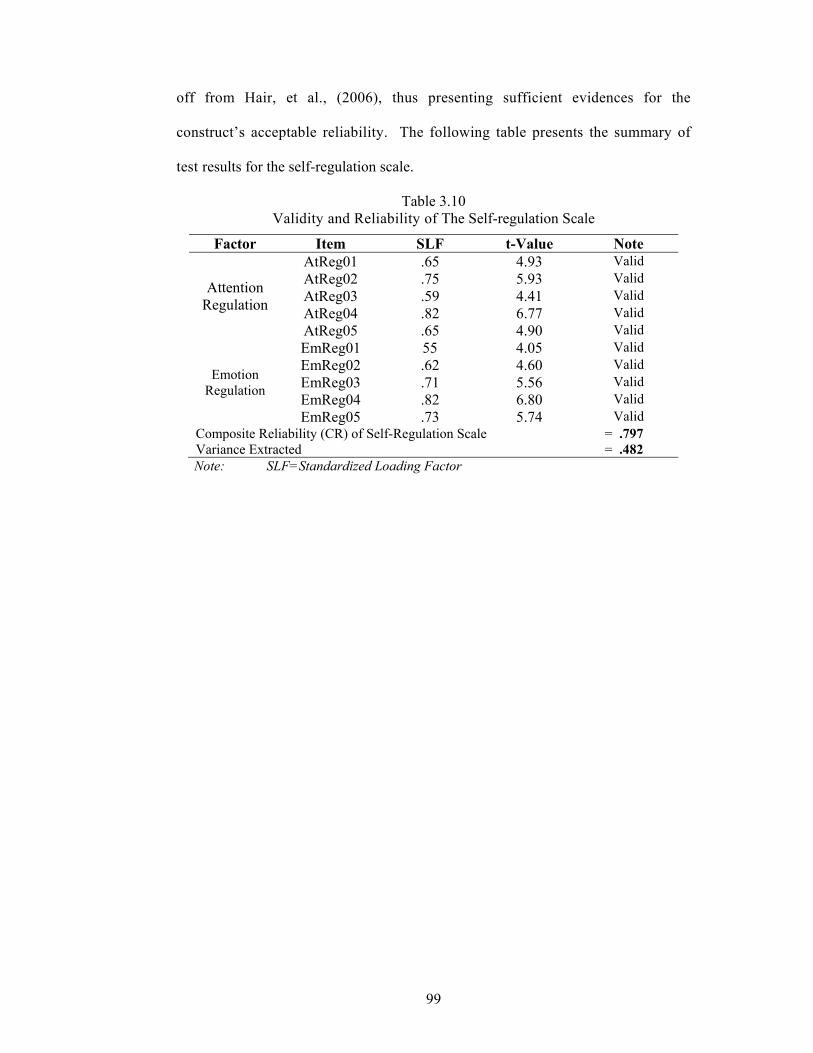
99
off from Hair, et al., (2006), thus presenting sufficient evidences for the
construct’s acceptable reliability. The following table presents the summary of
test results for the self-regulation scale.
Table 3.10 Validity and Reliability of The Self-regulation Scale
Factor Item SLF t-Value Note
Attention Regulation
AtReg01 .65 4.93 Valid AtReg02 .75 5.93 Valid AtReg03 .59 4.41 Valid AtReg04 .82 6.77 Valid AtReg05 .65 4.90 Valid
Emotion Regulation
EmReg01 55 4.05 Valid EmReg02 .62 4.60 Valid EmReg03 .71 5.56 Valid EmReg04 .82 6.80 Valid EmReg05 .73 5.74 Valid
Composite Reliability (CR) of Self-Regulation Scale = .797 Variance Extracted = .482 Note: SLF=Standardized Loading Factor
100
CHAPTER 4
RESULTS
4.1 Preparation of the analysis
Data analysis process used in this study comprised of testing two sub-models.
It began with analysis of the measurement model, and then proceeded to the
structural model. For the measurement model, each latent variable was measured by
its indicators; while the structural model, which characterized the relationship
between exogenous and endogenous variables, exhibited the path and statistical
significance of each relationship, and illustrated the amount of variance in the
endogenous variables that can be explained by the respective proposed determinants.
According to Anderson and Gerbing (1988), the two components (measurement and
structural model) have high complexity that they should be analyzed separately to
attain better outcomes. On this basis, this study employs the two-step approach
recommended by Anderson and Gerbing.
Analysis of the measurement model conducted was Confirmatory Factor
Analysis (CFA) to estimate dimensionality, validity, and reliability of each variable
of the study. Analysis then proceeds to the structural model to confirm assessment of
nomological validity. The two analyses employed LISREL 8.80 software and works
based on structural equation modeling rules.
Prior to data analyzed, participant’s responses were reviewed to look for
unanswered scale items. Because the study has a relatively large sample size, List-
wise Deletion was employed as the selected approach. The responses of participant
who left one or more of the scale items unanswered were removed from the data set.
101
In addition, reverse coded items of participant’s responses were reviewed and
recoded.
With respect to type of matrix used, this study prefers to adopt covariance
matrix instead of correlation matrix for several reasons. First, using a covariance
matrix allows for examination of a proposed theoretical framework (Hair, et al.,
2006). Second, a covariance matrix provides standardized solutions; as well, a
correlation matric (Bentler, et al., 2001). Lastly, using a correlation matrix leads to
the chi-square test and standard errors (Bentler, et al., 2001).
This study used the total disaggregation approach to analyze the measurement
model. In this sense, the creation of summated scores of item was built as a
weighted of its components. Further, the partial aggregation approach is considered
appropriate to test the structural model, namely by combining subsets of items into
composites and then treating them as indicators of the constructs. In consistent with
the option for the partial aggregation, the creation of score summarized of component
was built as a weighted for each of its latent.
Maximum likelihood (ML) was the selected estimation technique adopted in
this study. This estimation method is the default of LISREL and more widely used.
However, due to non-consensus on the appropriate index to assess the overall
goodness-of-fit of a model (Ping, 2004), the following fit indices were chosen for the
analysis. They are: 1) chi-square goodness-of-fit test (χ2); 2) ratio of χ2 to degrees of
freedom (χ2/df); 3) root mean squared error of approximation (RMSEA); 4)
goodness-of-fit index (GFI); and 5) adjusted goodness-of-fit index (AGFI). These
indices are absolute fit indices, which assess the overall model-to-data fit for both
structural and measurement models (Bollen, 1989; Hair, et al., 2006). Another two
indices are comparative fit index (CFI); and non-normed fit index (NNFI). These
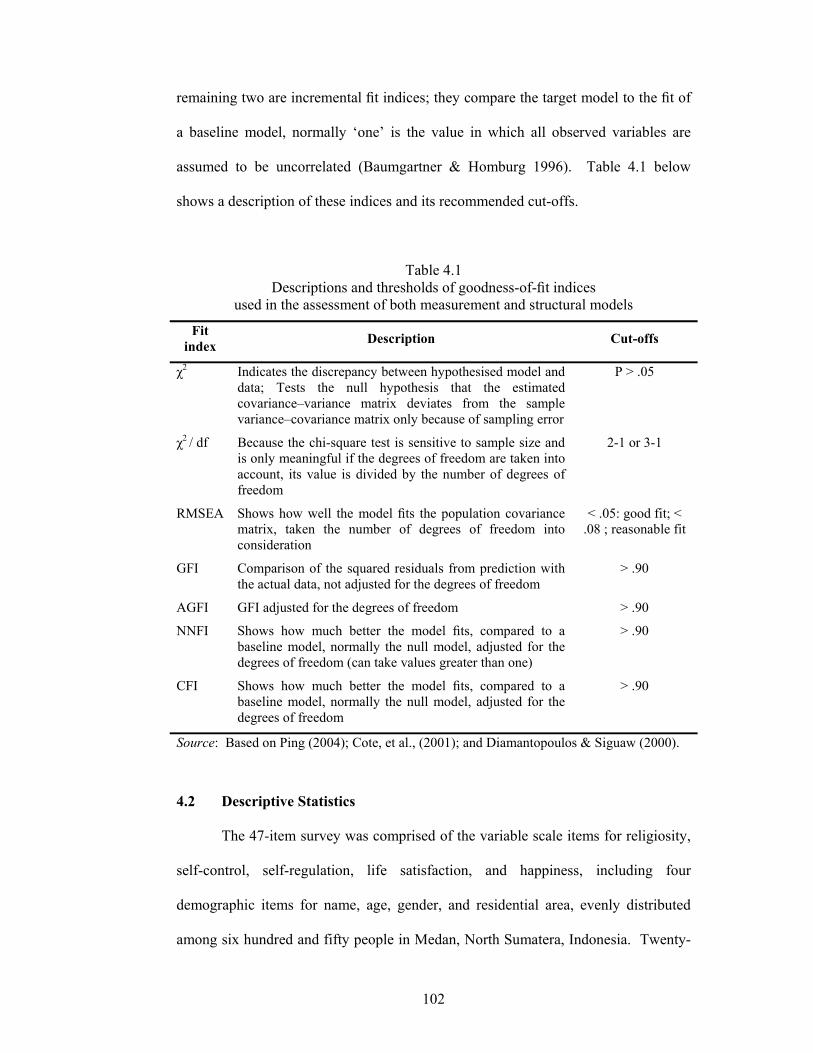
102
remaining two are incremental fit indices; they compare the target model to the fit of
a baseline model, normally ‘one’ is the value in which all observed variables are
assumed to be uncorrelated (Baumgartner & Homburg 1996). Table 4.1 below
shows a description of these indices and its recommended cut-offs.
Table 4.1 Descriptions and thresholds of goodness-of-fit indices
used in the assessment of both measurement and structural models
Fit index
Description Cut-offs
χ2 Indicates the discrepancy between hypothesised model and data; Tests the null hypothesis that the estimated covariance–variance matrix deviates from the sample variance–covariance matrix only because of sampling error
P > .05
χ2 / df Because the chi-square test is sensitive to sample size and is only meaningful if the degrees of freedom are taken into account, its value is divided by the number of degrees of freedom
2-1 or 3-1
RMSEA Shows how well the model fits the population covariance matrix, taken the number of degrees of freedom into consideration
< .05: good fit; < .08 ; reasonable fit
GFI Comparison of the squared residuals from prediction with the actual data, not adjusted for the degrees of freedom
> .90
AGFI GFI adjusted for the degrees of freedom > .90
NNFI Shows how much better the model fits, compared to a baseline model, normally the null model, adjusted for the degrees of freedom (can take values greater than one)
> .90
CFI Shows how much better the model fits, compared to a baseline model, normally the null model, adjusted for the degrees of freedom
> .90
Source: Based on Ping (2004); Cote, et al., (2001); and Diamantopoulos & Siguaw (2000).
4.2 Descriptive Statistics
The 47-item survey was comprised of the variable scale items for religiosity,
self-control, self-regulation, life satisfaction, and happiness, including four
demographic items for name, age, gender, and residential area, evenly distributed
among six hundred and fifty people in Medan, North Sumatera, Indonesia. Twenty-
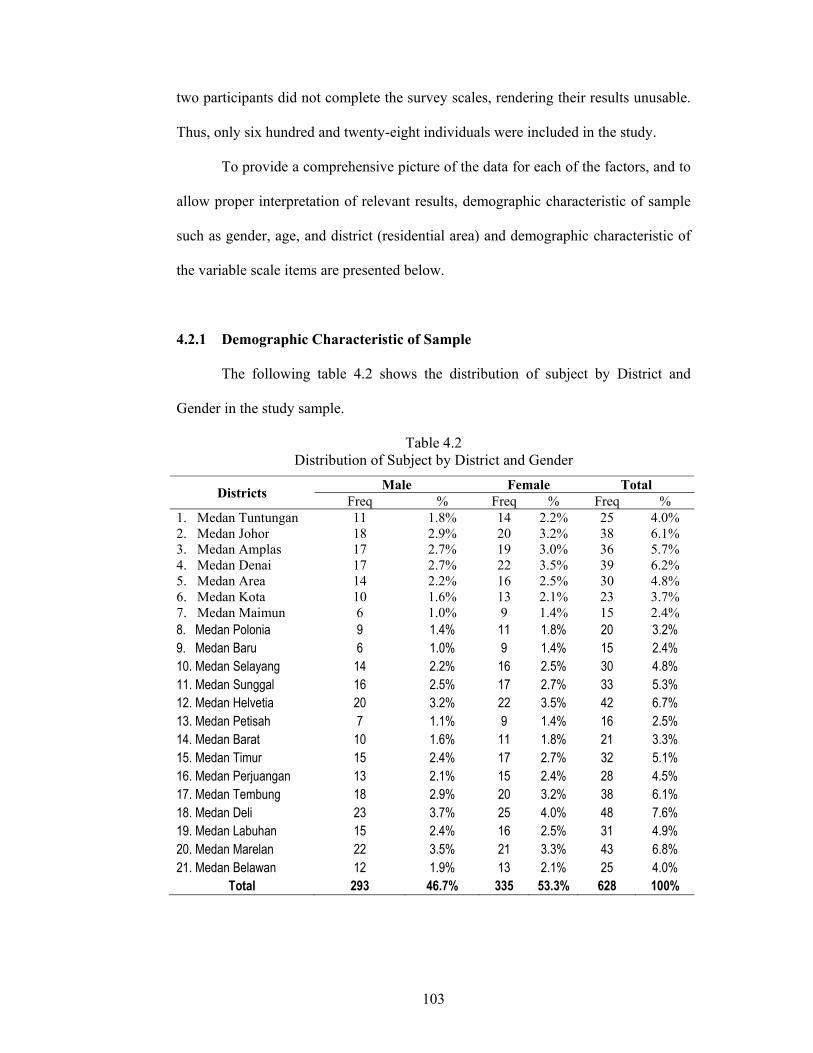
103
two participants did not complete the survey scales, rendering their results unusable.
Thus, only six hundred and twenty-eight individuals were included in the study.
To provide a comprehensive picture of the data for each of the factors, and to
allow proper interpretation of relevant results, demographic characteristic of sample
such as gender, age, and district (residential area) and demographic characteristic of
the variable scale items are presented below.
4.2.1 Demographic Characteristic of Sample
The following table 4.2 shows the distribution of subject by District and
Gender in the study sample.
Table 4.2 Distribution of Subject by District and Gender
Districts Male Female Total
Freq % Freq % Freq % 1. Medan Tuntungan 11 1.8% 14 2.2% 25 4.0% 2. Medan Johor 18 2.9% 20 3.2% 38 6.1% 3. Medan Amplas 17 2.7% 19 3.0% 36 5.7% 4. Medan Denai 17 2.7% 22 3.5% 39 6.2% 5. Medan Area 14 2.2% 16 2.5% 30 4.8% 6. Medan Kota 10 1.6% 13 2.1% 23 3.7% 7. Medan Maimun 6 1.0% 9 1.4% 15 2.4% 8. Medan Polonia 9 1.4% 11 1.8% 20 3.2% 9. Medan Baru 6 1.0% 9 1.4% 15 2.4% 10. Medan Selayang 14 2.2% 16 2.5% 30 4.8% 11. Medan Sunggal 16 2.5% 17 2.7% 33 5.3% 12. Medan Helvetia 20 3.2% 22 3.5% 42 6.7% 13. Medan Petisah 7 1.1% 9 1.4% 16 2.5% 14. Medan Barat 10 1.6% 11 1.8% 21 3.3% 15. Medan Timur 15 2.4% 17 2.7% 32 5.1% 16. Medan Perjuangan 13 2.1% 15 2.4% 28 4.5% 17. Medan Tembung 18 2.9% 20 3.2% 38 6.1% 18. Medan Deli 23 3.7% 25 4.0% 48 7.6% 19. Medan Labuhan 15 2.4% 16 2.5% 31 4.9% 20. Medan Marelan 22 3.5% 21 3.3% 43 6.8% 21. Medan Belawan 12 1.9% 13 2.1% 25 4.0%
Total 293 46.7% 335 53.3% 628 100%
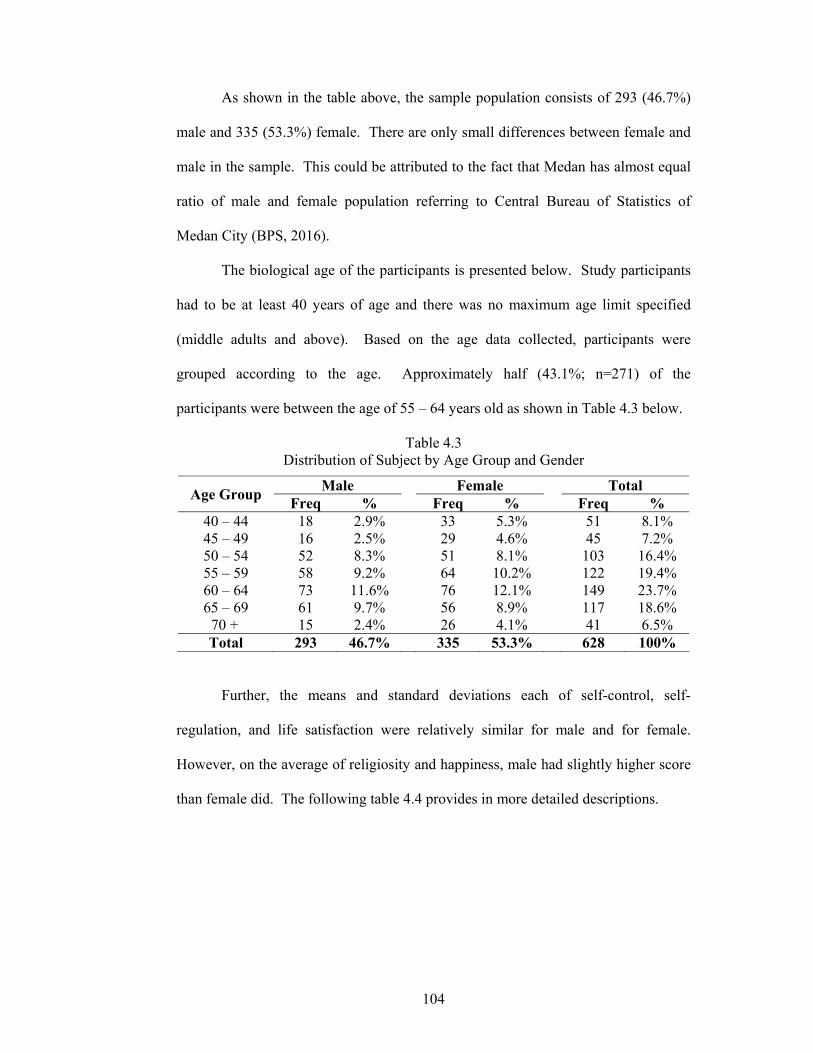
104
As shown in the table above, the sample population consists of 293 (46.7%)
male and 335 (53.3%) female. There are only small differences between female and
male in the sample. This could be attributed to the fact that Medan has almost equal
ratio of male and female population referring to Central Bureau of Statistics of
Medan City (BPS, 2016).
The biological age of the participants is presented below. Study participants
had to be at least 40 years of age and there was no maximum age limit specified
(middle adults and above). Based on the age data collected, participants were
grouped according to the age. Approximately half (43.1%; n=271) of the
participants were between the age of 55 – 64 years old as shown in Table 4.3 below.
Table 4.3 Distribution of Subject by Age Group and Gender
Age Group Male Female Total
Freq % Freq % Freq % 40 – 44 18 2.9% 33 5.3% 51 8.1% 45 – 49 16 2.5% 29 4.6% 45 7.2% 50 – 54 52 8.3% 51 8.1% 103 16.4% 55 – 59 58 9.2% 64 10.2% 122 19.4% 60 – 64 73 11.6% 76 12.1% 149 23.7% 65 – 69 61 9.7% 56 8.9% 117 18.6%
70 + 15 2.4% 26 4.1% 41 6.5% Total 293 46.7% 335 53.3% 628 100%
Further, the means and standard deviations each of self-control, self-
regulation, and life satisfaction were relatively similar for male and for female.
However, on the average of religiosity and happiness, male had slightly higher score
than female did. The following table 4.4 provides in more detailed descriptions.
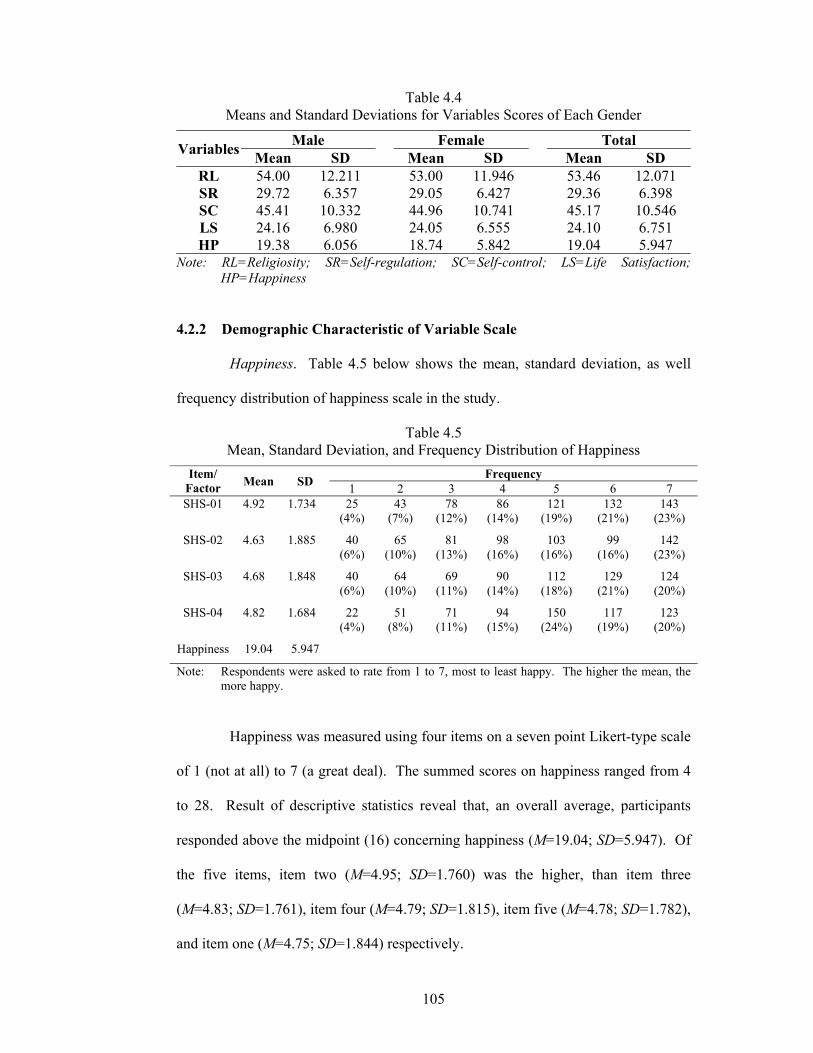
105
Table 4.4 Means and Standard Deviations for Variables Scores of Each Gender
Variables Male Female Total
Mean SD Mean SD Mean SD RL 54.00 12.211 53.00 11.946 53.46 12.071 SR 29.72 6.357 29.05 6.427 29.36 6.398 SC 45.41 10.332 44.96 10.741 45.17 10.546 LS 24.16 6.980 24.05 6.555 24.10 6.751 HP 19.38 6.056 18.74 5.842 19.04 5.947
Note: RL=Religiosity; SR=Self-regulation; SC=Self-control; LS=Life Satisfaction; HP=Happiness
4.2.2 Demographic Characteristic of Variable Scale
Happiness. Table 4.5 below shows the mean, standard deviation, as well
frequency distribution of happiness scale in the study.
Table 4.5 Mean, Standard Deviation, and Frequency Distribution of Happiness
Item/ Factor Mean SD
Frequency 1 2 3 4 5 6 7
SHS-01 4.92 1.734 25 (4%)
43 (7%)
78 (12%)
86 (14%)
121 (19%)
132 (21%)
143 (23%)
SHS-02 4.63 1.885 40 (6%)
65 (10%)
81 (13%)
98 (16%)
103 (16%)
99 (16%)
142 (23%)
SHS-03 4.68 1.848 40 (6%)
64 (10%)
69 (11%)
90 (14%)
112 (18%)
129 (21%)
124 (20%)
SHS-04 4.82 1.684 22 (4%)
51 (8%)
71 (11%)
94 (15%)
150 (24%)
117 (19%)
123 (20%)
Happiness 19.04 5.947
Note: Respondents were asked to rate from 1 to 7, most to least happy. The higher the mean, the more happy.
Happiness was measured using four items on a seven point Likert-type scale
of 1 (not at all) to 7 (a great deal). The summed scores on happiness ranged from 4
to 28. Result of descriptive statistics reveal that, an overall average, participants
responded above the midpoint (16) concerning happiness (M=19.04; SD=5.947). Of
the five items, item two (M=4.95; SD=1.760) was the higher, than item three
(M=4.83; SD=1.761), item four (M=4.79; SD=1.815), item five (M=4.78; SD=1.782),
and item one (M=4.75; SD=1.844) respectively.
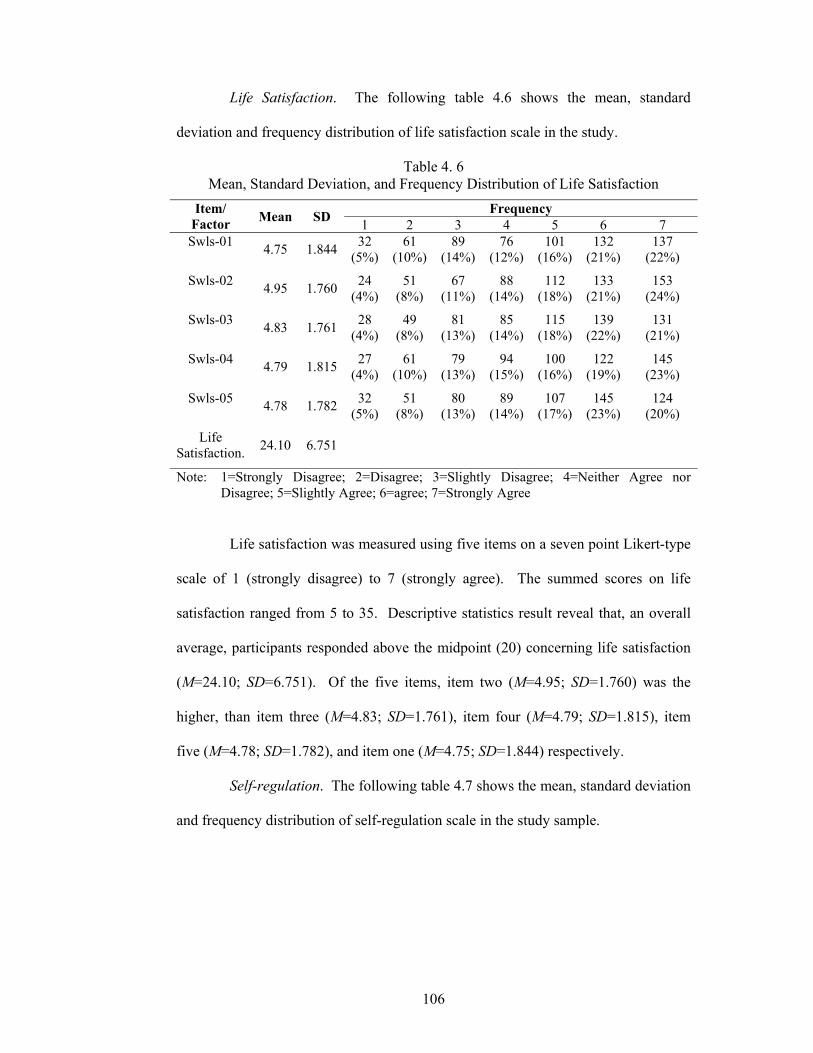
106
Life Satisfaction. The following table 4.6 shows the mean, standard
deviation and frequency distribution of life satisfaction scale in the study.
Table 4. 6 Mean, Standard Deviation, and Frequency Distribution of Life Satisfaction
Item/ Factor
Mean SD Frequency
1 2 3 4 5 6 7 Swls-01
4.75 1.844 32
(5%) 61
(10%) 89
(14%) 76
(12%) 101
(16%) 132
(21%) 137
(22%)
Swls-02 4.95 1.760
24 (4%)
51 (8%)
67 (11%)
88 (14%)
112 (18%)
133 (21%)
153 (24%)
Swls-03 4.83 1.761
28 (4%)
49 (8%)
81 (13%)
85 (14%)
115 (18%)
139 (22%)
131 (21%)
Swls-04 4.79 1.815
27 (4%)
61 (10%)
79 (13%)
94 (15%)
100 (16%)
122 (19%)
145 (23%)
Swls-05 4.78 1.782
32 (5%)
51 (8%)
80 (13%)
89 (14%)
107 (17%)
145 (23%)
124 (20%)
Life Satisfaction.
24.10 6.751
Note: 1=Strongly Disagree; 2=Disagree; 3=Slightly Disagree; 4=Neither Agree nor Disagree; 5=Slightly Agree; 6=agree; 7=Strongly Agree
Life satisfaction was measured using five items on a seven point Likert-type
scale of 1 (strongly disagree) to 7 (strongly agree). The summed scores on life
satisfaction ranged from 5 to 35. Descriptive statistics result reveal that, an overall
average, participants responded above the midpoint (20) concerning life satisfaction
(M=24.10; SD=6.751). Of the five items, item two (M=4.95; SD=1.760) was the
higher, than item three (M=4.83; SD=1.761), item four (M=4.79; SD=1.815), item
five (M=4.78; SD=1.782), and item one (M=4.75; SD=1.844) respectively.
Self-regulation. The following table 4.7 shows the mean, standard deviation
and frequency distribution of self-regulation scale in the study sample.
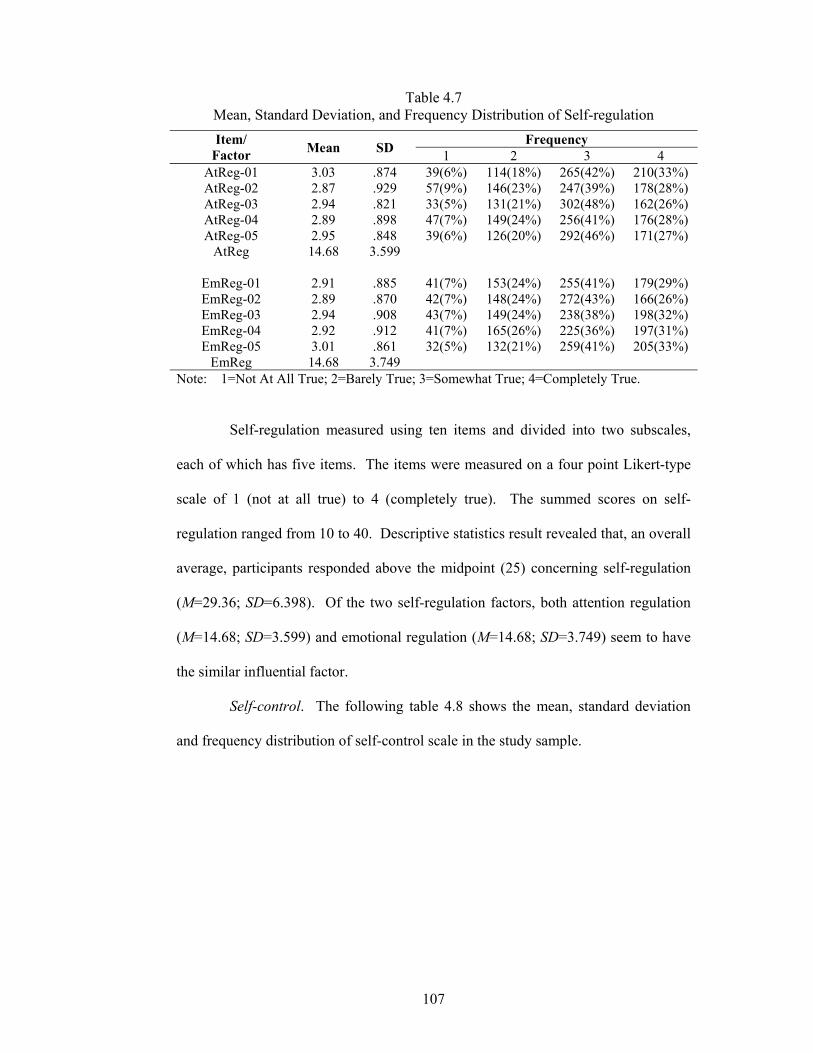
107
Table 4.7 Mean, Standard Deviation, and Frequency Distribution of Self-regulation
Item/ Factor Mean SD
Frequency 1 2 3 4
AtReg-01 3.03 .874 39(6%) 114(18%) 265(42%) 210(33%) AtReg-02 2.87 .929 57(9%) 146(23%) 247(39%) 178(28%) AtReg-03 2.94 .821 33(5%) 131(21%) 302(48%) 162(26%) AtReg-04 2.89 .898 47(7%) 149(24%) 256(41%) 176(28%) AtReg-05 2.95 .848 39(6%) 126(20%) 292(46%) 171(27%)
AtReg 14.68 3.599
EmReg-01 2.91 .885 41(7%) 153(24%) 255(41%) 179(29%) EmReg-02 2.89 .870 42(7%) 148(24%) 272(43%) 166(26%) EmReg-03 2.94 .908 43(7%) 149(24%) 238(38%) 198(32%) EmReg-04 2.92 .912 41(7%) 165(26%) 225(36%) 197(31%) EmReg-05 3.01 .861 32(5%) 132(21%) 259(41%) 205(33%)
EmReg 14.68 3.749 Note: 1=Not At All True; 2=Barely True; 3=Somewhat True; 4=Completely True.
Self-regulation measured using ten items and divided into two subscales,
each of which has five items. The items were measured on a four point Likert-type
scale of 1 (not at all true) to 4 (completely true). The summed scores on self-
regulation ranged from 10 to 40. Descriptive statistics result revealed that, an overall
average, participants responded above the midpoint (25) concerning self-regulation
(M=29.36; SD=6.398). Of the two self-regulation factors, both attention regulation
(M=14.68; SD=3.599) and emotional regulation (M=14.68; SD=3.749) seem to have
the similar influential factor.
Self-control. The following table 4.8 shows the mean, standard deviation
and frequency distribution of self-control scale in the study sample.
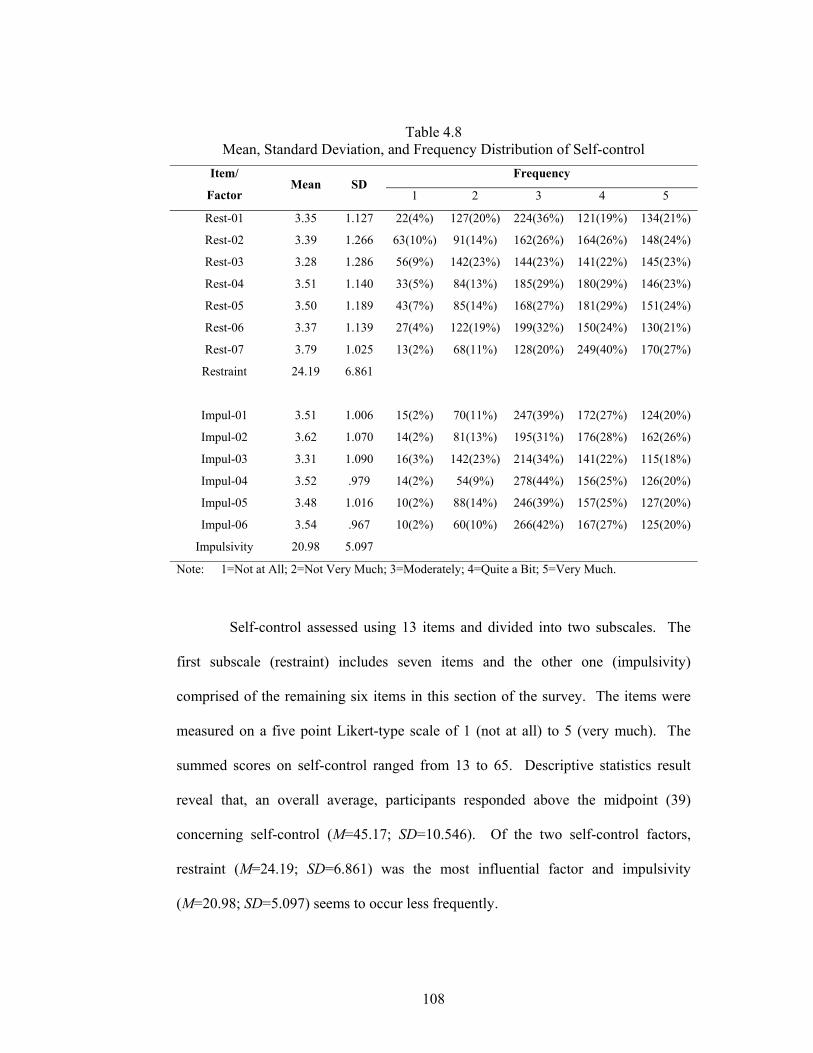
108
Table 4.8 Mean, Standard Deviation, and Frequency Distribution of Self-control
Item/
Factor Mean SD
Frequency
1 2 3 4 5
Rest-01 3.35 1.127 22(4%) 127(20%) 224(36%) 121(19%) 134(21%)
Rest-02 3.39 1.266 63(10%) 91(14%) 162(26%) 164(26%) 148(24%)
Rest-03 3.28 1.286 56(9%) 142(23%) 144(23%) 141(22%) 145(23%)
Rest-04 3.51 1.140 33(5%) 84(13%) 185(29%) 180(29%) 146(23%)
Rest-05 3.50 1.189 43(7%) 85(14%) 168(27%) 181(29%) 151(24%)
Rest-06 3.37 1.139 27(4%) 122(19%) 199(32%) 150(24%) 130(21%)
Rest-07 3.79 1.025 13(2%) 68(11%) 128(20%) 249(40%) 170(27%)
Restraint 24.19 6.861
Impul-01 3.51 1.006 15(2%) 70(11%) 247(39%) 172(27%) 124(20%)
Impul-02 3.62 1.070 14(2%) 81(13%) 195(31%) 176(28%) 162(26%)
Impul-03 3.31 1.090 16(3%) 142(23%) 214(34%) 141(22%) 115(18%)
Impul-04 3.52 .979 14(2%) 54(9%) 278(44%) 156(25%) 126(20%)
Impul-05 3.48 1.016 10(2%) 88(14%) 246(39%) 157(25%) 127(20%)
Impul-06 3.54 .967 10(2%) 60(10%) 266(42%) 167(27%) 125(20%)
Impulsivity 20.98 5.097
Note: 1=Not at All; 2=Not Very Much; 3=Moderately; 4=Quite a Bit; 5=Very Much.
Self-control assessed using 13 items and divided into two subscales. The
first subscale (restraint) includes seven items and the other one (impulsivity)
comprised of the remaining six items in this section of the survey. The items were
measured on a five point Likert-type scale of 1 (not at all) to 5 (very much). The
summed scores on self-control ranged from 13 to 65. Descriptive statistics result
reveal that, an overall average, participants responded above the midpoint (39)
concerning self-control (M=45.17; SD=10.546). Of the two self-control factors,
restraint (M=24.19; SD=6.861) was the most influential factor and impulsivity
(M=20.98; SD=5.097) seems to occur less frequently.
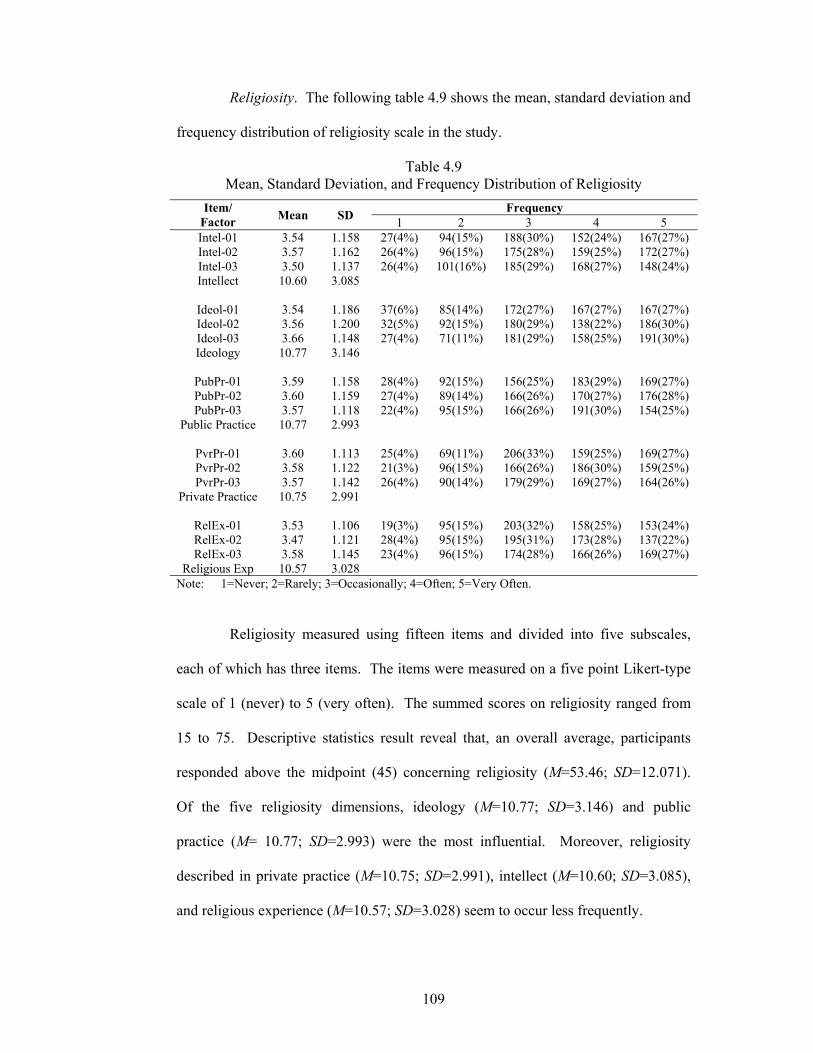
109
Religiosity. The following table 4.9 shows the mean, standard deviation and
frequency distribution of religiosity scale in the study.
Table 4.9 Mean, Standard Deviation, and Frequency Distribution of Religiosity
Item/ Factor
Mean SD Frequency
1 2 3 4 5 Intel-01 3.54 1.158 27(4%) 94(15%) 188(30%) 152(24%) 167(27%) Intel-02 3.57 1.162 26(4%) 96(15%) 175(28%) 159(25%) 172(27%) Intel-03 3.50 1.137 26(4%) 101(16%) 185(29%) 168(27%) 148(24%) Intellect 10.60 3.085
Ideol-01 3.54 1.186 37(6%) 85(14%) 172(27%) 167(27%) 167(27%) Ideol-02 3.56 1.200 32(5%) 92(15%) 180(29%) 138(22%) 186(30%) Ideol-03 3.66 1.148 27(4%) 71(11%) 181(29%) 158(25%) 191(30%) Ideology 10.77 3.146
PubPr-01 3.59 1.158 28(4%) 92(15%) 156(25%) 183(29%) 169(27%) PubPr-02 3.60 1.159 27(4%) 89(14%) 166(26%) 170(27%) 176(28%) PubPr-03 3.57 1.118 22(4%) 95(15%) 166(26%) 191(30%) 154(25%)
Public Practice 10.77 2.993
PvrPr-01 3.60 1.113 25(4%) 69(11%) 206(33%) 159(25%) 169(27%) PvrPr-02 3.58 1.122 21(3%) 96(15%) 166(26%) 186(30%) 159(25%) PvrPr-03 3.57 1.142 26(4%) 90(14%) 179(29%) 169(27%) 164(26%)
Private Practice 10.75 2.991
RelEx-01 3.53 1.106 19(3%) 95(15%) 203(32%) 158(25%) 153(24%) RelEx-02 3.47 1.121 28(4%) 95(15%) 195(31%) 173(28%) 137(22%) RelEx-03 3.58 1.145 23(4%) 96(15%) 174(28%) 166(26%) 169(27%)
Religious Exp 10.57 3.028 Note: 1=Never; 2=Rarely; 3=Occasionally; 4=Often; 5=Very Often.
Religiosity measured using fifteen items and divided into five subscales,
each of which has three items. The items were measured on a five point Likert-type
scale of 1 (never) to 5 (very often). The summed scores on religiosity ranged from
15 to 75. Descriptive statistics result reveal that, an overall average, participants
responded above the midpoint (45) concerning religiosity (M=53.46; SD=12.071).
Of the five religiosity dimensions, ideology (M=10.77; SD=3.146) and public
practice (M= 10.77; SD=2.993) were the most influential. Moreover, religiosity
described in private practice (M=10.75; SD=2.991), intellect (M=10.60; SD=3.085),
and religious experience (M=10.57; SD=3.028) seem to occur less frequently.
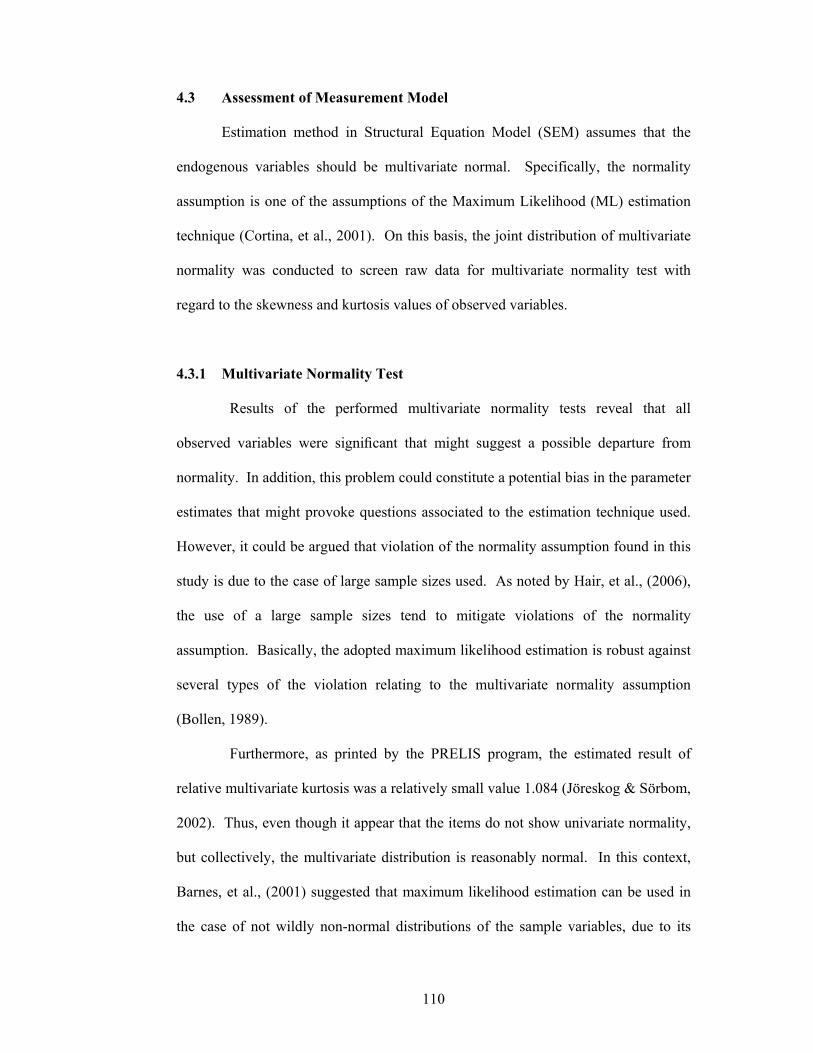
110
4.3 Assessment of Measurement Model
Estimation method in Structural Equation Model (SEM) assumes that the
endogenous variables should be multivariate normal. Specifically, the normality
assumption is one of the assumptions of the Maximum Likelihood (ML) estimation
technique (Cortina, et al., 2001). On this basis, the joint distribution of multivariate
normality was conducted to screen raw data for multivariate normality test with
regard to the skewness and kurtosis values of observed variables.
4.3.1 Multivariate Normality Test
Results of the performed multivariate normality tests reveal that all
observed variables were significant that might suggest a possible departure from
normality. In addition, this problem could constitute a potential bias in the parameter
estimates that might provoke questions associated to the estimation technique used.
However, it could be argued that violation of the normality assumption found in this
study is due to the case of large sample sizes used. As noted by Hair, et al., (2006),
the use of a large sample sizes tend to mitigate violations of the normality
assumption. Basically, the adopted maximum likelihood estimation is robust against
several types of the violation relating to the multivariate normality assumption
(Bollen, 1989).
Furthermore, as printed by the PRELIS program, the estimated result of
relative multivariate kurtosis was a relatively small value 1.084 (Jöreskog & Sörbom,
2002). Thus, even though it appear that the items do not show univariate normality,
but collectively, the multivariate distribution is reasonably normal. In this context,
Barnes, et al., (2001) suggested that maximum likelihood estimation can be used in
the case of not wildly non-normal distributions of the sample variables, due to its
111
results in most situations are probably reliable. In addition, the transformed
procedure could change the meaning of actual responses which leading to more
problems. The option was to follow these considerations, so that the non-normally
distributed variable was not transformed. Nevertheless, Sattora and Bentler, (1988)
argued that in case with some presence of non-normality, the Robust Maximum
Likelihood Method should be used to provide stable estimations and results should
be interpreted with caution.
4.3.2 Confirmatory Factor Analysis of Religiosity.
Dimensionality Test. The Centrality of religiosity Scale (CRS) employed to
measure about people religiosity. In line with previous approach (chapter 2), The
CRS consists of 15 items covering the five constructs corresponded to the five key
qualities of religiosity, i.e., intellectual, ideology, private practice, public practice,
and religious experience. Using this model, each key quality represents the latent
factor (the unobserved factor) and the items serve as the manifest variables (the
observed factors). The conceptual structure of the five-factor model and the items
presented in Figure 4.1 below:
112
Ideology (ɳ2)
Prv Prac (ɳ3)
Pub Prac ɳ4)
Rel Ex (ɳ5)
RL ξ
PrvPr01
PubPr01
RelEx01
PrvPr02
PrvPr03
PubPr02
PubPr03
RelEx02
RelEx03
Intellect (ɳ1)
Intel01 (Y1)
Intel02 (Y2)
Intel03 (Y3)
λ1
λ2
λ3
Ideol01 (Y4)
Ideol02 (Y5)
Ideol03 (Y6)
λ4
λ5
λ6
λ7
λ8
λ9
λ10
λ11
λ12
λ13
λ14
λ15
γ1
γ2
γ3
γ4
γ5
Figure 4.1. Second-Order SEM Model of CRS Note: Intel=Intellegence; Ideol=Ideology; PubPr=Public Practice; PrvPr=Private Practice; RelEx=Religious
Experience; RL=Religiosity
Based on the conceptual structure of religiosity mentioned in Figure 4.1
above, it was seemingly a second-order factor structure. Therefore,
unidimensionality is the main aim of the analysis; i.e., whether each of the first-order
factors or dimensions held unidimensionality, and whether the second-order factor
structure was supported. The estimated results are presented in following table 4.10:
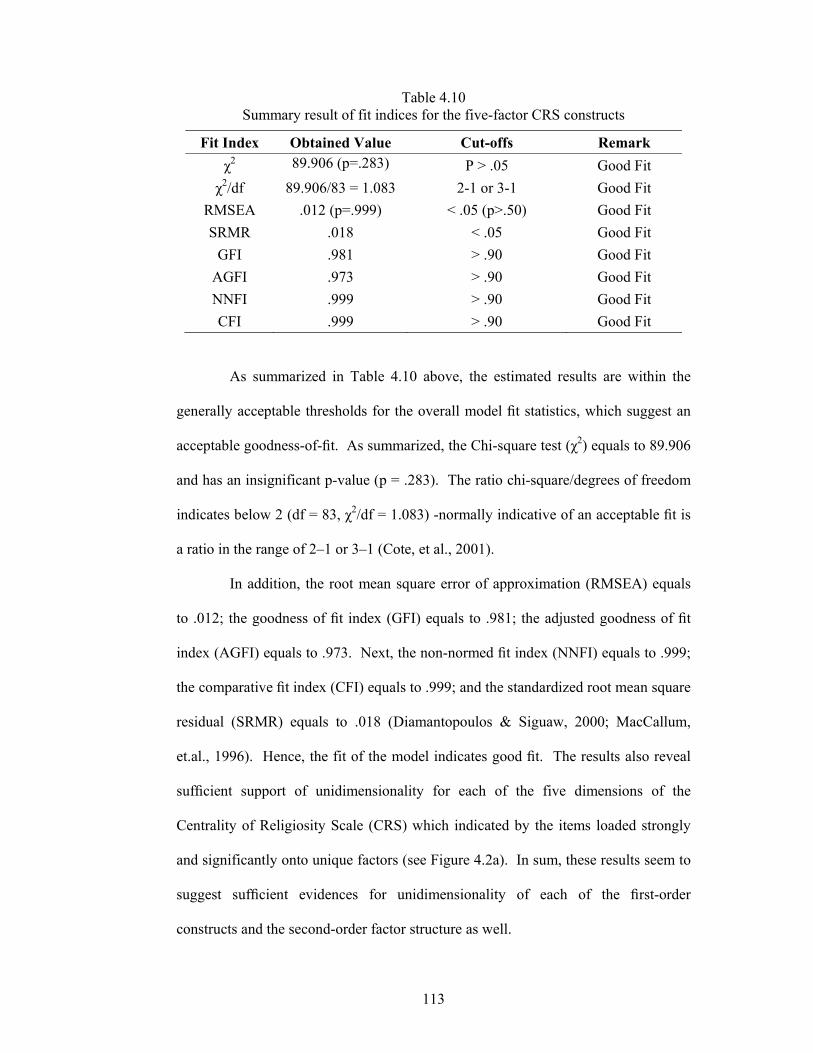
113
Table 4.10 Summary result of fit indices for the five-factor CRS constructs
Fit Index Obtained Value Cut-offs Remark
χ2 89.906 (p=.283) P > .05 Good Fit
χ2/df 89.906/83 = 1.083 2-1 or 3-1 Good Fit
RMSEA .012 (p=.999) < .05 (p>.50) Good Fit
SRMR .018 < .05 Good Fit
GFI .981 > .90 Good Fit
AGFI .973 > .90 Good Fit
NNFI .999 > .90 Good Fit
CFI .999 > .90 Good Fit
As summarized in Table 4.10 above, the estimated results are within the
generally acceptable thresholds for the overall model fit statistics, which suggest an
acceptable goodness-of-fit. As summarized, the Chi-square test (χ2) equals to 89.906
and has an insignificant p-value (p = .283). The ratio chi-square/degrees of freedom
indicates below 2 (df = 83, χ2/df = 1.083) -normally indicative of an acceptable fit is
a ratio in the range of 2–1 or 3–1 (Cote, et al., 2001).
In addition, the root mean square error of approximation (RMSEA) equals
to .012; the goodness of fit index (GFI) equals to .981; the adjusted goodness of fit
index (AGFI) equals to .973. Next, the non-normed fit index (NNFI) equals to .999;
the comparative fit index (CFI) equals to .999; and the standardized root mean square
residual (SRMR) equals to .018 (Diamantopoulos & Siguaw, 2000; MacCallum,
et.al., 1996). Hence, the fit of the model indicates good fit. The results also reveal
sufficient support of unidimensionality for each of the five dimensions of the
Centrality of Religiosity Scale (CRS) which indicated by the items loaded strongly
and significantly onto unique factors (see Figure 4.2a). In sum, these results seem to
suggest sufficient evidences for unidimensionality of each of the first-order
constructs and the second-order factor structure as well.
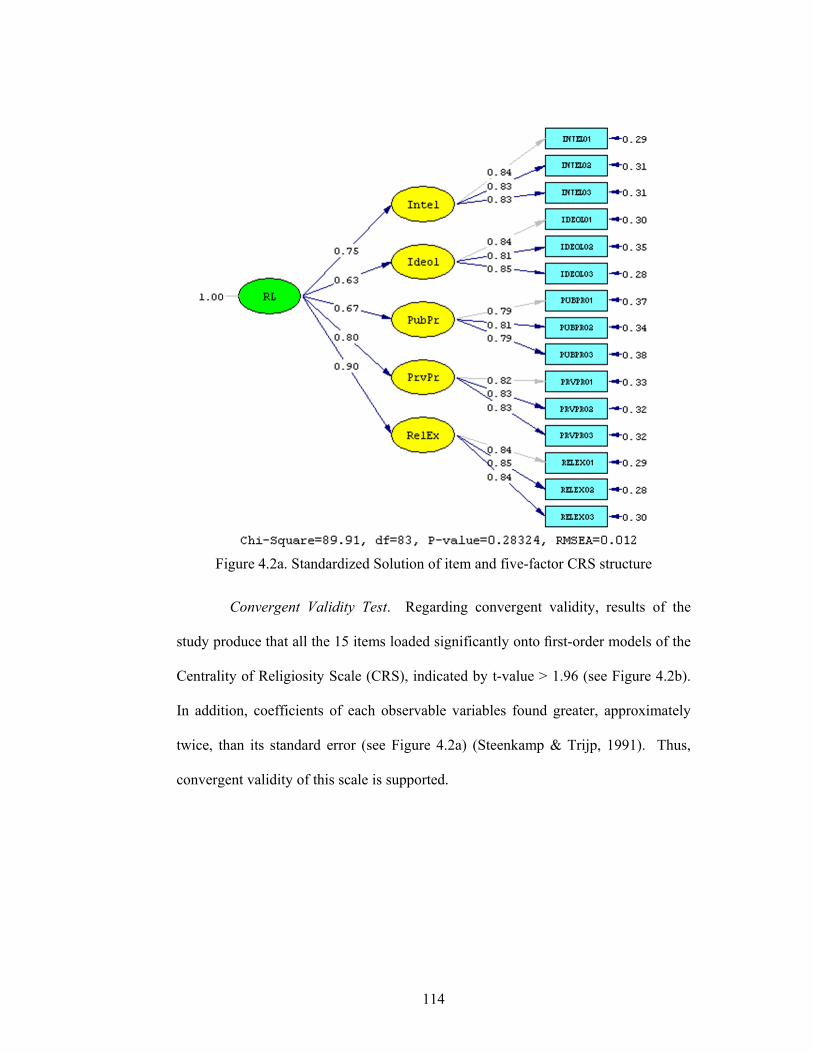
114
Figure 4.2a. Standardized Solution of item and five-factor CRS structure
Convergent Validity Test. Regarding convergent validity, results of the
study produce that all the 15 items loaded significantly onto first-order models of the
Centrality of Religiosity Scale (CRS), indicated by t-value > 1.96 (see Figure 4.2b).
In addition, coefficients of each observable variables found greater, approximately
twice, than its standard error (see Figure 4.2a) (Steenkamp & Trijp, 1991). Thus,
convergent validity of this scale is supported.
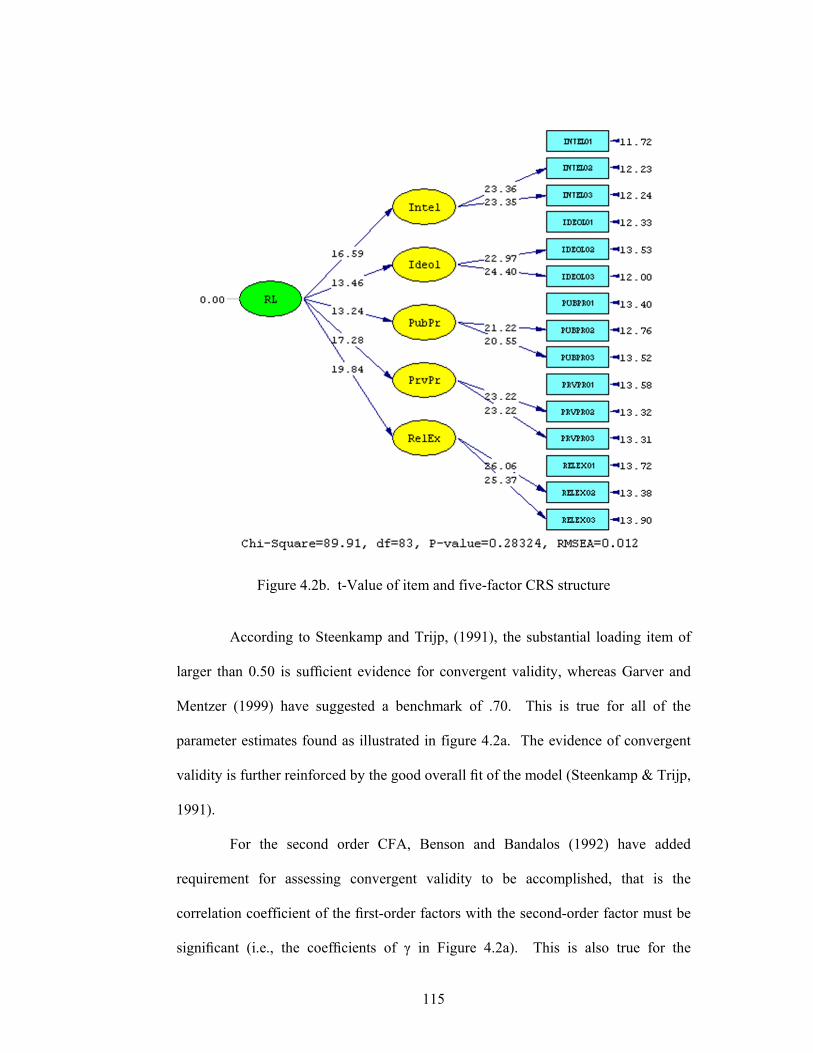
115
Figure 4.2b.1t-Value of item and five-factor CRS structure
According to Steenkamp and Trijp, (1991), the substantial loading item of
larger than 0.50 is sufficient evidence for convergent validity, whereas Garver and
Mentzer (1999) have suggested a benchmark of .70. This is true for all of the
parameter estimates found as illustrated in figure 4.2a. The evidence of convergent
validity is further reinforced by the good overall fit of the model (Steenkamp & Trijp,
1991).
For the second order CFA, Benson and Bandalos (1992) have added
requirement for assessing convergent validity to be accomplished, that is the
correlation coefficient of the first-order factors with the second-order factor must be
significant (i.e., the coefficients of γ in Figure 4.2a). This is also true for the
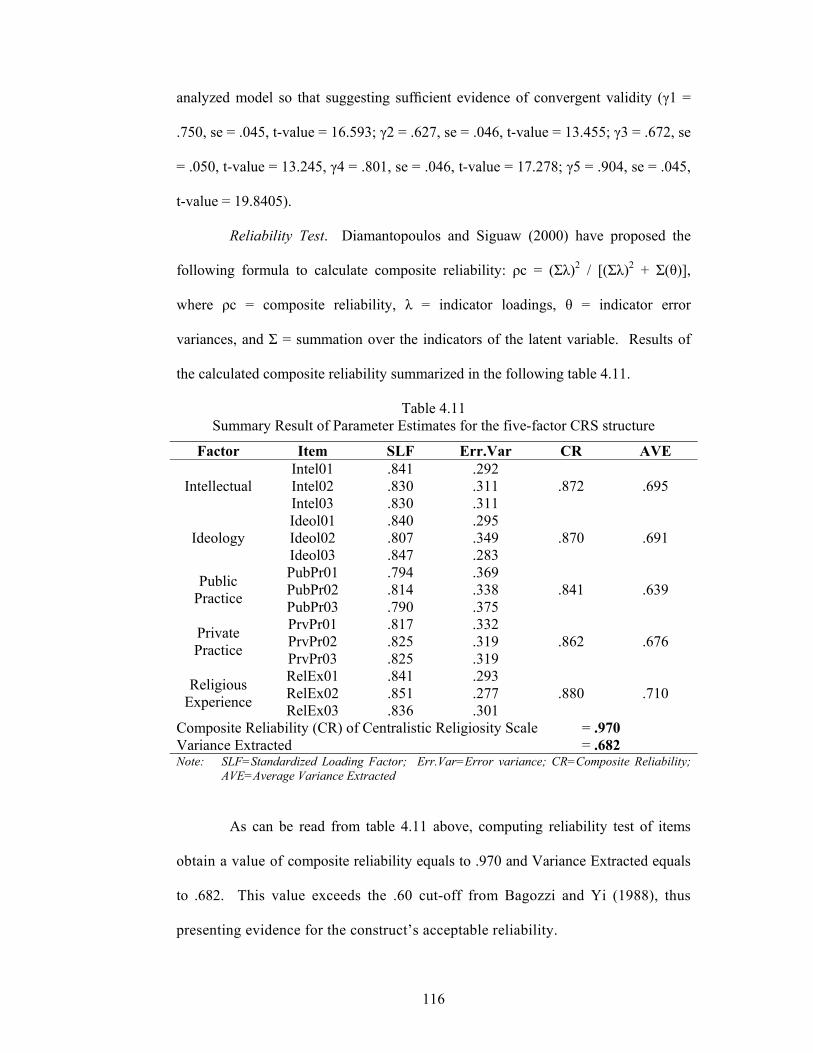
116
analyzed model so that suggesting sufficient evidence of convergent validity (γ1 =
.750, se = .045, t-value = 16.593; γ2 = .627, se = .046, t-value = 13.455; γ3 = .672, se
= .050, t-value = 13.245, γ4 = .801, se = .046, t-value = 17.278; γ5 = .904, se = .045,
t-value = 19.8405).
Reliability Test. Diamantopoulos and Siguaw (2000) have proposed the
following formula to calculate composite reliability: ρс = (Σλ)2 / [(Σλ)2 + Σ(θ)],
where ρс = composite reliability, λ = indicator loadings, θ = indicator error
variances, and Σ = summation over the indicators of the latent variable. Results of
the calculated composite reliability summarized in the following table 4.11.
Table 4.11 Summary Result of Parameter Estimates for the five-factor CRS structure
Factor Item SLF Err.Var CR AVE
Intellectual Intel01 .841 .292
.872 .695 Intel02 .830 .311 Intel03 .830 .311
Ideology Ideol01 .840 .295
.870 .691 Ideol02 .807 .349 Ideol03 .847 .283
Public Practice
PubPr01 .794 .369 .841 .639 PubPr02 .814 .338
PubPr03 .790 .375
Private Practice
PrvPr01 .817 .332 .862 .676 PrvPr02 .825 .319
PrvPr03 .825 .319
Religious Experience
RelEx01 .841 .293 .880 .710 RelEx02 .851 .277
RelEx03 .836 .301 Composite Reliability (CR) of Centralistic Religiosity Scale = .970 Variance Extracted = .682 Note: SLF=Standardized Loading Factor; Err.Var=Error variance; CR=Composite Reliability; AVE=Average Variance Extracted
As can be read from table 4.11 above, computing reliability test of items
obtain a value of composite reliability equals to .970 and Variance Extracted equals
to .682. This value exceeds the .60 cut-off from Bagozzi and Yi (1988), thus
presenting evidence for the construct’s acceptable reliability.
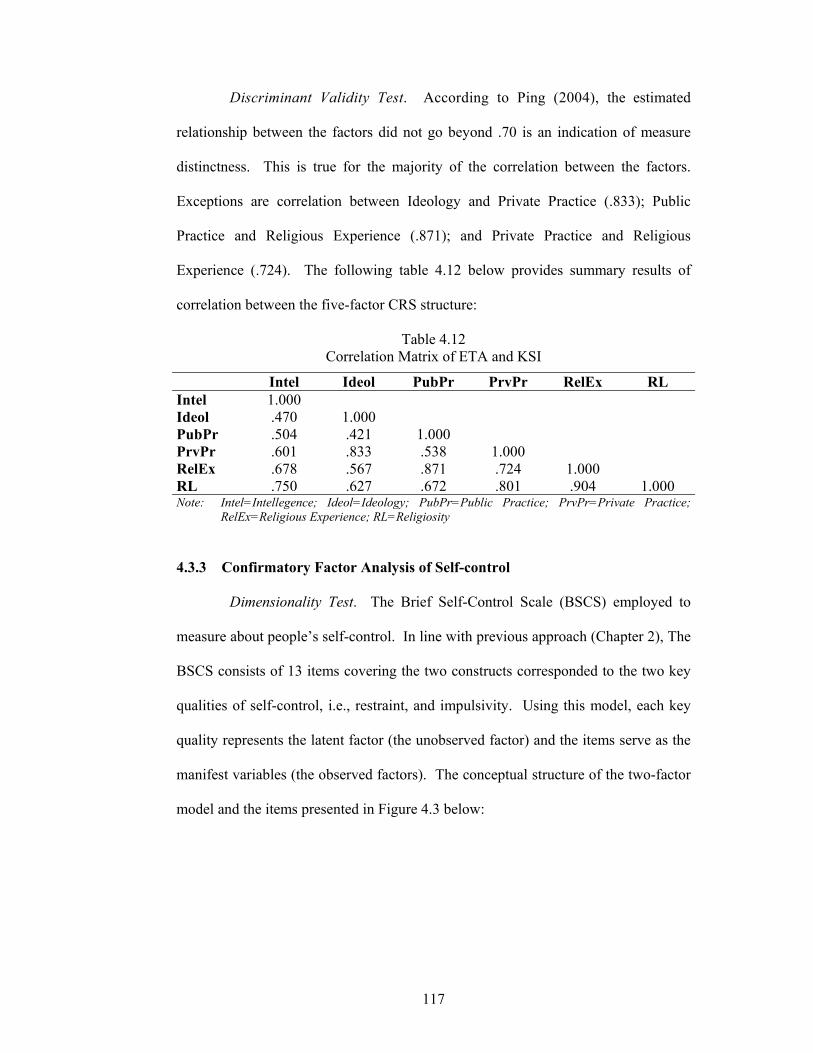
117
Discriminant Validity Test. According to Ping (2004), the estimated
relationship between the factors did not go beyond .70 is an indication of measure
distinctness. This is true for the majority of the correlation between the factors.
Exceptions are correlation between Ideology and Private Practice (.833); Public
Practice and Religious Experience (.871); and Private Practice and Religious
Experience (.724). The following table 4.12 below provides summary results of
correlation between the five-factor CRS structure:
Table 4.12 Correlation Matrix of ETA and KSI
Intel Ideol PubPr PrvPr RelEx RL Intel 1.000 Ideol .470 1.000 PubPr .504 .421 1.000 PrvPr .601 .833 .538 1.000 RelEx .678 .567 .871 .724 1.000 RL .750 .627 .672 .801 .904 1.000 Note: Intel=Intellegence; Ideol=Ideology; PubPr=Public Practice; PrvPr=Private Practice;
RelEx=Religious Experience; RL=Religiosity
4.3.3 Confirmatory Factor Analysis of Self-control
Dimensionality Test. The Brief Self-Control Scale (BSCS) employed to
measure about people’s self-control. In line with previous approach (Chapter 2), The
BSCS consists of 13 items covering the two constructs corresponded to the two key
qualities of self-control, i.e., restraint, and impulsivity. Using this model, each key
quality represents the latent factor (the unobserved factor) and the items serve as the
manifest variables (the observed factors). The conceptual structure of the two-factor
model and the items presented in Figure 4.3 below:
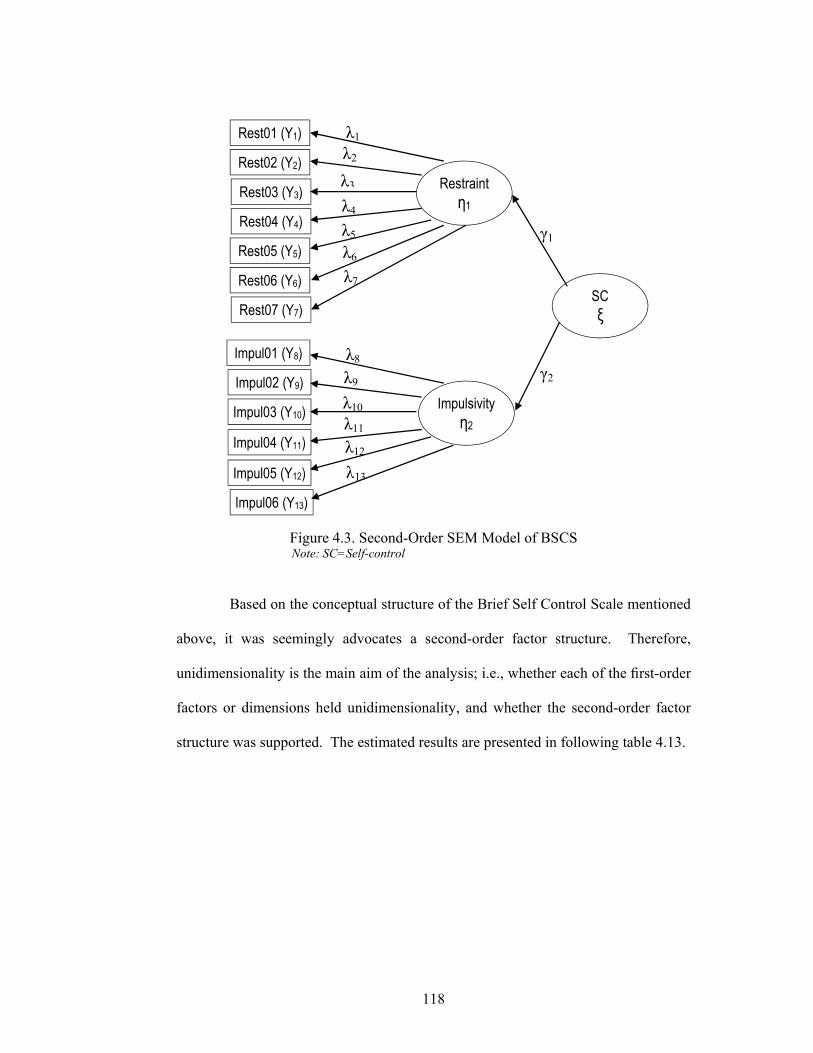
118
Figure 4.3. Second-Order SEM Model of BSCS Note: SC=Self-control
Based on the conceptual structure of the Brief Self Control Scale mentioned
above, it was seemingly advocates a second-order factor structure. Therefore,
unidimensionality is the main aim of the analysis; i.e., whether each of the first-order
factors or dimensions held unidimensionality, and whether the second-order factor
structure was supported. The estimated results are presented in following table 4.13.
Restraint η1
Impulsivity η2
SC ξ
Rest03 (Y3)
Rest02 (Y2)
Rest01 (Y1)
Rest04 (Y4)
Rest05 (Y5)
Impul01 (Y8)
Impul02 (Y9)
Impul03 (Y10)
Impul04 (Y11)
Impul05 (Y12)
λ1
λ2
λ3
λ4
λ5
λ8
λ9
λ10
λ11
λ12
γ1
γ2
Rest06 (Y6)
Rest07 (Y7)
λ6
λ7
Impul06 (Y13)
λ13
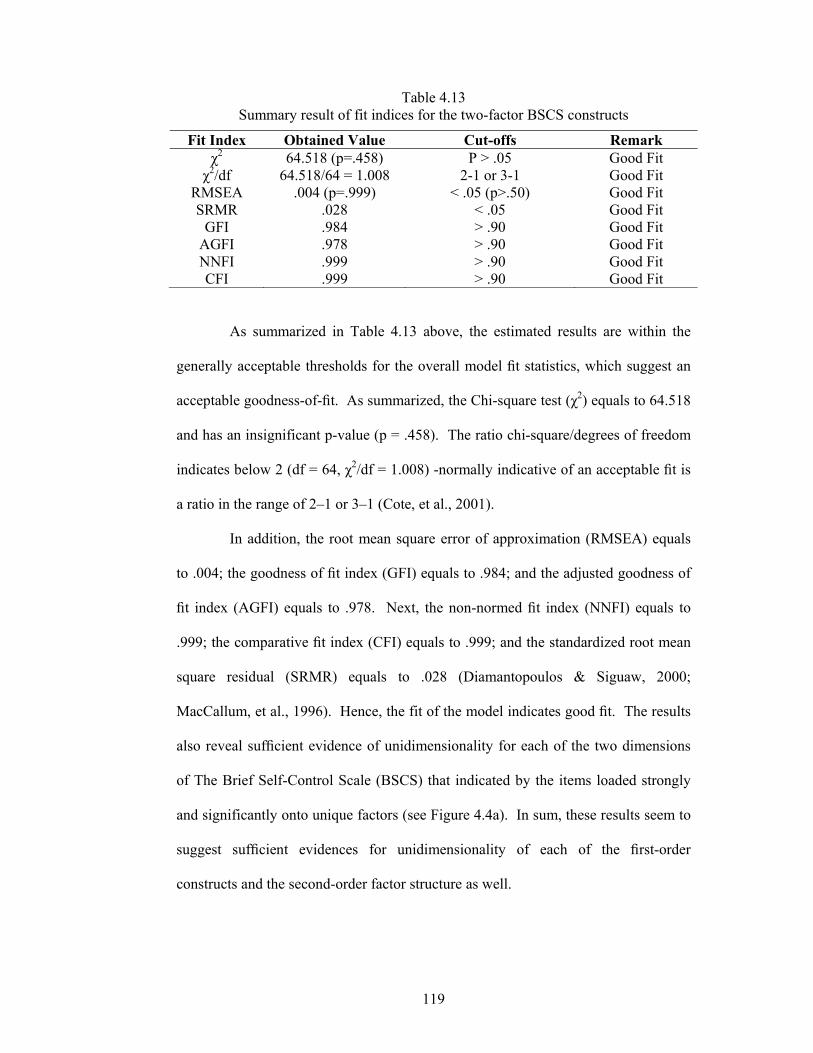
119
Table 4.13 Summary result of fit indices for the two-factor BSCS constructs
Fit Index Obtained Value Cut-offs Remark χ2 64.518 (p=.458) P > .05 Good Fit
χ2/df 64.518/64 = 1.008 2-1 or 3-1 Good Fit RMSEA .004 (p=.999) < .05 (p>.50) Good Fit SRMR .028 < .05 Good Fit
GFI .984 > .90 Good Fit AGFI .978 > .90 Good Fit NNFI .999 > .90 Good Fit CFI .999 > .90 Good Fit
As summarized in Table 4.13 above, the estimated results are within the
generally acceptable thresholds for the overall model fit statistics, which suggest an
acceptable goodness-of-fit. As summarized, the Chi-square test (χ2) equals to 64.518
and has an insignificant p-value (p = .458). The ratio chi-square/degrees of freedom
indicates below 2 (df = 64, χ2/df = 1.008) -normally indicative of an acceptable fit is
a ratio in the range of 2–1 or 3–1 (Cote, et al., 2001).
In addition, the root mean square error of approximation (RMSEA) equals
to .004; the goodness of fit index (GFI) equals to .984; and the adjusted goodness of
fit index (AGFI) equals to .978. Next, the non-normed fit index (NNFI) equals to
.999; the comparative fit index (CFI) equals to .999; and the standardized root mean
square residual (SRMR) equals to .028 (Diamantopoulos & Siguaw, 2000;
MacCallum, et al., 1996). Hence, the fit of the model indicates good fit. The results
also reveal sufficient evidence of unidimensionality for each of the two dimensions
of The Brief Self-Control Scale (BSCS) that indicated by the items loaded strongly
and significantly onto unique factors (see Figure 4.4a). In sum, these results seem to
suggest sufficient evidences for unidimensionality of each of the first-order
constructs and the second-order factor structure as well.
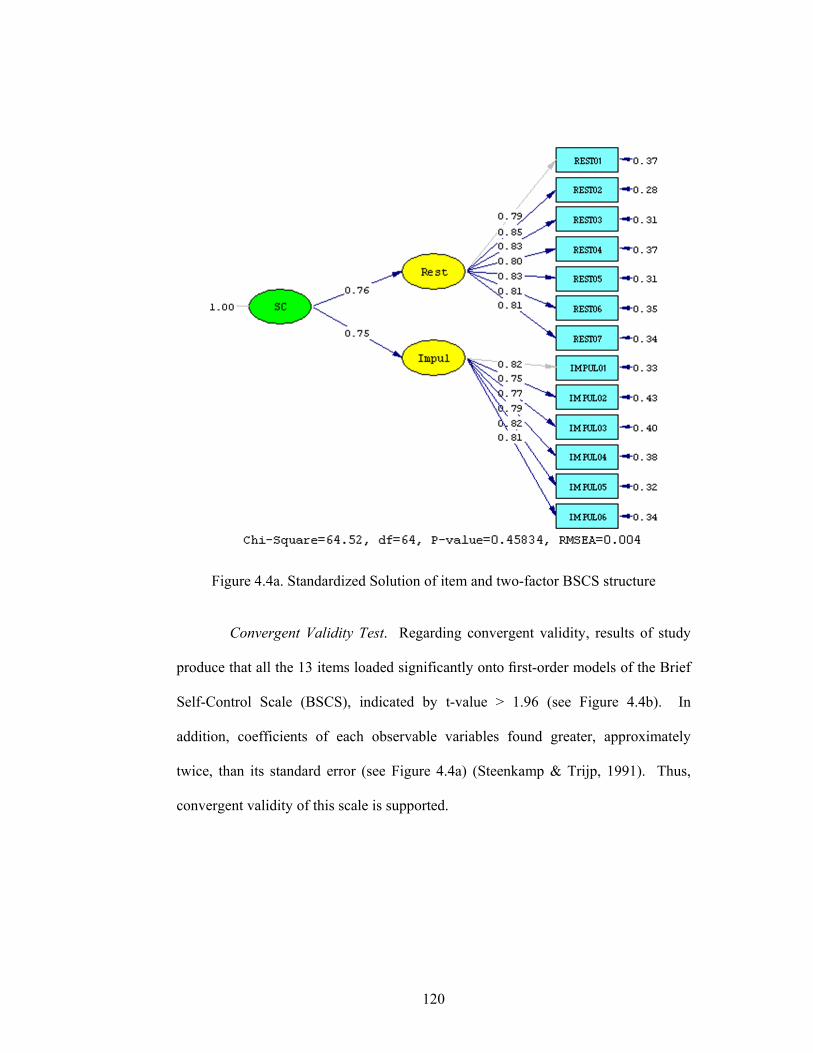
120
Figure 4.4a. Standardized Solution of item and two-factor BSCS structure
Convergent Validity Test. Regarding convergent validity, results of study
produce that all the 13 items loaded significantly onto first-order models of the Brief
Self-Control Scale (BSCS), indicated by t-value > 1.96 (see Figure 4.4b). In
addition, coefficients of each observable variables found greater, approximately
twice, than its standard error (see Figure 4.4a) (Steenkamp & Trijp, 1991). Thus,
convergent validity of this scale is supported.
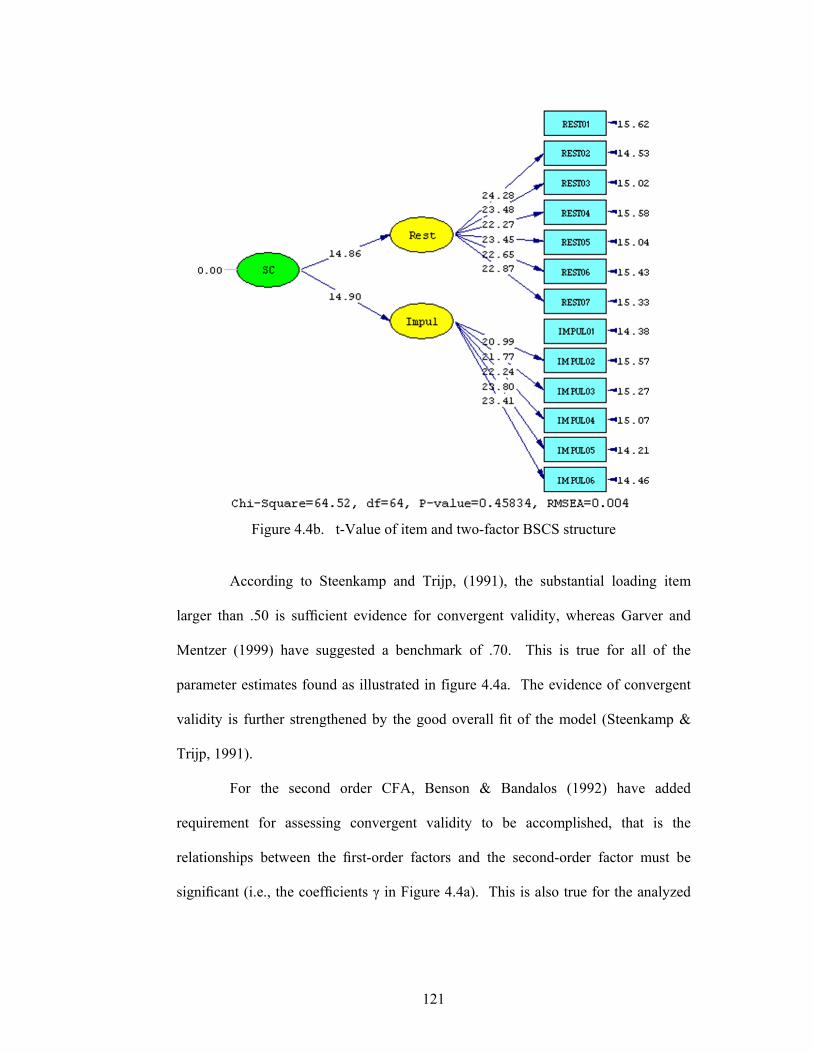
121
Figure 4.4b.1 t-Value of item and two-factor BSCS structure
According to Steenkamp and Trijp, (1991), the substantial loading item
larger than .50 is sufficient evidence for convergent validity, whereas Garver and
Mentzer (1999) have suggested a benchmark of .70. This is true for all of the
parameter estimates found as illustrated in figure 4.4a. The evidence of convergent
validity is further strengthened by the good overall fit of the model (Steenkamp &
Trijp, 1991).
For the second order CFA, Benson & Bandalos (1992) have added
requirement for assessing convergent validity to be accomplished, that is the
relationships between the first-order factors and the second-order factor must be
significant (i.e., the coefficients γ in Figure 4.4a). This is also true for the analyzed
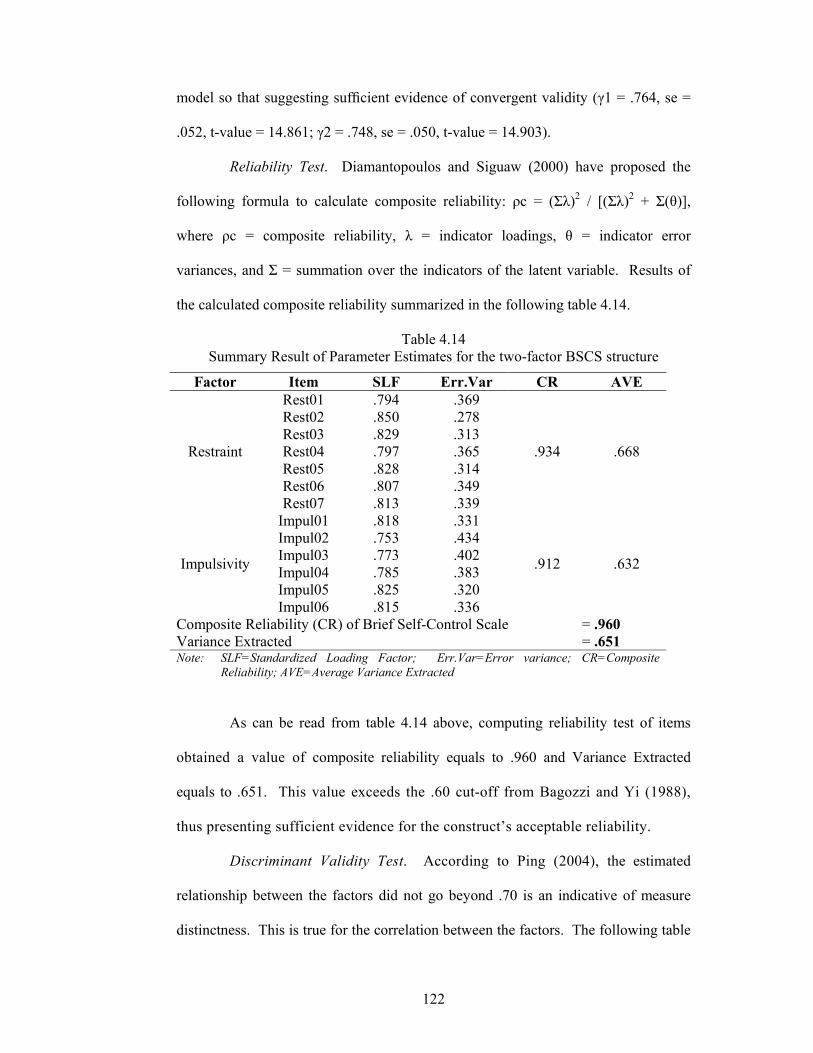
122
model so that suggesting sufficient evidence of convergent validity (γ1 = .764, se =
.052, t-value = 14.861; γ2 = .748, se = .050, t-value = 14.903).
Reliability Test. Diamantopoulos and Siguaw (2000) have proposed the
following formula to calculate composite reliability: ρс = (Σλ)2 / [(Σλ)2 + Σ(θ)],
where ρс = composite reliability, λ = indicator loadings, θ = indicator error
variances, and Σ = summation over the indicators of the latent variable. Results of
the calculated composite reliability summarized in the following table 4.14.
Table 4.14 Summary Result of Parameter Estimates for the two-factor BSCS structure
Factor Item SLF Err.Var CR AVE
Restraint
Rest01 .794 .369
.934 .668
Rest02 .850 .278 Rest03 .829 .313 Rest04 .797 .365 Rest05 .828 .314 Rest06 .807 .349 Rest07 .813 .339
Impulsivity
Impul01 .818 .331
.912 .632
Impul02 .753 .434 Impul03 .773 .402 Impul04 .785 .383 Impul05 .825 .320 Impul06 .815 .336
Composite Reliability (CR) of Brief Self-Control Scale = .960 Variance Extracted = .651 Note: SLF=Standardized Loading Factor; Err.Var=Error variance; CR=Composite
Reliability; AVE=Average Variance Extracted
As can be read from table 4.14 above, computing reliability test of items
obtained a value of composite reliability equals to .960 and Variance Extracted
equals to .651. This value exceeds the .60 cut-off from Bagozzi and Yi (1988),
thus presenting sufficient evidence for the construct’s acceptable reliability.
Discriminant Validity Test. According to Ping (2004), the estimated
relationship between the factors did not go beyond .70 is an indicative of measure
distinctness. This is true for the correlation between the factors. The following table
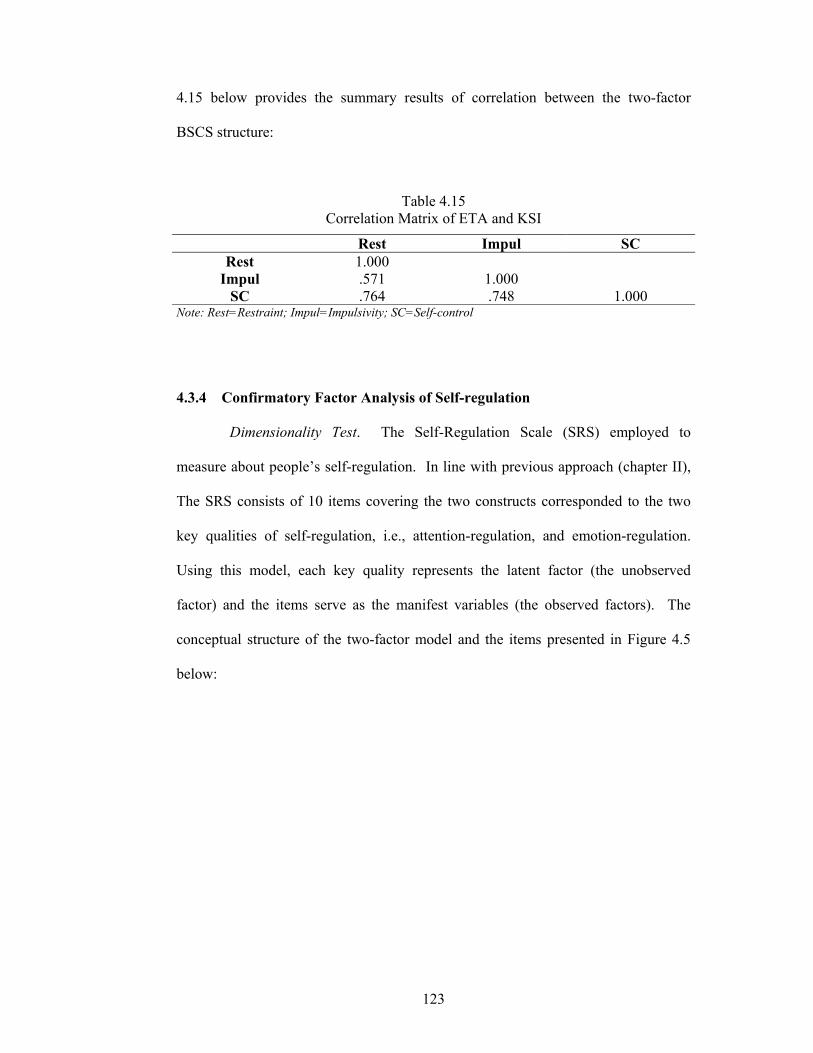
123
4.15 below provides the summary results of correlation between the two-factor
BSCS structure:
Table 4.15 Correlation Matrix of ETA and KSI
Rest Impul SC Rest 1.000
Impul .571 1.000 SC .764 .748 1.000
Note: Rest=Restraint; Impul=Impulsivity; SC=Self-control
4.3.4 Confirmatory Factor Analysis of Self-regulation
Dimensionality Test. The Self-Regulation Scale (SRS) employed to
measure about people’s self-regulation. In line with previous approach (chapter II),
The SRS consists of 10 items covering the two constructs corresponded to the two
key qualities of self-regulation, i.e., attention-regulation, and emotion-regulation.
Using this model, each key quality represents the latent factor (the unobserved
factor) and the items serve as the manifest variables (the observed factors). The
conceptual structure of the two-factor model and the items presented in Figure 4.5
below:
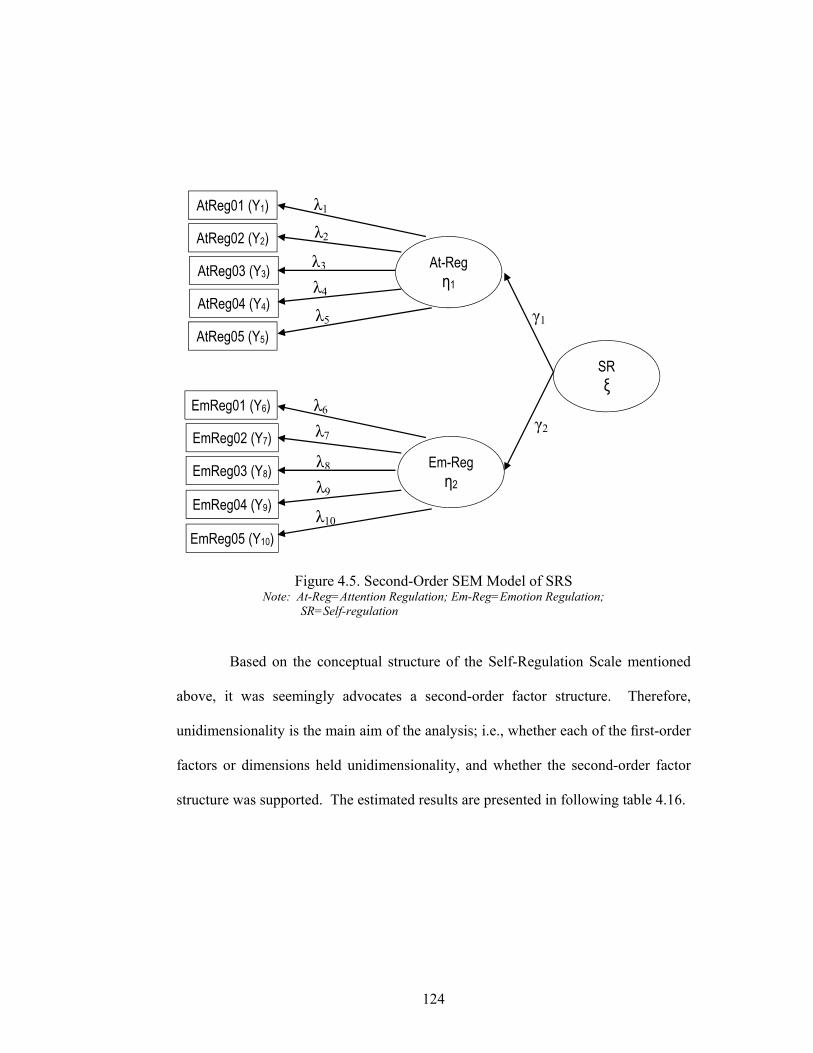
124
At-Reg η1
Em-Reg η2
SR ξ
AtReg03 (Y3)
AtReg02 (Y2)
AtReg01 (Y1)
AtReg04 (Y4)
AtReg05 (Y5)
EmReg01 (Y6)
EmReg02 (Y7)
EmReg03 (Y8)
EmReg04 (Y9)
EmReg05 (Y10)
λ1
λ2
λ3
λ4
λ5
λ6
λ7
λ8
λ9
λ10
γ1
γ2
Figure 4.5. Second-Order SEM Model of SRS Note: At-Reg=Attention Regulation; Em-Reg=Emotion Regulation;
SR=Self-regulation
Based on the conceptual structure of the Self-Regulation Scale mentioned
above, it was seemingly advocates a second-order factor structure. Therefore,
unidimensionality is the main aim of the analysis; i.e., whether each of the first-order
factors or dimensions held unidimensionality, and whether the second-order factor
structure was supported. The estimated results are presented in following table 4.16.
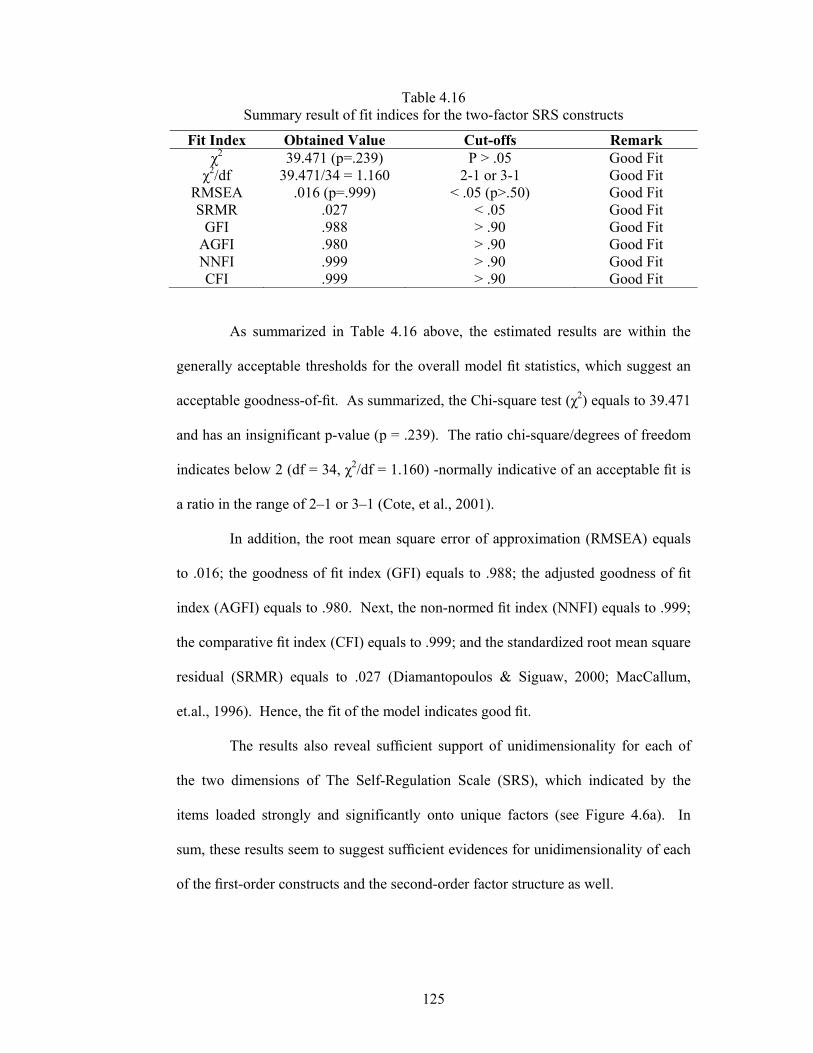
125
Table 4.16 Summary result of fit indices for the two-factor SRS constructs
Fit Index Obtained Value Cut-offs Remark χ2 39.471 (p=.239) P > .05 Good Fit
χ2/df 39.471/34 = 1.160 2-1 or 3-1 Good Fit RMSEA .016 (p=.999) < .05 (p>.50) Good Fit SRMR .027 < .05 Good Fit
GFI .988 > .90 Good Fit AGFI .980 > .90 Good Fit NNFI .999 > .90 Good Fit CFI .999 > .90 Good Fit
As summarized in Table 4.16 above, the estimated results are within the
generally acceptable thresholds for the overall model fit statistics, which suggest an
acceptable goodness-of-fit. As summarized, the Chi-square test (χ2) equals to 39.471
and has an insignificant p-value (p = .239). The ratio chi-square/degrees of freedom
indicates below 2 (df = 34, χ2/df = 1.160) -normally indicative of an acceptable fit is
a ratio in the range of 2–1 or 3–1 (Cote, et al., 2001).
In addition, the root mean square error of approximation (RMSEA) equals
to .016; the goodness of fit index (GFI) equals to .988; the adjusted goodness of fit
index (AGFI) equals to .980. Next, the non-normed fit index (NNFI) equals to .999;
the comparative fit index (CFI) equals to .999; and the standardized root mean square
residual (SRMR) equals to .027 (Diamantopoulos & Siguaw, 2000; MacCallum,
et.al., 1996). Hence, the fit of the model indicates good fit.
The results also reveal sufficient support of unidimensionality for each of
the two dimensions of The Self-Regulation Scale (SRS), which indicated by the
items loaded strongly and significantly onto unique factors (see Figure 4.6a). In
sum, these results seem to suggest sufficient evidences for unidimensionality of each
of the first-order constructs and the second-order factor structure as well.
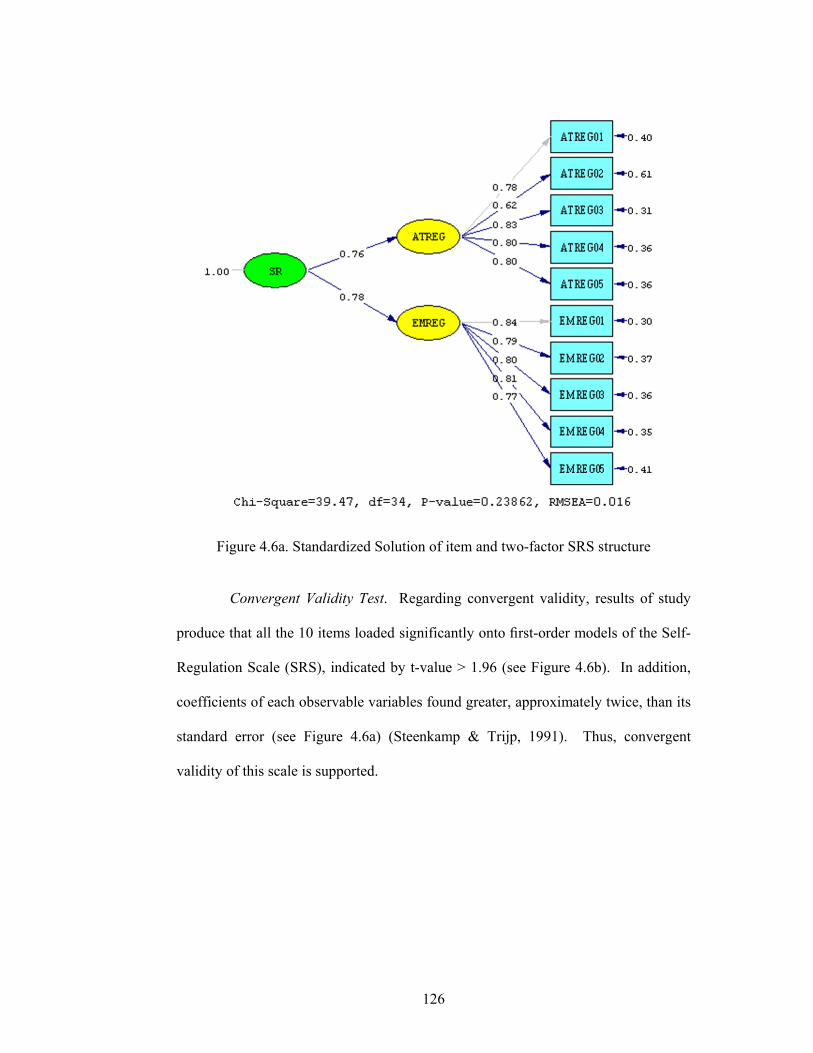
126
Figure 4.6a. Standardized Solution of item and two-factor SRS structure
Convergent Validity Test. Regarding convergent validity, results of study
produce that all the 10 items loaded significantly onto first-order models of the Self-
Regulation Scale (SRS), indicated by t-value > 1.96 (see Figure 4.6b). In addition,
coefficients of each observable variables found greater, approximately twice, than its
standard error (see Figure 4.6a) (Steenkamp & Trijp, 1991). Thus, convergent
validity of this scale is supported.
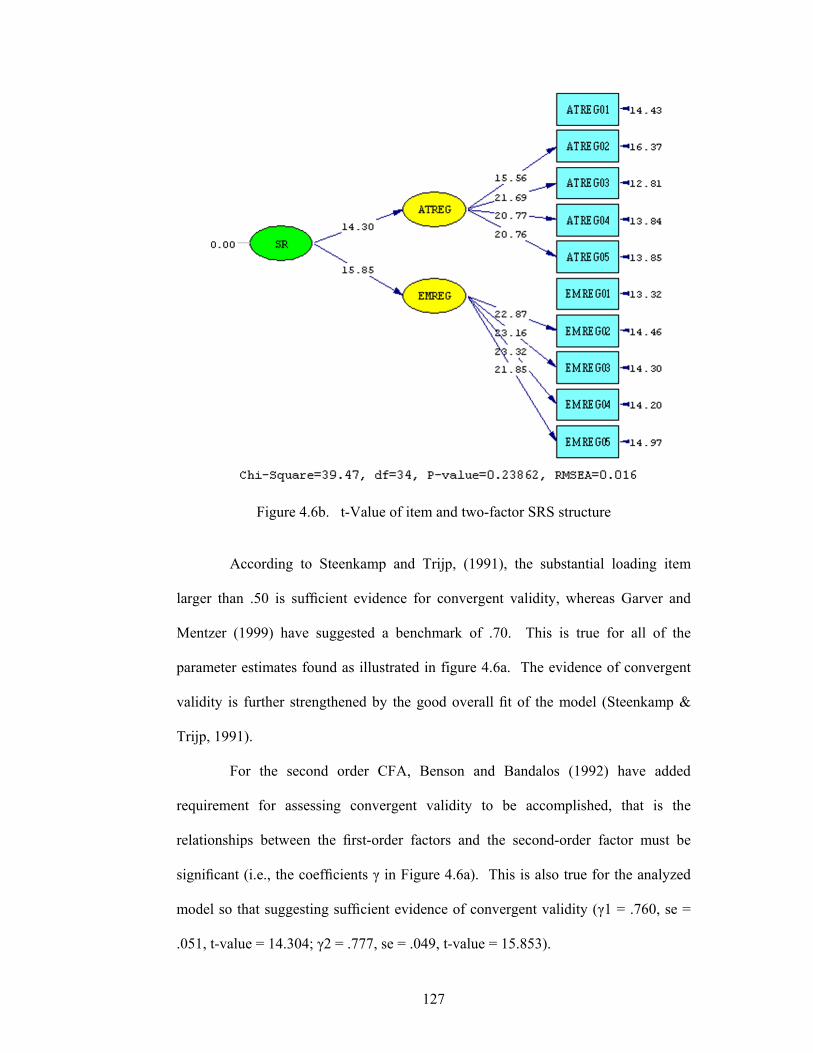
127
Figure 4.6b.1 t-Value of item and two-factor SRS structure
According to Steenkamp and Trijp, (1991), the substantial loading item
larger than .50 is sufficient evidence for convergent validity, whereas Garver and
Mentzer (1999) have suggested a benchmark of .70. This is true for all of the
parameter estimates found as illustrated in figure 4.6a. The evidence of convergent
validity is further strengthened by the good overall fit of the model (Steenkamp &
Trijp, 1991).
For the second order CFA, Benson and Bandalos (1992) have added
requirement for assessing convergent validity to be accomplished, that is the
relationships between the first-order factors and the second-order factor must be
significant (i.e., the coefficients γ in Figure 4.6a). This is also true for the analyzed
model so that suggesting sufficient evidence of convergent validity (γ1 = .760, se =
.051, t-value = 14.304; γ2 = .777, se = .049, t-value = 15.853).
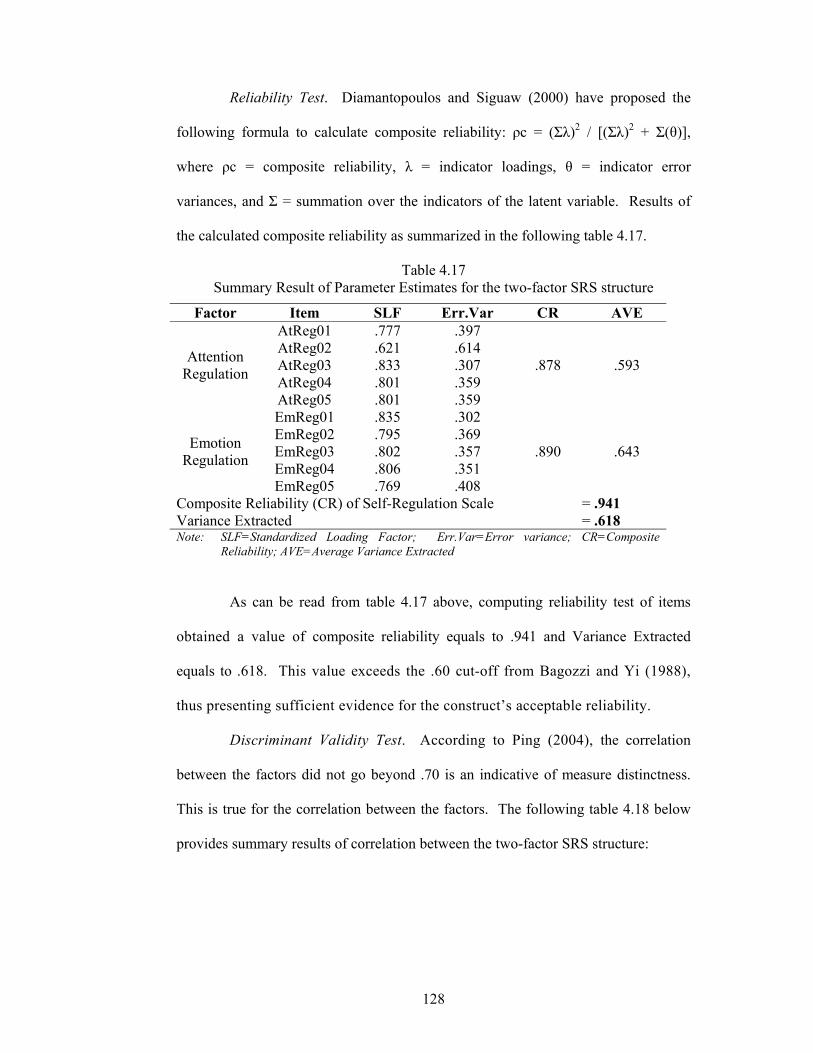
128
Reliability Test. Diamantopoulos and Siguaw (2000) have proposed the
following formula to calculate composite reliability: ρс = (Σλ)2 / [(Σλ)2 + Σ(θ)],
where ρс = composite reliability, λ = indicator loadings, θ = indicator error
variances, and Σ = summation over the indicators of the latent variable. Results of
the calculated composite reliability as summarized in the following table 4.17.
Table 4.17 Summary Result of Parameter Estimates for the two-factor SRS structure
Factor Item SLF Err.Var CR AVE
Attention Regulation
AtReg01 .777 .397
.878 .593 AtReg02 .621 .614 AtReg03 .833 .307 AtReg04 .801 .359 AtReg05 .801 .359
Emotion Regulation
EmReg01 .835 .302
.890 .643 EmReg02 .795 .369 EmReg03 .802 .357 EmReg04 .806 .351 EmReg05 .769 .408
Composite Reliability (CR) of Self-Regulation Scale = .941 Variance Extracted = .618 Note: SLF=Standardized Loading Factor; Err.Var=Error variance; CR=Composite
Reliability; AVE=Average Variance Extracted
As can be read from table 4.17 above, computing reliability test of items
obtained a value of composite reliability equals to .941 and Variance Extracted
equals to .618. This value exceeds the .60 cut-off from Bagozzi and Yi (1988),
thus presenting sufficient evidence for the construct’s acceptable reliability.
Discriminant Validity Test. According to Ping (2004), the correlation
between the factors did not go beyond .70 is an indicative of measure distinctness.
This is true for the correlation between the factors. The following table 4.18 below
provides summary results of correlation between the two-factor SRS structure:
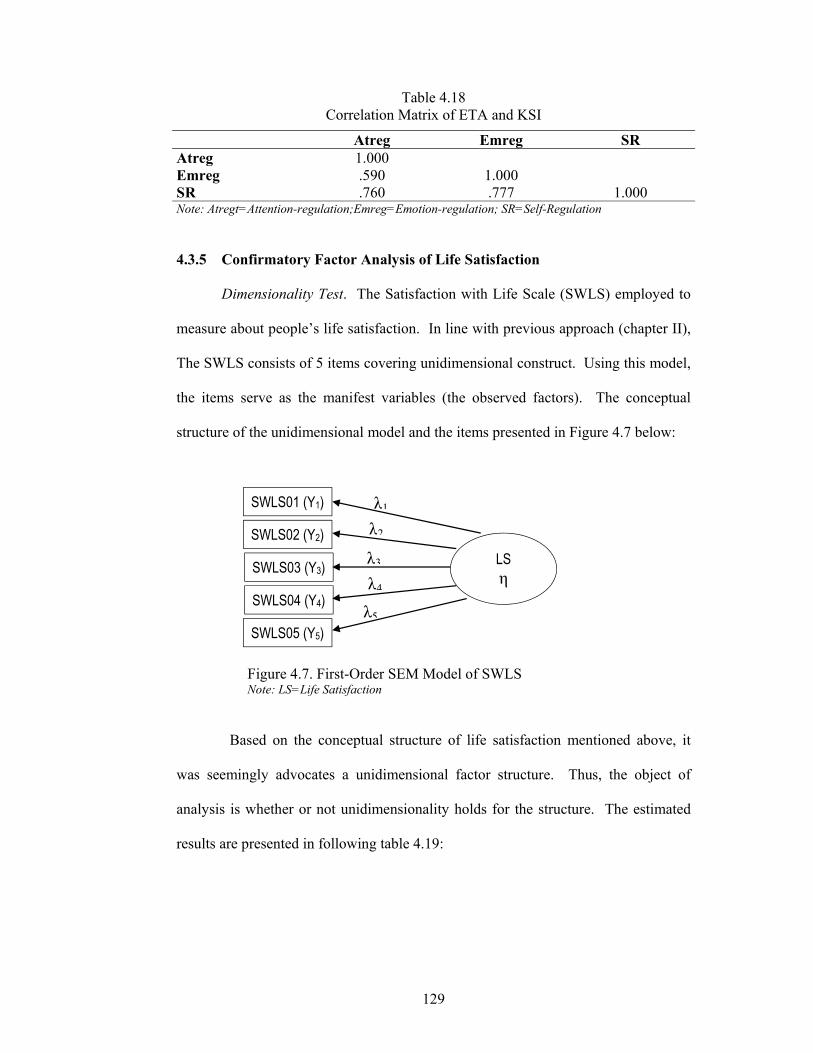
129
LS η
SWLS03 (Y3)
SWLS02 (Y2)
SWLS01 (Y1)
SWLS04 (Y4)
SWLS05 (Y5)
λ1
λ2
λ3
λ4
λ5
Table 4.18 Correlation Matrix of ETA and KSI
Atreg Emreg SR Atreg 1.000 Emreg .590 1.000 SR .760 .777 1.000 Note: Atregt=Attention-regulation;Emreg=Emotion-regulation; SR=Self-Regulation
4.3.5 Confirmatory Factor Analysis of Life Satisfaction
Dimensionality Test. The Satisfaction with Life Scale (SWLS) employed to
measure about people’s life satisfaction. In line with previous approach (chapter II),
The SWLS consists of 5 items covering unidimensional construct. Using this model,
the items serve as the manifest variables (the observed factors). The conceptual
structure of the unidimensional model and the items presented in Figure 4.7 below:
Figure 4.7. First-Order SEM Model of SWLS Note: LS=Life Satisfaction
Based on the conceptual structure of life satisfaction mentioned above, it
was seemingly advocates a unidimensional factor structure. Thus, the object of
analysis is whether or not unidimensionality holds for the structure. The estimated
results are presented in following table 4.19:
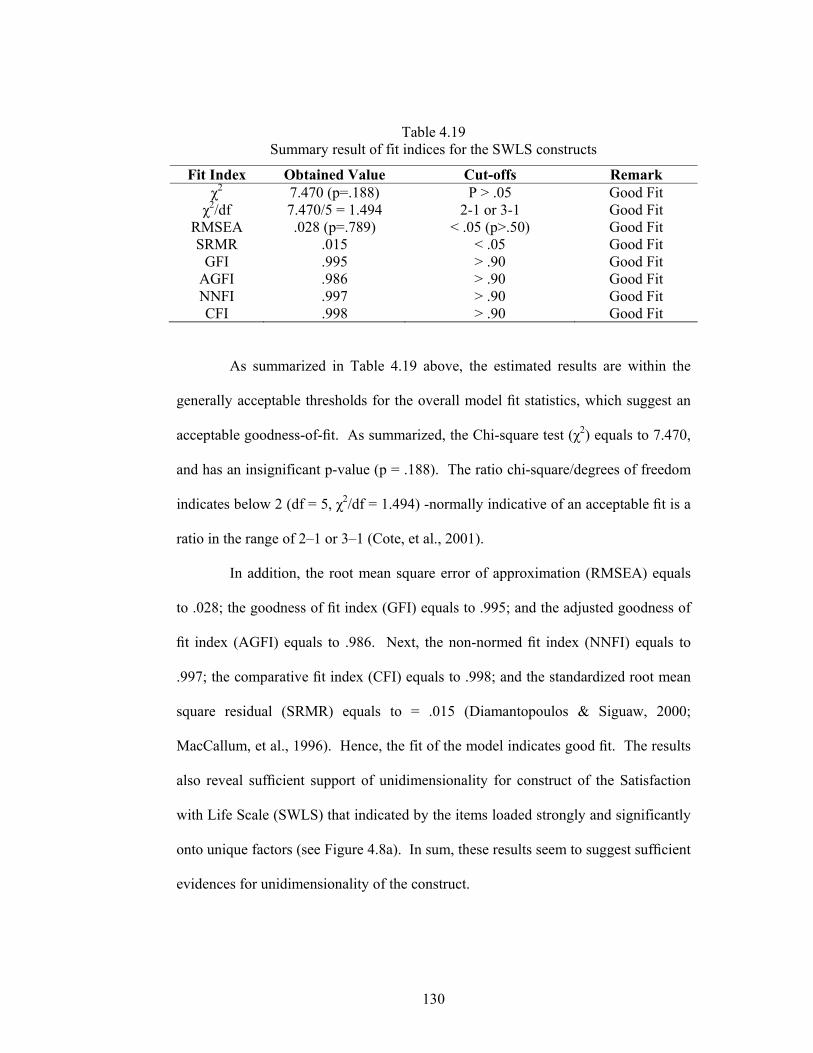
130
Table 4.19 Summary result of fit indices for the SWLS constructs
Fit Index Obtained Value Cut-offs Remark χ2 7.470 (p=.188) P > .05 Good Fit
χ2/df 7.470/5 = 1.494 2-1 or 3-1 Good Fit RMSEA .028 (p=.789) < .05 (p>.50) Good Fit SRMR .015 < .05 Good Fit
GFI .995 > .90 Good Fit AGFI .986 > .90 Good Fit NNFI .997 > .90 Good Fit CFI .998 > .90 Good Fit
As summarized in Table 4.19 above, the estimated results are within the
generally acceptable thresholds for the overall model fit statistics, which suggest an
acceptable goodness-of-fit. As summarized, the Chi-square test (χ2) equals to 7.470,
and has an insignificant p-value (p = .188). The ratio chi-square/degrees of freedom
indicates below 2 (df = 5, χ2/df = 1.494) -normally indicative of an acceptable fit is a
ratio in the range of 2–1 or 3–1 (Cote, et al., 2001).
In addition, the root mean square error of approximation (RMSEA) equals
to .028; the goodness of fit index (GFI) equals to .995; and the adjusted goodness of
fit index (AGFI) equals to .986. Next, the non-normed fit index (NNFI) equals to
.997; the comparative fit index (CFI) equals to .998; and the standardized root mean
square residual (SRMR) equals to = .015 (Diamantopoulos & Siguaw, 2000;
MacCallum, et al., 1996). Hence, the fit of the model indicates good fit. The results
also reveal sufficient support of unidimensionality for construct of the Satisfaction
with Life Scale (SWLS) that indicated by the items loaded strongly and significantly
onto unique factors (see Figure 4.8a). In sum, these results seem to suggest sufficient
evidences for unidimensionality of the construct.
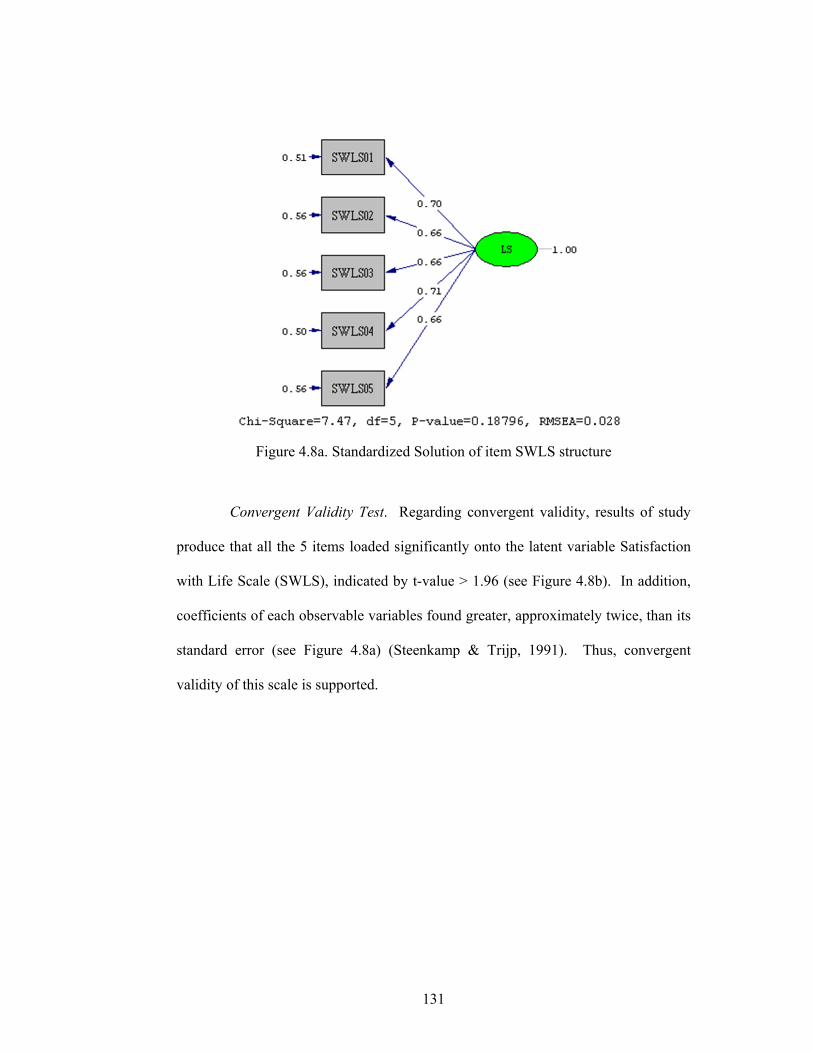
131
Figure 4.8a. Standardized Solution of item SWLS structure
Convergent Validity Test. Regarding convergent validity, results of study
produce that all the 5 items loaded significantly onto the latent variable Satisfaction
with Life Scale (SWLS), indicated by t-value > 1.96 (see Figure 4.8b). In addition,
coefficients of each observable variables found greater, approximately twice, than its
standard error (see Figure 4.8a) (Steenkamp & Trijp, 1991). Thus, convergent
validity of this scale is supported.
132
Figure 4.8b.1t-Value of item for SWLS structure
According to Steenkamp and Trijp, (1991), the substantial loading item
larger than .50 is sufficient evidence for convergent validity, whereas Garver and
Mentzer (1999) have suggested a benchmark of .70. This is almost true for all of the
parameter estimates found except for item SWLS02 (.661); SWLS03 (.662); and
SWLS05 (.660), as illustrated in figure 4.8a. The evidence of convergent validity is
further strengthened by the good overall fit of the model (Steenkamp & Trijp, 1991).
Reliability Test. Diamantopoulos and Siguaw (2000) have proposed the
following formula to calculate composite reliability: ρс = (Σλ)2 / [(Σλ)2 + Σ(θ)],
where ρс = composite reliability, λ = indicator loadings, θ = indicator error
variances, and Σ = summation over the indicators of the latent variable. Results of
the calculated composite reliability summarized in the following table 4.20.
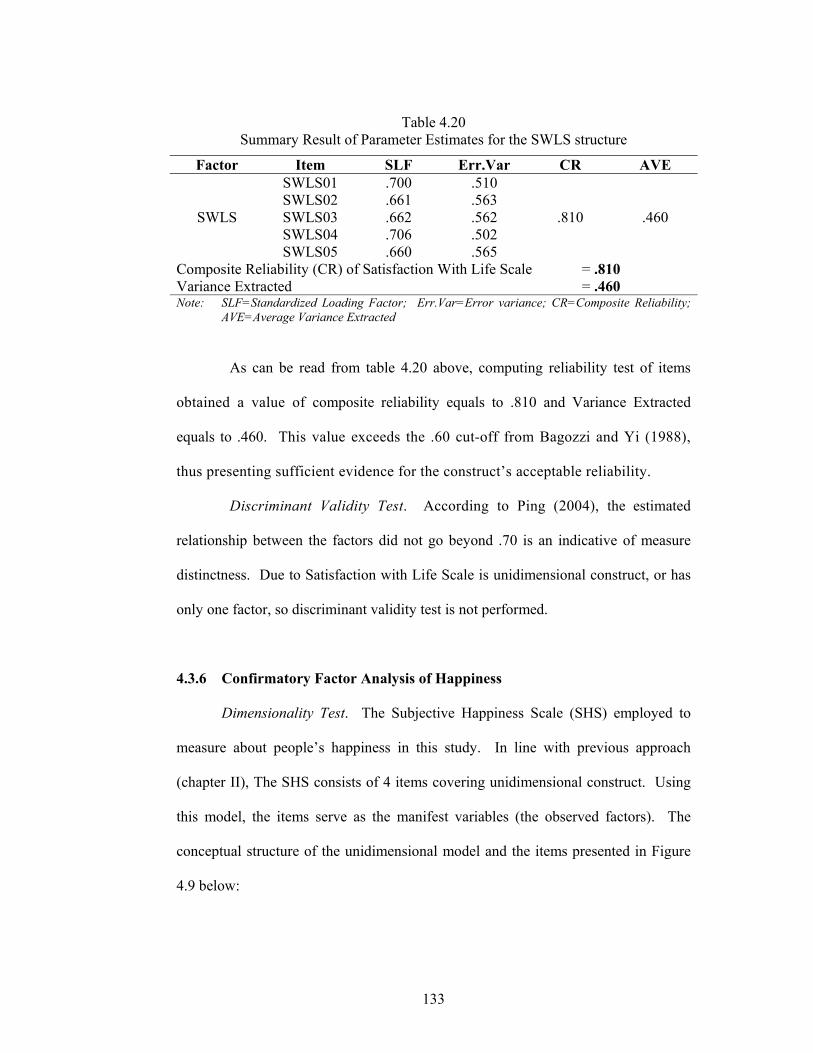
133
Table 4.20 Summary Result of Parameter Estimates for the SWLS structure
Factor Item SLF Err.Var CR AVE
SWLS
SWLS01 .700 .510
.810 .460 SWLS02 .661 .563 SWLS03 .662 .562 SWLS04 .706 .502 SWLS05 .660 .565
Composite Reliability (CR) of Satisfaction With Life Scale = .810 Variance Extracted = .460 Note: SLF=Standardized Loading Factor; Err.Var=Error variance; CR=Composite Reliability; AVE=Average Variance Extracted
As can be read from table 4.20 above, computing reliability test of items
obtained a value of composite reliability equals to .810 and Variance Extracted
equals to .460. This value exceeds the .60 cut-off from Bagozzi and Yi (1988),
thus presenting sufficient evidence for the construct’s acceptable reliability.
Discriminant Validity Test. According to Ping (2004), the estimated
relationship between the factors did not go beyond .70 is an indicative of measure
distinctness. Due to Satisfaction with Life Scale is unidimensional construct, or has
only one factor, so discriminant validity test is not performed.
4.3.6 Confirmatory Factor Analysis of Happiness
Dimensionality Test. The Subjective Happiness Scale (SHS) employed to
measure about people’s happiness in this study. In line with previous approach
(chapter II), The SHS consists of 4 items covering unidimensional construct. Using
this model, the items serve as the manifest variables (the observed factors). The
conceptual structure of the unidimensional model and the items presented in Figure
4.9 below:
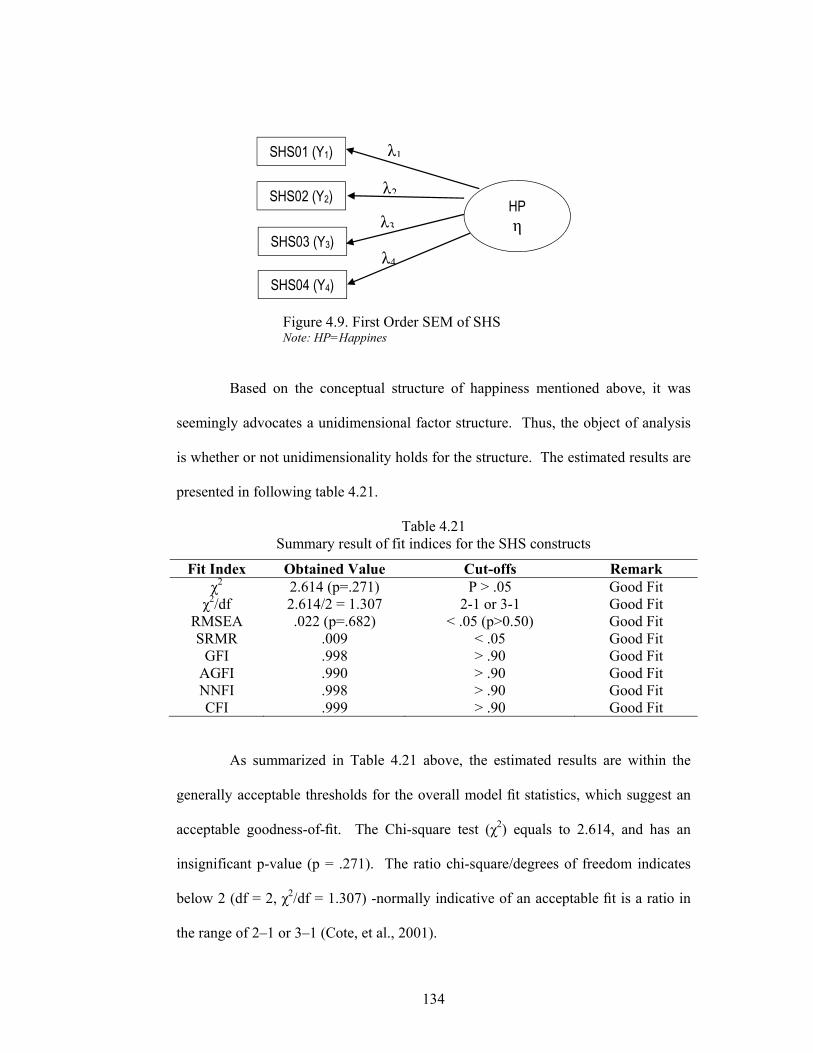
134
HP η
SHS03 (Y3)
SHS02 (Y2)
SHS01 (Y1)
SHS04 (Y4)
λ1
λ2
λ3
λ4
Figure 4.9. First Order SEM of SHS Note: HP=Happines
Based on the conceptual structure of happiness mentioned above, it was
seemingly advocates a unidimensional factor structure. Thus, the object of analysis
is whether or not unidimensionality holds for the structure. The estimated results are
presented in following table 4.21.
Table 4.21 Summary result of fit indices for the SHS constructs
Fit Index Obtained Value Cut-offs Remark χ2 2.614 (p=.271) P > .05 Good Fit
χ2/df 2.614/2 = 1.307 2-1 or 3-1 Good Fit RMSEA .022 (p=.682) < .05 (p>0.50) Good Fit SRMR .009 < .05 Good Fit
GFI .998 > .90 Good Fit AGFI .990 > .90 Good Fit NNFI .998 > .90 Good Fit CFI .999 > .90 Good Fit
As summarized in Table 4.21 above, the estimated results are within the
generally acceptable thresholds for the overall model fit statistics, which suggest an
acceptable goodness-of-fit. The Chi-square test (χ2) equals to 2.614, and has an
insignificant p-value (p = .271). The ratio chi-square/degrees of freedom indicates
below 2 (df = 2, χ2/df = 1.307) -normally indicative of an acceptable fit is a ratio in
the range of 2–1 or 3–1 (Cote, et al., 2001).
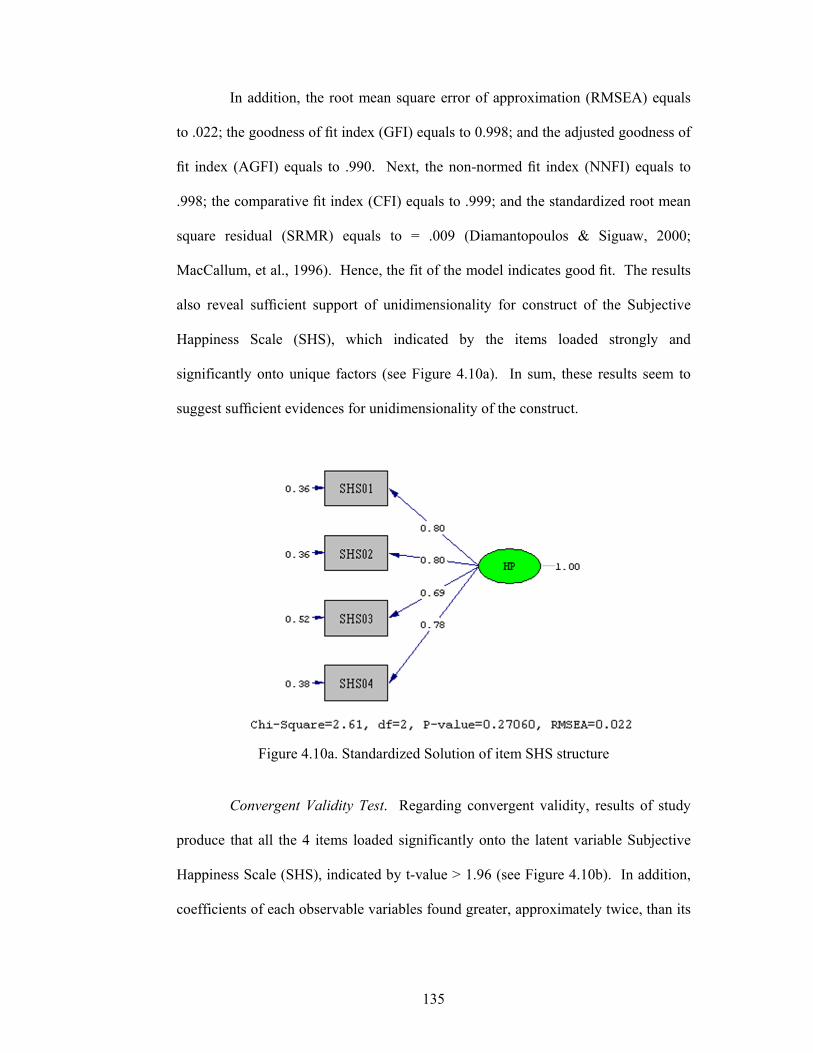
135
In addition, the root mean square error of approximation (RMSEA) equals
to .022; the goodness of fit index (GFI) equals to 0.998; and the adjusted goodness of
fit index (AGFI) equals to .990. Next, the non-normed fit index (NNFI) equals to
.998; the comparative fit index (CFI) equals to .999; and the standardized root mean
square residual (SRMR) equals to = .009 (Diamantopoulos & Siguaw, 2000;
MacCallum, et al., 1996). Hence, the fit of the model indicates good fit. The results
also reveal sufficient support of unidimensionality for construct of the Subjective
Happiness Scale (SHS), which indicated by the items loaded strongly and
significantly onto unique factors (see Figure 4.10a). In sum, these results seem to
suggest sufficient evidences for unidimensionality of the construct.
Figure 4.10a. Standardized Solution of item SHS structure
Convergent Validity Test. Regarding convergent validity, results of study
produce that all the 4 items loaded significantly onto the latent variable Subjective
Happiness Scale (SHS), indicated by t-value > 1.96 (see Figure 4.10b). In addition,
coefficients of each observable variables found greater, approximately twice, than its
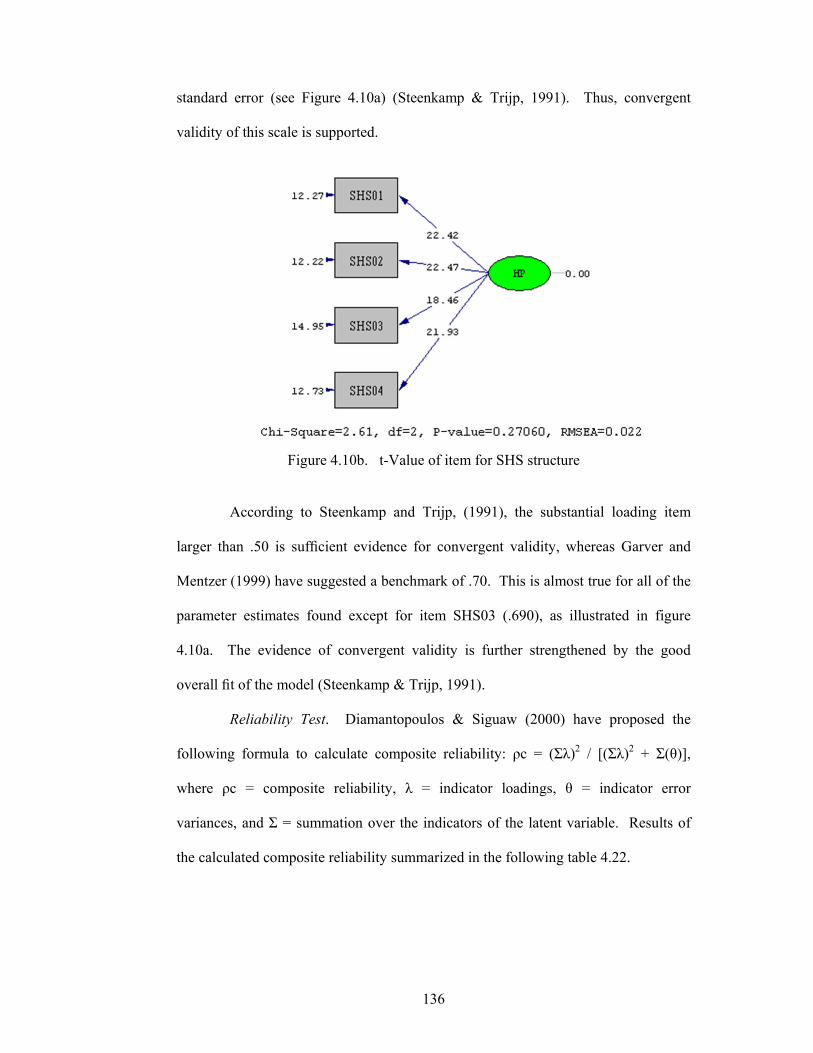
136
standard error (see Figure 4.10a) (Steenkamp & Trijp, 1991). Thus, convergent
validity of this scale is supported.
Figure 4.10b.1 t-Value of item for SHS structure
According to Steenkamp and Trijp, (1991), the substantial loading item
larger than .50 is sufficient evidence for convergent validity, whereas Garver and
Mentzer (1999) have suggested a benchmark of .70. This is almost true for all of the
parameter estimates found except for item SHS03 (.690), as illustrated in figure
4.10a. The evidence of convergent validity is further strengthened by the good
overall fit of the model (Steenkamp & Trijp, 1991).
Reliability Test. Diamantopoulos & Siguaw (2000) have proposed the
following formula to calculate composite reliability: ρс = (Σλ)2 / [(Σλ)2 + Σ(θ)],
where ρс = composite reliability, λ = indicator loadings, θ = indicator error
variances, and Σ = summation over the indicators of the latent variable. Results of
the calculated composite reliability summarized in the following table 4.22.

137
Table 4.22 Summary Result of Parameter Estimates for the SHS structure
Factor Item SLF Err.Var CR AVE
SHS
SHS01 .798 .363
.847 .581 SHS02 .799 .361 SHS03 .690 .523 SHS04 .758 .384
Composite Reliability (CR) of Subjective Happiness Scale = .847 Variance Extracted = .581 Note: SLF=Standardized Loading Factor; Err.Var=Error variance; CR=Composite Reliability; AVE=Average Variance Extracted
As can be read from table 4.22 above, computing reliability test of items
obtained a value of composite reliability equals to .847 and Variance Extracted
equals to .581. This value exceeds of the .60 cut-off from Bagozzi and Yi (1988),
thus presenting sufficient evidence for the construct’s acceptable reliability.
Discriminant Validity Test. According to Ping (2004), the correlation
between the factors did not go beyond .70 is an indicative of measure distinctness.
Due to Subjective Happiness Scale is unidimensional construct, or has only one
factor, so discriminant validity test is not performed.
4.4 Structural Model
As aforementioned, the two-step approach for structural equation modeling
(SEM) was employed in this study. It began with analysis on the measurement
model as was done earlier, and then proceed to the structural model that conducted
using partial aggregation approach (Anderson & Gerbing, 1988).
Related to the partial aggregation approach, the summated scales of items is
done by calculating the sum of each item that is in accordance with the each of sub
latent variables, and subsequently treated as indicators of constructs. Referring to
Diamantopoulos and Siguaw (2000), in the case of the constructs possess only one
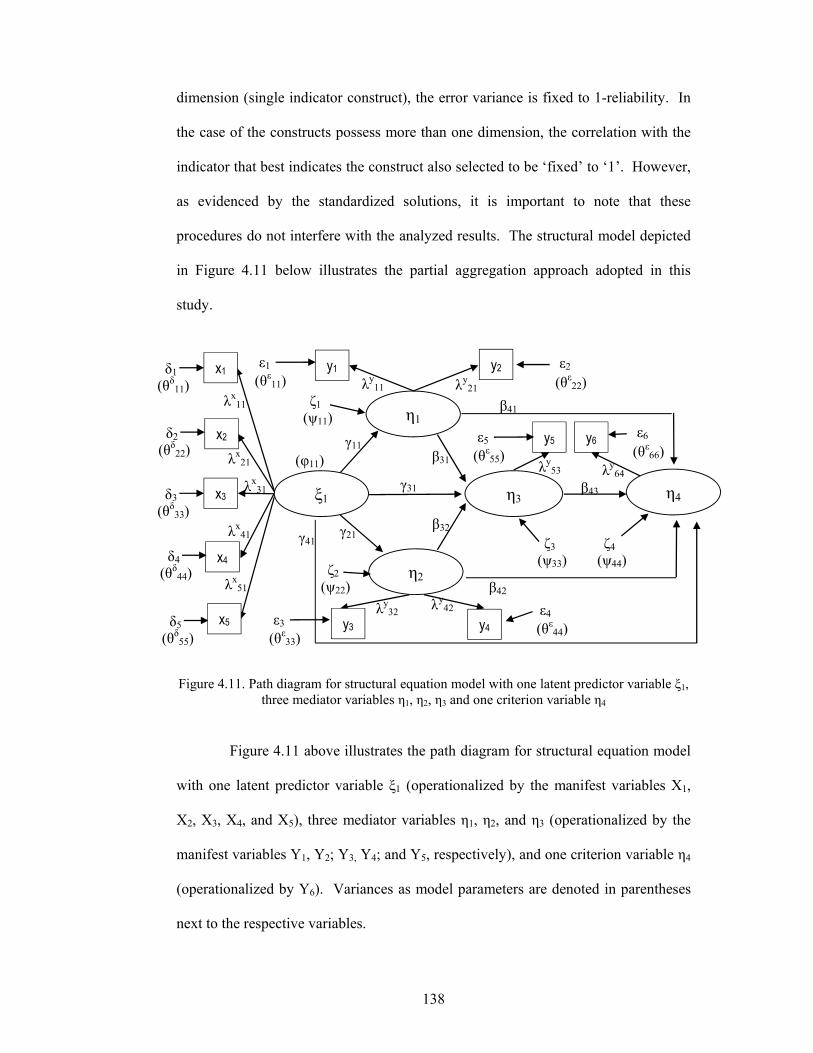
138
dimension (single indicator construct), the error variance is fixed to 1-reliability. In
the case of the constructs possess more than one dimension, the correlation with the
indicator that best indicates the construct also selected to be ‘fixed’ to ‘1’. However,
as evidenced by the standardized solutions, it is important to note that these
procedures do not interfere with the analyzed results. The structural model depicted
in Figure 4.11 below illustrates the partial aggregation approach adopted in this
study.
Figure 4.11. Path diagram for structural equation model with one latent predictor variable ξ1, three mediator variables η1, η2, η3 and one criterion variable η4
Figure 4.11 above illustrates the path diagram for structural equation model
with one latent predictor variable ξ1 (operationalized by the manifest variables X1,
X2, X3, X4, and X5), three mediator variables η1, η2, and η3 (operationalized by the
manifest variables Y1, Y2; Y3, Y4; and Y5, respectively), and one criterion variable η4
(operationalized by Y6). Variances as model parameters are denoted in parentheses
next to the respective variables.
η2
η1
y1
ξ1 η3 η4
y2
y3 y4
y5 y6
x5
x3
x4
x2
x1
λx11
λx21
λx31
λx41
λx51
λy11 λy
21
λy32
λy42
λy53 λy
64
γ11
γ21
γ31
γ41
β31
β32
β42
β41
β43
δ1
(θδ11)
δ2
(θδ22)
δ3
(θδ33)
δ4
(θδ44)
δ5
(θδ55)
(φ11)
ζ1
(ψ11)
ζ2
(ψ22)
ζ3
(ψ33) ζ4
(ψ44)
ε5
(θε55)
ε1
(θε11)
ε3
(θε33)
ε4
(θε44)
ε2
(θε22)
ε6
(θε66)
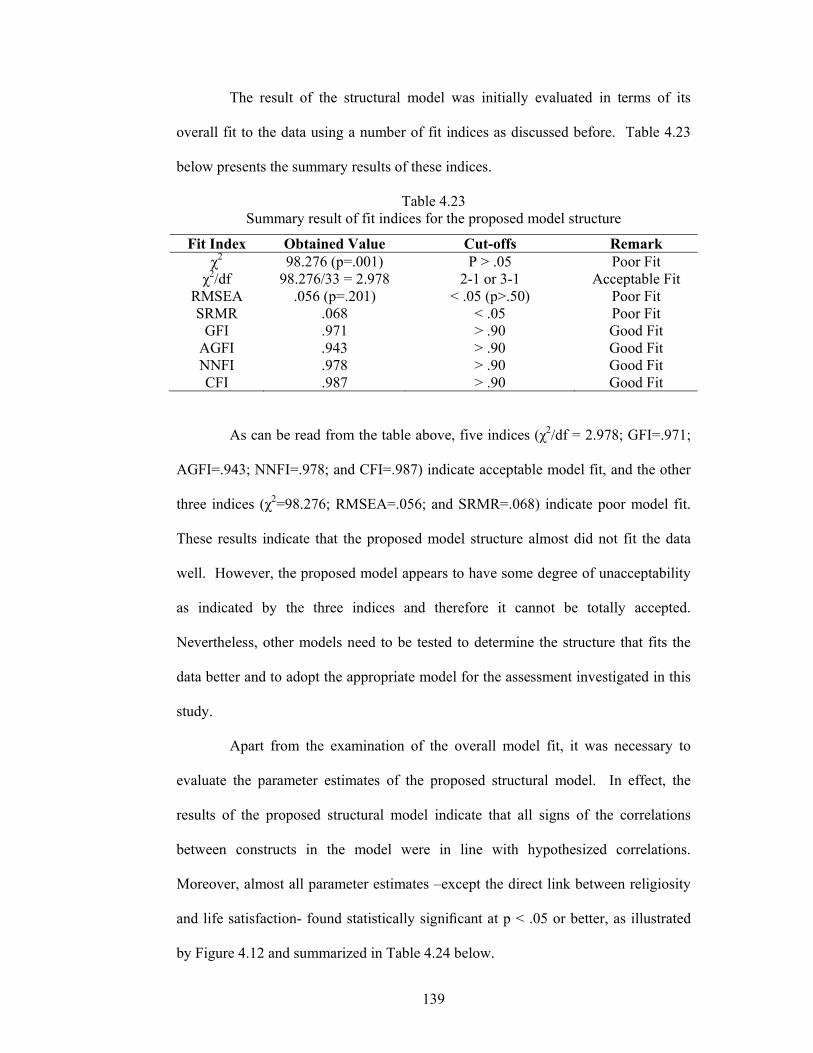
139
The result of the structural model was initially evaluated in terms of its
overall fit to the data using a number of fit indices as discussed before. Table 4.23
below presents the summary results of these indices.
Table 4.23 Summary result of fit indices for the proposed model structure
Fit Index Obtained Value Cut-offs Remark χ2 98.276 (p=.001) P > .05 Poor Fit
χ2/df 98.276/33 = 2.978 2-1 or 3-1 Acceptable Fit RMSEA .056 (p=.201) < .05 (p>.50) Poor Fit SRMR .068 < .05 Poor Fit
GFI .971 > .90 Good Fit AGFI .943 > .90 Good Fit NNFI .978 > .90 Good Fit CFI .987 > .90 Good Fit
As can be read from the table above, five indices (χ2/df = 2.978; GFI=.971;
AGFI=.943; NNFI=.978; and CFI=.987) indicate acceptable model fit, and the other
three indices (χ2=98.276; RMSEA=.056; and SRMR=.068) indicate poor model fit.
These results indicate that the proposed model structure almost did not fit the data
well. However, the proposed model appears to have some degree of unacceptability
as indicated by the three indices and therefore it cannot be totally accepted.
Nevertheless, other models need to be tested to determine the structure that fits the
data better and to adopt the appropriate model for the assessment investigated in this
study.
Apart from the examination of the overall model fit, it was necessary to
evaluate the parameter estimates of the proposed structural model. In effect, the
results of the proposed structural model indicate that all signs of the correlations
between constructs in the model were in line with hypothesized correlations.
Moreover, almost all parameter estimates –except the direct link between religiosity
and life satisfaction- found statistically significant at p < .05 or better, as illustrated
by Figure 4.12 and summarized in Table 4.24 below.
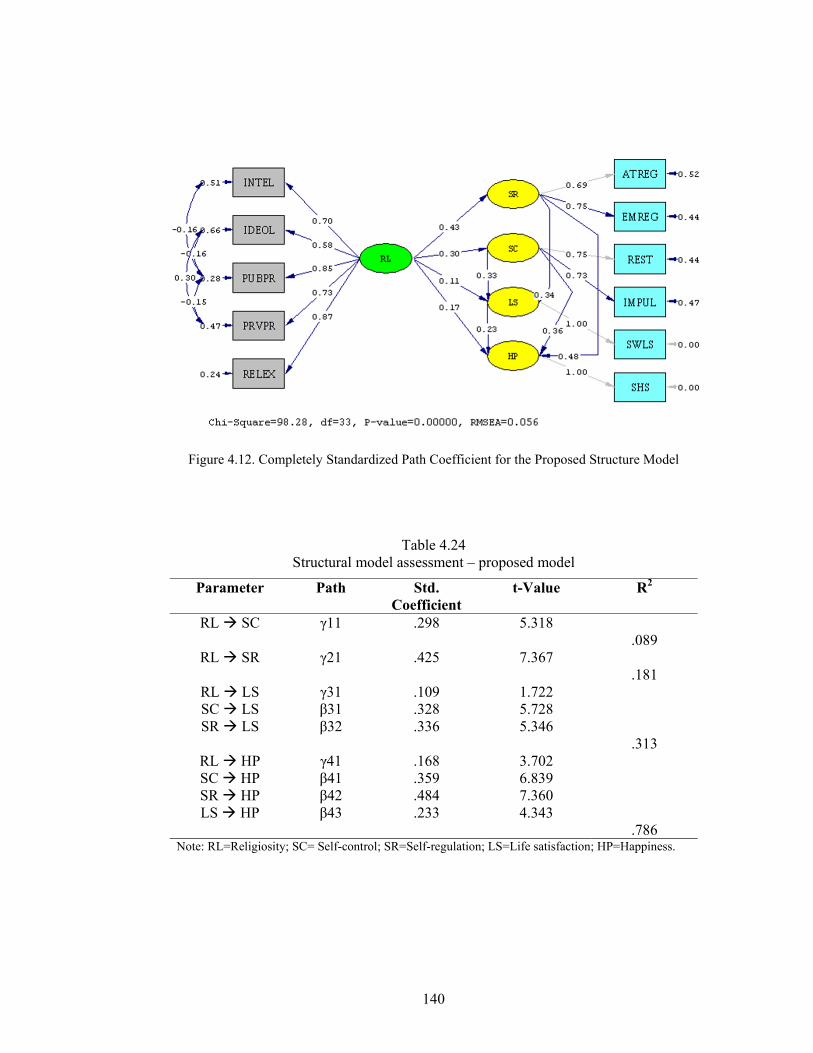
140
Figure 4.12. Completely Standardized Path Coefficient for the Proposed Structure Model
Table 4.24 Structural model assessment – proposed model
Parameter Path Std. Coefficient
t-Value R2
RL SC γ11 .298 5.318 .089
RL SR γ21 .425 7.367 .181
RL LS γ31 .109 1.722 SC LS β31 .328 5.728 SR LS β32 .336 5.346
.313 RL HP γ41 .168 3.702 SC HP β41 .359 6.839 SR HP β42 .484 7.360 LS HP β43 .233 4.343
.786 Note: RL=Religiosity; SC= Self-control; SR=Self-regulation; LS=Life satisfaction; HP=Happiness.
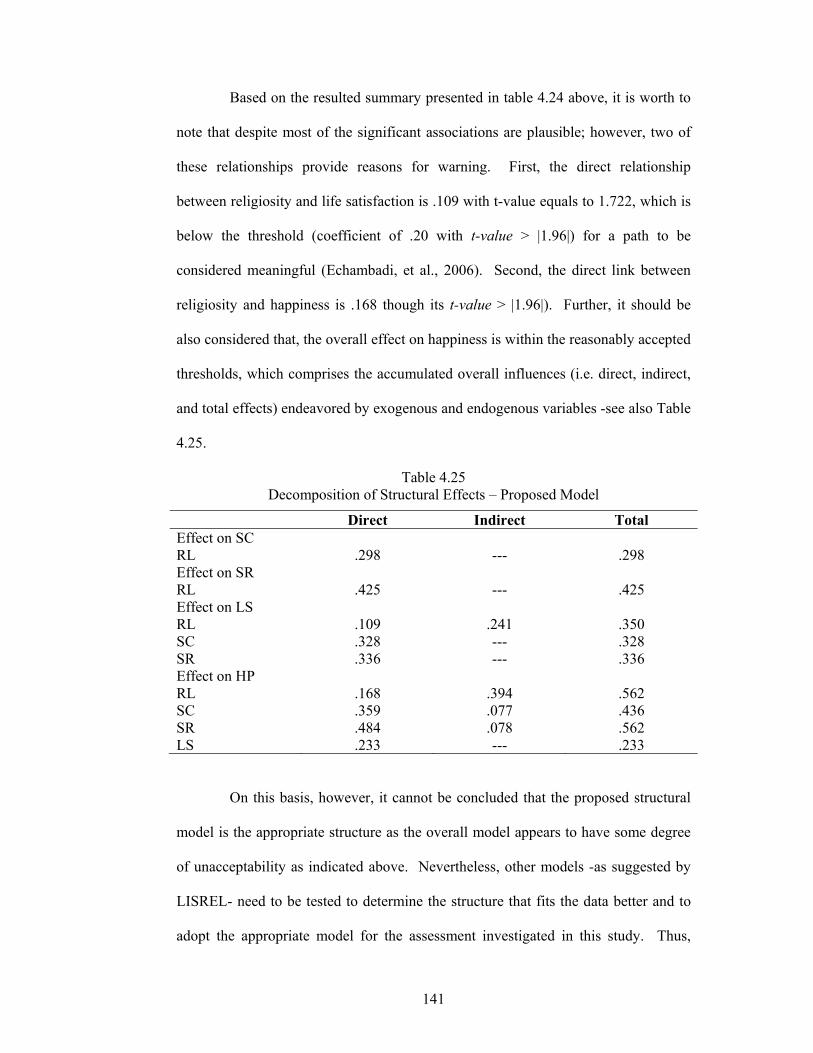
141
Based on the resulted summary presented in table 4.24 above, it is worth to
note that despite most of the significant associations are plausible; however, two of
these relationships provide reasons for warning. First, the direct relationship
between religiosity and life satisfaction is .109 with t-value equals to 1.722, which is
below the threshold (coefficient of .20 with t-value > |1.96|) for a path to be
considered meaningful (Echambadi, et al., 2006). Second, the direct link between
religiosity and happiness is .168 though its t-value > |1.96|). Further, it should be
also considered that, the overall effect on happiness is within the reasonably accepted
thresholds, which comprises the accumulated overall influences (i.e. direct, indirect,
and total effects) endeavored by exogenous and endogenous variables -see also Table
4.25.
Table 4.25 Decomposition of Structural Effects – Proposed Model
Direct Indirect Total Effect on SC RL .298 --- .298 Effect on SR RL .425 --- .425 Effect on LS RL .109 .241 .350 SC .328 --- .328 SR .336 --- .336 Effect on HP RL .168 .394 .562 SC .359 .077 .436 SR .484 .078 .562 LS .233 --- .233
On this basis, however, it cannot be concluded that the proposed structural
model is the appropriate structure as the overall model appears to have some degree
of unacceptability as indicated above. Nevertheless, other models -as suggested by
LISREL- need to be tested to determine the structure that fits the data better and to
adopt the appropriate model for the assessment investigated in this study. Thus,
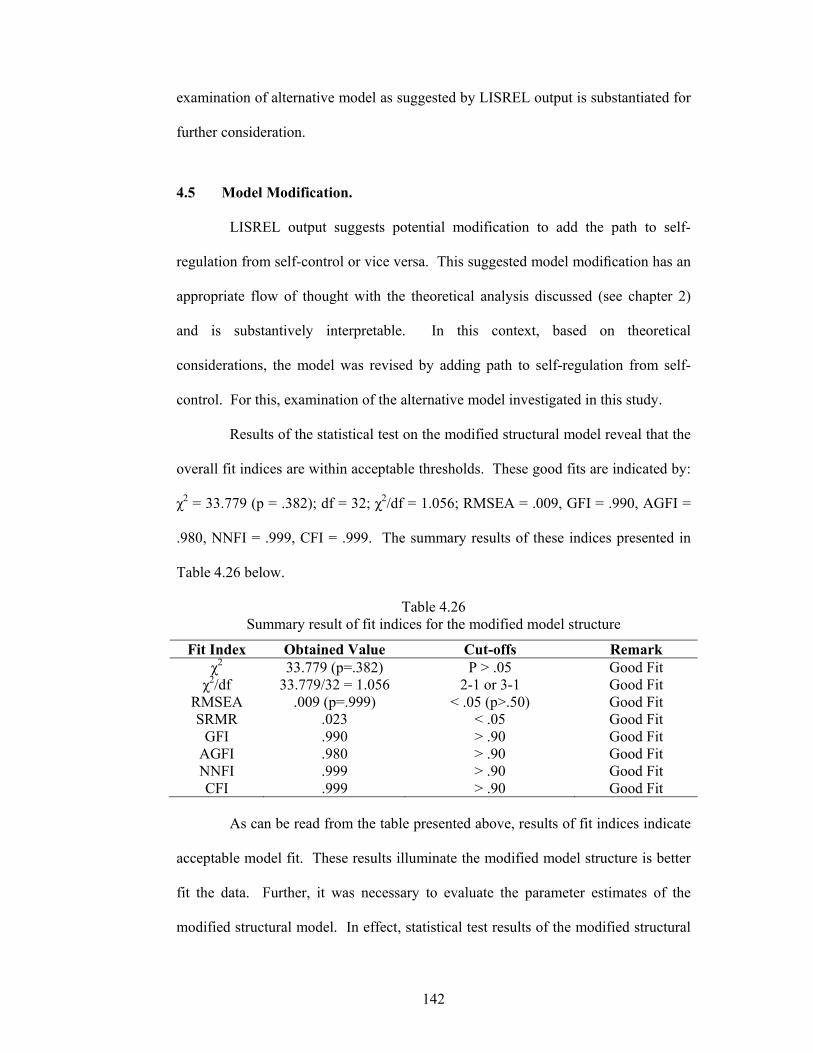
142
examination of alternative model as suggested by LISREL output is substantiated for
further consideration.
4.5 Model Modification.
LISREL output suggests potential modification to add the path to self-
regulation from self-control or vice versa. This suggested model modification has an
appropriate flow of thought with the theoretical analysis discussed (see chapter 2)
and is substantively interpretable. In this context, based on theoretical
considerations, the model was revised by adding path to self-regulation from self-
control. For this, examination of the alternative model investigated in this study.
Results of the statistical test on the modified structural model reveal that the
overall fit indices are within acceptable thresholds. These good fits are indicated by:
χ2 = 33.779 (p = .382); df = 32; χ2/df = 1.056; RMSEA = .009, GFI = .990, AGFI =
.980, NNFI = .999, CFI = .999. The summary results of these indices presented in
Table 4.26 below.
Table 4.26 Summary result of fit indices for the modified model structure
Fit Index Obtained Value Cut-offs Remark χ2 33.779 (p=.382) P > .05 Good Fit
χ2/df 33.779/32 = 1.056 2-1 or 3-1 Good Fit RMSEA .009 (p=.999) < .05 (p>.50) Good Fit SRMR .023 < .05 Good Fit
GFI .990 > .90 Good Fit AGFI .980 > .90 Good Fit NNFI .999 > .90 Good Fit CFI .999 > .90 Good Fit
As can be read from the table presented above, results of fit indices indicate
acceptable model fit. These results illuminate the modified model structure is better
fit the data. Further, it was necessary to evaluate the parameter estimates of the
modified structural model. In effect, statistical test results of the modified structural
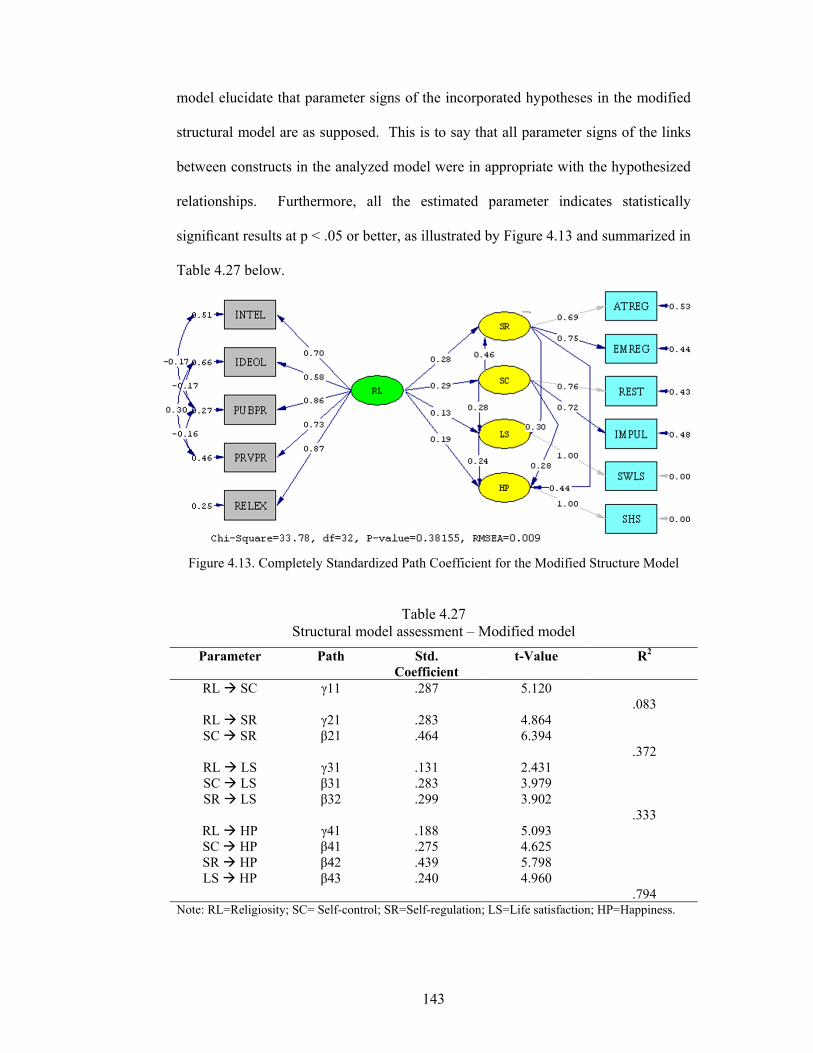
143
model elucidate that parameter signs of the incorporated hypotheses in the modified
structural model are as supposed. This is to say that all parameter signs of the links
between constructs in the analyzed model were in appropriate with the hypothesized
relationships. Furthermore, all the estimated parameter indicates statistically
significant results at p < .05 or better, as illustrated by Figure 4.13 and summarized in
Table 4.27 below.
Figure 4. 13. Completely Standardized Path Coefficient for the Modified Structure
Model
Figure 4.13. Completely Standardized Path Coefficient for the Modified Structure Model
Table 4.27 Structural model assessment – Modified model
Parameter Path Std. Coefficient
t-Value R2
RL SC γ11 .287 5.120 .083
RL SR γ21 .283 4.864 SC SR β21 .464 6.394
.372 RL LS γ31 .131 2.431 SC LS β31 .283 3.979 SR LS β32 .299 3.902
.333 RL HP γ41 .188 5.093 SC HP β41 .275 4.625 SR HP β42 .439 5.798 LS HP β43 .240 4.960
.794 Note: RL=Religiosity; SC= Self-control; SR=Self-regulation; LS=Life satisfaction; HP=Happiness.
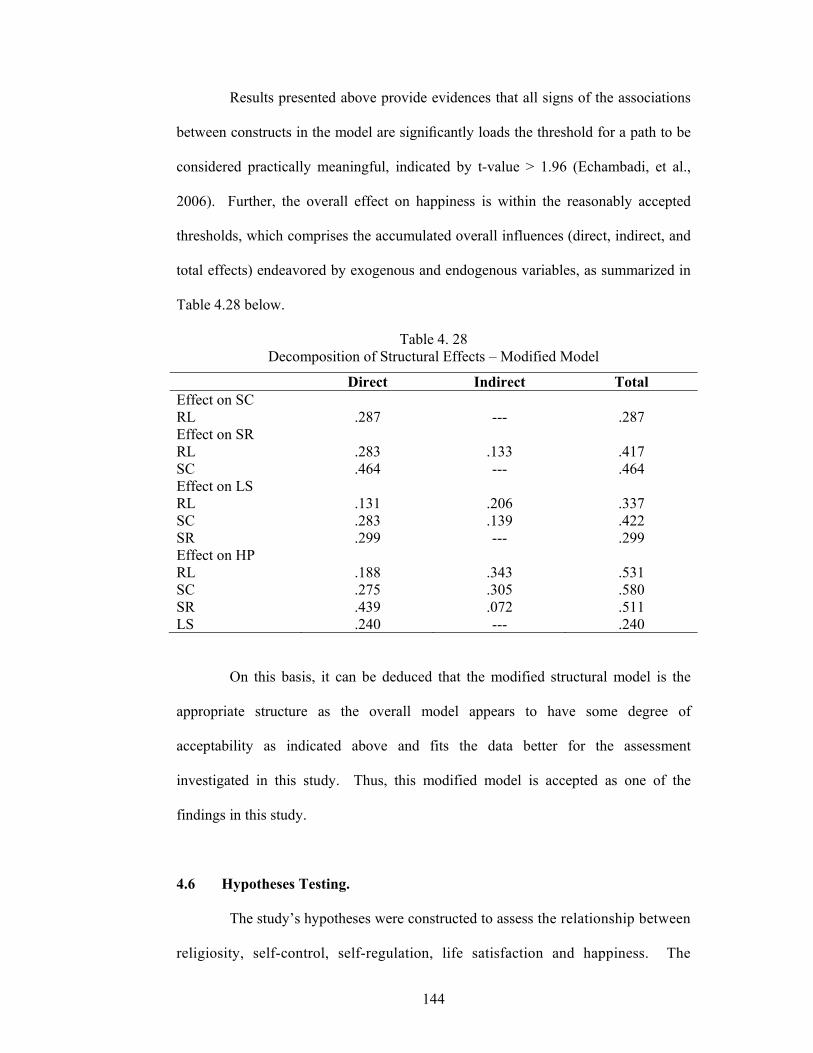
144
Results presented above provide evidences that all signs of the associations
between constructs in the model are significantly loads the threshold for a path to be
considered practically meaningful, indicated by t-value > 1.96 (Echambadi, et al.,
2006). Further, the overall effect on happiness is within the reasonably accepted
thresholds, which comprises the accumulated overall influences (direct, indirect, and
total effects) endeavored by exogenous and endogenous variables, as summarized in
Table 4.28 below.
Table 4. 28 Decomposition of Structural Effects – Modified Model
Direct Indirect Total Effect on SC RL .287 --- .287 Effect on SR RL .283 .133 .417 SC .464 --- .464 Effect on LS RL .131 .206 .337 SC .283 .139 .422 SR .299 --- .299 Effect on HP RL .188 .343 .531 SC .275 .305 .580 SR .439 .072 .511 LS .240 --- .240
On this basis, it can be deduced that the modified structural model is the
appropriate structure as the overall model appears to have some degree of
acceptability as indicated above and fits the data better for the assessment
investigated in this study. Thus, this modified model is accepted as one of the
findings in this study.
4.6 Hypotheses Testing.
The study’s hypotheses were constructed to assess the relationship between
religiosity, self-control, self-regulation, life satisfaction and happiness. The
145
analyzed mediation conducted based on the two-step approach of Structural
Equation Model (SEM) principles by means of LISREL software 8.80.
4.6.1 Hypothesis One
Hypothesis one stated that religiosity is positively related to self-control. The
higher the religiosity score a person obtained, the more likely it followed by an
increased score in self-control.
Referring to the results of data analysis presented earlier, the summary result
of structural model assessment and decomposition of structural effects as illustrated
by Table 4.27 and 4.28 above revealed that the signs of the parameter load
significantly at p < .01 (t-values = 5.120). This evidence was reinforced by the
substantial path coefficient of .287. The directionality of the relationship was
positive and the magnitude of the relationship calculated by squaring the coefficient
was an effect size of .083. This indicated that about 8.3% of the variance in self-
control was explained by the predictor variable of religiosity. Thus, this finding
rejected the null hypothesis and accepted hypothesis one that religiosity is positively
related to self-control.
4.6.2 Hypothesis Two
Hypothesis two stated that religiosity is positively related to self-regulation.
The higher the religiosity score a person obtained, the more likely it followed by an
increased score in self-regulation.
Referring to the results of data analysis presented earlier, the summary results
of structural model assessment and decomposition of structural effects as illustrated
by Table 4.27 and 4.28 above revealed that the signs of the parameter load
146
significantly at p < .01 (t-values = 4.864). This evidence was reinforced by the
substantial path coefficient of .283. The directionality of the relationship was
positive and the magnitude of the relationship calculated by squaring the coefficient
was an effect size of .174. This indicated that approximately 17.4% of the variance
in self-regulation was explained by the predictor variable of religiosity. Thus, this
finding rejected the null hypothesis and accepted hypothesis two that religiosity is
positively related to self-regulation.
4.6.3 Hypothesis Three
Hypothesis three stated that self-control and self-regulation are positively
mediated the relationship between religiosity and life satisfaction. The higher the
religiosity score a person obtained, the higher the self-control and self-regulation
score possessed, and in turn, the more likely it followed by an increased score in life
satisfaction.
Referring to the results of data analysis presented earlier, the summary results
of structural model assessment and decomposition of structural effects as illustrated
by Table 4.27 and 4.28 above, revealed that the signs of the parameter load at p < .05
(t-values = 2.431) for religiosity; and p < .01 (t-values = 3.979) for self-control; and
p < .01 (t-values = 3.902) for self-regulation. These evidences were reinforced by
the substantial path coefficient of .131 for religiosity; of .283 for self-control; and of
.299 for self-regulation. The directionality of the relationship was positive and the
magnitude of the relationship calculated by squaring the coefficient was an effect
size of .333. This indicated that approximately 33.3% of the variance in life
satisfaction was explained by the mediator and predictor variable of self-control,
self-regulation and religiosity. Thus, this finding rejected the null hypothesis and
147
accepted hypothesis three that Self-control and self-regulation are positively
mediated the relationship between religiosity and life satisfaction.
4.6.4 Hypothesis Four
Hypothesis four stated that self-control, self-regulation, and life satisfaction
are positively mediated the relationship between religiosity and happiness. The
higher the religiosity score a person obtained, the higher the self-control, self-
regulation, and life satisfaction score gained, and in turn, the more likely it followed
by an increased score in happiness.
Referring to the results of data analysis presented earlier, the summary results
of structural model assessment and decomposition of structural effects were
illustrated by Table 4.27 and 4.28 above. Results of the study revealed that the signs
of the parameter load at p < .01 (t-values = 5.093) for religiosity; and p < .01 (t-
values = 4.625) for self-control; and p < .01 (t-values = 5.798) for self-regulation;
and p < .01 (t-values = 4.960) for life satisfaction. These evidences were reinforced
by the substantial path coefficient of .188 for religiosity; of .275 for self-control; of
.439 for self-regulation; and of .240 for life satisfaction. The directionality of the
relationship was positive and the magnitude of the relationship calculated by
squaring the coefficient was an effect size of .794. This indicated that approximately
79.4% of the variance in happiness was explained by the mediator and predictor
variable of self-control, self-regulation, life satisfaction and religiosity. Thus, this
finding rejected the null hypothesis and accepted hypothesis four that self-control,
self-regulation, and life satisfaction are positively mediated the relationship between
religiosity and happiness.
148
CHAPTER 5
DISCUSSION
5.1 Introduction
This final chapter presents the discussion of the study. Firstly, summary of
findings derived from the research results are presented to address the research
questions. The findings are then discussed in relation to previous studies. Next,
theoretical and practical implications inferred from the results are presented. This is
followed by limitation and then directions for future research. Finally, conclusions
drawing from the main findings of this research are presented at the end of this
chapter.
5.2 Summary of Findings
The main research objectives of this study are to investigate the religiosity
and its possible influence on happiness by examining the mediating role of self-
control, self-regulation, and life satisfaction. Specifically, it looks into the mediating
effect of self-control, self-regulation, and life satisfaction on the relationship between
religiosity and happiness. Four research questions were formulated in line with the
research objectives as previously discussed in the chapter one.
The conceptual framework developed for the research was based on careful
consideration of the literature. In the model, relationship between variables then was
depicted. The quantitative approach was adopted to validate and to test the
interconnectedness of the research framework through the sample from people in
Medan, North Sumatera, Indonesia. Cross sectional survey, with overall 628 usable
questionnaires gathered. Further, an investigation of the measurement model using
149
confirmatory factor analysis (CFA) was performed. Subsequently, analysis based on
Structural Equation Model (SEM) principles extended to the structural model to
assess the relationship between religiosity, self-control, self-regulation, life
satisfaction, and happiness.
The results of study provide evidence that religiosity has a positive significant
relationship with happiness and this relationship is mediated by self-control, self-
regulation, and life satisfaction. These findings are briefly presented with reference
to the four research questions as follows:
Referring to hypothesis one, the result rejected the null hypothesis and accepted
hypothesis one that religiosity is positively related to self-control. It was reinforced
significantly by the substantial path coefficient of .287 (p < .01). The directionality
of the relationship was positive and the magnitude of the relationship calculated by
squaring the coefficient was an effect size of .083. This indicated that the magnitude
of variance in self-control explained by the predictor variable of religiosity was
approximately 8.3%.
Referring to hypothesis two, the results rejected the null hypothesis and
accepted hypothesis two that religiosity is positively related to self-regulation. It was
reinforced significantly by the substantial path coefficient of .283 (p < .01). The
directionality of the relationship was positive and the magnitude of the relationship
calculated by squaring the coefficient was an effect size of .174. This indicated the
magnitude of variance in self-regulation explained by the predictor variable of
religiosity was approximately 17.4%.
Referring to hypothesis three, the results again rejected the null hypothesis and
accepted hypothesis three that self-control and self-regulation are positively mediated
the relationship between religiosity and life satisfaction. It was reinforced
150
significantly by the substantial path coefficient of .131 (p < .05) for religiosity; .283
(p < .01) for self-control; and .299 (p < .01) for self-regulation. The directionality of
the relationship was positive and the magnitude of the relationship calculated by
squaring the coefficient was an effect size of .333. This indicated the magnitude of
variance in life satisfaction explained by mediator and predictor variable of self-
control, self-regulation, and religiosity was approximately 33.3%.
Lastly, to hypothesis four, the results rejected the null hypothesis and
accepted hypothesis four that self-control, self-regulation, and life satisfaction are
positively mediated the relationship between religiosity and happiness. It was
reinforced significantly by the substantial path coefficient of .188 (p < .01) for
religiosity; .275 (p < .01) for self-control; and .439 (p < .01) for self-regulation; and
.240 (p < .01) for life satisfaction. The directionality of the relationship was positive
and the magnitude of the relationship calculated by squaring the coefficient was an
effect size of .794. This indicated that approximately 79.4% of the variance in
happiness was explained by the mediator and predictor variable of self-control, self-
regulation, life satisfaction and religiosity.
5.3 Discussion
This section discusses empirical evidence derived from this study and then
relates them to previous research. It also elaborates the findings with theoretical
perspective in order to address research questions. The discussion is organized in
accordance to the research questions of the study. Each of these research questions is
presented and discussed as follow.
151
5.3.1 The Relationship between Religiosity and Self-control
The first research question was formulated to investigate if religiosity is
positively related to self-control. As such, hypothesis one was formulated.
Hypothesis one stated that religiosity is positively related to self-control. Results of
the study confirmed this hypothesis. In this study, religiosity was significantly
correlated with self-control (β = .287, p < .01). Result of squaring the coefficient had
an effect size of .083, which indicates that approximately 8.3% of the variance in
self-control was explained by religiosity. Of the two self-control factors, restraint
was the most accounted for by religiosity than impulsivity, but only slightly so (.218
and .207 respectively).
This positive correlation finding is empirically supported and consistent with
previous studies. As noted by McCullough and Willoughby (2009), this association
has been replicated among samples from a variety of religious background and
nationalities. Additionally, personality research reveals that people who possessed
high religiosity tend to have better self-control (Lodi-Smith & Roberts, 2007;
Saroglou, 2002). Possible explanations that can be offered related to this finding is
that in the face of temptation, people employ religious values to support them
performing self-control and, conversely, that religious mental content makes
temptation and stimulation to sin become less accessible (Fishbach et al., 2003).
Furthermore, Azzi and Ehrenberg (1975) explained that the ability to
postpone pleasures of desire (i.e., gratification or excitement) that underlies the
choice of behavior becomes an important dynamic for religious people who believe
in the Hereafter. Accordingly, Iannaccone (1998) argued that it should make sense
to deny temptation for short-term benefit by engaging in religiously proscribed
behavior in order to achieve long-term benefits that may exceed short-term benefits
152
associated with involvement in the behavior. Religious teachings that emphasize on
a judgment in the afterlife may improve people’s ability to exercise better self-
control so they are more likely to avoid and/or delay gratification. These links
between religiosity and the ability to postpone pleasure and delay gratification,
however, may help to explain this research finding in which religiosity influences
self-control.
Based on result obtained, it is worth to point out that the relationships
appeared stronger in other studies addressing the possibility that religiosity has
relationship with higher self-control. For example, a study conducted by Bergin, et
al., (1987) has reported the link between religiosity and The California Psychological
Inventory (r = .32) which considered as the self-control scale, and positively
correlated to self-control Schedule of Rosenbaum (r = .38). Similarly, French et al.
(2008) have found that on the basis of parent-reported and self-reported using
Indonesia’s Muslim 8th and 9th graders sample, religiosity was related to self-control
(standardized coefficient = .36). Also, other study by Aziz & Rehman (1996) have
found that religiosity was related to higher self-control (r = .35) among postgraduate
Pakistani Muslims. A slightly weaker relationship found in this study may be due to
using different analysis. However, this study examines the potential roles of the
mediating variable on the relationship between several dependent and independent
variables using structural equations model in which measurement errors is accounted.
Therefore, it can be more accurate to estimate the interaction effects among variables
involved (Chin, 1998).
153
5.3.2 The relationship between religiosity and self-regulation
The second research question was formulated to investigate if religiosity is
positively related to self-regulation. Accordingly, hypothesis two is set to address
this question. Hypothesis two stated that religiosity is positively related to self-
regulation. The resulted study confirmed this hypothesis. Based on the current
results, religiosity was significantly correlated with self-regulation (β = .283, p <
.01). Result of squaring the coefficient was an effect size of .174, which refers to
approximately 17.4% of the variance in self-regulation can be explained by
religiosity. Of the two self-regulation factors, emotional regulation was the most
accounted for by religiosity than attention regulation, but only slightly so, 0.313 and
0.287 respectively.
This positive correlation is consistent with previous finding. For example,
Chan and Woollacott (2007) found that some religious rituals influence attention
variables that are the foundation to self-regulation. Wenger (2007) also found that
scripture reading might serve self-regulatory functions. On the basis of this result, it
can be argued that belief systems of religiosity prescribe the goals that should be
achieved by sanctifying its adherents. When goal achievement in line with religious
meaning, it should reduce conflict because the integrated goals became easier to
attain (Emmons, 1999). Furthermore, religiosity predisposes selection associated
with goals; erases goals conflict by influencing the process by which the values
derived from religious teachings converted into principles those are personally
meaningful. These links between religiosity and goals, however, may help to explain
this research finding in which religiosity influences self-regulation.
Another possible explanation for the relationship is the perceived monitoring
by God fosters self-regulation. Bering and Johnson (2005) argued that belief system
154
shaped by religion prescribed that God monitors any peoples’ behavior, evaluates,
and administers rewards or sanctions. This Being, with His Omnipotence, could not
deceived by people attempts to cheat Him. Inasmuch as religious belief systems
posit God that observe humans’ behavior and pass judgment, the God should seem to
represent an evaluative audience and appeared to modify decision-making.
However, several literatures related to self-regulation explained that perception about
the presence of other people could increase person’s self-awareness and lead to act as
expected standards (Carver & Scheier, 1998). These links between religiosity and
perceived monitoring by God, however, may help to explain this research finding in
which religiosity influences self-regulation.
5.3.3 The Mediating Effect of Self-control and Self-regulation on the
Relationship between Religiosity and Life Satisfaction
Hypothesis three is set to address research question three. Hypothesis three
defined that self-control and self-regulation are positively mediated the relationship
between religiosity and life satisfaction. Results of the study confirmed this
hypothesis. The obtained results of structural model revealed path coefficient of .131
(p < .05) for religiosity; .283 (p < .01) for self-control; and .299 (p < .01) for self-
regulation. According to these obtained results, the most effect to attain life
satisfaction was contributed by self-regulation, following by self-control, and then
religiosity as the least.
This evidence is also clearly reflected in the results, which indicate that the
total effect of religiosity on life satisfaction was the substantial path coefficient of
.337 (p < .01). This result is in line with research findings by Lelkes (2006) which
found that religiosity positively increases individuals’ self-reported satisfaction.
155
Next, it is noteworthy that the total path coefficient consists of only .131 (p <
.05) for direct path, while the rest of .206 (p < .01) for indirect path, suggesting that
the relationship was partially mediated. It may means that the relationship between
religiosity and life satisfaction was varied according to the underlying mediation
role. When religiosity is related to life satisfaction, it is partially depending on its
relationship with self-control and self-regulation.
Based on findings mentioned above, the observed indirect relations between
religiosity and life satisfaction revealed that the most effect is through self-control
(.121), and then by means of self-regulation (.085). These evidences shed light on
the importance of religiosity that emphasizes more on the internalization of religious
teachings relating to fostering people’s self-control abilities to pursue life
satisfaction. Furthermore, it may relate to the notion that religion is able to prescribe
health-promoting behaviors and proscribe health-compromising ones (Hill, et al.,
2006). Moreover, another explanation for these findings is related to the strong self-
regulation that religiosity offers. It is likely that these self-qualities, which build
through religious teachings and practices, consequently help building satisfaction
with life. Thus, this finding seems to offer insight into understanding the uncertainty
about the mechanisms underlying the relationship between religiosity and life
satisfaction.
Finally, it also worth to note that result of squaring the coefficient was an
effect size of .333 that refers to approximately 33.3% of the relationship between
religiosity and life satisfaction could be illuminated based on self-control and self-
regulation. While the rest of 66.7% is determined by other factors were not included
in this study, such as gratitude, hope, positive coping (Witvliet, 2018; Li, et al.,
2016), and so on.
156
5.3.4 The Mediating Effect of Self-control, Self-regulation and Life
Satisfaction on the Relationship between Religiosity and Happiness
Finally, the fourth research question was formulated to investigate whether
self-control, self-regulation, and life satisfaction mediate the relationship between
religiosity and happiness. Accordingly, hypothesis fourth is set to address it.
Hypothesis four stated that self-control, self-regulation, and life satisfaction are
positively mediated the relationship between religiosity and happiness. Results of
the study confirmed this hypothesis. The obtained results of structural model
revealed path coefficient of .188 (p < .01) for religiosity; .275 (p < .01) for self-
control; .439 (p < .01) for self-regulation; and .240 (p < .01) for life satisfaction.
According to the results obtained, the most effect to attain happiness was contributed
by self-regulation, which is then followed by self-control, life satisfaction, and
religiosity as the least.
This evidence is also clearly reflected in the results, which indicate that the
total effect of religiosity on happiness was the substantial path coefficient of .531 (p
< .01). This positive significant effect was not surprised given that both constructs
are characterized by well-being and relative freedom from neurotic stress. In
Addition, previous meta-analysis review conducted by Ano and Vasconcelles (2005)
have deduced that religiosity positively related to positive psychological outcomes
such as life satisfaction and happiness, and on the other hand, negatively related to
negative psychological outcomes such as depression and anxiety.
However, what is worth pointing out that the total path coefficient consists of
only .188 (p < .01) for direct path, while the rest of .343 (p < .01) for indirect path,
suggesting that the relationship was partially mediated. It may imply that the
157
association between religiosity and happiness varied in accordance with the
underlying mediation role. When religiosity is relating to happiness, it is partially
depending on its relationship with self-control, self-regulation, and life satisfaction.
Thus, there were three significant indirect pathways found in this study.
First, this pathway made up through self-control and consisted of four parts.
(1) Religiosity relates to self-control, which in turn associates with happiness, the
indirect path coefficient equals to .079. (2) Religiosity relates to self-control, which
in turn associates with better self-regulation, and then more happiness, the indirect
path coefficient equals to .058. (3) Religiosity influences self-control, which
subsequently relates to self-regulation, and then become more satisfied with life, an
association that in turn influences happiness, this indirect path coefficient was .010.
(4) Religiosity relates to greater self-control, which in turn associates with higher life
satisfaction, and then become happier, the indirect path coefficient equals to .020.
Taken together, the total indirect coefficient of this pathway was .166. The findings
of this mediation pathway confirm an important piece of the relationship between
religiosity and happiness due, in part, to the propensity of religiosity to promote self-
control. It seems that when people exerting self-control, they tend to modify
responses in a manner that contains an emphasis on one goal in order to chase
another one that is considered to get more benefit in the long-term. Definitely,
Iannaccone (1998) argued that it should make sense to deny temptation for short-
term benefit by engaging in religiously proscribed behavior in order to achieve long-
term benefits that may exceed short-term benefits associated with involvement in the
behavior. Religious teachings that emphasize on a judgment in the afterlife may
improve people’s ability to exercise better self-control so they are more likely to
avoid and/or delay gratification.
158
Second, this pathway made up through self-regulation and composed of two
parts: (i) people’s religiosity relates to better self-regulation, which in turn affects
happiness, the indirect path coefficient equals to .124; and (ii) religiosity relates to
better self-regulation, which in turn related to higher satisfaction with life, and then
become happier, the indirect path coefficient equals to .020. Taken together, the total
indirect coefficient of this pathway was .145. The findings of this mediation
pathway confirm an important piece of the relationship between religiosity and
happiness was due, in part, to the propensity of people’s religiosity to enhance self-
regulation. It is likely that when people self-regulating, they are adjusting their
related behavior to achieve some preferred aim or end state (Carver & Scheier,
1998). Much of self-regulation happens in an unthinking way or somewhat
awareness (Fitzsimmons & Bargh, 2004). Perhaps, through this self-regulatory
process, the constructs of religiosity may be activated outside of awareness (Shariff
& Norenzayan, 2007), and thereby influences people happiness.
Finally, the indirect path coefficient from religiosity through life satisfaction
to happiness was .031. The finding of this mediation pathway confirms the
relationship between religiosity and happiness was due, in part, to religiosity’ ability
to promote a fulfilling life. Previous studies have confirmed that people’s life
satisfaction predisposes the experience of perceived happiness (Haybron, 2007;
Lyubomirsky, et al., 2005; Schwartz et al. 2002). Perhaps people who are religious
and satisfied with their lives, also subsequently lead them to be happier.
According to the main goal of this study, the evidences found could explain
why widespread excitements of religious behavior in Indonesia are still not
accompanied by a rise in people happiness. Specifically, why happiness remains
such a large problem in spite of rise in euphoria religious happened in Indonesia.
159
However, the findings of study offer a deeper understanding that the relationship
between religiosity and happiness may be due to important implications that
constituted by religiosity on the self-controlling processes of its adherents, which is
related to better self-regulation, and then to more satisfied with life, an association
that in turn relates to happiness. In this sense, religiosity is related to happiness and
this relationship is mediated by self-control, self-regulation, and life satisfaction.
Thus, the findings seem to offer insight into understanding the uncertainty about the
mechanisms underlying the relationship between religiosity and happiness.
Finally, it is noteworthy that result of squaring the coefficient was an effect
size of .794 that refers to approximately 79.4% of the relationship between religiosity
and happiness could be explained on the basis of self-control, self-regulation, and life
satisfaction. Meanwhile, the remaining of 20.6% is determined by other factors not
included in the study, such as gratitude, hope, positive coping (Witvliet, 2018; Li, et
al., 2016), and so on.
5.4 Implication
The findings of this study have several theoretical and practical implications.
The following section discusses the implication found in this study.
5.4.1 Theoretical Implication
Firstly, findings of this study confirmed the connections of religiosity to self-
control, self-regulation, life satisfaction, and happiness. Even though the
relationships have been found between them, but limited researches have been
conducted within the South East Asian context, particularly in the context of
Indonesia.
160
Secondly, religiosity has found to be related to life satisfaction. However, the
strength of the relationships found varies (Brough & Frame, 2004; Khatri & Fern,
2001). Therefore, findings of this study contribute new insights to theoretical
consideration that self-control and self-regulation have important role in the
relationship between religiosity and life satisfaction. Findings of this study provide
some further considerations of the variation previously noted in religiosity and life
satisfaction literature, and clearly affirm the underlying mechanisms of how the
association of religiosity with life satisfaction varies due to the mediating effects of
self-control and self-regulation.
Thirdly, religiosity has found to be an inconsistent predictor of happiness.
For example, Francis and Robbins (2000) evidenced a significant positive correlation
of religiosity with happiness. Conversely, Lewis, et al., (2000) also discovered that
religiosity and happiness have no significant association. However, it is noteworthy
that all these previous researches examined the direct link of religiosity to happiness.
The mechanisms through which religiosity operates and how religiosity influences
happiness remain in a black box. Therefore, findings of this study contribute new
insights to theoretical consideration that religiosity related to happiness through self-
control, self-regulation, and life satisfaction. These findings may illuminate some of
the contradictions previously noted in the literatures related to religiosity and
happiness. Hence, these findings are important because they shed light on the precise
nature of the how relationship between religiosity and happiness is.
Fourthly, most of researchers, from the literature review, do not distinguish
between life satisfaction and happiness. Happiness and life satisfaction have been
used interchangeably due to interrelated concepts (Lucas, et al., 2003; Staw &
Barsade, 1993). Findings of this study provide empirical evidences for this
161
conceptual difference between happiness and life satisfaction, in which life
satisfaction is an antecedent to happiness.
5.4.2 Practical Implication.
Findings in this study provide several prevention and intervention efforts that
can be utilized by ustadz in delivering Islamic da’wah, government authorities in
adopting policies and those with deep interest in developing people. These research
findings help to understand how a crisis in religiosity can be an essential factor
contributing to unhappiness that occurred in society. Lack of happiness in addition
to the rise of religiosity is considered as a potential result of religious ineffectiveness
to shape people’s conduct in everyday life. Instead of delivering religious
egocentrism and fanaticism in Islamic assembly, as it has frequently occurred so far,
religious moral values related to the self-developing, such as self-control and self-
regulation, should be emphasized more in conveying religious teachings.
Furthermore, the significant link of religiosity and happiness that mediated by
self-control and self-regulation has provided new angle for interpretation and
implementation of religious ritual more properly. Such as prayer at least five times a
day, fasting during Ramadan, giving Zakat, performing Hajj, reading religious
scriptures should refer to promote more control over emotions, appetites, and
impulses. Such interpretation and implementation of religious ritual that focus on
exercising and internalizing values contained in all of those religious rituals should
be the main focus of parents in instilling the religiosity of their children at home, of
the ustadz in shaping the religious personality of the ummah, and also the
government in formulating religious curriculum in schools, so it might thus be useful
162
and lead to increase self-control and self-regulation, and in turn affect life
satisfaction and happiness.
5.5 Limitations and Future Direction
The present study, however, has some limitations that warrant future
investigation. Firstly, the results found in this study should be construing carefully
due to the evidences provided concerning the pathways between variables are cross-
sectional research design. Future research should use longitudinal or experimental
research designs to ensure the more guaranteed causal directions.
Secondly, the main result of the present study has a weakness to be
generalized on different age groups because the participants were people aged 40
years and more. Further research with diverse samples is needed to investigate
whether the proposed model can be supported in different groups.
Thirdly, findings of this study based on a convenience sample of people from
Medan only, which limits the generalizability of the findings to other places and
cultures. There are some evidences suggested that the influences of religiosity have
a tendency to be larger in more religious societies as well to be smaller in nations
with high economic and existential security (Diener, et al., 2011). Thus, studies
investigated the generalizability of this model to other places and cultures are
required to establish a confidence in the findings reported. Future researches should
consider all of these limitations.
163
5.6 Conclusion
On the basis of this study, four conclusions can be made. Firstly, religiosity
has a positive relationship with self-control. Approximately 8.3% of the variance in
self-control was explained by religiosity. Of the two self-control factors, restraint
was the most accounted for by religiosity than impulsivity. Secondly, religiosity has
a positive relationship with self-regulation. Approximately 17.4% of the variance in
self-regulation was explained by religiosity. Of the two self-regulation factors,
emotional regulation was the most accounted for by religiosity than attention
regulation. Thirdly, religiosity has a positive relationship with life satisfaction. This
relationship is partially mediated by self-control and self-regulation. Approximately
33.3% of the relationship between religiosity and life satisfaction could be explained
based on self-control and self-regulation, in which self-control contribute more.
Fourthly, religiosity has a positive relationship with happiness. This relationship is
partially mediated by self-control, self-regulation, and life satisfaction.
Approximately 79.4% of the relationship between religiosity and happiness could be
explained on the basis of self-control, self-regulation, and life satisfaction. The most
effect was contributed by self-regulation, then by self-control, life satisfaction, and
religiosity as the least.
Briefly, the meaning of being religious based on the relationship between
religiosity and happiness may be due to implications constituted by religion on the
self-controlling and self-regulating processes of its adherents, and then related to be
more satisfied with life, an association that in turn predicted more on happiness.
164
REFERENCES
Aaidh, Q. A. (2003). Don’t be sad. Saudi Arabia: International Islamic Publishing House.
Abdel-Khalek, A. M. (2011). The development and validation of the Arabic Scale of Mental Health (ASMH). Psychological Reports, 109(3), 949-964.
Ackerman, R., & Derubeis, R. (1991). Is depressive realism real? Clinical Psychology Review, 11(5), 565–584.
Agung, W. P. (2015, September 26). Indonesia`s Hajj Management Considered To Be The Best. Tempo. Retrieved from https://en.tempo.co
Ainslie, G. (1975). Specious reward: A behavioral theory of impulsiveness and impulse control. Psychological Bulletin, 82(4), 463-496.
Aisha, S. (2011, April 11). Happiness in Islam: Happiness & Science. The Religion of Islam. Retrieved from: https://www.islamreligion.com
Alex, M. (1986). Job satisfaction, marital satisfaction, and the quality of life, in E. M. Andrews (Ed.) Research on the Quality of Life, Ann Arbor, Mich.: Institute for Social Research.
Algoe, S. B., & Haidt, J. (2009). Witnessing excellence in action: the “other-praising” emotions of elevation, gratitude, and admiration. The Journal of Positive Psychology, 4(2), 105-127.
Allport, G. W., & Ross, J. M. (1967). Personal religious orientation and prejudice. Journal of Personality and Social Psychology, 5(4): 432-443.
Anderson, J. C., & Gerbing, D. W. (1988). Structural equation modeling in practice: A review and recommended two-step approach. Psychological Bulletin, 103(3), 411-423.
Andrews, F. M., & Withey, S. B. (1976). Social Indicators of Well-Being. New York: Plenum Press.
Ano, G. G., & Vasconcelles, E. B. (2005). Religious coping and psychological adjustment to stress: A meta-analysis. Journal of Clinical Psychology, 61(4), 461-480.
Antonella, D. F., Dianne, V. B., Ingrid, B., Teresa, F., & Marie, P. W. (2011). The eudaimonic and hedonic components of happiness: qualitative and quantitative findings. Social Indicators Research, 100, 185–207
Argyle, M. (1999). Causes and correlates of happiness. In D. Kahneman, E. Diener, & N. Schwarz (Eds.), Well-being: The foundations of hedonic psychology (pp. 353-373). New York, NY, US: Russell Sage Foundation.
Argyle, M. (2001). The Psychology of Happiness (2nd ed). London: Routledge.
Argyle, M., Martin, M., & Crossland, J. (1989). Happiness as a function of personality and social encounters. In J. P. Forgas & J. M. Innes (Eds.).
165
Recent Advances in Social Psychology: An International Perspective (pp. 189-203). North-Holland: Elsevier.
Aspinwall, L. G., Richter, L., & Hoffman, R. R. (2001). Understanding how optimism works: an examination of optimists’ adaptive moderation of belief and behaviour. In E. C. Chang (Eds.). Optimism and Pessimism: Implications for Theory, Research and Practice (pp. 217-238). Washington, DC: APA.
Austin, E. J., Saklofske, D. H., & Mastoras, S. M. (2010). Emotional intelligence, coping and exam-related stress in Canadian undergraduate students. Australian Journal of Psychology, 62, 42−50.
Austin, J. T., & Vancouver, J. B. (1996). Goal constructs in psychology: Structure, process, and content. Psychological Bulletin, 120(3), 338-375.
Averill, J. R., & More, T. A. (2000). Happiness. In M. Lewis & J. M. Haviland (Eds.). Handbook of emotions (pp. 663–676). New York: The Guilford Press.
Aziz, S., & Rehman, G. (1996). Self-control and tolerance among low and high religious groups. Journal of Personality and Clinical Studies, 12(2), 83-85.
Azrin, N. H., Naster, B. J., & Jones, R. (1973). Reciprocity counseling: A rapid learning-based procedure for marital counseling. Behavior Research and Therapy, 11(4), 365-382.
Azzi, C., & Ehrenberg, R. G. (1975). Household allocation of time and church attendance. Journal of Political Economy, 83(1), 27-56.
Bagozzi, R. P., & Heatherton, T. F. (1994). A general approach to representing multifaceted personality constructs: application to state self-esteem. Structural Equation Modeling: A Multidisciplinary Journal, 1(1), 35-67.
Bagozzi, R.P., & Yi, Y. (1988). On the evaluation of structural equation model. Journal of Academy of Marketing Science, 16(1), 74-94.
Baier, C., & Wright, B. R. E. (2001). “If you love me, keep my commandments”: A meta-analysis of the effect of religion on crime. Journal of Research in Crime and Delinquency, 38(1), 3-21.
Baker, T. L. (1994). Doing Social Research (2nd ed.). New York: McGraw-Hill Inc.
Barkley, R. A. (1997). Behavioral inhibition, sustained attention, and executive functions: Constructing a unifying theory of ADHD. Psychological Bulletin, 121(1), 65-94.
Barnes, J., Cote, J., Cudeck, R., & Malthouse, E. (2001). Factor analysis: Checking assumptions of normality before conducting factor analysis. Journal of Consumer Psychology, 10(1), 79-81.
Barsade, S., & Staw, B. (1993). Affect and Managerial Performance: A Test of the Sadder-but-Wiser vs. Happier-and-Smarter Hypotheses. Administrative Science Quarterly, 38, 304-331.
166
Baumann, N. K., & Julius. (2002). Intuition, affect, and personality: Unconscious coherence judgments and self-regulation of negative affect. Journal of Personality and Social Psychology, 83(5), 1213-1223.
Baumeister, R. F., & Vohs, K. D. (2004). Self-regulation. In C. Peterson & M. E. P. Seligman (Eds.). Character Strengths and Virtues: A Handbook and Classification (pp. 499-516). Washington, DC: APA.
Baumeister, R. F., Heatherton, T. F., & Tice, D. M. (1994). Losing Control: How and why people fail at self-regulation. San Diego, CA: Academic Press.
Baumeister, R. F., Vohs, K. D., & Tice, D. M. (2007). The strength model of self-control. Current Directions in Psychological Science, 16(6), 351-355.
Baumgartner, H., & Homburg, C. (1996). Applications of structural equation modeling in marketing and consumer research: a review. International Journal of Research in Marketing, 13(2), 139-161.
Benson, J., & Bandalos, D.L. (1992). Second-order confirmatory factor analysis of the reactions to tests scale with cross-validation. Multivariate Behavioral Research, 27(3), 459-487.
Bentham, J. (1907). An Introduction to the Principles of Morals and Legislation. Oxford: Clarendon Press.
Bentler, P. M., & Chou, C. P. (1987). Practical issues in structural equation modeling. Sociological Methods and Research, 16, 78–117.
Bentler, P., Bagozzi, R. P., Cudeck, R., & Iacobucci, D. (2001). Structural equation modeling-SEM using correlation or covariance matrices. Journal of Consumer Psychology. 10(2), 85-87.
Bergan, A., & McConatha, J. T. (2001). Religiosity and life satisfaction. Activities, Adaptation and Aging, The Journal of Activities Management, 24(3): 23-34.
Bergin, A. E., Masters, K. S., Richards, P. S. (1987). Religiousness and mental health reconsidered: A study of an intrinsically religious sample. Journal of Counseling Psychology, 34(2), 197-204.
Bering, J. M., & Johnson, D. P. (2005). O Lord… You Perceive my Thoughts from Afar": Recursiveness and the Evolution of Supernatural Agency. Journal of Cognition and Culture, 5(1), 118-142
Block, J., & Kremen, A. M. (1996). IQ and ego-resilience: conceptual and empirical connections and separateness. Journal of Personality and Social Psychology, 70(2), 349-361.
Boehm, J. K., & Lyubomirsky, S. (2009). The promise of sustainable happiness. In C.R. Snyder & S. J. Lopez (Eds.), The Oxford handbook of positive psychology (pp. 667-677). Oxford, UK: Oxford University Press.
Bollen, K. A. (1989). Structural Equations with Latent Variables. New York: Wiley.
Borooah, V. K. (2006). What makes people happy? Some evidence from Northern Ireland. Journal of Happiness Studies, 7(4), 427-465.
167
BPS-Statistics of Medan City. (2016). Medan in Figures 2016. Retrieved from https://medankota.bps.go.id/publication/2016/11/28/238f97840a44eb5d187158d4/kota-medan-dalam-angka-2016.html
Bradburn, N. M., & Caplovitz, D. (1965). Reports on Happiness. Chicago: Adline.
Brajsa-Zganec, A., Lipovcan, L. K., Ivanovic, D., Larsen, Z. P. (2017). Well-Being of Nursing Students: Role of Affect Regulation, Self-Esteem, Family Cohesion and Social Support. The Open Public Health Journal, 10, 69-79.
Brandon, J. E., Oescher, J., & Loftin, J. M. (1990). The self-control questionnaire: An assessment. Health Values, 14(3), 3-9.
Brehm, J., & Rahn, W. (1997). Individual-Level Evidence for the Causes and Consequences of Social Capital. American. Journal of Political Science, 41(3), 999-1023.
Brickman, P., Coates, D., & Janoff-Bulman, R. (1978). Lottery winners and accident victims: Is happiness relative? Journal of Personality and Social Psychology, 36(8), 917-927.
Brough, P., & Frame, R. (2004). Predicting police job satisfaction and turnover intentions: The role of social support and police organisational variables. New Zealand Journal of Psychology, 33(1), 8-16.
Buss, D. (2000). The evolution of happiness. American Psychologist, 55(1), 15-23.
Campbell, A., Converse, P. E., & Rodgers, W. L. (1976) The Quality of American Life: Perceptions, Evaluations, and Satisfactions. New York, USA: Russel Sage Foundation.
Cantril, H. (1965). The pattern of human concerns. New Brunswick, NJ: Rutgers University Press.
Carver, C. S. (2005). Impulse and constraint: Perspectives from personality psychology, convergence with theory in other areas, and potential for integration. Personality and Social Psychology Review, 9(4), 312–333.
Carver, C. S., & Scheier, M. F. (1982). Control theory: A useful conceptual framework for personality–social, clinical, and health psychology. Psychological Bulletin, 92(1), 111-135.
Carver, C. S., & Scheier, M. F. (1998). On the Self-regulation of Behavior. New York: Cambridge University Press.
Chan, D., & Woollacott, M. (2007). Effects of level of meditation experience on attentional focus: is the efficiency of executive or orientation networks improved? The Journal of Alternative and Complementary Medicine, 13, 651-658.
Chen, H. C., & Bates, R. A. (2005). Instrument development strategies for cross-cultural studies. In M. L. Morris & F. M. Nafukho (Eds.), Proceedings of the Academy of Human Resource Development 2005 Annual Meeting (pp. 693-700).
168
Chin, W. W. (1998). The partial least squares approach for structural equation modeling. In GA Marcoulides (ed.), Modern Methods for Business Research, pp. 295-336. London: Lawrence Erlbaum Associates.
Christophe, M. (2017, April 13). Ethnic horizontal inequity in Indonesia. Halshs. Retrieved from: https://halshs.archives-ouvertes.fr/halshs-01508026
Cohen, S. B. (2002). Happiness and the immune system. Positive Health, 82, 9-12.
Cohen-Zada, Danny, & Sander, W. (2011). Religious participation versus shopping: What makes people happier? Journal of Law and Economics. 54, 889-906.
Compton, W., Smith, M., Cornish, K., & Qualls, D. (1996). Factor structure of mental health measures. Journal of Personality and Social Psychology, 71(2), 406-413.
Converse, P. D., Beverage, M. S., Vaghef, K., & Moore, L. S. (2018). Self-control over time: Implications for work, relationship, and well-being outcomes. Journal of Research in Personality, 73, 82-92.
Corno, L. (1994). Student volition and education: Outcomes, influences, and practices. In D. H. Schunk & B. J. Zimmerman (Eds.), Self-regulation of learning and performance: Issues and educational applications (pp. 229-251). Hillsdale, NJ, US: Lawrence Erlbaum Associates, Inc.
Corr, P. J. (2008). The Reinforcement Sensitivity Theory of Personality. Cambridge: Cambridge University Press.
Cortina, J., Chen, G., & Dunlap, W. (2001). Testing interaction effects in LISREL: examination and illustration of available procedures. Organizational Research Methods, 4(4), 324-360.
Cote, J., Netemeyer, R., & Bentler, P. (2001). Structural equation modeling - improving model fit by correlating errors. Journal of Consumer Psychology. 10(2), 87-88.
D’Onofrio, B. M., Murrelle, L., Eaves, L. J., McCullough, M. E., Landis, J. L., & Maes, H. H. (1999). Adolescent religiousness and its influence on substance use: preliminary findings from the MidAtlantic School Age Twin Study. Twin Research, 2(2), 156-168.
Danner, D., Snowdon, D., & Friesen, W. (2001). Positive emotions early in life and the longevity: findings from the nun study. Journal of Personality and Social Psychology, 80(5), 804-813.
Davina Chan & Marjorie Woollacott, (2007). Effects of level of meditation experience on attentional focus: Is the efficiency of executive or orientation networks improved? The Journal of Alternative and Complementary Medicine, 13(6), 651-657.
Davis, N. J., & Robinson, R. V. (2006). The egalitarian face of Islamic orthodoxy: Support for Islamic law and economic justice in seven Muslim-majority nations. American Sociological Review, 71, 167–190.
Deci, E. L., & Ryan, R. M. (2008). Self-determination theory: A macro-theory of human motivation, development, and health. Canadian Psychology/Psychologie canadienne, 49(3), 182-185.
169
Deutscher, I. (1973). What We Say / What We Do: Sentiments & Acts. Glenview, IL: Scott, Foresman and Company.
Diamantopoulos, A., & Siguaw, J. (2000). Introducing LISREL. London: SAGE.
Diamond, A. (2013). Executive Functions. Annual Review of Psychology, 64, 135-168.
Diener E., & Diener, M. (2009) Cross-cultural correlates of life satisfaction and self-esteem. In: Diener E. (eds) Culture and Well-Being. Social Indicators Research Series, 38, 71-91. Springer, Dordrecht.
Diener, E. (1994). Assessing subjective well-being: Progress and opportunities. Social Indicators Research, 31(2), 103-157.
Diener, E. (2000). Subjective well-being: the science of happiness and a proposal for a national index. American Psychologist, 55(1), 34–43.
Diener, E. R., Emmons, R. A., & Larsan, R. J. (1985). The Satisfaction with Life Scale. Journal of Personality Assessment, 49(1), 71-75.
Diener, E., & Seligman, M. E. P. (2004). Beyond money: Toward an economy of wellbeing. Psychological Science in the Public Interest, 5, 1–31.
Diener, E., & Suh, E. M. (1999). National differences in subjective well-being. In D. Kahneman, E. Diener, & N. Schwarz (Eds.), Well-being: The Foundations of Hedonic Psychology (pp. 434–450). New York: Sage.
Diener, E., Louis, T., & David G. M. (2011). The religion paradox: If religion makes people happy, why are so many dropping out? Journal of Personality and Social Psychology, 101(6), 1278-1290.
Diener, E., Lucas, R. E., & Scollon, C. N. (2006). Beyond the hedonic treadmill: Revising the adaptation theory of well-being. American Psychologist, 61(4), 305-314.
Diener, E., Scollon, C. N., & Lucas, R. E. (2004). The evolving concept of subjective well-being: The multifaceted nature of happiness. In P. T. Costa, & I. C. Siegler, (Eds.), Recent Advances in Psychology and Aging (pp. 188–219). Amsterdam: Elsevier.
Diener, E., Suh, E. M., Smith, H., & Shao, L. (1995). National differences in reported subjective well-being: Why do they occur? Social Indicators Research Special Issue: Global Report on Student Well-Being, 34, 7-32.
Diener, E., Suh, E. M., Lucas, R. E., & Smith, H. L. (1999). Subjective well-being: Three decades of progress. Psychological Bulletin, 125(2), 276-302.
Diener, E., Tay, L., & Myers, D. G. (2011). The religion paradox: If religion makes people happy, why are so many dropping out? Journal of Personality and Social Psychology, 101(6), 1278-1290.
Donahue, M. J. (1985). Intrinsic and extrinsic religiousness: review and meta-analysis. Journal of Personality and Social Psychology, 48(2): 400-419.
Drummond, N. (2000). Quality of life with asthma: The existential and the aesthetic. Sociology of Health and Illness, 22(2), 235-253.
170
Duckworth, A. L., & Kern, M. L. (2011). A meta-analysis of the convergent validity of self-control measures. Journal of Research in Personality, 45(3), 259-268.
Duckworth, A. L., & Seligman, M. E. P. (2006). Self-discipline outdoes IQ in predicting academic performance of adolescents. Psychological Science, 16(12), 939-944.
Durkheim, E. (1965). The elementary forms of religious life (J. W. Swain, Trans.). New York: Free Press.
Echambadi, R., Campbell, B., & Agarwal, R. (2006). Encouraging best practice in quantitative management research: an incomplete list of opportunities. Journal of Management Study, 43(8), 1801-1820.
Ellison, C. G. (1991). Religious Involvement and Subjective Wellbeing. Journal of Health and Social Behavior 32, 80-99.
Emmons, R. A. (1999). Religion in the Psychology of Personality: An Introduction. Journal of Personality, 67(6), 874-888.
Emmons, R. A., & Shelton, C. M. (2002). Gratitude and the science of positive psychology. In C. R. Snyder & S. J. Lopez (Eds.), Handbook of positive psychology (pp. 459-471). New York, NY, US: Oxford University Press.
Emmons, R. A., Cheung, C., & Keivan, T. (1998). Assessing Spirituality through Personal Goals: Implications for Research on Religion and Subjective Well-Being. Social Indicators Research, 45, 391-422.
Feeney, B. C., & Collins, N. L. (2015). A new look at social support: A theoretical perspective on thriving through relationships. Personality and Social Psychology Review, 19(2), 113-147.
Ferriss, A. L. (2002). Religion and Quality of Life. Journal of Happiness Studies, 3, 199-215.
Finkel, E. J., & Campbell, W. K. (2001). Self-control and accommodation in close relationships: An interdependence analysis. Journal of Personality and Social Psychology, 81(2), 263-277.
Finkenauer, C., Engels, R. C. M. E., & Baumeister, R. F. (2005). Parenting and adolescent externalizing and internalizing problems: The role of self-control. International Journal of Behavioral Development, 29, 58-69.
Fishbach, A., Friedman, R. S., & Kruglanski, A. W. (2003). Leading us not unto temptation: Momentary allurements elicit overriding goal activation. Journal of Personality and Social Psychology, 84, 296 –309.
Fitzsimons, G. M., & Bargh, J. A. (2004). Automatic self-regulation. In R. F. Baumeister & K. D. Vohs (Eds.), Handbook of self-regulation: Research, theory, and applications (pp. 151-170). New York, NY, US: Guilford Press.
Fordyce, M. W. (1988). A review of research on the happiness measures: A sixty second index of happiness and mental health. Social Indicators Research, 20(4), 355-381.
171
Fox, S. L. (2015). Cognitive enrichment, self-regulation, life satisfaction and aging. Dissertation. Educational Psychology Program, Faculty of Education, Simon Fraser University, Canada.
Francis, L. J., & Katz, Y. G. (1992). The relationship between personality and religiosity in an Israeli sample. Journal for the Scientific Study of Religion, 31, 153-162.
Francis, L. J., & Katz, Y. G. (2000). Internal consistency reliability and validity of the Hebrew translation of the Oxford Happiness Inventory. Psychological Reports, 87(1), 193-196.
Francis, L. J., & Robbins, M. (2000). Religion and happiness: A study in empirical theology. Transpersonal Psychology Review, 4(2), 17-22.
Francis, L. J., Brown, L. B., Lester, D., & Philipchalk, R. (1998). Happiness as a stable extraversion: A cross-cultural examination of the reliability and validity of the Oxford Happiness Inventory among students in UK, USA, Australia, and Canada. Personality and Individual Differences, 24(2), 167-171.
Frederick, S., Loewenstein, G., 1999. Hedonic adaptation. In: Kahneman, D., Diener, E., Schwarz, N. (Eds.), Foundations of Hedonic Psychology: Scientific Perspectives on Enjoyment and Suffering (pp. 302–329). New York: Russell Sage Foundation.
Fredrickson, B. (2002). Positive emotions. In C. R. Snyder and S. Lopez (eds), Handbook of Positive Psychology (pp. 120–34). New York: Oxford University Press.
French, D. C., Eisenberg, N., Vaughan, J., Purwono, U., & Suryanti, T. A. (2008). Religious involvement and the social competence and adjustment of indonesian muslim adolescents. Developmental Psychology, 44(2), 597-611.
Frey, B. S. (2008). Happiness: A Revolution In Economics. Cambridge: The MIT Press.
Frey, B. S., & Stutzer, A. (2002). Happiness and Economics: How the Economy and Institutions Affect Well-being. Princeton, N.J: Princeton University Press.
Fujita, F., & Diener, E. (2005). Life satisfaction set point: Stability and change. Journal of Personality and Social Psychology, 88, 158–164
Fujita, K. (2011). On conceptualizing self-control as more than the effortful inhibition of impulses. Personality and Social Psychology Review, 15(4), 352–366.
Gailliot, M. T., & Baumeister, R. F. (2007). Self-regulation and sexual restraint: Dispositionally and temporarily poor self-regulatory abilities contribute to failures at restraining sexual behavior. Personality and Social Psychology Bulletin, 33(2), 173-186.
Gamble, A., & Gärling, T. (2012). The relationships between life satisfaction, happiness, and current mood. Journal of Happiness Studies, 13(1), 31-45.
172
Garver, M., & Mentzer, J. (1999). Logistics research methods: employing structural equation modeling to test for construct validity. Journal of Business Logistics. 20(1), 33-57.
Geyer, A. L., & Baumeister, R. F. (2005). Religion, morality, and self-control: values, virtues, and vices. In R. F. Paloutzian & C . L . Park (Eds.), Handbook of The Psychology of Religion and Spirituality (pp. 412– 432). New York: Guilford Press.
Glock, C. Y., & Stark. R. (1965). Religion and society in tension. Chicago: Rand McNally.
Gottfredson, M. R., & Hirschi, T. (1990). A General Theory of Crime. Stanford, CA: Stanford University Press.
Grasmick, H. G., Tittle, C. R., Bursik, R. J. J., & Arneklev, B. J. (1993). Testing the core empirical implications of Gottfredson and Hirschi’s general theory of crime. Journal of Research in Crime and Delinquency, 30(1), 5-29.
Gray, J. A. (1994). Personality dimensions and emotion systems. In P. Ekman & R. J. Davidson (Eds.). The Nature of Emotion: Fundamental Questions (pp. 329–331). New York: Oxford University Press.
Greeley, Andrew, & Michael, H. 2006. Happiness and Lifestyle among Conservative Christians. Pp. 150–61 in The Truth about Conservative Christians. Chicago, IL: University of Chicago Press.
Gundelach, P., & Kreiner, S. (2004). Happiness and life satisfaction in advanced european countries. Cross-Cultural Research, 38(4), 359-386.
Hafiz, A. (2015, June 24). Semarak Ramadhan dalam negara khilafah. Hizbut tahrir Indonesia. Retrieved from http://hizbut-tahrir.or.id/
Hagger, M. S., Wood, C., Stiff, C., & Chatzisarantis, N. L. D. (2010). Ego depletion and the strength model of self-control: A meta-analysis. Psychological Bulletin, 136, 495-525.
Hair, J., Black, W., Babin, B., Anderson, R., & Tatham, R. (2006). Multivariate Data Analysis (6th ed.). Uppersaddle River, N.J.: Pearson Prentice Hall.
Haybron, D. M. (2007). Well-being and virtue. Journal of Ethics & Social Philosophy, 2(2), 1-27.
Haybron, D. M. (2013). The proper pursuit of happiness. Res Philosophica, 90(3), 387-411.
Headey, B., & Wearing, A. (1989). Personality, life events, and subjective well-being: Toward a dynamic equilibrium model. Journal of Personality and Social Psychology, 57, 731–739.
Headey, B., Schupp, J., Tucci, I., & Wagner, G. G. (2010). Authentic happiness theory supported by impact of religion on life satisfaction: A longitudinal analysis with data for Germany. The Journal of Positive Psychology, 5(1), 73-82.
Heller D., Watson D., & Hies R. (2004). The role of person versus situation in life satisfaction: A critical examination, Psychological Bulletin, 130(4), 574-600.
173
Helliwell, J., Layard, R., & Sachs, J. (2018). World Happiness Report 2018. New York: Sustainable Development Solutions Network.
Hildebrandt, L. (1987). Consumer retail satisfaction in rural areas: a re-analysis of survey data. Journal of Economic Psychology, 8(1), 19-42.
Hill, P. C., & Hood, R. W. Jr., (1999). Measures of religiosity. Birmingham, AL: Religious Education Press.
Hill, T. D., Burdette, A. M., Ellison, C. G., Musick, M. A. (2006). Religious Attendance and the Health Behaviors of Texas Adults. Preventive Medicine, 42, 309-312.
Hills, P., & Argyle, M. (2002). The Oxford Happiness Questionnaire: A compact scale for the measurement of psychological well-being. Personality and Individual Differences, 33(7), 1073-1082.
Himmel, S., & Murrel, S. A. (1983). Reliability and validity of five mental health scales in older persons. Journal of Gerontology, 38(3), 333-339.
Hoffmann, W., & Van Dillen, L. (2012). Desire: The new hot spot in self-control research. Current Directions in Psychological Science, 21(5) 317–322.
Hoffmann, W., Luhmann, M., Fisher, R. R., Vohs, K. D., & Baumeister, R. F. (2013). Yes, but are they happy? Effects of trait self‐control on affective well‐being and life satisfaction. Journal of Personality, 82(4), 265-277.
Hooks, K., Milich, R., & Lorch, E. P. (1994). Sustained and selective attention in boys with attention deficit hyperactivity disorder. Journal of Clinical Child Psychology, 23(1), 69-77.
Huber, S., & Huber, O. W. (2012) The Centrality of Religiosity Scale (CRS). Religions. 3: 710–724.
Iannaccone, L. R. (1998). Introduction to the Economics of Religion. Journal of Economic Literature, 36(3), 1465-1495.
Igbaria, M. (1990). End-user computing efectiveness: A structural equation model. International Journal of Management Science, 18(6), 637-652.
Inglehart, R. F. (2010). Faith and freedom: Traditional and modern ways to happiness. In E. Diener, D. Kahneman & J. Helliwell (Eds.), International Differences in Well-Being (pp. 351-397). Oxford, UK: Oxford University Press.
Inzlicht, M., Legault, L., & Teper, R. (2014). Exploring the mechanisms of self-control improvement. Current Directions in Psychological Science, 23(4), 302–307.
Isen, A. (2000). Positive affect and decision making. In M. Lewis and J. Haviland Jones (eds), Handbook of Emotions, 2nd.ed, (pp. 417-436). New York: Guilford.
Islam, S. M. S., & Johnson, C. A. (2003). Correlates of smoking behavior among Muslim Arab-American adolescents. Ethnicity and Health, 8(4), 319-337.
174
James, H.S., & Chymis, A. (2004). Are happy people ethical people? Evidence from North America and Europe (Working Paper No. AEWP 2004-8). Columbia, MO: University of Missouri, Department of Agricultural Economics.
James, W. (1958). The varieties of religious experience. New York: Penguin.
Jöreskog, K., & Sörbom, D. (2002). PRELIS 2: User’s Reference Guide. Lincolnwood: Scientific Software International.
Jöreskog, K., Sörbom, D., Du Toit, S., & Du Toit, M. (2001). LISREL 8: New Statistical Features. Lincolnwood: Scientific Software International.
Kahneman, D. (1999). Objective happiness. In D. Kahneman, E. Diener, & N. Schwarz (Eds.), Well-being: The Foundations of Hedonic Psychology (pp. 3-25). New York, NY, US: Russell Sage Foundation.
Kandel, E. R., James, H., Schwartz, & Jessell. (2000). Principles of Neural Science (4th ed). Mcgraw-hill health professions division.
Karoly P. (1993). Mechanisms of self-regulation: A systems view. Annual Review of Psychology, 44(1), 23-52.
Kelly, G. A. (1955). The Psychology of Personal Constructs. Oxford, England: W. W. Norton.
Keyes, C., Shmotkin, D., & Ryff, C. (2000). Optimizing well-being: the empirical encounter of two traditions. Journal of Personality and Social Psychology, 82(6), 1007-1022.
Khatri, N., & Fern, C. T. (2001). Explaining employee turnover in an Asian context, Human Resource Management Journal, 11(1), 54-74.
King, L. A. (2001). The health benefits of writing about life goals. Personality and Social Psychology Bulletin, 27, 798–807.
Klanjsek, R., Vazsonyi, A. T., & Trejos-Castillo, E. (2012). Religious orientation, low self-control, and deviance: Muslims, Catholics, Eastern Orthodox-, and “Bible Belt” Christians. Journal of Adolescence, 35(3), 671-682.
Kline, R. B. (2011). Principles and Practice of Structural Equation Modeling. New York: Guilford Publications.
Koenig, H. G., & Larson, D. B. (2001). Religion and mental health: Evidence for an association. International Review of Psychiatry, 13(2), 67-78.
Kortt, M. A., Dollery, B., & Grant, B. (2015). Religion and life satisfaction down under. Journal of Happiness Studies, 16(2), 277-293.
Kozma, A., & Stones, M. J. (1980). The measurement of happiness: The development of the Memorial University of Newfoundland Scale of Happiness (MUNSH). Journal of Gerontology, 35(6), 906-912.
Kozma, A., Stones, M. J., & McNeil, J. K. (1991). Psychological Well-Being in Later Life. Toronto, ON: Butterworths.
Krause, N. (2008). Aging in the Church: How Social Relationships Affect Health. West Conshohocken, PA: Templeton Foundation Press.
175
Krause, N., Ironson, G., & Hill, P. (2018). Religious involvement and happiness: Assessing the mediating role of compassion and helping others. The Journal of Social Psychology, 158(2), 256-270.
Krejcie, R. V., & Morgan, D. W. (1970). Determining sample size for research activities. Educational and Psychological Measurement, 30(3), 607-610.
Kuhl, J. (1992). A theory of self-regulation: Action versus state orientation, self-discrimination, and some applications. Applied Psychology: An International Review, 41(2), 97-129.
Kuhl, J., & Beckmann, J. (Eds.). (1994). Volition and Personality: Action versus State Orientation. Seattle, WA: Hogrefe & Huber.
Kuhl, J., & Fuhrmann, A. (1998). Decomposing self-regulation and selfcontrol: The Volitional Components Inventory. In: Heckhausen J, Dweck CS, Eds. Motivation and Self-Regulation Across The Life Span. pp. 15-49. Cambridge: Cambridge University Press.
Kuhl, J., & Kraska, K. (1989). Self-regulation and metamotivation: Computational mechanisms, development, and assessment. In R. Kanfer, P. L. Ackerman, & R. Cudeck (Eds.), Abilities, Motivation, and Methodology (pp. 343-374). Hillsdaie, NJ: Erlbaum
Laird, R. D., Mark, L. D., & Marrero, M. D. (2011). Religiosity, self-control, and antisocial behavior: Religiosity as a promotive and protective factor. Journal of Applied Developmental Psychology, 32(2), 78-85.
Lane, R. E. (2000). The loss of happiness in market democracies (The Yale ISPS series). New Haven: Yale University Press.
Larsen, R. J., & Ketelaar, T. (1989). Extraversion, neuroticism, and susceptibility to positive and negative mood induction procedures. Personality and Individual Differences, 10, 1221-1222.
Lawton, P. M. (2001). Emotion in later life. Current Directions in Psychological Science, 10(4), 120-123.
Layard, R. (2005). Happiness: Lessons from a New Science. New York: Penguin Books.
Layous, K., & Lyubomirsky, S. (2014). The how, why, what, when, and who of happiness: Mechanisms underlying the success of positive interventions. In J. Gruber, & J. Moscowitz, (Eds.), Positive Emotion: Integrating the Light Sides and Dark Sides (pp. 473-495). New York: Oxford University Press.
Lelkes, O. (2006). Tasting freedom: Happiness, religion, and economic transition. Journal of Economic Behavior & Organization, 59(2), 173-194.
Letzring, T. D., Block, J., & Funder, D. C. (2005). Ego-control and ego-resiliency: Generalization of self-report scales based on personality descriptions from acquaintances, clinicians, and the self. Journal of Research in Personality, 39, 395-422.
Lewis, C. A., Maltby, J., & Burkinshaw, S. (2000). Religion and happiness: still no association, Journal of Beliefs & Values, 21(2), 233-236.
176
Li, J. B., Delvecchio, E., Lis, A., Nie, Y. G., & DiRiso, D. (2016). Positive coping as mediator between self-control and life satisfaction: Evidence from two Chinese samples. Personality and Individual Differences, 97, 130-133.
Lim, C., & Putnam, R. D. (2010). Religion, social networks, and life satisfaction. American Sociological Review. 75(6), 914–933.
Lodico, M. G., Spaulding, D. T., & Voegtle, K. H. (2006). Methods in Educational Research: From Theory to Practice. San Francisco, CA: Jossey-Bass.
Lodi-Smith, J., & Roberts, B. W. (2007). Social investment and personality: A meta-analysis of the relationship of personality traits to investment in work, family, religion, and volunteerism. Personality and Social Psychology Review, 11(1), 68–86.
Logue, A. W. (1988). Research in self-control: An integrating frame-work. Behavioral & Brain Sciences, 11, 665-709.
Lu, L., & Lin, Y. Y. (1998). Family roles and happiness in adulthood. Personality and Individual Differences, 25, 195-207.
Lu, L., & Shih, J. B. (1997). Personality and happiness: Is mental health a mediator? Personality and Individual Differences, 22(2), 249-256.
Lu, L., Gilmour, R., & Kao, S. (2001). Cultural values and happiness: An East-West dialogue. The Journal of Social Psychology, 141(4), 477–493.
Lucas, R. E., Clark, A. E., Georgellis, Y., & Diener, E. (2003). Reexamining adaptation and the set point model of happiness: Reactions to changes in marital status. Journal of Personality and Social Psychology, 84, 527–539.
Lumpkin F. J., & Hunt B. J. (1989). Mobility as influence on retail patronage behavior of the elderly: Testing conventional wisdom, Journal of Academy of Science, 17, 1-12.
Luszczynska, A., Diehl, M., Gutiérrez-Doña, B., Kuusinen, P., & Schwarzer, R. (2004). Measuring one component of dispositional self-regulation: Attention control in goal pursuit. Personality and Individual Differences, 37, 555-566.
Lykken, D. & Tellegen, A. (1996). Happiness is a stochastic phenomenon. Psychological Science, 7, 186-189.
Lyubomirsky, S. (2008). The How of Happiness: A scientific approach to getting the life you want. New York: Penguin Press.
Lyubomirsky, S. (2011). Hedonic adaptation to positive and negative experiences. In S. Folkman (Ed.), Oxford Library of Psychology. The Oxford Handbook of Stress, Health, and Coping (pp. 200-224). New York, NY, US: Oxford University Press.
Lyubomirsky, S., & Lepper, H. S. (1999). A measure of subjective happiness: Preliminary reliability and construct validation. Social Indicators Research, 46(2), 137-155.
177
Lyubomirsky, S., Dickerhoof, R., Boehm, J. K., & Sheldon, K. M. (2011). Becoming happier takes both a will and a proper way: An experimental longitudinal intervention to boost well-being. Emotion, 11, 391–402.
Lyubomirsky, S., King, L., & Diener, E. (2005). The benefits of frequent positive affect: Does happiness lead to success? Psychological Bulletin, 131(6), 803-855.
Lyubomirsky, S., Tkach, C., & Dimatteo, M. R. (2006). What are the difference between happiness & self-esteem. Social Indicators Research, 78, 363-404.
MacCallum, R. C., Browne, M. W., & Sugawara, H. M. (1996). Power analysis and determination of sample size for covariance structure modeling. Psychological Methods, 1(2), 130-149.
Magnus, K., Diener, E., Fujita, F., & Pavot, W. (1993). Extraversion and neuroticism as predictors of objective life events: A longitudinal analysis. Journal of Personality and Social Psychology, 65(5), 1046-1053.
Mahon, N. E., & Yarcheski, A. (2002). Alternative theories of happiness in early adolescents. Clinical Nursing Research, 11(3), 306-323.
Maloney, P. W., Grawitch, M. J., & Barber, L. K. (2012). The multi-factor structure of the Brief Self-Control Scale: Discriminant validity of restraint and impulsivity. Journal of Research in Personality, 46(1), 111-115.
Martín, S. J., Perles, F., & Canto, J. M. (2010). Life satisfaction and perception of happiness among university students. The Spanish Journal of Psychology, 13(2), 617–28.
Maruuta, T., Colligan, R., Malinchoc, M., & Offord, K. (2000). Optimists vs pessimists: survival rate among medical patients over a 30 year period. Mayo Clinic Proceedings, 75(2), 140-143.
Maxwell, S. E., & Cole, D. A. (2007). Bias in cross-sectional analyses of longitudinal mediation. Psychological Methods, 12(1), 23-44.
McCrae, R. R., & Costa, P. T. (1991). Adding Liebe und Arbeit: The full five-factor model and well-being. Bulletin of Personality and Social Psychology, 17, 227-232.
McCullough, M. E., & Carter, E. C. (2013). Religion, self-control, and self-regulation: How and why are they related? In K. I. Pargament, J. J. Exline, & J. W. Jones (Eds.), APA Handbook of Psychology, Religion, and Spirituality: Context, Theory, and Research (pp. 123-138). Washington, DC, US: American Psychological Association.
McCullough, M. E., & Willoughby, B. L. B. (2009). Religion, self-regulation, and self-control: Associations, explanations, and implications. Psychological Bulletin, 135(1), 69-93.
McCullough, M. E., Hoyt, W. T., Larson, D. B., Koenig, H. G., & Thoresen, C. E. (2000). Religious involvement and mortality: A meta-analytic review. Health Psychology, 19(3), 211-222.
178
McDaniel, S. W., & Burnett, J. J., (1990). Consumer religiosity and retail store evaluative criteria. Journal of the Academy of Marketing Science, 18, 101-112.
McGreal, R., & Joseph, S. (1993). The Depression-Happiness Scale. Psychological Reports, 73(3), 1279-1282.
McMahon, D. M. (2006). Happiness: A History. New York: Atlantic Monthly Press.
Meeberg, G. A. (1993). Quality of life: A concept analysis. Journal of Advanced Nursing, 18(1), 32–38.
Mehrangiz, S., Mehravar, M. J., Raziyeh, K. F., & Ebrahimi, T. (2013). The relationship between happiness, meta-cognitive skills (self-regulation, problem-solving) and academic achievement of students in Tehran. Life Science Journal, 10(4), 452-457.
Metcalfe, J., & Mischel, W. (1999). A hot/cool-system analysis of delay of gratification: dynamics of willpower. Psychological Review, 106, 3-19.
Mischel, W., Shoda, Y., & Rodriguez, M. (1989). Delay of gratification in children. Science, 244, 933-938.
Mufti, K. (2006, November 06). Happiness in Islam: Concepts of Happiness. The Religion of Islam. Retrieved from: https://www.islamreligion.com
Myers D. G., & Diener, E. (1995). Who is Happy. Journal of Psychological Science, 6(1), 10-19.
Myers, D. G. (1992). The pursuit of happiness: Discovering the pathways to wellbeing and enduring personal joy. New York: Harper Collins Publishers.
Myers, D. G. (2000). The funds, friends and faith of happy people. American Psychologist, 55(1), 56–67.
Natvig, G. K., Albrektsen, G., & Qvarnstrom, U. (2003). Associations between psychosocial factors and happiness among school adolescents. International Journal of Nursing Practice, 9(3), 166-175.
Nes, R. B., Røysamb, E., Tambs, K., Harris, J. R., & Reichborn-Kjennerud, T. (2006). Subjective wellbeing: Genetic and environmental contributions to stability and change. Psychological Medicine, 36(7), 1033-1042.
O’Toole, J. (2005). Creating the good life: Applying Aristotle’s wisdom to find meaning and happiness (pp. 28-50). New York: Rodale.
Okulicz-Kozaryn, A. (2010). Religiosity and life satisfaction across nations. Mental Health, Religion & Culture, 13,2, 155-169.
Ostir, G., Markides, K., Black, S., & Goodwin, J. (2000). Emotional well-being predicts subsequent functional independence and survival. Journal of the American Geriatrics Society, 48(5), 473-478.
Pargament, K. I. (2001). The Psychology of Religion and Coping: Theory, Research, Practice. New York: Guilford Press.
179
Patton, J. H., Stanford, M. S., & Barratt, E. S. (1995). Factor structure of the Barratt Impulsiveness Scale. Journal of Clinical Psychology, 51(6), 768-774.
Pavot, W., & Diener, E. (1993). Review of the satisfaction with life scale. Psychological Assessment, 5(2), 164.
Pavot, W., & Diener, E. (2008). The satisfaction with life scale and the emerging construct of life satisfaction. The Journal of Positive Psychology, 3, 137-152.
Pearson, Q. M. (2008). Role overload, job satisfaction, leisure satisfaction, and psychological health among employed women. Journal of Counseling & Development, 86(1), 57-63.
Pelly, U. (1985). Sejarah Kota Madya Medan, 1950-1979. Departemen Pendidikan dan Kebudayaan R.I., Proyek Inventarisasi dan Dokumentasi Sejarah Nasional, Direktorat Sejarah dan Nilai Tradisional.
Peterson, C., Park, N., & Seligman, M. E. (2005). Orientations to happiness and life satisfaction: The full life versus the empty life. Journal of Happiness Studies, 6, 25–41.
Piliavin, J. A. (2003). Doing well by doing good: Benefits for the benefactor. In Keyes, Corey L. M. (Eds.), Flourishing: Positive Psychology and the Life Well-Lived, (pp. 227-247). Washington, DC, US: American Psychological Association.
Ping, R. A. (2004). On assuring valid measures for theoretical models using survey data. Journal of Business Research, 57(2), 125-141.
Plonim, R., & Nesselroade, J. R. (1990). Behavioral genetics and personality change. Journal of Personality, 58(1), 191-220.
Powell, L. H., Shahabi, L., & Thoresen, C. E. (2003). Religion and spirituality: Linkages to physical health. American Psychologist, 58(1), 36-52.
Praskova, A., Creed, P. A., & Hood, M. (2015). Self-regulatory processes mediating between career calling and perceived employability and life satisfaction in emerging adults. Journal of Career Development, 42, 86-101.
Pratt, T. C., & Cullen, F. T. (2000). The empirical status of Gottfredson and Hirschi’s general theory of crime: A meta-analysis. Criminology, 38(3), 931-964.
Preacher, K. J., Rucker, D. D., & Hayes, A. F. (2007). Addressing moderated mediation hypotheses: theory, methods, and prescriptions. Multivariate Behavioral Research, 42(1), 185-227.
Putnam, R. (2000) Bowling Alone: The Collapse and Revival of American Community. New York: Simon & Schuster.
Qayyim, I. J,. (1990). Al-Jawabu Al-Kafi li Man Saala an Dawâi. As-Shafi, Beirut: Dar Al-Ihyâi Ulûm.
Rachlin H. (2000). The Science of Self-Control. Harvard University Press: Cambridge, MA.
180
Ramezani, S. G., & Gholtash, A. (2015). The relationship between happiness, self-control and locus of control. International Journal of Education and Psychology, 1(2), 100-104.
Roberts, B. W., & Robins, R. W. (2000). Broad dispositions, broad aspirations: The intersection of personality traits and major life goals. Personality and Social Psychology Bulletin, 26(10), 1284–1296.
Roberts, B. W., Walton, K. E., Viechtbauer, W. (2006). Patterns of mean-level change in personality traits across the life course: A meta-analysis of longitudinal studies. Psychological Bulletin, 132(1), 1-25.
Roscoe, J. T. (1975). Fundamental Research Statistics for the Behavioural Sciences (2nd edition). New York: Holt Rinehart & Winston.
Rosnow, R. L., & Rosenthal, R. (2008). Beginning Behavioral Research: A Conceptual Primer (6th ed.). Upper Saddle River, NJ: Pearson Prentice-Hall.
Ryan, R. M., & Deci, E. L. (2008). A self-determination theory approach to psychotherapy: The motivational basis for effective change. Canadian Psychology, 49, 186-193.
Ryan, R. M., Rigby, S., & King, K. (1993). Two types of religious internalization and their relations to religious orientations and mental health. Journal of Personality and Social Psychology, 65(3), 586-596.
Ryff, C. D. (1989). Happiness is everything, or is it? Explorations on the meaning of psychological well-being. Journal of Personality and Social Psychology, 57(6), 1069-1081.
Ryff, C. D., & Keyes, C. (1995). The structure of psychological well-being revisited. Journal of Personality and Social Psychology, 69(4), 719-727.
Sander, W. (2017). Religion, religiosity, and happiness. Review of Religious Research, 59(2), 251-262.
Sarafino, E. (2002). Health Psychology (4th ed). New York: Wiley.
Saroglou, V. (2002). Religion and the five factors of personality: A meta-analytic review. Personality and Individual Differences, 32(1), 15-25.
Saroglou, V., Delpierre, V., Dernell, R. (2004). Values and religiosity: a meta-analysis of studies using Schwartzs model. Personality and Individual Differences, 37, 721-734.
Sasongko, A. (2015, February 02). Ini pandangan Thomas Stamford Raffles soal haji. Republika online. Retrieved from http://www.republika.co.id/ berita/jurnal-haji/
Satorra, A., & Bentler, P. M. (1988). Scaling corrections for chi-square statistics in covariance structure analysis. ASA 1988 Proceedings of the Business and Economic Statistics, Section (308-313). Alexandria, VA: American Statistical Association.
Scheier, M. F., & Carver, C. S. (1993). On the power of positive thinking. The benefits of being optimistic. Current Directions in Psychological Science, 2(1), 26-30.
181
Schimmack, U., Oishi, S., Furr, R. M., & Funder, D. C. (2004). Personality and life satisfaction: A facet-level analysis. Personality and Social Psychology Bulletin, 30, 1062–1075.
Schmeichel, B. J., & Baumeister, R. F. (2004). Self-regulatory strength. In Baumeister, R. F., & Vohs, K. D. (Eds.), Handbook of Self-Regulation: Research, Theory, and Applications (pp. 84-98). New York: Guilford Press.
Schwartz, B., Ward, A., Monterosso, J., Lyubomirsky, S., White, K., & Lehman, D. R. (2002). Maximizing versus satisficing: Happiness is a matter of choice. Journal of Personality and Social Psychology, 83(5), 1178-1197.
Schwarzer, R., Diehl, M., & Schmitz, G. S. (1999). Self-Regulation Scale. Retrieved from http://userpage.fu-berlin.de/~health/selfreg_e.htm.
Sears, D. O. (1986). College sophomores in the laboratory: Influences of a narrow data base on social psychology's view of human nature. Journal of Personality and Social Psychology, 51(3), 515-530.
Sekaran, U. (2003). Research Methods for Business: A Skill Building Approach (3th Ed.). New York: John Wiley & Sons, Inc.
Seligman, M. E. P. (1998). President’s column: Building human strength: Psychology’s forgotten mission. APA Monitor, 29(1), 1.
Seligman, M. E. P. (2002). Authentic Happiness: Using the New Positive Psychology to Realise your Potential for Lasting Fulfilment. New York: Free Press.
Seligman, M. E. P. (2011). Flourish: A Visionary New Understanding of Happiness and Well-Being. NY: Free Press.
Shahrooz, N., & Farnaz, M. M. (2016). The Relationship between Life Satisfaction and Happiness: The Mediating Role of Resiliency. International Journal of Psychological Studies, 8(3), 194-201.
Shanker, S. (2016). Self-Reg: How to help your child (and you) break the stress cycle and successfully engage with life. Toronto: Penguin Random House.
Shariff, A. F., & Norenzayan, A. (2007). God is watching you: Priming God concepts increases prosocial behavior in an anonymous economic game. Psychological Science, 18(9), 803–809.
Sheldon, K. M., & Lyubomirsky, S. (2006). How to increase and sustain positive emotion: The effects of expressing gratitude and visualizing best possible selves. The Journal of Positive Psychology, 1, 73–82.
Shin, D., & Johnson, M. D. (1978). Avowed happiness as an overall assessment of the quality of life. Social Indicators Research, 5, 475-492.
Sieff, E. M., Dawes, R. M., & Loewenstein, G. (1999). Anticipated versus actual reaction to HIV test results. The American Journal of Psychology, 112(2), 297–311.
Sillick, W. J., & Cathcart, S. (2013). The relationship between religiosity and happiness: The mediating role of purpose in life. Mental Health, Religion & Culture, 17(5), 494-507.
182
Sillick, W. J., Stevens, B. A., & Cathcart, S. (2016). Religiosity and happiness: A comparison of the happiness levels between the religious and the nonreligious. The Journal of Happiness & Well-Being, 4(1), 115-127.
Sin, N. L., & Lyubomirsky, S. (2009). Enhancing well-being and alleviating depressive symptoms with positive psychology interventions: A practice-friendly meta-analysis. Journal of Clinical Psychology: In Session, 65, 467–487.
Sin, N. L., Jacobs, K. M., & Lyubomirsky, S. (2011). House and happiness: A differential diagnosis. In Martin, L. L., & Cascio, T. (Eds.), House and Psychology (pp. 77-94). New York: Wiley.
Singh, K. (2007). Quantitative Social Research Methods. Los Angeles, CA: Sage.
Sinnewe, E., Kortt, M. A., & Dollery, B. (2015). Religion and Life Satisfaction: Evidence from Germany. Social Indicators Research, 123(3), 837-855.
Sirgy, M. J. (1998). Materialism and Quality of Life. Social Indicators Research, 43, 227-260.
Smith, T. B., McCullough, M. E., & Poll, J. (2003). Religiousness and depression: Evidence for a main effect and the moderating influence of stressful life events. Psychological Bulletin, 129(4), 614-636.
Stark, R., & Glock, C. Y., (1968). American Piety: The Nature of Religious Commitment. Berkeley, CA: University of California Press.
Staw, B. M., & Barsade, S. G. (1993). Affect and managerial performance: A test of the sadder-but-wiser vs. happier-and-smarter hypothesis. Administrative Science Quarterly, 38, 304-331.
Staw, B., Sutton, R., & Pelled, L. (1994). Employee positive emotion and favourable outcomes at the workplace. Organization Science, 5(1), 51-71.
Steenkamp, J., & van Trijp, H. (1991). The use of LISREL in validating marketing constructs. International Journal of Research in Marketing, 8(4), 283-299.
Stock, W. A., & Okun, M. A. (1982). The construct validity of life satisfaction among the elderly. Journal of Gerontology, 37(5), 625-627.
Stutzer, A., & Frey, B. S. (2002). Happiness and Economics: How The Economy and Institutions Affect Well-Being. Princeton: Princeton Univ. Press.
Suh, E., Diener, E., & Fujita, F. (1996). Events and subjective well-being: Only recent events matter. Journal of Personality and Social Psychology, 70(5), 1091-1102.
Suh, E., Diener, E., Oishi, S., & Triandis, H. C. (1998). The shifting basis of life satisfaction judgments across cultures: Emotions versus norms. Journal of Personality and Social Psychology, 74(2), 482-493.
Sutowo, I., & Wibisono, S. (2013). Perilaku Agresif Anggota Organisasi Kemasyarakatan di Provinsi Yogyakarta. Humanitas, X(2), 31-44.
183
Tangney, J., Baumeister, R. F., & Boone, A. L. (2004). High self-control predicts good adjustment, less pathology, better grades, and interpersonal success. Journal of Personality, 72(2), 271-324.
Tannsjo, T. (2007). Narrow hedonism. Journal of Happiness Studies, 8(1), 79-98.
Tatarkiewicz, W. (1976). Analysis of Happiness. The Hague, Netherlands: Martinus Nijhoff.
Tekke, M., Francis, L. J., & Robbins. M. (2018). Religious affect and personal happiness: A replication among Sunni students in Malaysia. Journal of Muslim Mental Health, 11(2), 3-15.
Tice, D. M., & Bratslavsky, E. (2000). Giving in to Feel Good: The Place of Emotion Regulation in the Context of General Self-Control. Psychological Inquiry, 11(3), 149-159.
Tice, D. M., Baumeister, R. F., Shmueli, D., & Muraven, M. (2007). Restoring the self: Positive affect helps improve self-regulation following ego depletion. Journal of Experimental Social Psychology, 43(3), 379-384.
Tkach, C. T. (2006). Unlocking the treasury of human kindness: Enduring improvements in mood, happiness, and self-evaluations. Dissertation Abstracts International: Section B: The Sciences and Engineering, 67(1-B), 603.
Tkach, C., & Lyubomirsky, S. (2006). How do people pursue happiness?: Relating personality, happiness-increasing strategies, and well-being. Journal of Happiness Studies, 7(2), 183-225.
Tov, W., & Diener, Ed.(2007). Subjective Well-Being and Peace. Paper presented at the University of Illinois-University of Michigan Culture Conference, Champaign, Illinois.
Triandis, H. (2000). Cultural syndromes and subjective well-being. In Diener. E., & Suh, E., (eds), Culture and Subjective Well-being (pp. 13-36). Cambridge, MA: MIT Press.
Ulrich, R., Dimberg, U., & Driver, B. (1991). Psychophysiological indicators of leisure benefits. In Driver, B., Brown, P., & Peterson, G. (eds), Benefits of Leisure (pp. 73–89). State College, PA: Venture Publishing.
Umi, S., (2010, August 06). Agama dan kekerasan komunal. Fakultas Syariah. Retrieved from http://syariah.uin-malang.ac.id/
Underwood, B., & Froming, W. J. (1980). The mood survey: A personality measure of happy and sad mood. Journal of Personality Assessment, 44(4), 404-414.
Veenhoven, R. (1991). Questions on happiness: Classical topic, modern answers, blind spots. In Argyle, M., Schwarz, N., & Strack, F. (Eds.), Subjective Well-Being: An Interdisciplinary Perspective (pp.7-26), International series in experimental social psychology. Oxford: Pergamon.
184
Veenhoven, R. (2014). Greatest Happiness For The Greatest Number. In: Alex C. M. (Eds.) Encyclopedia of Quality of Life and Well-Being Research (pp. 2612-2613). Dordrecht, Netherlands: Springer Reference Series.
Vitterso, J. (2013). Functional wellbeing: Happiness as feelings, evaluations, and functioning. In David, S., Boniwell, I., & Conley, A. A. (Eds.), Oxford handbook of happiness (pp. 227-244). Oxford: Oxford University Press.
Wagener, L. M., Furrow, J. L., King, P. E., Leffert, N., & Benson, P. (2003). Religious involvement and developmental resources in youth. Review of Religious Research, 44(3), 271-284.
Walsh, R. (2011). Lifestyle and mental health. American Psychologist, 66(7), 579-592.
Waterman, A. S. (1990). The relevance of Aristotle's conception of eudaimonia for the psychological study of happiness. Theoretical and Philosophical Psychology, 10(1), 39-44.
Watterson, K., & Giesler, R. B. (2012). Religiosity and self-control: when the going gets tough, the religious get self-regulating. Psychology of Religion and Spirituality, 4(3), 193-205.
Wenger, J. L. (2007). The implicit nature of intrinsic religious pursuit. The International Journal for the Psychology of Religion, 17, 47-60.
Westermann, R., Spies, K., Stahl, G. & Hesse, F. W. (1996). Relative effectiveness and validity of mood induction procedures: a meta-analysis. European Journal of Social Psychology, 26(4), 557–580.
Wiese, C. W., Tay, L., Duckworth, A. L., D’Mello, S., Kuykendall, L., Hoffmann, W., Baumeister, R. F., & Vohs, K. D. (2017). Too much of a good thing? Exploring the inverted‐U relationship between self‐control and happiness. Journal of Personality, 86(3), 380-396.
Wilkes, R. E., Burnett, J. J., & Howell, R. D. (1986). On the meaning and measurement of religiosity in consumer research. Journal of the Academy of Marketing Science, 14(1), 47-56.
Witvliet, C. V., Richie, F. J., Luna, L. M., & Tongeren, D. R. (2018). Gratitude predicts hope and happiness: A two-study assessment of traits and states. The Journal of Positive Psychology, 1743-9760.
Wood, J. V. (1996). What is social comparison and how should we study it? Personality and Social Psychology Bulletin, 22(5), 520-537.
Worthington, E. L., Wade, N. G., Hight, T. L., McCullough, M. E., Berry, J. T., Ripley, J. S., Berry, J. W., Schmitt, M. M., & Bursley, K. H. (2003). The Religious Commitment Inventory-10: development, refinement and validation of a brief scale for research and counseling. Journal of Counseling Psychology, 50(1), 84-96.
Wortman, C. B., Silver, R. C., & Kessler, R. C. (1993). The meaning of loss and adjustment to bereavement. In M. S. Stroebe, W. Stroebe, & R.O. Hansson (Eds.), Bereavement: A Sourcebook of Research and Interventions (pp. 349–366). London: Cambridge University Press.
185
Yamane, T. (1967). Statistic, An Introductory Analysis (2nd Ed.). New York: Harper and Row.
Yamkovenko, B. V., Holton, E., & Bates, R. A. (2007). The Learning Transfer System Inventory (LTSI) in Ukraine: The cross-cultural validation of the instrument. Journal of European Industrial Training, 31, 377-401.
Yenni, K. (2016, December 13). The Blasphemy Trial of Jakarta’s Governor Puts Indonesian Secularism in a Shockingly Poor Light. Time. Retrieved from: http://time.com/4598716/ahoktrial-governor-jakarta-indonesia-blasphemy-islam/
Yousaf, A. A. (2006). The Holy Qur’an, Text, Translation & Commentary. Lahore: Sh.M Ashraf.
Zhao, J., Kong, F., & Wang, Y. (2013). Shyness and subjective well-being: The role of emotional intelligence and social support. Social Indicators Research, 114(3), 891-900.
Zimmerman, M. A. (1995). Psychological empowerment: Issues and illustrations. American Journal of Community Psychology, 23, 581-599.
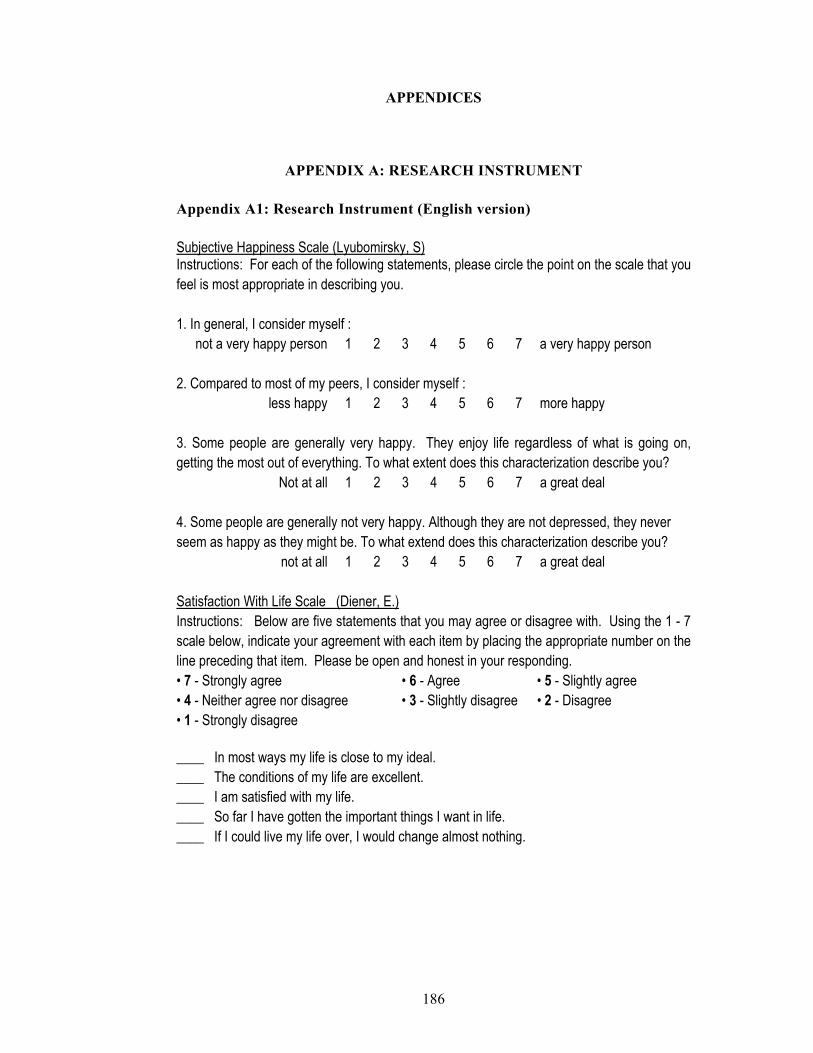
186
APPENDICES
APPENDIX A: RESEARCH INSTRUMENT
Appendix A1: Research Instrument (English version)
Subjective Happiness Scale (Lyubomirsky, S) Instructions: For each of the following statements, please circle the point on the scale that you feel is most appropriate in describing you. 1. In general, I consider myself :
not a very happy person 1 2 3 4 5 6 7 a very happy person 2. Compared to most of my peers, I consider myself :
less happy 1 2 3 4 5 6 7 more happy 3. Some people are generally very happy. They enjoy life regardless of what is going on, getting the most out of everything. To what extent does this characterization describe you?
Not at all 1 2 3 4 5 6 7 a great deal 4. Some people are generally not very happy. Although they are not depressed, they never seem as happy as they might be. To what extend does this characterization describe you?
not at all 1 2 3 4 5 6 7 a great deal Satisfaction With Life Scale (Diener, E.) Instructions: Below are five statements that you may agree or disagree with. Using the 1 - 7 scale below, indicate your agreement with each item by placing the appropriate number on the line preceding that item. Please be open and honest in your responding. • 7 - Strongly agree • 6 - Agree • 5 - Slightly agree • 4 - Neither agree nor disagree • 3 - Slightly disagree • 2 - Disagree • 1 - Strongly disagree ____ In most ways my life is close to my ideal. ____ The conditions of my life are excellent. ____ I am satisfied with my life. ____ So far I have gotten the important things I want in life. ____ If I could live my life over, I would change almost nothing.
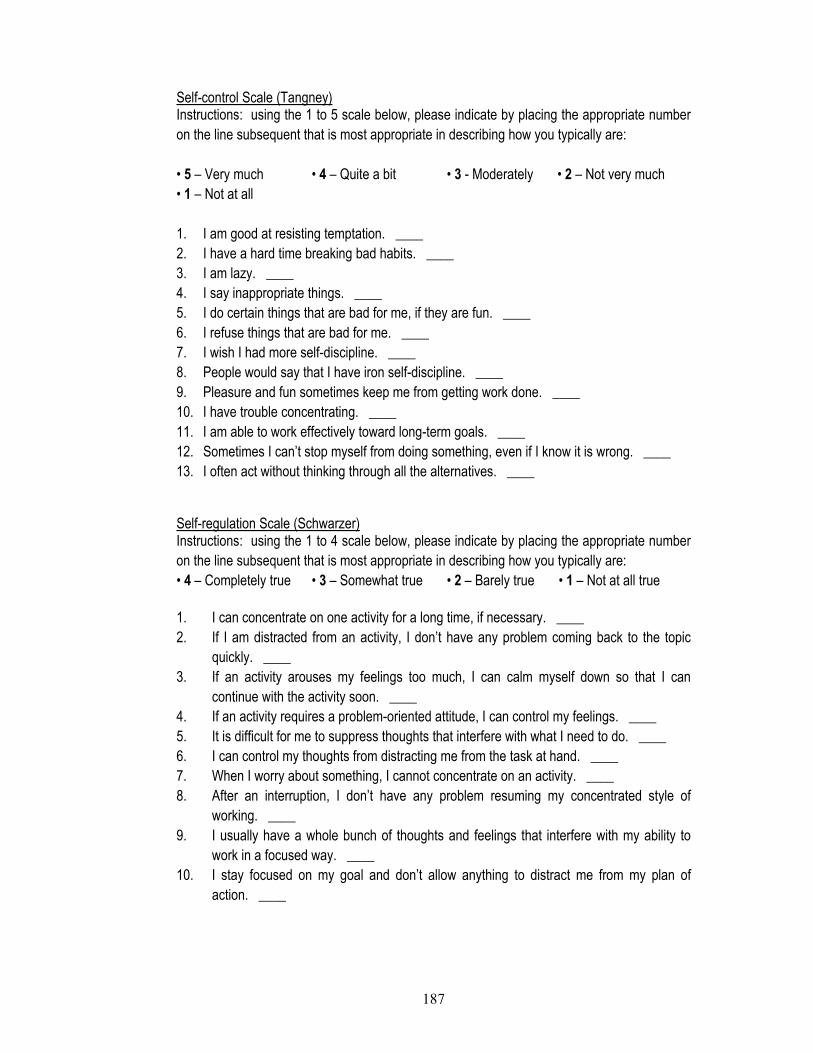
187
Self-control Scale (Tangney) Instructions: using the 1 to 5 scale below, please indicate by placing the appropriate number on the line subsequent that is most appropriate in describing how you typically are: • 5 – Very much • 4 – Quite a bit • 3 - Moderately • 2 – Not very much • 1 – Not at all 1. I am good at resisting temptation. ____ 2. I have a hard time breaking bad habits. ____ 3. I am lazy. ____ 4. I say inappropriate things. ____ 5. I do certain things that are bad for me, if they are fun. ____ 6. I refuse things that are bad for me. ____ 7. I wish I had more self-discipline. ____ 8. People would say that I have iron self-discipline. ____ 9. Pleasure and fun sometimes keep me from getting work done. ____ 10. I have trouble concentrating. ____ 11. I am able to work effectively toward long-term goals. ____ 12. Sometimes I can’t stop myself from doing something, even if I know it is wrong. ____ 13. I often act without thinking through all the alternatives. ____
Self-regulation Scale (Schwarzer) Instructions: using the 1 to 4 scale below, please indicate by placing the appropriate number on the line subsequent that is most appropriate in describing how you typically are: • 4 – Completely true • 3 – Somewhat true • 2 – Barely true • 1 – Not at all true 1. I can concentrate on one activity for a long time, if necessary. ____ 2. If I am distracted from an activity, I don’t have any problem coming back to the topic
quickly. ____ 3. If an activity arouses my feelings too much, I can calm myself down so that I can
continue with the activity soon. ____ 4. If an activity requires a problem-oriented attitude, I can control my feelings. ____ 5. It is difficult for me to suppress thoughts that interfere with what I need to do. ____ 6. I can control my thoughts from distracting me from the task at hand. ____ 7. When I worry about something, I cannot concentrate on an activity. ____ 8. After an interruption, I don’t have any problem resuming my concentrated style of
working. ____ 9. I usually have a whole bunch of thoughts and feelings that interfere with my ability to
work in a focused way. ____ 10. I stay focused on my goal and don’t allow anything to distract me from my plan of
action. ____

188
Centrality of Religiosity Scale (Huber) Instructions: For each of the following statements and/or questions, please indicate your frequency with each item by placing the appropriate number on the line subsequent that is most appropriate in describing you. • 5 - Very often • 4 - Often • 3 - Occasionally • 2 - Rarely • 1 - Never 01: How often do you think about religious issues? ____ 03: How often do you take part in religious services? ____ 04: How often do you pray? ____ 05: How often do you experience situations in which you have the feeling that God or
something divine intervenes in your life? ____ 10: How often do you experience situations in which you have the feeling that God or
something divine wants to communicate or to reveal something to you? ____ 11: How often do you keep yourself informed about religious questions through radio,
television, internet, newspapers, or books? ____ 14: How often do you pray spontaneously when inspired by daily situations? ____ 15: How often do you experience situations in which you have the feeling that God or
something divine is present? ____ Instructions: For each of the following statements and/or questions, please indicate your importance with each item by placing the appropriate number on the line subsequent that is most appropriate in describing you. • 5 – Very much • 4 – Quite a bit • 3 - Moderately • 2 – Not very much • 1 – Not at all 02: To what extent do you believe that God or something divine exists? ____ 06: How interested are you in learning more about religious topics? ____ 07: To what extend do you believe in an afterlife - e.g. immortality of the soul, resurrection
of the dead or reincarnation? ____ 08: How important is to take part in religious services? ____ 09: How important is personal prayer for you? ____ 12: In your opinion, how probable is it that a higher power really exists? ____ 13: How important is it for you to be connected to a religious community? ____
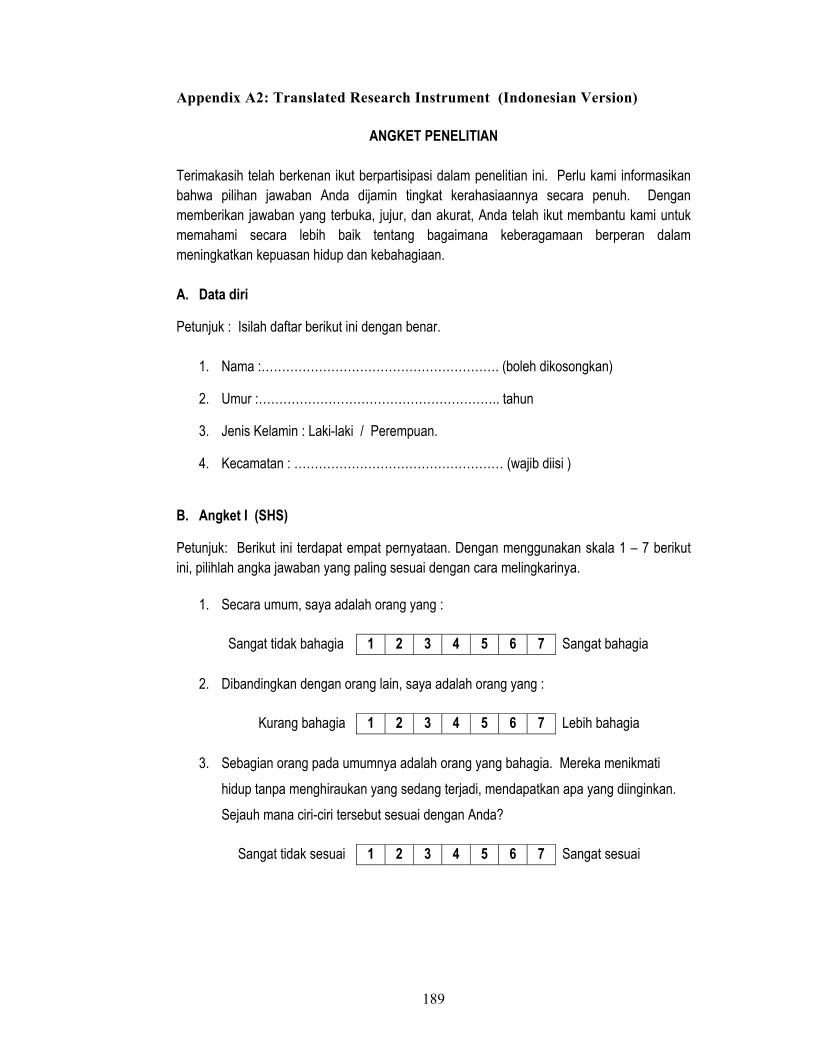
189
Appendix A2: Translated Research Instrument (Indonesian Version)
ANGKET PENELITIAN Terimakasih telah berkenan ikut berpartisipasi dalam penelitian ini. Perlu kami informasikan bahwa pilihan jawaban Anda dijamin tingkat kerahasiaannya secara penuh. Dengan memberikan jawaban yang terbuka, jujur, dan akurat, Anda telah ikut membantu kami untuk memahami secara lebih baik tentang bagaimana keberagamaan berperan dalam meningkatkan kepuasan hidup dan kebahagiaan. A. Data diri
Petunjuk : Isilah daftar berikut ini dengan benar.
1. Nama :…………………………………………………. (boleh dikosongkan)
2. Umur :………………………………………………….. tahun
3. Jenis Kelamin : Laki-laki / Perempuan.
4. Kecamatan : …………………………………………… (wajib diisi )
B. Angket I (SHS)
Petunjuk: Berikut ini terdapat empat pernyataan. Dengan menggunakan skala 1 – 7 berikut ini, pilihlah angka jawaban yang paling sesuai dengan cara melingkarinya.
1. Secara umum, saya adalah orang yang :
Sangat tidak bahagia 1 2 3 4 5 6 7 Sangat bahagia
2. Dibandingkan dengan orang lain, saya adalah orang yang :
Kurang bahagia 1 2 3 4 5 6 7 Lebih bahagia
3. Sebagian orang pada umumnya adalah orang yang bahagia. Mereka menikmati
hidup tanpa menghiraukan yang sedang terjadi, mendapatkan apa yang diinginkan.
Sejauh mana ciri-ciri tersebut sesuai dengan Anda?
Sangat tidak sesuai 1 2 3 4 5 6 7 Sangat sesuai
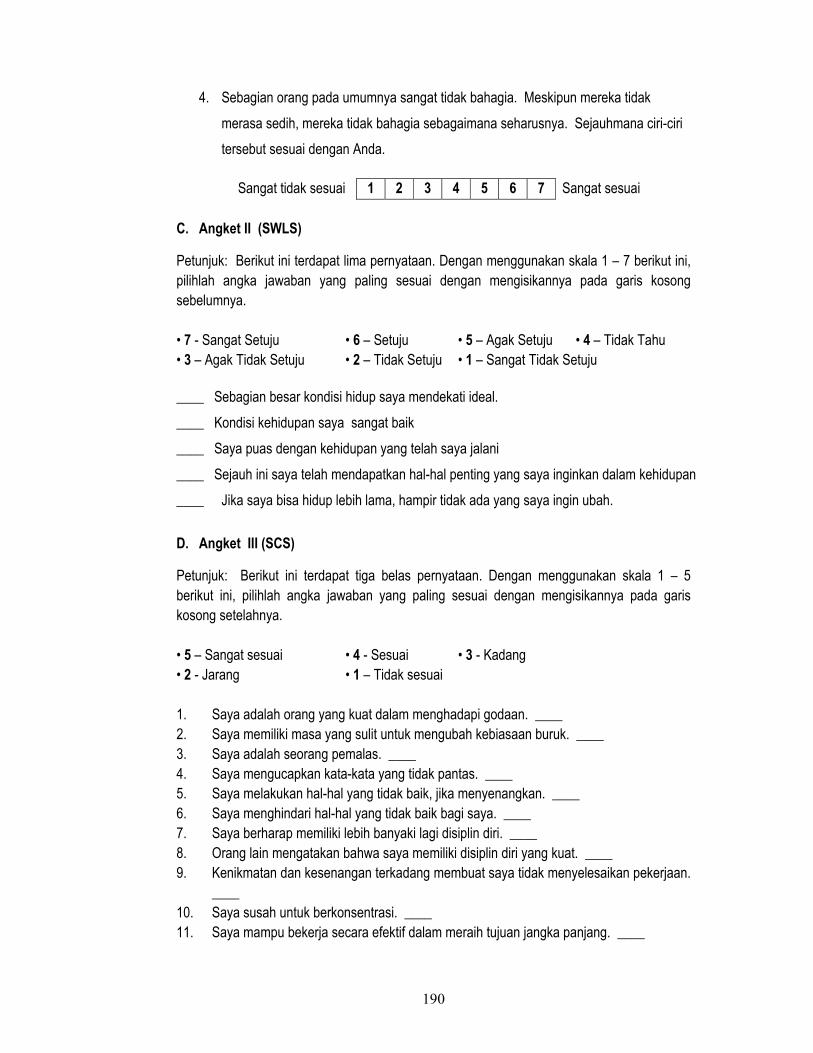
190
4. Sebagian orang pada umumnya sangat tidak bahagia. Meskipun mereka tidak
merasa sedih, mereka tidak bahagia sebagaimana seharusnya. Sejauhmana ciri-ciri
tersebut sesuai dengan Anda.
Sangat tidak sesuai 1 2 3 4 5 6 7 Sangat sesuai C. Angket II (SWLS)
Petunjuk: Berikut ini terdapat lima pernyataan. Dengan menggunakan skala 1 – 7 berikut ini, pilihlah angka jawaban yang paling sesuai dengan mengisikannya pada garis kosong sebelumnya. • 7 - Sangat Setuju • 6 – Setuju • 5 – Agak Setuju • 4 – Tidak Tahu • 3 – Agak Tidak Setuju • 2 – Tidak Setuju • 1 – Sangat Tidak Setuju ____ Sebagian besar kondisi hidup saya mendekati ideal.
____ Kondisi kehidupan saya sangat baik
____ Saya puas dengan kehidupan yang telah saya jalani
____ Sejauh ini saya telah mendapatkan hal-hal penting yang saya inginkan dalam kehidupan
____ Jika saya bisa hidup lebih lama, hampir tidak ada yang saya ingin ubah.
D. Angket III (SCS)
Petunjuk: Berikut ini terdapat tiga belas pernyataan. Dengan menggunakan skala 1 – 5 berikut ini, pilihlah angka jawaban yang paling sesuai dengan mengisikannya pada garis kosong setelahnya. • 5 – Sangat sesuai • 4 - Sesuai • 3 - Kadang • 2 - Jarang • 1 – Tidak sesuai 1. Saya adalah orang yang kuat dalam menghadapi godaan. ____ 2. Saya memiliki masa yang sulit untuk mengubah kebiasaan buruk. ____ 3. Saya adalah seorang pemalas. ____ 4. Saya mengucapkan kata-kata yang tidak pantas. ____ 5. Saya melakukan hal-hal yang tidak baik, jika menyenangkan. ____ 6. Saya menghindari hal-hal yang tidak baik bagi saya. ____ 7. Saya berharap memiliki lebih banyaki lagi disiplin diri. ____ 8. Orang lain mengatakan bahwa saya memiliki disiplin diri yang kuat. ____ 9. Kenikmatan dan kesenangan terkadang membuat saya tidak menyelesaikan pekerjaan.
____ 10. Saya susah untuk berkonsentrasi. ____ 11. Saya mampu bekerja secara efektif dalam meraih tujuan jangka panjang. ____

191
12. Terkadang saya tidak dapat menahan diri untuk melakukan sesuatu, meskipun saya menyadari hal tersebut salah. ____
13. Saya sering bertindak tanpa memikirkan kemungkinan adanya alternatif lain. ____
E. Angket IV (SRS)
Petunjuk: Berikut ini terdapat sepuluh pernyataan. Dengan menggunakan skala 1 – 4 berikut ini, pilihlah angka jawaban yang paling sesuai dengan mengisikannya pada garis kosong setelahnya. • 4 – Sangat benar • 3 – Benar • 2 – Kurang benar • 1 – Tidak benar 1. Jika diperlukan, saya mampu berkonsentrasi pada satu aktivitas untuk waktu yang
lama. ____ 2. Jika saya mendapat gangguan dalam beraktivitas, saya tidak mengalami kesulitan
untuk melakukan kembali aktivitas tersebut dengan segera. ____ 3. Bila sebuah aktivitas terlalu mengganggu perasaan saya, saya mampu menenangkan
diri agar dapat melanjutkan kembali aktivitas tersebut dengan segera. ____ 4. Bila sebuah pekerjaan membutuhkan sikap yang berorientasi pada masalah, saya
mampu untuk mengendalikan perasaan saya. ____ 5. Sulit bagi saya untuk mengendalikan pikiran yang mengganggu apa yang harus saya
kerjakan. ____ 6. Saya mampu mengendalikan pikiran yang mengganggu dalam melaksanakan
pekerjaan yang ada. ____ 7. Ketika saya khawatir akan sesuatu, saya tidak bisa konsentrasi dalam beraktivitas.
____ 8. Setelah menghadapi gangguan, Saya tidak mengalami kesulitan untuk melanjutkan
aktivitas. ____ 9. Saya selalu memiliki banyak pikiran dan perasaan yang mengganggu kemampuan
saya beraktivitas dengan fokus. ____ 10. Saya selalu fokus pada tujuan dan tidak membenarkan apa pun untuk mengganggu
saya dalam meraihnya. ____
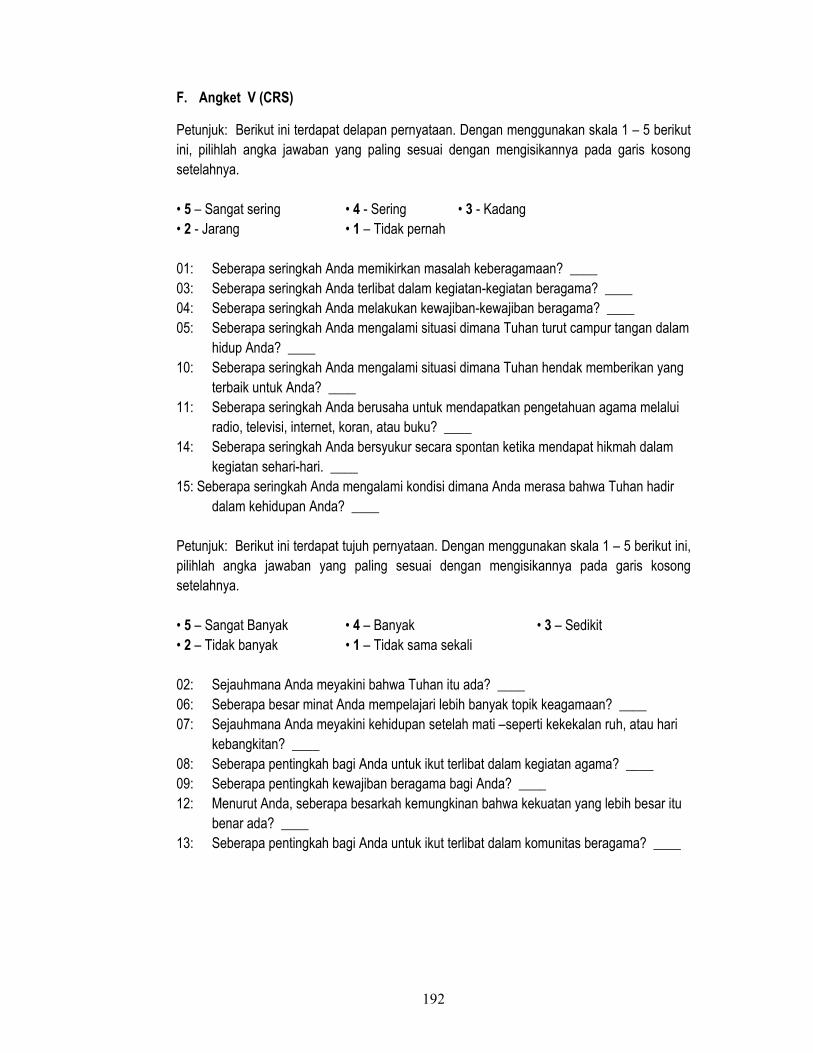
192
F. Angket V (CRS)
Petunjuk: Berikut ini terdapat delapan pernyataan. Dengan menggunakan skala 1 – 5 berikut ini, pilihlah angka jawaban yang paling sesuai dengan mengisikannya pada garis kosong setelahnya. • 5 – Sangat sering • 4 - Sering • 3 - Kadang • 2 - Jarang • 1 – Tidak pernah 01: Seberapa seringkah Anda memikirkan masalah keberagamaan? ____ 03: Seberapa seringkah Anda terlibat dalam kegiatan-kegiatan beragama? ____ 04: Seberapa seringkah Anda melakukan kewajiban-kewajiban beragama? ____ 05: Seberapa seringkah Anda mengalami situasi dimana Tuhan turut campur tangan dalam
hidup Anda? ____ 10: Seberapa seringkah Anda mengalami situasi dimana Tuhan hendak memberikan yang
terbaik untuk Anda? ____ 11: Seberapa seringkah Anda berusaha untuk mendapatkan pengetahuan agama melalui
radio, televisi, internet, koran, atau buku? ____ 14: Seberapa seringkah Anda bersyukur secara spontan ketika mendapat hikmah dalam
kegiatan sehari-hari. ____ 15: Seberapa seringkah Anda mengalami kondisi dimana Anda merasa bahwa Tuhan hadir
dalam kehidupan Anda? ____ Petunjuk: Berikut ini terdapat tujuh pernyataan. Dengan menggunakan skala 1 – 5 berikut ini, pilihlah angka jawaban yang paling sesuai dengan mengisikannya pada garis kosong setelahnya. • 5 – Sangat Banyak • 4 – Banyak • 3 – Sedikit • 2 – Tidak banyak • 1 – Tidak sama sekali 02: Sejauhmana Anda meyakini bahwa Tuhan itu ada? ____ 06: Seberapa besar minat Anda mempelajari lebih banyak topik keagamaan? ____ 07: Sejauhmana Anda meyakini kehidupan setelah mati –seperti kekekalan ruh, atau hari
kebangkitan? ____ 08: Seberapa pentingkah bagi Anda untuk ikut terlibat dalam kegiatan agama? ____ 09: Seberapa pentingkah kewajiban beragama bagi Anda? ____ 12: Menurut Anda, seberapa besarkah kemungkinan bahwa kekuatan yang lebih besar itu
benar ada? ____ 13: Seberapa pentingkah bagi Anda untuk ikut terlibat dalam komunitas beragama? ____
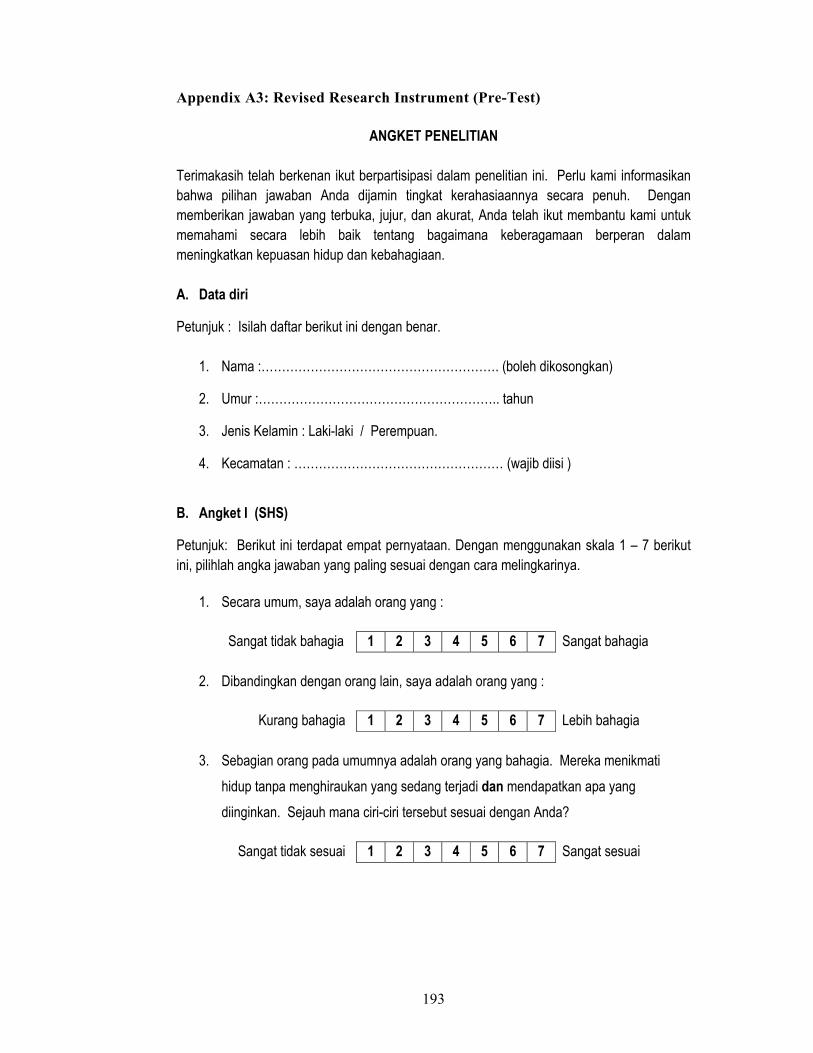
193
Appendix A3: Revised Research Instrument (Pre-Test)
ANGKET PENELITIAN Terimakasih telah berkenan ikut berpartisipasi dalam penelitian ini. Perlu kami informasikan bahwa pilihan jawaban Anda dijamin tingkat kerahasiaannya secara penuh. Dengan memberikan jawaban yang terbuka, jujur, dan akurat, Anda telah ikut membantu kami untuk memahami secara lebih baik tentang bagaimana keberagamaan berperan dalam meningkatkan kepuasan hidup dan kebahagiaan. A. Data diri
Petunjuk : Isilah daftar berikut ini dengan benar.
1. Nama :…………………………………………………. (boleh dikosongkan)
2. Umur :………………………………………………….. tahun
3. Jenis Kelamin : Laki-laki / Perempuan.
4. Kecamatan : …………………………………………… (wajib diisi )
B. Angket I (SHS)
Petunjuk: Berikut ini terdapat empat pernyataan. Dengan menggunakan skala 1 – 7 berikut ini, pilihlah angka jawaban yang paling sesuai dengan cara melingkarinya.
1. Secara umum, saya adalah orang yang :
Sangat tidak bahagia 1 2 3 4 5 6 7 Sangat bahagia
2. Dibandingkan dengan orang lain, saya adalah orang yang :
Kurang bahagia 1 2 3 4 5 6 7 Lebih bahagia
3. Sebagian orang pada umumnya adalah orang yang bahagia. Mereka menikmati
hidup tanpa menghiraukan yang sedang terjadi dan mendapatkan apa yang
diinginkan. Sejauh mana ciri-ciri tersebut sesuai dengan Anda?
Sangat tidak sesuai 1 2 3 4 5 6 7 Sangat sesuai
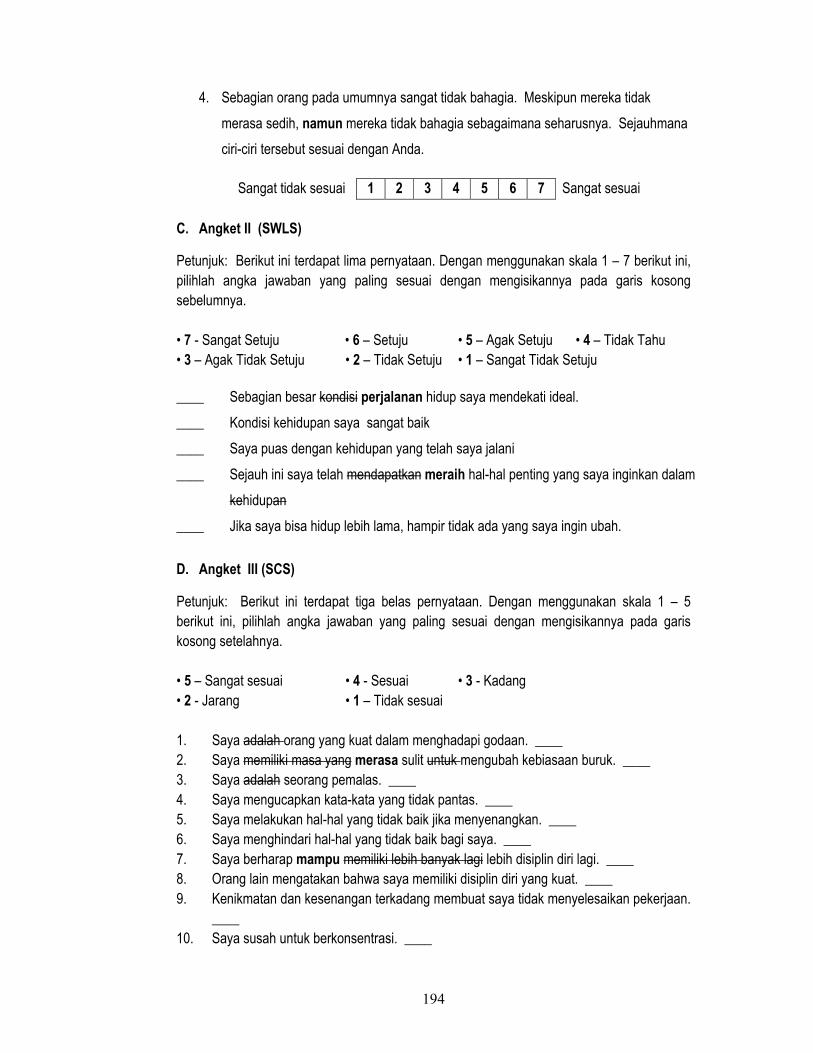
194
4. Sebagian orang pada umumnya sangat tidak bahagia. Meskipun mereka tidak
merasa sedih, namun mereka tidak bahagia sebagaimana seharusnya. Sejauhmana
ciri-ciri tersebut sesuai dengan Anda.
Sangat tidak sesuai 1 2 3 4 5 6 7 Sangat sesuai C. Angket II (SWLS)
Petunjuk: Berikut ini terdapat lima pernyataan. Dengan menggunakan skala 1 – 7 berikut ini, pilihlah angka jawaban yang paling sesuai dengan mengisikannya pada garis kosong sebelumnya. • 7 - Sangat Setuju • 6 – Setuju • 5 – Agak Setuju • 4 – Tidak Tahu • 3 – Agak Tidak Setuju • 2 – Tidak Setuju • 1 – Sangat Tidak Setuju ____ Sebagian besar kondisi perjalanan hidup saya mendekati ideal.
____ Kondisi kehidupan saya sangat baik
____ Saya puas dengan kehidupan yang telah saya jalani
____ Sejauh ini saya telah mendapatkan meraih hal-hal penting yang saya inginkan dalam
kehidupan
____ Jika saya bisa hidup lebih lama, hampir tidak ada yang saya ingin ubah.
D. Angket III (SCS)
Petunjuk: Berikut ini terdapat tiga belas pernyataan. Dengan menggunakan skala 1 – 5 berikut ini, pilihlah angka jawaban yang paling sesuai dengan mengisikannya pada garis kosong setelahnya. • 5 – Sangat sesuai • 4 - Sesuai • 3 - Kadang • 2 - Jarang • 1 – Tidak sesuai 1. Saya adalah orang yang kuat dalam menghadapi godaan. ____ 2. Saya memiliki masa yang merasa sulit untuk mengubah kebiasaan buruk. ____ 3. Saya adalah seorang pemalas. ____ 4. Saya mengucapkan kata-kata yang tidak pantas. ____ 5. Saya melakukan hal-hal yang tidak baik jika menyenangkan. ____ 6. Saya menghindari hal-hal yang tidak baik bagi saya. ____ 7. Saya berharap mampu memiliki lebih banyak lagi lebih disiplin diri lagi. ____ 8. Orang lain mengatakan bahwa saya memiliki disiplin diri yang kuat. ____ 9. Kenikmatan dan kesenangan terkadang membuat saya tidak menyelesaikan pekerjaan.
____ 10. Saya susah untuk berkonsentrasi. ____

195
11. Saya mampu bekerja secara efektif dalam meraih tujuan jangka panjang. ____ 12. Terkadang Saya tidak dapat menahan diri untuk melakukan sesuatu, meskipun saya
menyadari hal tersebut salah. ____ 13. Saya sering bertindak tanpa memikirkan kemungkinan adanya alternatif lain. ____
E. Angket IV (SRS)
Petunjuk: Berikut ini terdapat sepuluh pernyataan. Dengan menggunakan skala 1 – 4 berikut ini, pilihlah angka jawaban yang paling sesuai dengan mengisikannya pada garis kosong setelahnya. • 4 – Sangat benar • 3 – Benar • 2 – Kurang benar • 1 – Tidak benar 1. Jika diperlukan, saya mampu berkonsentrasi pada satu aktivitas untuk waktu yang lama. ____ 2. Jika saya mendapat gangguan dalam beraktivitas, saya tidak mengalami kesulitan
untuk melakukan kembali aktivitas tersebut dengan segera. ____ 3. Bila sebuah aktivitas terlalu mengganggu perasaan saya, saya mampu menenangkan
diri agar dapat melanjutkan kembali aktivitas tersebut dengan segera. ____ 4. Bila sebuah pekerjaan membutuhkan sikap yang berorientasi pada masalah, saya
mampu untuk mengendalikan perasaan saya. ____ 5. Sulit bagi Saya untuk mengendalikan merasa kesulitan mengendalikan pikiran yang
mengganggu tentang apa yang harus saya kerjakan. ____ 6. Saya mampu mengendalikan pikiran yang mengganggu dalam melaksanakan
pekerjaan yang ada. ____ 7. Ketika saya khawatir akan sesuatu, saya tidak bisa konsentrasi dalam beraktivitas.
____ 8. Setelah menghadapi gangguan, Saya tidak mengalami kesulitan untuk melanjutkan
aktivitas. ____ 9. Saya selalu memiliki banyak pikiran dan perasaan yang mengganggu kemampuan
saya beraktivitas dengan fokus. ____ 10. Saya selalu mampu berfokus pada tujuan dan tidak membenarkan membiarkan apa
pun mengganggu saya dalam meraihnya. ____
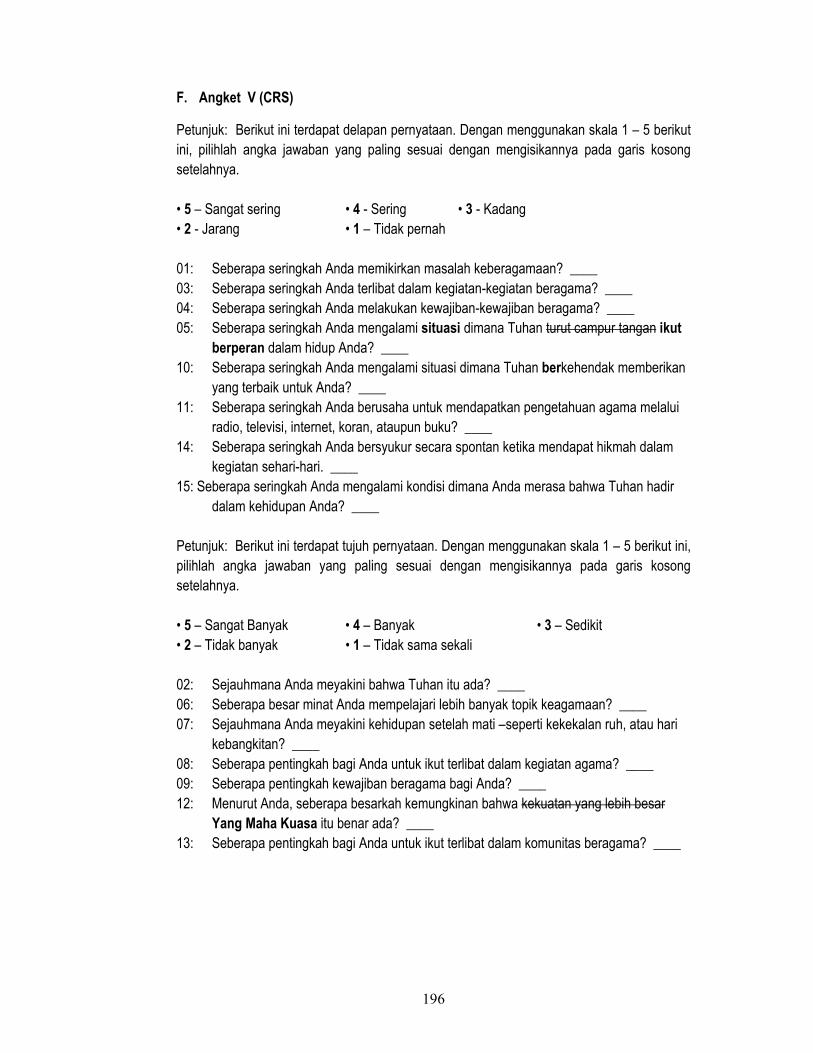
196
F. Angket V (CRS)
Petunjuk: Berikut ini terdapat delapan pernyataan. Dengan menggunakan skala 1 – 5 berikut ini, pilihlah angka jawaban yang paling sesuai dengan mengisikannya pada garis kosong setelahnya. • 5 – Sangat sering • 4 - Sering • 3 - Kadang • 2 - Jarang • 1 – Tidak pernah 01: Seberapa seringkah Anda memikirkan masalah keberagamaan? ____ 03: Seberapa seringkah Anda terlibat dalam kegiatan-kegiatan beragama? ____ 04: Seberapa seringkah Anda melakukan kewajiban-kewajiban beragama? ____ 05: Seberapa seringkah Anda mengalami situasi dimana Tuhan turut campur tangan ikut
berperan dalam hidup Anda? ____ 10: Seberapa seringkah Anda mengalami situasi dimana Tuhan berkehendak memberikan
yang terbaik untuk Anda? ____ 11: Seberapa seringkah Anda berusaha untuk mendapatkan pengetahuan agama melalui
radio, televisi, internet, koran, ataupun buku? ____ 14: Seberapa seringkah Anda bersyukur secara spontan ketika mendapat hikmah dalam
kegiatan sehari-hari. ____ 15: Seberapa seringkah Anda mengalami kondisi dimana Anda merasa bahwa Tuhan hadir
dalam kehidupan Anda? ____ Petunjuk: Berikut ini terdapat tujuh pernyataan. Dengan menggunakan skala 1 – 5 berikut ini, pilihlah angka jawaban yang paling sesuai dengan mengisikannya pada garis kosong setelahnya. • 5 – Sangat Banyak • 4 – Banyak • 3 – Sedikit • 2 – Tidak banyak • 1 – Tidak sama sekali 02: Sejauhmana Anda meyakini bahwa Tuhan itu ada? ____ 06: Seberapa besar minat Anda mempelajari lebih banyak topik keagamaan? ____ 07: Sejauhmana Anda meyakini kehidupan setelah mati –seperti kekekalan ruh, atau hari
kebangkitan? ____ 08: Seberapa pentingkah bagi Anda untuk ikut terlibat dalam kegiatan agama? ____ 09: Seberapa pentingkah kewajiban beragama bagi Anda? ____ 12: Menurut Anda, seberapa besarkah kemungkinan bahwa kekuatan yang lebih besar
Yang Maha Kuasa itu benar ada? ____ 13: Seberapa pentingkah bagi Anda untuk ikut terlibat dalam komunitas beragama? ____
197
Appendix A4: Research Instrument (Pilot Test & Main Test)
Survey Penelitian
Disusun Oleh:
Abdul Aziz Rusman
Universiti Sains Malaysia

198
Surat Pernyataan Persetujuan Nama saya Abdul Aziz Rusman, mahasiswa program doktor di Universitas Sains Malaysia, Penang. Saya sedang melakukan penelitian untuk kepentingan disertasi program doktor yang sedang saya tempuh. Pengisian survey ini memakan waktu kurang lebih 30 menit. Jika Anda memilih untuk ikut berpartisipasi, Anda boleh tidak mengisi nama Anda pada kolom yang tersedia. Survey ini tidak untuk meraih keuntungan pribadi, dan juga tidak mengandung resiko apapun ketika Anda memilih untuk tidak ikut. Hasil penelitian ini mungkin akan dipublikasikan di jurnal akademis atau disajikan dalam seminar atau konfrensi. Namun demikian, data hasil penelitian ini hanya akan disajikan secara umum. Dengan kata lain, hasil survey per individu tidak akan pernah disajikan dalam laporan sehingga apa pun jawaban Anda tidak akan mungkin bisa ditelusuri. Partisipasi Anda dalam penelitian ini adalah bersifat suka rela. Jika Anda memutuskan untuk ikut, dimohon untuk mengisi setiap butir pernyataan dengan lengkap. Anda juga masih boleh untuk membatalkan keterlibatan dengan tidak mengembalikan survey ini kepada kami. Partisipasi dan dukungan Anda dalam penelitian ini amat sangat dihargai. Semoga penelitian ini dapat bermanfaat untuk kesejahteraan umat manusia. Jika ada pertanyaan dan saran dikemudian hari, Anda dapat menghubungi kami. Terimakasih. Abdul Aziz Rusman Jl. Brigjend Katamso, Gg. Jarak, No.1 Medan. Hp : 0813 6227 2002 Email : [email protected]
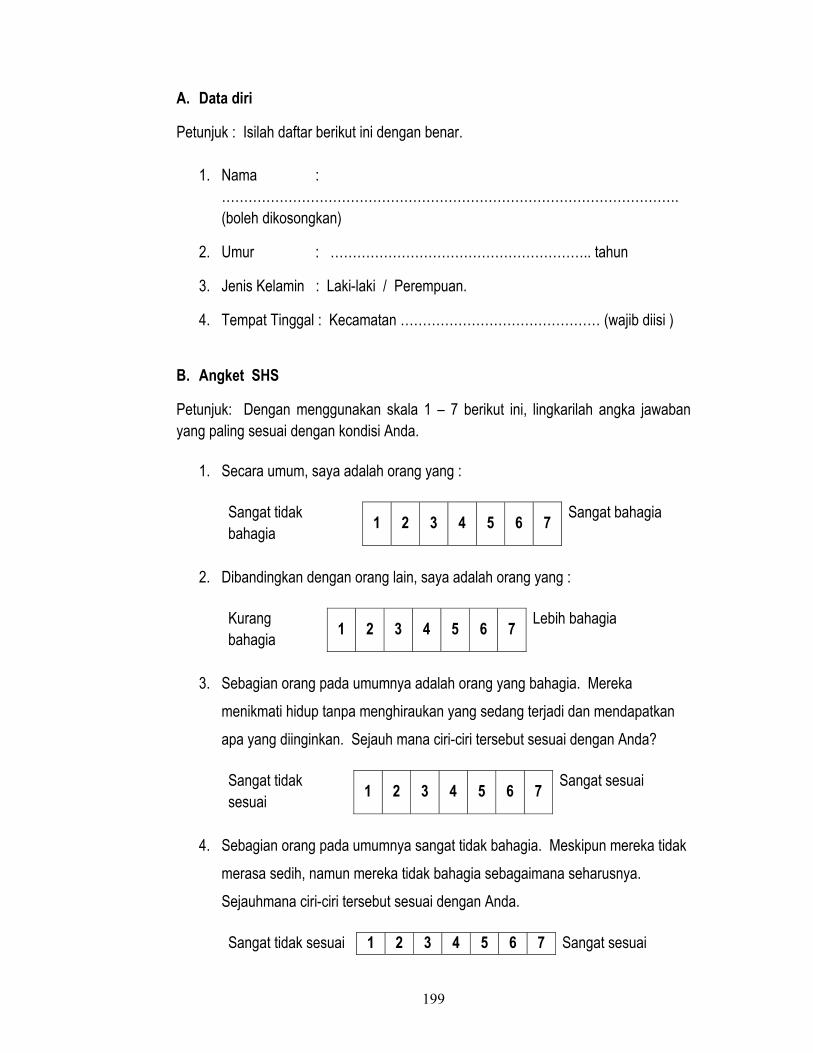
199
A. Data diri
Petunjuk : Isilah daftar berikut ini dengan benar.
1. Nama : …………………………………………………………………………………………. (boleh dikosongkan)
2. Umur : ………………………………………………….. tahun
3. Jenis Kelamin : Laki-laki / Perempuan.
4. Tempat Tinggal : Kecamatan ……………………………………… (wajib diisi )
B. Angket SHS
Petunjuk: Dengan menggunakan skala 1 – 7 berikut ini, lingkarilah angka jawaban yang paling sesuai dengan kondisi Anda.
1. Secara umum, saya adalah orang yang :
Sangat tidak bahagia
1 2 3 4 5 6 7 Sangat bahagia
2. Dibandingkan dengan orang lain, saya adalah orang yang :
Kurang bahagia
1 2 3 4 5 6 7 Lebih bahagia
3. Sebagian orang pada umumnya adalah orang yang bahagia. Mereka
menikmati hidup tanpa menghiraukan yang sedang terjadi dan mendapatkan
apa yang diinginkan. Sejauh mana ciri-ciri tersebut sesuai dengan Anda?
Sangat tidak sesuai
1 2 3 4 5 6 7 Sangat sesuai
4. Sebagian orang pada umumnya sangat tidak bahagia. Meskipun mereka tidak
merasa sedih, namun mereka tidak bahagia sebagaimana seharusnya.
Sejauhmana ciri-ciri tersebut sesuai dengan Anda.
Sangat tidak sesuai 1 2 3 4 5 6 7 Sangat sesuai
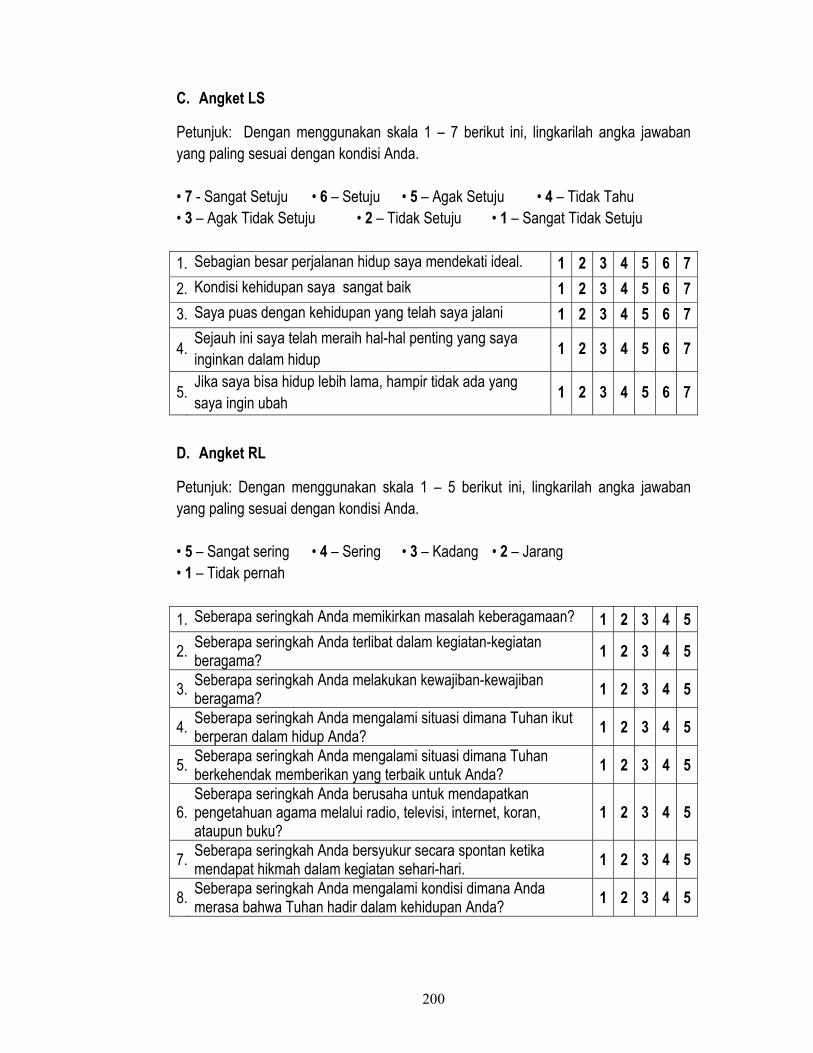
200
C. Angket LS
Petunjuk: Dengan menggunakan skala 1 – 7 berikut ini, lingkarilah angka jawaban yang paling sesuai dengan kondisi Anda. • 7 - Sangat Setuju • 6 – Setuju • 5 – Agak Setuju • 4 – Tidak Tahu • 3 – Agak Tidak Setuju • 2 – Tidak Setuju • 1 – Sangat Tidak Setuju
1. Sebagian besar perjalanan hidup saya mendekati ideal. 1 2 3 4 5 6 7
2. Kondisi kehidupan saya sangat baik 1 2 3 4 5 6 7
3. Saya puas dengan kehidupan yang telah saya jalani 1 2 3 4 5 6 7
4.Sejauh ini saya telah meraih hal-hal penting yang saya inginkan dalam hidup
1 2 3 4 5 6 7
5.Jika saya bisa hidup lebih lama, hampir tidak ada yang saya ingin ubah
1 2 3 4 5 6 7
D. Angket RL
Petunjuk: Dengan menggunakan skala 1 – 5 berikut ini, lingkarilah angka jawaban yang paling sesuai dengan kondisi Anda. • 5 – Sangat sering • 4 – Sering • 3 – Kadang • 2 – Jarang • 1 – Tidak pernah
1. Seberapa seringkah Anda memikirkan masalah keberagamaan? 1 2 3 4 5
2.Seberapa seringkah Anda terlibat dalam kegiatan-kegiatan beragama?
1 2 3 4 5
3. Seberapa seringkah Anda melakukan kewajiban-kewajiban beragama?
1 2 3 4 5
4.Seberapa seringkah Anda mengalami situasi dimana Tuhan ikut berperan dalam hidup Anda?
1 2 3 4 5
5.Seberapa seringkah Anda mengalami situasi dimana Tuhan berkehendak memberikan yang terbaik untuk Anda?
1 2 3 4 5
6.Seberapa seringkah Anda berusaha untuk mendapatkan pengetahuan agama melalui radio, televisi, internet, koran, ataupun buku?
1 2 3 4 5
7.Seberapa seringkah Anda bersyukur secara spontan ketika mendapat hikmah dalam kegiatan sehari-hari.
1 2 3 4 5
8.Seberapa seringkah Anda mengalami kondisi dimana Anda merasa bahwa Tuhan hadir dalam kehidupan Anda?
1 2 3 4 5
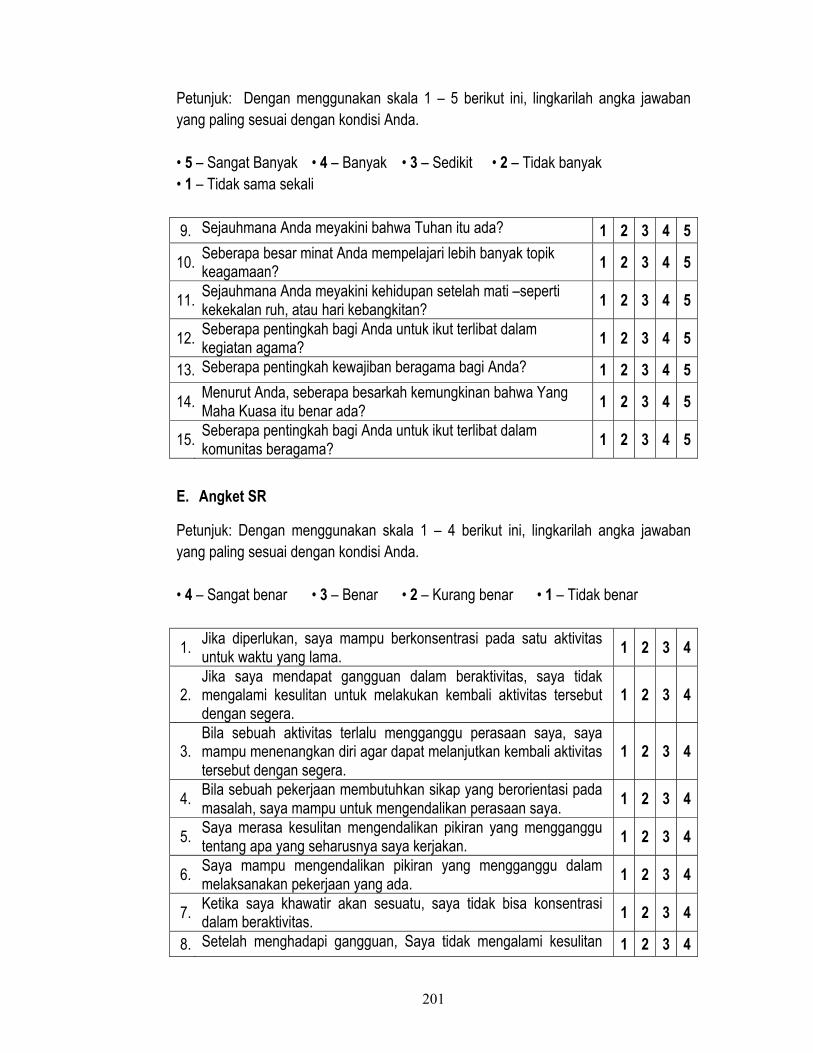
201
Petunjuk: Dengan menggunakan skala 1 – 5 berikut ini, lingkarilah angka jawaban yang paling sesuai dengan kondisi Anda. • 5 – Sangat Banyak • 4 – Banyak • 3 – Sedikit • 2 – Tidak banyak • 1 – Tidak sama sekali
9. Sejauhmana Anda meyakini bahwa Tuhan itu ada? 1 2 3 4 5
10. Seberapa besar minat Anda mempelajari lebih banyak topik keagamaan? 1 2 3 4 5
11. Sejauhmana Anda meyakini kehidupan setelah mati –seperti kekekalan ruh, atau hari kebangkitan?
1 2 3 4 5
12. Seberapa pentingkah bagi Anda untuk ikut terlibat dalam kegiatan agama?
1 2 3 4 5
13. Seberapa pentingkah kewajiban beragama bagi Anda? 1 2 3 4 5
14. Menurut Anda, seberapa besarkah kemungkinan bahwa Yang Maha Kuasa itu benar ada?
1 2 3 4 5
15. Seberapa pentingkah bagi Anda untuk ikut terlibat dalam komunitas beragama?
1 2 3 4 5
E. Angket SR
Petunjuk: Dengan menggunakan skala 1 – 4 berikut ini, lingkarilah angka jawaban yang paling sesuai dengan kondisi Anda. • 4 – Sangat benar • 3 – Benar • 2 – Kurang benar • 1 – Tidak benar
1. Jika diperlukan, saya mampu berkonsentrasi pada satu aktivitas untuk waktu yang lama.
1 2 3 4
2. Jika saya mendapat gangguan dalam beraktivitas, saya tidak mengalami kesulitan untuk melakukan kembali aktivitas tersebut dengan segera.
1 2 3 4
3. Bila sebuah aktivitas terlalu mengganggu perasaan saya, saya mampu menenangkan diri agar dapat melanjutkan kembali aktivitas tersebut dengan segera.
1 2 3 4
4. Bila sebuah pekerjaan membutuhkan sikap yang berorientasi pada masalah, saya mampu untuk mengendalikan perasaan saya.
1 2 3 4
5. Saya merasa kesulitan mengendalikan pikiran yang mengganggu tentang apa yang seharusnya saya kerjakan.
1 2 3 4
6. Saya mampu mengendalikan pikiran yang mengganggu dalam melaksanakan pekerjaan yang ada.
1 2 3 4
7. Ketika saya khawatir akan sesuatu, saya tidak bisa konsentrasi dalam beraktivitas.
1 2 3 4
8. Setelah menghadapi gangguan, Saya tidak mengalami kesulitan 1 2 3 4
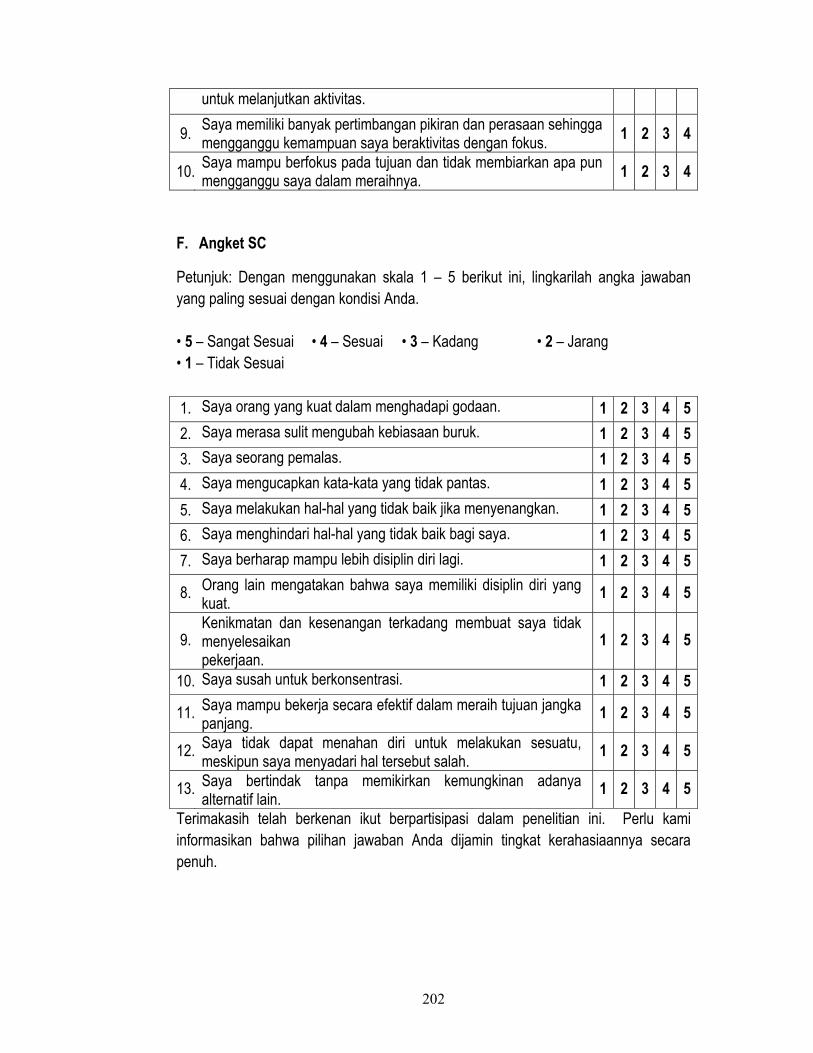
202
untuk melanjutkan aktivitas.
9. Saya memiliki banyak pertimbangan pikiran dan perasaan sehingga mengganggu kemampuan saya beraktivitas dengan fokus.
1 2 3 4
10. Saya mampu berfokus pada tujuan dan tidak membiarkan apa pun mengganggu saya dalam meraihnya.
1 2 3 4
F. Angket SC
Petunjuk: Dengan menggunakan skala 1 – 5 berikut ini, lingkarilah angka jawaban yang paling sesuai dengan kondisi Anda. • 5 – Sangat Sesuai • 4 – Sesuai • 3 – Kadang • 2 – Jarang • 1 – Tidak Sesuai
1. Saya orang yang kuat dalam menghadapi godaan. 1 2 3 4 5
2. Saya merasa sulit mengubah kebiasaan buruk. 1 2 3 4 5
3. Saya seorang pemalas. 1 2 3 4 5
4. Saya mengucapkan kata-kata yang tidak pantas. 1 2 3 4 5
5. Saya melakukan hal-hal yang tidak baik jika menyenangkan. 1 2 3 4 5
6. Saya menghindari hal-hal yang tidak baik bagi saya. 1 2 3 4 5
7. Saya berharap mampu lebih disiplin diri lagi. 1 2 3 4 5
8. Orang lain mengatakan bahwa saya memiliki disiplin diri yang kuat.
1 2 3 4 5
9. Kenikmatan dan kesenangan terkadang membuat saya tidak menyelesaikan pekerjaan.
1 2 3 4 5
10. Saya susah untuk berkonsentrasi. 1 2 3 4 5
11. Saya mampu bekerja secara efektif dalam meraih tujuan jangka panjang.
1 2 3 4 5
12. Saya tidak dapat menahan diri untuk melakukan sesuatu, meskipun saya menyadari hal tersebut salah.
1 2 3 4 5
13. Saya bertindak tanpa memikirkan kemungkinan adanya alternatif lain.
1 2 3 4 5
Terimakasih telah berkenan ikut berpartisipasi dalam penelitian ini. Perlu kami informasikan bahwa pilihan jawaban Anda dijamin tingkat kerahasiaannya secara penuh.
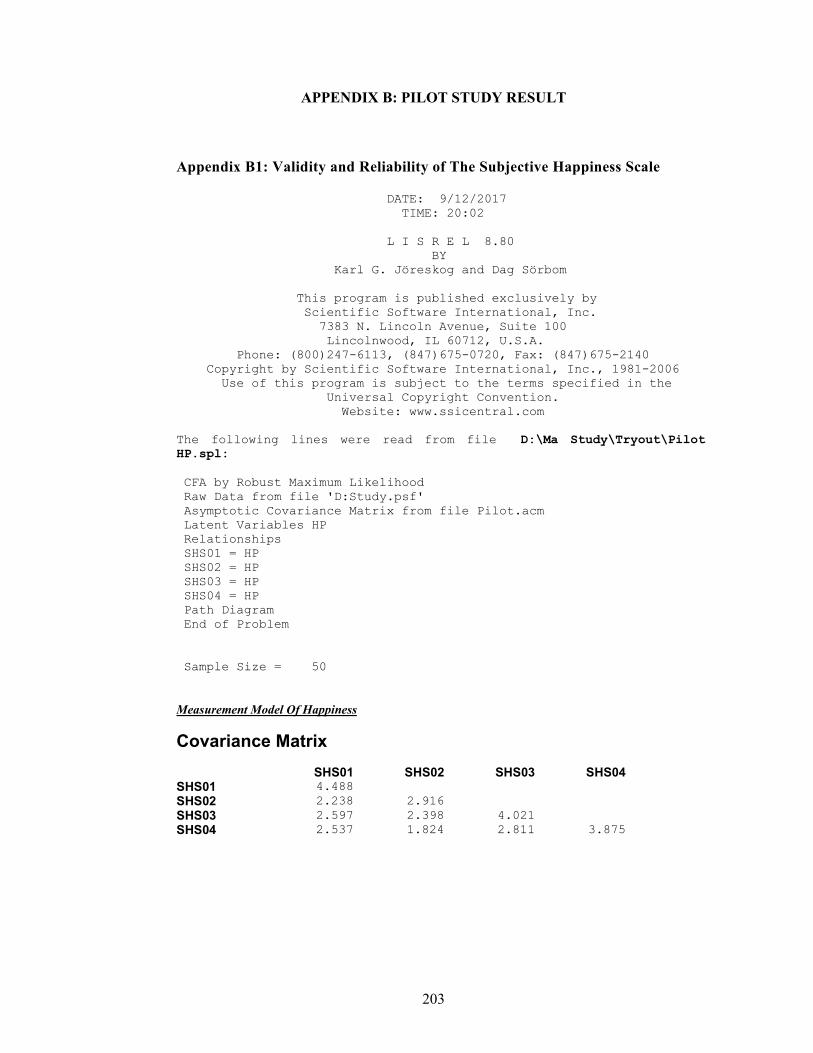
203
APPENDIX B: PILOT STUDY RESULT
Appendix B1: Validity and Reliability of The Subjective Happiness Scale DATE: 9/12/2017 TIME: 20:02 L I S R E L 8.80 BY Karl G. Jöreskog and Dag Sörbom This program is published exclusively by Scientific Software International, Inc. 7383 N. Lincoln Avenue, Suite 100 Lincolnwood, IL 60712, U.S.A. Phone: (800)247-6113, (847)675-0720, Fax: (847)675-2140 Copyright by Scientific Software International, Inc., 1981-2006 Use of this program is subject to the terms specified in the Universal Copyright Convention. Website: www.ssicentral.com The following lines were read from file D:\Ma Study\Tryout\Pilot HP.spl: CFA by Robust Maximum Likelihood Raw Data from file 'D:Study.psf' Asymptotic Covariance Matrix from file Pilot.acm Latent Variables HP Relationships SHS01 = HP SHS02 = HP SHS03 = HP SHS04 = HP Path Diagram End of Problem Sample Size = 50 Measurement Model Of Happiness
Covariance Matrix
SHS01 SHS02 SHS03 SHS04 SHS01 4.488 SHS02 2.238 2.916 SHS03 2.597 2.398 4.021 SHS04 2.537 1.824 2.811 3.875
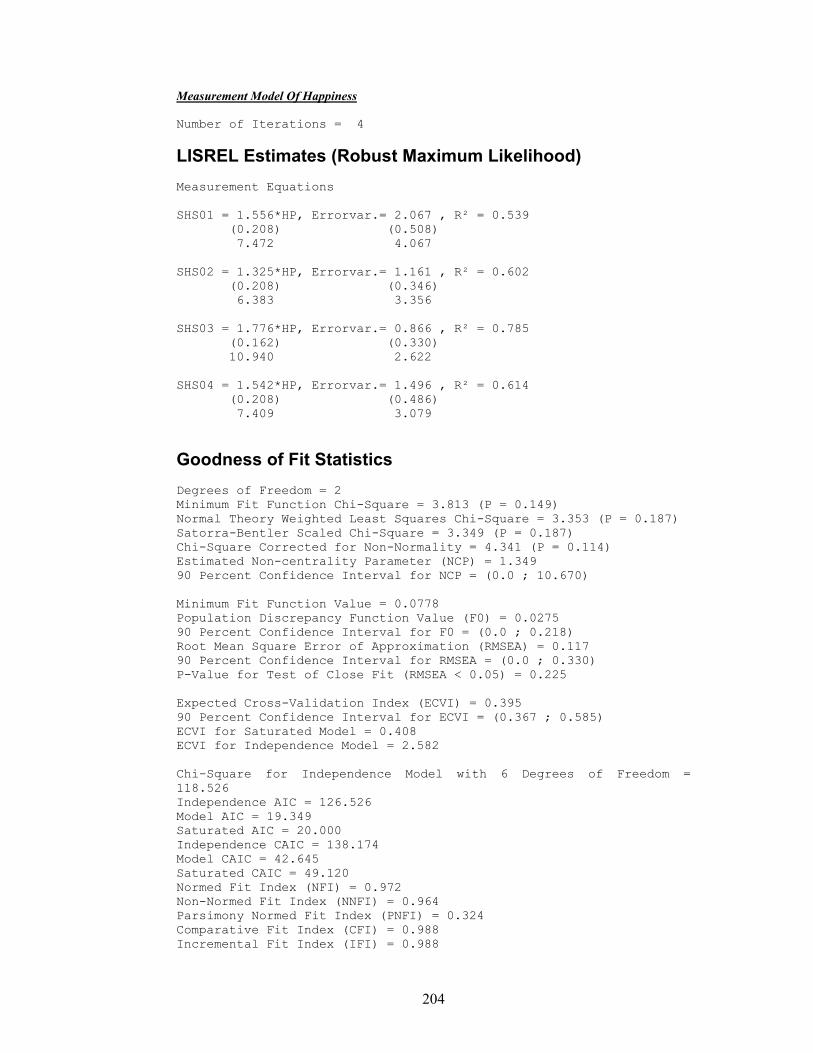
204
Measurement Model Of Happiness Number of Iterations = 4
LISREL Estimates (Robust Maximum Likelihood) Measurement Equations SHS01 = 1.556*HP, Errorvar.= 2.067 , R² = 0.539
(0.208) (0.508) 7.472 4.067
SHS02 = 1.325*HP, Errorvar.= 1.161 , R² = 0.602
(0.208) (0.346) 6.383 3.356
SHS03 = 1.776*HP, Errorvar.= 0.866 , R² = 0.785
(0.162) (0.330) 10.940 2.622
SHS04 = 1.542*HP, Errorvar.= 1.496 , R² = 0.614
(0.208) (0.486) 7.409 3.079
Goodness of Fit Statistics Degrees of Freedom = 2 Minimum Fit Function Chi-Square = 3.813 (P = 0.149) Normal Theory Weighted Least Squares Chi-Square = 3.353 (P = 0.187) Satorra-Bentler Scaled Chi-Square = 3.349 (P = 0.187) Chi-Square Corrected for Non-Normality = 4.341 (P = 0.114) Estimated Non-centrality Parameter (NCP) = 1.349 90 Percent Confidence Interval for NCP = (0.0 ; 10.670) Minimum Fit Function Value = 0.0778 Population Discrepancy Function Value (F0) = 0.0275 90 Percent Confidence Interval for F0 = (0.0 ; 0.218) Root Mean Square Error of Approximation (RMSEA) = 0.117 90 Percent Confidence Interval for RMSEA = (0.0 ; 0.330) P-Value for Test of Close Fit (RMSEA < 0.05) = 0.225 Expected Cross-Validation Index (ECVI) = 0.395 90 Percent Confidence Interval for ECVI = (0.367 ; 0.585) ECVI for Saturated Model = 0.408 ECVI for Independence Model = 2.582 Chi-Square for Independence Model with 6 Degrees of Freedom = 118.526 Independence AIC = 126.526 Model AIC = 19.349 Saturated AIC = 20.000 Independence CAIC = 138.174 Model CAIC = 42.645 Saturated CAIC = 49.120 Normed Fit Index (NFI) = 0.972 Non-Normed Fit Index (NNFI) = 0.964 Parsimony Normed Fit Index (PNFI) = 0.324 Comparative Fit Index (CFI) = 0.988 Incremental Fit Index (IFI) = 0.988
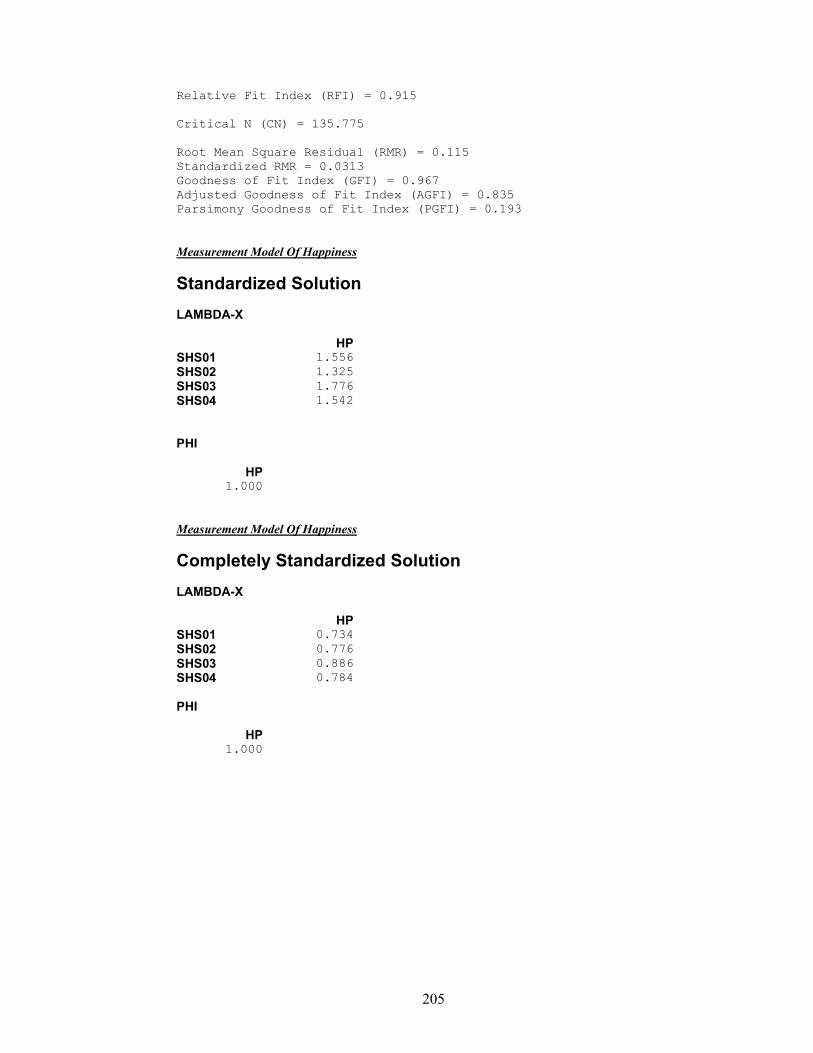
205
Relative Fit Index (RFI) = 0.915 Critical N (CN) = 135.775 Root Mean Square Residual (RMR) = 0.115 Standardized RMR = 0.0313 Goodness of Fit Index (GFI) = 0.967 Adjusted Goodness of Fit Index (AGFI) = 0.835 Parsimony Goodness of Fit Index (PGFI) = 0.193 Measurement Model Of Happiness
Standardized Solution LAMBDA-X
HP SHS01 1.556 SHS02 1.325 SHS03 1.776 SHS04 1.542 PHI
HP 1.000
Measurement Model Of Happiness
Completely Standardized Solution LAMBDA-X
HP SHS01 0.734 SHS02 0.776 SHS03 0.886 SHS04 0.784 PHI
HP 1.000
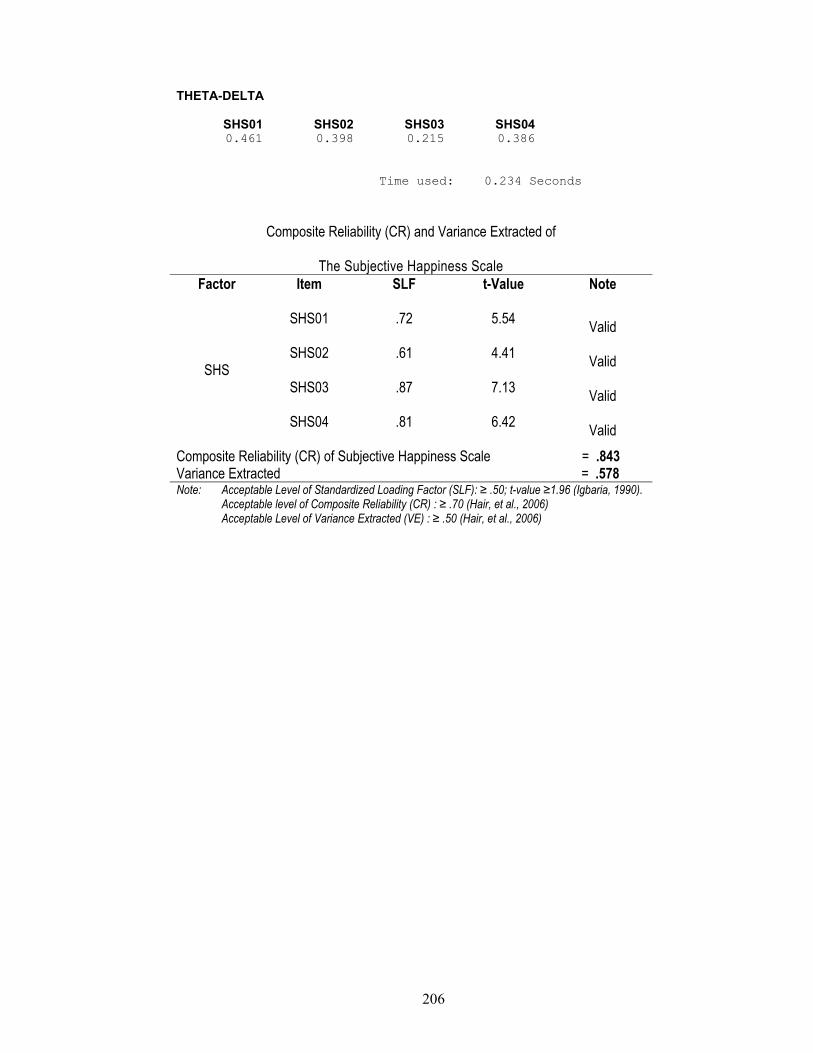
206
THETA-DELTA
SHS01 SHS02 SHS03 SHS04 0.461 0.398 0.215 0.386
Time used: 0.234 Seconds
Composite Reliability (CR) and Variance Extracted of
The Subjective Happiness Scale Factor Item SLF t-Value Note
SHS
SHS01 .72 5.54 Valid
SHS02 .61 4.41 Valid
SHS03 .87 7.13 Valid
SHS04 .81 6.42 Valid
Composite Reliability (CR) of Subjective Happiness Scale = .843 Variance Extracted = .578 Note: Acceptable Level of Standardized Loading Factor (SLF): ≥ .50; t-value ≥1.96 (Igbaria, 1990). Acceptable level of Composite Reliability (CR) : ≥ .70 (Hair, et al., 2006) Acceptable Level of Variance Extracted (VE) : ≥ .50 (Hair, et al., 2006)
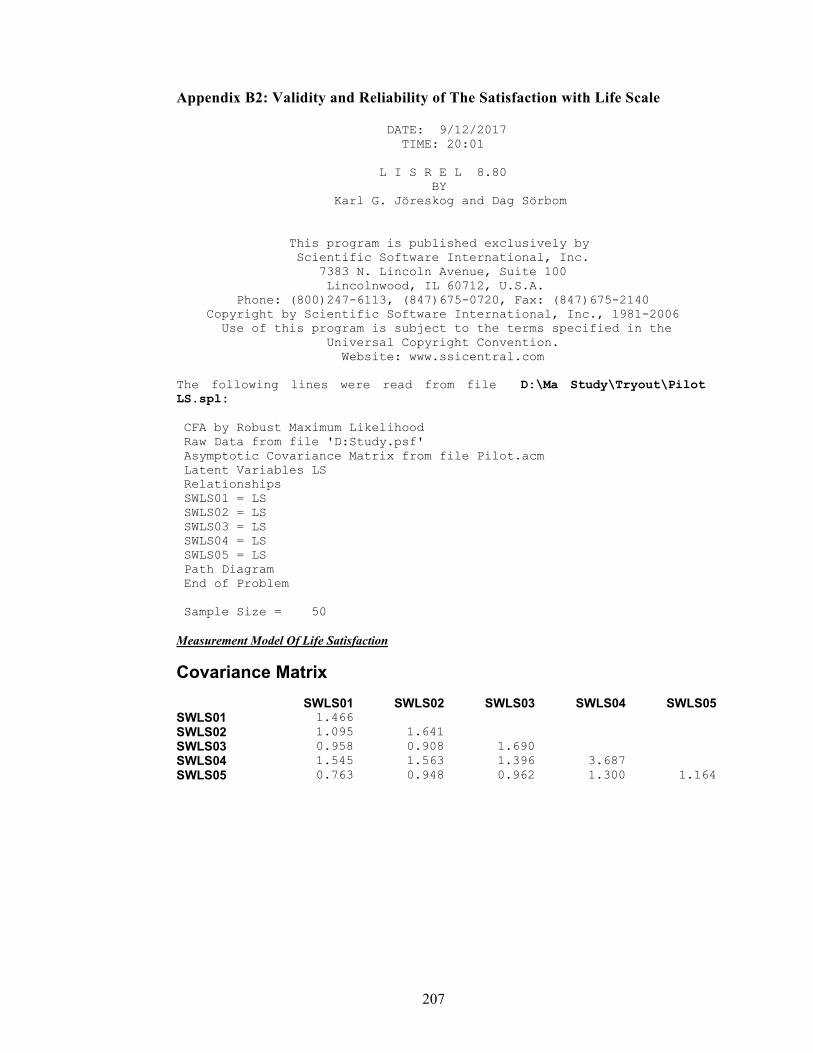
207
Appendix B2: Validity and Reliability of The Satisfaction with Life Scale DATE: 9/12/2017 TIME: 20:01 L I S R E L 8.80 BY Karl G. Jöreskog and Dag Sörbom This program is published exclusively by Scientific Software International, Inc. 7383 N. Lincoln Avenue, Suite 100 Lincolnwood, IL 60712, U.S.A. Phone: (800)247-6113, (847)675-0720, Fax: (847)675-2140 Copyright by Scientific Software International, Inc., 1981-2006 Use of this program is subject to the terms specified in the Universal Copyright Convention. Website: www.ssicentral.com The following lines were read from file D:\Ma Study\Tryout\Pilot LS.spl: CFA by Robust Maximum Likelihood Raw Data from file 'D:Study.psf' Asymptotic Covariance Matrix from file Pilot.acm Latent Variables LS Relationships SWLS01 = LS SWLS02 = LS SWLS03 = LS SWLS04 = LS SWLS05 = LS Path Diagram End of Problem Sample Size = 50 Measurement Model Of Life Satisfaction
Covariance Matrix
SWLS01 SWLS02 SWLS03 SWLS04 SWLS05 SWLS01 1.466 SWLS02 1.095 1.641 SWLS03 0.958 0.908 1.690 SWLS04 1.545 1.563 1.396 3.687 SWLS05 0.763 0.948 0.962 1.300 1.164
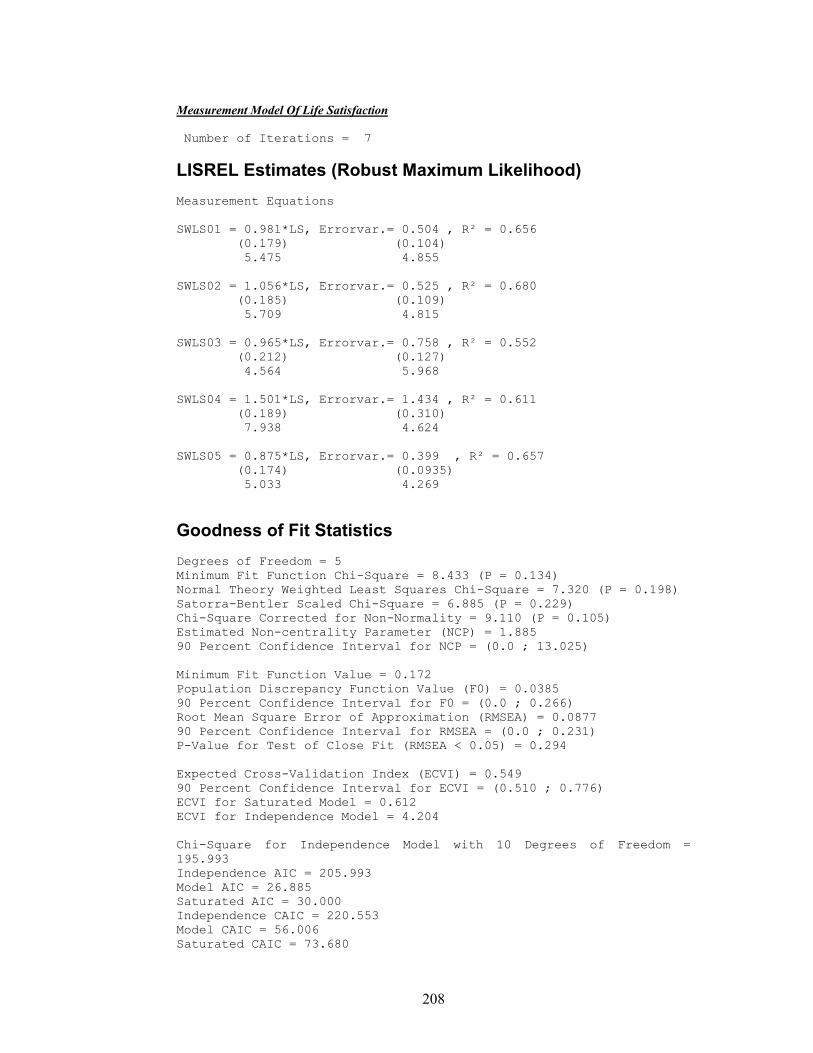
208
Measurement Model Of Life Satisfaction Number of Iterations = 7
LISREL Estimates (Robust Maximum Likelihood) Measurement Equations SWLS01 = 0.981*LS, Errorvar.= 0.504 , R² = 0.656
(0.179) (0.104) 5.475 4.855
SWLS02 = 1.056*LS, Errorvar.= 0.525 , R² = 0.680
(0.185) (0.109) 5.709 4.815
SWLS03 = 0.965*LS, Errorvar.= 0.758 , R² = 0.552
(0.212) (0.127) 4.564 5.968
SWLS04 = 1.501*LS, Errorvar.= 1.434 , R² = 0.611
(0.189) (0.310) 7.938 4.624
SWLS05 = 0.875*LS, Errorvar.= 0.399 , R² = 0.657
(0.174) (0.0935) 5.033 4.269
Goodness of Fit Statistics Degrees of Freedom = 5 Minimum Fit Function Chi-Square = 8.433 (P = 0.134) Normal Theory Weighted Least Squares Chi-Square = 7.320 (P = 0.198) Satorra-Bentler Scaled Chi-Square = 6.885 (P = 0.229) Chi-Square Corrected for Non-Normality = 9.110 (P = 0.105) Estimated Non-centrality Parameter (NCP) = 1.885 90 Percent Confidence Interval for NCP = (0.0 ; 13.025) Minimum Fit Function Value = 0.172 Population Discrepancy Function Value (F0) = 0.0385 90 Percent Confidence Interval for F0 = (0.0 ; 0.266) Root Mean Square Error of Approximation (RMSEA) = 0.0877 90 Percent Confidence Interval for RMSEA = (0.0 ; 0.231) P-Value for Test of Close Fit (RMSEA < 0.05) = 0.294 Expected Cross-Validation Index (ECVI) = 0.549 90 Percent Confidence Interval for ECVI = (0.510 ; 0.776) ECVI for Saturated Model = 0.612 ECVI for Independence Model = 4.204 Chi-Square for Independence Model with 10 Degrees of Freedom = 195.993 Independence AIC = 205.993 Model AIC = 26.885 Saturated AIC = 30.000 Independence CAIC = 220.553 Model CAIC = 56.006 Saturated CAIC = 73.680

209
Normed Fit Index (NFI) = 0.965 Non-Normed Fit Index (NNFI) = 0.980 Parsimony Normed Fit Index (PNFI) = 0.482 Comparative Fit Index (CFI) = 0.990 Incremental Fit Index (IFI) = 0.990 Relative Fit Index (RFI) = 0.930 Critical N (CN) = 108.379 Root Mean Square Residual (RMR) = 0.0568 Standardized RMR = 0.0367 Goodness of Fit Index (GFI) = 0.944 Adjusted Goodness of Fit Index (AGFI) = 0.831 Parsimony Goodness of Fit Index (PGFI) = 0.315 Measurement Model Of Life Satisfaction
Standardized Solution LAMBDA-X
LS SWLS01 0.981 SWLS02 1.056 SWLS03 0.965 SWLS04 1.501 SWLS05 0.875 PHI
LS 1.000
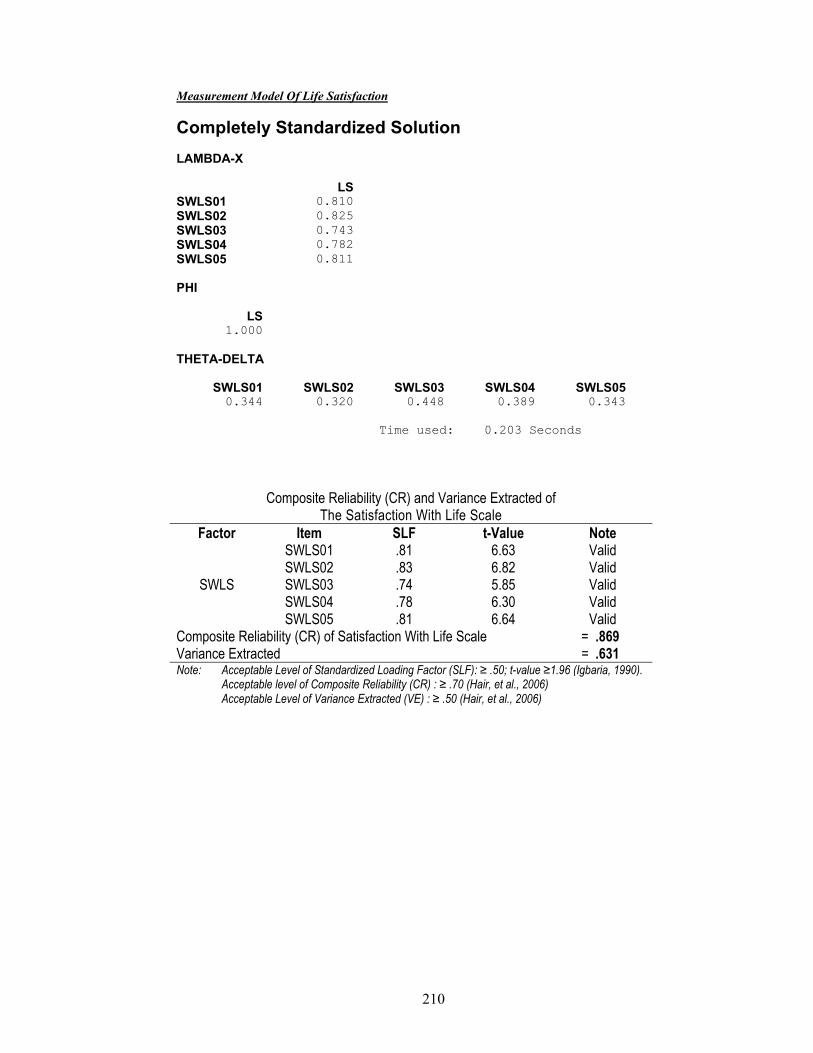
210
Measurement Model Of Life Satisfaction
Completely Standardized Solution LAMBDA-X
LS SWLS01 0.810 SWLS02 0.825 SWLS03 0.743 SWLS04 0.782 SWLS05 0.811 PHI
LS 1.000
THETA-DELTA
SWLS01 SWLS02 SWLS03 SWLS04 SWLS05 0.344 0.320 0.448 0.389 0.343
Time used: 0.203 Seconds
Composite Reliability (CR) and Variance Extracted of The Satisfaction With Life Scale
Factor Item SLF t-Value Note
SWLS
SWLS01 .81 6.63 Valid SWLS02 .83 6.82 Valid SWLS03 .74 5.85 Valid SWLS04 .78 6.30 Valid SWLS05 .81 6.64 Valid
Composite Reliability (CR) of Satisfaction With Life Scale = .869 Variance Extracted = .631 Note: Acceptable Level of Standardized Loading Factor (SLF): ≥ .50; t-value ≥1.96 (Igbaria, 1990). Acceptable level of Composite Reliability (CR) : ≥ .70 (Hair, et al., 2006) Acceptable Level of Variance Extracted (VE) : ≥ .50 (Hair, et al., 2006)

211
Appendix B3: Validity and Reliability of The Self-Regulation Scale
DATE: 9/12/2017 TIME: 19:59 L I S R E L 8.80 BY Karl G. Jöreskog and Dag Sörbom This program is published exclusively by Scientific Software International, Inc. 7383 N. Lincoln Avenue, Suite 100 Lincolnwood, IL 60712, U.S.A. Phone: (800)247-6113, (847)675-0720, Fax: (847)675-2140 Copyright by Scientific Software International, Inc., 1981-2006 Use of this program is subject to the terms specified in the Universal Copyright Convention. Website: www.ssicentral.com The following lines were read from file D:\Ma Study\Tryout\SR Pilot.spl: Second Order CFA by Robust Maximum Likelihood Raw Data from file 'D:Study.psf' Asymptotic Covariance Matrix from file Pilot.acm Latent Variables ATREG EMREG SR Relationships ATREG01 = ATREG ATREG02 = ATREG ATREG03 = ATREG ATREG04 = ATREG ATREG05 = ATREG EMREG01 = EMREG EMREG02 = EMREG EMREG03 = EMREG EMREG04 = EMREG EMREG05 = EMREG ATREG = SR EMREG = SR Set error Variance of ATREG and EMREG free Path Diagram End of Problem Sample Size = 50
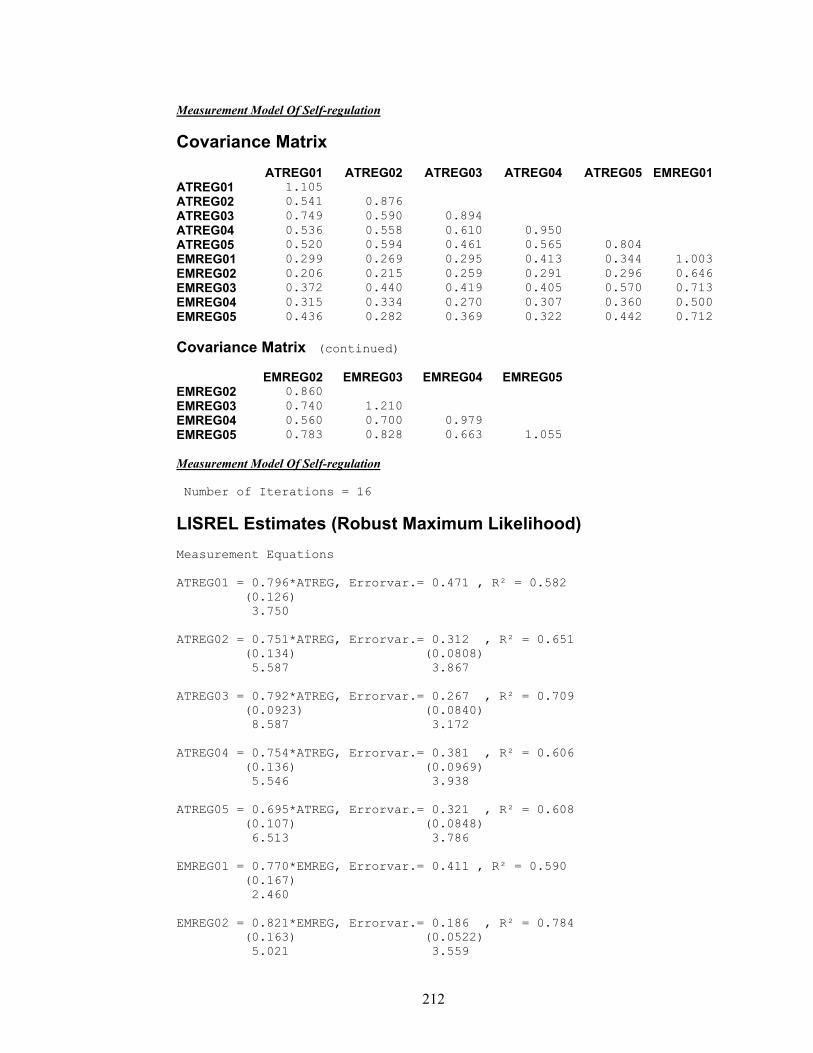
212
Measurement Model Of Self-regulation
Covariance Matrix
ATREG01 ATREG02 ATREG03 ATREG04 ATREG05 EMREG01 ATREG01 1.105 ATREG02 0.541 0.876 ATREG03 0.749 0.590 0.894 ATREG04 0.536 0.558 0.610 0.950 ATREG05 0.520 0.594 0.461 0.565 0.804 EMREG01 0.299 0.269 0.295 0.413 0.344 1.003 EMREG02 0.206 0.215 0.259 0.291 0.296 0.646 EMREG03 0.372 0.440 0.419 0.405 0.570 0.713 EMREG04 0.315 0.334 0.270 0.307 0.360 0.500 EMREG05 0.436 0.282 0.369 0.322 0.442 0.712
Covariance Matrix (continued)
EMREG02 EMREG03 EMREG04 EMREG05 EMREG02 0.860 EMREG03 0.740 1.210 EMREG04 0.560 0.700 0.979 EMREG05 0.783 0.828 0.663 1.055 Measurement Model Of Self-regulation Number of Iterations = 16
LISREL Estimates (Robust Maximum Likelihood) Measurement Equations ATREG01 = 0.796*ATREG, Errorvar.= 0.471 , R² = 0.582
(0.126) 3.750
ATREG02 = 0.751*ATREG, Errorvar.= 0.312 , R² = 0.651
(0.134) (0.0808) 5.587 3.867
ATREG03 = 0.792*ATREG, Errorvar.= 0.267 , R² = 0.709
(0.0923) (0.0840) 8.587 3.172
ATREG04 = 0.754*ATREG, Errorvar.= 0.381 , R² = 0.606
(0.136) (0.0969) 5.546 3.938
ATREG05 = 0.695*ATREG, Errorvar.= 0.321 , R² = 0.608
(0.107) (0.0848) 6.513 3.786
EMREG01 = 0.770*EMREG, Errorvar.= 0.411 , R² = 0.590
(0.167) 2.460
EMREG02 = 0.821*EMREG, Errorvar.= 0.186 , R² = 0.784
(0.163) (0.0522) 5.021 3.559
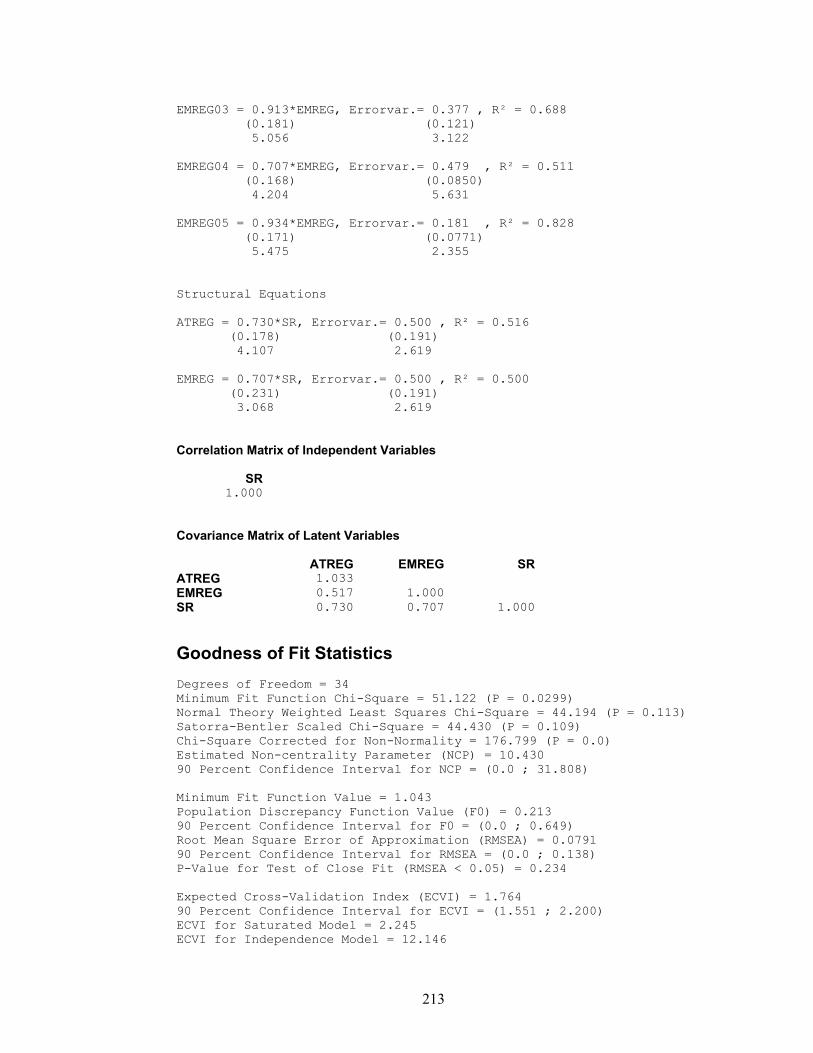
213
EMREG03 = 0.913*EMREG, Errorvar.= 0.377 , R² = 0.688
(0.181) (0.121) 5.056 3.122
EMREG04 = 0.707*EMREG, Errorvar.= 0.479 , R² = 0.511
(0.168) (0.0850) 4.204 5.631
EMREG05 = 0.934*EMREG, Errorvar.= 0.181 , R² = 0.828
(0.171) (0.0771) 5.475 2.355
Structural Equations ATREG = 0.730*SR, Errorvar.= 0.500 , R² = 0.516
(0.178) (0.191) 4.107 2.619
EMREG = 0.707*SR, Errorvar.= 0.500 , R² = 0.500
(0.231) (0.191) 3.068 2.619
Correlation Matrix of Independent Variables
SR 1.000
Covariance Matrix of Latent Variables
ATREG EMREG SR ATREG 1.033 EMREG 0.517 1.000 SR 0.730 0.707 1.000
Goodness of Fit Statistics Degrees of Freedom = 34 Minimum Fit Function Chi-Square = 51.122 (P = 0.0299) Normal Theory Weighted Least Squares Chi-Square = 44.194 (P = 0.113) Satorra-Bentler Scaled Chi-Square = 44.430 (P = 0.109) Chi-Square Corrected for Non-Normality = 176.799 (P = 0.0) Estimated Non-centrality Parameter (NCP) = 10.430 90 Percent Confidence Interval for NCP = (0.0 ; 31.808) Minimum Fit Function Value = 1.043 Population Discrepancy Function Value (F0) = 0.213 90 Percent Confidence Interval for F0 = (0.0 ; 0.649) Root Mean Square Error of Approximation (RMSEA) = 0.0791 90 Percent Confidence Interval for RMSEA = (0.0 ; 0.138) P-Value for Test of Close Fit (RMSEA < 0.05) = 0.234 Expected Cross-Validation Index (ECVI) = 1.764 90 Percent Confidence Interval for ECVI = (1.551 ; 2.200) ECVI for Saturated Model = 2.245 ECVI for Independence Model = 12.146
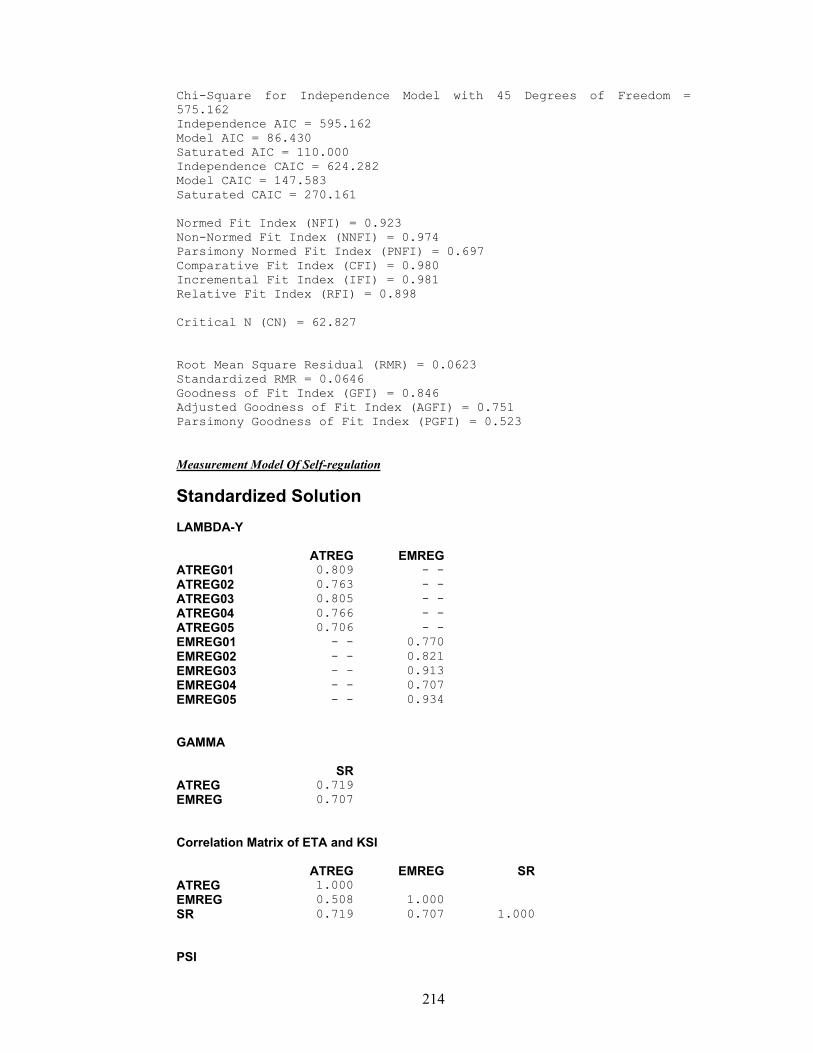
214
Chi-Square for Independence Model with 45 Degrees of Freedom = 575.162 Independence AIC = 595.162 Model AIC = 86.430 Saturated AIC = 110.000 Independence CAIC = 624.282 Model CAIC = 147.583 Saturated CAIC = 270.161 Normed Fit Index (NFI) = 0.923 Non-Normed Fit Index (NNFI) = 0.974 Parsimony Normed Fit Index (PNFI) = 0.697 Comparative Fit Index (CFI) = 0.980 Incremental Fit Index (IFI) = 0.981 Relative Fit Index (RFI) = 0.898 Critical N (CN) = 62.827 Root Mean Square Residual (RMR) = 0.0623 Standardized RMR = 0.0646 Goodness of Fit Index (GFI) = 0.846 Adjusted Goodness of Fit Index (AGFI) = 0.751 Parsimony Goodness of Fit Index (PGFI) = 0.523 Measurement Model Of Self-regulation
Standardized Solution LAMBDA-Y
ATREG EMREG ATREG01 0.809 - - ATREG02 0.763 - - ATREG03 0.805 - - ATREG04 0.766 - - ATREG05 0.706 - - EMREG01 - - 0.770 EMREG02 - - 0.821 EMREG03 - - 0.913 EMREG04 - - 0.707 EMREG05 - - 0.934 GAMMA
SR ATREG 0.719 EMREG 0.707 Correlation Matrix of ETA and KSI
ATREG EMREG SR ATREG 1.000 EMREG 0.508 1.000 SR 0.719 0.707 1.000 PSI
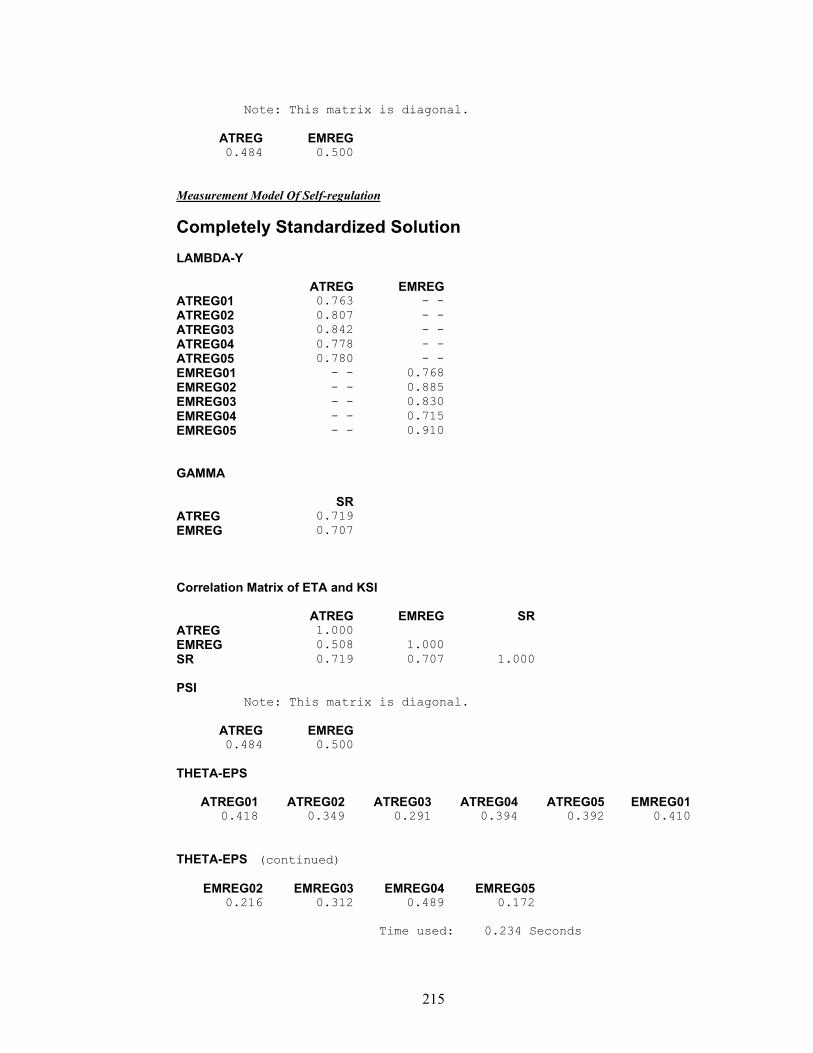
215
Note: This matrix is diagonal.
ATREG EMREG 0.484 0.500
Measurement Model Of Self-regulation
Completely Standardized Solution LAMBDA-Y
ATREG EMREG ATREG01 0.763 - - ATREG02 0.807 - - ATREG03 0.842 - - ATREG04 0.778 - - ATREG05 0.780 - - EMREG01 - - 0.768 EMREG02 - - 0.885 EMREG03 - - 0.830 EMREG04 - - 0.715 EMREG05 - - 0.910 GAMMA
SR ATREG 0.719 EMREG 0.707 Correlation Matrix of ETA and KSI
ATREG EMREG SR ATREG 1.000 EMREG 0.508 1.000 SR 0.719 0.707 1.000 PSI Note: This matrix is diagonal.
ATREG EMREG 0.484 0.500
THETA-EPS ATREG01 ATREG02 ATREG03 ATREG04 ATREG05 EMREG01
0.418 0.349 0.291 0.394 0.392 0.410 THETA-EPS (continued) EMREG02 EMREG03 EMREG04 EMREG05
0.216 0.312 0.489 0.172 Time used: 0.234 Seconds
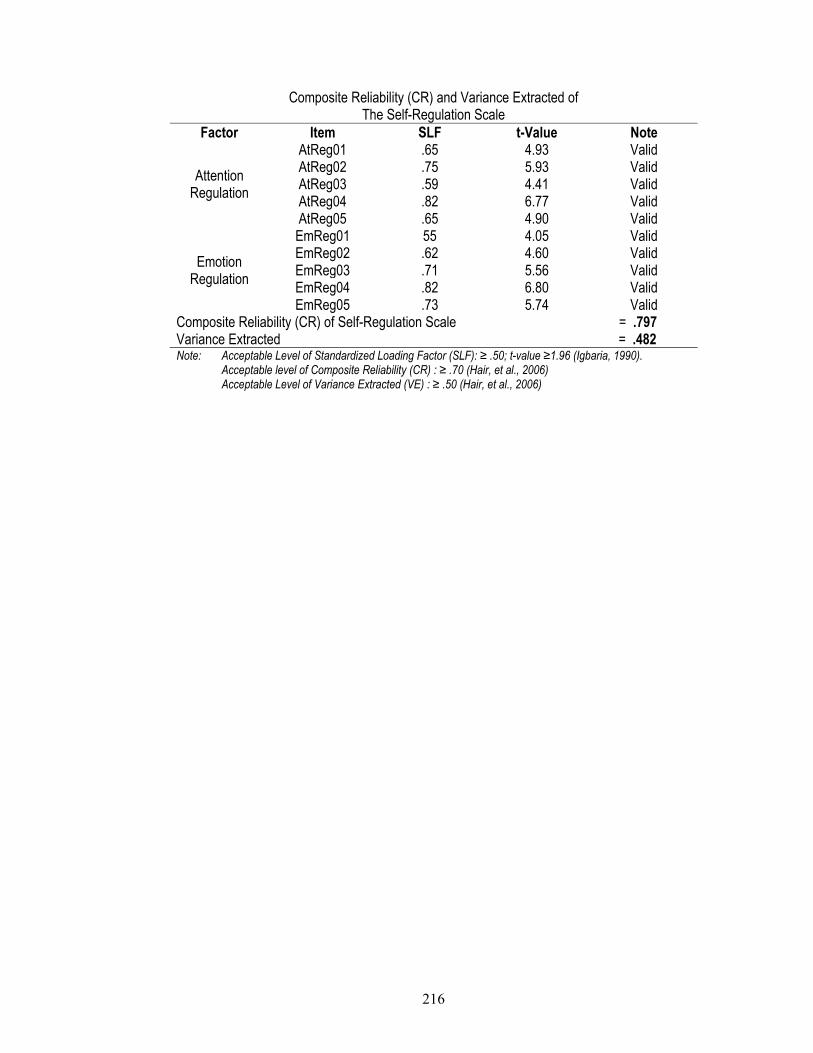
216
Composite Reliability (CR) and Variance Extracted of The Self-Regulation Scale
Factor Item SLF t-Value Note
Attention Regulation
AtReg01 .65 4.93 Valid AtReg02 .75 5.93 Valid AtReg03 .59 4.41 Valid AtReg04 .82 6.77 Valid AtReg05 .65 4.90 Valid
Emotion Regulation
EmReg01 55 4.05 Valid EmReg02 .62 4.60 Valid EmReg03 .71 5.56 Valid EmReg04 .82 6.80 Valid EmReg05 .73 5.74 Valid
Composite Reliability (CR) of Self-Regulation Scale = .797 Variance Extracted = .482 Note: Acceptable Level of Standardized Loading Factor (SLF): ≥ .50; t-value ≥1.96 (Igbaria, 1990). Acceptable level of Composite Reliability (CR) : ≥ .70 (Hair, et al., 2006) Acceptable Level of Variance Extracted (VE) : ≥ .50 (Hair, et al., 2006)

217
Appendix B4: Validity and Reliability of The Brief Self-Control Scale DATE: 9/12/2017 TIME: 20:00 L I S R E L 8.80 BY Karl G. Jöreskog and Dag Sörbom This program is published exclusively by Scientific Software International, Inc. 7383 N. Lincoln Avenue, Suite 100 Lincolnwood, IL 60712, U.S.A. Phone: (800)247-6113, (847)675-0720, Fax: (847)675-2140 Copyright by Scientific Software International, Inc., 1981-2006 Use of this program is subject to the terms specified in the Universal Copyright Convention. Website: www.ssicentral.com The following lines were read from file D:\Ma Study\Tryout\Pilot SC.spl: Second Order CFA by Robust Maximum Likelihood Raw Data from file 'D:Study.psf' Asymptotic Covariance Matrix from file Pilot.acm Sample Size = 628 Latent Variables Rest Impul SC Relationships REST01 = Rest REST02 = Rest REST03 = Rest REST04 = Rest REST05 = Rest REST06 = Rest REST07 = Rest IMPUL01 = Impul IMPUL02 = Impul IMPUL03 = Impul IMPUL04 = Impul IMPUL05 = Impul IMPUL06 = Impul Rest = SC Impul = SC Set the Error Variance of Rest and Impul correlate Path Diagram End of Problem Sample Size = 628
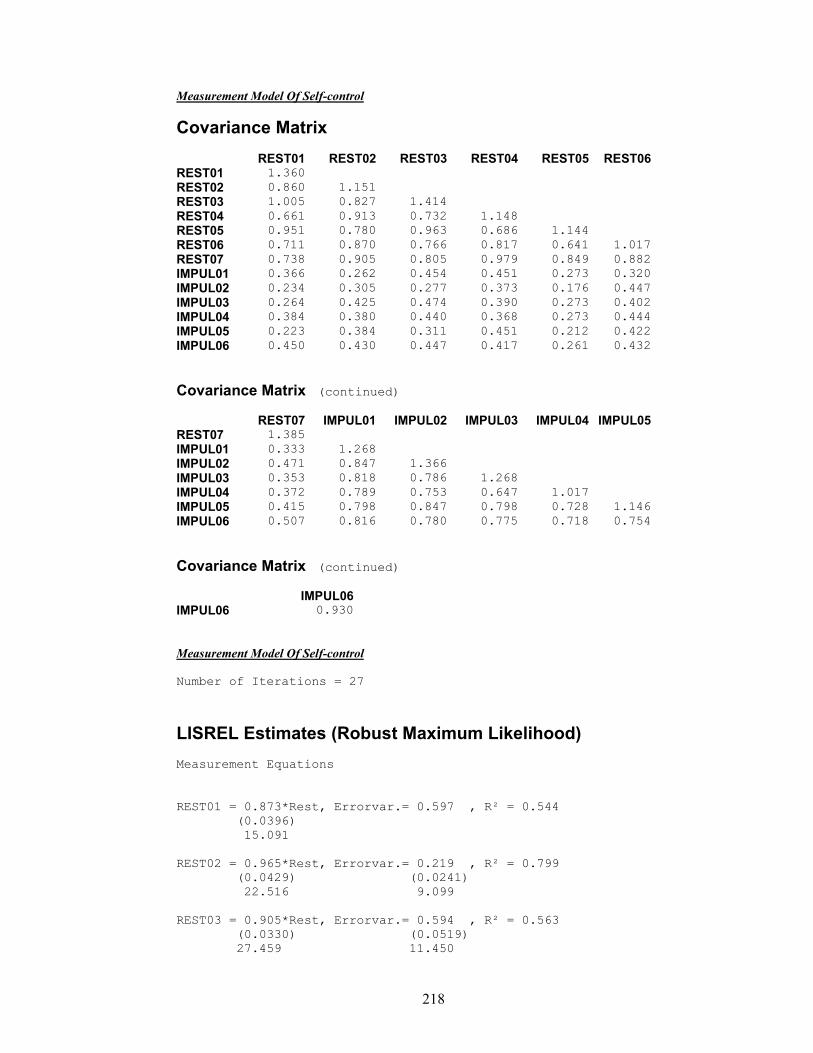
218
Measurement Model Of Self-control
Covariance Matrix
REST01 REST02 REST03 REST04 REST05 REST06 REST01 1.360 REST02 0.860 1.151 REST03 1.005 0.827 1.414 REST04 0.661 0.913 0.732 1.148 REST05 0.951 0.780 0.963 0.686 1.144 REST06 0.711 0.870 0.766 0.817 0.641 1.017 REST07 0.738 0.905 0.805 0.979 0.849 0.882 IMPUL01 0.366 0.262 0.454 0.451 0.273 0.320 IMPUL02 0.234 0.305 0.277 0.373 0.176 0.447 IMPUL03 0.264 0.425 0.474 0.390 0.273 0.402 IMPUL04 0.384 0.380 0.440 0.368 0.273 0.444 IMPUL05 0.223 0.384 0.311 0.451 0.212 0.422 IMPUL06 0.450 0.430 0.447 0.417 0.261 0.432
Covariance Matrix (continued)
REST07 IMPUL01 IMPUL02 IMPUL03 IMPUL04 IMPUL05 REST07 1.385 IMPUL01 0.333 1.268 IMPUL02 0.471 0.847 1.366 IMPUL03 0.353 0.818 0.786 1.268 IMPUL04 0.372 0.789 0.753 0.647 1.017 IMPUL05 0.415 0.798 0.847 0.798 0.728 1.146 IMPUL06 0.507 0.816 0.780 0.775 0.718 0.754
Covariance Matrix (continued)
IMPUL06 IMPUL06 0.930 Measurement Model Of Self-control Number of Iterations = 27
LISREL Estimates (Robust Maximum Likelihood) Measurement Equations REST01 = 0.873*Rest, Errorvar.= 0.597 , R² = 0.544
(0.0396) 15.091
REST02 = 0.965*Rest, Errorvar.= 0.219 , R² = 0.799
(0.0429) (0.0241) 22.516 9.099
REST03 = 0.905*Rest, Errorvar.= 0.594 , R² = 0.563
(0.0330) (0.0519) 27.459 11.450
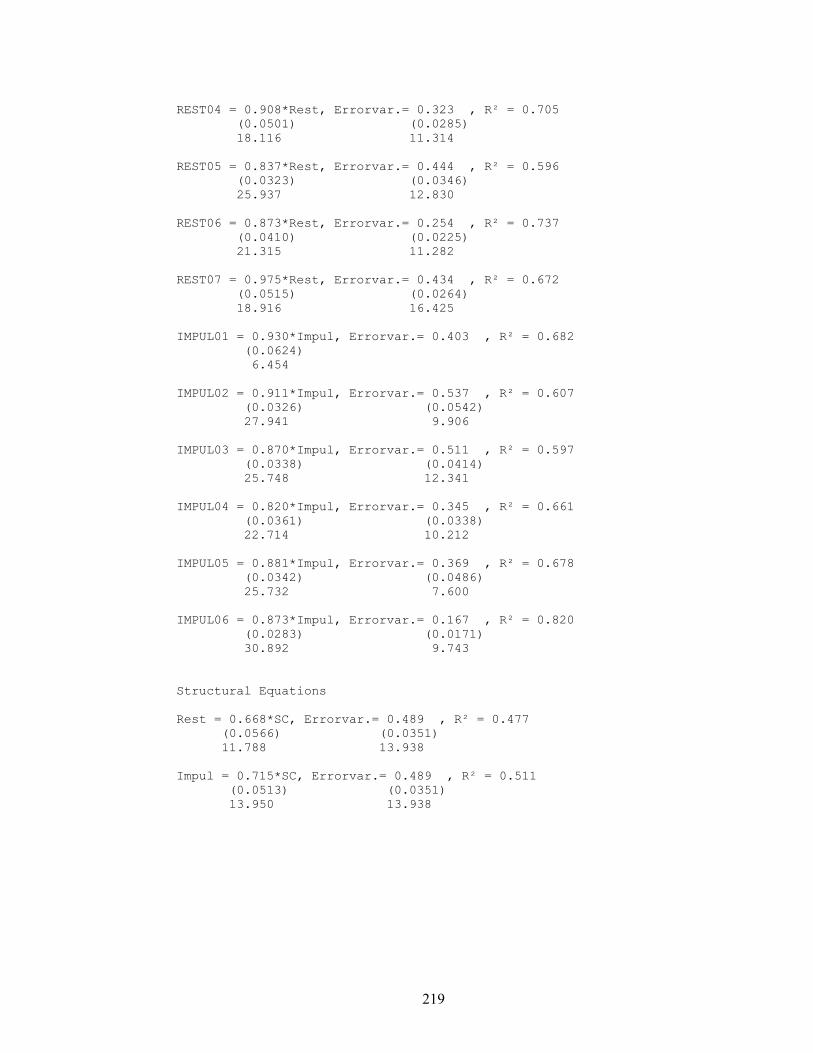
219
REST04 = 0.908*Rest, Errorvar.= 0.323 , R² = 0.705
(0.0501) (0.0285) 18.116 11.314
REST05 = 0.837*Rest, Errorvar.= 0.444 , R² = 0.596
(0.0323) (0.0346) 25.937 12.830
REST06 = 0.873*Rest, Errorvar.= 0.254 , R² = 0.737
(0.0410) (0.0225) 21.315 11.282
REST07 = 0.975*Rest, Errorvar.= 0.434 , R² = 0.672
(0.0515) (0.0264) 18.916 16.425
IMPUL01 = 0.930*Impul, Errorvar.= 0.403 , R² = 0.682
(0.0624) 6.454
IMPUL02 = 0.911*Impul, Errorvar.= 0.537 , R² = 0.607
(0.0326) (0.0542) 27.941 9.906
IMPUL03 = 0.870*Impul, Errorvar.= 0.511 , R² = 0.597
(0.0338) (0.0414) 25.748 12.341
IMPUL04 = 0.820*Impul, Errorvar.= 0.345 , R² = 0.661
(0.0361) (0.0338) 22.714 10.212
IMPUL05 = 0.881*Impul, Errorvar.= 0.369 , R² = 0.678
(0.0342) (0.0486) 25.732 7.600
IMPUL06 = 0.873*Impul, Errorvar.= 0.167 , R² = 0.820
(0.0283) (0.0171) 30.892 9.743
Structural Equations Rest = 0.668*SC, Errorvar.= 0.489 , R² = 0.477
(0.0566) (0.0351) 11.788 13.938
Impul = 0.715*SC, Errorvar.= 0.489 , R² = 0.511
(0.0513) (0.0351) 13.950 13.938
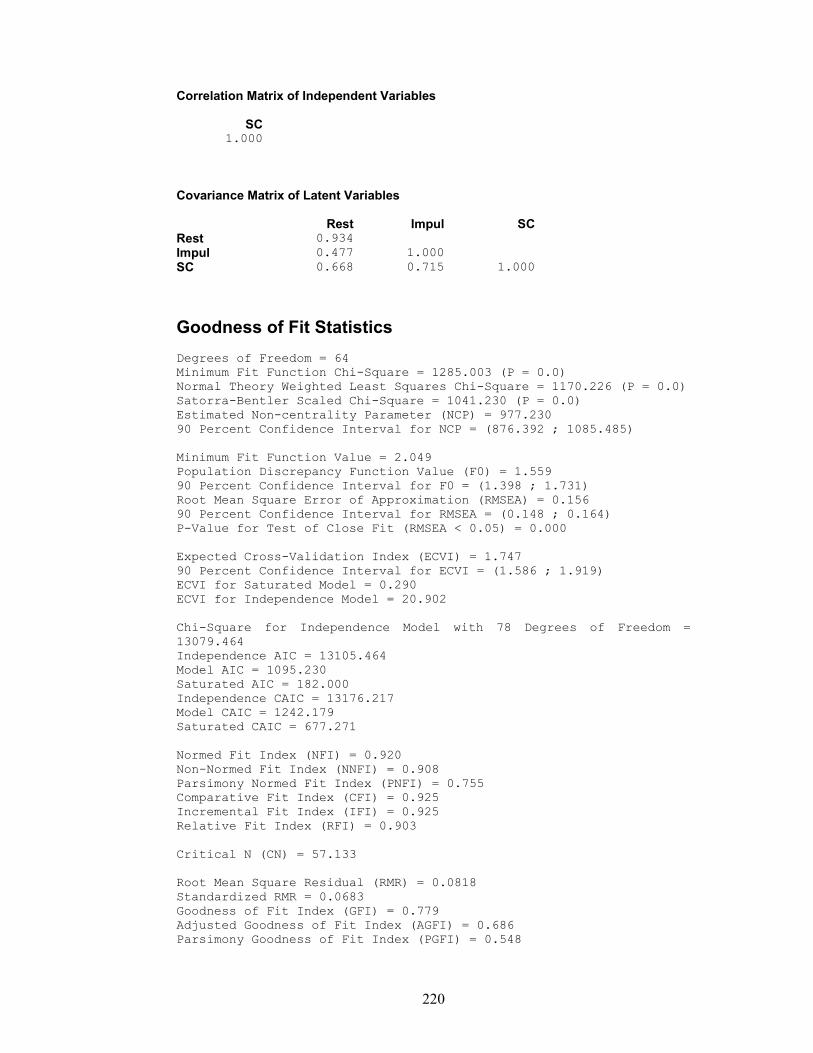
220
Correlation Matrix of Independent Variables
SC 1.000
Covariance Matrix of Latent Variables
Rest Impul SC Rest 0.934 Impul 0.477 1.000 SC 0.668 0.715 1.000
Goodness of Fit Statistics Degrees of Freedom = 64 Minimum Fit Function Chi-Square = 1285.003 (P = 0.0) Normal Theory Weighted Least Squares Chi-Square = 1170.226 (P = 0.0) Satorra-Bentler Scaled Chi-Square = 1041.230 (P = 0.0) Estimated Non-centrality Parameter (NCP) = 977.230 90 Percent Confidence Interval for NCP = (876.392 ; 1085.485) Minimum Fit Function Value = 2.049 Population Discrepancy Function Value (F0) = 1.559 90 Percent Confidence Interval for F0 = (1.398 ; 1.731) Root Mean Square Error of Approximation (RMSEA) = 0.156 90 Percent Confidence Interval for RMSEA = (0.148 ; 0.164) P-Value for Test of Close Fit (RMSEA < 0.05) = 0.000 Expected Cross-Validation Index (ECVI) = 1.747 90 Percent Confidence Interval for ECVI = (1.586 ; 1.919) ECVI for Saturated Model = 0.290 ECVI for Independence Model = 20.902 Chi-Square for Independence Model with 78 Degrees of Freedom = 13079.464 Independence AIC = 13105.464 Model AIC = 1095.230 Saturated AIC = 182.000 Independence CAIC = 13176.217 Model CAIC = 1242.179 Saturated CAIC = 677.271 Normed Fit Index (NFI) = 0.920 Non-Normed Fit Index (NNFI) = 0.908 Parsimony Normed Fit Index (PNFI) = 0.755 Comparative Fit Index (CFI) = 0.925 Incremental Fit Index (IFI) = 0.925 Relative Fit Index (RFI) = 0.903 Critical N (CN) = 57.133 Root Mean Square Residual (RMR) = 0.0818 Standardized RMR = 0.0683 Goodness of Fit Index (GFI) = 0.779 Adjusted Goodness of Fit Index (AGFI) = 0.686 Parsimony Goodness of Fit Index (PGFI) = 0.548
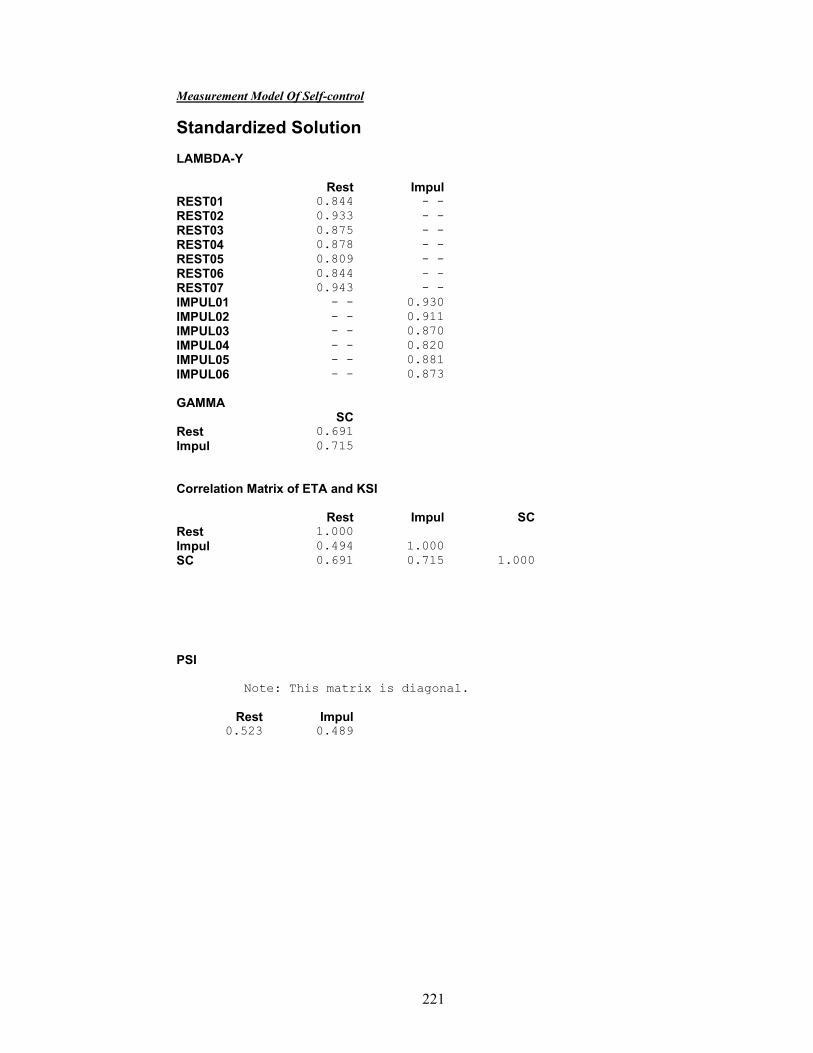
221
Measurement Model Of Self-control
Standardized Solution LAMBDA-Y
Rest Impul REST01 0.844 - - REST02 0.933 - - REST03 0.875 - - REST04 0.878 - - REST05 0.809 - - REST06 0.844 - - REST07 0.943 - - IMPUL01 - - 0.930 IMPUL02 - - 0.911 IMPUL03 - - 0.870 IMPUL04 - - 0.820 IMPUL05 - - 0.881 IMPUL06 - - 0.873 GAMMA
SC Rest 0.691 Impul 0.715 Correlation Matrix of ETA and KSI
Rest Impul SC Rest 1.000 Impul 0.494 1.000 SC 0.691 0.715 1.000 PSI Note: This matrix is diagonal.
Rest Impul 0.523 0.489
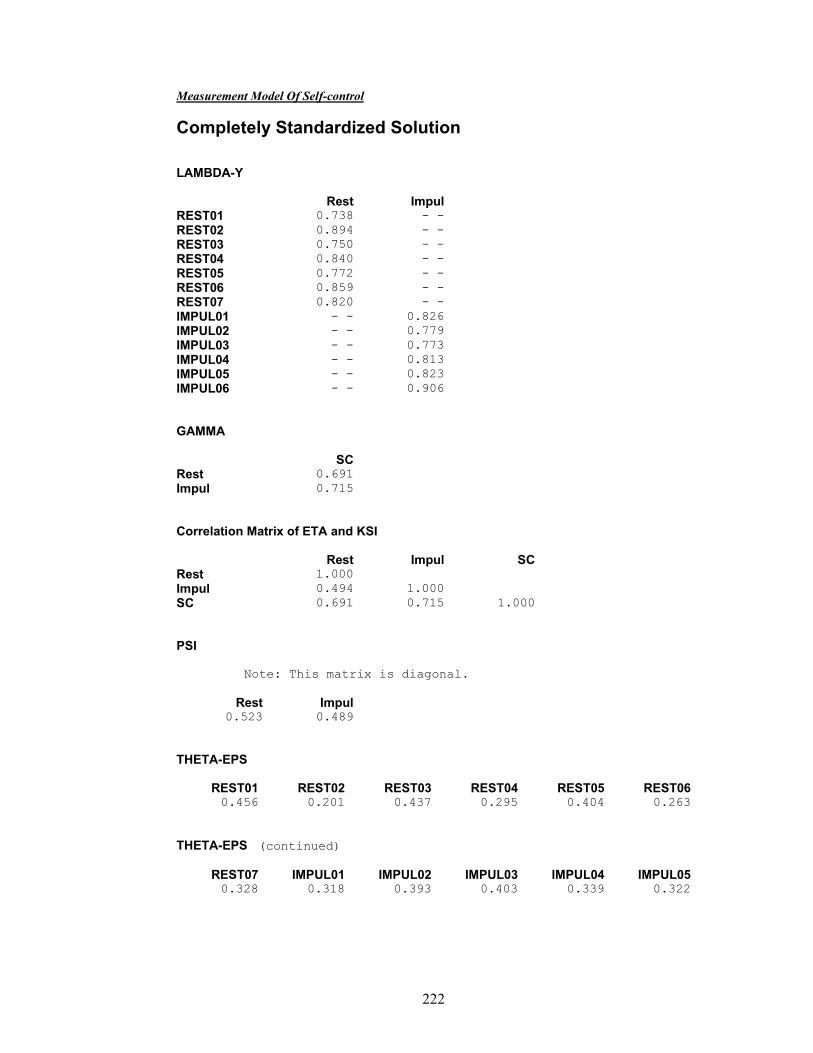
222
Measurement Model Of Self-control
Completely Standardized Solution LAMBDA-Y
Rest Impul REST01 0.738 - - REST02 0.894 - - REST03 0.750 - - REST04 0.840 - - REST05 0.772 - - REST06 0.859 - - REST07 0.820 - - IMPUL01 - - 0.826 IMPUL02 - - 0.779 IMPUL03 - - 0.773 IMPUL04 - - 0.813 IMPUL05 - - 0.823 IMPUL06 - - 0.906 GAMMA
SC Rest 0.691 Impul 0.715 Correlation Matrix of ETA and KSI
Rest Impul SC Rest 1.000 Impul 0.494 1.000 SC 0.691 0.715 1.000 PSI Note: This matrix is diagonal.
Rest Impul 0.523 0.489
THETA-EPS
REST01 REST02 REST03 REST04 REST05 REST06 0.456 0.201 0.437 0.295 0.404 0.263
THETA-EPS (continued)
REST07 IMPUL01 IMPUL02 IMPUL03 IMPUL04 IMPUL05 0.328 0.318 0.393 0.403 0.339 0.322
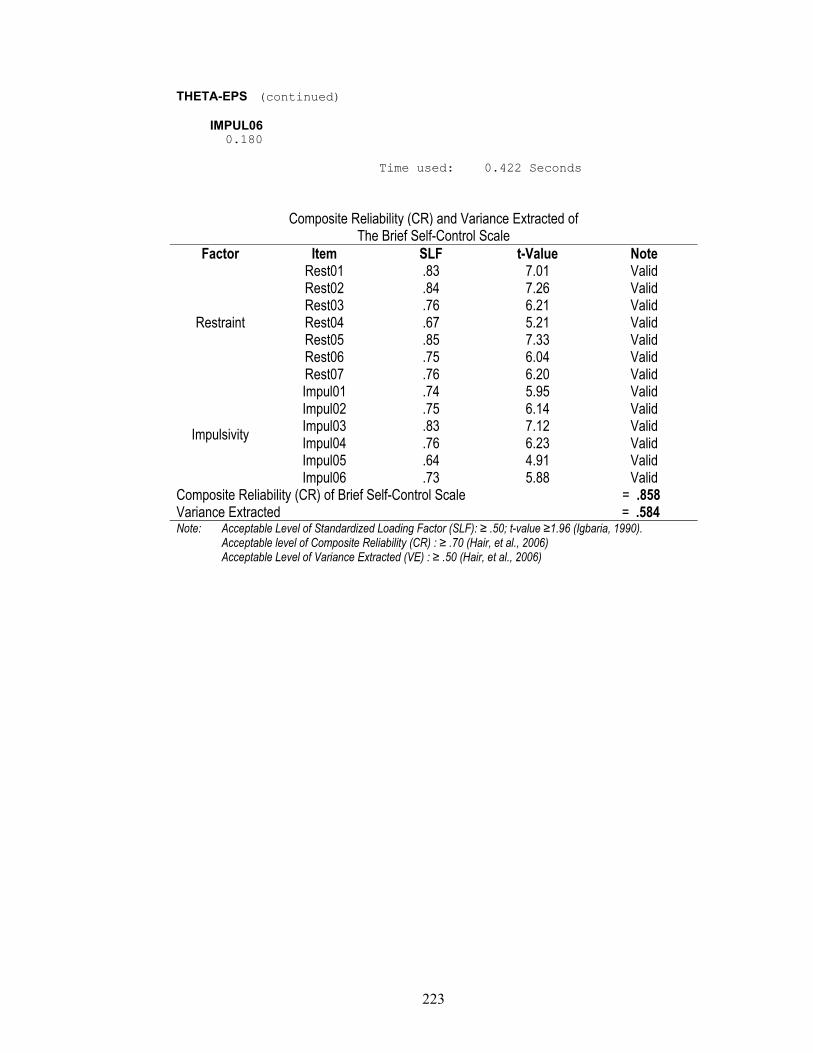
223
THETA-EPS (continued)
IMPUL06 0.180
Time used: 0.422 Seconds
Composite Reliability (CR) and Variance Extracted of The Brief Self-Control Scale
Factor Item SLF t-Value Note
Restraint
Rest01 .83 7.01 Valid Rest02 .84 7.26 Valid Rest03 .76 6.21 Valid Rest04 .67 5.21 Valid Rest05 .85 7.33 Valid Rest06 .75 6.04 Valid Rest07 .76 6.20 Valid
Impulsivity
Impul01 .74 5.95 Valid Impul02 .75 6.14 Valid Impul03 .83 7.12 Valid Impul04 .76 6.23 Valid Impul05 .64 4.91 Valid Impul06 .73 5.88 Valid
Composite Reliability (CR) of Brief Self-Control Scale = .858 Variance Extracted = .584 Note: Acceptable Level of Standardized Loading Factor (SLF): ≥ .50; t-value ≥1.96 (Igbaria, 1990). Acceptable level of Composite Reliability (CR) : ≥ .70 (Hair, et al., 2006) Acceptable Level of Variance Extracted (VE) : ≥ .50 (Hair, et al., 2006)

224
Appendix B5: Validity and Reliability of The Centralistic Religious Scale DATE: 9/12/2017 TIME: 19:56 L I S R E L 8.80 BY Karl G. Jöreskog and Dag Sörbom This program is published exclusively by Scientific Software International, Inc. 7383 N. Lincoln Avenue, Suite 100 Lincolnwood, IL 60712, U.S.A. Phone: (800)247-6113, (847)675-0720, Fax: (847)675-2140 Copyright by Scientific Software International, Inc., 1981-2006 Use of this program is subject to the terms specified in the Universal Copyright Convention. Website: www.ssicentral.com The following lines were read from file D:\Ma Study\Tryout\RL Pilot.spl: Second Order CFA Estimated by Robust Maximum Likelihood Raw Data from file 'D:Study.psf' Asymptotic Covariance Matrix from file Pilot.acm Latent Variables Intel Ideol PubPr PrvPr RelEx RL Relationships INTEL01 = Intel INTEL02 = Intel INTEL03 = Intel IDEOL01 = Ideol IDEOL02 = Ideol IDEOL03 = Ideol PUBPR01 = PubPr PUBPR02 = PubPr PUBPR03 = PubPr PRVPR01 = PrvPr PRVPR02 = PrvPr PRVPR03 = PrvPr RELEX01 = RelEx RELEX02 = RelEx RELEX03 = RelEx Intel = RL Ideol = RL PubPr = RL PrvPr = RL RelEx = RL Path Diagram End of Problem Sample Size = 50

225
Measurement Validity Of Religiosity
Covariance Matrix
INTEL01 INTEL02 INTEL03 IDEOL01 IDEOL02 IDEOL03 INTEL01 1.118 INTEL02 0.649 1.144 INTEL03 0.696 0.698 1.126 IDEOL01 0.635 0.771 0.585 1.298 IDEOL02 0.477 0.682 0.531 0.705 1.189 IDEOL03 0.648 0.620 0.625 0.836 0.661 1.115 PUBPR01 0.499 0.543 0.452 0.597 0.423 0.439 PUBPR02 0.435 0.567 0.540 0.811 0.626 0.593 PUBPR03 0.309 0.486 0.524 0.623 0.726 0.448 PRVPR01 0.184 0.604 0.318 0.487 0.429 0.221 PRVPR02 0.279 0.657 0.439 0.516 0.578 0.387 PRVPR03 0.296 0.547 0.536 0.570 0.567 0.575 RELEX01 0.362 0.404 0.144 0.737 0.620 0.607 RELEX02 0.213 0.339 0.207 0.515 0.423 0.480 RELEX03 0.353 0.241 0.316 0.627 0.442 0.573
Covariance Matrix (continued)
PUBPR01 PUBPR02 PUBPR03 PRVPR01 PRVPR02 PRVPR03 PUBPR01 1.244 PUBPR02 0.707 1.561 PUBPR03 0.719 0.709 1.257 PRVPR01 0.389 0.403 0.384 1.466 PRVPR02 0.395 0.461 0.455 0.883 1.275 PRVPR03 0.552 0.635 0.590 0.748 0.691 1.028 RELEX01 0.580 0.741 0.574 0.287 0.504 0.419 RELEX02 0.508 0.544 0.658 0.206 0.375 0.409 RELEX03 0.687 0.600 0.688 0.260 0.461 0.553
Covariance Matrix (continued)
RELEX01 RELEX02 RELEX03 RELEX01 1.363 RELEX02 0.784 1.203 RELEX03 0.823 0.891 1.602
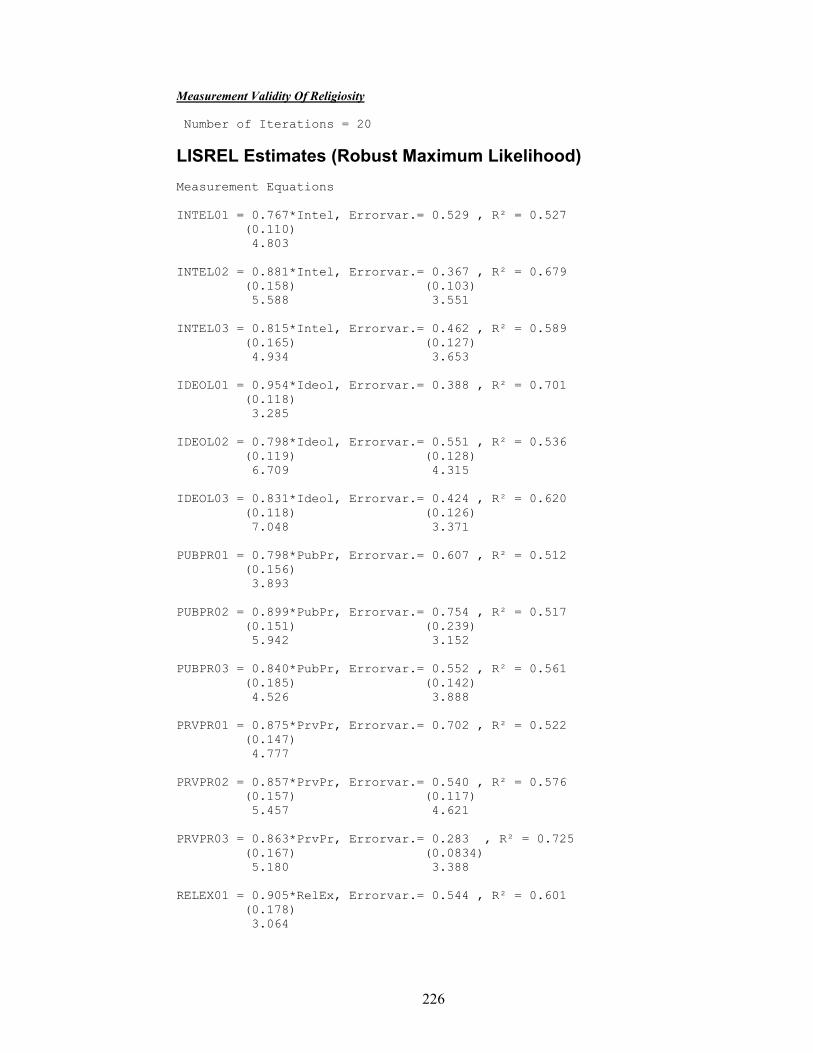
226
Measurement Validity Of Religiosity Number of Iterations = 20
LISREL Estimates (Robust Maximum Likelihood) Measurement Equations INTEL01 = 0.767*Intel, Errorvar.= 0.529 , R² = 0.527
(0.110) 4.803
INTEL02 = 0.881*Intel, Errorvar.= 0.367 , R² = 0.679
(0.158) (0.103) 5.588 3.551
INTEL03 = 0.815*Intel, Errorvar.= 0.462 , R² = 0.589
(0.165) (0.127) 4.934 3.653
IDEOL01 = 0.954*Ideol, Errorvar.= 0.388 , R² = 0.701
(0.118) 3.285
IDEOL02 = 0.798*Ideol, Errorvar.= 0.551 , R² = 0.536
(0.119) (0.128) 6.709 4.315
IDEOL03 = 0.831*Ideol, Errorvar.= 0.424 , R² = 0.620
(0.118) (0.126) 7.048 3.371
PUBPR01 = 0.798*PubPr, Errorvar.= 0.607 , R² = 0.512
(0.156) 3.893
PUBPR02 = 0.899*PubPr, Errorvar.= 0.754 , R² = 0.517
(0.151) (0.239) 5.942 3.152
PUBPR03 = 0.840*PubPr, Errorvar.= 0.552 , R² = 0.561
(0.185) (0.142) 4.526 3.888
PRVPR01 = 0.875*PrvPr, Errorvar.= 0.702 , R² = 0.522
(0.147) 4.777
PRVPR02 = 0.857*PrvPr, Errorvar.= 0.540 , R² = 0.576
(0.157) (0.117) 5.457 4.621
PRVPR03 = 0.863*PrvPr, Errorvar.= 0.283 , R² = 0.725
(0.167) (0.0834) 5.180 3.388
RELEX01 = 0.905*RelEx, Errorvar.= 0.544 , R² = 0.601
(0.178) 3.064
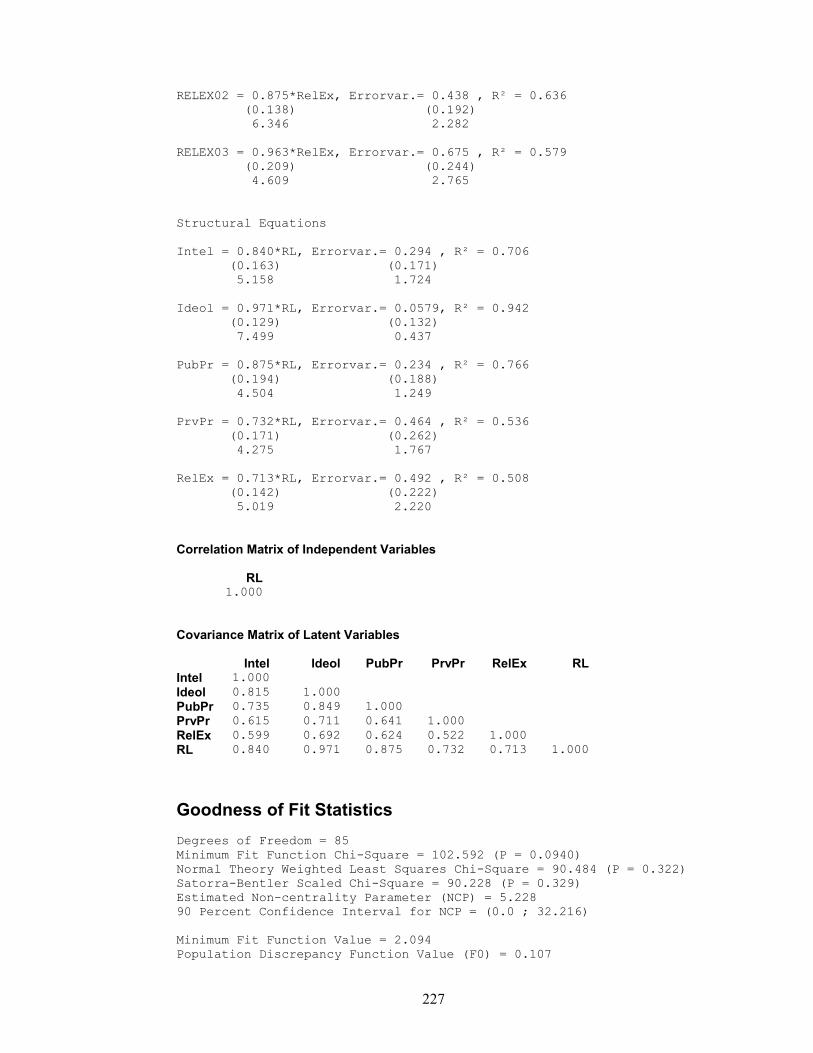
227
RELEX02 = 0.875*RelEx, Errorvar.= 0.438 , R² = 0.636 (0.138) (0.192) 6.346 2.282
RELEX03 = 0.963*RelEx, Errorvar.= 0.675 , R² = 0.579
(0.209) (0.244) 4.609 2.765
Structural Equations Intel = 0.840*RL, Errorvar.= 0.294 , R² = 0.706
(0.163) (0.171) 5.158 1.724
Ideol = 0.971*RL, Errorvar.= 0.0579, R² = 0.942
(0.129) (0.132) 7.499 0.437
PubPr = 0.875*RL, Errorvar.= 0.234 , R² = 0.766
(0.194) (0.188) 4.504 1.249
PrvPr = 0.732*RL, Errorvar.= 0.464 , R² = 0.536
(0.171) (0.262) 4.275 1.767
RelEx = 0.713*RL, Errorvar.= 0.492 , R² = 0.508
(0.142) (0.222) 5.019 2.220
Correlation Matrix of Independent Variables
RL 1.000
Covariance Matrix of Latent Variables
Intel Ideol PubPr PrvPr RelEx RL Intel 1.000 Ideol 0.815 1.000 PubPr 0.735 0.849 1.000 PrvPr 0.615 0.711 0.641 1.000 RelEx 0.599 0.692 0.624 0.522 1.000 RL 0.840 0.971 0.875 0.732 0.713 1.000
Goodness of Fit Statistics Degrees of Freedom = 85 Minimum Fit Function Chi-Square = 102.592 (P = 0.0940) Normal Theory Weighted Least Squares Chi-Square = 90.484 (P = 0.322) Satorra-Bentler Scaled Chi-Square = 90.228 (P = 0.329) Estimated Non-centrality Parameter (NCP) = 5.228 90 Percent Confidence Interval for NCP = (0.0 ; 32.216) Minimum Fit Function Value = 2.094 Population Discrepancy Function Value (F0) = 0.107
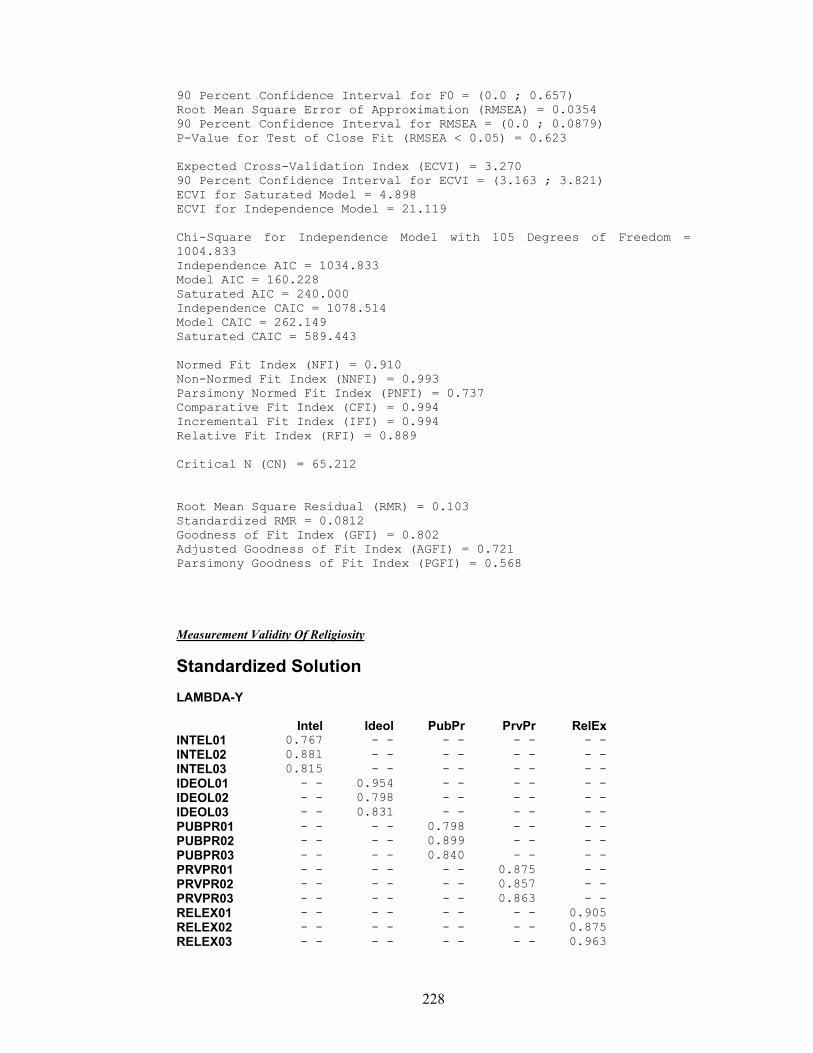
228
90 Percent Confidence Interval for F0 = (0.0 ; 0.657) Root Mean Square Error of Approximation (RMSEA) = 0.0354 90 Percent Confidence Interval for RMSEA = (0.0 ; 0.0879) P-Value for Test of Close Fit (RMSEA < 0.05) = 0.623 Expected Cross-Validation Index (ECVI) = 3.270 90 Percent Confidence Interval for ECVI = (3.163 ; 3.821) ECVI for Saturated Model = 4.898 ECVI for Independence Model = 21.119 Chi-Square for Independence Model with 105 Degrees of Freedom = 1004.833 Independence AIC = 1034.833 Model AIC = 160.228 Saturated AIC = 240.000 Independence CAIC = 1078.514 Model CAIC = 262.149 Saturated CAIC = 589.443 Normed Fit Index (NFI) = 0.910 Non-Normed Fit Index (NNFI) = 0.993 Parsimony Normed Fit Index (PNFI) = 0.737 Comparative Fit Index (CFI) = 0.994 Incremental Fit Index (IFI) = 0.994 Relative Fit Index (RFI) = 0.889 Critical N (CN) = 65.212 Root Mean Square Residual (RMR) = 0.103 Standardized RMR = 0.0812 Goodness of Fit Index (GFI) = 0.802 Adjusted Goodness of Fit Index (AGFI) = 0.721 Parsimony Goodness of Fit Index (PGFI) = 0.568 Measurement Validity Of Religiosity
Standardized Solution LAMBDA-Y
Intel Ideol PubPr PrvPr RelEx INTEL01 0.767 - - - - - - - - INTEL02 0.881 - - - - - - - - INTEL03 0.815 - - - - - - - - IDEOL01 - - 0.954 - - - - - - IDEOL02 - - 0.798 - - - - - - IDEOL03 - - 0.831 - - - - - - PUBPR01 - - - - 0.798 - - - - PUBPR02 - - - - 0.899 - - - - PUBPR03 - - - - 0.840 - - - - PRVPR01 - - - - - - 0.875 - - PRVPR02 - - - - - - 0.857 - - PRVPR03 - - - - - - 0.863 - - RELEX01 - - - - - - - - 0.905 RELEX02 - - - - - - - - 0.875 RELEX03 - - - - - - - - 0.963
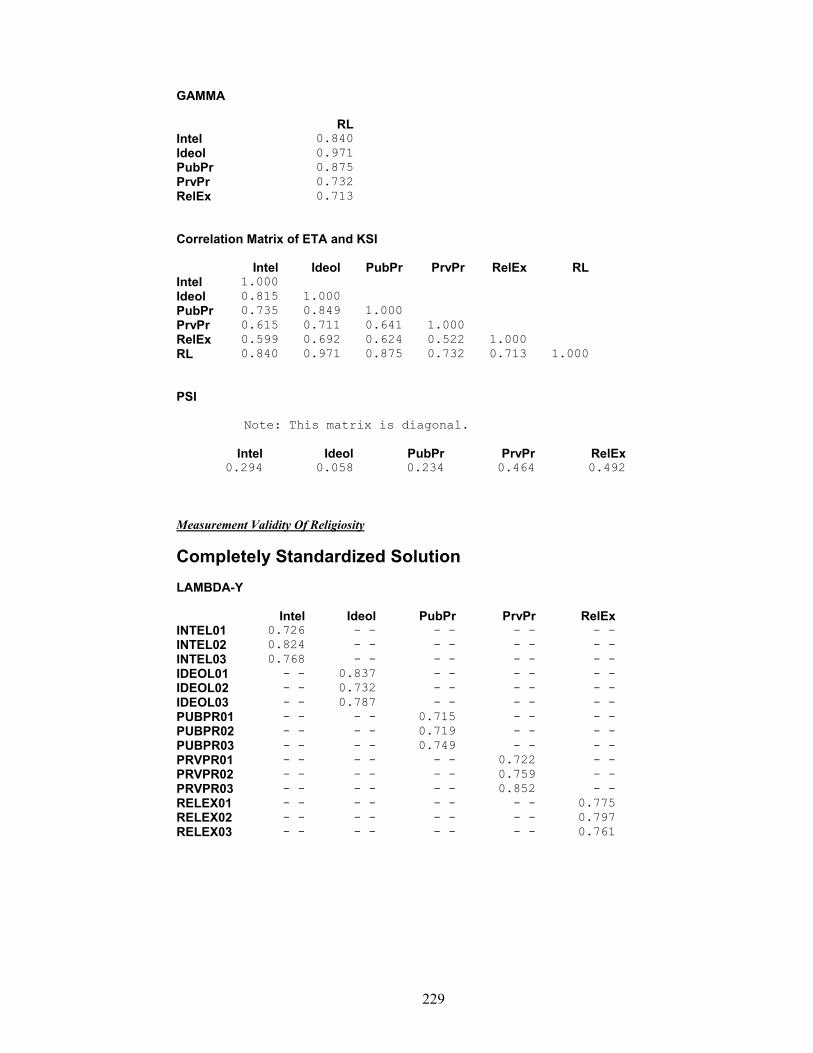
229
GAMMA
RL Intel 0.840 Ideol 0.971 PubPr 0.875 PrvPr 0.732 RelEx 0.713 Correlation Matrix of ETA and KSI
Intel Ideol PubPr PrvPr RelEx RL Intel 1.000 Ideol 0.815 1.000 PubPr 0.735 0.849 1.000 PrvPr 0.615 0.711 0.641 1.000 RelEx 0.599 0.692 0.624 0.522 1.000 RL 0.840 0.971 0.875 0.732 0.713 1.000 PSI Note: This matrix is diagonal.
Intel Ideol PubPr PrvPr RelEx 0.294 0.058 0.234 0.464 0.492
Measurement Validity Of Religiosity
Completely Standardized Solution LAMBDA-Y
Intel Ideol PubPr PrvPr RelEx INTEL01 0.726 - - - - - - - - INTEL02 0.824 - - - - - - - - INTEL03 0.768 - - - - - - - - IDEOL01 - - 0.837 - - - - - - IDEOL02 - - 0.732 - - - - - - IDEOL03 - - 0.787 - - - - - - PUBPR01 - - - - 0.715 - - - - PUBPR02 - - - - 0.719 - - - - PUBPR03 - - - - 0.749 - - - - PRVPR01 - - - - - - 0.722 - - PRVPR02 - - - - - - 0.759 - - PRVPR03 - - - - - - 0.852 - - RELEX01 - - - - - - - - 0.775 RELEX02 - - - - - - - - 0.797 RELEX03 - - - - - - - - 0.761
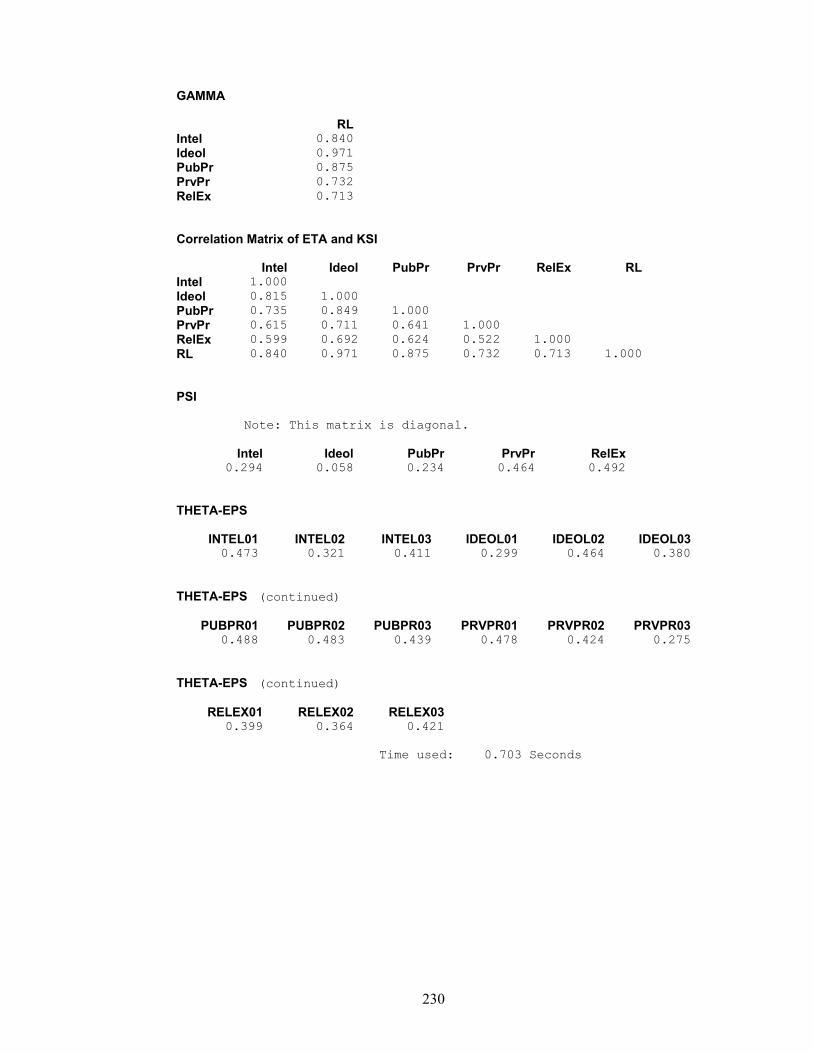
230
GAMMA
RL Intel 0.840 Ideol 0.971 PubPr 0.875 PrvPr 0.732 RelEx 0.713 Correlation Matrix of ETA and KSI
Intel Ideol PubPr PrvPr RelEx RL Intel 1.000 Ideol 0.815 1.000 PubPr 0.735 0.849 1.000 PrvPr 0.615 0.711 0.641 1.000 RelEx 0.599 0.692 0.624 0.522 1.000 RL 0.840 0.971 0.875 0.732 0.713 1.000 PSI Note: This matrix is diagonal.
Intel Ideol PubPr PrvPr RelEx 0.294 0.058 0.234 0.464 0.492
THETA-EPS
INTEL01 INTEL02 INTEL03 IDEOL01 IDEOL02 IDEOL03 0.473 0.321 0.411 0.299 0.464 0.380
THETA-EPS (continued) PUBPR01 PUBPR02 PUBPR03 PRVPR01 PRVPR02 PRVPR03
0.488 0.483 0.439 0.478 0.424 0.275 THETA-EPS (continued)
RELEX01 RELEX02 RELEX03 0.399 0.364 0.421
Time used: 0.703 Seconds
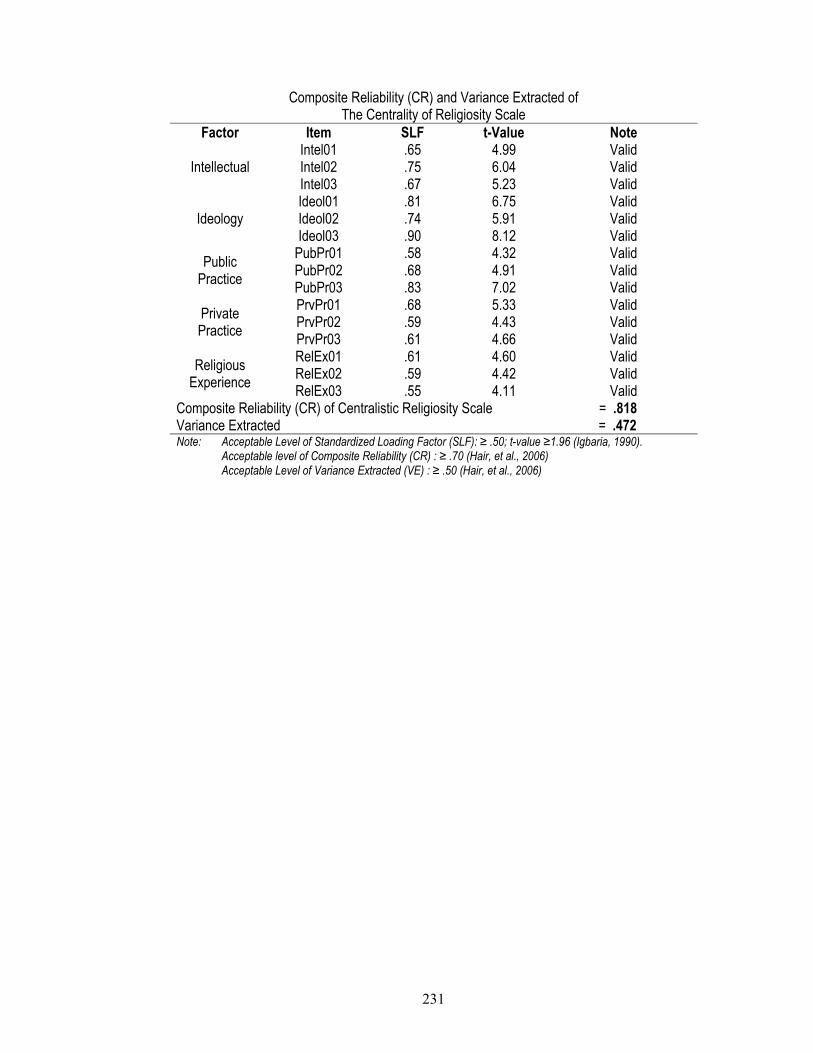
231
Composite Reliability (CR) and Variance Extracted of The Centrality of Religiosity Scale
Factor Item SLF t-Value Note
Intellectual Intel01 .65 4.99 Valid Intel02 .75 6.04 Valid Intel03 .67 5.23 Valid
Ideology Ideol01 .81 6.75 Valid Ideol02 .74 5.91 Valid Ideol03 .90 8.12 Valid
Public Practice
PubPr01 .58 4.32 Valid PubPr02 .68 4.91 Valid PubPr03 .83 7.02 Valid
Private Practice
PrvPr01 .68 5.33 Valid PrvPr02 .59 4.43 Valid PrvPr03 .61 4.66 Valid
Religious Experience
RelEx01 .61 4.60 Valid RelEx02 .59 4.42 Valid RelEx03 .55 4.11 Valid
Composite Reliability (CR) of Centralistic Religiosity Scale = .818 Variance Extracted = .472 Note: Acceptable Level of Standardized Loading Factor (SLF): ≥ .50; t-value ≥1.96 (Igbaria, 1990). Acceptable level of Composite Reliability (CR) : ≥ .70 (Hair, et al., 2006) Acceptable Level of Variance Extracted (VE) : ≥ .50 (Hair, et al., 2006)
232
APPENDIX C: MAIN STUDY RESULTS Appendix C1: Measurement Model Of Centralistic Religious Scale
(CRS)
233
234

235
L I S R E L 8.80 BY Karl G. Jöreskog and Dag Sörbom This program is published exclusively by Scientific Software International, Inc. 7383 N. Lincoln Avenue, Suite 100 Lincolnwood, IL 60712, U.S.A. Phone: (800)247-6113, (847)675-0720, Fax: (847)675-2140 Copyright by Scientific Software International, Inc., 1981-2006 Use of this program is subject to the terms specified in the Universal Copyright Convention. Website: www.ssicentral.com The following lines were read from file D:\Ma Study\01 main study Raw score\RL.spl: Second Order CFA Estimated by Maximum Likelihood Raw Data from file 'D:Study1 main study Raw score.psf' Latent Variables Intel Ideol PubPr PrvPr RelEx RL Relationships INTEL01 = Intel INTEL02 = Intel INTEL03 = Intel IDEOL01 = Ideol IDEOL02 = Ideol IDEOL03 = Ideol PUBPR01 = PubPr PUBPR02 = PubPr PUBPR03 = PubPr PRVPR01 = PrvPr PRVPR02 = PrvPr PRVPR03 = PrvPr RELEX01 = RelEx RELEX02 = RelEx RELEX03 = RelEx Intel = RL Ideol = RL PubPr = RL PrvPr = RL RelEx = RL Set the Error Covariance of PrvPr and Ideol Correlate Set the Error Covariance of RelEx and PubPr Correlate Path Diagram End of Problem Sample Size = 628
236
Measurement Model Of Religiosity
Covariance Matrix
INTEL01 INTEL02 INTEL03 IDEOL01 IDEOL02 IDEOL03 INTEL01 1.340 INTEL02 0.952 1.350 INTEL03 0.920 0.897 1.293 IDEOL01 0.392 0.432 0.403 1.406 IDEOL02 0.414 0.469 0.465 0.952 1.439 IDEOL03 0.405 0.422 0.403 0.987 0.928 1.319 PUBPR01 0.433 0.455 0.465 0.335 0.357 0.364 PUBPR02 0.421 0.464 0.445 0.368 0.367 0.395 PUBPR03 0.434 0.415 0.446 0.332 0.308 0.341 PRVPR01 0.489 0.514 0.540 0.726 0.773 0.732 PRVPR02 0.520 0.574 0.551 0.741 0.770 0.724 PRVPR03 0.523 0.575 0.557 0.794 0.799 0.760 RELEX01 0.611 0.606 0.627 0.499 0.493 0.500 RELEX02 0.604 0.617 0.637 0.555 0.555 0.552 RELEX03 0.610 0.613 0.630 0.572 0.507 0.564
Covariance Matrix (continued)
PUBPR01 PUBPR02 PUBPR03 PRVPR01 PRVPR02 PRVPR03 PUBPR01 1.342 PUBPR02 0.885 1.343 PUBPR03 0.788 0.838 1.250 PRVPR01 0.438 0.430 0.371 1.238 PRVPR02 0.471 0.504 0.460 0.850 1.258 PRVPR03 0.472 0.523 0.474 0.867 0.857 1.305 RELEX01 0.776 0.731 0.717 0.572 0.651 0.630 RELEX02 0.750 0.776 0.776 0.588 0.691 0.642 RELEX03 0.766 0.778 0.733 0.630 0.656 0.642
Covariance Matrix (continued)
RELEX01 RELEX02 RELEX03 RELEX01 1.223 RELEX02 0.882 1.258 RELEX03 0.898 0.910 1.310
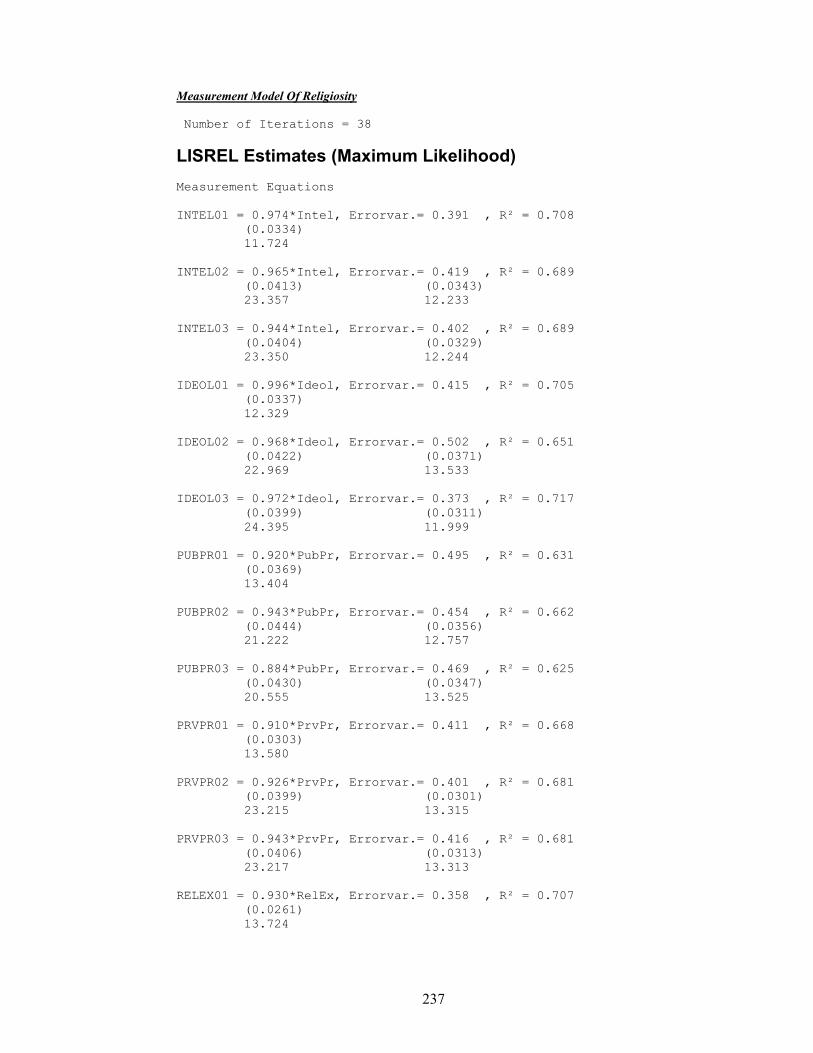
237
Measurement Model Of Religiosity Number of Iterations = 38
LISREL Estimates (Maximum Likelihood) Measurement Equations INTEL01 = 0.974*Intel, Errorvar.= 0.391 , R² = 0.708
(0.0334) 11.724
INTEL02 = 0.965*Intel, Errorvar.= 0.419 , R² = 0.689
(0.0413) (0.0343) 23.357 12.233
INTEL03 = 0.944*Intel, Errorvar.= 0.402 , R² = 0.689
(0.0404) (0.0329) 23.350 12.244
IDEOL01 = 0.996*Ideol, Errorvar.= 0.415 , R² = 0.705
(0.0337) 12.329
IDEOL02 = 0.968*Ideol, Errorvar.= 0.502 , R² = 0.651
(0.0422) (0.0371) 22.969 13.533
IDEOL03 = 0.972*Ideol, Errorvar.= 0.373 , R² = 0.717
(0.0399) (0.0311) 24.395 11.999
PUBPR01 = 0.920*PubPr, Errorvar.= 0.495 , R² = 0.631
(0.0369) 13.404
PUBPR02 = 0.943*PubPr, Errorvar.= 0.454 , R² = 0.662
(0.0444) (0.0356) 21.222 12.757
PUBPR03 = 0.884*PubPr, Errorvar.= 0.469 , R² = 0.625
(0.0430) (0.0347) 20.555 13.525
PRVPR01 = 0.910*PrvPr, Errorvar.= 0.411 , R² = 0.668
(0.0303) 13.580
PRVPR02 = 0.926*PrvPr, Errorvar.= 0.401 , R² = 0.681
(0.0399) (0.0301) 23.215 13.315
PRVPR03 = 0.943*PrvPr, Errorvar.= 0.416 , R² = 0.681
(0.0406) (0.0313) 23.217 13.313
RELEX01 = 0.930*RelEx, Errorvar.= 0.358 , R² = 0.707
(0.0261) 13.724

238
RELEX02 = 0.954*RelEx, Errorvar.= 0.348 , R² = 0.723 (0.0366) (0.0260) 26.064 13.383
RELEX03 = 0.957*RelEx, Errorvar.= 0.395 , R² = 0.699
(0.0377) (0.0284) 25.374 13.898
Structural Equations Intel = 0.750*RL, Errorvar.= 0.438 , R² = 0.562
(0.0452) (0.0483) 16.593 9.056
Ideol = 0.627*RL, Errorvar.= 0.607 , R² = 0.393
(0.0466) (0.0580) 13.455 10.467
PubPr = 0.672*RL, Errorvar.= 0.549 , R² = 0.451
(0.0507) (0.0629) 13.245 8.719
PrvPr = 0.801*RL, Errorvar.= 0.358 , R² = 0.642
(0.0464) (0.0473) 17.278 7.573
RelEx = 0.904*RL, Errorvar.= 0.182 , R² = 0.818
(0.0456) (0.0453) 19.840 4.017
Error Covariance for PrvPr and Ideol = 0.331
(0.0405) 8.160
Error Covariance for RelEx and PubPr = 0.264
(0.0428) 6.165
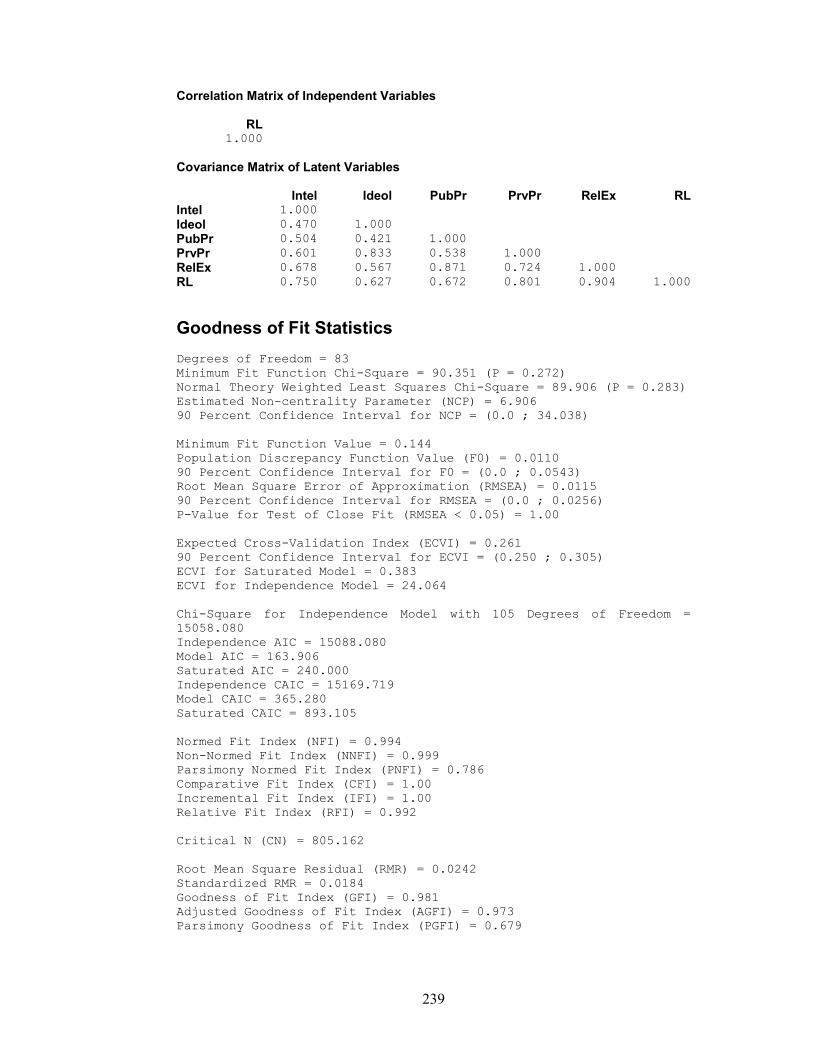
239
Correlation Matrix of Independent Variables
RL 1.000
Covariance Matrix of Latent Variables
Intel Ideol PubPr PrvPr RelEx RL Intel 1.000 Ideol 0.470 1.000 PubPr 0.504 0.421 1.000 PrvPr 0.601 0.833 0.538 1.000 RelEx 0.678 0.567 0.871 0.724 1.000 RL 0.750 0.627 0.672 0.801 0.904 1.000
Goodness of Fit Statistics Degrees of Freedom = 83 Minimum Fit Function Chi-Square = 90.351 (P = 0.272) Normal Theory Weighted Least Squares Chi-Square = 89.906 (P = 0.283) Estimated Non-centrality Parameter (NCP) = 6.906 90 Percent Confidence Interval for NCP = (0.0 ; 34.038) Minimum Fit Function Value = 0.144 Population Discrepancy Function Value (F0) = 0.0110 90 Percent Confidence Interval for F0 = (0.0 ; 0.0543) Root Mean Square Error of Approximation (RMSEA) = 0.0115 90 Percent Confidence Interval for RMSEA = (0.0 ; 0.0256) P-Value for Test of Close Fit (RMSEA < 0.05) = 1.00 Expected Cross-Validation Index (ECVI) = 0.261 90 Percent Confidence Interval for ECVI = (0.250 ; 0.305) ECVI for Saturated Model = 0.383 ECVI for Independence Model = 24.064 Chi-Square for Independence Model with 105 Degrees of Freedom = 15058.080 Independence AIC = 15088.080 Model AIC = 163.906 Saturated AIC = 240.000 Independence CAIC = 15169.719 Model CAIC = 365.280 Saturated CAIC = 893.105 Normed Fit Index (NFI) = 0.994 Non-Normed Fit Index (NNFI) = 0.999 Parsimony Normed Fit Index (PNFI) = 0.786 Comparative Fit Index (CFI) = 1.00 Incremental Fit Index (IFI) = 1.00 Relative Fit Index (RFI) = 0.992 Critical N (CN) = 805.162 Root Mean Square Residual (RMR) = 0.0242 Standardized RMR = 0.0184 Goodness of Fit Index (GFI) = 0.981 Adjusted Goodness of Fit Index (AGFI) = 0.973 Parsimony Goodness of Fit Index (PGFI) = 0.679

240
Measurement Model Of Religiosity
Fitted Covariance Matrix
INTEL01 INTEL02 INTEL03 IDEOL01 IDEOL02 IDEOL03 INTEL01 1.340 INTEL02 0.939 1.350 INTEL03 0.919 0.911 1.293 IDEOL01 0.456 0.452 0.442 1.406 IDEOL02 0.443 0.439 0.430 0.964 1.439 IDEOL03 0.445 0.441 0.432 0.968 0.942 1.319 PUBPR01 0.451 0.447 0.438 0.386 0.375 0.377 PUBPR02 0.463 0.458 0.448 0.396 0.385 0.386 PUBPR03 0.433 0.429 0.420 0.371 0.360 0.362 PRVPR01 0.532 0.527 0.516 0.754 0.734 0.737 PRVPR02 0.541 0.536 0.525 0.768 0.747 0.750 PRVPR03 0.551 0.546 0.535 0.782 0.761 0.764 RELEX01 0.614 0.608 0.595 0.525 0.511 0.513 RELEX02 0.630 0.624 0.611 0.539 0.524 0.526 RELEX03 0.632 0.626 0.612 0.540 0.525 0.528
Fitted Covariance Matrix (continued)
PUBPR01 PUBPR02 PUBPR03 PRVPR01 PRVPR02 PRVPR03 PUBPR01 1.342 PUBPR02 0.868 1.343 PUBPR03 0.813 0.833 1.250 PRVPR01 0.450 0.461 0.432 1.238 PRVPR02 0.458 0.470 0.440 0.842 1.258 PRVPR03 0.467 0.478 0.448 0.858 0.873 1.305 RELEX01 0.746 0.764 0.716 0.613 0.624 0.635 RELEX02 0.765 0.784 0.734 0.628 0.639 0.651 RELEX03 0.767 0.786 0.736 0.630 0.641 0.653
Fitted Covariance Matrix (continued)
RELEX01 RELEX02 RELEX03 RELEX01 1.223 RELEX02 0.887 1.258 RELEX03 0.890 0.912 1.310
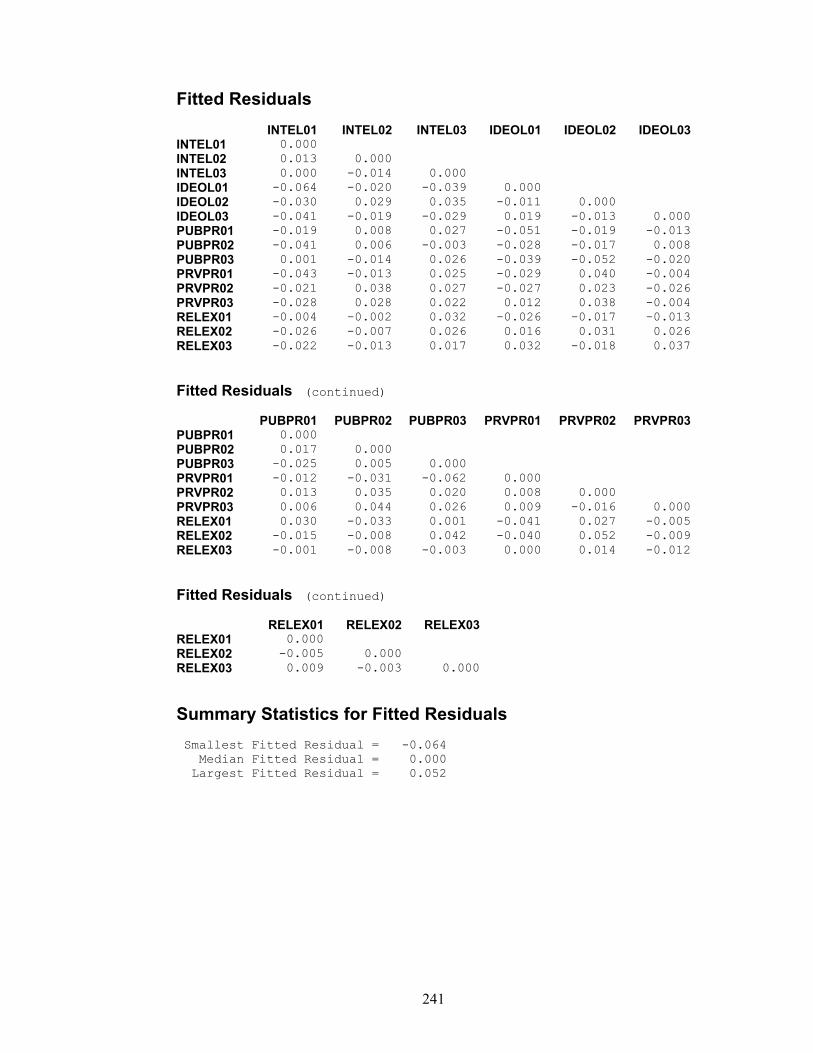
241
Fitted Residuals
INTEL01 INTEL02 INTEL03 IDEOL01 IDEOL02 IDEOL03 INTEL01 0.000 INTEL02 0.013 0.000 INTEL03 0.000 -0.014 0.000 IDEOL01 -0.064 -0.020 -0.039 0.000 IDEOL02 -0.030 0.029 0.035 -0.011 0.000 IDEOL03 -0.041 -0.019 -0.029 0.019 -0.013 0.000 PUBPR01 -0.019 0.008 0.027 -0.051 -0.019 -0.013 PUBPR02 -0.041 0.006 -0.003 -0.028 -0.017 0.008 PUBPR03 0.001 -0.014 0.026 -0.039 -0.052 -0.020 PRVPR01 -0.043 -0.013 0.025 -0.029 0.040 -0.004 PRVPR02 -0.021 0.038 0.027 -0.027 0.023 -0.026 PRVPR03 -0.028 0.028 0.022 0.012 0.038 -0.004 RELEX01 -0.004 -0.002 0.032 -0.026 -0.017 -0.013 RELEX02 -0.026 -0.007 0.026 0.016 0.031 0.026 RELEX03 -0.022 -0.013 0.017 0.032 -0.018 0.037
Fitted Residuals (continued)
PUBPR01 PUBPR02 PUBPR03 PRVPR01 PRVPR02 PRVPR03 PUBPR01 0.000 PUBPR02 0.017 0.000 PUBPR03 -0.025 0.005 0.000 PRVPR01 -0.012 -0.031 -0.062 0.000 PRVPR02 0.013 0.035 0.020 0.008 0.000 PRVPR03 0.006 0.044 0.026 0.009 -0.016 0.000 RELEX01 0.030 -0.033 0.001 -0.041 0.027 -0.005 RELEX02 -0.015 -0.008 0.042 -0.040 0.052 -0.009 RELEX03 -0.001 -0.008 -0.003 0.000 0.014 -0.012
Fitted Residuals (continued)
RELEX01 RELEX02 RELEX03 RELEX01 0.000 RELEX02 -0.005 0.000 RELEX03 0.009 -0.003 0.000
Summary Statistics for Fitted Residuals Smallest Fitted Residual = -0.064 Median Fitted Residual = 0.000 Largest Fitted Residual = 0.052
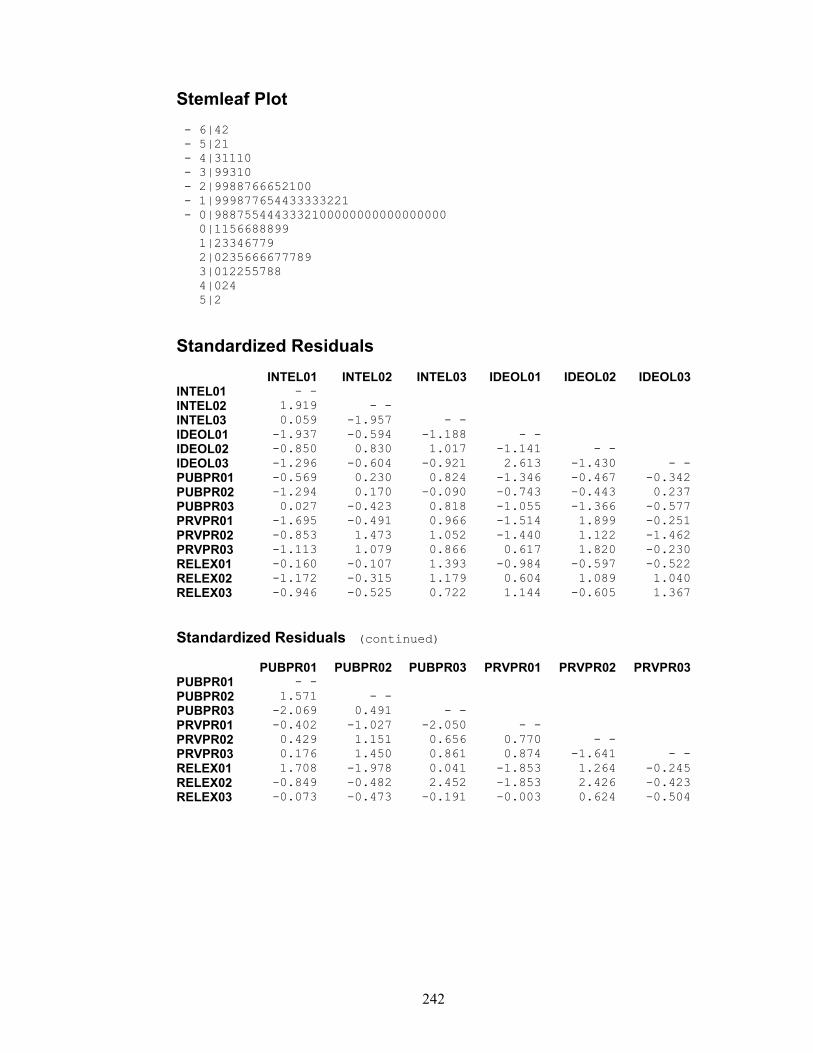
242
Stemleaf Plot - 6|42 - 5|21 - 4|31110 - 3|99310 - 2|9988766652100 - 1|999877654433333221 - 0|9887554443332100000000000000000 0|1156688899 1|23346779 2|0235666677789 3|012255788 4|024 5|2
Standardized Residuals
INTEL01 INTEL02 INTEL03 IDEOL01 IDEOL02 IDEOL03 INTEL01 - - INTEL02 1.919 - - INTEL03 0.059 -1.957 - - IDEOL01 -1.937 -0.594 -1.188 - - IDEOL02 -0.850 0.830 1.017 -1.141 - - IDEOL03 -1.296 -0.604 -0.921 2.613 -1.430 - - PUBPR01 -0.569 0.230 0.824 -1.346 -0.467 -0.342 PUBPR02 -1.294 0.170 -0.090 -0.743 -0.443 0.237 PUBPR03 0.027 -0.423 0.818 -1.055 -1.366 -0.577 PRVPR01 -1.695 -0.491 0.966 -1.514 1.899 -0.251 PRVPR02 -0.853 1.473 1.052 -1.440 1.122 -1.462 PRVPR03 -1.113 1.079 0.866 0.617 1.820 -0.230 RELEX01 -0.160 -0.107 1.393 -0.984 -0.597 -0.522 RELEX02 -1.172 -0.315 1.179 0.604 1.089 1.040 RELEX03 -0.946 -0.525 0.722 1.144 -0.605 1.367
Standardized Residuals (continued)
PUBPR01 PUBPR02 PUBPR03 PRVPR01 PRVPR02 PRVPR03 PUBPR01 - - PUBPR02 1.571 - - PUBPR03 -2.069 0.491 - - PRVPR01 -0.402 -1.027 -2.050 - - PRVPR02 0.429 1.151 0.656 0.770 - - PRVPR03 0.176 1.450 0.861 0.874 -1.641 - - RELEX01 1.708 -1.978 0.041 -1.853 1.264 -0.245 RELEX02 -0.849 -0.482 2.452 -1.853 2.426 -0.423 RELEX03 -0.073 -0.473 -0.191 -0.003 0.624 -0.504

243
Standardized Residuals (continued)
RELEX01 RELEX02 RELEX03 RELEX01 - - RELEX02 -0.575 - - RELEX03 0.869 -0.288 - -
Summary Statistics for Standardized Residuals Smallest Standardized Residual = -2.069 Median Standardized Residual = -0.002 Largest Standardized Residual = 2.613
Stemleaf Plot -20|75 -18|86455 -16|94 -14|1643 -12|7509 -10|974153 - 8|852555 - 6|4000 - 4|987732098774220 - 2|429543 - 0|961970000000000000000 0|34678 2|34 4|39 6|022627 8|22367777 10|245892458 12|679 14|577 16|1 18|202 20| 22| 24|35 26|1
Largest Positive Standardized Residuals Residual for IDEOL03 and IDEOL01 2.613
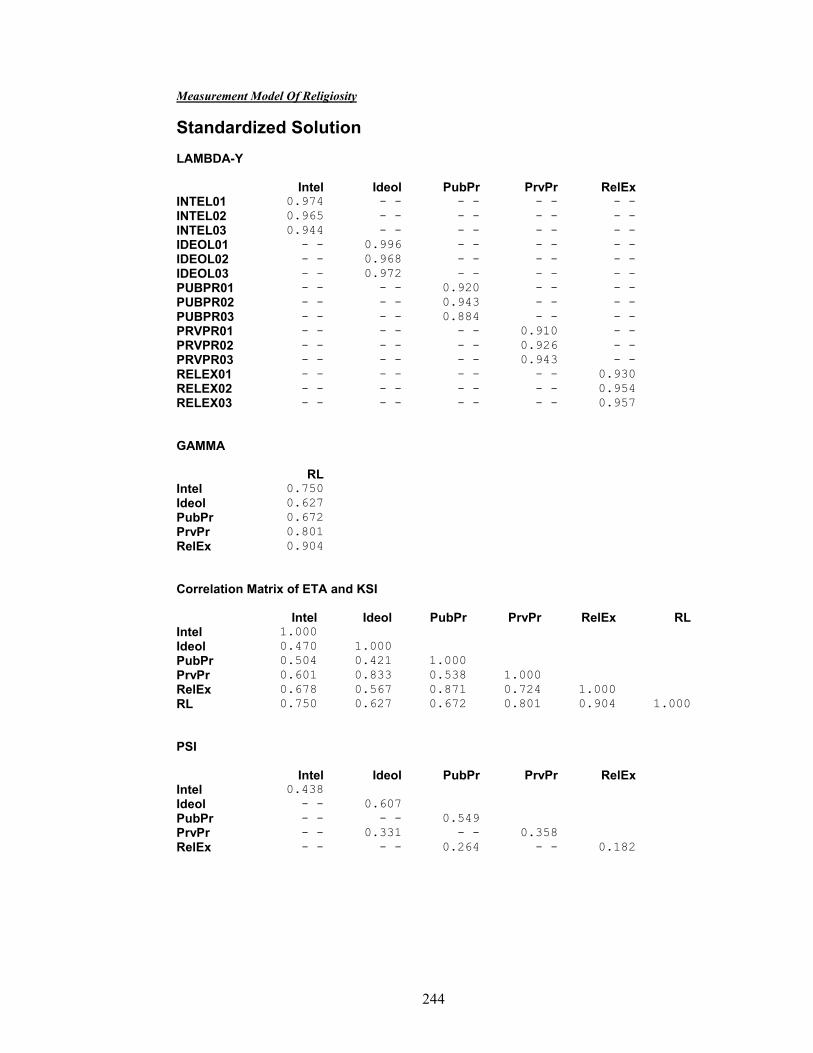
244
Measurement Model Of Religiosity
Standardized Solution LAMBDA-Y
Intel Ideol PubPr PrvPr RelEx INTEL01 0.974 - - - - - - - - INTEL02 0.965 - - - - - - - - INTEL03 0.944 - - - - - - - - IDEOL01 - - 0.996 - - - - - - IDEOL02 - - 0.968 - - - - - - IDEOL03 - - 0.972 - - - - - - PUBPR01 - - - - 0.920 - - - - PUBPR02 - - - - 0.943 - - - - PUBPR03 - - - - 0.884 - - - - PRVPR01 - - - - - - 0.910 - - PRVPR02 - - - - - - 0.926 - - PRVPR03 - - - - - - 0.943 - - RELEX01 - - - - - - - - 0.930 RELEX02 - - - - - - - - 0.954 RELEX03 - - - - - - - - 0.957 GAMMA
RL Intel 0.750 Ideol 0.627 PubPr 0.672 PrvPr 0.801 RelEx 0.904 Correlation Matrix of ETA and KSI
Intel Ideol PubPr PrvPr RelEx RL Intel 1.000 Ideol 0.470 1.000 PubPr 0.504 0.421 1.000 PrvPr 0.601 0.833 0.538 1.000 RelEx 0.678 0.567 0.871 0.724 1.000 RL 0.750 0.627 0.672 0.801 0.904 1.000 PSI
Intel Ideol PubPr PrvPr RelEx Intel 0.438 Ideol - - 0.607 PubPr - - - - 0.549 PrvPr - - 0.331 - - 0.358 RelEx - - - - 0.264 - - 0.182
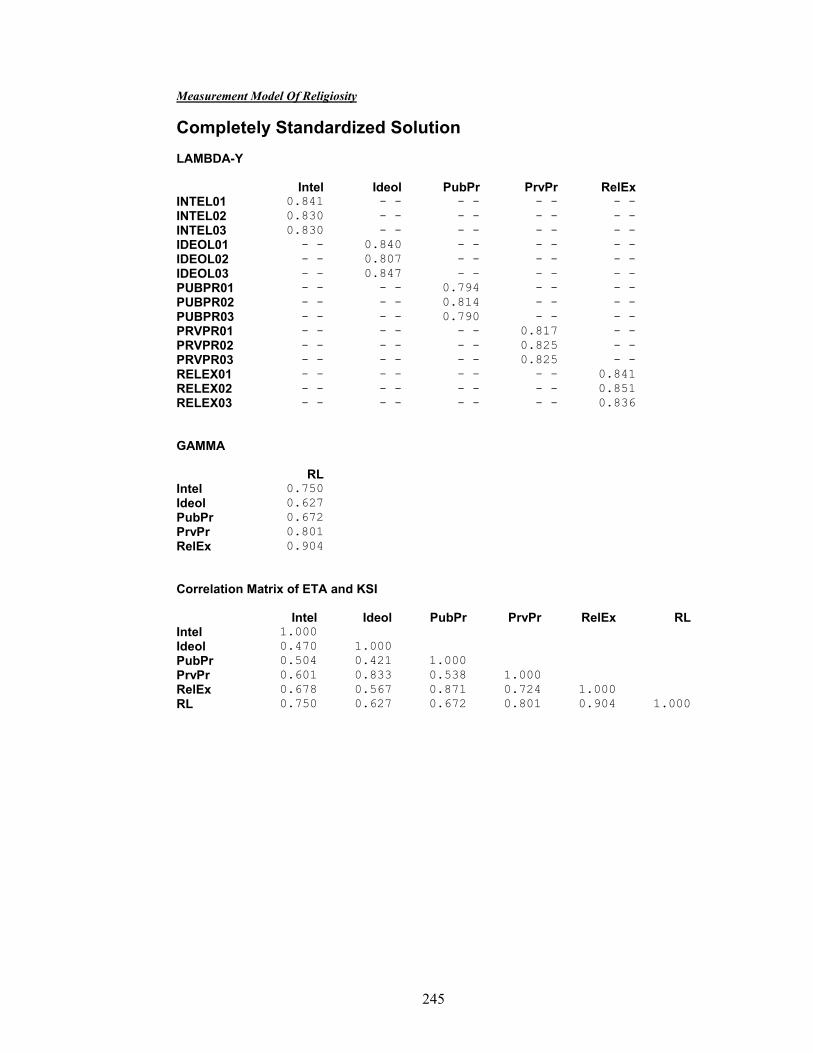
245
Measurement Model Of Religiosity
Completely Standardized Solution LAMBDA-Y
Intel Ideol PubPr PrvPr RelEx INTEL01 0.841 - - - - - - - - INTEL02 0.830 - - - - - - - - INTEL03 0.830 - - - - - - - - IDEOL01 - - 0.840 - - - - - - IDEOL02 - - 0.807 - - - - - - IDEOL03 - - 0.847 - - - - - - PUBPR01 - - - - 0.794 - - - - PUBPR02 - - - - 0.814 - - - - PUBPR03 - - - - 0.790 - - - - PRVPR01 - - - - - - 0.817 - - PRVPR02 - - - - - - 0.825 - - PRVPR03 - - - - - - 0.825 - - RELEX01 - - - - - - - - 0.841 RELEX02 - - - - - - - - 0.851 RELEX03 - - - - - - - - 0.836 GAMMA
RL Intel 0.750 Ideol 0.627 PubPr 0.672 PrvPr 0.801 RelEx 0.904 Correlation Matrix of ETA and KSI
Intel Ideol PubPr PrvPr RelEx RL Intel 1.000 Ideol 0.470 1.000 PubPr 0.504 0.421 1.000 PrvPr 0.601 0.833 0.538 1.000 RelEx 0.678 0.567 0.871 0.724 1.000 RL 0.750 0.627 0.672 0.801 0.904 1.000
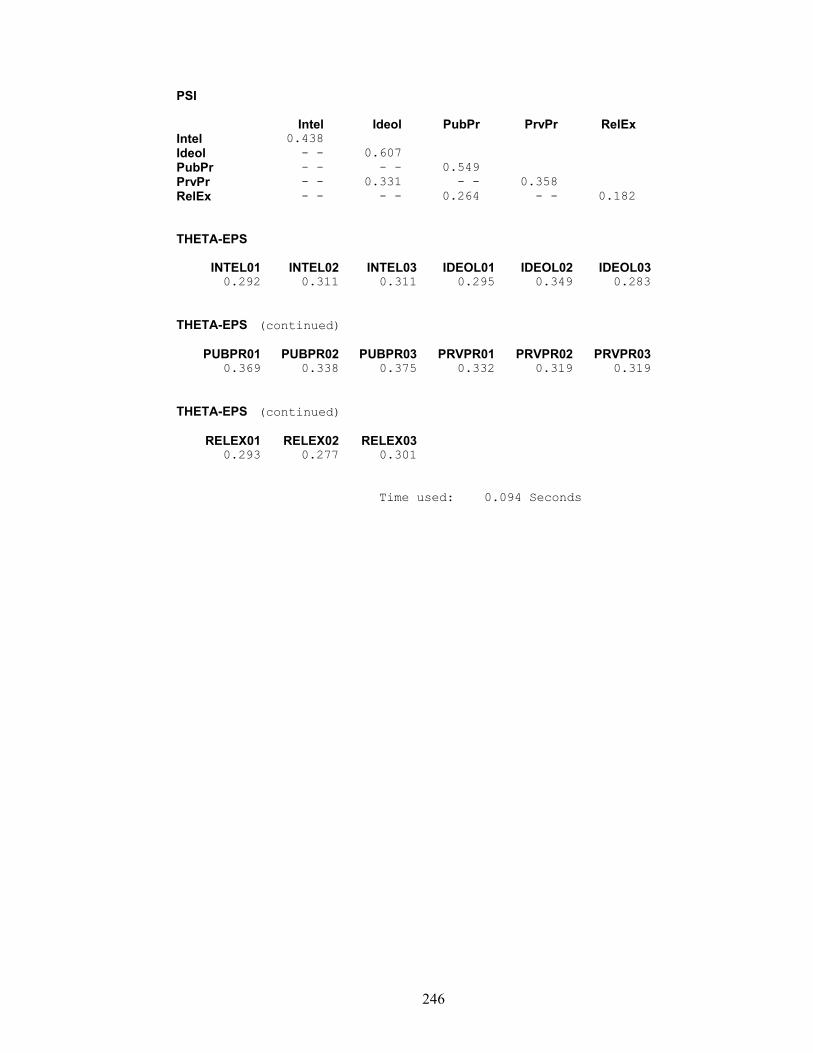
246
PSI
Intel Ideol PubPr PrvPr RelEx Intel 0.438 Ideol - - 0.607 PubPr - - - - 0.549 PrvPr - - 0.331 - - 0.358 RelEx - - - - 0.264 - - 0.182 THETA-EPS
INTEL01 INTEL02 INTEL03 IDEOL01 IDEOL02 IDEOL03 0.292 0.311 0.311 0.295 0.349 0.283
THETA-EPS (continued) PUBPR01 PUBPR02 PUBPR03 PRVPR01 PRVPR02 PRVPR03
0.369 0.338 0.375 0.332 0.319 0.319 THETA-EPS (continued) RELEX01 RELEX02 RELEX03
0.293 0.277 0.301 Time used: 0.094 Seconds
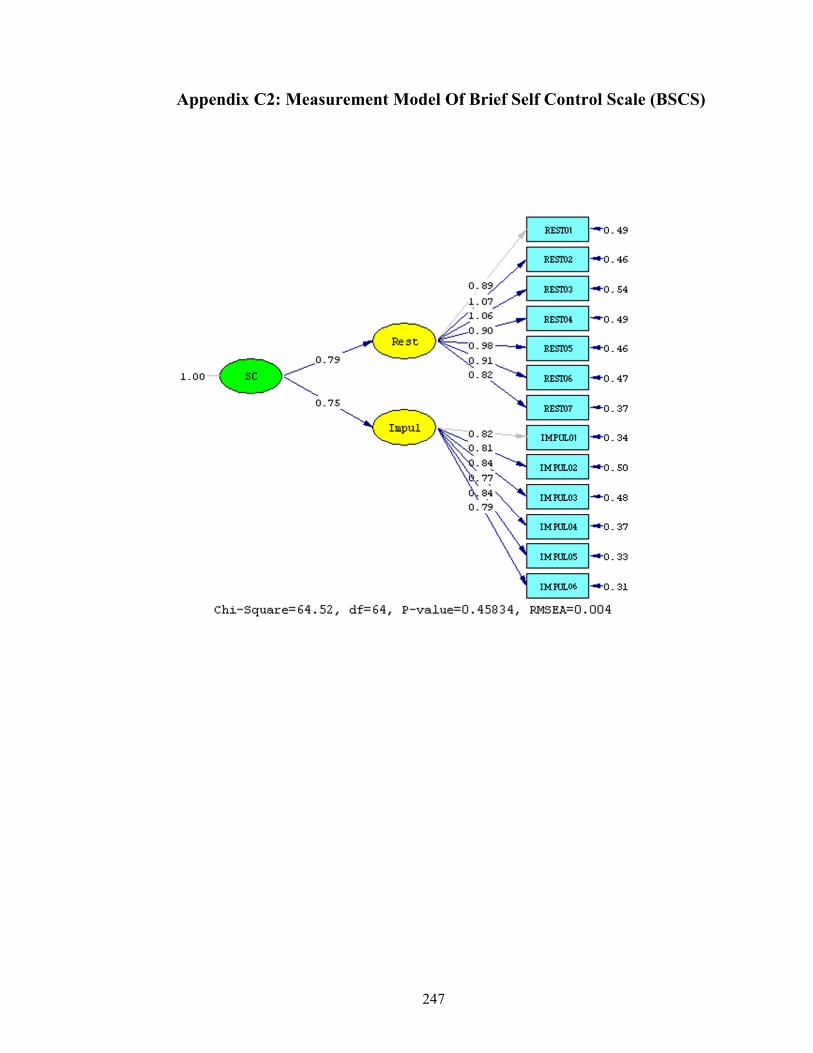
247
Appendix C2: Measurement Model Of Brief Self Control Scale (BSCS)
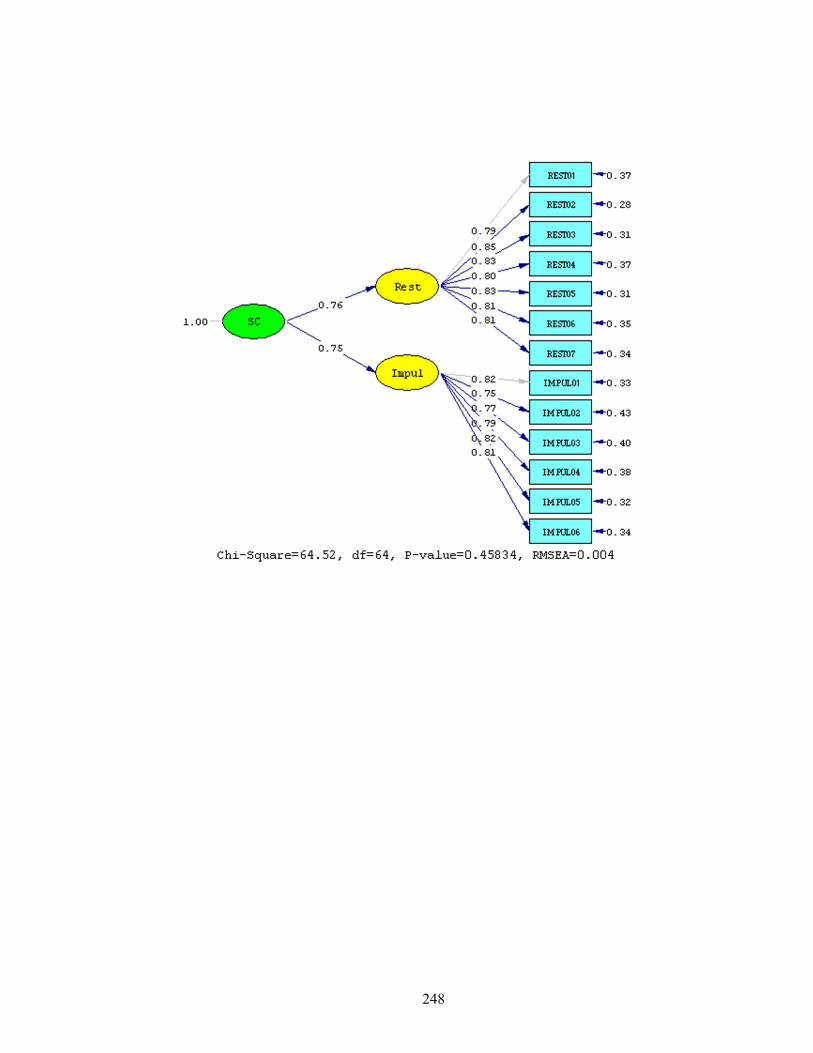
248
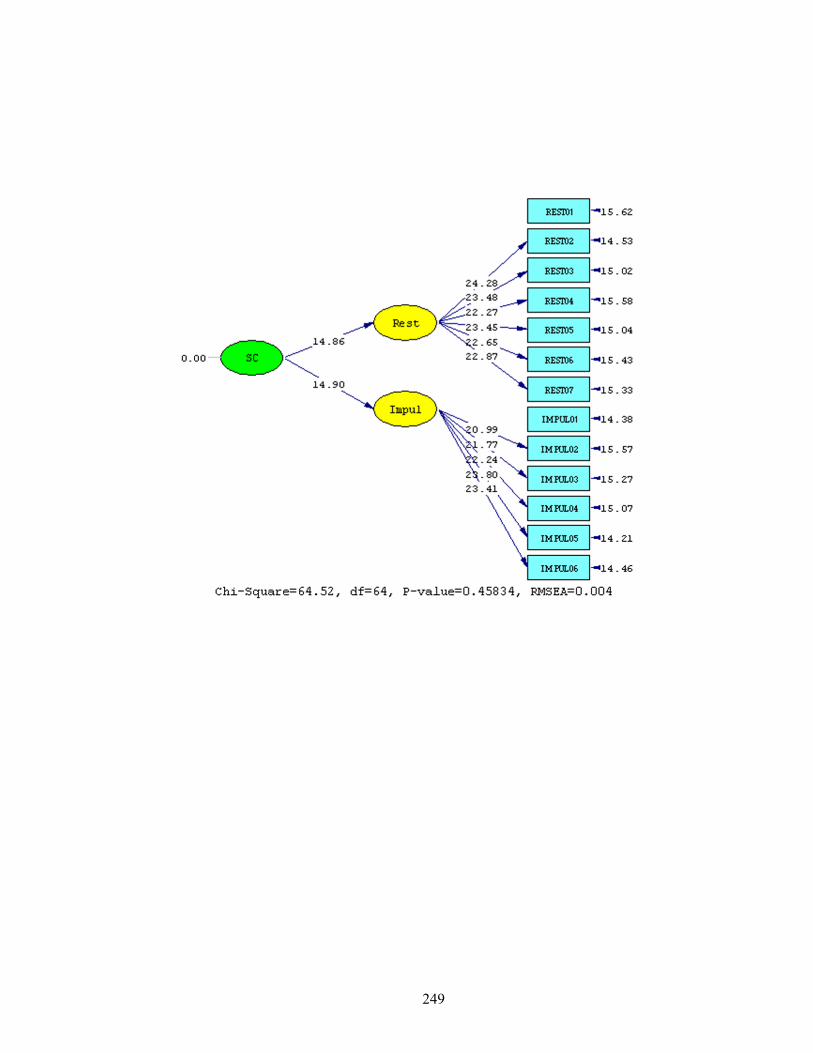
249

250
L I S R E L 8.80 BY Karl G. Jöreskog and Dag Sörbom This program is published exclusively by Scientific Software International, Inc. 7383 N. Lincoln Avenue, Suite 100 Lincolnwood, IL 60712, U.S.A. Phone: (800)247-6113, (847)675-0720, Fax: (847)675-2140 Copyright by Scientific Software International, Inc., 1981-2006 Use of this program is subject to the terms specified in the Universal Copyright Convention. Website: www.ssicentral.com The following lines were read from file D:\Ma Study\01 main study Raw score\SC.spl: Second Order CFA by Maximum Likelihood Raw Data from file 'D:Study1 main study Raw score.psf' Sample Size = 628 Latent Variables Rest Impul SC Relationships REST01 = Rest REST02 = Rest REST03 = Rest REST04 = Rest REST05 = Rest REST06 = Rest REST07 = Rest IMPUL01 = Impul IMPUL02 = Impul IMPUL03 = Impul IMPUL04 = Impul IMPUL05 = Impul IMPUL06 = Impul Rest = SC Impul = SC Set the Error Variance of Rest and Impul correlate Path Diagram End of Problem Sample Size = 628
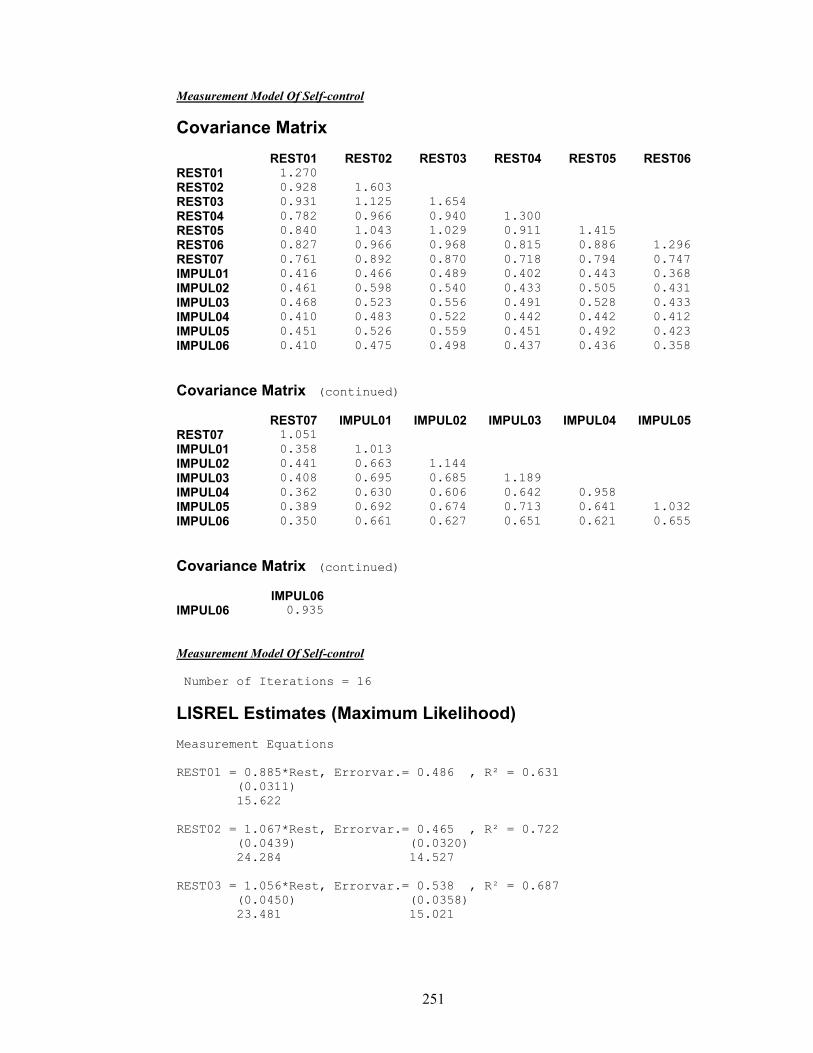
251
Measurement Model Of Self-control
Covariance Matrix
REST01 REST02 REST03 REST04 REST05 REST06 REST01 1.270 REST02 0.928 1.603 REST03 0.931 1.125 1.654 REST04 0.782 0.966 0.940 1.300 REST05 0.840 1.043 1.029 0.911 1.415 REST06 0.827 0.966 0.968 0.815 0.886 1.296 REST07 0.761 0.892 0.870 0.718 0.794 0.747 IMPUL01 0.416 0.466 0.489 0.402 0.443 0.368 IMPUL02 0.461 0.598 0.540 0.433 0.505 0.431 IMPUL03 0.468 0.523 0.556 0.491 0.528 0.433 IMPUL04 0.410 0.483 0.522 0.442 0.442 0.412 IMPUL05 0.451 0.526 0.559 0.451 0.492 0.423 IMPUL06 0.410 0.475 0.498 0.437 0.436 0.358
Covariance Matrix (continued)
REST07 IMPUL01 IMPUL02 IMPUL03 IMPUL04 IMPUL05 REST07 1.051 IMPUL01 0.358 1.013 IMPUL02 0.441 0.663 1.144 IMPUL03 0.408 0.695 0.685 1.189 IMPUL04 0.362 0.630 0.606 0.642 0.958 IMPUL05 0.389 0.692 0.674 0.713 0.641 1.032 IMPUL06 0.350 0.661 0.627 0.651 0.621 0.655
Covariance Matrix (continued)
IMPUL06 IMPUL06 0.935 Measurement Model Of Self-control Number of Iterations = 16
LISREL Estimates (Maximum Likelihood) Measurement Equations REST01 = 0.885*Rest, Errorvar.= 0.486 , R² = 0.631
(0.0311) 15.622
REST02 = 1.067*Rest, Errorvar.= 0.465 , R² = 0.722
(0.0439) (0.0320) 24.284 14.527
REST03 = 1.056*Rest, Errorvar.= 0.538 , R² = 0.687
(0.0450) (0.0358) 23.481 15.021

252
REST04 = 0.899*Rest, Errorvar.= 0.492 , R² = 0.635 (0.0403) (0.0316) 22.272 15.585
REST05 = 0.976*Rest, Errorvar.= 0.462 , R² = 0.686
(0.0416) (0.0308) 23.450 15.038
REST06 = 0.909*Rest, Errorvar.= 0.469 , R² = 0.651
(0.0401) (0.0304) 22.654 15.425
REST07 = 0.825*Rest, Errorvar.= 0.370 , R² = 0.661
(0.0361) (0.0242) 22.867 15.329
IMPUL01 = 0.823*Impul, Errorvar.= 0.335 , R² = 0.669
(0.0233) 14.382
IMPUL02 = 0.805*Impul, Errorvar.= 0.496 , R² = 0.566
(0.0384) (0.0319) 20.992 15.570
IMPUL03 = 0.843*Impul, Errorvar.= 0.478 , R² = 0.598
(0.0387) (0.0313) 21.771 15.272
IMPUL04 = 0.769*Impul, Errorvar.= 0.367 , R² = 0.617
(0.0346) (0.0244) 22.242 15.067
IMPUL05 = 0.838*Impul, Errorvar.= 0.330 , R² = 0.680
(0.0352) (0.0232) 23.801 14.212
IMPUL06 = 0.788*Impul, Errorvar.= 0.314 , R² = 0.664
(0.0337) (0.0217) 23.408 14.458
Structural Equations Rest = 0.764*SC, Errorvar.= 0.441 , R² = 0.584
(0.0529) (0.0346) 14.861 12.735
Impul = 0.748*SC, Errorvar.= 0.441 , R² = 0.559
(0.0502) (0.0346) 14.903 12.735
Correlation Matrix of Independent Variables
SC 1.000
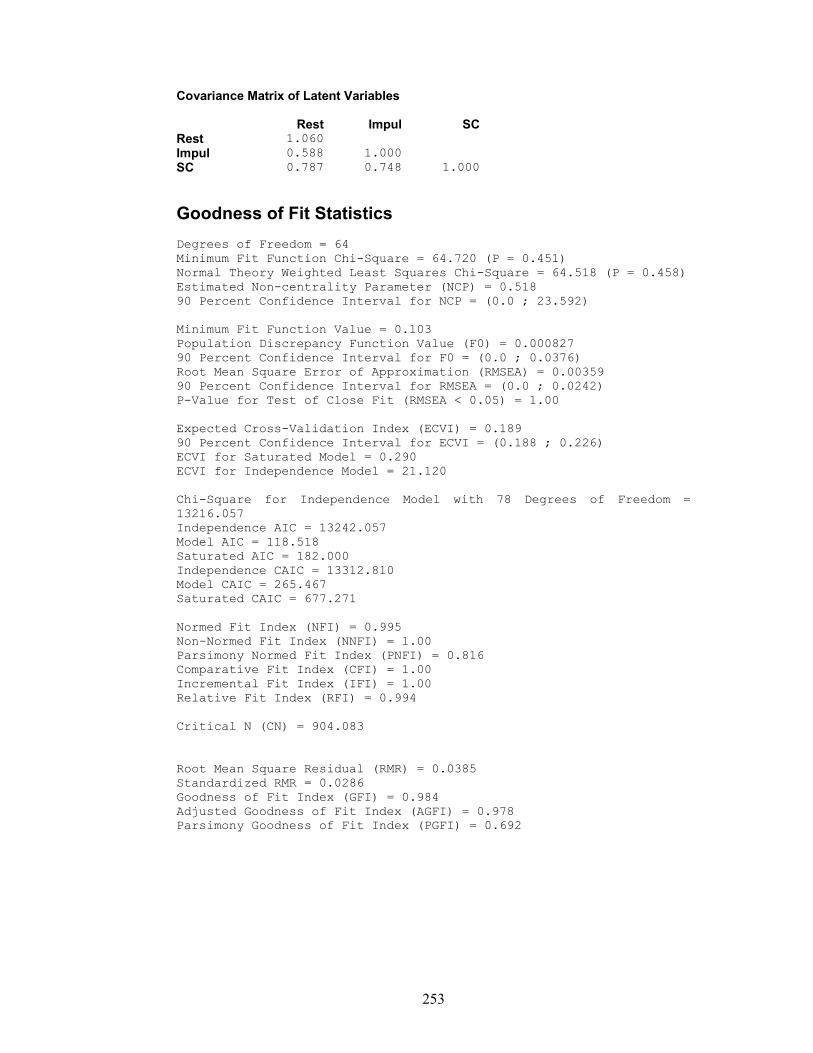
253
Covariance Matrix of Latent Variables
Rest Impul SC Rest 1.060 Impul 0.588 1.000 SC 0.787 0.748 1.000
Goodness of Fit Statistics Degrees of Freedom = 64 Minimum Fit Function Chi-Square = 64.720 (P = 0.451) Normal Theory Weighted Least Squares Chi-Square = 64.518 (P = 0.458) Estimated Non-centrality Parameter (NCP) = 0.518 90 Percent Confidence Interval for NCP = (0.0 ; 23.592) Minimum Fit Function Value = 0.103 Population Discrepancy Function Value (F0) = 0.000827 90 Percent Confidence Interval for F0 = (0.0 ; 0.0376) Root Mean Square Error of Approximation (RMSEA) = 0.00359 90 Percent Confidence Interval for RMSEA = (0.0 ; 0.0242) P-Value for Test of Close Fit (RMSEA < 0.05) = 1.00 Expected Cross-Validation Index (ECVI) = 0.189 90 Percent Confidence Interval for ECVI = (0.188 ; 0.226) ECVI for Saturated Model = 0.290 ECVI for Independence Model = 21.120 Chi-Square for Independence Model with 78 Degrees of Freedom = 13216.057 Independence AIC = 13242.057 Model AIC = 118.518 Saturated AIC = 182.000 Independence CAIC = 13312.810 Model CAIC = 265.467 Saturated CAIC = 677.271 Normed Fit Index (NFI) = 0.995 Non-Normed Fit Index (NNFI) = 1.00 Parsimony Normed Fit Index (PNFI) = 0.816 Comparative Fit Index (CFI) = 1.00 Incremental Fit Index (IFI) = 1.00 Relative Fit Index (RFI) = 0.994 Critical N (CN) = 904.083 Root Mean Square Residual (RMR) = 0.0385 Standardized RMR = 0.0286 Goodness of Fit Index (GFI) = 0.984 Adjusted Goodness of Fit Index (AGFI) = 0.978 Parsimony Goodness of Fit Index (PGFI) = 0.692
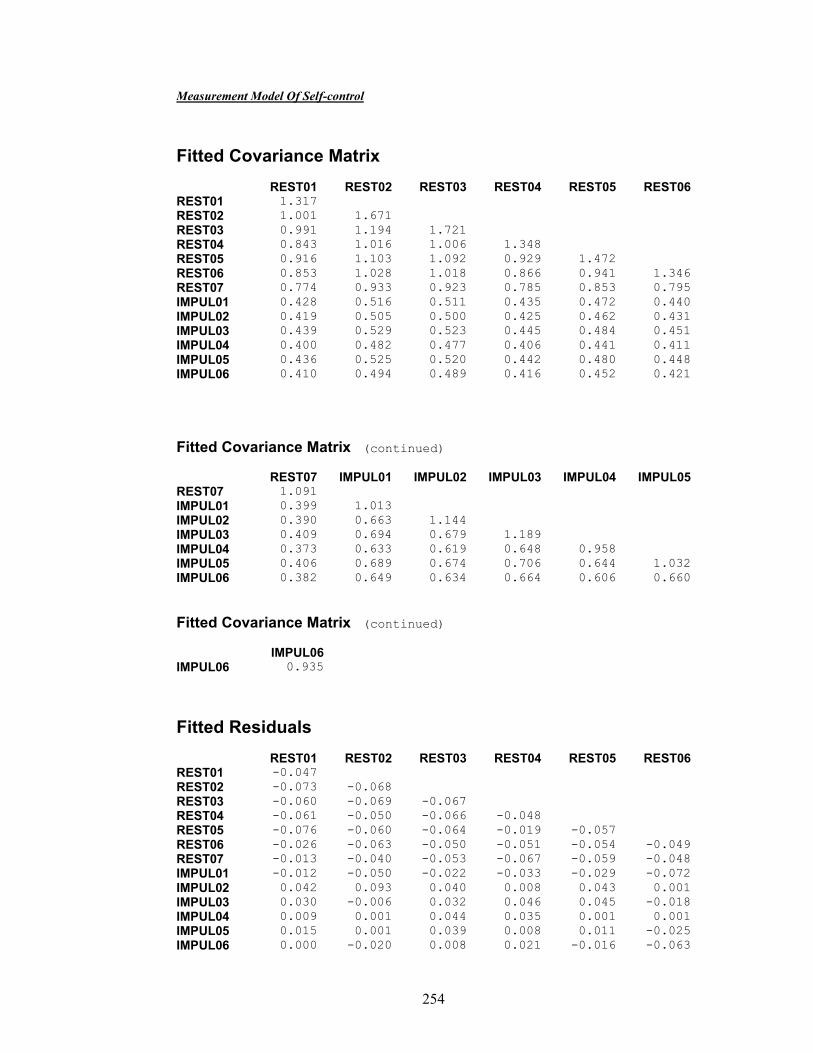
254
Measurement Model Of Self-control
Fitted Covariance Matrix
REST01 REST02 REST03 REST04 REST05 REST06 REST01 1.317 REST02 1.001 1.671 REST03 0.991 1.194 1.721 REST04 0.843 1.016 1.006 1.348 REST05 0.916 1.103 1.092 0.929 1.472 REST06 0.853 1.028 1.018 0.866 0.941 1.346 REST07 0.774 0.933 0.923 0.785 0.853 0.795 IMPUL01 0.428 0.516 0.511 0.435 0.472 0.440 IMPUL02 0.419 0.505 0.500 0.425 0.462 0.431 IMPUL03 0.439 0.529 0.523 0.445 0.484 0.451 IMPUL04 0.400 0.482 0.477 0.406 0.441 0.411 IMPUL05 0.436 0.525 0.520 0.442 0.480 0.448 IMPUL06 0.410 0.494 0.489 0.416 0.452 0.421
Fitted Covariance Matrix (continued)
REST07 IMPUL01 IMPUL02 IMPUL03 IMPUL04 IMPUL05 REST07 1.091 IMPUL01 0.399 1.013 IMPUL02 0.390 0.663 1.144 IMPUL03 0.409 0.694 0.679 1.189 IMPUL04 0.373 0.633 0.619 0.648 0.958 IMPUL05 0.406 0.689 0.674 0.706 0.644 1.032 IMPUL06 0.382 0.649 0.634 0.664 0.606 0.660
Fitted Covariance Matrix (continued)
IMPUL06 IMPUL06 0.935
Fitted Residuals
REST01 REST02 REST03 REST04 REST05 REST06 REST01 -0.047 REST02 -0.073 -0.068 REST03 -0.060 -0.069 -0.067 REST04 -0.061 -0.050 -0.066 -0.048 REST05 -0.076 -0.060 -0.064 -0.019 -0.057 REST06 -0.026 -0.063 -0.050 -0.051 -0.054 -0.049 REST07 -0.013 -0.040 -0.053 -0.067 -0.059 -0.048 IMPUL01 -0.012 -0.050 -0.022 -0.033 -0.029 -0.072 IMPUL02 0.042 0.093 0.040 0.008 0.043 0.001 IMPUL03 0.030 -0.006 0.032 0.046 0.045 -0.018 IMPUL04 0.009 0.001 0.044 0.035 0.001 0.001 IMPUL05 0.015 0.001 0.039 0.008 0.011 -0.025 IMPUL06 0.000 -0.020 0.008 0.021 -0.016 -0.063
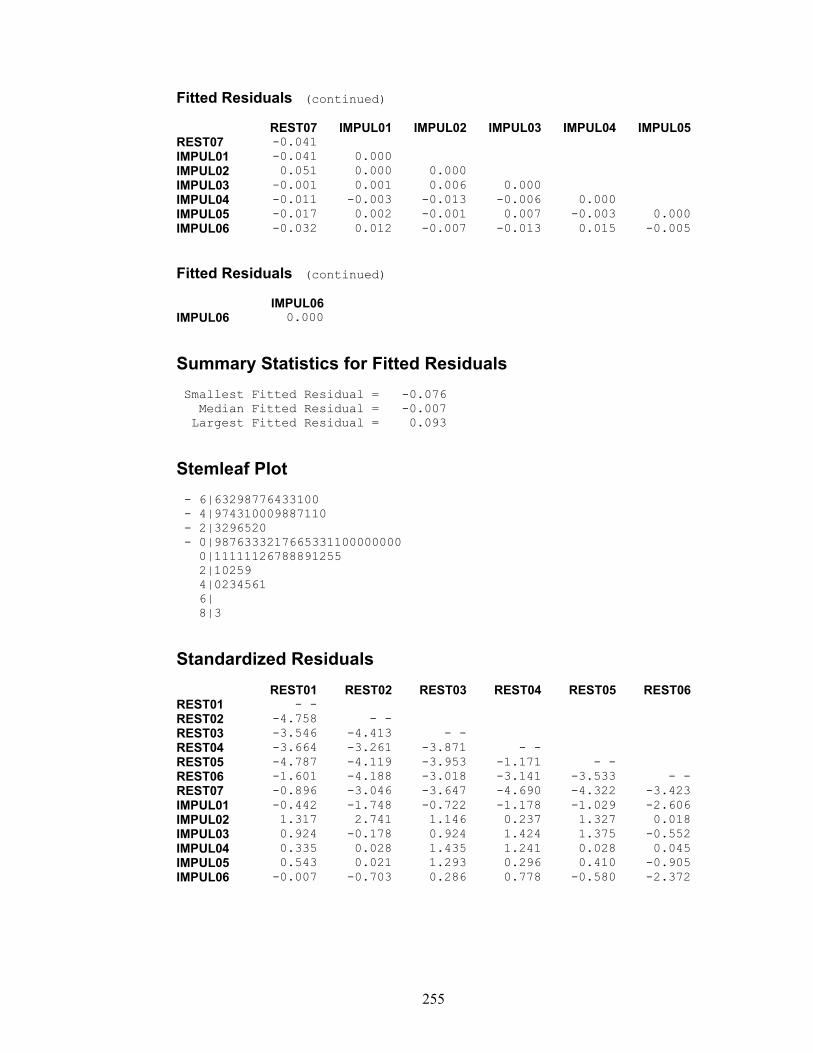
255
Fitted Residuals (continued)
REST07 IMPUL01 IMPUL02 IMPUL03 IMPUL04 IMPUL05 REST07 -0.041 IMPUL01 -0.041 0.000 IMPUL02 0.051 0.000 0.000 IMPUL03 -0.001 0.001 0.006 0.000 IMPUL04 -0.011 -0.003 -0.013 -0.006 0.000 IMPUL05 -0.017 0.002 -0.001 0.007 -0.003 0.000 IMPUL06 -0.032 0.012 -0.007 -0.013 0.015 -0.005
Fitted Residuals (continued)
IMPUL06 IMPUL06 0.000
Summary Statistics for Fitted Residuals Smallest Fitted Residual = -0.076 Median Fitted Residual = -0.007 Largest Fitted Residual = 0.093
Stemleaf Plot - 6|63298776433100 - 4|974310009887110 - 2|3296520 - 0|9876333217665331100000000 0|11111126788891255 2|10259 4|0234561 6| 8|3
Standardized Residuals
REST01 REST02 REST03 REST04 REST05 REST06 REST01 - - REST02 -4.758 - - REST03 -3.546 -4.413 - - REST04 -3.664 -3.261 -3.871 - - REST05 -4.787 -4.119 -3.953 -1.171 - - REST06 -1.601 -4.188 -3.018 -3.141 -3.533 - - REST07 -0.896 -3.046 -3.647 -4.690 -4.322 -3.423 IMPUL01 -0.442 -1.748 -0.722 -1.178 -1.029 -2.606 IMPUL02 1.317 2.741 1.146 0.237 1.327 0.018 IMPUL03 0.924 -0.178 0.924 1.424 1.375 -0.552 IMPUL04 0.335 0.028 1.435 1.241 0.028 0.045 IMPUL05 0.543 0.021 1.293 0.296 0.410 -0.905 IMPUL06 -0.007 -0.703 0.286 0.778 -0.580 -2.372
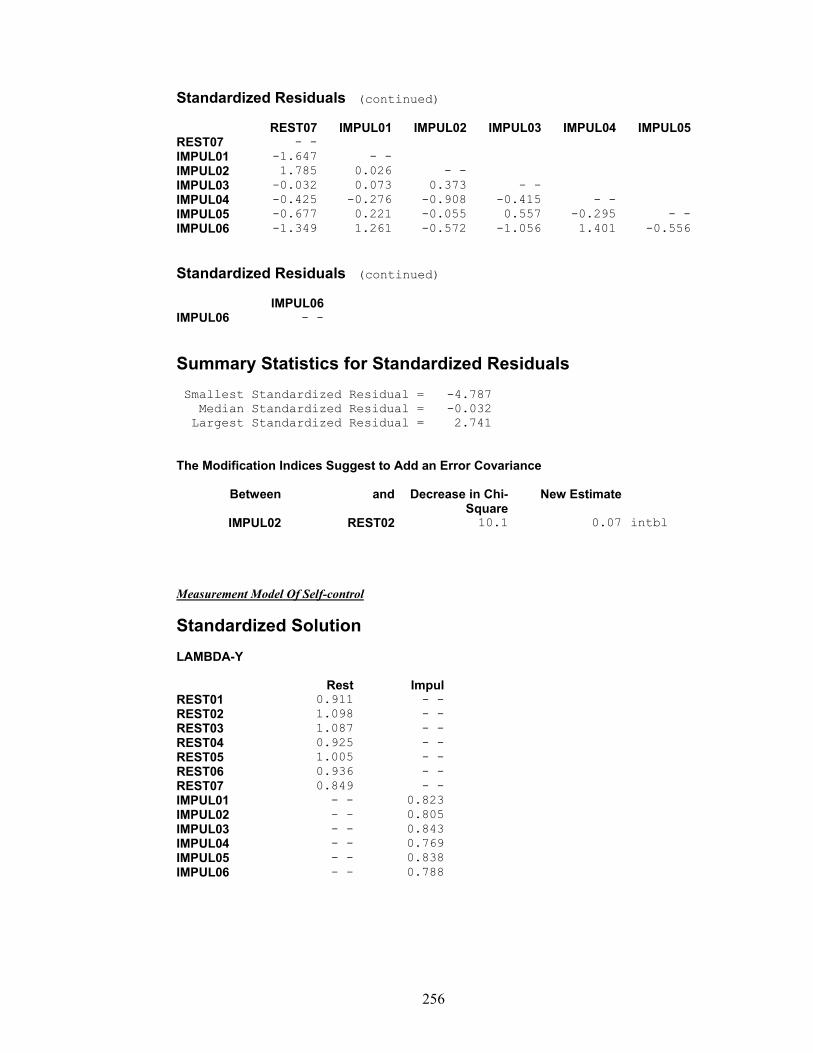
256
Standardized Residuals (continued)
REST07 IMPUL01 IMPUL02 IMPUL03 IMPUL04 IMPUL05 REST07 - - IMPUL01 -1.647 - - IMPUL02 1.785 0.026 - - IMPUL03 -0.032 0.073 0.373 - - IMPUL04 -0.425 -0.276 -0.908 -0.415 - - IMPUL05 -0.677 0.221 -0.055 0.557 -0.295 - - IMPUL06 -1.349 1.261 -0.572 -1.056 1.401 -0.556
Standardized Residuals (continued)
IMPUL06 IMPUL06 - -
Summary Statistics for Standardized Residuals Smallest Standardized Residual = -4.787 Median Standardized Residual = -0.032 Largest Standardized Residual = 2.741 The Modification Indices Suggest to Add an Error Covariance
Between and Decrease in Chi-Square
New Estimate
IMPUL02 REST02 10.1 0.07 intbl
Measurement Model Of Self-control
Standardized Solution LAMBDA-Y
Rest Impul REST01 0.911 - - REST02 1.098 - - REST03 1.087 - - REST04 0.925 - - REST05 1.005 - - REST06 0.936 - - REST07 0.849 - - IMPUL01 - - 0.823 IMPUL02 - - 0.805 IMPUL03 - - 0.843 IMPUL04 - - 0.769 IMPUL05 - - 0.838 IMPUL06 - - 0.788
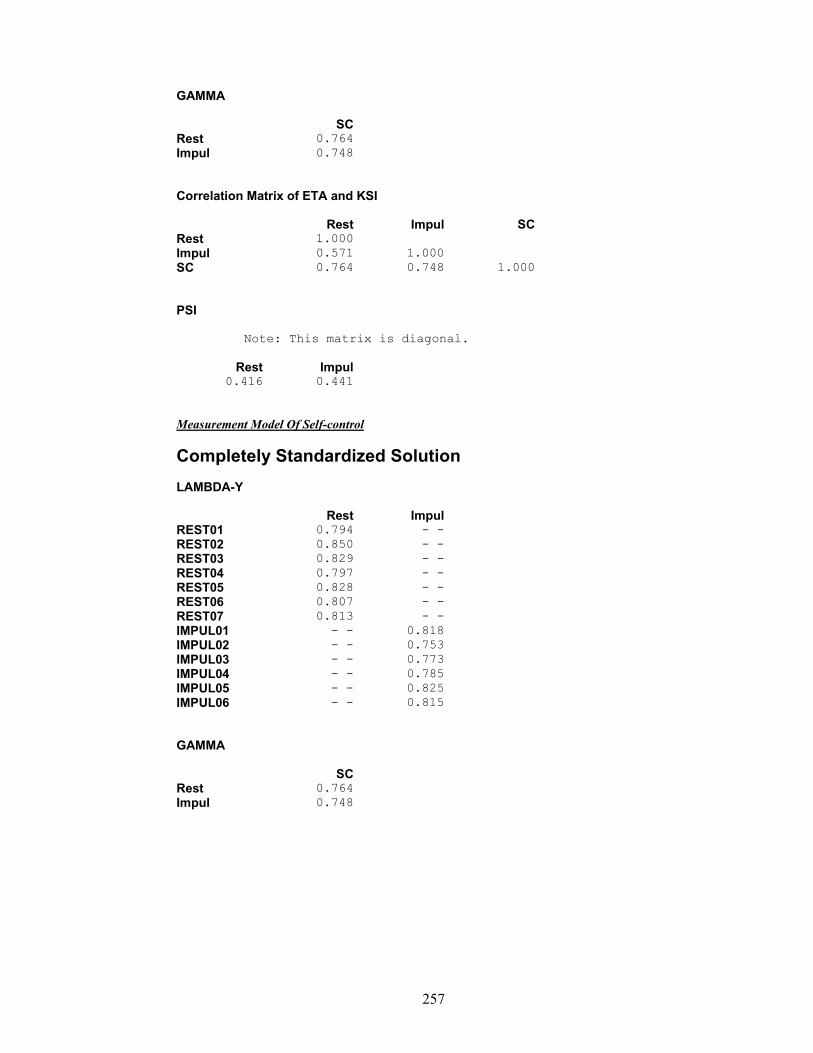
257
GAMMA
SC Rest 0.764 Impul 0.748 Correlation Matrix of ETA and KSI
Rest Impul SC Rest 1.000 Impul 0.571 1.000 SC 0.764 0.748 1.000 PSI Note: This matrix is diagonal.
Rest Impul 0.416 0.441
Measurement Model Of Self-control
Completely Standardized Solution LAMBDA-Y
Rest Impul REST01 0.794 - - REST02 0.850 - - REST03 0.829 - - REST04 0.797 - - REST05 0.828 - - REST06 0.807 - - REST07 0.813 - - IMPUL01 - - 0.818 IMPUL02 - - 0.753 IMPUL03 - - 0.773 IMPUL04 - - 0.785 IMPUL05 - - 0.825 IMPUL06 - - 0.815 GAMMA
SC Rest 0.764 Impul 0.748
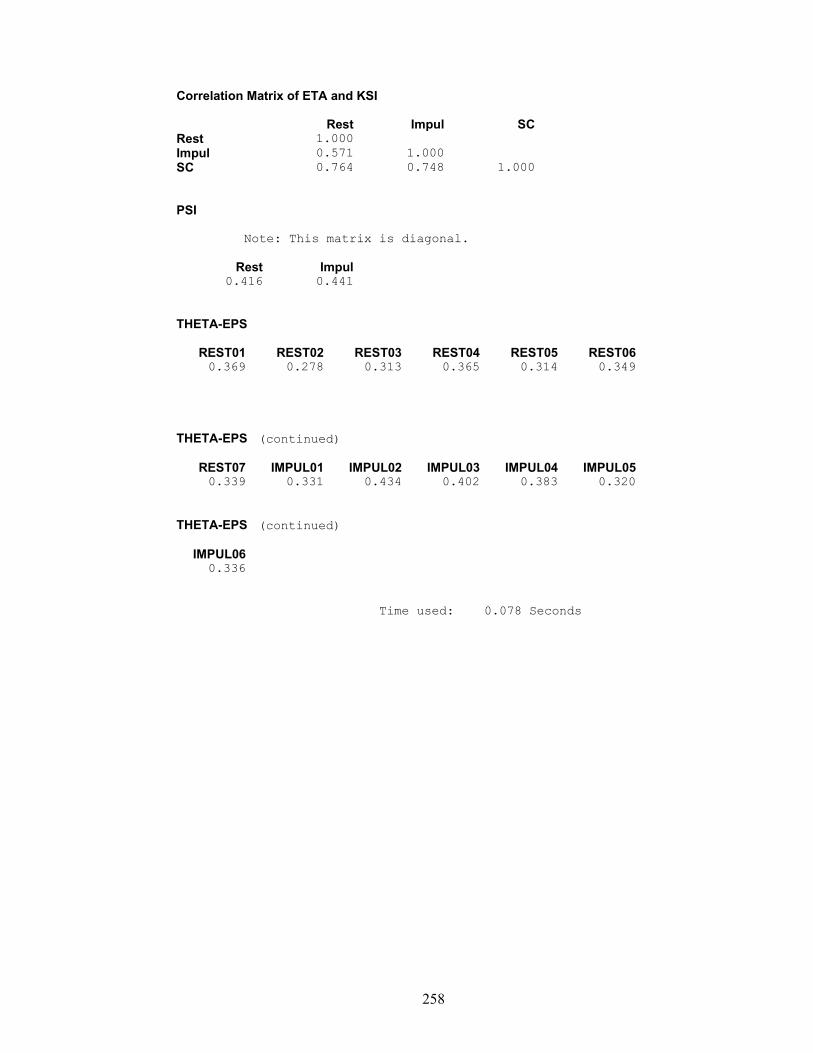
258
Correlation Matrix of ETA and KSI
Rest Impul SC Rest 1.000 Impul 0.571 1.000 SC 0.764 0.748 1.000 PSI Note: This matrix is diagonal.
Rest Impul 0.416 0.441
THETA-EPS REST01 REST02 REST03 REST04 REST05 REST06
0.369 0.278 0.313 0.365 0.314 0.349 THETA-EPS (continued) REST07 IMPUL01 IMPUL02 IMPUL03 IMPUL04 IMPUL05
0.339 0.331 0.434 0.402 0.383 0.320 THETA-EPS (continued) IMPUL06
0.336 Time used: 0.078 Seconds
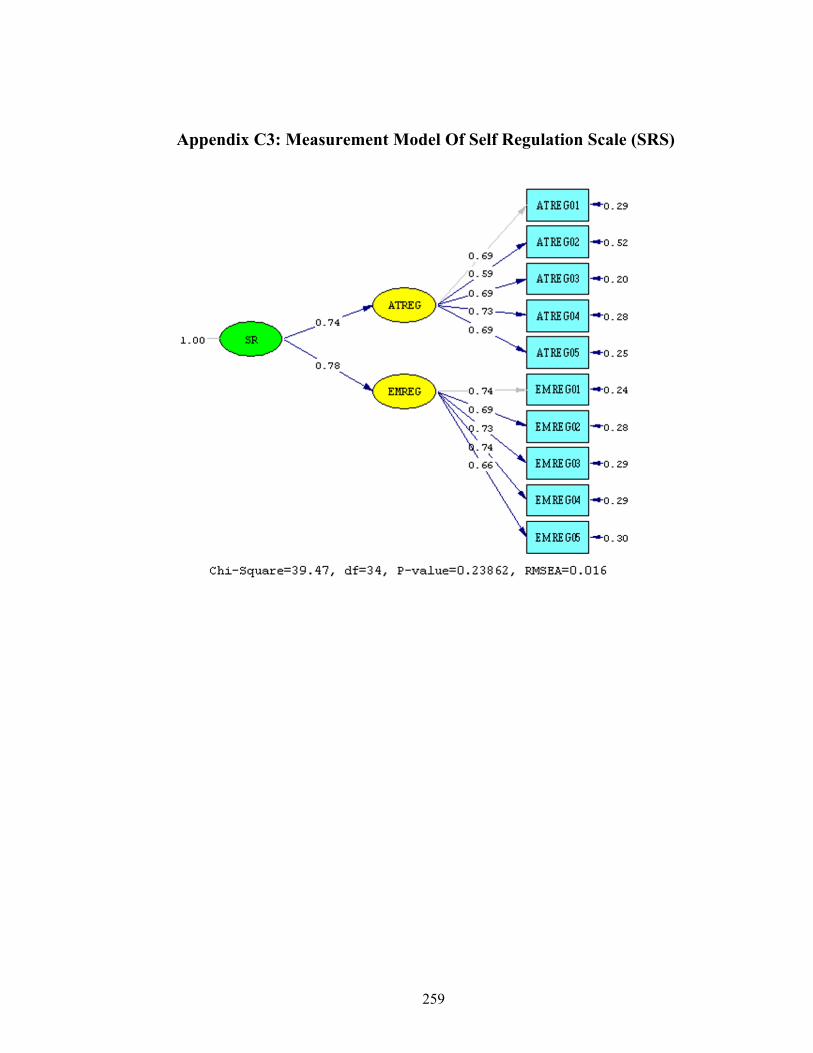
259
Appendix C3: Measurement Model Of Self Regulation Scale (SRS)
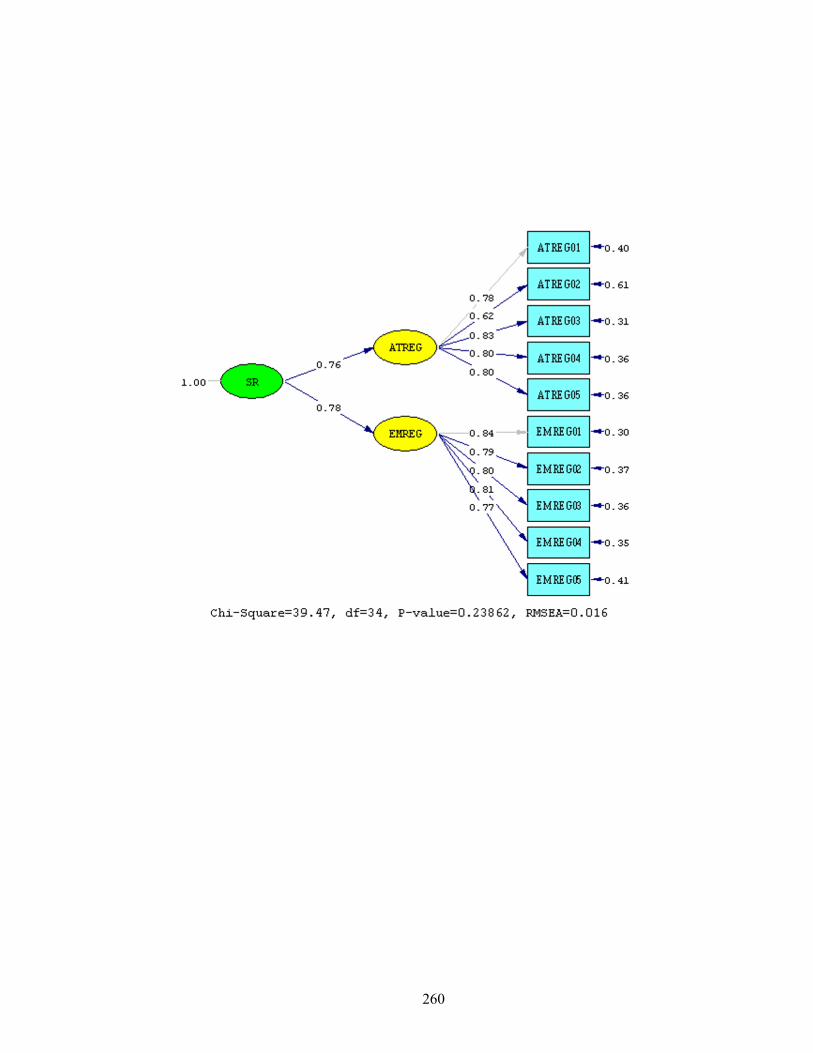
260

261

262
L I S R E L 8.80 BY Karl G. Jöreskog and Dag Sörbom This program is published exclusively by Scientific Software International, Inc. 7383 N. Lincoln Avenue, Suite 100 Lincolnwood, IL 60712, U.S.A. Phone: (800)247-6113, (847)675-0720, Fax: (847)675-2140 Copyright by Scientific Software International, Inc., 1981-2006 Use of this program is subject to the terms specified in the Universal Copyright Convention. Website: www.ssicentral.com The following lines were read from file D:\Ma Study\01 main study Raw score\SR.spl: Second Order CFA by Maximum Likelihood Raw Data from file 'D:Study1 main study Raw score.psf' Latent Variables ATREG EMREG SR Relationships ATREG01 = ATREG ATREG02 = ATREG ATREG03 = ATREG ATREG04 = ATREG ATREG05 = ATREG EMREG01 = EMREG EMREG02 = EMREG EMREG03 = EMREG EMREG04 = EMREG EMREG05 = EMREG ATREG = SR EMREG = SR Set Error variance ATREG and EMREG correlate Path Diagram End of Problem Sample Size = 628
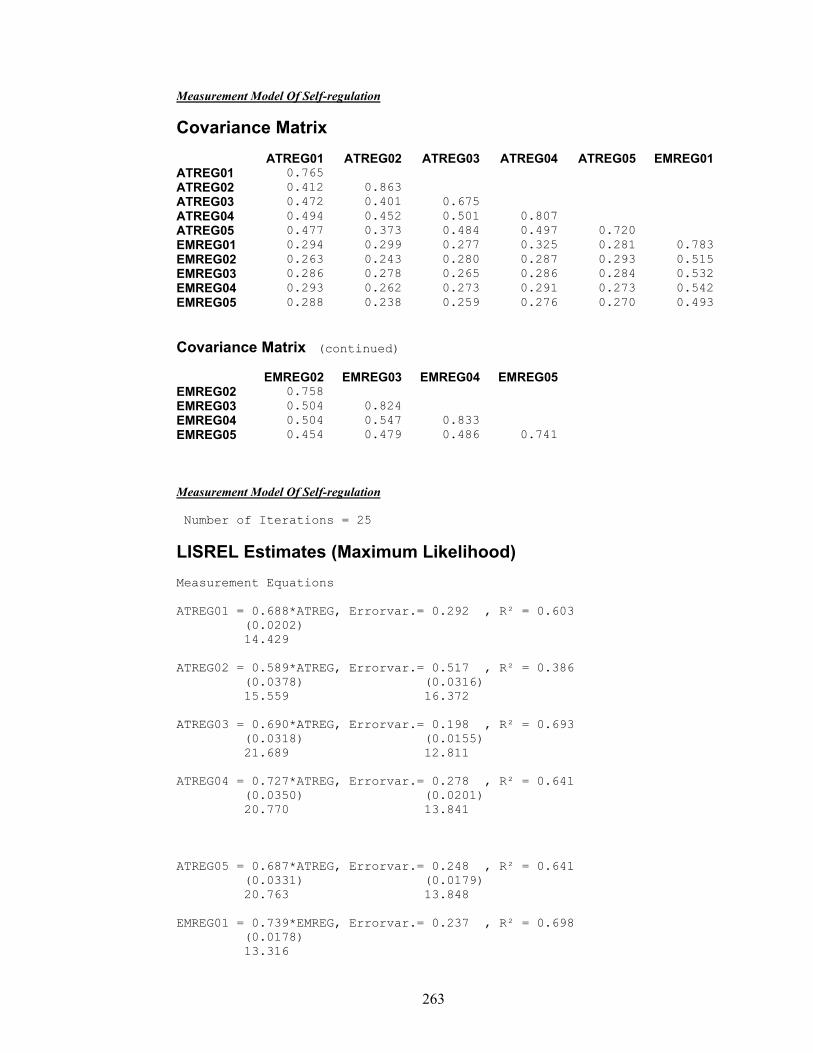
263
Measurement Model Of Self-regulation
Covariance Matrix
ATREG01 ATREG02 ATREG03 ATREG04 ATREG05 EMREG01 ATREG01 0.765 ATREG02 0.412 0.863 ATREG03 0.472 0.401 0.675 ATREG04 0.494 0.452 0.501 0.807 ATREG05 0.477 0.373 0.484 0.497 0.720 EMREG01 0.294 0.299 0.277 0.325 0.281 0.783 EMREG02 0.263 0.243 0.280 0.287 0.293 0.515 EMREG03 0.286 0.278 0.265 0.286 0.284 0.532 EMREG04 0.293 0.262 0.273 0.291 0.273 0.542 EMREG05 0.288 0.238 0.259 0.276 0.270 0.493
Covariance Matrix (continued)
EMREG02 EMREG03 EMREG04 EMREG05 EMREG02 0.758 EMREG03 0.504 0.824 EMREG04 0.504 0.547 0.833 EMREG05 0.454 0.479 0.486 0.741 Measurement Model Of Self-regulation Number of Iterations = 25
LISREL Estimates (Maximum Likelihood) Measurement Equations ATREG01 = 0.688*ATREG, Errorvar.= 0.292 , R² = 0.603
(0.0202) 14.429
ATREG02 = 0.589*ATREG, Errorvar.= 0.517 , R² = 0.386
(0.0378) (0.0316) 15.559 16.372
ATREG03 = 0.690*ATREG, Errorvar.= 0.198 , R² = 0.693
(0.0318) (0.0155) 21.689 12.811
ATREG04 = 0.727*ATREG, Errorvar.= 0.278 , R² = 0.641
(0.0350) (0.0201) 20.770 13.841
ATREG05 = 0.687*ATREG, Errorvar.= 0.248 , R² = 0.641
(0.0331) (0.0179) 20.763 13.848
EMREG01 = 0.739*EMREG, Errorvar.= 0.237 , R² = 0.698
(0.0178) 13.316
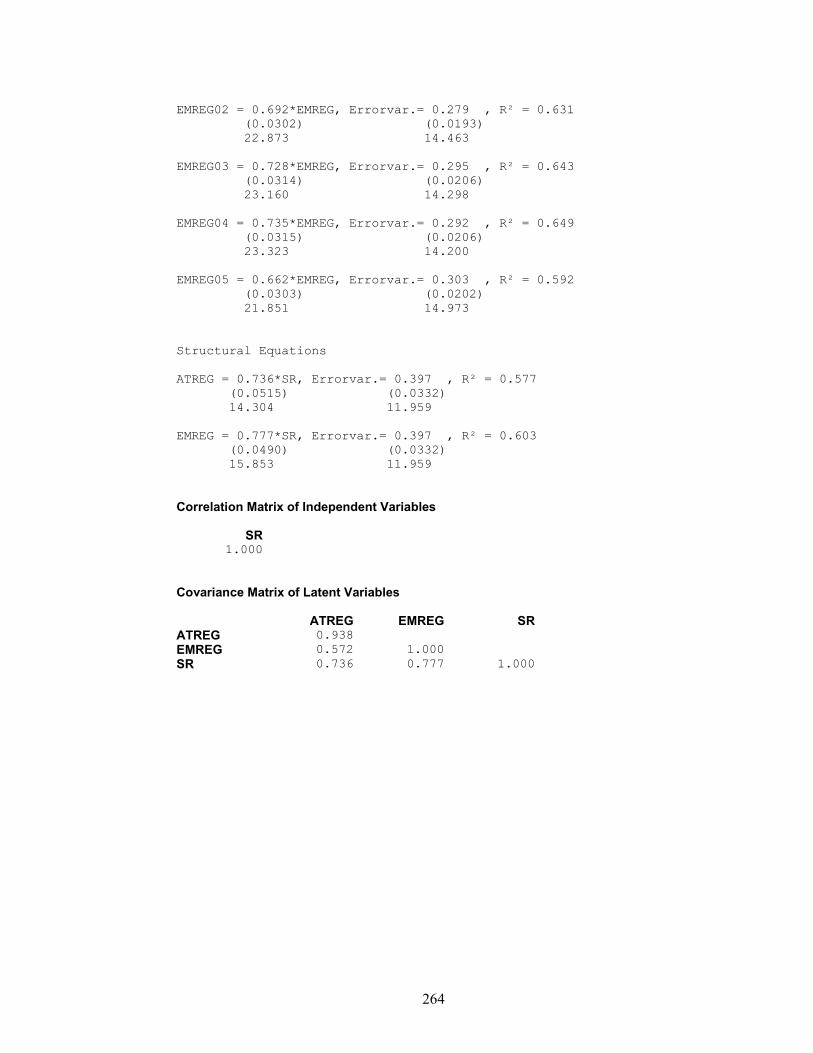
264
EMREG02 = 0.692*EMREG, Errorvar.= 0.279 , R² = 0.631
(0.0302) (0.0193) 22.873 14.463
EMREG03 = 0.728*EMREG, Errorvar.= 0.295 , R² = 0.643
(0.0314) (0.0206) 23.160 14.298
EMREG04 = 0.735*EMREG, Errorvar.= 0.292 , R² = 0.649
(0.0315) (0.0206) 23.323 14.200
EMREG05 = 0.662*EMREG, Errorvar.= 0.303 , R² = 0.592
(0.0303) (0.0202) 21.851 14.973
Structural Equations ATREG = 0.736*SR, Errorvar.= 0.397 , R² = 0.577
(0.0515) (0.0332) 14.304 11.959
EMREG = 0.777*SR, Errorvar.= 0.397 , R² = 0.603
(0.0490) (0.0332) 15.853 11.959
Correlation Matrix of Independent Variables
SR 1.000
Covariance Matrix of Latent Variables
ATREG EMREG SR ATREG 0.938 EMREG 0.572 1.000 SR 0.736 0.777 1.000
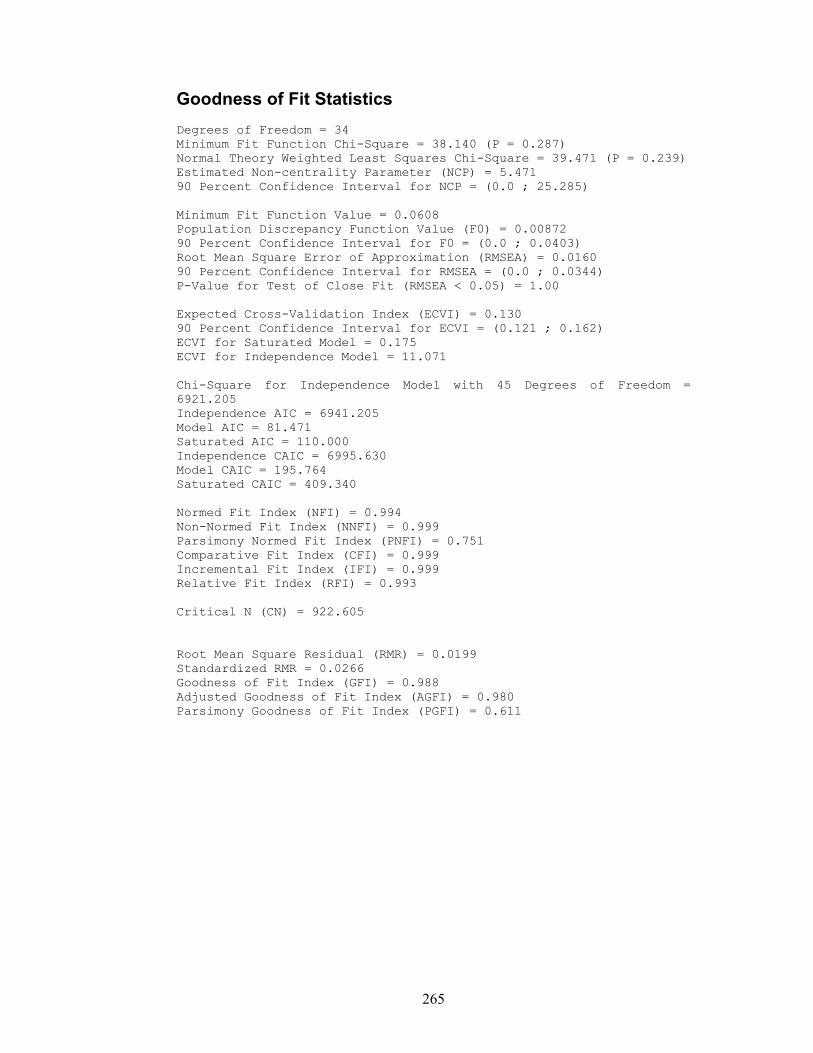
265
Goodness of Fit Statistics Degrees of Freedom = 34 Minimum Fit Function Chi-Square = 38.140 (P = 0.287) Normal Theory Weighted Least Squares Chi-Square = 39.471 (P = 0.239) Estimated Non-centrality Parameter (NCP) = 5.471 90 Percent Confidence Interval for NCP = (0.0 ; 25.285) Minimum Fit Function Value = 0.0608 Population Discrepancy Function Value (F0) = 0.00872 90 Percent Confidence Interval for F0 = (0.0 ; 0.0403) Root Mean Square Error of Approximation (RMSEA) = 0.0160 90 Percent Confidence Interval for RMSEA = (0.0 ; 0.0344) P-Value for Test of Close Fit (RMSEA < 0.05) = 1.00 Expected Cross-Validation Index (ECVI) = 0.130 90 Percent Confidence Interval for ECVI = (0.121 ; 0.162) ECVI for Saturated Model = 0.175 ECVI for Independence Model = 11.071 Chi-Square for Independence Model with 45 Degrees of Freedom = 6921.205 Independence AIC = 6941.205 Model AIC = 81.471 Saturated AIC = 110.000 Independence CAIC = 6995.630 Model CAIC = 195.764 Saturated CAIC = 409.340 Normed Fit Index (NFI) = 0.994 Non-Normed Fit Index (NNFI) = 0.999 Parsimony Normed Fit Index (PNFI) = 0.751 Comparative Fit Index (CFI) = 0.999 Incremental Fit Index (IFI) = 0.999 Relative Fit Index (RFI) = 0.993 Critical N (CN) = 922.605 Root Mean Square Residual (RMR) = 0.0199 Standardized RMR = 0.0266 Goodness of Fit Index (GFI) = 0.988 Adjusted Goodness of Fit Index (AGFI) = 0.980 Parsimony Goodness of Fit Index (PGFI) = 0.611
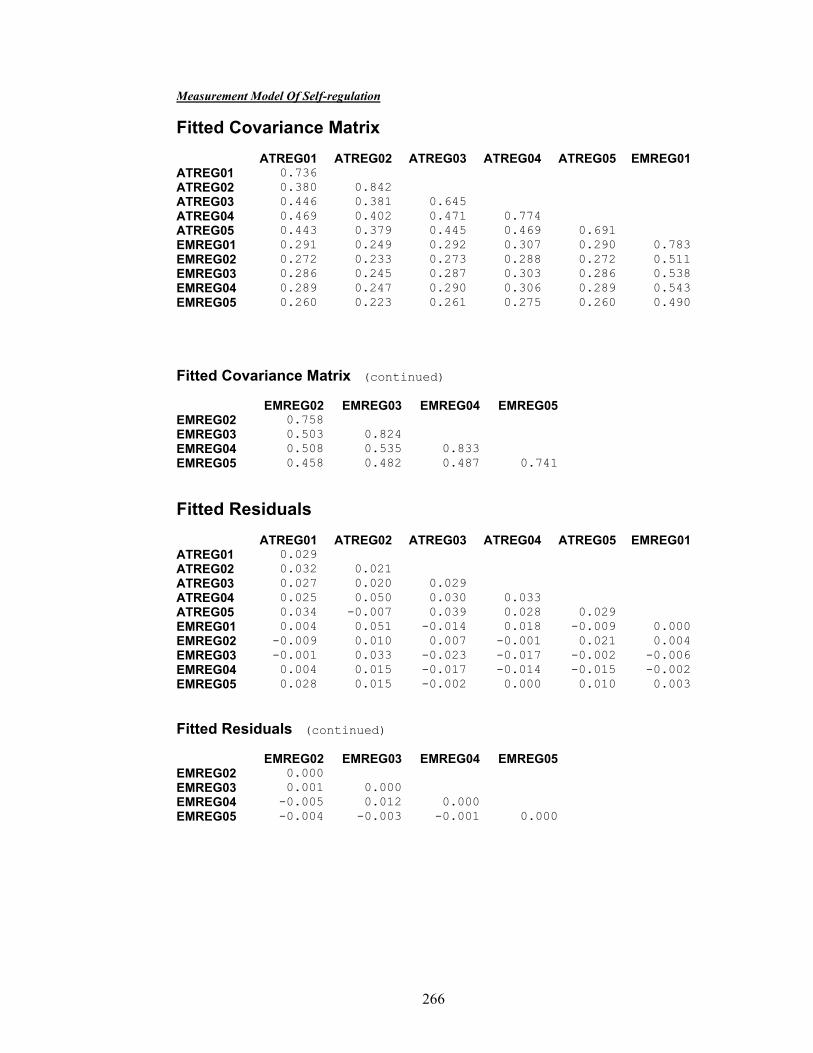
266
Measurement Model Of Self-regulation
Fitted Covariance Matrix
ATREG01 ATREG02 ATREG03 ATREG04 ATREG05 EMREG01 ATREG01 0.736 ATREG02 0.380 0.842 ATREG03 0.446 0.381 0.645 ATREG04 0.469 0.402 0.471 0.774 ATREG05 0.443 0.379 0.445 0.469 0.691 EMREG01 0.291 0.249 0.292 0.307 0.290 0.783 EMREG02 0.272 0.233 0.273 0.288 0.272 0.511 EMREG03 0.286 0.245 0.287 0.303 0.286 0.538 EMREG04 0.289 0.247 0.290 0.306 0.289 0.543 EMREG05 0.260 0.223 0.261 0.275 0.260 0.490
Fitted Covariance Matrix (continued)
EMREG02 EMREG03 EMREG04 EMREG05 EMREG02 0.758 EMREG03 0.503 0.824 EMREG04 0.508 0.535 0.833 EMREG05 0.458 0.482 0.487 0.741
Fitted Residuals
ATREG01 ATREG02 ATREG03 ATREG04 ATREG05 EMREG01 ATREG01 0.029 ATREG02 0.032 0.021 ATREG03 0.027 0.020 0.029 ATREG04 0.025 0.050 0.030 0.033 ATREG05 0.034 -0.007 0.039 0.028 0.029 EMREG01 0.004 0.051 -0.014 0.018 -0.009 0.000 EMREG02 -0.009 0.010 0.007 -0.001 0.021 0.004 EMREG03 -0.001 0.033 -0.023 -0.017 -0.002 -0.006 EMREG04 0.004 0.015 -0.017 -0.014 -0.015 -0.002 EMREG05 0.028 0.015 -0.002 0.000 0.010 0.003
Fitted Residuals (continued)
EMREG02 EMREG03 EMREG04 EMREG05 EMREG02 0.000 EMREG03 0.001 0.000 EMREG04 -0.005 0.012 0.000 EMREG05 -0.004 -0.003 -0.001 0.000
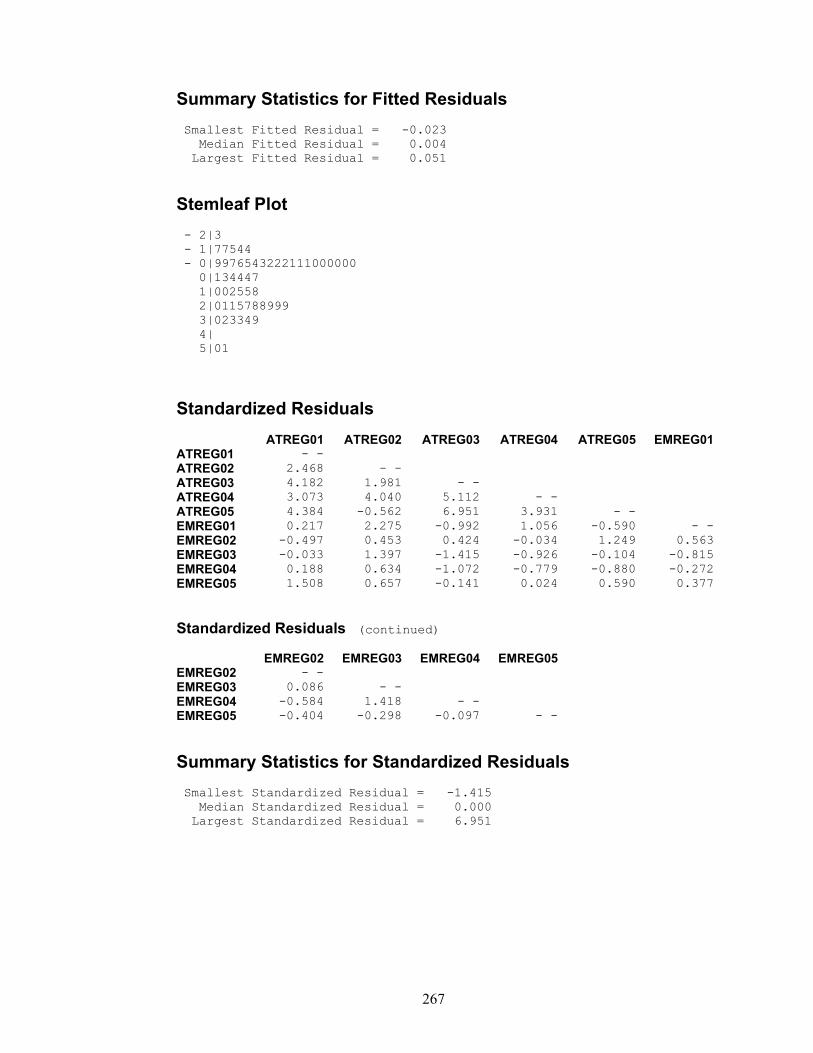
267
Summary Statistics for Fitted Residuals Smallest Fitted Residual = -0.023 Median Fitted Residual = 0.004 Largest Fitted Residual = 0.051
Stemleaf Plot - 2|3 - 1|77544 - 0|9976543222111000000 0|134447 1|002558 2|0115788999 3|023349 4| 5|01
Standardized Residuals
ATREG01 ATREG02 ATREG03 ATREG04 ATREG05 EMREG01 ATREG01 - - ATREG02 2.468 - - ATREG03 4.182 1.981 - - ATREG04 3.073 4.040 5.112 - - ATREG05 4.384 -0.562 6.951 3.931 - - EMREG01 0.217 2.275 -0.992 1.056 -0.590 - - EMREG02 -0.497 0.453 0.424 -0.034 1.249 0.563 EMREG03 -0.033 1.397 -1.415 -0.926 -0.104 -0.815 EMREG04 0.188 0.634 -1.072 -0.779 -0.880 -0.272 EMREG05 1.508 0.657 -0.141 0.024 0.590 0.377
Standardized Residuals (continued)
EMREG02 EMREG03 EMREG04 EMREG05 EMREG02 - - EMREG03 0.086 - - EMREG04 -0.584 1.418 - - EMREG05 -0.404 -0.298 -0.097 - -
Summary Statistics for Standardized Residuals Smallest Standardized Residual = -1.415 Median Standardized Residual = 0.000 Largest Standardized Residual = 6.951
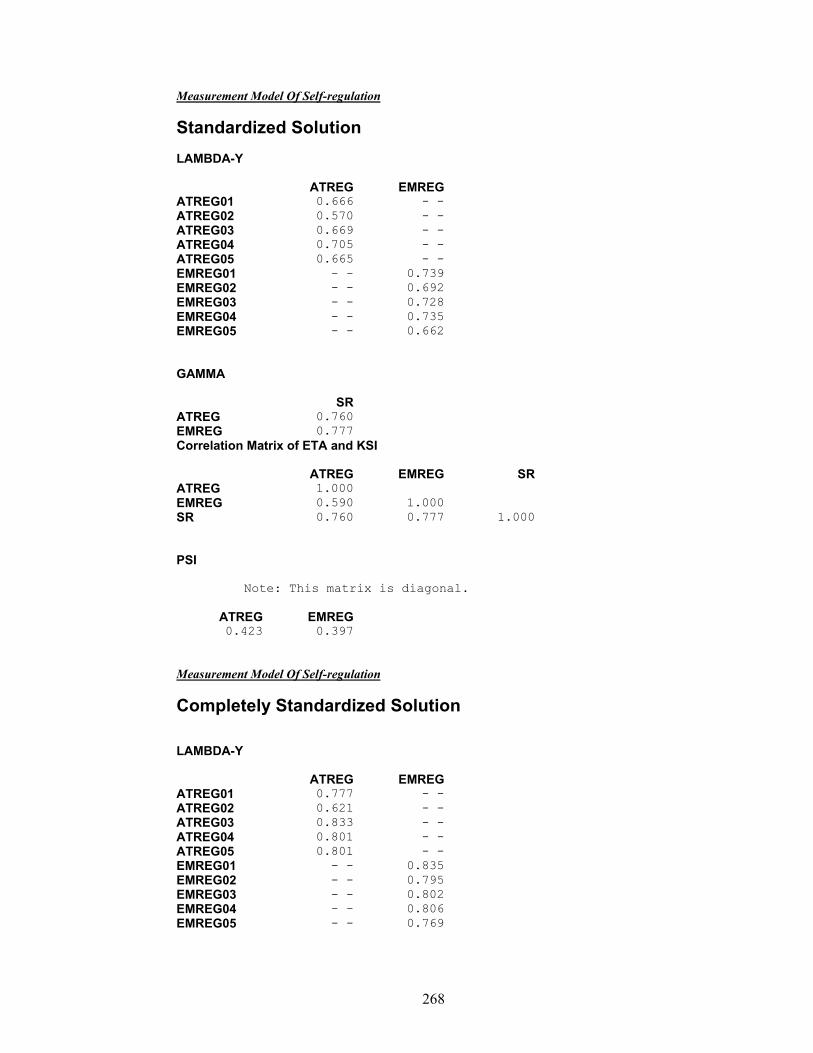
268
Measurement Model Of Self-regulation
Standardized Solution LAMBDA-Y
ATREG EMREG ATREG01 0.666 - - ATREG02 0.570 - - ATREG03 0.669 - - ATREG04 0.705 - - ATREG05 0.665 - - EMREG01 - - 0.739 EMREG02 - - 0.692 EMREG03 - - 0.728 EMREG04 - - 0.735 EMREG05 - - 0.662 GAMMA
SR ATREG 0.760 EMREG 0.777 Correlation Matrix of ETA and KSI
ATREG EMREG SR ATREG 1.000 EMREG 0.590 1.000 SR 0.760 0.777 1.000 PSI Note: This matrix is diagonal.
ATREG EMREG 0.423 0.397
Measurement Model Of Self-regulation
Completely Standardized Solution LAMBDA-Y
ATREG EMREG ATREG01 0.777 - - ATREG02 0.621 - - ATREG03 0.833 - - ATREG04 0.801 - - ATREG05 0.801 - - EMREG01 - - 0.835 EMREG02 - - 0.795 EMREG03 - - 0.802 EMREG04 - - 0.806 EMREG05 - - 0.769

269
GAMMA
SR ATREG 0.760 EMREG 0.777 Correlation Matrix of ETA and KSI
ATREG EMREG SR ATREG 1.000 EMREG 0.590 1.000 SR 0.760 0.777 1.000 PSI Note: This matrix is diagonal.
ATREG EMREG 0.423 0.397
THETA-EPS ATREG01 ATREG02 ATREG03 ATREG04 ATREG05 EMREG01
0.397 0.614 0.307 0.359 0.359 0.302 THETA-EPS (continued) EMREG02 EMREG03 EMREG04 EMREG05
0.369 0.357 0.351 0.408
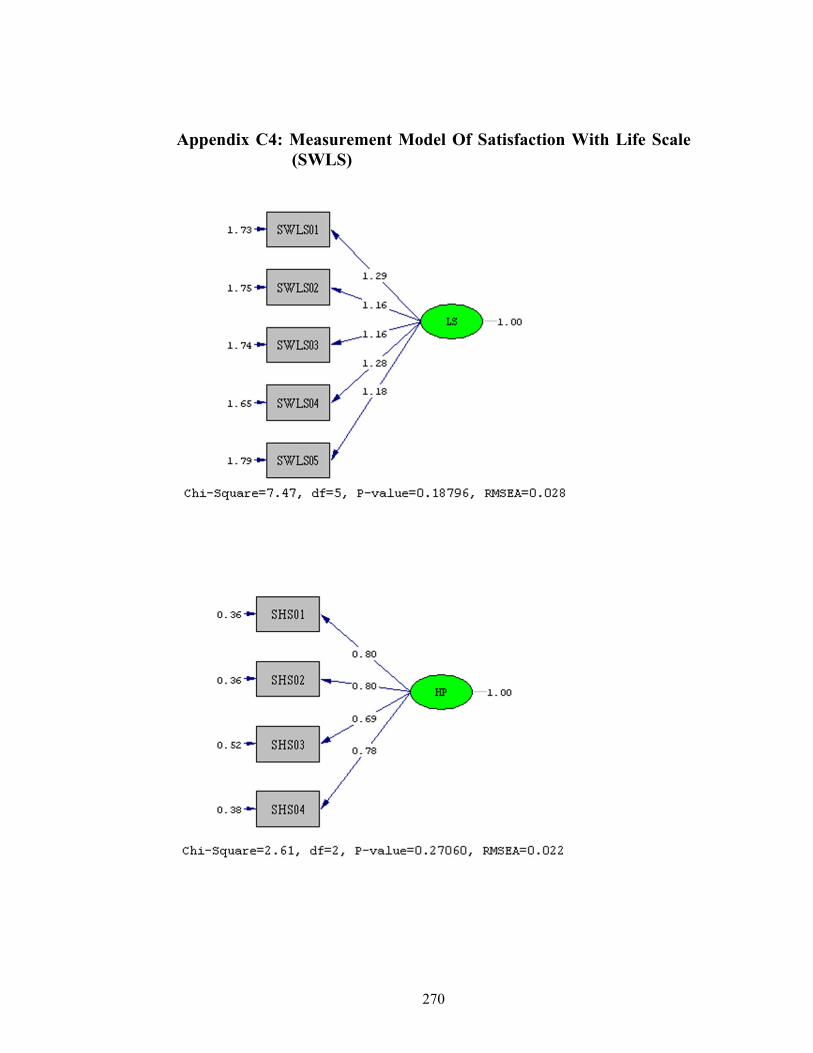
270
Appendix C4: Measurement Model Of Satisfaction With Life Scale
(SWLS)
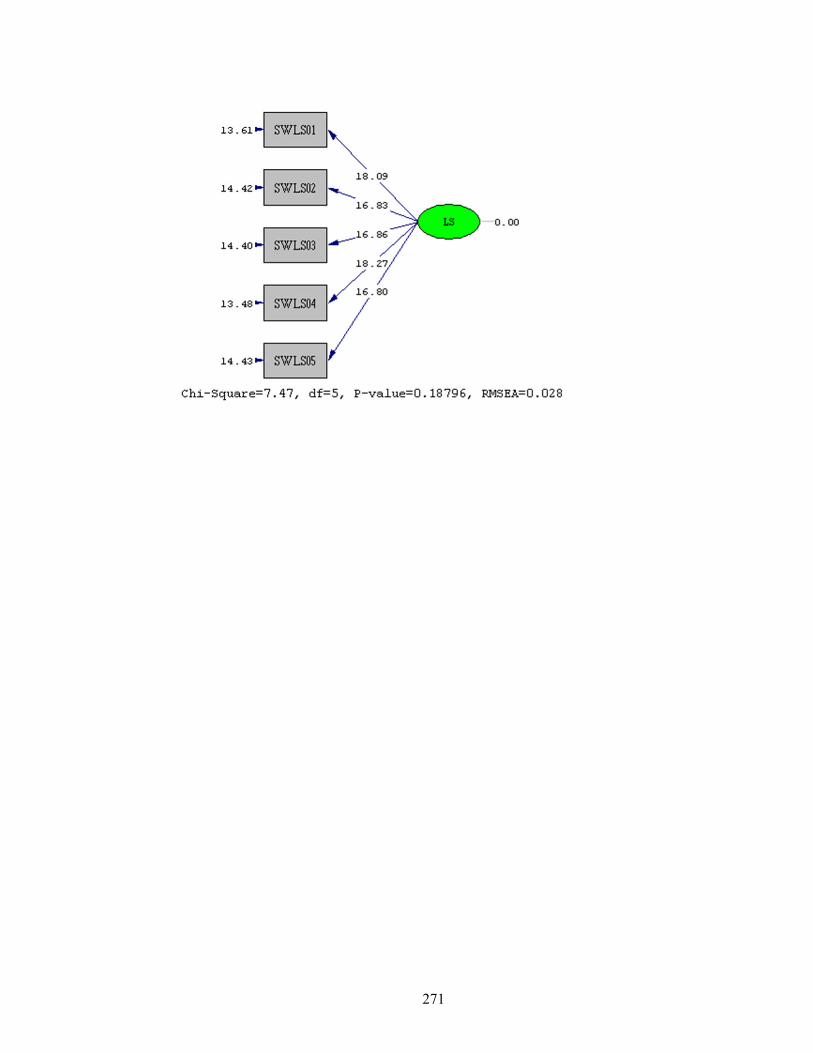
271
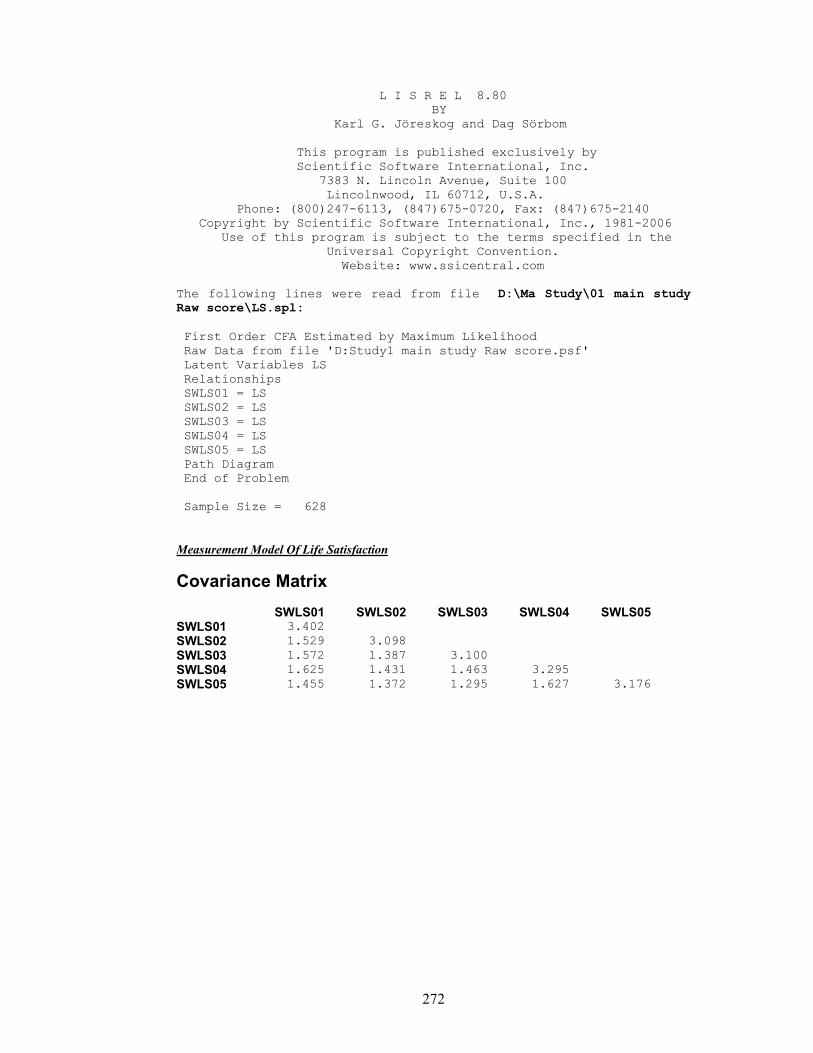
272
L I S R E L 8.80 BY Karl G. Jöreskog and Dag Sörbom This program is published exclusively by Scientific Software International, Inc. 7383 N. Lincoln Avenue, Suite 100 Lincolnwood, IL 60712, U.S.A. Phone: (800)247-6113, (847)675-0720, Fax: (847)675-2140 Copyright by Scientific Software International, Inc., 1981-2006 Use of this program is subject to the terms specified in the Universal Copyright Convention. Website: www.ssicentral.com The following lines were read from file D:\Ma Study\01 main study Raw score\LS.spl: First Order CFA Estimated by Maximum Likelihood Raw Data from file 'D:Study1 main study Raw score.psf' Latent Variables LS Relationships SWLS01 = LS SWLS02 = LS SWLS03 = LS SWLS04 = LS SWLS05 = LS Path Diagram End of Problem Sample Size = 628 Measurement Model Of Life Satisfaction
Covariance Matrix
SWLS01 SWLS02 SWLS03 SWLS04 SWLS05 SWLS01 3.402 SWLS02 1.529 3.098 SWLS03 1.572 1.387 3.100 SWLS04 1.625 1.431 1.463 3.295 SWLS05 1.455 1.372 1.295 1.627 3.176
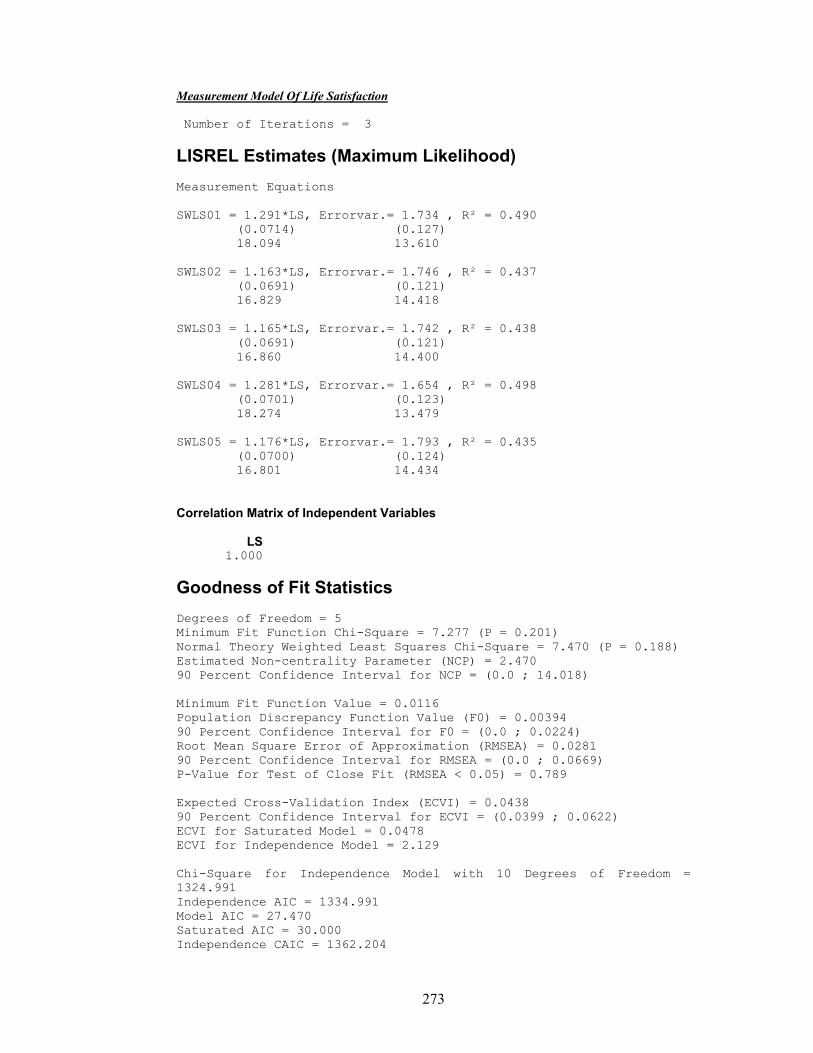
273
Measurement Model Of Life Satisfaction Number of Iterations = 3
LISREL Estimates (Maximum Likelihood) Measurement Equations SWLS01 = 1.291*LS, Errorvar.= 1.734 , R² = 0.490
(0.0714) (0.127) 18.094 13.610
SWLS02 = 1.163*LS, Errorvar.= 1.746 , R² = 0.437
(0.0691) (0.121) 16.829 14.418
SWLS03 = 1.165*LS, Errorvar.= 1.742 , R² = 0.438
(0.0691) (0.121) 16.860 14.400
SWLS04 = 1.281*LS, Errorvar.= 1.654 , R² = 0.498
(0.0701) (0.123) 18.274 13.479
SWLS05 = 1.176*LS, Errorvar.= 1.793 , R² = 0.435
(0.0700) (0.124) 16.801 14.434
Correlation Matrix of Independent Variables
LS 1.000
Goodness of Fit Statistics Degrees of Freedom = 5 Minimum Fit Function Chi-Square = 7.277 (P = 0.201) Normal Theory Weighted Least Squares Chi-Square = 7.470 (P = 0.188) Estimated Non-centrality Parameter (NCP) = 2.470 90 Percent Confidence Interval for NCP = (0.0 ; 14.018) Minimum Fit Function Value = 0.0116 Population Discrepancy Function Value (F0) = 0.00394 90 Percent Confidence Interval for F0 = (0.0 ; 0.0224) Root Mean Square Error of Approximation (RMSEA) = 0.0281 90 Percent Confidence Interval for RMSEA = (0.0 ; 0.0669) P-Value for Test of Close Fit (RMSEA < 0.05) = 0.789 Expected Cross-Validation Index (ECVI) = 0.0438 90 Percent Confidence Interval for ECVI = (0.0399 ; 0.0622) ECVI for Saturated Model = 0.0478 ECVI for Independence Model = 2.129 Chi-Square for Independence Model with 10 Degrees of Freedom = 1324.991 Independence AIC = 1334.991 Model AIC = 27.470 Saturated AIC = 30.000 Independence CAIC = 1362.204
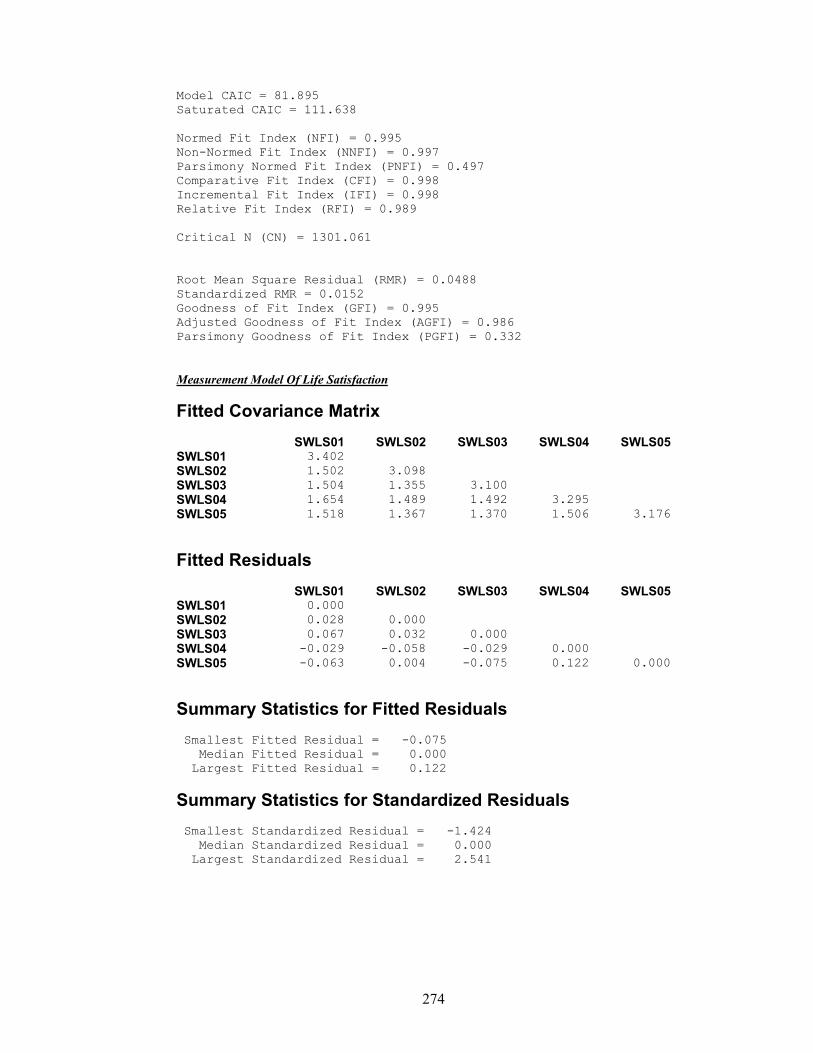
274
Model CAIC = 81.895 Saturated CAIC = 111.638 Normed Fit Index (NFI) = 0.995 Non-Normed Fit Index (NNFI) = 0.997 Parsimony Normed Fit Index (PNFI) = 0.497 Comparative Fit Index (CFI) = 0.998 Incremental Fit Index (IFI) = 0.998 Relative Fit Index (RFI) = 0.989 Critical N (CN) = 1301.061 Root Mean Square Residual (RMR) = 0.0488 Standardized RMR = 0.0152 Goodness of Fit Index (GFI) = 0.995 Adjusted Goodness of Fit Index (AGFI) = 0.986 Parsimony Goodness of Fit Index (PGFI) = 0.332 Measurement Model Of Life Satisfaction
Fitted Covariance Matrix
SWLS01 SWLS02 SWLS03 SWLS04 SWLS05 SWLS01 3.402 SWLS02 1.502 3.098 SWLS03 1.504 1.355 3.100 SWLS04 1.654 1.489 1.492 3.295 SWLS05 1.518 1.367 1.370 1.506 3.176
Fitted Residuals
SWLS01 SWLS02 SWLS03 SWLS04 SWLS05 SWLS01 0.000 SWLS02 0.028 0.000 SWLS03 0.067 0.032 0.000 SWLS04 -0.029 -0.058 -0.029 0.000 SWLS05 -0.063 0.004 -0.075 0.122 0.000
Summary Statistics for Fitted Residuals Smallest Fitted Residual = -0.075 Median Fitted Residual = 0.000 Largest Fitted Residual = 0.122
Summary Statistics for Standardized Residuals Smallest Standardized Residual = -1.424 Median Standardized Residual = 0.000 Largest Standardized Residual = 2.541
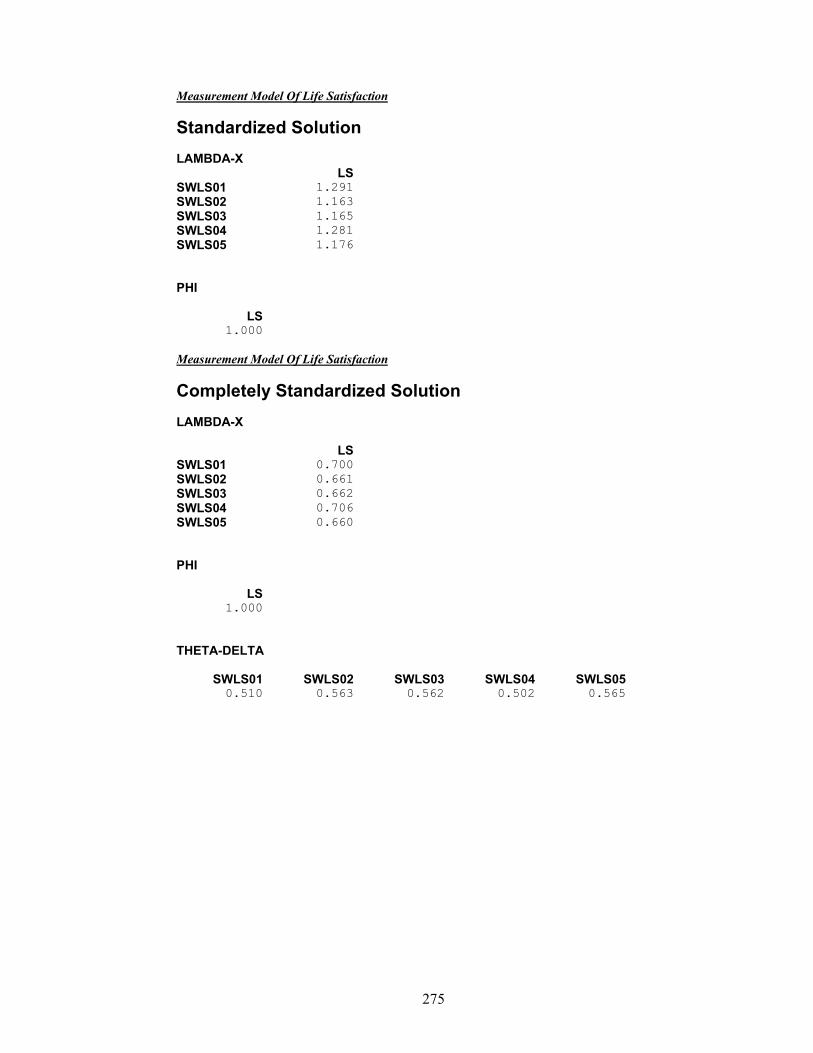
275
Measurement Model Of Life Satisfaction
Standardized Solution LAMBDA-X
LS SWLS01 1.291 SWLS02 1.163 SWLS03 1.165 SWLS04 1.281 SWLS05 1.176 PHI
LS 1.000
Measurement Model Of Life Satisfaction
Completely Standardized Solution LAMBDA-X
LS SWLS01 0.700 SWLS02 0.661 SWLS03 0.662 SWLS04 0.706 SWLS05 0.660 PHI
LS 1.000
THETA-DELTA
SWLS01 SWLS02 SWLS03 SWLS04 SWLS05 0.510 0.563 0.562 0.502 0.565
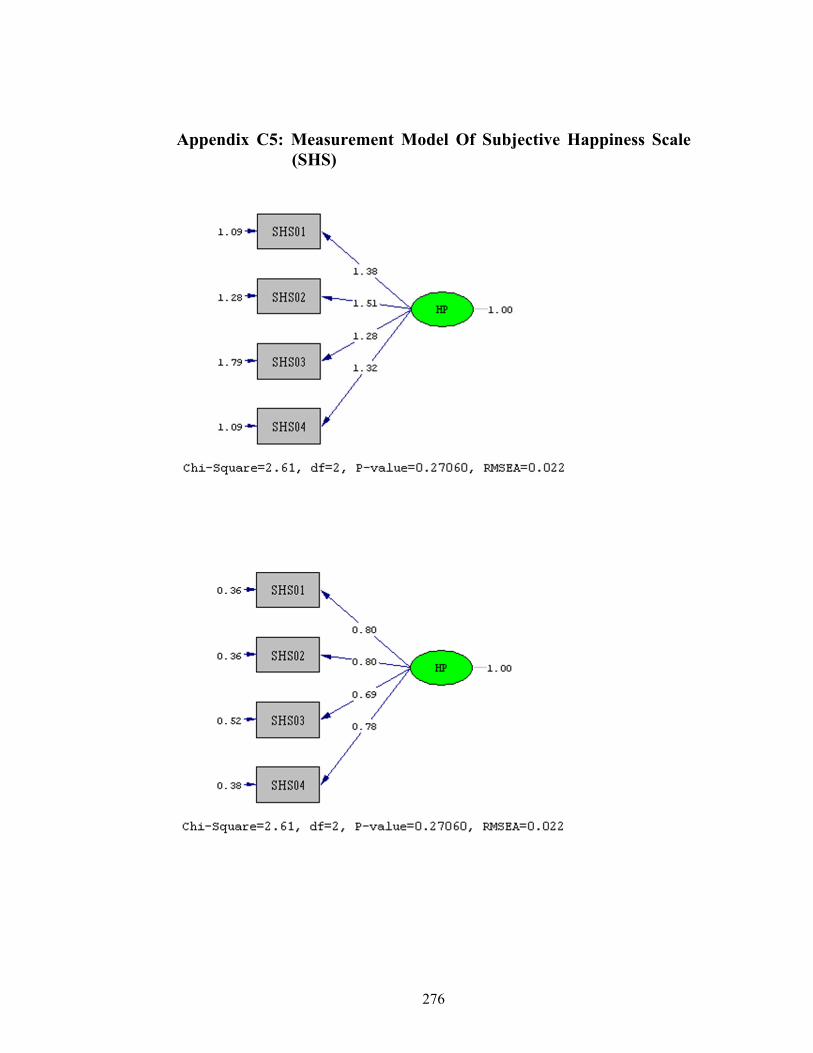
276
Appendix C5: Measurement Model Of Subjective Happiness Scale
(SHS)
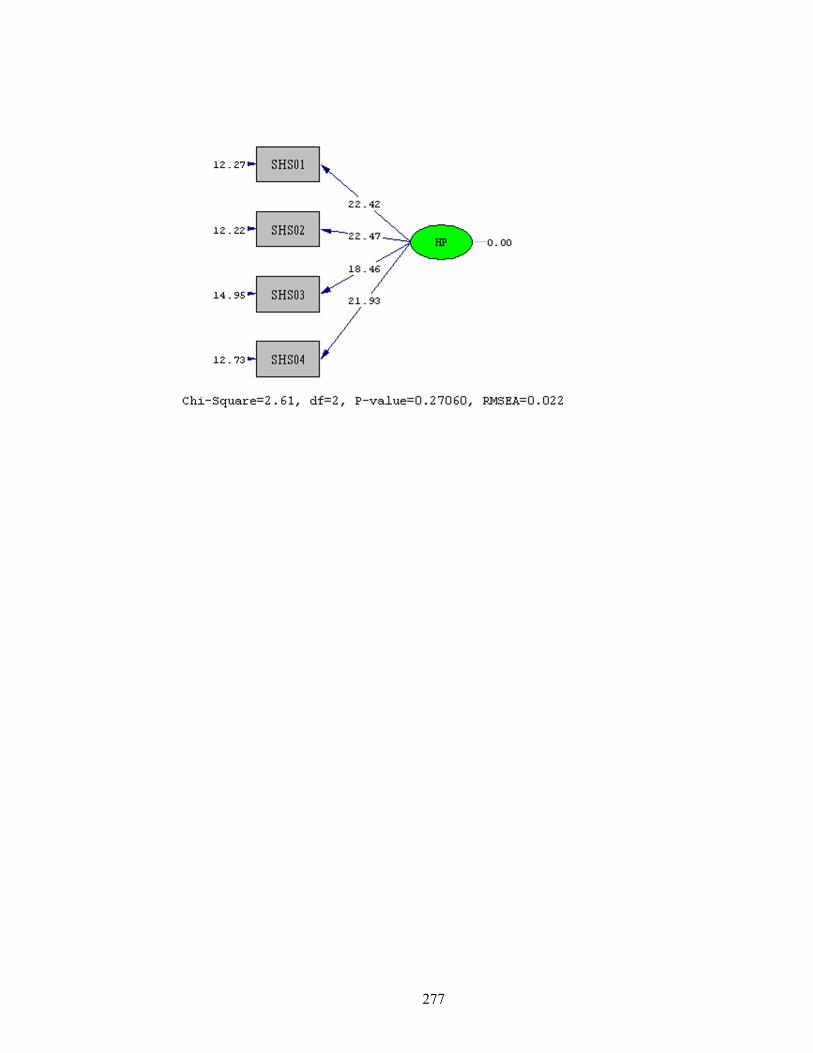
277
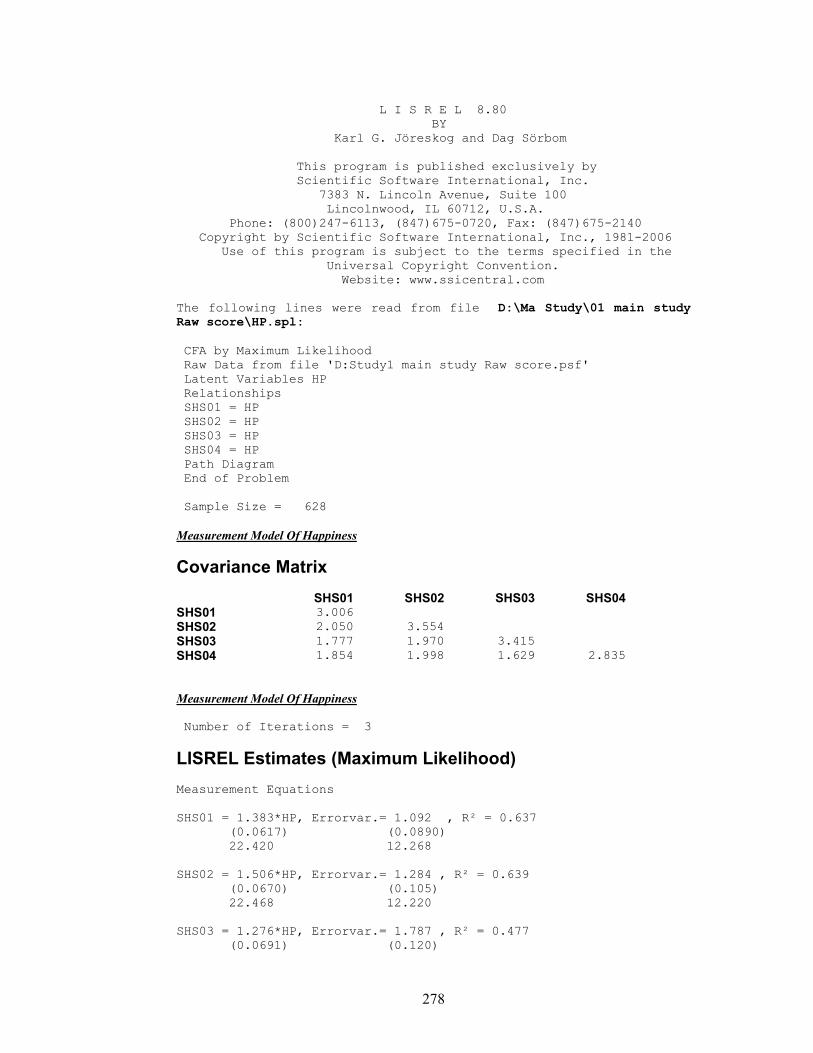
278
L I S R E L 8.80 BY Karl G. Jöreskog and Dag Sörbom This program is published exclusively by Scientific Software International, Inc. 7383 N. Lincoln Avenue, Suite 100 Lincolnwood, IL 60712, U.S.A. Phone: (800)247-6113, (847)675-0720, Fax: (847)675-2140 Copyright by Scientific Software International, Inc., 1981-2006 Use of this program is subject to the terms specified in the Universal Copyright Convention. Website: www.ssicentral.com The following lines were read from file D:\Ma Study\01 main study Raw score\HP.spl: CFA by Maximum Likelihood Raw Data from file 'D:Study1 main study Raw score.psf' Latent Variables HP Relationships SHS01 = HP SHS02 = HP SHS03 = HP SHS04 = HP Path Diagram End of Problem Sample Size = 628 Measurement Model Of Happiness
Covariance Matrix
SHS01 SHS02 SHS03 SHS04 SHS01 3.006 SHS02 2.050 3.554 SHS03 1.777 1.970 3.415 SHS04 1.854 1.998 1.629 2.835 Measurement Model Of Happiness Number of Iterations = 3
LISREL Estimates (Maximum Likelihood) Measurement Equations SHS01 = 1.383*HP, Errorvar.= 1.092 , R² = 0.637
(0.0617) (0.0890) 22.420 12.268
SHS02 = 1.506*HP, Errorvar.= 1.284 , R² = 0.639
(0.0670) (0.105) 22.468 12.220
SHS03 = 1.276*HP, Errorvar.= 1.787 , R² = 0.477
(0.0691) (0.120)
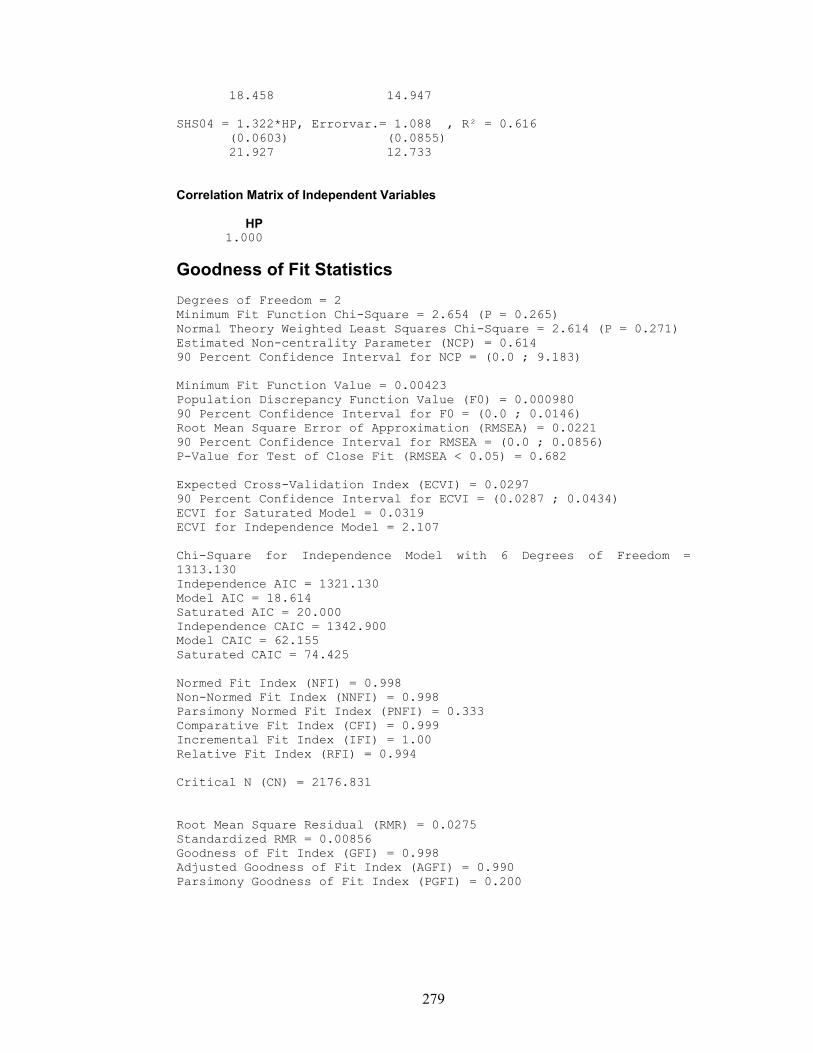
279
18.458 14.947 SHS04 = 1.322*HP, Errorvar.= 1.088 , R² = 0.616
(0.0603) (0.0855) 21.927 12.733
Correlation Matrix of Independent Variables
HP 1.000
Goodness of Fit Statistics Degrees of Freedom = 2 Minimum Fit Function Chi-Square = 2.654 (P = 0.265) Normal Theory Weighted Least Squares Chi-Square = 2.614 (P = 0.271) Estimated Non-centrality Parameter (NCP) = 0.614 90 Percent Confidence Interval for NCP = (0.0 ; 9.183) Minimum Fit Function Value = 0.00423 Population Discrepancy Function Value (F0) = 0.000980 90 Percent Confidence Interval for F0 = (0.0 ; 0.0146) Root Mean Square Error of Approximation (RMSEA) = 0.0221 90 Percent Confidence Interval for RMSEA = (0.0 ; 0.0856) P-Value for Test of Close Fit (RMSEA < 0.05) = 0.682 Expected Cross-Validation Index (ECVI) = 0.0297 90 Percent Confidence Interval for ECVI = (0.0287 ; 0.0434) ECVI for Saturated Model = 0.0319 ECVI for Independence Model = 2.107 Chi-Square for Independence Model with 6 Degrees of Freedom = 1313.130 Independence AIC = 1321.130 Model AIC = 18.614 Saturated AIC = 20.000 Independence CAIC = 1342.900 Model CAIC = 62.155 Saturated CAIC = 74.425 Normed Fit Index (NFI) = 0.998 Non-Normed Fit Index (NNFI) = 0.998 Parsimony Normed Fit Index (PNFI) = 0.333 Comparative Fit Index (CFI) = 0.999 Incremental Fit Index (IFI) = 1.00 Relative Fit Index (RFI) = 0.994 Critical N (CN) = 2176.831 Root Mean Square Residual (RMR) = 0.0275 Standardized RMR = 0.00856 Goodness of Fit Index (GFI) = 0.998 Adjusted Goodness of Fit Index (AGFI) = 0.990 Parsimony Goodness of Fit Index (PGFI) = 0.200
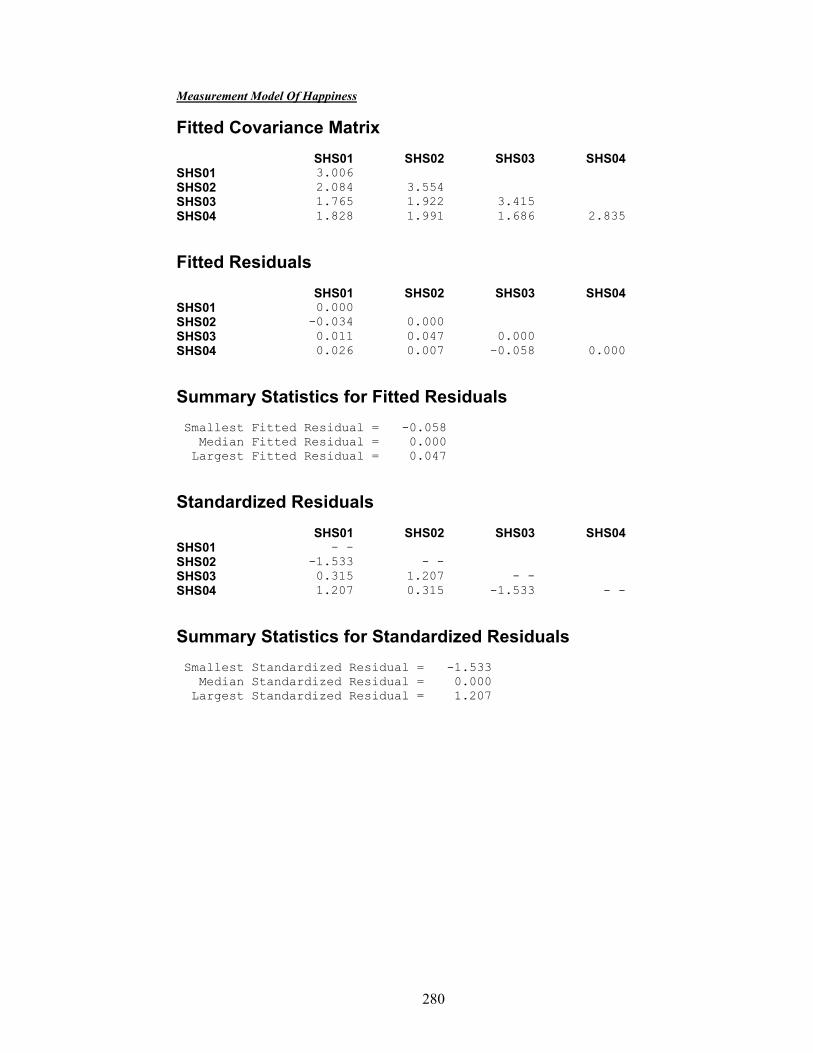
280
Measurement Model Of Happiness
Fitted Covariance Matrix
SHS01 SHS02 SHS03 SHS04 SHS01 3.006 SHS02 2.084 3.554 SHS03 1.765 1.922 3.415 SHS04 1.828 1.991 1.686 2.835
Fitted Residuals
SHS01 SHS02 SHS03 SHS04 SHS01 0.000 SHS02 -0.034 0.000 SHS03 0.011 0.047 0.000 SHS04 0.026 0.007 -0.058 0.000
Summary Statistics for Fitted Residuals Smallest Fitted Residual = -0.058 Median Fitted Residual = 0.000 Largest Fitted Residual = 0.047
Standardized Residuals
SHS01 SHS02 SHS03 SHS04 SHS01 - - SHS02 -1.533 - - SHS03 0.315 1.207 - - SHS04 1.207 0.315 -1.533 - -
Summary Statistics for Standardized Residuals Smallest Standardized Residual = -1.533 Median Standardized Residual = 0.000 Largest Standardized Residual = 1.207
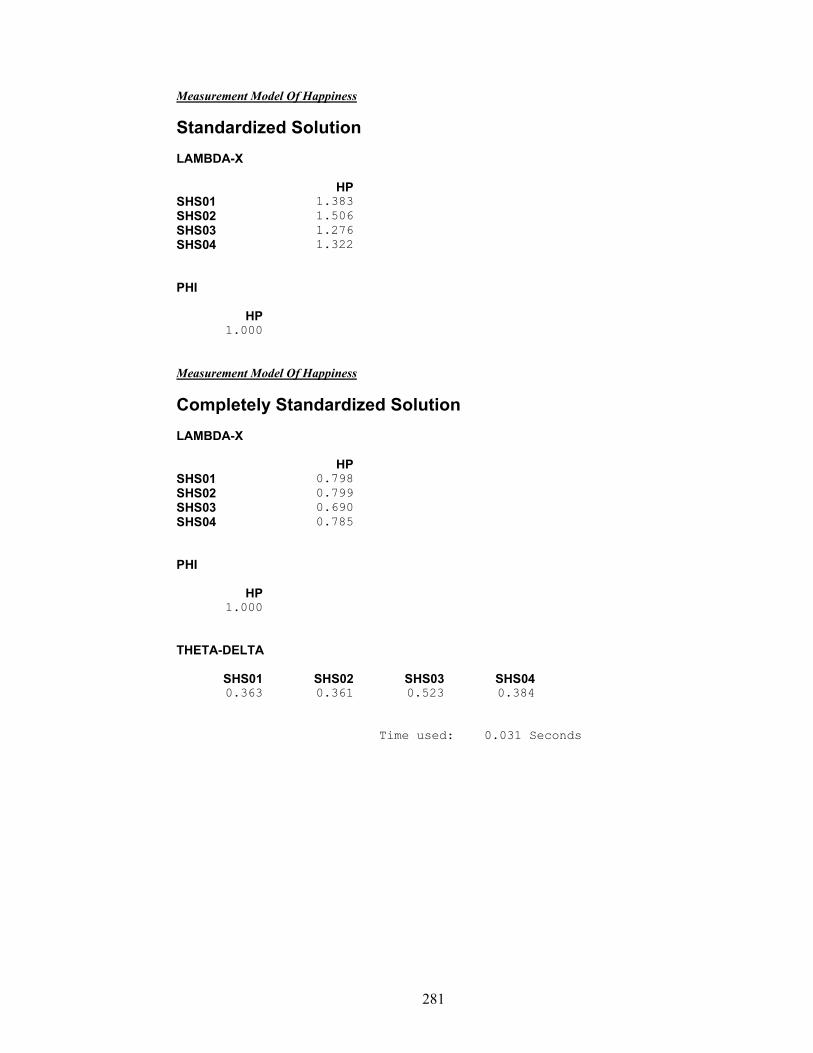
281
Measurement Model Of Happiness
Standardized Solution LAMBDA-X
HP SHS01 1.383 SHS02 1.506 SHS03 1.276 SHS04 1.322 PHI
HP 1.000
Measurement Model Of Happiness
Completely Standardized Solution LAMBDA-X
HP SHS01 0.798 SHS02 0.799 SHS03 0.690 SHS04 0.785 PHI
HP 1.000
THETA-DELTA
SHS01 SHS02 SHS03 SHS04 0.363 0.361 0.523 0.384
Time used: 0.031 Seconds
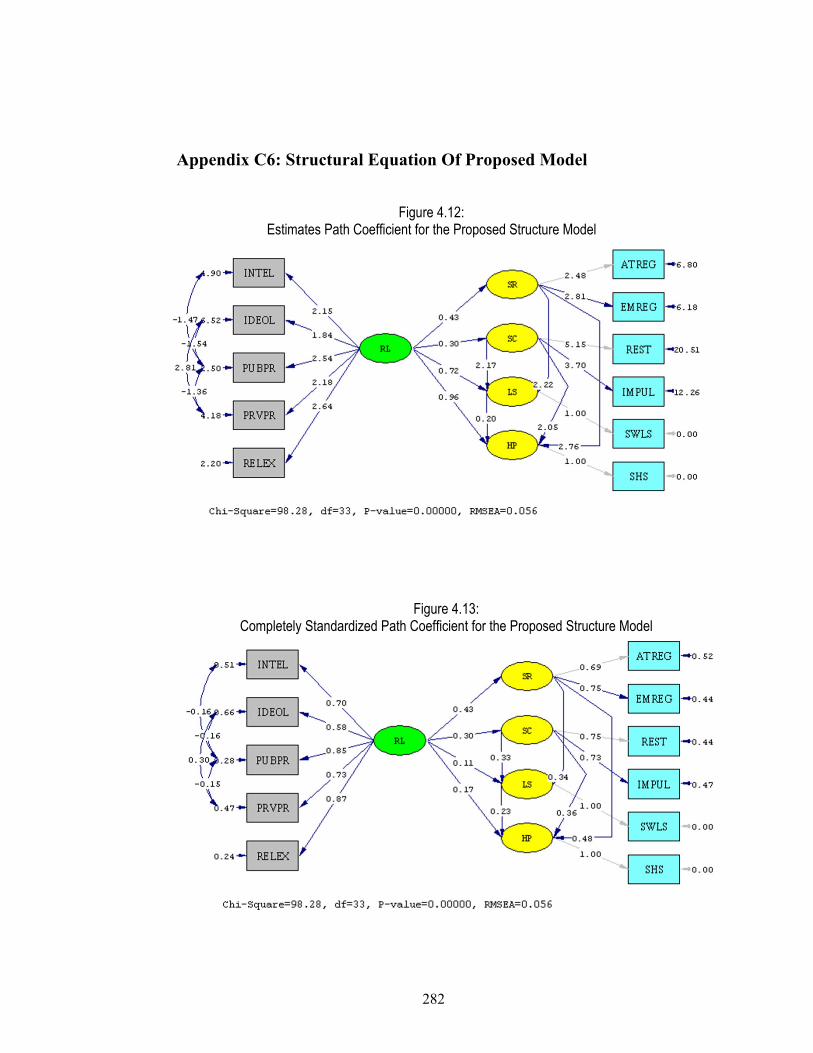
282
Appendix C6: Structural Equation Of Proposed Model
Figure 4.12: Estimates Path Coefficient for the Proposed Structure Model
Figure 4.13: Completely Standardized Path Coefficient for the Proposed Structure Model
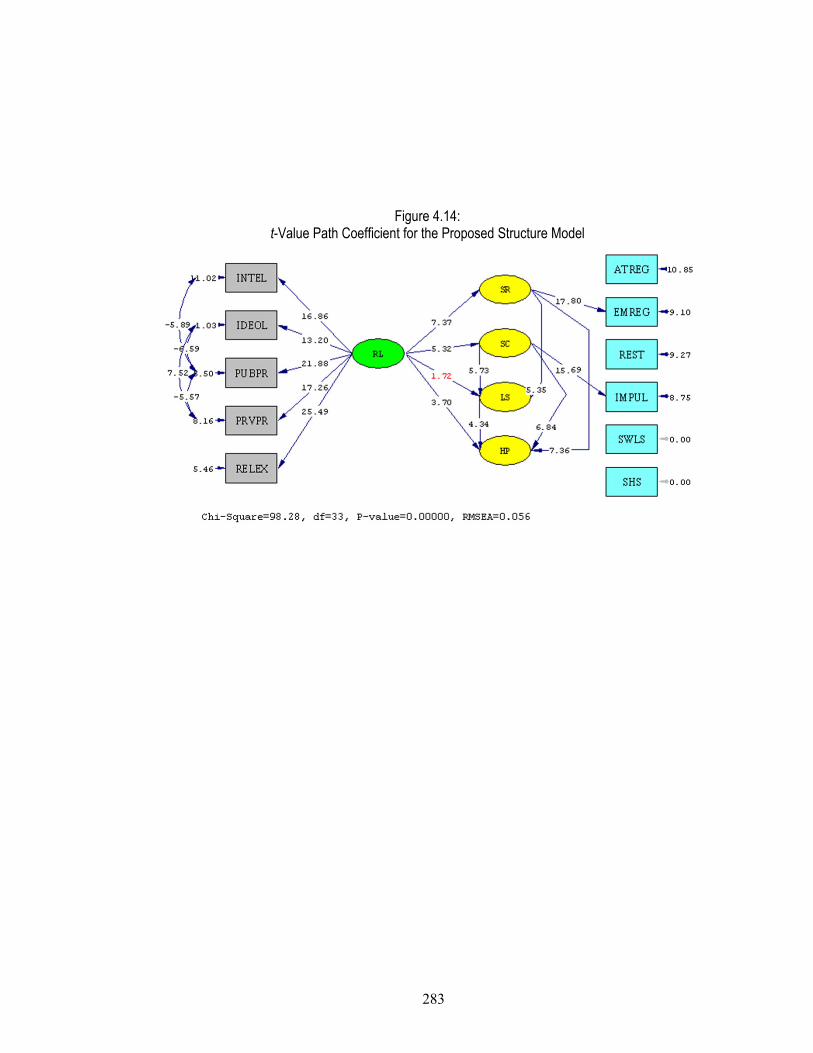
283
Figure 4.14: t-Value Path Coefficient for the Proposed Structure Model

284
L I S R E L 8.80 BY Karl G. Jöreskog and Dag Sörbom This program is published exclusively by Scientific Software International, Inc. 7383 N. Lincoln Avenue, Suite 100 Lincolnwood, IL 60712, U.S.A. Phone: (800)247-6113, (847)675-0720, Fax: (847)675-2140 Copyright by Scientific Software International, Inc., 1981-2006 Use of this program is subject to the terms specified in the Universal Copyright Convention. Website: www.ssicentral.com The following lines were read from file D:\Ma Study\01 main study Raw score\FactorStructure.spl: Structural Equation Models Based on The Partial Aggregation Approach Raw Data from file 'D:Study1 main study Raw score.psf' Asymptotic Covariance Matrix From File FactorStructure.acm Latent Variables SR SC LS HP RL Relationships ATREG = SR EMREG = SR REST = SC IMPUL = SC SWLS = 1.000*LS SHS = 1.000*HP INTEL = RL IDEOL = RL PUBPR = RL PRVPR = RL RELEX = RL LS = SR LS = SC HP = SR HP = SC HP = LS SR = RL SC = RL LS = RL HP = RL Set the Error Variance of SWLS to 0 Set the Error Variance of SHS to 0 Set the Error Covariance of PUBPR and INTEL correlate Set the Error Covariance of PUBPR and IDEOL correlate Set the Error Covariance of PRVPR and IDEOL correlate Set the Error Covariance of PRVPR and PUBPR correlate Path Diagram End of Problem Sample Size = 628
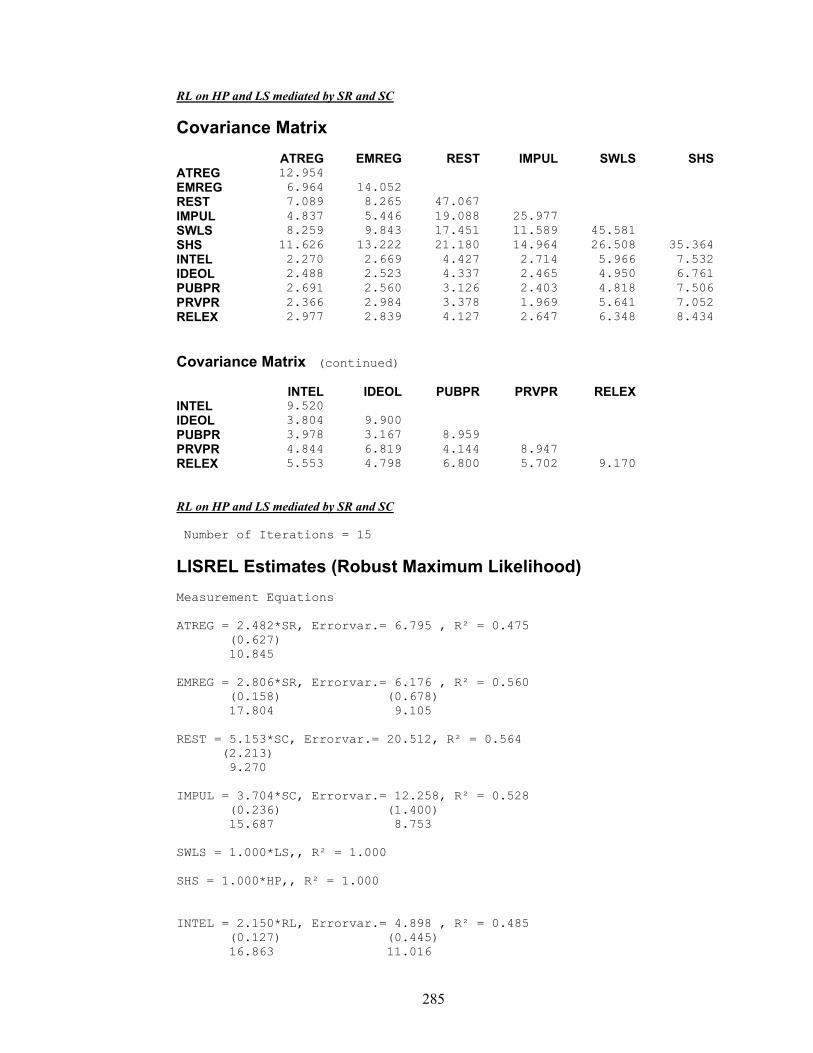
285
RL on HP and LS mediated by SR and SC
Covariance Matrix
ATREG EMREG REST IMPUL SWLS SHS ATREG 12.954 EMREG 6.964 14.052 REST 7.089 8.265 47.067 IMPUL 4.837 5.446 19.088 25.977 SWLS 8.259 9.843 17.451 11.589 45.581 SHS 11.626 13.222 21.180 14.964 26.508 35.364 INTEL 2.270 2.669 4.427 2.714 5.966 7.532 IDEOL 2.488 2.523 4.337 2.465 4.950 6.761 PUBPR 2.691 2.560 3.126 2.403 4.818 7.506 PRVPR 2.366 2.984 3.378 1.969 5.641 7.052 RELEX 2.977 2.839 4.127 2.647 6.348 8.434
Covariance Matrix (continued)
INTEL IDEOL PUBPR PRVPR RELEX INTEL 9.520 IDEOL 3.804 9.900 PUBPR 3.978 3.167 8.959 PRVPR 4.844 6.819 4.144 8.947 RELEX 5.553 4.798 6.800 5.702 9.170 RL on HP and LS mediated by SR and SC Number of Iterations = 15
LISREL Estimates (Robust Maximum Likelihood) Measurement Equations ATREG = 2.482*SR, Errorvar.= 6.795 , R² = 0.475
(0.627) 10.845
EMREG = 2.806*SR, Errorvar.= 6.176 , R² = 0.560
(0.158) (0.678) 17.804 9.105
REST = 5.153*SC, Errorvar.= 20.512, R² = 0.564
(2.213) 9.270
IMPUL = 3.704*SC, Errorvar.= 12.258, R² = 0.528
(0.236) (1.400) 15.687 8.753
SWLS = 1.000*LS,, R² = 1.000 SHS = 1.000*HP,, R² = 1.000 INTEL = 2.150*RL, Errorvar.= 4.898 , R² = 0.485
(0.127) (0.445) 16.863 11.016
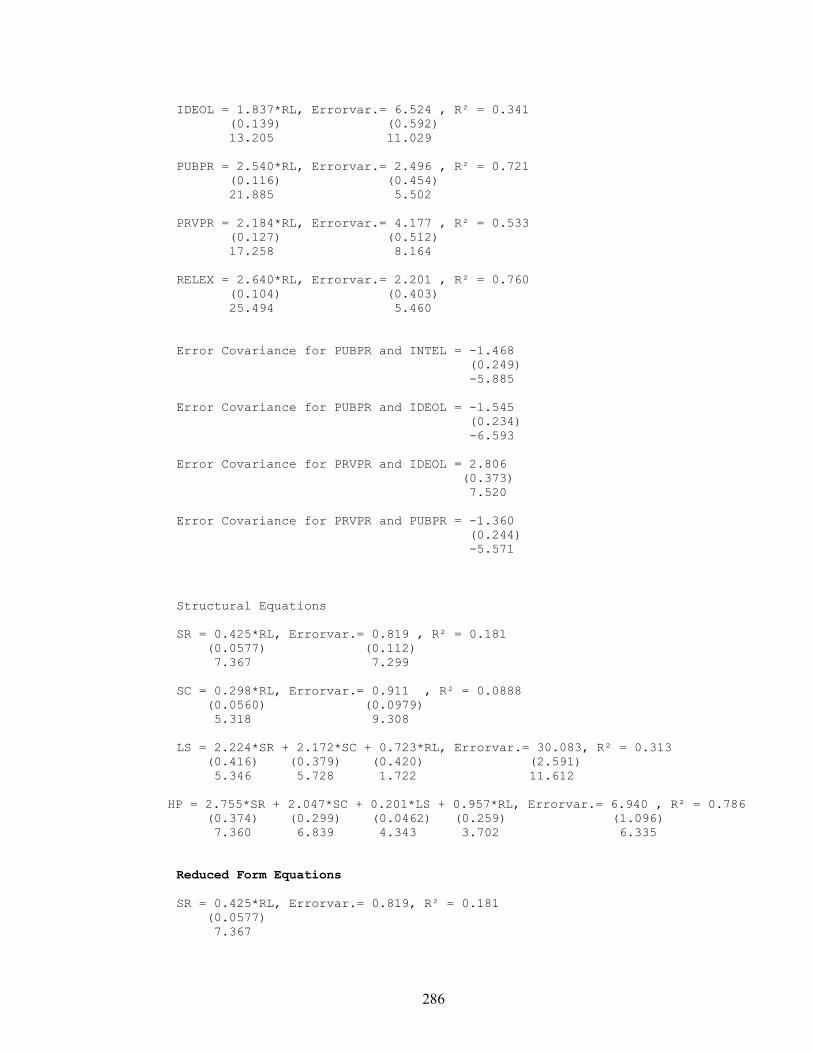
286
IDEOL = 1.837*RL, Errorvar.= 6.524 , R² = 0.341
(0.139) (0.592) 13.205 11.029
PUBPR = 2.540*RL, Errorvar.= 2.496 , R² = 0.721
(0.116) (0.454) 21.885 5.502
PRVPR = 2.184*RL, Errorvar.= 4.177 , R² = 0.533
(0.127) (0.512) 17.258 8.164
RELEX = 2.640*RL, Errorvar.= 2.201 , R² = 0.760
(0.104) (0.403) 25.494 5.460
Error Covariance for PUBPR and INTEL = -1.468
(0.249) -5.885
Error Covariance for PUBPR and IDEOL = -1.545
(0.234) -6.593
Error Covariance for PRVPR and IDEOL = 2.806
(0.373) 7.520
Error Covariance for PRVPR and PUBPR = -1.360
(0.244) -5.571
Structural Equations SR = 0.425*RL, Errorvar.= 0.819 , R² = 0.181 (0.0577) (0.112) 7.367 7.299 SC = 0.298*RL, Errorvar.= 0.911 , R² = 0.0888 (0.0560) (0.0979) 5.318 9.308 LS = 2.224*SR + 2.172*SC + 0.723*RL, Errorvar.= 30.083, R² = 0.313 (0.416) (0.379) (0.420) (2.591) 5.346 5.728 1.722 11.612
HP = 2.755*SR + 2.047*SC + 0.201*LS + 0.957*RL, Errorvar.= 6.940 , R² = 0.786 (0.374) (0.299) (0.0462) (0.259) (1.096) 7.360 6.839 4.343 3.702 6.335 Reduced Form Equations SR = 0.425*RL, Errorvar.= 0.819, R² = 0.181 (0.0577) 7.367
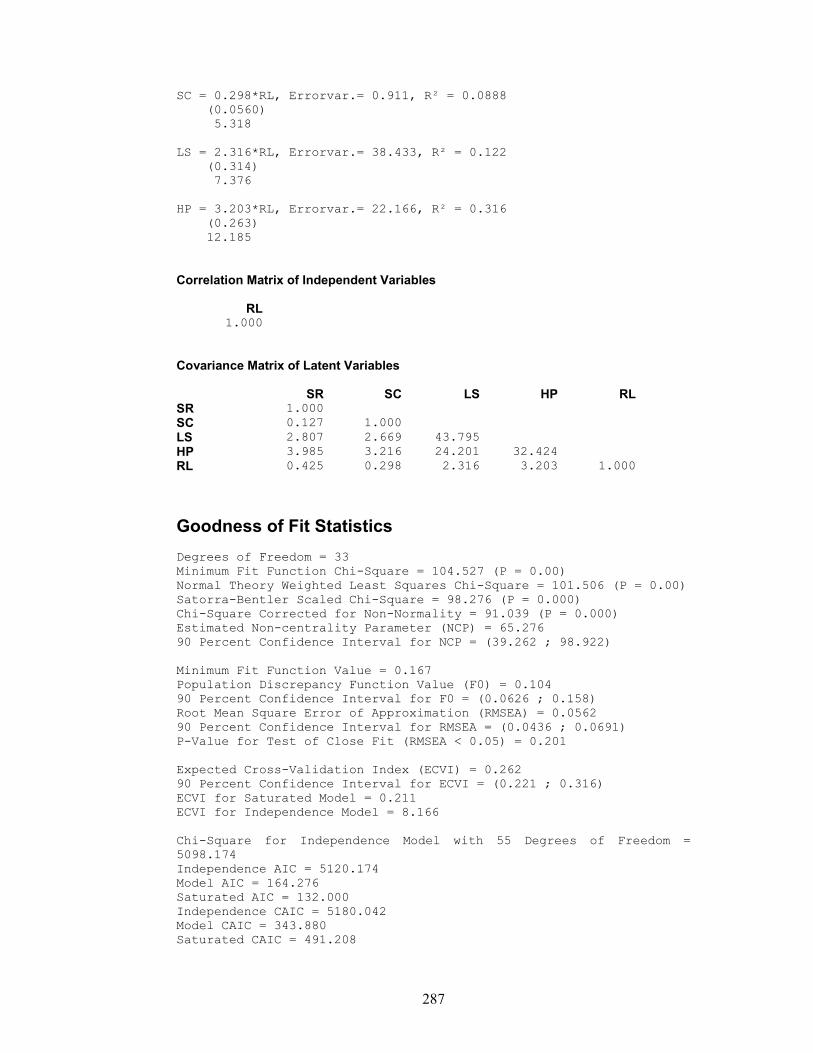
287
SC = 0.298*RL, Errorvar.= 0.911, R² = 0.0888 (0.0560) 5.318 LS = 2.316*RL, Errorvar.= 38.433, R² = 0.122 (0.314) 7.376 HP = 3.203*RL, Errorvar.= 22.166, R² = 0.316 (0.263) 12.185 Correlation Matrix of Independent Variables
RL 1.000
Covariance Matrix of Latent Variables
SR SC LS HP RL SR 1.000 SC 0.127 1.000 LS 2.807 2.669 43.795 HP 3.985 3.216 24.201 32.424 RL 0.425 0.298 2.316 3.203 1.000
Goodness of Fit Statistics Degrees of Freedom = 33 Minimum Fit Function Chi-Square = 104.527 (P = 0.00) Normal Theory Weighted Least Squares Chi-Square = 101.506 (P = 0.00) Satorra-Bentler Scaled Chi-Square = 98.276 (P = 0.000) Chi-Square Corrected for Non-Normality = 91.039 (P = 0.000) Estimated Non-centrality Parameter (NCP) = 65.276 90 Percent Confidence Interval for NCP = (39.262 ; 98.922) Minimum Fit Function Value = 0.167 Population Discrepancy Function Value (F0) = 0.104 90 Percent Confidence Interval for F0 = (0.0626 ; 0.158) Root Mean Square Error of Approximation (RMSEA) = 0.0562 90 Percent Confidence Interval for RMSEA = (0.0436 ; 0.0691) P-Value for Test of Close Fit (RMSEA < 0.05) = 0.201 Expected Cross-Validation Index (ECVI) = 0.262 90 Percent Confidence Interval for ECVI = (0.221 ; 0.316) ECVI for Saturated Model = 0.211 ECVI for Independence Model = 8.166 Chi-Square for Independence Model with 55 Degrees of Freedom = 5098.174 Independence AIC = 5120.174 Model AIC = 164.276 Saturated AIC = 132.000 Independence CAIC = 5180.042 Model CAIC = 343.880 Saturated CAIC = 491.208
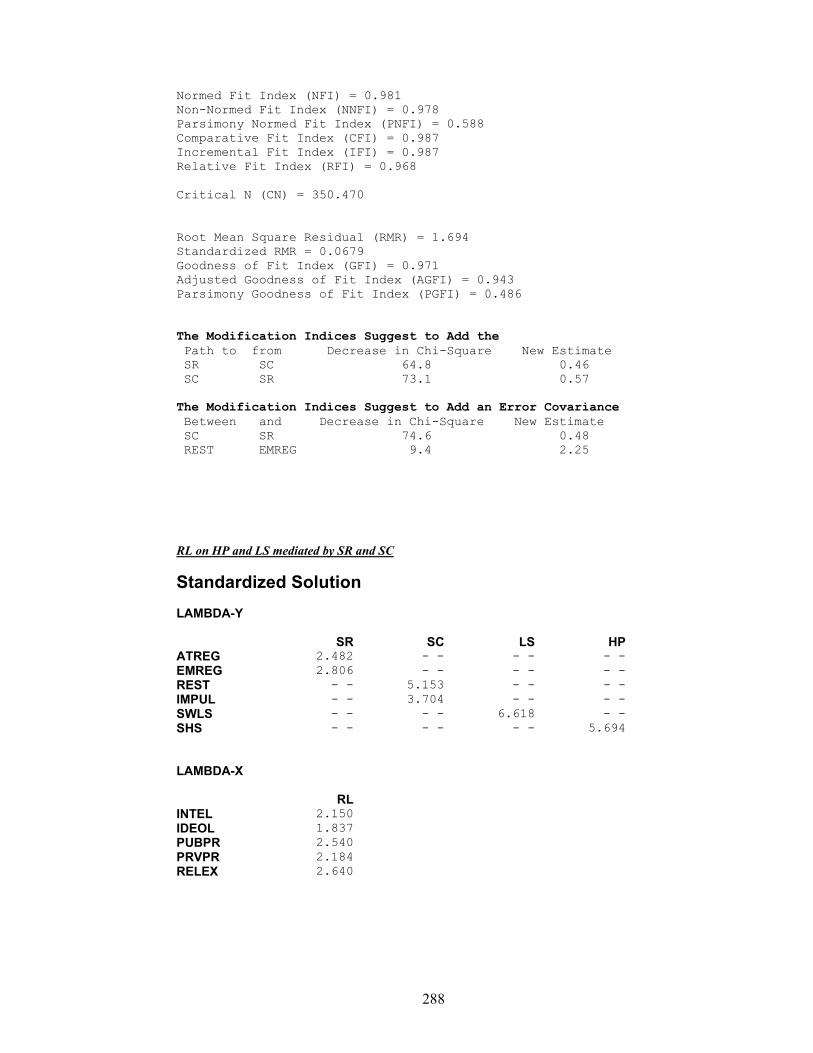
288
Normed Fit Index (NFI) = 0.981 Non-Normed Fit Index (NNFI) = 0.978 Parsimony Normed Fit Index (PNFI) = 0.588 Comparative Fit Index (CFI) = 0.987 Incremental Fit Index (IFI) = 0.987 Relative Fit Index (RFI) = 0.968 Critical N (CN) = 350.470 Root Mean Square Residual (RMR) = 1.694 Standardized RMR = 0.0679 Goodness of Fit Index (GFI) = 0.971 Adjusted Goodness of Fit Index (AGFI) = 0.943 Parsimony Goodness of Fit Index (PGFI) = 0.486 The Modification Indices Suggest to Add the Path to from Decrease in Chi-Square New Estimate SR SC 64.8 0.46 SC SR 73.1 0.57 The Modification Indices Suggest to Add an Error Covariance Between and Decrease in Chi-Square New Estimate SC SR 74.6 0.48 REST EMREG 9.4 2.25 RL on HP and LS mediated by SR and SC
Standardized Solution LAMBDA-Y
SR SC LS HP ATREG 2.482 - - - - - - EMREG 2.806 - - - - - - REST - - 5.153 - - - - IMPUL - - 3.704 - - - - SWLS - - - - 6.618 - - SHS - - - - - - 5.694 LAMBDA-X
RL INTEL 2.150 IDEOL 1.837 PUBPR 2.540 PRVPR 2.184 RELEX 2.640
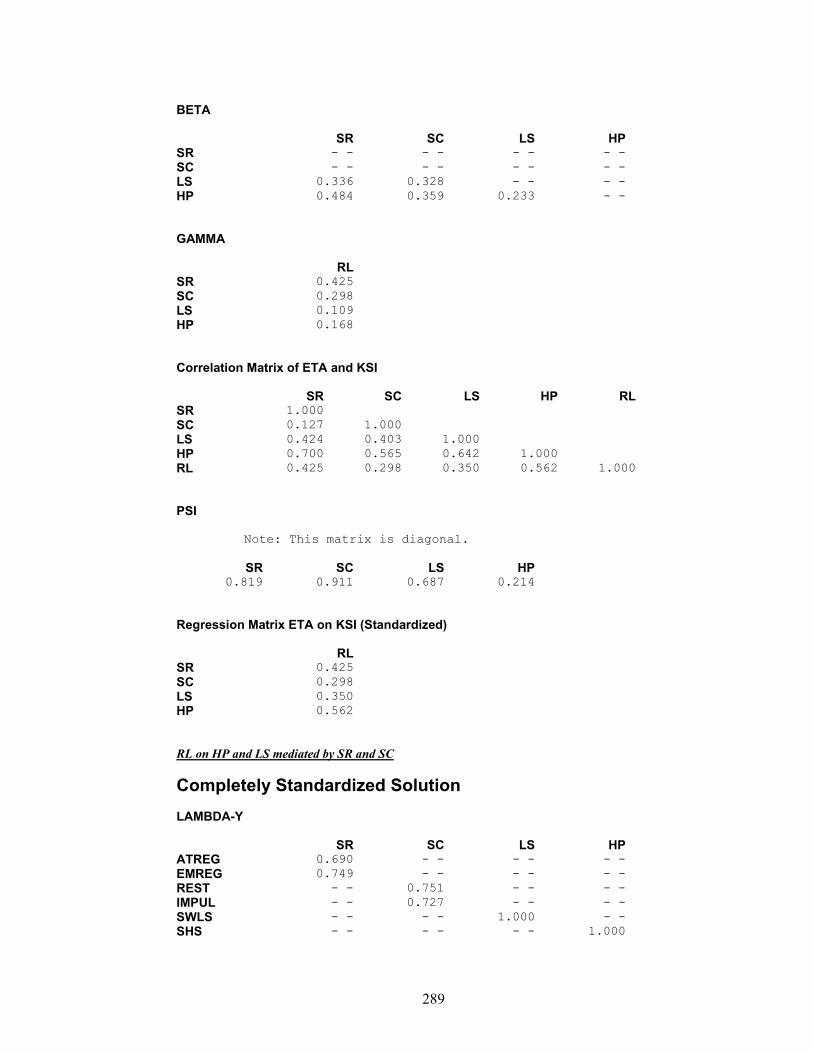
289
BETA
SR SC LS HP SR - - - - - - - - SC - - - - - - - - LS 0.336 0.328 - - - - HP 0.484 0.359 0.233 - - GAMMA
RL SR 0.425 SC 0.298 LS 0.109 HP 0.168 Correlation Matrix of ETA and KSI
SR SC LS HP RL SR 1.000 SC 0.127 1.000 LS 0.424 0.403 1.000 HP 0.700 0.565 0.642 1.000 RL 0.425 0.298 0.350 0.562 1.000 PSI Note: This matrix is diagonal.
SR SC LS HP 0.819 0.911 0.687 0.214
Regression Matrix ETA on KSI (Standardized)
RL SR 0.425 SC 0.298 LS 0.350 HP 0.562 RL on HP and LS mediated by SR and SC
Completely Standardized Solution LAMBDA-Y
SR SC LS HP ATREG 0.690 - - - - - - EMREG 0.749 - - - - - - REST - - 0.751 - - - - IMPUL - - 0.727 - - - - SWLS - - - - 1.000 - - SHS - - - - - - 1.000
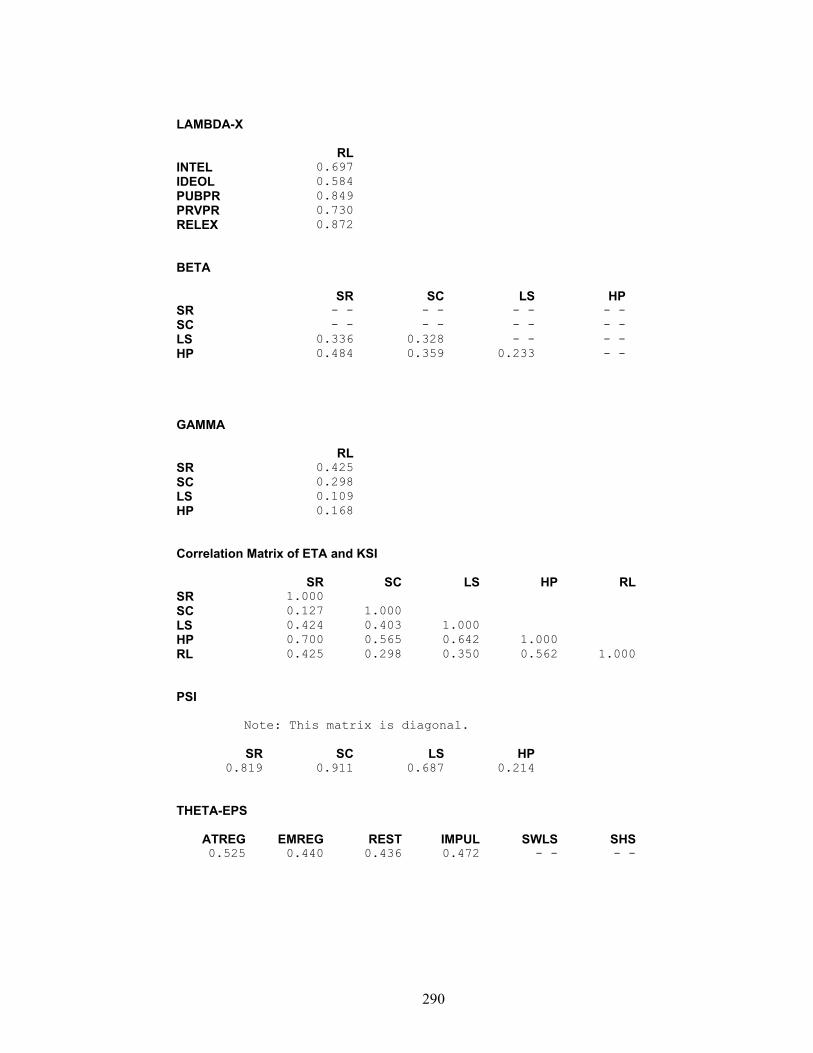
290
LAMBDA-X
RL INTEL 0.697 IDEOL 0.584 PUBPR 0.849 PRVPR 0.730 RELEX 0.872 BETA
SR SC LS HP SR - - - - - - - - SC - - - - - - - - LS 0.336 0.328 - - - - HP 0.484 0.359 0.233 - - GAMMA
RL SR 0.425 SC 0.298 LS 0.109 HP 0.168 Correlation Matrix of ETA and KSI
SR SC LS HP RL SR 1.000 SC 0.127 1.000 LS 0.424 0.403 1.000 HP 0.700 0.565 0.642 1.000 RL 0.425 0.298 0.350 0.562 1.000 PSI Note: This matrix is diagonal.
SR SC LS HP 0.819 0.911 0.687 0.214
THETA-EPS ATREG EMREG REST IMPUL SWLS SHS
0.525 0.440 0.436 0.472 - - - -
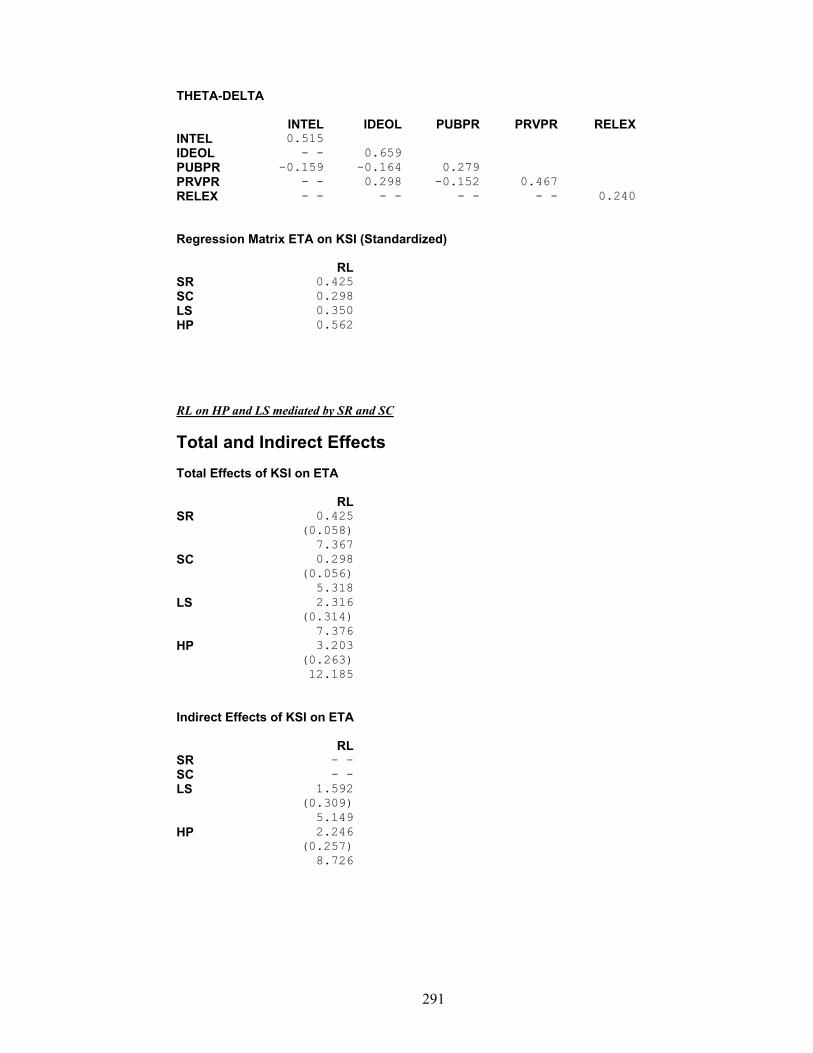
291
THETA-DELTA
INTEL IDEOL PUBPR PRVPR RELEX INTEL 0.515 IDEOL - - 0.659 PUBPR -0.159 -0.164 0.279 PRVPR - - 0.298 -0.152 0.467 RELEX - - - - - - - - 0.240 Regression Matrix ETA on KSI (Standardized)
RL SR 0.425 SC 0.298 LS 0.350 HP 0.562 RL on HP and LS mediated by SR and SC
Total and Indirect Effects Total Effects of KSI on ETA
RL SR 0.425 (0.058) 7.367 SC 0.298 (0.056) 5.318 LS 2.316 (0.314) 7.376 HP 3.203 (0.263) 12.185 Indirect Effects of KSI on ETA
RL SR - - SC - - LS 1.592 (0.309) 5.149 HP 2.246 (0.257) 8.726
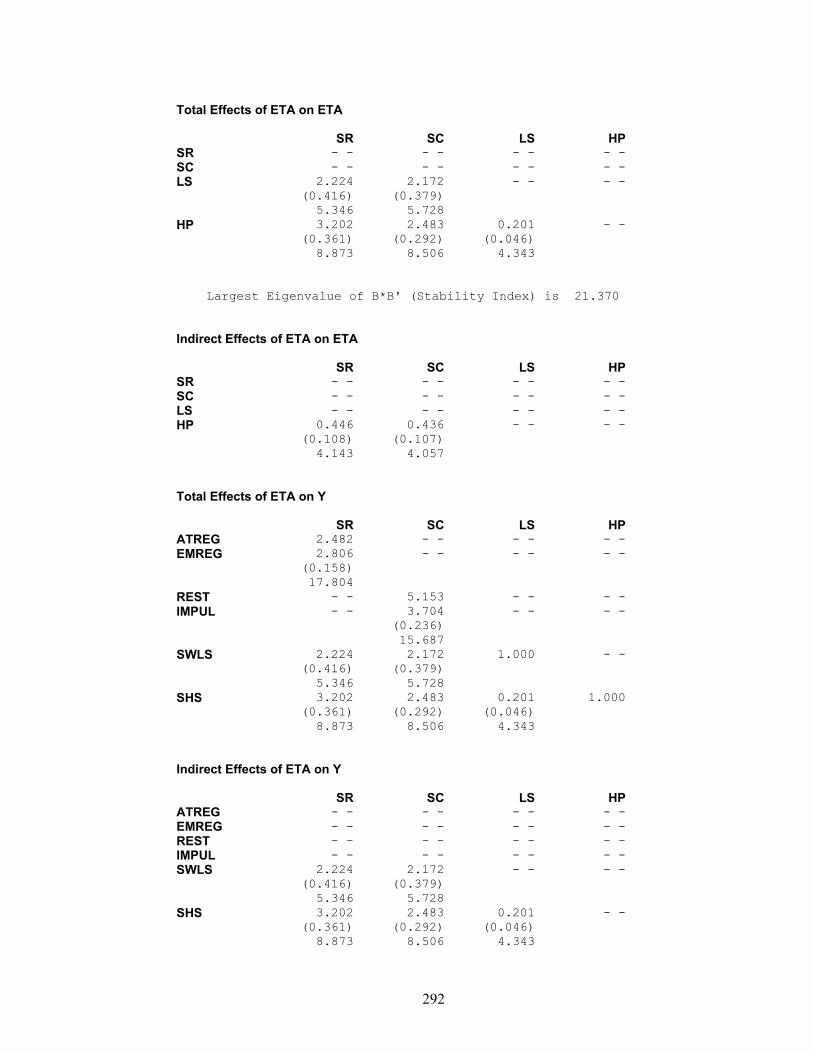
292
Total Effects of ETA on ETA
SR SC LS HP SR - - - - - - - - SC - - - - - - - - LS 2.224 2.172 - - - - (0.416) (0.379) 5.346 5.728 HP 3.202 2.483 0.201 - - (0.361) (0.292) (0.046) 8.873 8.506 4.343 Largest Eigenvalue of B*B' (Stability Index) is 21.370 Indirect Effects of ETA on ETA
SR SC LS HP SR - - - - - - - - SC - - - - - - - - LS - - - - - - - - HP 0.446 0.436 - - - - (0.108) (0.107) 4.143 4.057 Total Effects of ETA on Y
SR SC LS HP ATREG 2.482 - - - - - - EMREG 2.806 - - - - - - (0.158) 17.804 REST - - 5.153 - - - - IMPUL - - 3.704 - - - - (0.236) 15.687 SWLS 2.224 2.172 1.000 - - (0.416) (0.379) 5.346 5.728 SHS 3.202 2.483 0.201 1.000 (0.361) (0.292) (0.046) 8.873 8.506 4.343 Indirect Effects of ETA on Y
SR SC LS HP ATREG - - - - - - - - EMREG - - - - - - - - REST - - - - - - - - IMPUL - - - - - - - - SWLS 2.224 2.172 - - - - (0.416) (0.379) 5.346 5.728 SHS 3.202 2.483 0.201 - - (0.361) (0.292) (0.046) 8.873 8.506 4.343
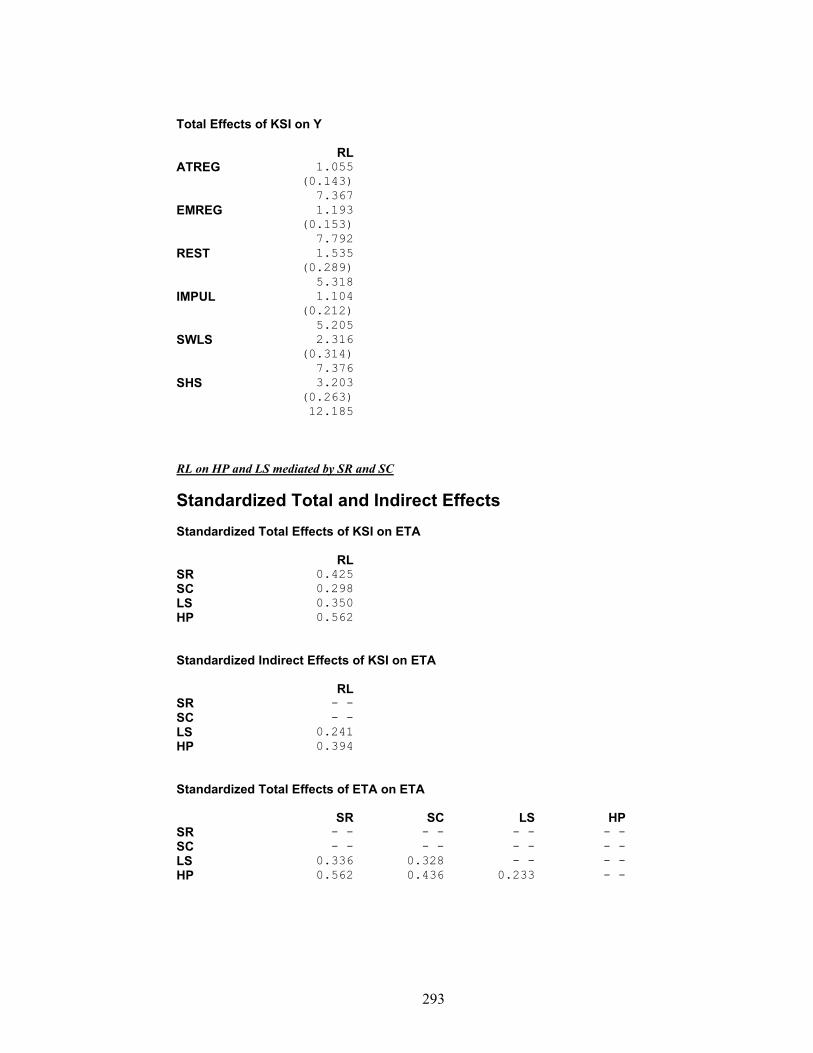
293
Total Effects of KSI on Y
RL ATREG 1.055 (0.143) 7.367 EMREG 1.193 (0.153) 7.792 REST 1.535 (0.289) 5.318 IMPUL 1.104 (0.212) 5.205 SWLS 2.316 (0.314) 7.376 SHS 3.203 (0.263) 12.185 RL on HP and LS mediated by SR and SC
Standardized Total and Indirect Effects Standardized Total Effects of KSI on ETA
RL SR 0.425 SC 0.298 LS 0.350 HP 0.562 Standardized Indirect Effects of KSI on ETA
RL SR - - SC - - LS 0.241 HP 0.394 Standardized Total Effects of ETA on ETA
SR SC LS HP SR - - - - - - - - SC - - - - - - - - LS 0.336 0.328 - - - - HP 0.562 0.436 0.233 - -
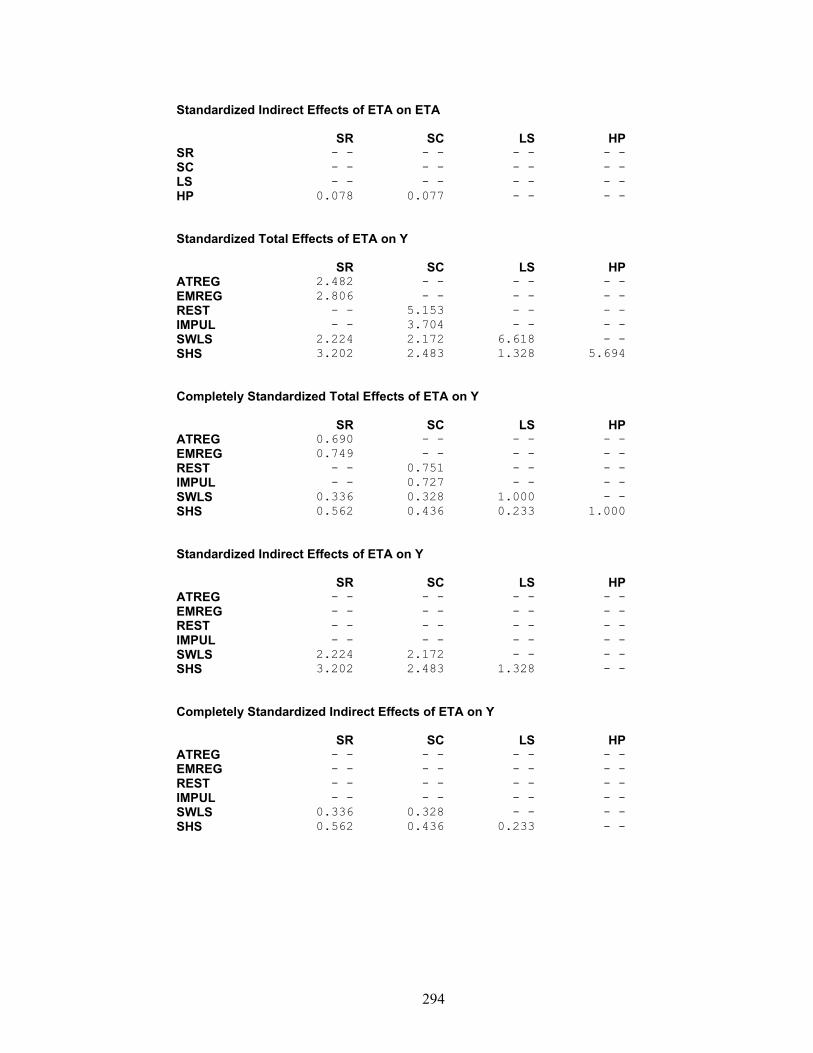
294
Standardized Indirect Effects of ETA on ETA
SR SC LS HP SR - - - - - - - - SC - - - - - - - - LS - - - - - - - - HP 0.078 0.077 - - - - Standardized Total Effects of ETA on Y
SR SC LS HP ATREG 2.482 - - - - - - EMREG 2.806 - - - - - - REST - - 5.153 - - - - IMPUL - - 3.704 - - - - SWLS 2.224 2.172 6.618 - - SHS 3.202 2.483 1.328 5.694 Completely Standardized Total Effects of ETA on Y
SR SC LS HP ATREG 0.690 - - - - - - EMREG 0.749 - - - - - - REST - - 0.751 - - - - IMPUL - - 0.727 - - - - SWLS 0.336 0.328 1.000 - - SHS 0.562 0.436 0.233 1.000 Standardized Indirect Effects of ETA on Y
SR SC LS HP ATREG - - - - - - - - EMREG - - - - - - - - REST - - - - - - - - IMPUL - - - - - - - - SWLS 2.224 2.172 - - - - SHS 3.202 2.483 1.328 - - Completely Standardized Indirect Effects of ETA on Y
SR SC LS HP ATREG - - - - - - - - EMREG - - - - - - - - REST - - - - - - - - IMPUL - - - - - - - - SWLS 0.336 0.328 - - - - SHS 0.562 0.436 0.233 - -
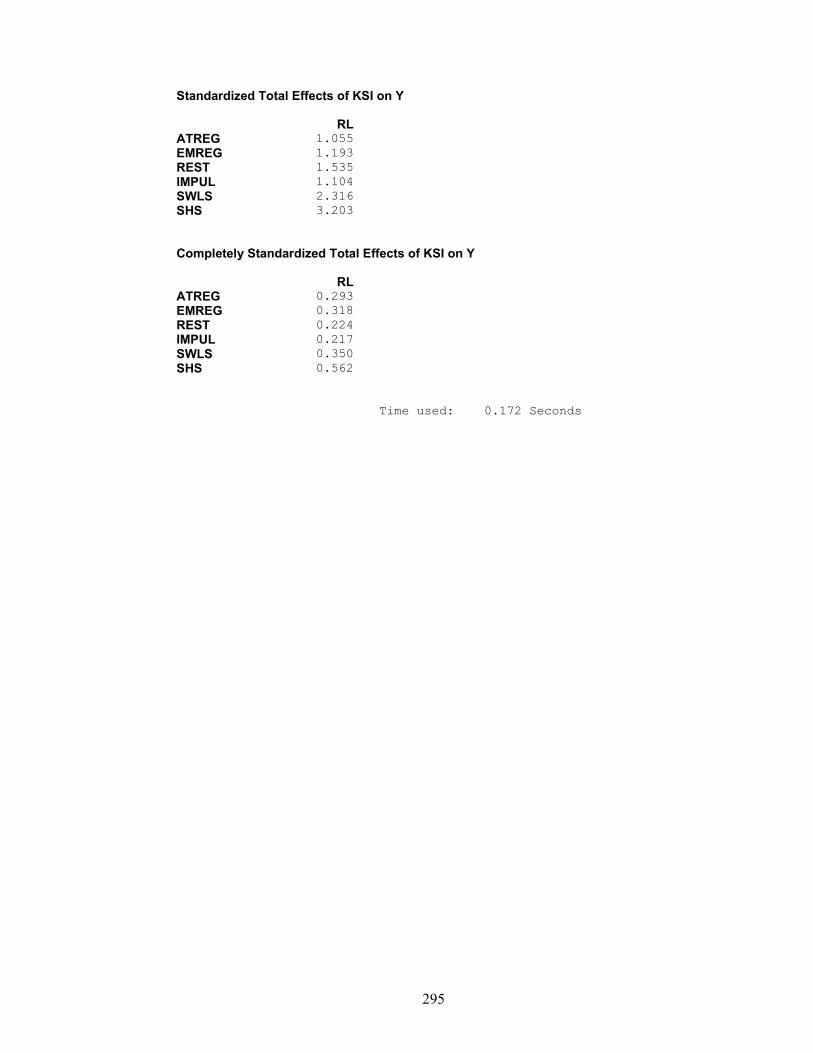
295
Standardized Total Effects of KSI on Y
RL ATREG 1.055 EMREG 1.193 REST 1.535 IMPUL 1.104 SWLS 2.316 SHS 3.203 Completely Standardized Total Effects of KSI on Y
RL ATREG 0.293 EMREG 0.318 REST 0.224 IMPUL 0.217 SWLS 0.350 SHS 0.562 Time used: 0.172 Seconds
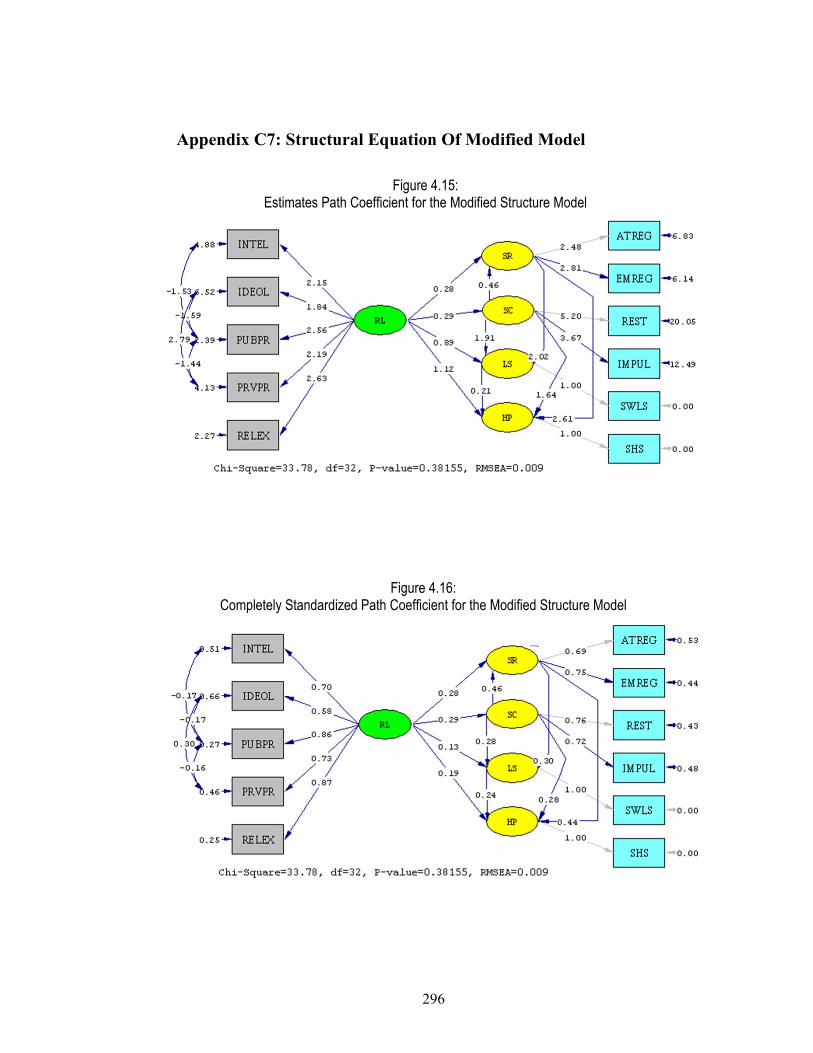
296
Appendix C7: Structural Equation Of Modified Model
Figure 4.15: Estimates Path Coefficient for the Modified Structure Model
Figure 4.16: Completely Standardized Path Coefficient for the Modified Structure Model
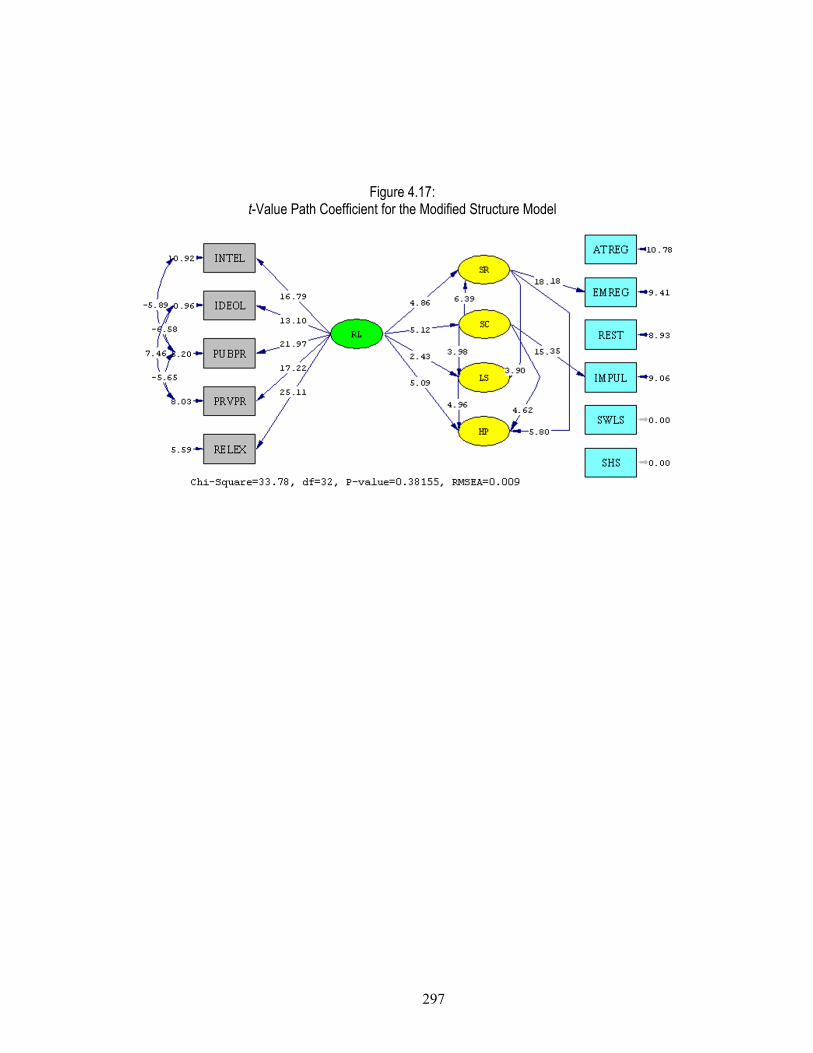
297
Figure 4.17: t-Value Path Coefficient for the Modified Structure Model

298
L I S R E L 8.80 BY Karl G. Jöreskog and Dag Sörbom This program is published exclusively by Scientific Software International, Inc. 7383 N. Lincoln Avenue, Suite 100 Lincolnwood, IL 60712, U.S.A. Phone: (800)247-6113, (847)675-0720, Fax: (847)675-2140 Copyright by Scientific Software International, Inc., 1981-2006 Use of this program is subject to the terms specified in the Universal Copyright Convention. Website: www.ssicentral.com The following lines were read from file D:\Ma Study\01 main study Raw score\FactorStructure modified.spl: Structural Equation Models Based on The Partial Aggregation Approach Raw Data from file 'D:Study1 main study Raw score.psf' Asymptotic Covariance Matrix From File FactorStructure.acm Latent Variables SR SC LS HP RL Relationships ATREG = SR EMREG = SR REST = SC IMPUL = SC SWLS = 1.000*LS SHS = 1.000*HP INTEL = RL IDEOL = RL PUBPR = RL PRVPR = RL RELEX = RL LS = SR LS = SC HP = SR HP = SC HP = LS SR = SC SR = RL SC = RL LS = RL HP = RL Set the Error Variance of SWLS to 0 Set the Error Variance of SHS to 0 Set the Error Covariance of PUBPR and INTEL correlate Set the Error Covariance of PUBPR and IDEOL correlate Set the Error Covariance of PRVPR and IDEOL correlate Set the Error Covariance of PRVPR and PUBPR correlate Path Diagram End of Problem Sample Size = 628
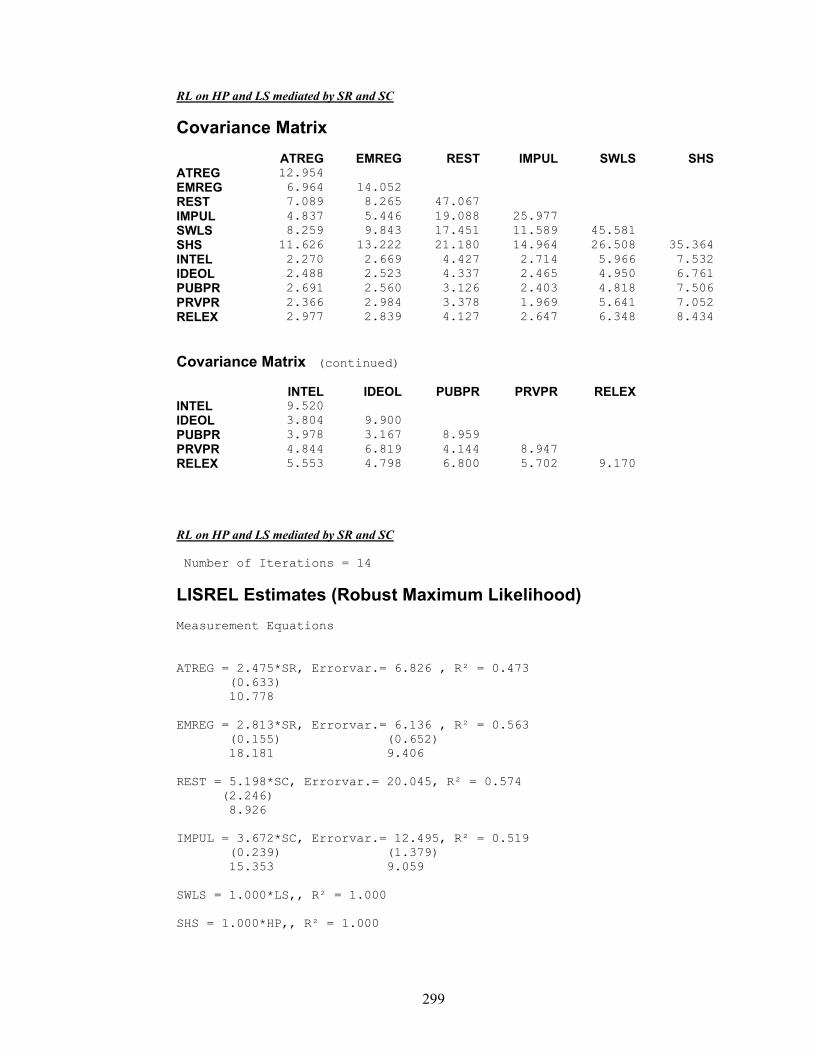
299
RL on HP and LS mediated by SR and SC
Covariance Matrix
ATREG EMREG REST IMPUL SWLS SHS ATREG 12.954 EMREG 6.964 14.052 REST 7.089 8.265 47.067 IMPUL 4.837 5.446 19.088 25.977 SWLS 8.259 9.843 17.451 11.589 45.581 SHS 11.626 13.222 21.180 14.964 26.508 35.364 INTEL 2.270 2.669 4.427 2.714 5.966 7.532 IDEOL 2.488 2.523 4.337 2.465 4.950 6.761 PUBPR 2.691 2.560 3.126 2.403 4.818 7.506 PRVPR 2.366 2.984 3.378 1.969 5.641 7.052 RELEX 2.977 2.839 4.127 2.647 6.348 8.434
Covariance Matrix (continued)
INTEL IDEOL PUBPR PRVPR RELEX INTEL 9.520 IDEOL 3.804 9.900 PUBPR 3.978 3.167 8.959 PRVPR 4.844 6.819 4.144 8.947 RELEX 5.553 4.798 6.800 5.702 9.170 RL on HP and LS mediated by SR and SC Number of Iterations = 14
LISREL Estimates (Robust Maximum Likelihood) Measurement Equations ATREG = 2.475*SR, Errorvar.= 6.826 , R² = 0.473
(0.633) 10.778
EMREG = 2.813*SR, Errorvar.= 6.136 , R² = 0.563
(0.155) (0.652) 18.181 9.406
REST = 5.198*SC, Errorvar.= 20.045, R² = 0.574
(2.246) 8.926
IMPUL = 3.672*SC, Errorvar.= 12.495, R² = 0.519
(0.239) (1.379) 15.353 9.059
SWLS = 1.000*LS,, R² = 1.000 SHS = 1.000*HP,, R² = 1.000
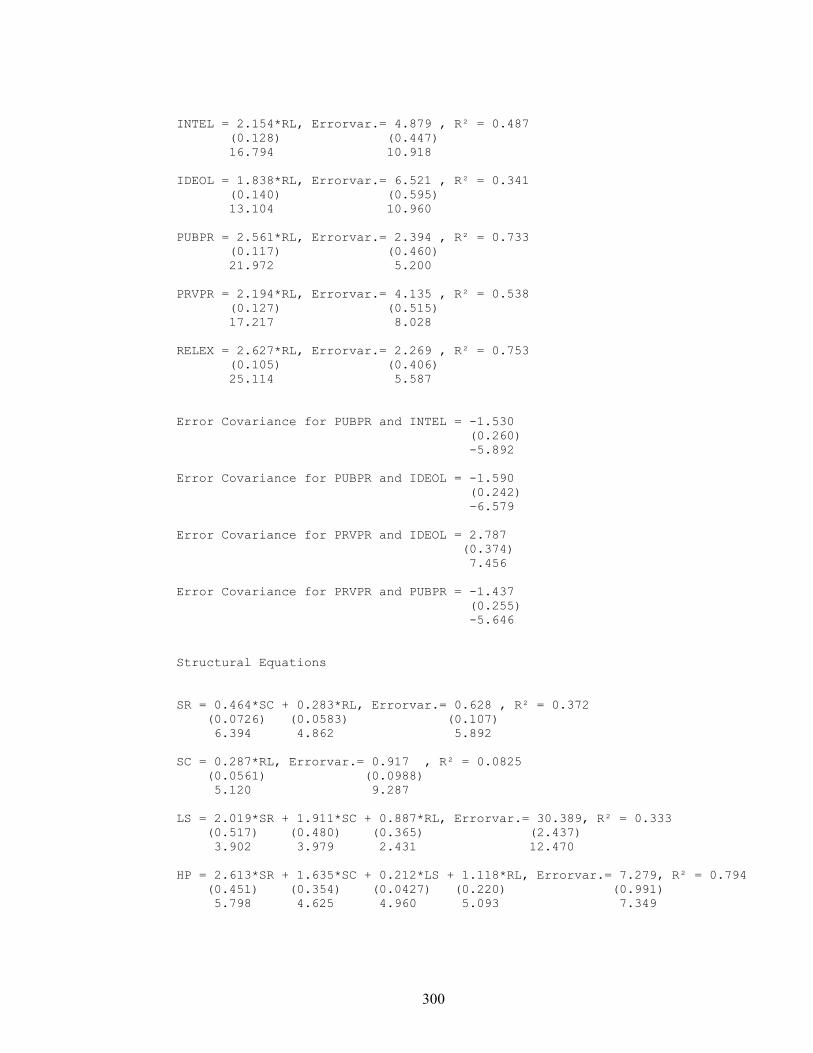
300
INTEL = 2.154*RL, Errorvar.= 4.879 , R² = 0.487
(0.128) (0.447) 16.794 10.918
IDEOL = 1.838*RL, Errorvar.= 6.521 , R² = 0.341
(0.140) (0.595) 13.104 10.960
PUBPR = 2.561*RL, Errorvar.= 2.394 , R² = 0.733
(0.117) (0.460) 21.972 5.200
PRVPR = 2.194*RL, Errorvar.= 4.135 , R² = 0.538
(0.127) (0.515) 17.217 8.028
RELEX = 2.627*RL, Errorvar.= 2.269 , R² = 0.753
(0.105) (0.406) 25.114 5.587
Error Covariance for PUBPR and INTEL = -1.530
(0.260) -5.892
Error Covariance for PUBPR and IDEOL = -1.590
(0.242) -6.579
Error Covariance for PRVPR and IDEOL = 2.787
(0.374) 7.456
Error Covariance for PRVPR and PUBPR = -1.437
(0.255) -5.646
Structural Equations SR = 0.464*SC + 0.283*RL, Errorvar.= 0.628 , R² = 0.372 (0.0726) (0.0583) (0.107) 6.394 4.862 5.892 SC = 0.287*RL, Errorvar.= 0.917 , R² = 0.0825 (0.0561) (0.0988) 5.120 9.287 LS = 2.019*SR + 1.911*SC + 0.887*RL, Errorvar.= 30.389, R² = 0.333 (0.517) (0.480) (0.365) (2.437) 3.902 3.979 2.431 12.470 HP = 2.613*SR + 1.635*SC + 0.212*LS + 1.118*RL, Errorvar.= 7.279, R² = 0.794 (0.451) (0.354) (0.0427) (0.220) (0.991) 5.798 4.625 4.960 5.093 7.349
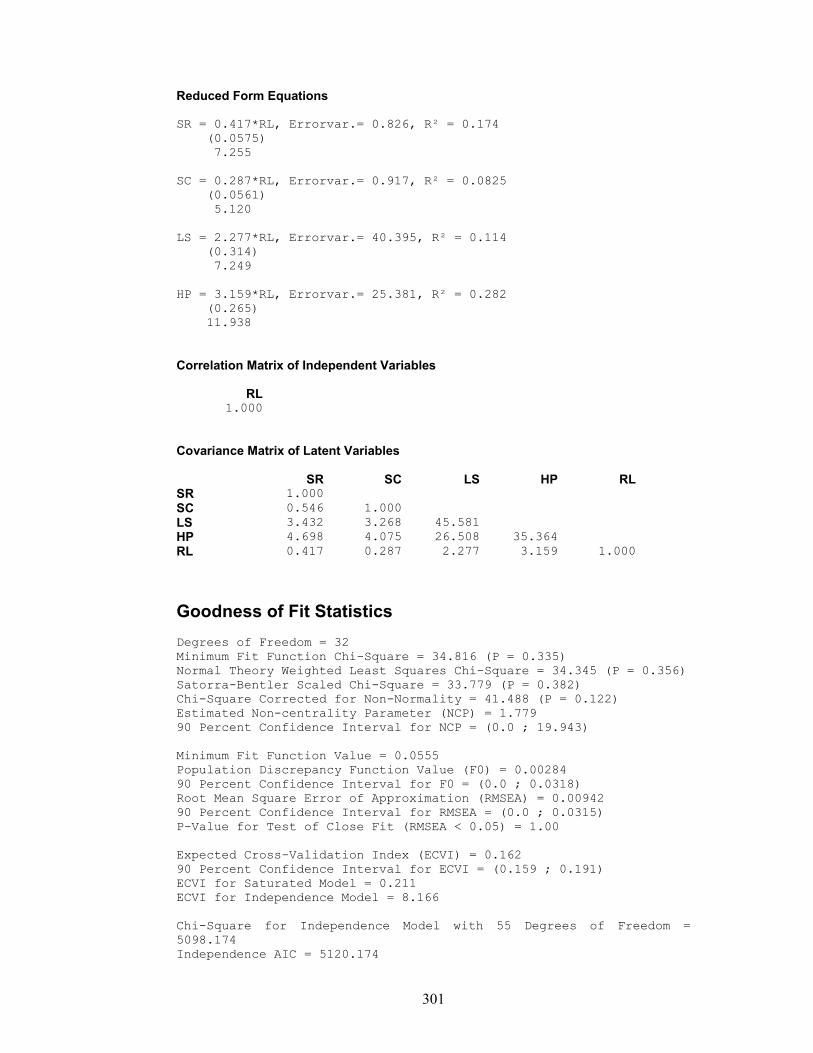
301
Reduced Form Equations SR = 0.417*RL, Errorvar.= 0.826, R² = 0.174 (0.0575) 7.255 SC = 0.287*RL, Errorvar.= 0.917, R² = 0.0825 (0.0561) 5.120 LS = 2.277*RL, Errorvar.= 40.395, R² = 0.114 (0.314) 7.249 HP = 3.159*RL, Errorvar.= 25.381, R² = 0.282 (0.265) 11.938 Correlation Matrix of Independent Variables
RL 1.000
Covariance Matrix of Latent Variables
SR SC LS HP RL SR 1.000 SC 0.546 1.000 LS 3.432 3.268 45.581 HP 4.698 4.075 26.508 35.364 RL 0.417 0.287 2.277 3.159 1.000
Goodness of Fit Statistics Degrees of Freedom = 32 Minimum Fit Function Chi-Square = 34.816 (P = 0.335) Normal Theory Weighted Least Squares Chi-Square = 34.345 (P = 0.356) Satorra-Bentler Scaled Chi-Square = 33.779 (P = 0.382) Chi-Square Corrected for Non-Normality = 41.488 (P = 0.122) Estimated Non-centrality Parameter (NCP) = 1.779 90 Percent Confidence Interval for NCP = (0.0 ; 19.943) Minimum Fit Function Value = 0.0555 Population Discrepancy Function Value (F0) = 0.00284 90 Percent Confidence Interval for F0 = (0.0 ; 0.0318) Root Mean Square Error of Approximation (RMSEA) = 0.00942 90 Percent Confidence Interval for RMSEA = (0.0 ; 0.0315) P-Value for Test of Close Fit (RMSEA < 0.05) = 1.00 Expected Cross-Validation Index (ECVI) = 0.162 90 Percent Confidence Interval for ECVI = (0.159 ; 0.191) ECVI for Saturated Model = 0.211 ECVI for Independence Model = 8.166 Chi-Square for Independence Model with 55 Degrees of Freedom = 5098.174 Independence AIC = 5120.174
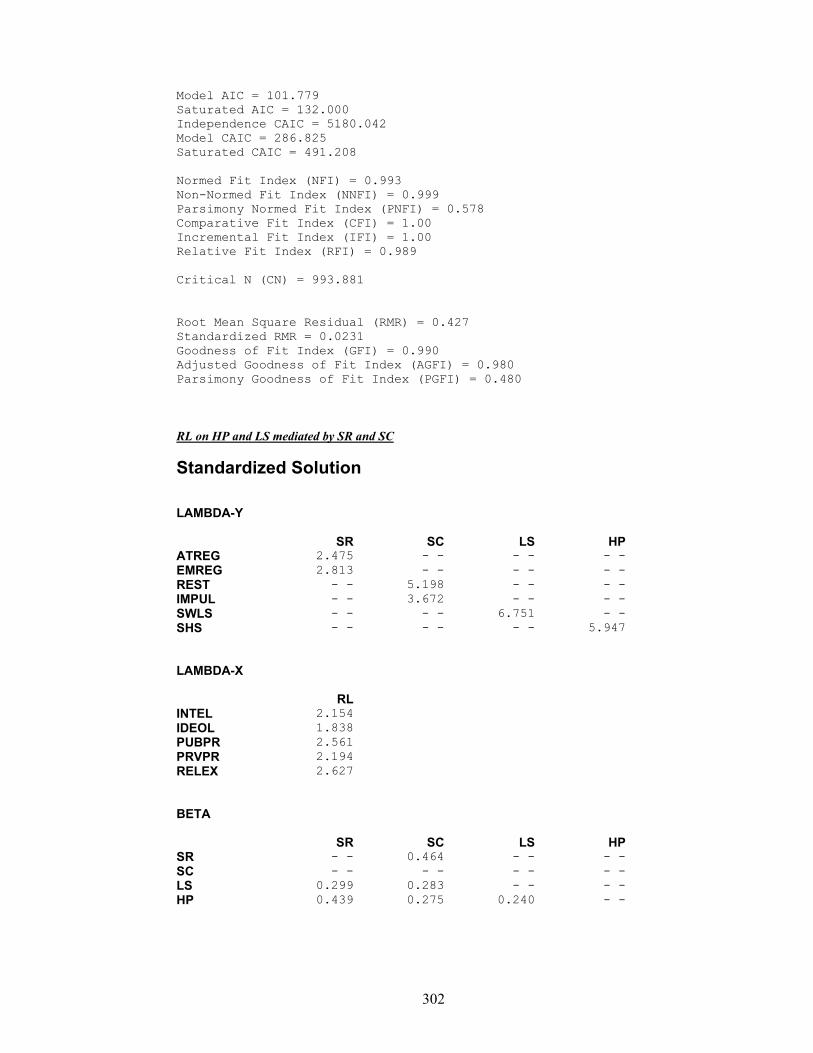
302
Model AIC = 101.779 Saturated AIC = 132.000 Independence CAIC = 5180.042 Model CAIC = 286.825 Saturated CAIC = 491.208 Normed Fit Index (NFI) = 0.993 Non-Normed Fit Index (NNFI) = 0.999 Parsimony Normed Fit Index (PNFI) = 0.578 Comparative Fit Index (CFI) = 1.00 Incremental Fit Index (IFI) = 1.00 Relative Fit Index (RFI) = 0.989 Critical N (CN) = 993.881 Root Mean Square Residual (RMR) = 0.427 Standardized RMR = 0.0231 Goodness of Fit Index (GFI) = 0.990 Adjusted Goodness of Fit Index (AGFI) = 0.980 Parsimony Goodness of Fit Index (PGFI) = 0.480 RL on HP and LS mediated by SR and SC
Standardized Solution LAMBDA-Y
SR SC LS HP ATREG 2.475 - - - - - - EMREG 2.813 - - - - - - REST - - 5.198 - - - - IMPUL - - 3.672 - - - - SWLS - - - - 6.751 - - SHS - - - - - - 5.947 LAMBDA-X
RL INTEL 2.154 IDEOL 1.838 PUBPR 2.561 PRVPR 2.194 RELEX 2.627 BETA
SR SC LS HP SR - - 0.464 - - - - SC - - - - - - - - LS 0.299 0.283 - - - - HP 0.439 0.275 0.240 - -
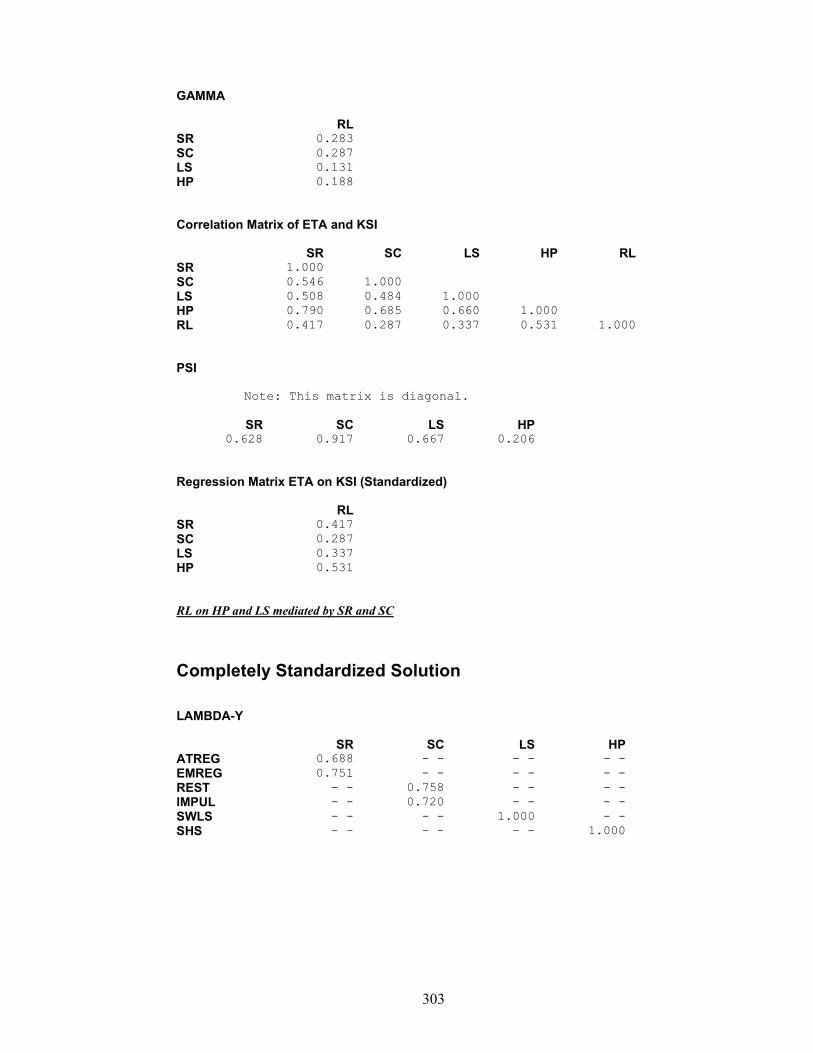
303
GAMMA
RL SR 0.283 SC 0.287 LS 0.131 HP 0.188 Correlation Matrix of ETA and KSI
SR SC LS HP RL SR 1.000 SC 0.546 1.000 LS 0.508 0.484 1.000 HP 0.790 0.685 0.660 1.000 RL 0.417 0.287 0.337 0.531 1.000 PSI Note: This matrix is diagonal.
SR SC LS HP 0.628 0.917 0.667 0.206
Regression Matrix ETA on KSI (Standardized)
RL SR 0.417 SC 0.287 LS 0.337 HP 0.531 RL on HP and LS mediated by SR and SC
Completely Standardized Solution LAMBDA-Y
SR SC LS HP ATREG 0.688 - - - - - - EMREG 0.751 - - - - - - REST - - 0.758 - - - - IMPUL - - 0.720 - - - - SWLS - - - - 1.000 - - SHS - - - - - - 1.000
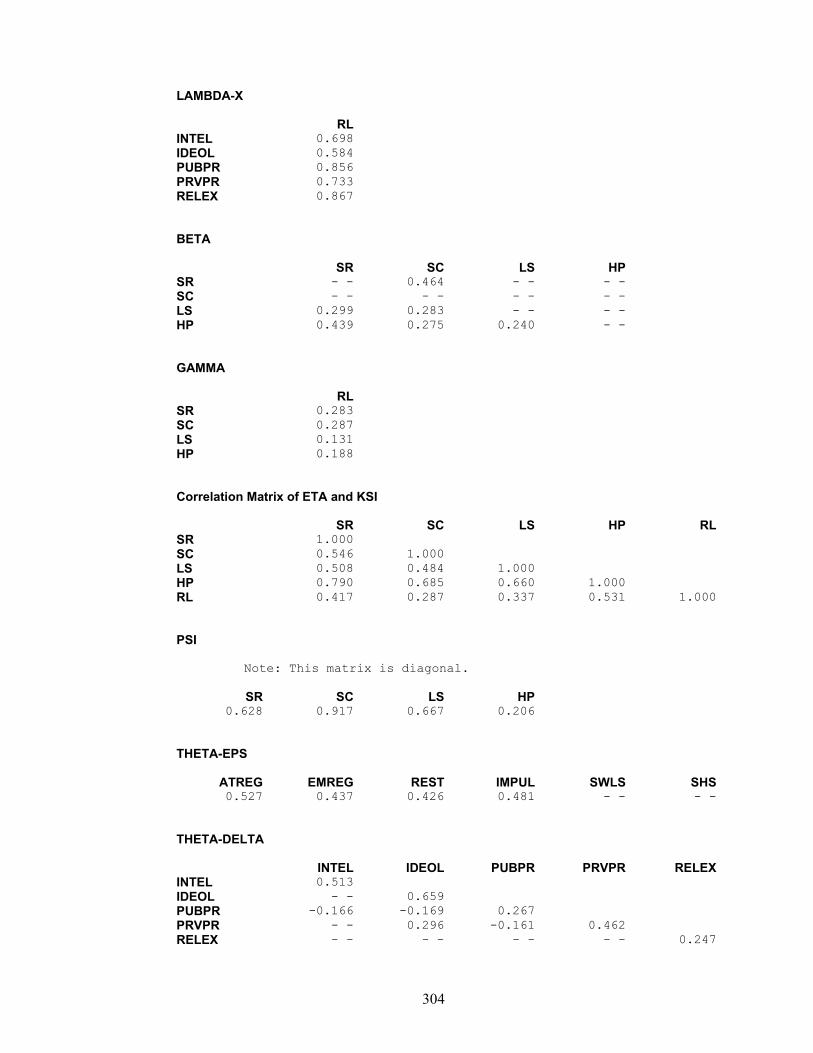
304
LAMBDA-X
RL INTEL 0.698 IDEOL 0.584 PUBPR 0.856 PRVPR 0.733 RELEX 0.867 BETA
SR SC LS HP SR - - 0.464 - - - - SC - - - - - - - - LS 0.299 0.283 - - - - HP 0.439 0.275 0.240 - - GAMMA
RL SR 0.283 SC 0.287 LS 0.131 HP 0.188 Correlation Matrix of ETA and KSI
SR SC LS HP RL SR 1.000 SC 0.546 1.000 LS 0.508 0.484 1.000 HP 0.790 0.685 0.660 1.000 RL 0.417 0.287 0.337 0.531 1.000 PSI Note: This matrix is diagonal.
SR SC LS HP 0.628 0.917 0.667 0.206
THETA-EPS
ATREG EMREG REST IMPUL SWLS SHS 0.527 0.437 0.426 0.481 - - - -
THETA-DELTA
INTEL IDEOL PUBPR PRVPR RELEX INTEL 0.513 IDEOL - - 0.659 PUBPR -0.166 -0.169 0.267 PRVPR - - 0.296 -0.161 0.462 RELEX - - - - - - - - 0.247
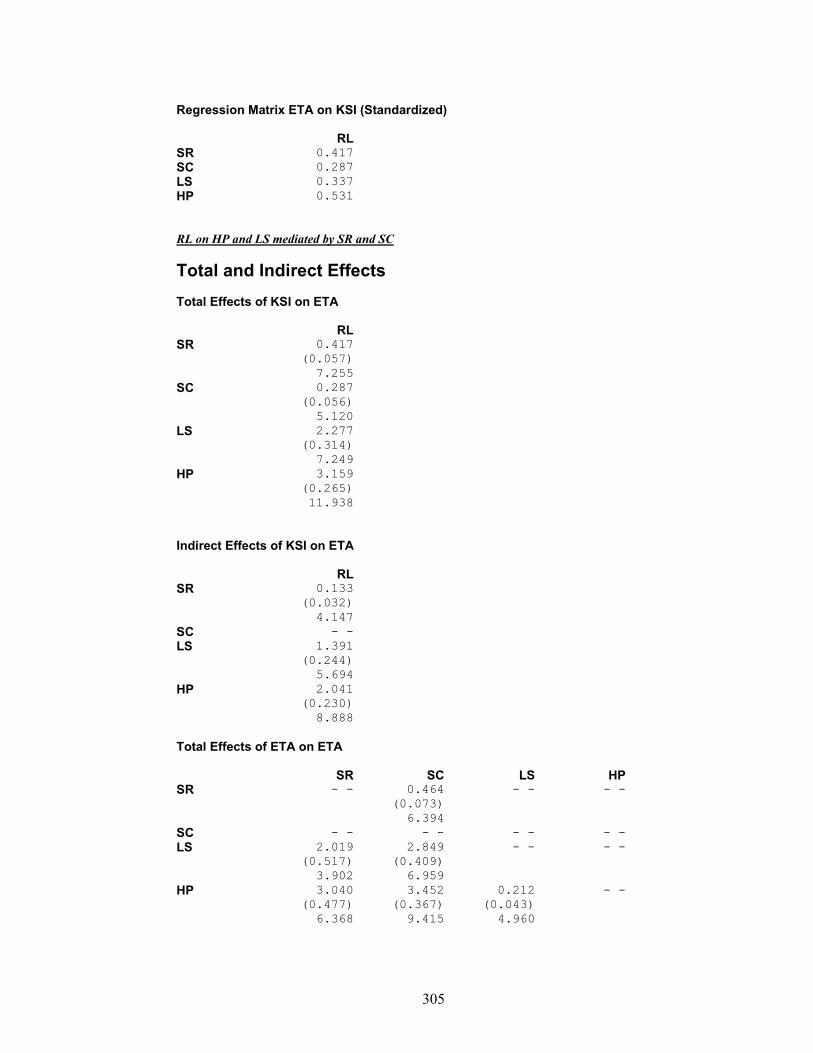
305
Regression Matrix ETA on KSI (Standardized)
RL SR 0.417 SC 0.287 LS 0.337 HP 0.531 RL on HP and LS mediated by SR and SC
Total and Indirect Effects Total Effects of KSI on ETA
RL SR 0.417 (0.057) 7.255 SC 0.287 (0.056) 5.120 LS 2.277 (0.314) 7.249 HP 3.159 (0.265) 11.938 Indirect Effects of KSI on ETA
RL SR 0.133 (0.032) 4.147 SC - - LS 1.391 (0.244) 5.694 HP 2.041 (0.230) 8.888 Total Effects of ETA on ETA
SR SC LS HP SR - - 0.464 - - - - (0.073) 6.394 SC - - - - - - - - LS 2.019 2.849 - - - - (0.517) (0.409) 3.902 6.959 HP 3.040 3.452 0.212 - - (0.477) (0.367) (0.043) 6.368 9.415 4.960
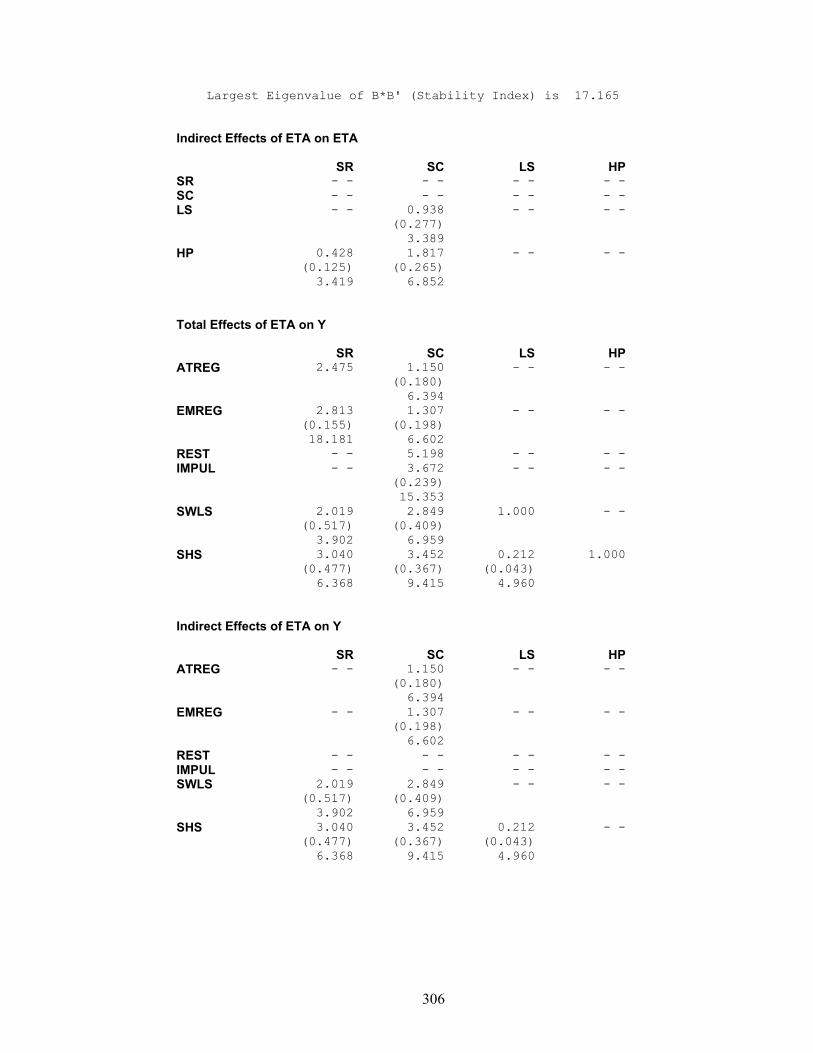
306
Largest Eigenvalue of B*B' (Stability Index) is 17.165 Indirect Effects of ETA on ETA
SR SC LS HP SR - - - - - - - - SC - - - - - - - - LS - - 0.938 - - - - (0.277) 3.389 HP 0.428 1.817 - - - - (0.125) (0.265) 3.419 6.852 Total Effects of ETA on Y
SR SC LS HP ATREG 2.475 1.150 - - - - (0.180) 6.394 EMREG 2.813 1.307 - - - - (0.155) (0.198) 18.181 6.602 REST - - 5.198 - - - - IMPUL - - 3.672 - - - - (0.239) 15.353 SWLS 2.019 2.849 1.000 - - (0.517) (0.409) 3.902 6.959 SHS 3.040 3.452 0.212 1.000 (0.477) (0.367) (0.043) 6.368 9.415 4.960 Indirect Effects of ETA on Y
SR SC LS HP ATREG - - 1.150 - - - - (0.180) 6.394 EMREG - - 1.307 - - - - (0.198) 6.602 REST - - - - - - - - IMPUL - - - - - - - - SWLS 2.019 2.849 - - - - (0.517) (0.409) 3.902 6.959 SHS 3.040 3.452 0.212 - - (0.477) (0.367) (0.043) 6.368 9.415 4.960
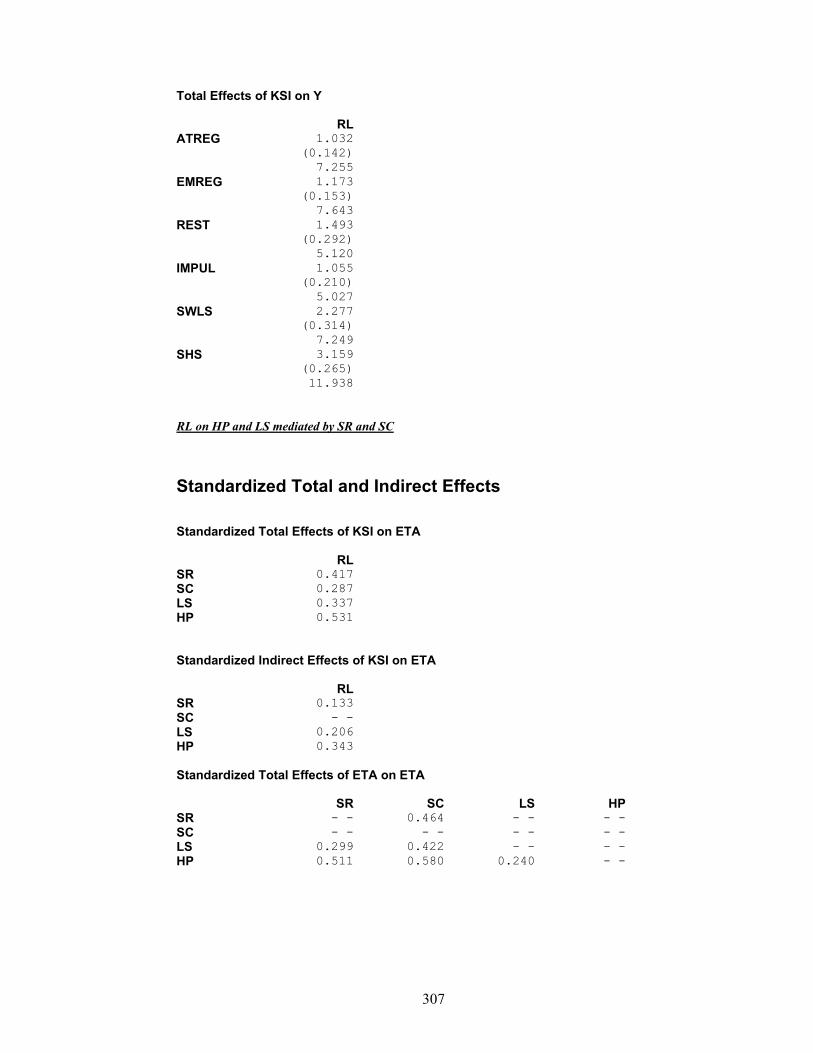
307
Total Effects of KSI on Y
RL ATREG 1.032 (0.142) 7.255 EMREG 1.173 (0.153) 7.643 REST 1.493 (0.292) 5.120 IMPUL 1.055 (0.210) 5.027 SWLS 2.277 (0.314) 7.249 SHS 3.159 (0.265) 11.938 RL on HP and LS mediated by SR and SC
Standardized Total and Indirect Effects Standardized Total Effects of KSI on ETA
RL SR 0.417 SC 0.287 LS 0.337 HP 0.531 Standardized Indirect Effects of KSI on ETA
RL SR 0.133 SC - - LS 0.206 HP 0.343 Standardized Total Effects of ETA on ETA
SR SC LS HP SR - - 0.464 - - - - SC - - - - - - - - LS 0.299 0.422 - - - - HP 0.511 0.580 0.240 - -
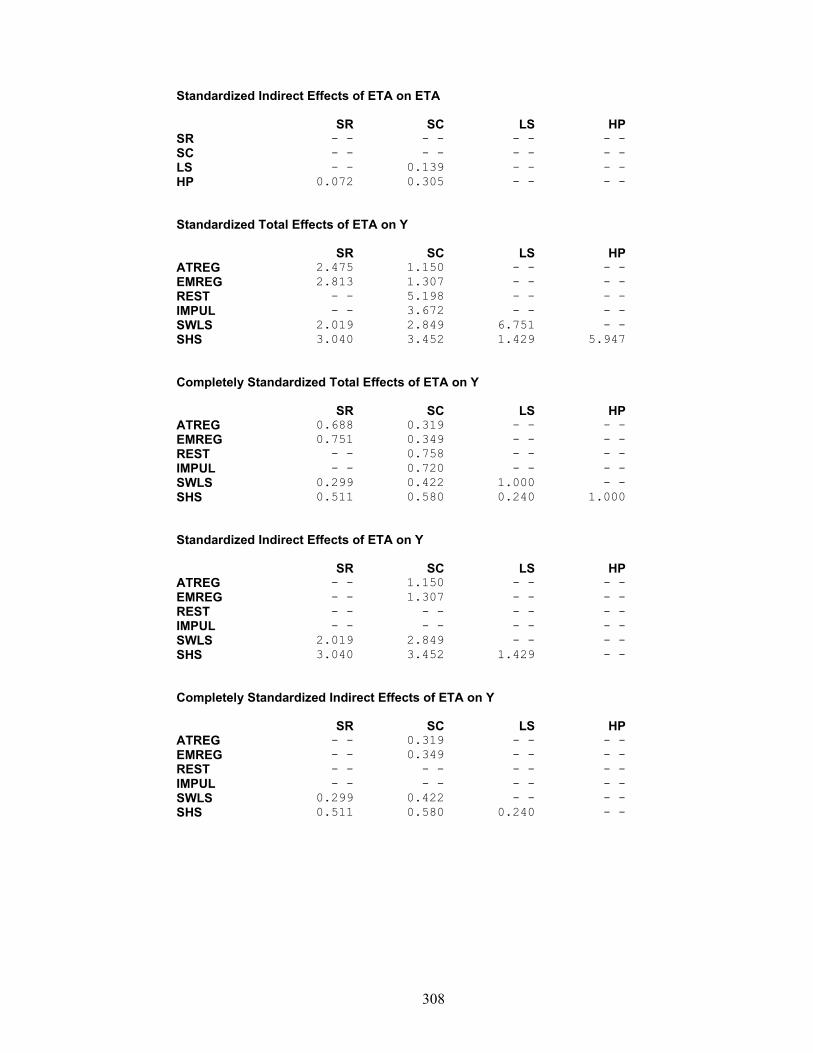
308
Standardized Indirect Effects of ETA on ETA
SR SC LS HP SR - - - - - - - - SC - - - - - - - - LS - - 0.139 - - - - HP 0.072 0.305 - - - - Standardized Total Effects of ETA on Y
SR SC LS HP ATREG 2.475 1.150 - - - - EMREG 2.813 1.307 - - - - REST - - 5.198 - - - - IMPUL - - 3.672 - - - - SWLS 2.019 2.849 6.751 - - SHS 3.040 3.452 1.429 5.947 Completely Standardized Total Effects of ETA on Y
SR SC LS HP ATREG 0.688 0.319 - - - - EMREG 0.751 0.349 - - - - REST - - 0.758 - - - - IMPUL - - 0.720 - - - - SWLS 0.299 0.422 1.000 - - SHS 0.511 0.580 0.240 1.000 Standardized Indirect Effects of ETA on Y
SR SC LS HP ATREG - - 1.150 - - - - EMREG - - 1.307 - - - - REST - - - - - - - - IMPUL - - - - - - - - SWLS 2.019 2.849 - - - - SHS 3.040 3.452 1.429 - - Completely Standardized Indirect Effects of ETA on Y
SR SC LS HP ATREG - - 0.319 - - - - EMREG - - 0.349 - - - - REST - - - - - - - - IMPUL - - - - - - - - SWLS 0.299 0.422 - - - - SHS 0.511 0.580 0.240 - -

309
Standardized Total Effects of KSI on Y
RL ATREG 1.032 EMREG 1.173 REST 1.493 IMPUL 1.055 SWLS 2.277 SHS 3.159 Completely Standardized Total Effects of KSI on Y
RL ATREG 0.287 EMREG 0.313 REST 0.218 IMPUL 0.207 SWLS 0.337 SHS 0.531 Time used: 0.156 Seconds


![A quantitative study investigating the relationship of ...1].pdf · A quantitative study investigating the relationship of intrinsic religiosity with meaning in life, stress, anxiety](https://img.pdfslide.net/doc/110x75/5f0731817e708231d41bc565/a-quantitative-study-investigating-the-relationship-of-1pdf-a-quantitative.jpg)