Embed Size (px)
Citation preview
Researchjournali’s Journal of Ecology
Vol. 4 | No. 1 February | 2017 1
www.researchjournali.com
Joash Nyakora Oruta
Lake Victoria South Catchment Area, Water Resources
Management Authority, Kisumu, Kenya
Boniface O. Oindo
School of Environment and Earth Sciences, Maseno
University, Kisumu, Kenya
Esna K. Bosire
School of Environment and Earth Sciences, Maseno
University, Kisumu, Kenya
Relationship Between
Riparian Vegetation
Cover And
Macroinvertebrate
Assemblages In
Kuywa River, Kenya
Researchjournali’s Journal of Ecology
Vol. 4 | No. 1 February | 2017 2
www.researchjournali.com
ABSTRACT
The Kuywa River watershed has undergone riparian vegetation planting since 2006 in order to improve the
river health. The planted riparian buffer zone vegetation was to improve channel stability, promote biodiversity,
and improve water quality. Studies undertaken elsewhere have investigated how environmental factors affect
ecosystem processes and functionalities but fail to show how water quality indicators influence the structure of
the benthic macroinvertebrates. However, this study investigated the relationship between water quality
indicators and benthic macroinvertebrate assemblages in the Kuywa River. Nine sites were assessed of different
riparian vegetation cover and benthic macroinvertebrates were collected. Spatial characteristics were obtained
by averaging four rounds of field sampling. Descriptive statistics employed included Richness Index (S),
Abundance Index (N), Margalef Richness (d), Shannon Index (H), Simpson diversity (λ) and Pielou. Bray-
Curtis similarity measure and Multi-dimensional Scaling (MDS) were applied. To test the hypothesis, whether
variations between the sites are significant, ANOSIM analysis was applied. Further, the effect of planted
riparian zone vegetation was tested by the percentage of EPT. The study classified the study sites into
'Excellent', 'Good', and 'Poor'. Three genus were found to be positively correlated (p<0.01) with canopy cover
and two negatively correlated. On the site richness, KG, K1 and T2 were found to have the highest family
richness (15, 14, 14 respectfully) and A (8) the least. Our study found a significant difference between sites in
terms of macroinvertebrate assemblages (R=0.94, p<0.01). For the sensitive species, K2, T2 and KM (14, 13,
11, respectfully) had the highest richness in terms of species, families and abundance. Site A had the lowest
intolerant species (8). ANOSIM hypothesis testing indicated variations between sites were statistically different
(R=0.94, p<0.1). SIMPROF test indicated that the MDS clusters generated for the nine sites were statistically
significant (Pi=3.215, p=0.001). Our study concluded that the loss of large woody debris provided by riparian
vegetation reduces substrate for feeding, attachment, and cover; causes loss of sediment and organic material
storage; reduces energy dissipation; alters flow hydraulics and therefore distribution of habitats; reduces bank
stability and community function. The land use above the site has a considerable influence on the river health.
For management and restoration actions to be effective, we must diagnose cause as well as assess harm, which
requires an improved understanding of the mechanisms through which land use impacts stream ecosystems.
This knowledge is important to the community and water resource managers as it will yield information on
effect of planted riparian zone vegetation on protecting the river health which may lead to the replication of the
same project in other watersheds.
Keyword: Benthic Macroinvertebrates, Riparian Vegetation Cover, River Health, Kuywa River
I. INTRODUCTION
The ecological health of rivers and streams is a fundamental and increasingly important water management
issue in both developed and developing world (Bunn, Davies, & Mosisch, 1999; Masese et al., 2013; Wantzen,
Researchjournali’s Journal of Ecology
Vol. 4 | No. 1 February | 2017 3
www.researchjournali.com
Ramirez, & Winemimller, 2006). The health of a river in ecological perspective is considered by looking at its
sustainability, resilience to stress and ecological integrity (Naiman & Decamp, 1997). The ecological integrity
in this case may refer to the capacity to support and maintain a balanced, integrated, adaptive biologic system
having the full range of elements and processes expected in the natural habitat of a region (Naiman & Decamp,
1997 ). With this understanding, programs such as AusRivAS, which measure river health by making
comparison with a nearby natural reference site (Smith et al., 1999) has been established. Moreso in South
Africa, SAAS programme classify health of rivers using the composition of macroinvertebrates (Masese et al.,
2014). The aim of these programes is to establish rivers which mimic the characteristics of a pristine conditions
with all processes and benthic macroinvertebrates assemblages being at optimum.
Prior to the 1990s, river health assessment mainly relied on water quality measures; however, in more recent
times, assessment programs have focused on the direct measurement of characteristics of the biota (mainly
benthic macroinvertebrates, algae, vegetation, and fish) or ecosystem processes ,(e.g.,(Angradi et al., 2011;
Bunn et al., 2010; Metcalfe-Smith, 1996). A holistic approach to assessing the health of a river system is to
apply multimetric methods which combine indicators that represent the biological, chemical, and physical
aspects of ecosystems (e.g., (Bunn et al., 2010; Davies, Harris, Hillman, & Walker, 2010; Ladson & White,
1999; Zhao, Yang, & Yao, 2005). Nevertheless, the riparian vegetation provides both physical and biological
aspects to determine river health. The physical aspects may include regulation of temperature through its
canopy, while biological aspects may include instream primary production.
More especially in small streams, the riparian provide instream primary production through light interception
and provides allochthonous organic matter used as food and habitat by aquatic consumers (Monoury, Gilbert,
& Lecerf, 2014). Vegetation cover also affects the exposure of the river to other disturbances such as cattle
grazing. Sabo et al. (2005) established that changes in riparian forest age, canopy structure and plant
communities may modify the composition of stream communities and functional roles played at community
levels.
Riparian zone vegetation normally comprises diverse, dynamic and complex systems, such that the ecosystem
functioning depends on the composition and characteristics of flora (Kim, Yeom, & An, 2014; Masese et al.,
2013; Sheldon & Fellows, 2010). Among other functions of riparian zone vegetation are; provision of critical
habitat and corridors for terrestrial wildlife (Naiman & Decamps, 1997), provision of habitat for aquatic
organisms, ensures protection of surface water quality and quantity (Growns, Rourke, & Gilligan, 2013), and
the control of the temperature of streams through canopy shades (Zhao, Mu, Tian, Jiao, & Wang, 2013).
Furthermore, it prevents bank erosion by stabilizing bank soils through roots (Naiman & Decamps, 1997;
Nyakora & Ngaira, 2014). This complexity sustain both simple and complex food-web in the rivers.
Researchjournali’s Journal of Ecology
Vol. 4 | No. 1 February | 2017 4
www.researchjournali.com
Other functionalities of riparian vegetation that affect the health of a river include the provision of organic
inputs, such as woody debris and leaf litter, to the stream ecosystem (Newham, Fellows, & Sheldon, 2011). The
woody debris creates a habitat and provides nutrients to stream organisms, dissipates energy and traps moving
materials (Naiman & Decamps, 1997; Sheldon, Boulton, & Puckridge, 2002; Xu & Liu, 2014). These functions
lead to assessing the effect of riparian vegetation on river health by monitoring the characteristics of benthic
macroinvertebrates.
Benthic macroinvertebrates are widely used for assessments of river health (Johnson, Widerholm, & Rosenberg,
1993). Benthic macroinvertebrates reside in the benthic habitat for at least part of their life, relatively immobile,
and very sensitive, therefore any disturbances in the aquatic environment may cause them to disappear or reduce
diversity (Hilsenhoff, 1988; Morse et al., 2007; Zamora-Muñoz, Sáinz-Cantero, Sánchez-Ortega, & Alba-
Tercedor, 1995). The advantage of using benthic macroinvertebrates in river health monitoring have been
discussed by Rosenberg and Resh (1993) and Ndebele-Murisa (2012) as they provide continuous monitors of
the condition of the waters they inhibit. Generally, benthic macroinvertebrates are sound to be used for river
health assessment due to their taxonomic soundness (easy to be recognized by non-specialists); wide or
cosmopolitan distribution; low mobility (local indication); well-known ecological characteristics; Numerical
abundance; exhibit diversity and are sensitive to pollution; high sensitivity to environmental stressor (s); and
high ability for quantification and standardization (Füreder & Reynolds, 2003; Hilty & Merenlender, 2000;
Rosenberg & Resh, 1993).
In Africa, the concept of stream restoration by planting riverine vegetation is new. The South African River
Health Monitoring Program investigates the macroinvertebrate assemblages in different rivers under different
disturbance gradients (Nojiyeza, 2013). Both in Uganda and Tanzania, the Lake Victoria Environmental
Management Progragram investigated the characteristics of macroinvertebrate and microinvertebrates
assemblages in Lake Victoria and its rivers in natural and disturbed gradients. Further, studies have been carried
out in upland rivers of the Usambara Mountains of Tanzania to evaluate the impacts of tea plantations in the
catchment of rivers on macroinvertebrates assemblage (Biervliet, 2009). These previous studies in Africa
focused on disturbances on natural river vegetation and their impact on macroinvertebrates. However, no study
has been carried out to investigate the effect of planted riparian vegetation cover on benthic macroinvertebrate
assemblages attributes.
In Kenya, a number of studies have been undertaken by using macroinvertebrates as an indicator of river health.
In the Mara River physico-chemical water quality parameters under different land have been investigated and
how they affect spatial distribution of benthic macroinvertebrates (Kilonzo et al., 2014; Minaya, MClain, Moog,
Omengo, & Singer, 2013). Further, in the Mara River classification of shredder using gut contents has been
carried out at different pollution gradients (Masese et al., 2013). In the Njoro River, Makoba, Shivoga,
Researchjournali’s Journal of Ecology
Vol. 4 | No. 1 February | 2017 5
www.researchjournali.com
Muchiri, and Miller (2008) investigated the influence of seasonality and point source effluent pollution on the
water chemistry and the structure of benthic invertebrate. On the other hand, Raburu, Masese, and Mulanda
(2009) developed a macroinvertebrate Index of Biotic Integrity for monitoring rivers in the upper catchments
of Nyando and Nzoia Rivers. Furthermore, Ndaruga, Ndiritu, Gichuki, and Wamich (2004) established the
relationship between water quality parameters and macroinvertebrate assemblages in Getharaini drainage in
central Kenya.
Despite a wide range of studies in Kenya dealing with microinvertebrates and land use practices none of them
has documented the influence of canopy cover on benthic macroinvertebrate composition. Our study aimed at
determining the relationship between riparian vegetation cover and benthic macroinvertebrate assemblage
attributes as an ecosystem measure of river health in the Kuywa River. This knowledge is important to the
community and water resource managers as it will yield information on effect of planted riparian zone
vegetation on protecting the river health which may lead to the replication of the same project in other
watersheds.
2. MATERIALS AND METHODS
The Kuywa catchment is bounded by latitude 034º 32` 53” E and 34º 45’ 32” E and 0º 25’ 24” N and 1º 50’
40” N. The entire river system is approximately 110km long. It originates from Mt. Elgon forest and discharges
its waters into Nzoia River, a major river draining into Lake Victoria (Government-of-Kenya, 1984). The
Kuywa River drains an estimated area of 580 square km2. The Kuywa River receives much of its runoff from
the springs, which are perennial, and a stable ground water recharge as evidenced by the 13 boreholes and 150
hand-dug wells in the catchment (Water Resources Management Authority, 2011).
This study adopted longitudinal and cross-sectional descriptive design. Data was collected at the same sites
quarterly over a period of one year beginning January, 2016 and ending October, 2016. This enabled the
searchers to detect changes in the characteristics of the target population at both group and the individual levels,
which led to establishment of sequence of events thus suggesting cause-and-effect relationship.
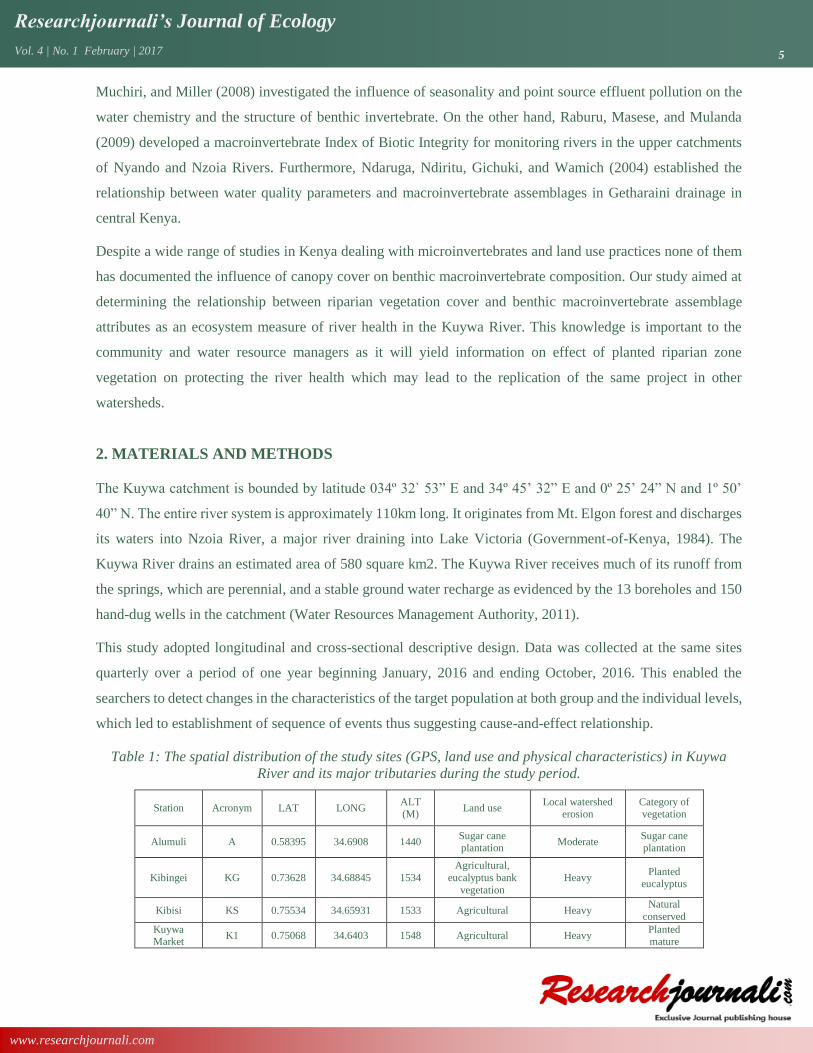
Table 1: The spatial distribution of the study sites (GPS, land use and physical characteristics) in Kuywa
River and its major tributaries during the study period.
Station Acronym LAT LONG ALT (M)
Land use Local watershed
erosion Category of vegetation
Alumuli A 0.58395 34.6908 1440 Sugar cane plantation
Moderate Sugar cane plantation
Kibingei KG 0.73628 34.68845 1534
Agricultural,
eucalyptus bank
vegetation
Heavy Planted
eucalyptus
Kibisi KS 0.75534 34.65931 1533 Agricultural Heavy Natural
conserved
Kuywa Market
K1 0.75068 34.6403 1548 Agricultural Heavy Planted mature
Researchjournali’s Journal of Ecology
Vol. 4 | No. 1 February | 2017 6
www.researchjournali.com
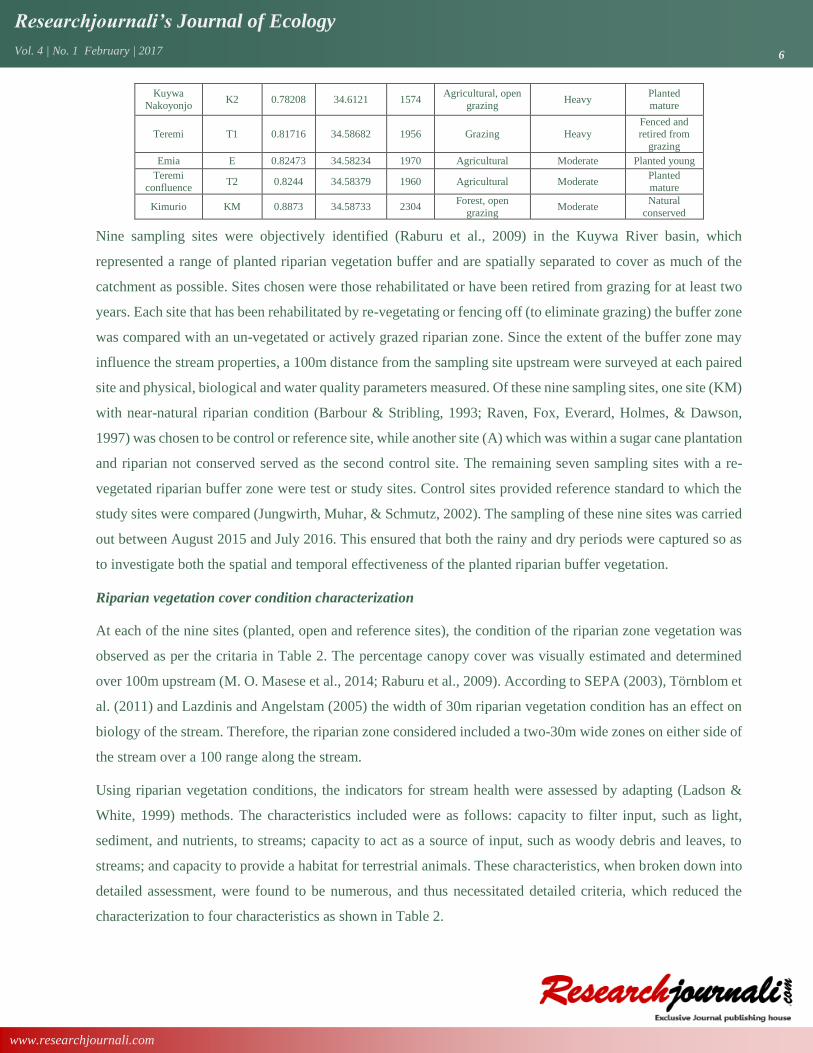
Kuywa
Nakoyonjo K2 0.78208 34.6121 1574
Agricultural, open
grazing Heavy
Planted
mature
Teremi T1 0.81716 34.58682 1956 Grazing Heavy Fenced and retired from
grazing
Emia E 0.82473 34.58234 1970 Agricultural Moderate Planted young
Teremi
confluence T2 0.8244 34.58379 1960 Agricultural Moderate
Planted
mature
Kimurio KM 0.8873 34.58733 2304 Forest, open
grazing Moderate
Natural
conserved
Nine sampling sites were objectively identified (Raburu et al., 2009) in the Kuywa River basin, which
represented a range of planted riparian vegetation buffer and are spatially separated to cover as much of the
catchment as possible. Sites chosen were those rehabilitated or have been retired from grazing for at least two
years. Each site that has been rehabilitated by re-vegetating or fencing off (to eliminate grazing) the buffer zone
was compared with an un-vegetated or actively grazed riparian zone. Since the extent of the buffer zone may
influence the stream properties, a 100m distance from the sampling site upstream were surveyed at each paired
site and physical, biological and water quality parameters measured. Of these nine sampling sites, one site (KM)
with near-natural riparian condition (Barbour & Stribling, 1993; Raven, Fox, Everard, Holmes, & Dawson,
1997) was chosen to be control or reference site, while another site (A) which was within a sugar cane plantation
and riparian not conserved served as the second control site. The remaining seven sampling sites with a re-
vegetated riparian buffer zone were test or study sites. Control sites provided reference standard to which the
study sites were compared (Jungwirth, Muhar, & Schmutz, 2002). The sampling of these nine sites was carried
out between August 2015 and July 2016. This ensured that both the rainy and dry periods were captured so as
to investigate both the spatial and temporal effectiveness of the planted riparian buffer vegetation.
Riparian vegetation cover condition characterization
At each of the nine sites (planted, open and reference sites), the condition of the riparian zone vegetation was
observed as per the critaria in Table 2. The percentage canopy cover was visually estimated and determined
over 100m upstream (M. O. Masese et al., 2014; Raburu et al., 2009). According to SEPA (2003), Törnblom et
al. (2011) and Lazdinis and Angelstam (2005) the width of 30m riparian vegetation condition has an effect on
biology of the stream. Therefore, the riparian zone considered included a two-30m wide zones on either side of
the stream over a 100 range along the stream.
Using riparian vegetation conditions, the indicators for stream health were assessed by adapting (Ladson &
White, 1999) methods. The characteristics included were as follows: capacity to filter input, such as light,
sediment, and nutrients, to streams; capacity to act as a source of input, such as woody debris and leaves, to
streams; and capacity to provide a habitat for terrestrial animals. These characteristics, when broken down into
detailed assessment, were found to be numerous, and thus necessitated detailed criteria, which reduced the
characterization to four characteristics as shown in Table 2.
Researchjournali’s Journal of Ecology
Vol. 4 | No. 1 February | 2017 7
www.researchjournali.com
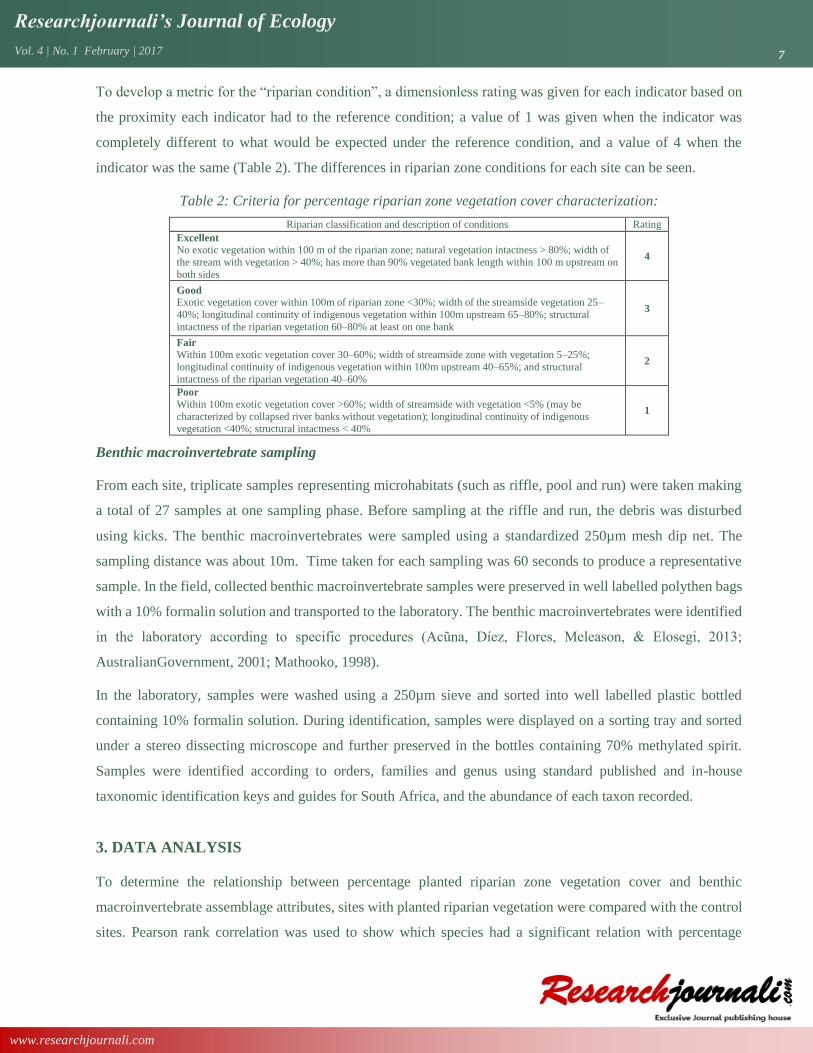
To develop a metric for the “riparian condition”, a dimensionless rating was given for each indicator based on
the proximity each indicator had to the reference condition; a value of 1 was given when the indicator was
completely different to what would be expected under the reference condition, and a value of 4 when the
indicator was the same (Table 2). The differences in riparian zone conditions for each site can be seen.
Table 2: Criteria for percentage riparian zone vegetation cover characterization:
Riparian classification and description of conditions Rating
Excellent
No exotic vegetation within 100 m of the riparian zone; natural vegetation intactness > 80%; width of
the stream with vegetation > 40%; has more than 90% vegetated bank length within 100 m upstream on
both sides
4
Good
Exotic vegetation cover within 100m of riparian zone <30%; width of the streamside vegetation 25–
40%; longitudinal continuity of indigenous vegetation within 100m upstream 65–80%; structural
intactness of the riparian vegetation 60–80% at least on one bank
3
Fair
Within 100m exotic vegetation cover 30–60%; width of streamside zone with vegetation 5–25%;
longitudinal continuity of indigenous vegetation within 100m upstream 40–65%; and structural
intactness of the riparian vegetation 40–60%
2
Poor
Within 100m exotic vegetation cover >60%; width of streamside with vegetation <5% (may be
characterized by collapsed river banks without vegetation); longitudinal continuity of indigenous vegetation <40%; structural intactness < 40%
1
Benthic macroinvertebrate sampling
From each site, triplicate samples representing microhabitats (such as riffle, pool and run) were taken making
a total of 27 samples at one sampling phase. Before sampling at the riffle and run, the debris was disturbed
using kicks. The benthic macroinvertebrates were sampled using a standardized 250µm mesh dip net. The
sampling distance was about 10m. Time taken for each sampling was 60 seconds to produce a representative
sample. In the field, collected benthic macroinvertebrate samples were preserved in well labelled polythen bags
with a 10% formalin solution and transported to the laboratory. The benthic macroinvertebrates were identified
in the laboratory according to specific procedures (Acũna, Díez, Flores, Meleason, & Elosegi, 2013;
AustralianGovernment, 2001; Mathooko, 1998).
In the laboratory, samples were washed using a 250µm sieve and sorted into well labelled plastic bottled
containing 10% formalin solution. During identification, samples were displayed on a sorting tray and sorted
under a stereo dissecting microscope and further preserved in the bottles containing 70% methylated spirit.
Samples were identified according to orders, families and genus using standard published and in-house
taxonomic identification keys and guides for South Africa, and the abundance of each taxon recorded.
3. DATA ANALYSIS
To determine the relationship between percentage planted riparian zone vegetation cover and benthic
macroinvertebrate assemblage attributes, sites with planted riparian vegetation were compared with the control
sites. Pearson rank correlation was used to show which species had a significant relation with percentage
Researchjournali’s Journal of Ecology
Vol. 4 | No. 1 February | 2017 8
www.researchjournali.com
riparian vegetation cover. Spatial characteristics were obtained by averaging for rounds of field sampling,
representing both dry period and wet period. This was accomplished by employing descriptive statistics which
involved computing the Richness Index (S), Abundance Index (N), Margalef Richness (d) (Margalef, 1956),
Shannon Index (H) (Maguran, 1988), Simpson diversity (λ) and Pielou evenness for benthic macroinvertebrates
at different sites. Inferential statistics was also performed to determine Bray-Curtis similarity measure. The
similarity was visualised using Multi-dimensional Scaling (MDS) in Primer v6, (Clarke, Somerfield, &
Chapman, 2006) on benthic macroinvertebrates when factored with percentage riparian vegetation cover. To
test the hypothesis, whether variations between the sites are significant, ANOSIM analysis was applied. Further,
the effect of planted riparian zone vegetation was tested by the percentage of EPT.
4. RESULTS
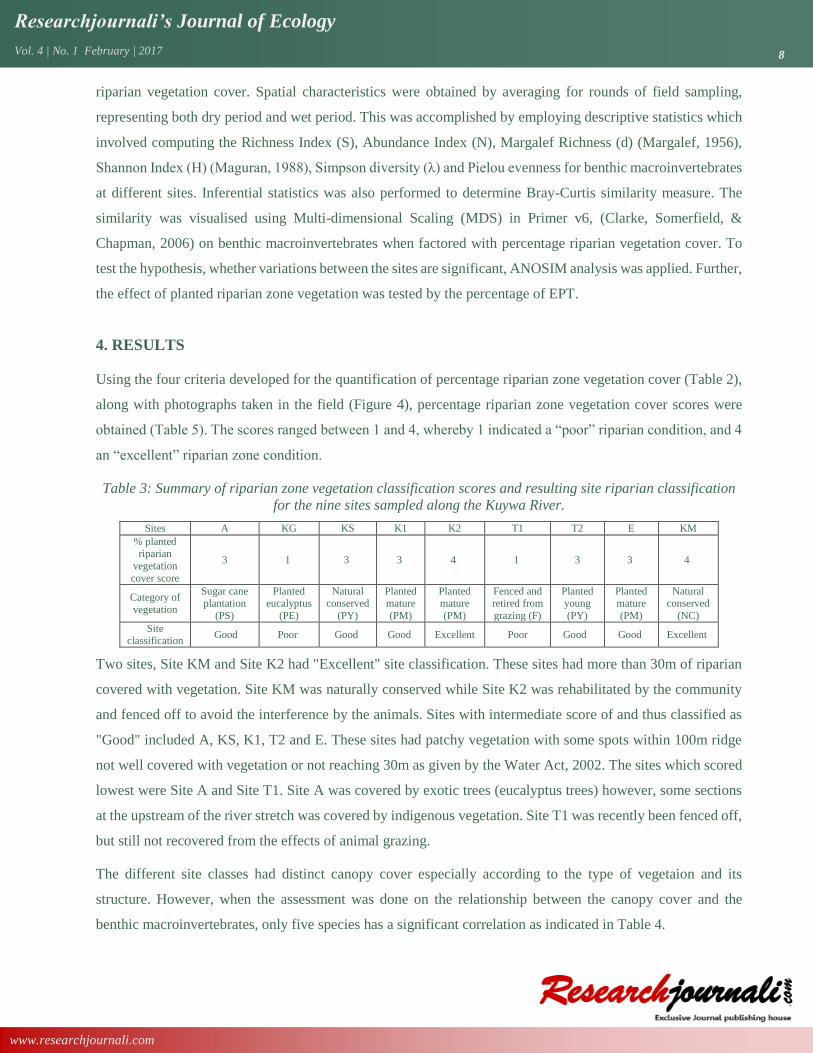
Using the four criteria developed for the quantification of percentage riparian zone vegetation cover (Table 2),
along with photographs taken in the field (Figure 4), percentage riparian zone vegetation cover scores were
obtained (Table 5). The scores ranged between 1 and 4, whereby 1 indicated a “poor” riparian condition, and 4
an “excellent” riparian zone condition.
Table 3: Summary of riparian zone vegetation classification scores and resulting site riparian classification
for the nine sites sampled along the Kuywa River.
Sites A KG KS K1 K2 T1 T2 E KM
% planted riparian
vegetation
cover score
3 1 3 3 4 1 3 3 4
Category of
vegetation
Sugar cane plantation
(PS)
Planted eucalyptus
(PE)
Natural conserved
(PY)
Planted mature
(PM)
Planted mature
(PM)
Fenced and retired from
grazing (F)
Planted young
(PY)
Planted mature
(PM)
Natural conserved
(NC)
Site classification
Good Poor Good Good Excellent Poor Good Good Excellent
Two sites, Site KM and Site K2 had "Excellent" site classification. These sites had more than 30m of riparian
covered with vegetation. Site KM was naturally conserved while Site K2 was rehabilitated by the community
and fenced off to avoid the interference by the animals. Sites with intermediate score of and thus classified as
"Good" included A, KS, K1, T2 and E. These sites had patchy vegetation with some spots within 100m ridge
not well covered with vegetation or not reaching 30m as given by the Water Act, 2002. The sites which scored
lowest were Site A and Site T1. Site A was covered by exotic trees (eucalyptus trees) however, some sections
at the upstream of the river stretch was covered by indigenous vegetation. Site T1 was recently been fenced off,
but still not recovered from the effects of animal grazing.
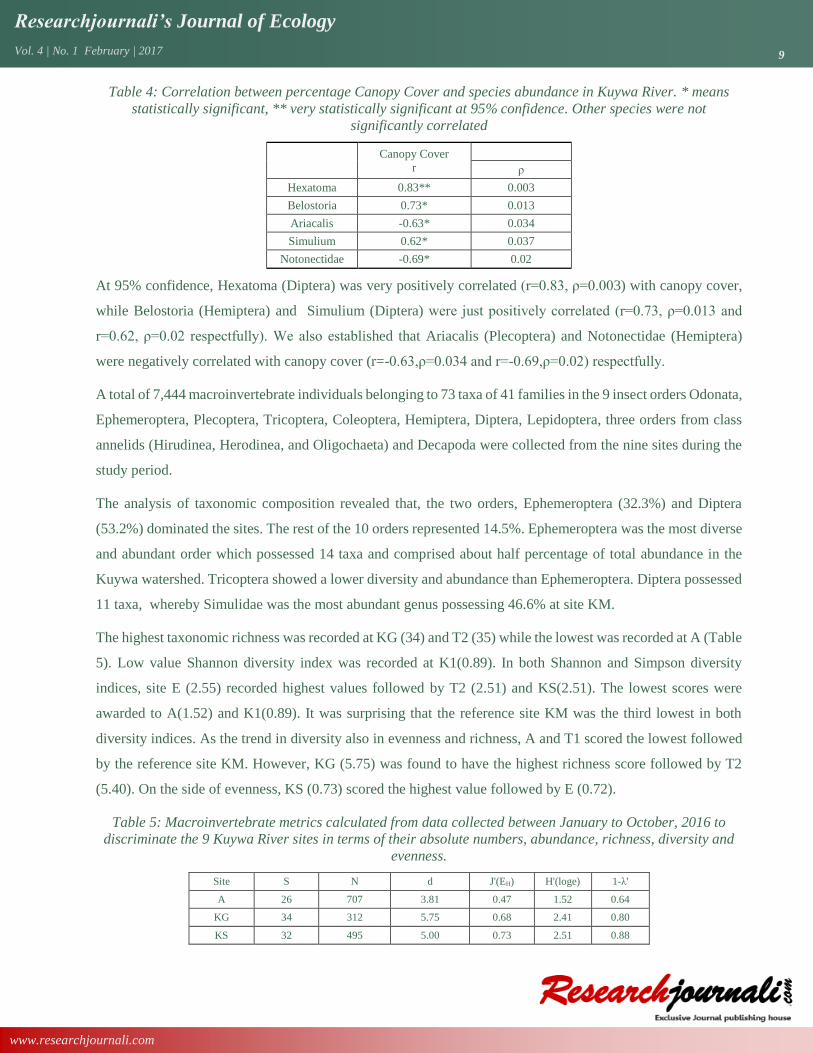
The different site classes had distinct canopy cover especially according to the type of vegetaion and its
structure. However, when the assessment was done on the relationship between the canopy cover and the
benthic macroinvertebrates, only five species has a significant correlation as indicated in Table 4.
Researchjournali’s Journal of Ecology
Vol. 4 | No. 1 February | 2017 9
www.researchjournali.com
Table 4: Correlation between percentage Canopy Cover and species abundance in Kuywa River. * means
statistically significant, ** very statistically significant at 95% confidence. Other species were not
significantly correlated
Canopy Cover
r
ρ
Hexatoma 0.83** 0.003
Belostoria 0.73* 0.013
Ariacalis -0.63* 0.034
Simulium 0.62* 0.037
Notonectidae -0.69* 0.02
At 95% confidence, Hexatoma (Diptera) was very positively correlated (r=0.83, ρ=0.003) with canopy cover,
while Belostoria (Hemiptera) and Simulium (Diptera) were just positively correlated (r=0.73, ρ=0.013 and
r=0.62, ρ=0.02 respectfully). We also established that Ariacalis (Plecoptera) and Notonectidae (Hemiptera)
were negatively correlated with canopy cover (r=-0.63,ρ=0.034 and r=-0.69,ρ=0.02) respectfully.
A total of 7,444 macroinvertebrate individuals belonging to 73 taxa of 41 families in the 9 insect orders Odonata,
Ephemeroptera, Plecoptera, Tricoptera, Coleoptera, Hemiptera, Diptera, Lepidoptera, three orders from class
annelids (Hirudinea, Herodinea, and Oligochaeta) and Decapoda were collected from the nine sites during the
study period.
The analysis of taxonomic composition revealed that, the two orders, Ephemeroptera (32.3%) and Diptera
(53.2%) dominated the sites. The rest of the 10 orders represented 14.5%. Ephemeroptera was the most diverse
and abundant order which possessed 14 taxa and comprised about half percentage of total abundance in the
Kuywa watershed. Tricoptera showed a lower diversity and abundance than Ephemeroptera. Diptera possessed
11 taxa, whereby Simulidae was the most abundant genus possessing 46.6% at site KM.
The highest taxonomic richness was recorded at KG (34) and T2 (35) while the lowest was recorded at A (Table
5). Low value Shannon diversity index was recorded at K1(0.89). In both Shannon and Simpson diversity
indices, site E (2.55) recorded highest values followed by T2 (2.51) and KS(2.51). The lowest scores were
awarded to A(1.52) and K1(0.89). It was surprising that the reference site KM was the third lowest in both
diversity indices. As the trend in diversity also in evenness and richness, A and T1 scored the lowest followed
by the reference site KM. However, KG (5.75) was found to have the highest richness score followed by T2
(5.40). On the side of evenness, KS (0.73) scored the highest value followed by E (0.72).
Table 5: Macroinvertebrate metrics calculated from data collected between January to October, 2016 to
discriminate the 9 Kuywa River sites in terms of their absolute numbers, abundance, richness, diversity and
evenness.
Site S N d J'(EH) H'(loge) 1-λ'
A 26 707 3.81 0.47 1.52 0.64
KG 34 312 5.75 0.68 2.41 0.80
KS 32 495 5.00 0.73 2.51 0.88
Researchjournali’s Journal of Ecology
Vol. 4 | No. 1 February | 2017 10
www.researchjournali.com
K1 31 1858 3.99 0.26 0.89 0.32
K2 35 1026 4.90 0.55 1.96 0.75
T1 29 607 4.37 0.69 2.34 0.82
E 34 843 4.90 0.72 2.55 0.88
T2 35 543 5.40 0.71 2.51 0.86
KM 28 1052 3.88 0.58 1.93 0.73
S=Richness index; N=Abundance index; d=Margalef richness; J'=Plelou's evenness; H'=Shannon index;
EH=Shannon evenness; 1-λ=Simpson diversity.
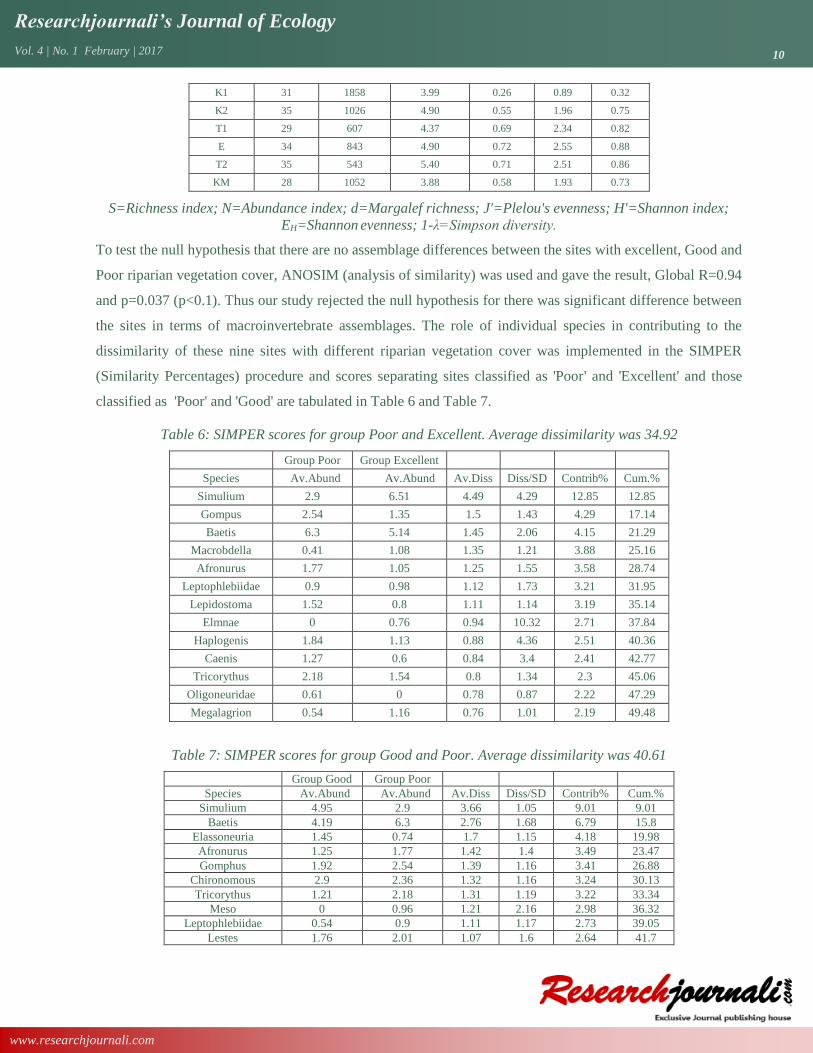
To test the null hypothesis that there are no assemblage differences between the sites with excellent, Good and
Poor riparian vegetation cover, ANOSIM (analysis of similarity) was used and gave the result, Global R=0.94
and p=0.037 (p<0.1). Thus our study rejected the null hypothesis for there was significant difference between
the sites in terms of macroinvertebrate assemblages. The role of individual species in contributing to the
dissimilarity of these nine sites with different riparian vegetation cover was implemented in the SIMPER
(Similarity Percentages) procedure and scores separating sites classified as 'Poor' and 'Excellent' and those
classified as 'Poor' and 'Good' are tabulated in Table 6 and Table 7.
Table 6: SIMPER scores for group Poor and Excellent. Average dissimilarity was 34.92
Group Poor Group Excellent
Species Av.Abund Av.Abund Av.Diss Diss/SD Contrib% Cum.%
Simulium 2.9 6.51 4.49 4.29 12.85 12.85
Gompus 2.54 1.35 1.5 1.43 4.29 17.14
Baetis 6.3 5.14 1.45 2.06 4.15 21.29
Macrobdella 0.41 1.08 1.35 1.21 3.88 25.16
Afronurus 1.77 1.05 1.25 1.55 3.58 28.74
Leptophlebiidae 0.9 0.98 1.12 1.73 3.21 31.95
Lepidostoma 1.52 0.8 1.11 1.14 3.19 35.14
Elmnae 0 0.76 0.94 10.32 2.71 37.84
Haplogenis 1.84 1.13 0.88 4.36 2.51 40.36
Caenis 1.27 0.6 0.84 3.4 2.41 42.77
Tricorythus 2.18 1.54 0.8 1.34 2.3 45.06
Oligoneuridae 0.61 0 0.78 0.87 2.22 47.29
Megalagrion 0.54 1.16 0.76 1.01 2.19 49.48
Table 7: SIMPER scores for group Good and Poor. Average dissimilarity was 40.61
Group Good Group Poor
Species Av.Abund Av.Abund Av.Diss Diss/SD Contrib% Cum.%
Simulium 4.95 2.9 3.66 1.05 9.01 9.01
Baetis 4.19 6.3 2.76 1.68 6.79 15.8
Elassoneuria 1.45 0.74 1.7 1.15 4.18 19.98
Afronurus 1.25 1.77 1.42 1.4 3.49 23.47
Gomphus 1.92 2.54 1.39 1.16 3.41 26.88
Chironomous 2.9 2.36 1.32 1.16 3.24 30.13
Tricorythus 1.21 2.18 1.31 1.19 3.22 33.34
Meso 0 0.96 1.21 2.16 2.98 36.32
Leptophlebiidae 0.54 0.9 1.11 1.17 2.73 39.05
Lestes 1.76 2.01 1.07 1.6 2.64 41.7
Researchjournali’s Journal of Ecology
Vol. 4 | No. 1 February | 2017 11
www.researchjournali.com
Ephemerella 0.92 0 1.07 0.53 2.63 44.32
Lepidostoma 0.94 1.52 1.01 1.2 2.48 46.81
Haplogenis 1.27 1.84 0.99 1.41 2.45 49.25
In Table 6, the average of the Bray-Curtis dissimilarity between the pairs of the nine sites was 34.92. This was
found to be made up of 4.49 from Simulium (Diptera), 1.5 from Gomphus (Odonata), 2.06 from Baetis
(Ephemeroptera) and the rest had insignificant contributions. The Simulium contributed 12.85% of the total of
34.92, Gompus gave 4.29% of this total and Baetis gave 4.15% of the total. Simulium declines strongly in
abundance in poor vegetation cover (6.51 to 2.9), whereas, Gompus increases in poor vegetation cover (1.35 to
2.54). Further, in Table 7, the average Bray-Curtis dissimilarity between all nine pairs of sites in the group was
40.61, made up of from Simulium (3.66 i.e. 9%), Baetis (2.76 i.e. 6.79%), Elassoneuria (Ephemeroptera) (0.74
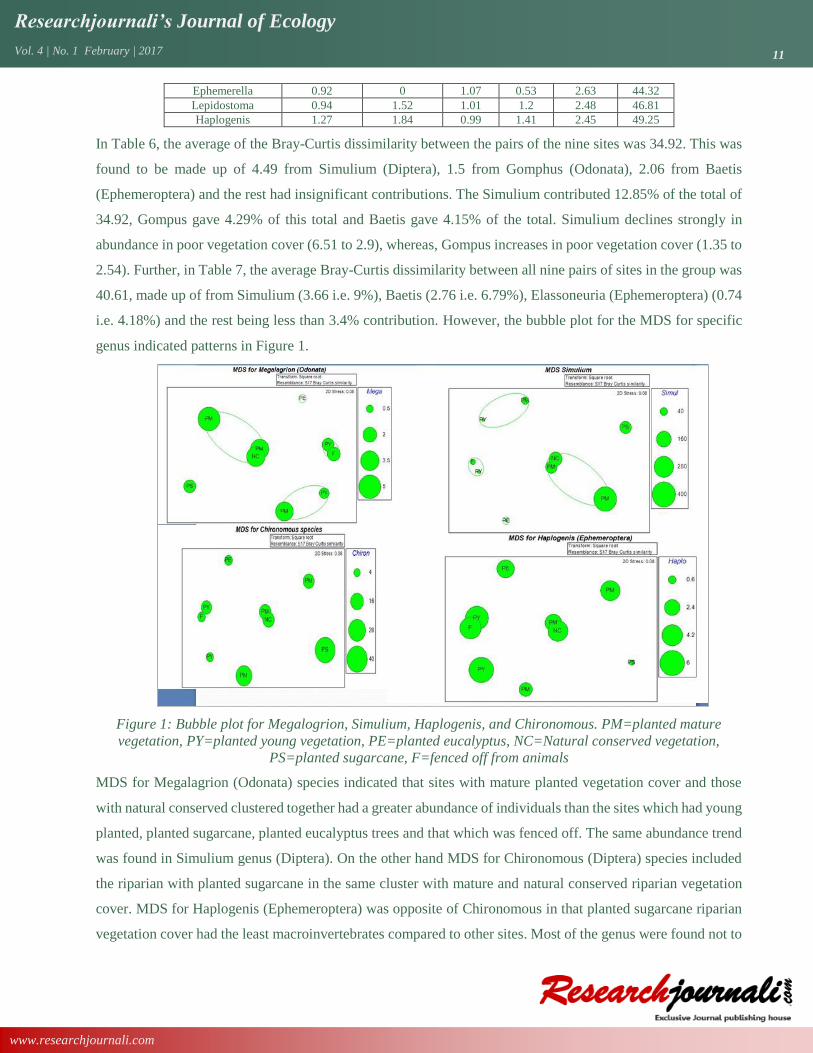
i.e. 4.18%) and the rest being less than 3.4% contribution. However, the bubble plot for the MDS for specific
genus indicated patterns in Figure 1.
Figure 1: Bubble plot for Megalogrion, Simulium, Haplogenis, and Chironomous. PM=planted mature
vegetation, PY=planted young vegetation, PE=planted eucalyptus, NC=Natural conserved vegetation,
PS=planted sugarcane, F=fenced off from animals
MDS for Megalagrion (Odonata) species indicated that sites with mature planted vegetation cover and those
with natural conserved clustered together had a greater abundance of individuals than the sites which had young
planted, planted sugarcane, planted eucalyptus trees and that which was fenced off. The same abundance trend
was found in Simulium genus (Diptera). On the other hand MDS for Chironomous (Diptera) species included
the riparian with planted sugarcane in the same cluster with mature and natural conserved riparian vegetation
cover. MDS for Haplogenis (Ephemeroptera) was opposite of Chironomous in that planted sugarcane riparian
vegetation cover had the least macroinvertebrates compared to other sites. Most of the genus were found not to
Researchjournali’s Journal of Ecology
Vol. 4 | No. 1 February | 2017 12
www.researchjournali.com
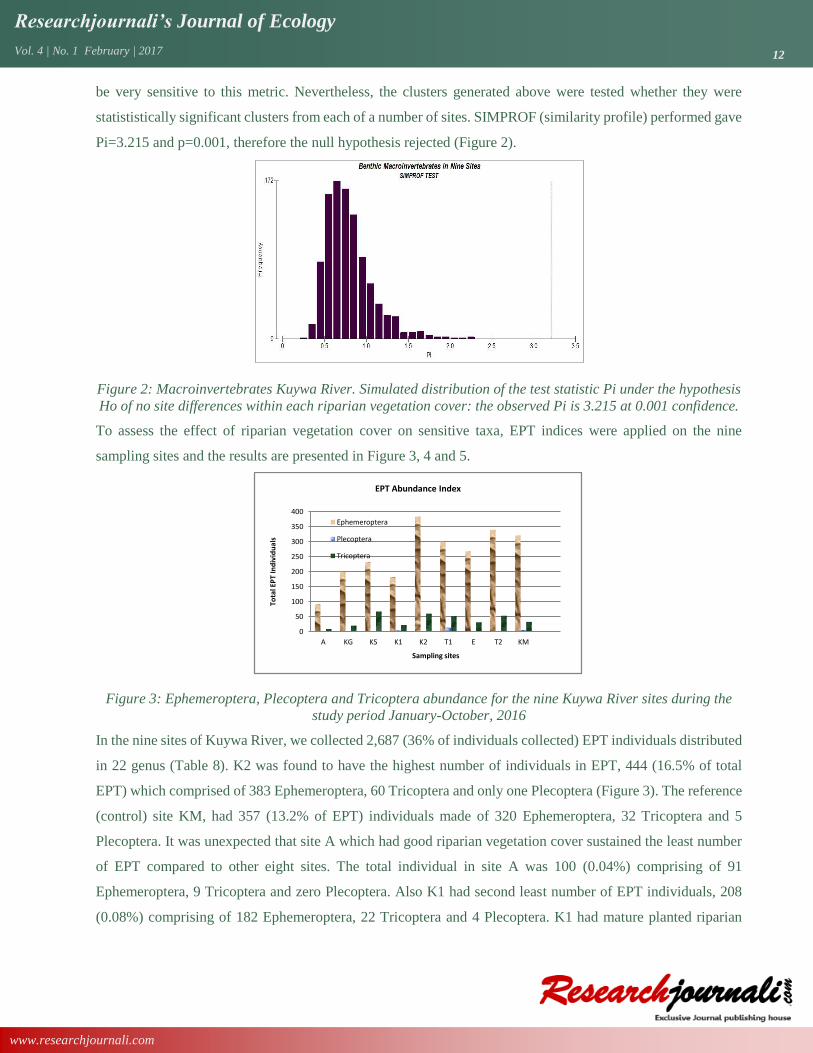
be very sensitive to this metric. Nevertheless, the clusters generated above were tested whether they were
statististically significant clusters from each of a number of sites. SIMPROF (similarity profile) performed gave
Pi=3.215 and p=0.001, therefore the null hypothesis rejected (Figure 2).
Figure 2: Macroinvertebrates Kuywa River. Simulated distribution of the test statistic Pi under the hypothesis
Ho of no site differences within each riparian vegetation cover: the observed Pi is 3.215 at 0.001 confidence.
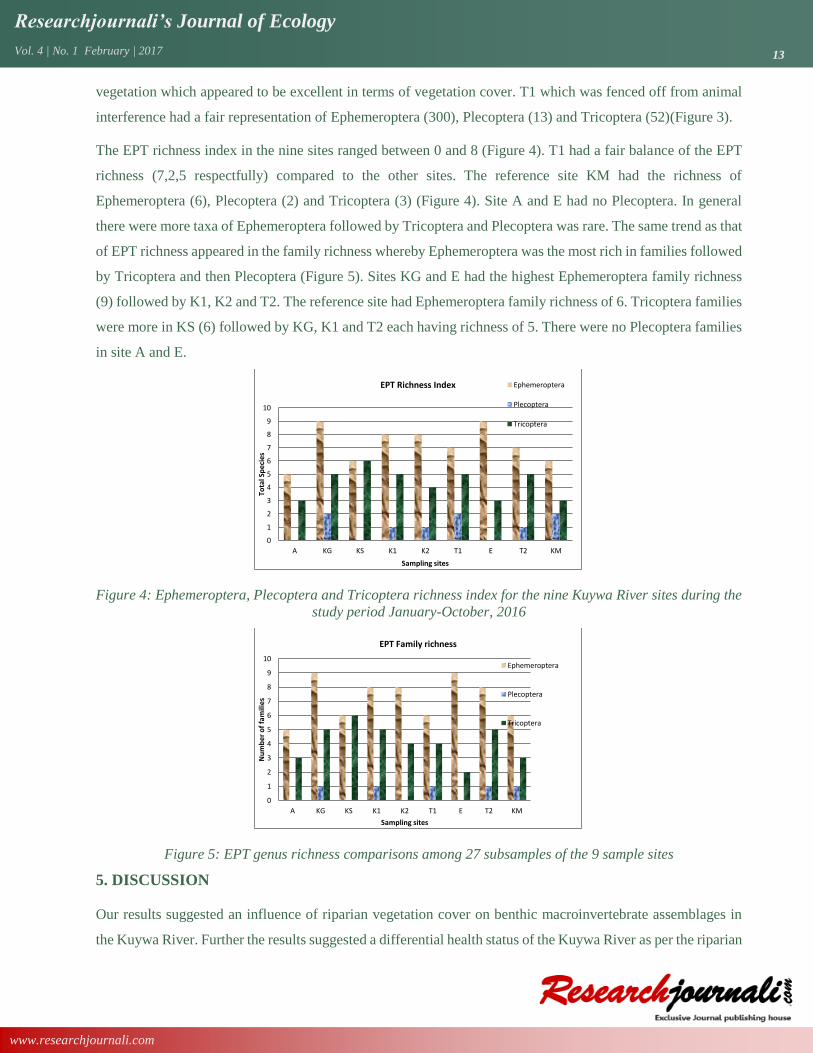
To assess the effect of riparian vegetation cover on sensitive taxa, EPT indices were applied on the nine
sampling sites and the results are presented in Figure 3, 4 and 5.
Figure 3: Ephemeroptera, Plecoptera and Tricoptera abundance for the nine Kuywa River sites during the
study period January-October, 2016
In the nine sites of Kuywa River, we collected 2,687 (36% of individuals collected) EPT individuals distributed
in 22 genus (Table 8). K2 was found to have the highest number of individuals in EPT, 444 (16.5% of total
EPT) which comprised of 383 Ephemeroptera, 60 Tricoptera and only one Plecoptera (Figure 3). The reference
(control) site KM, had 357 (13.2% of EPT) individuals made of 320 Ephemeroptera, 32 Tricoptera and 5
Plecoptera. It was unexpected that site A which had good riparian vegetation cover sustained the least number
of EPT compared to other eight sites. The total individual in site A was 100 (0.04%) comprising of 91
Ephemeroptera, 9 Tricoptera and zero Plecoptera. Also K1 had second least number of EPT individuals, 208
(0.08%) comprising of 182 Ephemeroptera, 22 Tricoptera and 4 Plecoptera. K1 had mature planted riparian
0
50
100
150
200
250
300
350
400
A KG KS K1 K2 T1 E T2 KM
Tota
l EP
T In
div
idu
als
Sampling sites
EPT Abundance Index
Ephemeroptera
Plecoptera
Tricoptera
Researchjournali’s Journal of Ecology
Vol. 4 | No. 1 February | 2017 13
www.researchjournali.com
vegetation which appeared to be excellent in terms of vegetation cover. T1 which was fenced off from animal
interference had a fair representation of Ephemeroptera (300), Plecoptera (13) and Tricoptera (52)(Figure 3).
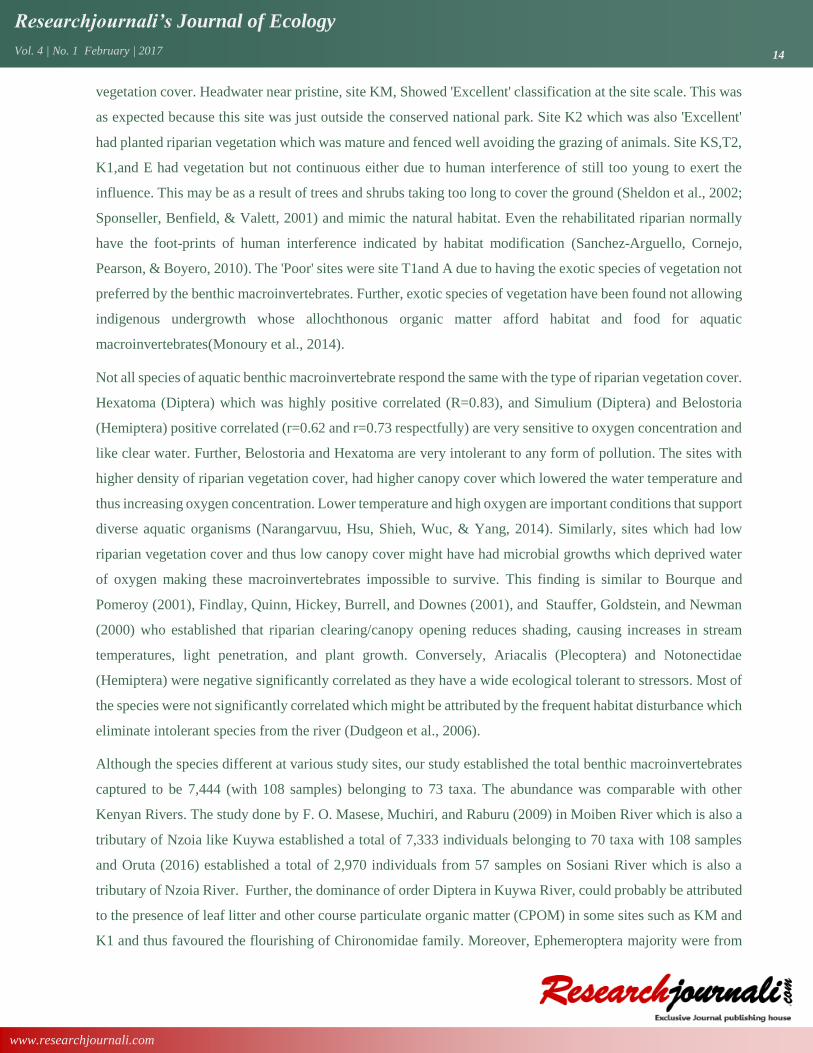
The EPT richness index in the nine sites ranged between 0 and 8 (Figure 4). T1 had a fair balance of the EPT
richness (7,2,5 respectfully) compared to the other sites. The reference site KM had the richness of
Ephemeroptera (6), Plecoptera (2) and Tricoptera (3) (Figure 4). Site A and E had no Plecoptera. In general
there were more taxa of Ephemeroptera followed by Tricoptera and Plecoptera was rare. The same trend as that
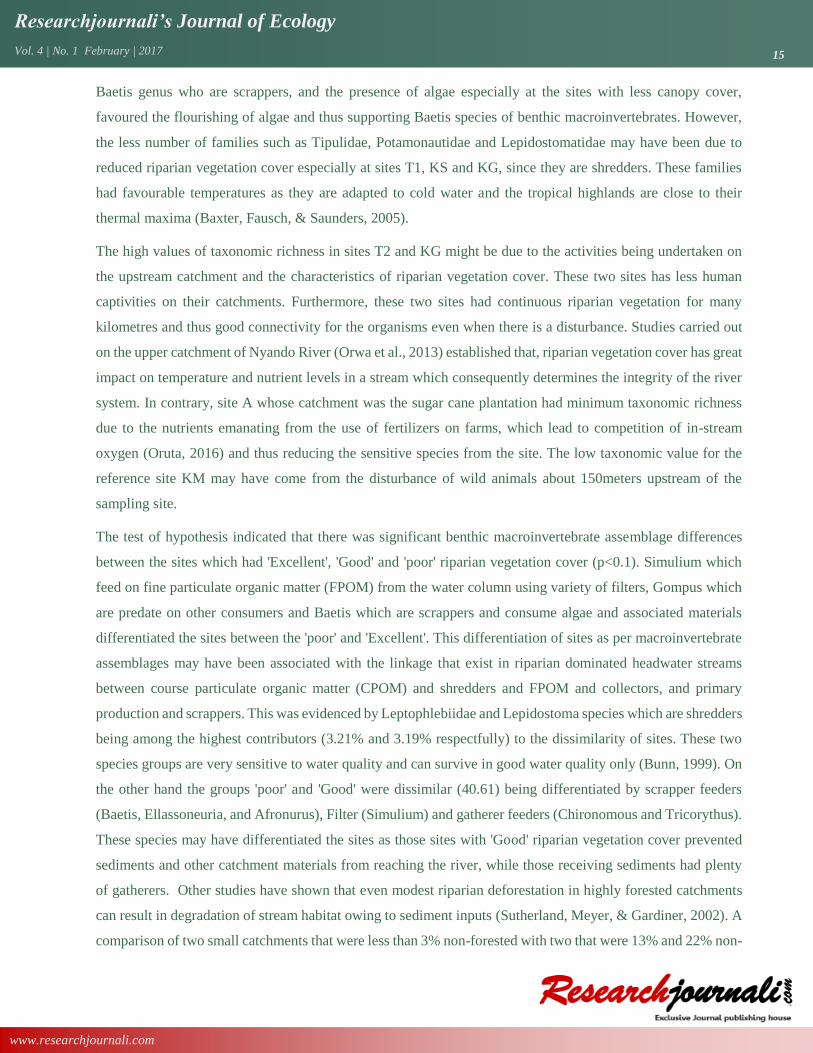
of EPT richness appeared in the family richness whereby Ephemeroptera was the most rich in families followed
by Tricoptera and then Plecoptera (Figure 5). Sites KG and E had the highest Ephemeroptera family richness
(9) followed by K1, K2 and T2. The reference site had Ephemeroptera family richness of 6. Tricoptera families
were more in KS (6) followed by KG, K1 and T2 each having richness of 5. There were no Plecoptera families
in site A and E.
Figure 4: Ephemeroptera, Plecoptera and Tricoptera richness index for the nine Kuywa River sites during the
study period January-October, 2016
Figure 5: EPT genus richness comparisons among 27 subsamples of the 9 sample sites
5. DISCUSSION
Our results suggested an influence of riparian vegetation cover on benthic macroinvertebrate assemblages in
the Kuywa River. Further the results suggested a differential health status of the Kuywa River as per the riparian
0
1
2
3
4
5
6
7
8
9
10
A KG KS K1 K2 T1 E T2 KM
Tota
l Sp
ecie
s
Sampling sites
EPT Richness Index Ephemeroptera
Plecoptera
Tricoptera
0
1
2
3
4
5
6
7
8
9
10
A KG KS K1 K2 T1 E T2 KM
Nu
mb
er o
f fa
mili
es
Sampling sites
EPT Family richness
Ephemeroptera
Plecoptera
Tricoptera
Researchjournali’s Journal of Ecology
Vol. 4 | No. 1 February | 2017 14
www.researchjournali.com
vegetation cover. Headwater near pristine, site KM, Showed 'Excellent' classification at the site scale. This was
as expected because this site was just outside the conserved national park. Site K2 which was also 'Excellent'
had planted riparian vegetation which was mature and fenced well avoiding the grazing of animals. Site KS,T2,
K1,and E had vegetation but not continuous either due to human interference of still too young to exert the
influence. This may be as a result of trees and shrubs taking too long to cover the ground (Sheldon et al., 2002;
Sponseller, Benfield, & Valett, 2001) and mimic the natural habitat. Even the rehabilitated riparian normally
have the foot-prints of human interference indicated by habitat modification (Sanchez-Arguello, Cornejo,
Pearson, & Boyero, 2010). The 'Poor' sites were site T1and A due to having the exotic species of vegetation not
preferred by the benthic macroinvertebrates. Further, exotic species of vegetation have been found not allowing
indigenous undergrowth whose allochthonous organic matter afford habitat and food for aquatic
macroinvertebrates(Monoury et al., 2014).
Not all species of aquatic benthic macroinvertebrate respond the same with the type of riparian vegetation cover.
Hexatoma (Diptera) which was highly positive correlated (R=0.83), and Simulium (Diptera) and Belostoria
(Hemiptera) positive correlated (r=0.62 and r=0.73 respectfully) are very sensitive to oxygen concentration and
like clear water. Further, Belostoria and Hexatoma are very intolerant to any form of pollution. The sites with
higher density of riparian vegetation cover, had higher canopy cover which lowered the water temperature and
thus increasing oxygen concentration. Lower temperature and high oxygen are important conditions that support
diverse aquatic organisms (Narangarvuu, Hsu, Shieh, Wuc, & Yang, 2014). Similarly, sites which had low
riparian vegetation cover and thus low canopy cover might have had microbial growths which deprived water
of oxygen making these macroinvertebrates impossible to survive. This finding is similar to Bourque and
Pomeroy (2001), Findlay, Quinn, Hickey, Burrell, and Downes (2001), and Stauffer, Goldstein, and Newman
(2000) who established that riparian clearing/canopy opening reduces shading, causing increases in stream
temperatures, light penetration, and plant growth. Conversely, Ariacalis (Plecoptera) and Notonectidae
(Hemiptera) were negative significantly correlated as they have a wide ecological tolerant to stressors. Most of
the species were not significantly correlated which might be attributed by the frequent habitat disturbance which
eliminate intolerant species from the river (Dudgeon et al., 2006).
Although the species different at various study sites, our study established the total benthic macroinvertebrates
captured to be 7,444 (with 108 samples) belonging to 73 taxa. The abundance was comparable with other
Kenyan Rivers. The study done by F. O. Masese, Muchiri, and Raburu (2009) in Moiben River which is also a
tributary of Nzoia like Kuywa established a total of 7,333 individuals belonging to 70 taxa with 108 samples
and Oruta (2016) established a total of 2,970 individuals from 57 samples on Sosiani River which is also a
tributary of Nzoia River. Further, the dominance of order Diptera in Kuywa River, could probably be attributed
to the presence of leaf litter and other course particulate organic matter (CPOM) in some sites such as KM and
K1 and thus favoured the flourishing of Chironomidae family. Moreover, Ephemeroptera majority were from
Researchjournali’s Journal of Ecology
Vol. 4 | No. 1 February | 2017 15
www.researchjournali.com
Baetis genus who are scrappers, and the presence of algae especially at the sites with less canopy cover,
favoured the flourishing of algae and thus supporting Baetis species of benthic macroinvertebrates. However,
the less number of families such as Tipulidae, Potamonautidae and Lepidostomatidae may have been due to
reduced riparian vegetation cover especially at sites T1, KS and KG, since they are shredders. These families
had favourable temperatures as they are adapted to cold water and the tropical highlands are close to their
thermal maxima (Baxter, Fausch, & Saunders, 2005).
The high values of taxonomic richness in sites T2 and KG might be due to the activities being undertaken on
the upstream catchment and the characteristics of riparian vegetation cover. These two sites has less human
captivities on their catchments. Furthermore, these two sites had continuous riparian vegetation for many
kilometres and thus good connectivity for the organisms even when there is a disturbance. Studies carried out
on the upper catchment of Nyando River (Orwa et al., 2013) established that, riparian vegetation cover has great
impact on temperature and nutrient levels in a stream which consequently determines the integrity of the river
system. In contrary, site A whose catchment was the sugar cane plantation had minimum taxonomic richness
due to the nutrients emanating from the use of fertilizers on farms, which lead to competition of in-stream
oxygen (Oruta, 2016) and thus reducing the sensitive species from the site. The low taxonomic value for the
reference site KM may have come from the disturbance of wild animals about 150meters upstream of the
sampling site.
The test of hypothesis indicated that there was significant benthic macroinvertebrate assemblage differences
between the sites which had 'Excellent', 'Good' and 'poor' riparian vegetation cover (p<0.1). Simulium which
feed on fine particulate organic matter (FPOM) from the water column using variety of filters, Gompus which
are predate on other consumers and Baetis which are scrappers and consume algae and associated materials
differentiated the sites between the 'poor' and 'Excellent'. This differentiation of sites as per macroinvertebrate
assemblages may have been associated with the linkage that exist in riparian dominated headwater streams
between course particulate organic matter (CPOM) and shredders and FPOM and collectors, and primary
production and scrappers. This was evidenced by Leptophlebiidae and Lepidostoma species which are shredders
being among the highest contributors (3.21% and 3.19% respectfully) to the dissimilarity of sites. These two
species groups are very sensitive to water quality and can survive in good water quality only (Bunn, 1999). On
the other hand the groups 'poor' and 'Good' were dissimilar (40.61) being differentiated by scrapper feeders
(Baetis, Ellassoneuria, and Afronurus), Filter (Simulium) and gatherer feeders (Chironomous and Tricorythus).
These species may have differentiated the sites as those sites with 'Good' riparian vegetation cover prevented
sediments and other catchment materials from reaching the river, while those receiving sediments had plenty
of gatherers. Other studies have shown that even modest riparian deforestation in highly forested catchments
can result in degradation of stream habitat owing to sediment inputs (Sutherland, Meyer, & Gardiner, 2002). A
comparison of two small catchments that were less than 3% non-forested with two that were 13% and 22% non-
Researchjournali’s Journal of Ecology
Vol. 4 | No. 1 February | 2017 16
www.researchjournali.com
forested found the latter to have higher concentrations of suspended sediments, higher turbidity at baseflow,
five to nine times greater bedload transport, and greater embeddedness (Sutherland et al. 2002). However, when
this interpretation has been done, care should be taken as materials in the river may be transported from a
distance and get deposited in a given site especially when encountered with the obstructions (Findlay et al.,
2001). Furthermoer, as discussed above, the sites with closed canopy which were in sites KM and K2 prevented
sun light penetration and might have limited the growth of algae (Greenway, 2004; Sheldon et al., 2012)
necessary for the survival of scrappers. Nevertheless, the feeding of shredders on riparian litter affects dentrital
processing in aquatic systems.
Loss of large woody debris reduces substrate for feeding, attachment, and cover; causes loss of sediment and
organic material storage; reduces energy dissipation; alters flow hydraulics and therefore distribution of
habitats; reduces bank stability and community function as evidences by the MDS plot of Megalagrion,
Simulium, Chironomous and Haplogenis species. Chironomous and Simulium were more abundant at sites with
either mature planted riparian vegetion or naturally conserved riparian vegetation. This may have been caused
by Simulium getting enough food from the water column at these sites there is plenty of debris falling from the
riparian vegetation into the water column. On the other hand the abundance of Chironomous may have been
attributed by the presence of wood debris in the river at natural conserved and mature planted vegetation sites
to trap food particles (L. B. Johnson, Breneman, & Richards, 2003; Stauffer et al., 2000). Although some species
were sensitive riparian vegetation, Megalagrion and Haplogenis species were found to be tolerant to riparian
vegetation absence. The sites with minimal riparian vegetation cover had more of these species which may be
as a result of these species having a wider ecological tolerance. The clusters for the tolerant and intolerant
species appeared to be statistically significant (Pi=3.215, p<0.001) indicating that they did not form by chance.
Similar studies have shown that land use that deprives a stream of riparian vegetation affects the attributes of
aquatic macroinvertebrates. A study carried out at Upper Wabash River in Indiana (Hrodey, Sutton, Frimpong,
& Simon, 2009) revealed that intensive agricultural land use where riparian vegetation had been cleared led to
remarkable changes in aquatic macroinvertebrate communities as well as to degraded water quality. Further,
this study established that stream macroinvertebrates responded negatively to increased sedimentation and
habitat loss.
The sensitive EPT group of benthic macroinvertebrates have been used to indicate the health of rivers/streams.
Our study K2 and T2 to having the highest percentage of EPT (16.5% and 13.0%). This might have been due
to the less disturbance at these two sites which had good riparian zone vegetation and less intensive agriculture
on their catchment. The control site KM had also a comparable number of EPT to that of K2 and T2. Conversely,
site A which had also good riparian zone vegetation had the lowest percentage EPT (0.04%), attributed by the
effect of agricultural chemicals from the sugarcane plantation. The EPT are sensitive to disturbance and
decrease with increase in nutrients levels (Mason, 2002). This was made more evident by the fact that sites A
Researchjournali’s Journal of Ecology
Vol. 4 | No. 1 February | 2017 17
www.researchjournali.com
and E had no Plecoptera at all. Site E might have also missed Plecoptera due to high usage of fertilizers and
pesticides on horticultural farms which were evident along the river. Site T1 had no grown vegetation but had
a fair representation of EPT due to the as a result of being fences off to eliminate the stress exerted by animals.
Generally, the relative abundance of the intolerant group in all sites was believed to be influenced by organic
matter and the availability of food for consumption. Our study agrees with Aura, Raburu, and Herrmann (2010),
Mason (2002) and Orwa et al. (2013) who found similar results and attributed it to the influence of organic
matter and food distribution of aquatic macroinvertebrates.
The distribution of EPT species to different sites varied with Ephemeroptera being the richest, followed by
Tricoptera and Plecoptera least. This was comparable with similar studies in Kenya (example; Orwa, Raburu,
Ngodhe, and Kipkorir (2014) and Oruta (2016)). Furthermore, the EPT species richness was found to balance
more in those sites with long coverage of riparian vegetation cover. The adjacent land use together with the
riparian vegetation cover had great influence which led to site A, E and KS to lack Plecoptera species. Our
result concurs with the one of Genito, Gburek, and Sharpley (2002) who established the decline of aquatic
macroinvertebrates in intolerant taxa (e.g. EPT) with increased agricultural land cover. However, due to the
high complexity of riparian vegetation and its services to ecosystem, there is always high colonization rates,
which in turn support abundant and diverse aquatic macroinvertebrates (Belsel, Usseglio-Polatera, & Moreteau,
2000). In contrast, Sponseller et al. (2001) observe that the increased filamentous green algae production and
the subsequent additional habitat it creates lead to a greater diversity of taxa in agricultural land use streams.
The family richness followed the same trend as the species richness, with KG and E having the highest scores
of Ephemeroptera family richness. Some of the Ephemeroptera family members a wide ecological tolerance
making them survive in stress prone areas. But still site A had lowest family richness due to the nutrients from
sugar cane plantation.
6. CONCLUSION
This study established that, riparian vegetation cover had an influence on benthic macroinvertebrate
assemblages. The sensitive species were found to be significantly correlated with the riparian vegetation cover
type. The sites good vegetation cover and well maintained riparian vegetation supported more species and taxa
compared to those with poor vegetation. However, the adjacent land use also affected the assemblages with
those sites with more agricultural inputs having poor representation of species. Furthermore, our study
established that there was a significant difference in macroinvertebrate assemblages between the sites which
had 'Excellent', 'Good' and 'Poor' riparian vegetation cover. Sites with 'Poor' riparian vegetation cover suffered
from lack of large woody debris which reduced substrate for feeding, attachment, and cover; caused loss of
sediment and organic material storage; reduced energy dissipation and therefore impacted on the distribution
Researchjournali’s Journal of Ecology
Vol. 4 | No. 1 February | 2017 18
www.researchjournali.com
of habitats. Our study concluded that, for management and restoration actions to be effective, we must diagnose
cause as well as assess harm, which requires an improved understanding of the mechanisms through which land
use impacts stream ecosystems. This may necessitate studies to examine the response of individual species,
family and order to better connect the chain of influence from land use to stream response. Such innervations
are of particular importance since riparian management has a direct influence on stream condition via well-
documented path- ways and because it promises benefits that are highly disproportionate to the land area
required. Such management should ensure continuity of the riparian vegetation cover to provide migratory
routes for the colonizers and limit gaps where storm water may drain into streams bypassing the riparian zone
and diminishing its effectiveness. This knowledge is important to the community and water resource managers
as it will yield information on effect of planted riparian zone vegetation on protecting the river health which
may lead to the replication of the same project in other watersheds.
7. REFERENCES
Acũna, V., Díez, J. R., Flores, L., Meleason, M., & Elosegi, A. (2013). Does it make eco-nomic sense to restore rivers for their ecosystem services? .
Journal Appl. Ecol., 1365-2664.
Angradi, T. R., Bolgrien, D. W., Jicha, T. M., Pearson, M. S., Taylor, D. L., Moffett, M. F., . . . Hill, B. H. (2011). Anassessment of stressor extent and
biological condition in the North American mid-continent great rivers (USA). River Syst, 19, 143-163
Aura, C. M., Raburu, P. O., & Herrmann, J. (2010). A preliminary macroinvertebrate Index of Biotic Integrity for bioassessment of the Kipkaren and
Sosiani Rivers, Nzoia River basin, Kenya. Lakes & Reservoirs: Research and Management, 15, 119-128.
AustralianGovernment. (2001). Queensland Australian River Assessment System (AusRivAS) Sampling and Processing Manual, August 2001.
Baptista, D. F., Buss, D. F., Egler, M., Giovanelli, A., Silveira, M. P., & Nessimian, J. L. (2007). A multimetric index based on benthic macroinvertebrates
for evaluation of Atlantic Forest streams at Rio de Janeiro State, Brazil. Hydrobiologia, 575, 83-94.
Barbour, M. T., & Stribling, J. B. (1993). A technique for assessing stream habitat structure. In: Jungwirth, M., Muhar, S., & Schmutz, S. (2002). Re-
establishing and assessing ecological integrity in riverine landscapes. National Association of Conservation Districts, Washington, DC., 156-178.
Baxter, C. V., Fausch, K. D., & Saunders, W. C. (2005). Tangled webs: reciprocal flows of invertebrate prey link streams and riparian zones. Fresh
Water Biology, 86(50), 201–220.
Belsel, J. N., Usseglio-Polatera, P., & Moreteau, J. C. (2000). The spatial heterogeneity of river bottom: a key factor determining macroinvertebrate
communities. Hydrobiologia, 442(423), 163-171.
Biervliet, O. V. (2009). Effects of Tea Plantations on Stream Invertebrates in a Global Biodiversity Hotspot in Africa. Biotropica, 41(4), 469-475
Bourque, C. P. A., & Pomeroy, J. H. (2001). Effects of forest harvesting on summer stream tem- peratures in New Brunswick, Canada: an inter-catchment,
multiple-year comparison. Hydrol. Earth Syst. Sci., 5(5), 599-613.
Bunn, S. E., Abal, E. G., Smith, M. J., Choy, S. C., Fellows, C. S., Harch, B. D., . . . Sheldon, F. (2010). Integration of science and monitoring of river
ecosystem health to guide investments in catchment protection and rehabilitation. Freshwater Biology, 55, 223-240.
Bunn, S. E., Davies, P. M., & Mosisch, T. D. (1999). Ecosystem measures of river health and their response to riparian and catchment degradation.
Freshwater Biology, 41, 333-345.
Clarke, K. R., Somerfield, P. J., & Chapman, M. G. (2006). On resemblance measures for ecological studies, including taxonomic dissimilarities and a
zero-adjusted Bray–Curtis coefficient for denuded assemblages. Journal of Experimental Marine Biology and Ecology, 330(2006), 55-80.
Davies, P. E., Harris, A. J. H., Hillman, T. J., & Walker, K. F. (2010). The sustainable rivers audit: assessing river ecosystem health in the Murray-
Darling Basin, Australia. Mar Freshw Res, 61, 764-777.
Dudgeon, D., Arthington, A. H., Gessner, M. O., Kawabata, Z., Knowler, D. J., L, C., . . . Sullivan, C. A. (2006). Freshwater biodiversity: importance,
threats, status and conservation challenges. Biological Reviews, 81(02), 163-182. doi: 10.1017/S1464793105006950
Researchjournali’s Journal of Ecology
Vol. 4 | No. 1 February | 2017 19
www.researchjournali.com
Findlay, S., Quinn, J. M., Hickey, C. W., Burrell, G., & Downes, M. (2001). Effects of land use and ri- parian flowpath on delivery of dissolved or- ganic
carbon to streams. Limnol. Oceanogr, 46, 345-355.
Füreder, L., & Reynolds, J. D. (2003). Is Austropotamobius pallipes a good bioindicator? Bulletin Français de la Pêche et de la Pisciculture, 370-371,
157-163.
Genito, D., Gburek, W. J., & Sharpley, A. N. (2002). Response of stream macroinvertebrates to agricultural land use in small watershed. J. Freshwater
ecology, 17, 109-119.
Government-of-Kenya. (1984). Kimilili 88/1, Bungoma 88-3, Elgon 74-3. East Africa 1:50,000 (Kenya). Nairobi: Survey of Kenya, Nairobi.
Greenway, M. (2004). Constructed Wetlands for Water Pollution Control - Processes, Parameters and Performance. Dev. Chem. Eng. Mineral process,
12(5/6), 1-14.
Growns, I., Rourke, M., & Gilligan, D. (2013). Toward river health assessment using species distributional modeling. Ecological Indicators, 29, 138-
144. doi: 10.1016/j.ecolind.2012.12.024
Hilsenhoff, W. L. (1988). Rapid field assessment of organic pollution with a family-level biotic index. J. N. Am. Benthol. Soc., 7, 65-68.
Hilty, J., & Merenlender, A. (2000). Faunal indicator taxa selection for monitoring ecosystem health. Biological Conservation, 92, 185-197.
Hrodey, P. J., Sutton, T. M., Frimpong, E. A., & Simon, T. P. (2009). DameLand-Use Impacts on Watershed Health and Integrity in Indiana Warmwater
Streams. American Midland Naturalist, 161(1), 76-95.
Johnson, L. B., Breneman, D. H., & Richards, C. (2003). Macroinvertebrate community structure and function associated with large wood in low gradient
streams. River Res. Appl., 19, 199- 218.
Johnson, R. K., Widerholm, T., & Rosenberg, D. M. (1993). Freshwater biomonitoring using individual organisms, populations, and species assemblages
of benthic macroinvertebrates. In D. M. Rosenberg, Resh, V. H. (Ed.), Freshwater Biomonitoring and Benthic Macroinvertebrates (pp. 40-158). New
York: Chapman and Hall.
Jungwirth, M., Muhar, S., & Schmutz, S. (2002). Re-establishing and assessing ecological integrity in riverine landscapes. Freshwater Biology, 47, 867-
887.
Kilonzo, F., Masese, F. O., Griensven, A. V., Bauwens, W., Obando, J., & Lens, P. N. L. (2014). Spatial–temporal variability in water quality and macro-
invertebrate assemblages in the Upper Mara River basin, Kenya. Physics and Chemistry of the Earth, 67-69(2014), 93-104.
Kim, J. H., Yeom, D. H., & An, K. G. (2014). A new approach of Integrated Health Responses (IHRs) modeling for ecological risk/health assessments
of an urban stream. Chemosphere, 108(2014), 376-382.
Ladson, A. R., & White, L. J. (1999). An Index of Stream Condition: Reference Manual. (9780731143184). Victoria. Dept. of Natural Resources
Environment. Waterways Unit: Waterways Unit, Department of Natural Resources and Environment Retrieved from
http://books.google.com.au/books?id=OaV_AAAACAAJ.
Lazdinis, M., & Angelstam, P. (2005). Functionality of riparian forest ecotones in the context of former Soviet Union and Swedish forest management
histories. Forest Policy and Economics, 7(3), 321-332.
Maguran, A. E. (1988). Ecological diversity and its measurement. London: Springer.
Makoba, H., Shivoga, W. A., Muchiri, M., & Miller, S. N. (2008). Use of Benthic Macroinvertebrates as indicators of water quality in river Njoro,
Kenya. Paper presented at the Taal 2007: The 12th World Lakes Conference
Margalef, R. (1956). Informacion y diversidad sepecifica en las communidades de organismos. Investigacion pesquera, 3, 99-106.
Masese, F. O., Kitaka, N., Kipkemboi, J., Gettel, G. M., Irvine, K., & McClain, M. E. (2013). Macroinvertebrate functional feeding groups in Kenyan
highland streams: evidence for a diverse shredder guild. Freshwater Science, 33(2), 435-450.
Masese, F. O., Muchiri, M., & Raburu, P. O. (2009). Macroinvertebrate assemblages as biological indicators of water quality inthe Moiben River, Kenya.
African Journal of Aquatic Science, 34(1), 15-26.
Masese, M. O., Kitaka, N., Kipkemboi, J., Gettela, M. G., Irvine, K., & McClain, M. E. (2014). Litter processing and shredder distribution as indicators
of riparianand catchment influences on ecological health of tropical streams. Ecological Indicators, 46, 23-37.
Mason, C. F. (2002). Biology of freshwater pollution (4th Ed. ed.). Essex London: Pearson Education Ltd.
Mathooko, J. M. (1998). Mayfly diversity in East Africa. Africa Journal of Ecology, 36, 368-370.
Metcalfe-Smith, J. L. (1996). Biological water quality assessment of rivers: use of macroinvertebrate communities. In G. Petts & P. Calow (Eds.), River
restoration (pp. 17-43 ). Oxford: Blackwell Science.
Minaya, V., MClain, M. E., Moog, O., Omengo, F., & Singer, G. A. (2013). Scale-dependent effects of rural activities on benthic macroinvertebrates
and physico-chemical characteristics in headwater streams of the Mara River, Kenya. Ecological Indicators, 32, 116-122.
Researchjournali’s Journal of Ecology
Vol. 4 | No. 1 February | 2017 20
www.researchjournali.com
Monoury, N. N., Gilbert, F., & Lecerf, A. (2014). Forest canopy cover determines invertebrate diversity and ecosystem process rates in depositional
zones of headwater streams. Freshwater Biology, 2014(59), 1532-1545
Morse, J. C., Bae, Y. J., Munkhjargal, G., Sangpradub, N., Tanida, K., Vshivkova, T. S., . . . Yule, C. M. (2007). Freshwater biomonitoring with
macroinvertebrates in East Asia. Front. Ecol. Environ, 5, 33-42.
Naiman, R. J., & Decamps, H. (1997). The ecology of interfaces: Riparian Zones Annual Review of Ecology and Systematics, 28, 621-658.
Narangarvuu, D., Hsu, C., Shieh, S. H., Wuc, F. C., & Yang, P. S. (2014). Macroinvertebrate assemblage patterns as indicators of water quality in the
Xindian watershed, Taiwan. Journal of Asia-Pacific Entomology, 17, 505-513.
Ndaruga, A. M., Ndiritu, G. G., Gichuki, N. N., & Wamich, W. N. (2004). Impact of water quality on macro-invertebrate assemblages along tropical
stream in Kenya. African Journal of Ecology, 42, 208-216.
Ndebele-Murisa, M. R. (2012). Biological monitoring and pollution assessment of the Mukuvisi River, Harare, Zimbambwe. Lakes & Reservoirs:
Research and Management, 17, 73-80.
Newham, M. J., Fellows, C. S., & Sheldon, F. (2011). Functions of riparian forest in urban catchments: a case study from sub-tropical Brisbane, Australia.
Urban Ecosyst, 14, 165-180. doi: 10.1007/s11252-010-0151-6
Nojiyeza, S. (2013). Community river restoration. (PhD), University of KwaZulu-Natal, Durban, South Africa.
Nyakora, J. O., & Ngaira, J. (2014). Assessing the achievement of integrated watershed management tool for sustainable management of water resources
in Kuywa River, Western Kenya. Herald J. Geogr. Rgnl. Plann., 3(4), 140 - 157
Oruta, J. N. (2016). Is the Sosiani River healthy? Investigating the relationship between water quality indicators and macroinvertebrate assemblages in
the Sosiani River. International Journal of Geography and Geology, 2016, 5(12), 259-280.
Orwa, P. O., Raburu, P. O., Kipkemboi, J., Rongoei, P., Okeyo-Owuor, J. B., & Omari, S. (2013). Use of macroinvertebrate assemblage to assess the
ecological integrity of Nyando Wetlands, Kenya. J. Ecol. Nat. Environ., 5(7), 152-164.
Orwa, P. O., Raburu, P. O., Ngodhe, O. S., & Kipkorir, R. (2014). Impacts of human activities on macroinvertebrate community structure along
Chepkoilel River Swamp, Kenya. International Journal of Water Resources and Environmental Engineering, 6(10), 252-260.
Raburu, P. O., Masese, F. O., & Mulanda, C. A. (2009). Macroinvertebrate Index of Biotic Integrity (M-IBI) for monitoring rivers in the upper catchment
of Lake Victoria Basin, Kenya. Aquatic Ecosystem Health & Management, 12(2), 197-205.
Raven, P. J., Fox, O. P., Everard, M., Holmes, N. T. H., & Dawson, F. H. (1997). River habitat survey: a new system for classifying rivers according to
their habitat quality. In:Jungwirth, M., Muhar, S., & Schmutz, S. (2002). Re-establishing and assessing ecological integrity in riverine landscapes. . The
Stationary Office, Edinburgh., 215-234.
Rosenberg, D. M., & Resh, V. H. (1993). Freshwater Biomonitoring and Benthic Macroinvertebrates. New York: Chapman and Hall.
Sabo, J. L., Sponseller, R., Dixon, M., Gade, K., Harms, T., Heffernan, J., . . . J., W. (2005). Riparian zones increase regional richness by harboring
different, not more, species. Ecology, 86, 56-62.
Sanchez-Arguello, R., Cornejo, A., Pearson, R. G., & Boyero, L. (2010). Spatial and temporal variation of stream communities in a human-affected
tropical watershed.
SEPA. (2003). Environmental Handbook for Monitoring: Site Descriptions (Version 1:5 2003-09-25), Program,Swedish. Freshwater:, 1-17
Sheldon, F., Boulton, A. J., & Puckridge, J. T. (2002). Conservation value of variable connectivity: aquatic invertebrate assemblages of channel and
floodplain habitats of a central Australian arid-zone river, Cooper Creek. Biological Conservation, 103, 13-31.
Sheldon, F., & Fellows, C. S. (2010). Water quality in two Australian dryland rivers: spatial and temporal variability and the role of flow. Marine
Freshwater Research, 61, 864-874.
Sheldon, F., Peterson, E. E., Boone, E. L., Sippel, S., Bunn, S. E., & Harch, B. D. (2012). Identifying the spatial scale of land use that most strongly
influences overall river ecosystem health score. doi: 10.1890/11-1792.1
Smith, M. J., Kay, W. R., Edward, D. H. D., Papas, P. J., Richardson, K., St, J., . . . Halse, S. A. (1999). AusRivAS: using macroinvertebrates to assess
ecological condition in rivers in Western Australia. Freshwater Biology, 41, 269-282.
Sponseller, R. A., Benfield, E. F., & Valett, H. M. (2001). Relationship between land use, spatial scale and stream macroinvertebrate communities.
Freshwater Biology, 2001(46), 1409-1424.
Stauffer, J. C., Goldstein, R. M., & Newman, R. M. (2000). Relationship of wooded riparian zones and runoff potential to fish community com- position
in agricultural streams. Can. J. Fish. Aquat. Sci., 57, 307-316
Sutherland, A. B., Meyer, J. L., & Gardiner, E. P. (2002). Effects of land cover on sediment regime and fish assemblage structure in four south- ern
Appalachian streams. Freshw. Biol., 47, 1791-1805.

Researchjournali’s Journal of Ecology
Vol. 4 | No. 1 February | 2017 21
www.researchjournali.com
Törnblom, J., Angelstam, P., Degerman, E., Henrikson, L., Edman, T., & Temnerud, T. (2011). Catchment land cover as a proxy for macroinvertebrate
assemblage structure in Carpathian Mountain streams. Hydrobiologia, 2011(673), 153-168.
Wantzen, K. M., Ramirez, A., & Winemimller, K. O. (2006). New vistas in Neotropical stream ecology - Preface. J. N. Amer. Benthol. Soc., 25, 61-65.
Water Resources Management Authority, W. (2011). Water Abstraction Survey for Kuywa Watershed. Kakamega: WRMA.
Xu, S., & Liu, Y. (2014). Assessment for river health based on variable fuzzy set theory. Water Resources, 41(2), 218-224. doi:
10.1134/S0097807814020134
Zamora-Muñoz, C., Sáinz-Cantero, C. E., Sánchez-Ortega, A., & Alba-Tercedor, J. (1995). Are biological indices BMPW' and ASPT' and their
significance regarding water quality seasonally dependent? Factors explaining their variations. Water Res., 29, 285-290.
Zhao, G. J., Mu, X. M., Tian, P., Jiao, J. Y., & Wang, F. (2013). Have conservation measures improved Yellow River health? Journal of Soil and Water
Conservation, 68(6), 159A-161A. doi: 10.2489/jswc.68.6.159A
Zhao, Y. W., Yang, Z. F., & Yao, C. Q. (2005). Basic frameworks of health assessment and restoration of Yellow River. J Soil Water Conserv, 19(5),
131-134.