Embed Size (px)
Citation preview

RELATIONSHIP BETWEEN RISK MANAGEMENT AND THE FINANCIAL
PERFORMANCE OF THE INSURANCE COMPANIES IN KENYA
BY
JAMES NJUI MBURU
D61/74648/2014
A RESEARCH PROJECT PRESENTED IN PARTIAL FULFILLMENT OF THE
REQUIREMENT FOR THE AWARD OF MASTERS OF BUSINESS
ADMINISTRATION, UNIVERSITY OF NAIROBI
OCTOBER 2016

ii
DECLARATION
This research project is my original work and has not been submitted for an award of a
degree in any other university.
SIGNATURE….……………………………….. DATE…………………………….
JAMES N. MBURU
D61/74648/2014
This research project has been submitted for examination with my approval as the
university supervisor
SIGNATURE….……………………………….. DATE…………………………….
DR. WINNY NYAMUTE
UNIVERSITY OF NAIROBI
iii
ACKNOWLEDGEMENTS
My appreciation goes to my supervisor Dr. Winny Nyamute for her great contribution
and support she extended in development of this research paper. Without her guidance
this research project would not have been achievable.

iv
DEDICATION
To my wife, Elizabeth, my daughter Mitchelle and my Son Allen for your patience and
encouragement throughout my MBA study. Wish you God blessings.

v
TABLE OF CONTENTS
LIST OF TABLES ......................................................................................................... viii
ABSTRACT ...................................................................................................................... ix
CHAPTER ONE ............................................................................................................... 1
INTRODUCTION............................................................................................................. 1
1.1 Background to the Study ...................................................................................... 1
1.1.1 Risk Management ......................................................................................... 2
1.1.2 The Financial Performance ........................................................................... 3
1.1.3 Link between Financial Performance and Risk Management ...................... 5
1.1.4 Kenyan Insurance firms ................................................................................ 6
1.2 Research problem ................................................................................................. 7
1.3 Objective of the study ............................................................................................... 9
1.4 The Value of the current study .................................................................................. 9
CHAPTER TWO ............................................................................................................ 11
LITERATURE REVIEW .............................................................................................. 11
2.1 Introduction ........................................................................................................ 11
2.2 Theoretical Review ............................................................................................ 11
2.2.1 The Modern Portfolio Theory ..................................................................... 11
2.2.2 Moral Hazard Theory .................................................................................. 14
2.2.3 Merton‟s Default Risk Model ..................................................................... 15
2.3 Determinants of Financial Performance ............................................................. 17
vi
2.3.1 Economic Condition ................................................................................... 17
2.3.2 Corporate Governance ................................................................................ 18
2.3.3 Structure of Ownership ............................................................................... 18
2.3.4 Policies and Characteristics of the Firm ..................................................... 19
2.3.5 Risk Management ....................................................................................... 19
2.4 Empirical Literature Review .............................................................................. 20
2.5 Summary of Literature Review .......................................................................... 23
2.6 Conceptual Frame work ..................................................................................... 25
CHAPTER THREE ........................................................................................................ 26
RESEARCH METHODOLOGY .................................................................................. 26
3.1 Introduction ........................................................................................................ 26
3.2 Research Design ................................................................................................. 26
3.3 Population........................................................................................................... 26
3.4 Data Collection ................................................................................................... 27
3.5 Data analysis ...................................................................................................... 27
3.5.1 Analytical Model ........................................................................................ 28
3.5.2 Test of Significance .................................................................................... 29
CHAPTER FOUR ........................................................................................................... 30
DATA ANALYSIS AND FINDINGS ............................................................................ 30
4.1 Introduction ........................................................................................................ 30
4.2 Demographic Analysis ....................................................................................... 30
4.3 Risk Management Practices ............................................................................... 31
4.4 Effect of The management of risk on Performance ........................................... 38

vii
CHAPTER FIVE ............................................................................................................ 42
SUMMARY,CONCLUSION,AND RECOMMENDATIONS ................................... 42
5.1 Introduction ........................................................................................................ 42
5.2 Summary of Findings ......................................................................................... 42
5.3 Conclusions ........................................................................................................ 43
5.4 Limitation of the Research ...................................................................................... 43
5.5 Recommendations .............................................................................................. 44
5.6 Suggestions for Further Research ...................................................................... 45
REFERENCES ................................................................................................................ 47
APPENDICES ................................................................................................................. 51
Appendix 1: Insurance firms in Kenya ..................................................................... 51
Appendix 2: Questionnaire ....................................................................................... 54
Appendix 3: Data ...................................................................................................... 61

viii
LIST OF TABLES
Table 1: Gender ............................................................................................................ 30
Table 2: Experience ...................................................................................................... 31
Table 3: Risk management practices ............................................................................ 32
Table 4: Risk management environment, procedures and policies .............................. 33
Table 5: Risk mitigation ............................................................................................... 34
Table 6: Risk monitoring .............................................................................................. 35
Table 7: Internal control ............................................................................................... 36
Table 8: Risk measurement........................................................................................... 37
Table 9: Risk investment strategy and guidelines ........................................................ 38
Table 10: Correlation matrix ....................................................................................... 39
Table 11: Model summary .......................................................................................... 40
Table 12: ANOVA ...................................................................................................... 40
Table 13: Coefficients ................................................................................................. 41

ix
LIST OF ABBREVIATIONS
AKI Association of Kenya insurers
ANOVA Analysis of Variance
CAPM Capital Asset Pricing Model
IRA Insurance Regulatory Authority
Ltd Limited Company
MPT Modern Portfolio Theory
NSE Nairobi Securities Exchange
RM Risk Management
ROA Return on Assets
ROE Return on owner's equity
x
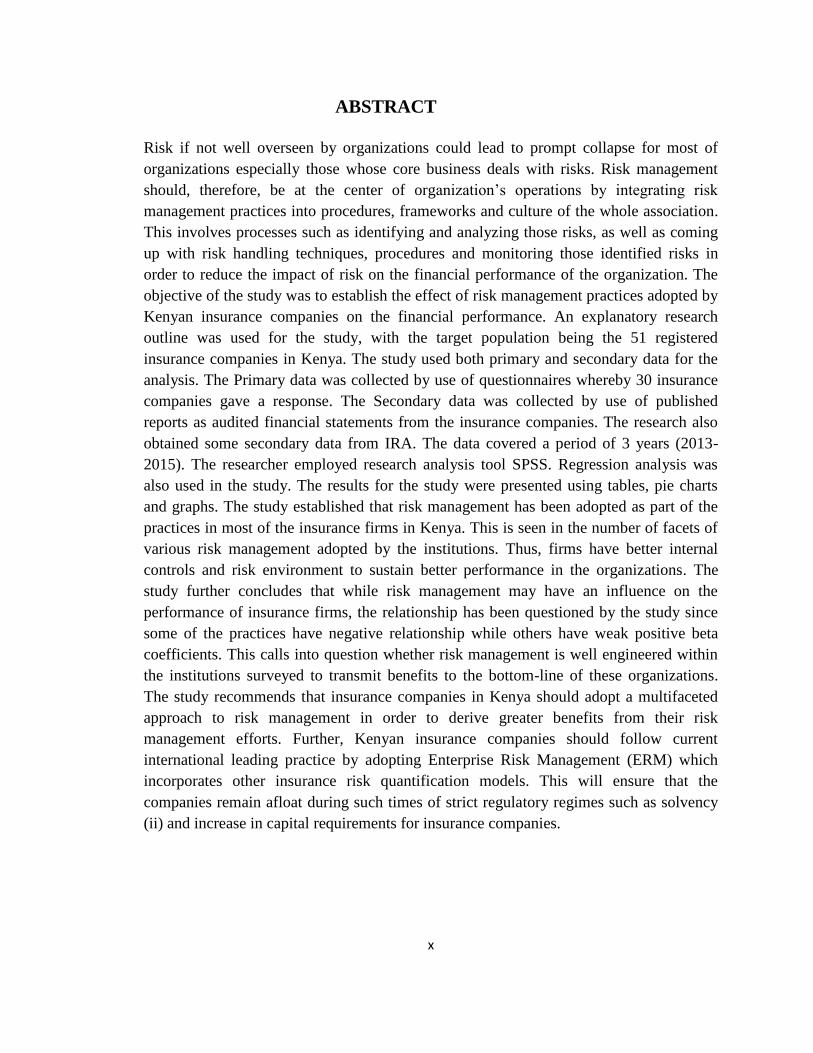
ABSTRACT
Risk if not well overseen by organizations could lead to prompt collapse for most of
organizations especially those whose core business deals with risks. Risk management
should, therefore, be at the center of organization‟s operations by integrating risk
management practices into procedures, frameworks and culture of the whole association.
This involves processes such as identifying and analyzing those risks, as well as coming
up with risk handling techniques, procedures and monitoring those identified risks in
order to reduce the impact of risk on the financial performance of the organization. The
objective of the study was to establish the effect of risk management practices adopted by
Kenyan insurance companies on the financial performance. An explanatory research
outline was used for the study, with the target population being the 51 registered
insurance companies in Kenya. The study used both primary and secondary data for the
analysis. The Primary data was collected by use of questionnaires whereby 30 insurance
companies gave a response. The Secondary data was collected by use of published
reports as audited financial statements from the insurance companies. The research also
obtained some secondary data from IRA. The data covered a period of 3 years (2013-
2015). The researcher employed research analysis tool SPSS. Regression analysis was
also used in the study. The results for the study were presented using tables, pie charts
and graphs. The study established that risk management has been adopted as part of the
practices in most of the insurance firms in Kenya. This is seen in the number of facets of
various risk management adopted by the institutions. Thus, firms have better internal
controls and risk environment to sustain better performance in the organizations. The
study further concludes that while risk management may have an influence on the
performance of insurance firms, the relationship has been questioned by the study since
some of the practices have negative relationship while others have weak positive beta
coefficients. This calls into question whether risk management is well engineered within
the institutions surveyed to transmit benefits to the bottom-line of these organizations.
The study recommends that insurance companies in Kenya should adopt a multifaceted
approach to risk management in order to derive greater benefits from their risk
management efforts. Further, Kenyan insurance companies should follow current
international leading practice by adopting Enterprise Risk Management (ERM) which
incorporates other insurance risk quantification models. This will ensure that the
companies remain afloat during such times of strict regulatory regimes such as solvency
(ii) and increase in capital requirements for insurance companies.

xi

1
CHAPTER ONE
INTRODUCTION
1.1 Background to the Study
In the insurance industry, experience points that sufficient risk administration converges
with wealth protection. The more the growth in wealth, the higher the risk of the business
engaged in managing those risks. Additionally, risk is not only part of the risky control
business, but also demonstrates the ideal chance to those insurance firms with proper and
timely measures to handle risks conclusively.
Internationally, previous research indicates that insurance firms with predictable risk
administration systems bring higher return on equity. Furthermore, there are higher
financial returns in the way business indicators in examination for their rivals who
infrequently provide for incredible significance to risk administration in their business.
Those investigations may be setting off to utilize standardized questionnaires with the
discovery of the amount of the provision about risk management in the insurance
organizations in Kenya and its effect on their financial outcome in the insurance firms.
In broader sense, insurance means taking over risks from customers and other investors.
Insurers determine all available quantifiable factors in consideration while creating
categories of low risk or high-risk profiles in the insurance. The category of risk defines
the amount of insurance premiums charged. In general, pricing of the insurance depends
on the frequency of claims where the policy with high frequency bears higher rates of
premium (Gollier, 2012). In the event that the insurance organizations have access to
large amount of the insured information at hand, the insurers could predict the premiums

2
with precision. In addition to this, insurers collect large amount of information about the
insured and policyholders. Advanced statistical tools and methods based on data mining
techniques of the insurance firms can be used to analyze, predict and determine insurance
policy risk levels of the policyholder (Dennis, 2005).
1.1.1 Risk Management
Omondi (2015) defines risk as a probable harm and a misfortune or any hazardous to the
firm that might not be favorable to the normal functioning of firms and might be reduced
by a preemptive action. Horcher (2005) states that both hazard and exposure are firmly
connected and that in most cases they are used interchangeably. A risk is the likelihood of
loss, while exposure is the possibility occasioned by the misfortune. Risk emerges
because of exposure to the hazard.
Risk management can be defined as the procedure of loss exposures identification
confronted by an organization with an informed view of proper selection of the
practically suitable methodologies for the treatment of these specific exposures
successfully (Rejda, 2003). Insurance indicates to a type of risk exchange where one
party (the insurance company) accepts to repay the other (insured) in the case of a insured
risk occurring in respect to a premium charged in advance (Rejda, 2003). Payment or
compensation occurs only after the insured risk materializes under the agreed
circumstances. Risk management is vital for the insurance industry.
In recent years, insurance firms have amplified their scope on risk management. Okotha
(2003) suggests that risks requires a careful judgment by administration of insurance
3
organizations, with a keen focus on the insurable risks to evade excessive losses claimed
by policyholders. Therefore, risk management is a vital factor in improving financial
performance (Okotha, 2003). Risk-taking establishments may, and do fail whenever risks
profiles are not adequately managed.
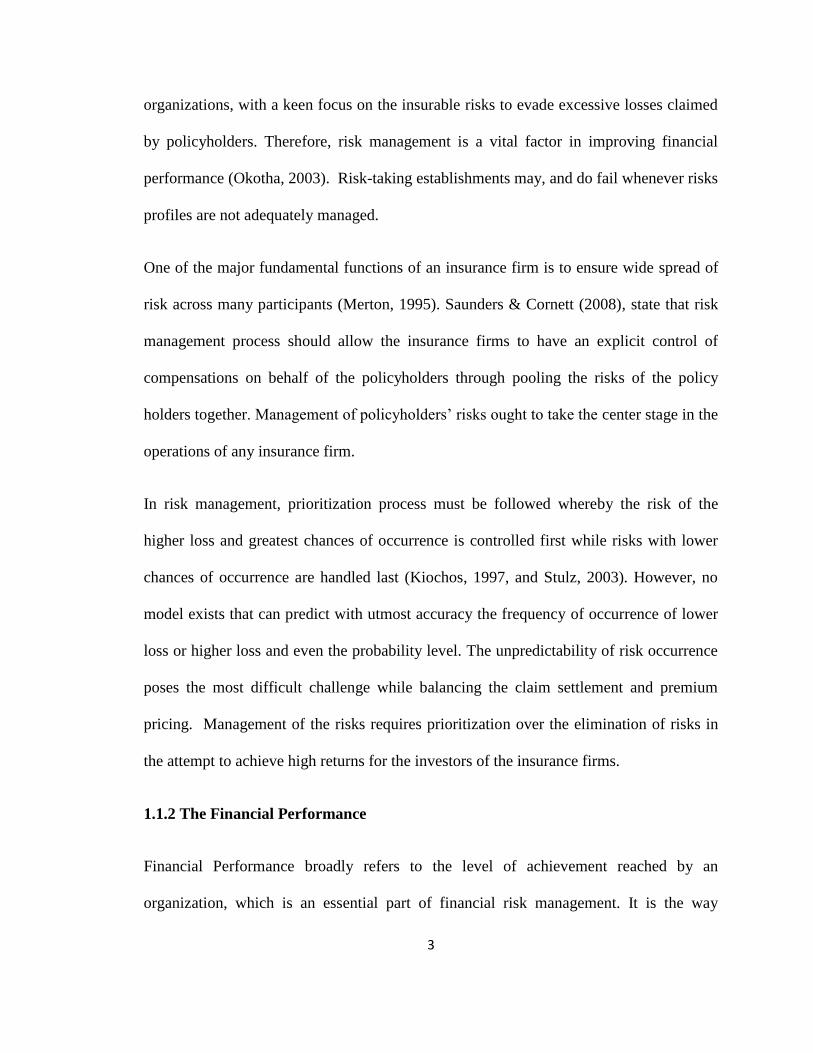
One of the major fundamental functions of an insurance firm is to ensure wide spread of
risk across many participants (Merton, 1995). Saunders & Cornett (2008), state that risk
management process should allow the insurance firms to have an explicit control of
compensations on behalf of the policyholders through pooling the risks of the policy
holders together. Management of policyholders‟ risks ought to take the center stage in the
operations of any insurance firm.
In risk management, prioritization process must be followed whereby the risk of the
higher loss and greatest chances of occurrence is controlled first while risks with lower
chances of occurrence are handled last (Kiochos, 1997, and Stulz, 2003). However, no
model exists that can predict with utmost accuracy the frequency of occurrence of lower
loss or higher loss and even the probability level. The unpredictability of risk occurrence
poses the most difficult challenge while balancing the claim settlement and premium
pricing. Management of the risks requires prioritization over the elimination of risks in
the attempt to achieve high returns for the investors of the insurance firms.
1.1.2 The Financial Performance
Financial Performance broadly refers to the level of achievement reached by an
organization, which is an essential part of financial risk management. It is the way
4
towards evaluating performance of the operations in financial standings and can form the
basis for comparison of firms in the same industry over time. A Financial performance
report outlines the financial outlook of an organization that reports the budgetary
wellbeing of an organization which facilitates different stakeholders and speculators to
take their venture decision. There are various approaches to gauge financial strength, but
all measures should have same consideration.
The Profitability ratios indicate the overall effectiveness of the company. The ratios used
give an overview regarding the net earnings in comparison to debt, assets, shareholders
equity and sales over a fixed period. Profitability ratios create a combination of
evaluation of a company‟s control, growth and success in converting investments into
profit. Lenders are intrigued by profitability ratios since they demonstrate the
organization's ability in repayment of both interest and loaned funds. Shareholders have
special interests towards profitability as investors. Profitability level indicates the speed
and amount of return they expect to get from their investments in the firm. In this
research paper the researcher focused on ROA as a measure of financial performance of
insurance companies.
Return on the owner's equity (ROE) ratio is the Net profit after the taxes divided by Total
shareholders‟ equity (PAT)/ E. The ration is an expectation by shareholders for the
money invested in the firm. Return on the Assets ratio is computed as the Net profit after
taxes divided by the Total assets (PAT)/ (TA). The ratio (ROA) indicates the level of the
operating efficiency for the firm based on all assets employed.
5
1.1.3 Risk Management and Financial Performance
Strengthening of insurance firms financially has suffered due to lack of compliance to the
regulations as risk management continues to expand. However, proper risk management
should ensure strong financial standing as compliance enables the firm to reduce losses.
In managing risks, officers in the insurance firms enhance profitability that culminated to
the value addition for the shareholders. Financial growth is a manifestation of efficiency
in balancing the risk profiles and proper compliance to regulation as set out by various
regulators such as IRA.
Babbel & Santomero (1996) concluded that insurers ought to assess those sorts of
hazards they would face and therefore come up with approaches to oversee them
adequately. They added that insurers have the responsibility of managing risks properly
through accepting and controlling only risks that have a clear prediction. This lowers the
level of risk exposure. According to Stulz (1984), risk administration may be a feasible
financial objective through which firm managers, should pay closer attention to the
normal productivity and the dissemination from claiming firm returns from investments
of better risk handling, subsequently providing for a system for adjusting firm objective
to work alongside the expected risk.
Proper risk management forms a critical part of the day-to-day running of any insurance
business focused on avoidance of the losses. A research by Jolly (1997) indicated that
precautionary strategies not only reduce risks but also drive profitability of the firm.

6
The effectiveness of risk management by insurance firms has a critical outlay of their
financial standing. Gold (1999) creates an assertion that point towards the survival of
insurers through a delicate balance between claims and operational expenses in
connection with amount of premiums collected. Ali & Luft (2002) suggested that the firm
seeks to engage in risk administration and mitigation procedures which results to increase
in shareholders worth.
It is essential for every organization to hold and effectively deal with some level of
hazard in the event that it is to expand its productivity or market esteem for money
related pain is to be mitigated. Risk portfolio administration is a vital capacity of
insurance firms in making esteem for shareholders and arrangement holders.
Organizations operations are presented to risks and if these risks are not moderated, the
organization's financial flow will be in problem. Organizations with viable risks
administration frameworks outdo the peers in the industry as they have proper
mechanisms to tackle any occurrence of any insured risks.
1.1.4 Kenyan Insurance Firms
Although insurance firms in Kenya were originally under the ownership of British
nationals during colonial period, the industry has grown steadily and now boasts of 60
years of existence. The insurance regulatory authority uses the Insurance Act (CAP 847)
to govern, promote and regulate insurance industry in Kenya.
In Kenya, 51 insurance firms, 5 reinsurance companies and 144 insurance brokers are in
operation. There are 6,428 insurance agents in Kenya. The Insurance Regulatory

7
Authority (IRA) is the regulator of all insurance firms in Kenya with a mandate to
supervise, regulate and develops the insurance industry in Kenya. Kenya‟s insurance
penetration stands at 3.1% compared to its peer countries in the Sub-Saharan Africa
region (Insurance Regulatory Authority, 2015). In this study, we are going to focus on all
the insurance firms in the country.
1.2 Research Problem
Risk management is very important for insurance company‟s performance. Over the past
decades, more regulations for insurance companies have been created. The Actuarial
function Guideline issued By IRA took effect in 2013. In addition to Solvency II, a
directive has been worked on for the past several years and is expected to come into
effect in December 2016. There is still no proof that the implementation of Risk
Management (RM) leads to better performance. Therefore, there is a need for further
research to examine the connection between RM implementation and the financial
performance.
There few legislative amendment created in the recent which have affected the Kenyan
insurance field. These incorporate increment in the solvency for long-term backup plans,
Increase in the base capital necessities for insurers, presentation of cash basis policies
which requires that insurance providers only assume the risks once the premiums has
been received, review of the investment limits for short term insurance, change in
taxation rules and policies on life business, charge of tax on dividends earned by financial
institutions and payment of penalties upon late of claims. All the above changes, which
have been acknowledged for directing the insurance agencies, have accompanied a
8
tremendous costs. The expenses incorporate additional measures in alleviating risks in
insurance agencies.
Certain categories of risks presented for mitigation provides a greater opportunity for
high returns to the insurance firm. Once the insurance firm capitalizes on those risks, a
new competitive advantage comes about through improved financial standing of the
company. Proper utilization of the mitigation efforts gives the management of insurance
firms a chance to employ the best practices in maximizing their efficiency in handling
risks.
Studies that have been reviewed in the empirical review shows an existence of
knowledge gap. Wani and Dar (2014) evaluated relationship that exists between the
financial risks and the profitability performance of the Indian insurance firm using
multiple linear regressions model. Imane (2013) studied on the Risk Management
Practices among Jordan companies and their effect on the financial performance. The
study selected credit risk (debt and risk), operational risk (efficiency, income, and price)
liquidity risk (capital, liquidity) and market risks (interest rates, inflation, and financial
crisis) as the independent variables. ROA and ROE were utilized as the dependent
variables for the period of fifteen years from 1998 to 2012.
Locally, Obudho (2014) studied on the relationship between financial risk and financial
performance in Kenyan insurance companies. The research employed a causal study design. The
population for this study was 49 insurance firms in Kenya. Omasete (2014) studied on the effect
of the management of risk and the financial performance of Kenyan insurance firms. A

9
descriptive research design was assumed for this research. The study adopted a census survey
of all the 49 registered insurance firms operating in Kenya.
Empirical studies done in Kenya have focused on the critical aspect of management of
risks and financial performance in the insurance industry. The number of risk
management practices in all the studies were limited to five practices hence the margin of
error has been consistent in all the studies. To reduce the margin of error, this study has
focused on additional risk management practices hence the error term has been minimal
and the results of the study are more precise and accurate in answering the question is
there a relationship between risk management and financial performance in insurance
companies in Kenya?
1.3 Objective of the Study
The goal of the study is to set up the relationship between risk administration and
financial performance of insurance companies in Kenya.
1.4 Value of the Study
This research is of great importance to insurance firms, the public, scholars the insurance
regulators and the active members in the NSE as it offers missing contributions necessary
for the stability of insurance industry. This study creates a significant contribution
towards a clear understanding of best practices while managing risks to achieve better
performance of Insurance firms in Kenya

10
The study will empower the Insurance organizations in Kenya to enhance their risk
administration system and embrace better methodologies to enhance the firms' financial
accomplishment through the risk administration strategies. This will empower the
insurance firms and agencies to perform better in monetary terms
The general population who are the real customers of the services provided by insurance
firms will benefit through moderates premium rates offered by insurance firms as result
of adequate risk management procedures.
The study will be useful to the administration such as regulatory bodies and the
government in setting directions on insurance firms in Kenya. This can be done by IRA
through issuance of new guidelines on RM.
Lastly, the research is an addition to the existing body of knowledge of management of
risk to benefit academicians while aiding further research on risk management in the
insurance sector and the financial sector

11
CHAPTER TWO
LITERATURE REVIEW
2.1 Introduction
This chapter touches on the theoretical review of the research paper whereby the main
theories on the management of risk is briefly discussed, determinants of financial
performance in insurance firms, further Empirical review, and conclusions on the chapter.
Conclusion on this chapter focuses on how this research intends to cover the knowledge
gap and the ways in which this research seeks to bridge an existing knowledge gap. The
review specifies the theory the research shall be based on.
2.2 Theoretical Review
This research was mainly guided by the following theories, the Modern Portfolio Theory,
the Moral Hazard Theory, and Merton's the default Risk Theory. These theories try to
explain the link between the risk management and monetary performance of finances of
Kenyan Insurance firms.
2.2.1 The Modern Portfolio Theory
From technical perspective, Modern Portfolio Theory (“MPT”) includes Portfolio
Selection Theory by Markowitz', presented in 1952, and commitments to the hypothesis
of budgetary resource value development which was developed in 1964 by William
Sharpe's, which came to be known as the "CAPM" ( Capital Asset Pricing Model)
(Veneeya, 2006). The MPT is a venture structure that determines and develops the
speculation portfolios depending on the growth of expected returns of the portfolio and

12
the minimization of the investment risks (Fabozzi, Gupta, & Markowitz, 2002). Also
called "portfolio theory" or "portfolio administration hypothesis," MPT advises that it is
likely to develop a productive collection of ideal portfolios, which offer greatest expected
returns for a set level of risk. It recommends that it is not enough to look at the normal
risks and returns of one specific stock in objectivity. A financial specialist can then
receive the rewards of enhancement from the stocks by putting resources into
diversification, especially by a lessening in the uncertainty of the given portfolio. MPT
measures the advantages got from diversification, otherwise termed as not tying the entire
investments up on a single venture.
A view by most speculators consider the risk part as the proceeds from a venture being
lower than the normal returns or just put the deviation from the normal returns lower than
the anticipated returns. Every stock has its particular standard deviation from its mean.
The standard deviation is known as the risk.
The risk in a portfolio individual stocks will be not be exactly as the risk inherent in
holding any of the individual stocks (on condition that the risks of the different stocks are
not specifically related). Markowitz indicated that venture is not about picking stocks, but
picking the right and particular blend of stocks in a given basket .Specifying arithmetic of
expansion, he suggested that financial specialists concentrate on selecting portfolios since
those portfolios' general risk compensate attributes rather than simply incorporating
portfolios from securities that each independently has alluring risk remunerate qualities.
This envisages that financial specialists ought to concentrate on selecting portfolios not
remain solitary securities. Treating single-period returns for different securities as
13
arbitrary factors, we could allocate those expected qualities, standard deviations, and
relationships. Given these, then we can compute the normal returns and unpredictability
of any portfolio developed with those securities. Out of the whole wicker container of
conceivable portfolios, certain ones will ideally adjust hazard and rewards. These contain
Markowitz effective scope of portfolios. A proposed speculator ought to choose any of
the portfolios that lie on the productive scope.
Tobin (1958) extended the work of Markowitz's work by adding a risk-free resource for
the examination. It, therefore, made it conceivable to influence or deleverage portfolios
on the efficient frontier. This prompted the ideas of a super-effective portfolio and the
capital market line. Through influence, securities on the capital market line can
outperform portfolio on the effective scope (Sharpe, 1964) formalized the capital
resource evaluating model (CAPM).
As per the CAPM, all speculators ought to maintain the market portfolio, utilized or
deleveraged with circumstances of the risk-free resource. Portfolio theory gives a setting
to the comprehension of the connections of the reward and the systemic risk involved. It
has molded how institutional portfolios are run and persuaded the utilization of passive
investment methods. The arithmetic of portfolio analysis is utilized as a part of money
related risks administration and was a possible antecedent for current value-at-risk
procedures.

14
2.2.2 Moral Hazard Theory
In economics, moral hazard is defined as when one individual goes out taking extra risks
because another person bears the cost of those risks. An ethical risk may happen where
the activities of one party may change to the impediment of another party taking a
powerful part in any financial exchanges.
Moral hazard happens under information asymmetry through which the higher risk-taker
in the transaction has more information about its goals than the other party paying dearly
of the risks. Paul Krugman (2009) portrayed this as “any circumstance in which one
individual settle on the choice about how much risk to take, while the risk is borne by the
other party.
The insufficient control of moral hazards frequently prompts unnecessary risk and
individual taking additional was a recurring theme in the modern financial crisis Wolf
(2008) suitably cautions that no other industry yet apart from finance has an equal ability
for privatizing additions and mingling misfortunes. Rather than creating value, as per the
guaranteed outlook, the acts of financial related designing (organized finance and elective
risk exchange), immense influence, forceful bookkeeping and doubtful credit assessment
have empowered their professionals to concentrate esteem on a gigantic scale. At
whatever point the client cannot viably screen the exercises of his agent, accordingly, the
last has a motivating force to build his fiscal earnings to the detriment of the former.
The insurance contract forms a basis for the moral hazard regarding the agency model.
Here the insurance firm is the less educated client, and the safeguarded individual is the

15
agent. Automotive insurance, for instance, makes a moral hazard for drivers; it makes an
extra motivator for hazardous driving because other individuals comprising of different
customers of the insurance firm will pay a part of the expenses of the agent‟s accidents.
Essentially, within sight of unemployment insurance contract, the unemployed client has
an extra motivator to remain unemployed because other individuals will pay part of their
living expenses Then again, within sight of medical coverage, guaranteed individuals will
have an extra motivator to take part in unsafe exercises or ways of life since others will
pay costs of the treatment if there should be an occurrence of ailment..
2.2.3 Merton’s Default Risk Model
Merton, a financial researcher in 1970s, created the model and it is utilized as a part of
the assessment of credit risks among home loan firms and corporations. The model used
to decide the capacity of debt holders to clear their obligations. The loan officers and
securities experts focused on deciding an organization's repayment failure by use of
Merton's model. The model permits the experts to better position the organization and
decides its capacity to stay solvent through the examination of reported obligation totals
and payment dates.
Merton's (1974) paper on the valuation of corporate securities is one of his various
fundamental commitments to finance. In his paper, Merton came up with two interrelated
inquiries in finance. To begin with, by what means would it be advisable for one to
approach understanding and clarifying credit spreads? Second, in what capacity would it
be advisable for one to consider the plan of the association's capital structure? Merton
was worried about seeking after the ideal capital structure of a firm.
16
A noteworthy benchmark in these studies is the KMV (Kealhofer, McQuown and
Vasicek), a San Francisco-based risk administration firm. KMV was established in 1989
to offer the business extension of Merton's model utilizing market-based information. In
2002, it was expanded by Moody's and got to be Moody's-KMV. Hillegeist, Keating,
Cram, and Rundstedt (2004) looked at the comparison that existed between the Merton
model to Ohlson (1980) and Altman (1968) models (Z-score and O-score) and arrived at
the deduction that the Merton display beats these models. Duffie et al. (2007)
demonstrated that macroeconomic factors that include, financing cost, stock return, and
stated market return have predictable expectation capacity even in the wake of controlling
for Merton model.
Campbell et al. (2007), utilizing a risk model, joined Merton display likelihood of default
with different factors significant to default expectation. They likewise observed that
Merton display probabilities had a moderately little commitment to the prescient power.
Bharath and Shumway (2008) introduced a "gullible" use of Merton model that beat the
intricate utilization of Merton model (in light of apparently Moody's-KMV
determinations)
In light of the assumptions, this research is founded on hypothesis number three, Merton's
default Risk Model. Merton model depends on some improving suspicions about the
structure of the normal company's funds. The occasion of default is dictated by the
market estimation of the company's advantages in conjunction with the obligation
structure of the firm. At the point when the estimation of the benefits falls beneath a
specific limit (the default point), the firm is thought to be in default. One reason for

17
default as expressed by Merton is credit hazard, which frames part of the risks confronted
by insurance firms in Kenya.
2.3 Determinants of Financial Performance
Financial growth of firms is critical for speculators, stakeholders and economy on its
entirety. For financial investment, the arrival on their predictions is exceedingly
substantial, and well achieving firms can draw high and long-term yields for their risk-
takers. Researches by Maher and Andersson (2000) and Javed and Iqbal (2007), have
indicated different non-budgetary components that can help or adversely affect the
accomplishment of the organization. Still no single compelling model has been built up
that catches extreme variety of the performance. In this research, factors such as
economic condition, ownership structure, policies, corporate governance, Firm
characteristics, and the management of risk forms discussion of this research.
2.3.1 Economic Condition
Economic standing of any nation can influence a company's performance on different
cost of borrowings, for instance, higher loan prices can contrarily influence the
company's capacity to create capital and put resources into ventures (Ntim, 2009). Prices
of essential services, high expenses connected with plant and hardware because of either
decay of coin. Import prices, high swelling rate and low-salary level of individuals can
diminish the interest for modern products and consequently obstinately affect the firm‟s
performance (Forbes, 2002). Insurance firms in Kenya have been highly affected by
inflation rates and the financial and the stiff competition.

18
2.3.2 Corporate Governance
Corporate governance concerns the arrangements and policies that direct how a firm sets
its strategies, creates systems and missions, screens and reports its implementation, and
deal with internal risks (Javed & Iqbal, 2007). Researchers are additionally of the view
that great corporate supervision sharpens the achievement of better performance of the
firm.
There are two models of corporate structure shareholder model and partner‟s model.
Shareholder approach concentrates on the value increase for proprietors while partner
approach covers more extensive angle and concerns the welfare of all stakeholders and
general firm accomplishment (Maher & Andersson, 2000).
A research led by Javed and Iqbal (2007) investigated effect of corporate administration
on firm execution by making files for board qualities, sincerity and proper disclosures.
Significances of their research supported a critical connection amongst performance and
records aside from straightforwardness and proper disclosures.
2.3.3 Structure of Ownership
Splitting up of ownership into categories lays on the view that there is distinct separation
of control and possession. Berle and Means came up with a division of possession and
distinguished two sorts in particular, Owner-controlled firms and government controlled
firms.

19
As indicated by agency theory, if supervisors of a firm happen to have possession stake
they are well on the way to increase shareholder value (Dutta, Sefton, & Weale, 1999).
Administrative risk avoidance and requirements on the earnings confine their
responsibility. Besides, ownership can turn out to be expensive for larger firms (Jensen &
Murphy, 1990). Number of tradable shares is contrarily identified with inside ownership,
as the greater part of the shares claimed by insiders is limited from the trading.
2.3.4 Policies and Characteristics of the Firm
Some firm attributes are connected with the growth of firm financially. These incorporate
development rate, size, profits, liquidity (Gurbuz et al., 2010) and deals. The policies that
have better development rate can manage the price of improved systems, and gradually
the benefits and size of the firm increases. Substantial firms engage skilled administrators
and officers who eventually add to the accomplishment of the firm performance. In this
way, the firm and its workers add value to each other's objectives (Succuro, 2010)
2.3.5 Risk Management
The management of risk portfolio of an insurance firm affects its performance. Unsafe
firms have a tendency to pull in just hazard taking financial specialists. The relationship
of returns and risk must be watched over so that the financial specialists do get the
expected value with the risk they are bearing. Risk administration has been a key
determinant in the performance of Kenya Insurance firms, because of the hazardous way
of insurance field.

20
2.4 Empirical Literature Review
Several studies have been done internationally and locally. We start by reviewing studies
done internationally then by studies done locally in line with the topic of research.
Ai & Brockett, (2008) established that there are multiple types of non-financial risks.
They include the hazard risk, and strategic risk operational risk. Ai & Brockett, (2008)
found that hazard risk refers to physical risks like theft, fire, liability claims, and business
interruptions, among others. Operational risk is risk of failure coming about because of
the insufficient or weak internal procedures and structures or from external incidents.
This can incorporate inside and outside misrepresentation, items and business rehearses,
harm to physical resources, business disturbance and framework disappointments, and
execution, conveyance and process administration. They also stated that Strategic risk is
closely related to the firm„s overall strategies. Reputation risk, competition risk and
regulatory risk are included in the strategic risk.
Eling & Schmeiser (2010) established that insurance firms were less affected than banks
when it comes to financial failure. This is because of the difference in business models.
Insurance firms are financed ahead of time and the installments are connected to future
claims with a prediction model. Likewise, as indicated by Elling and Schmeiser (2010),
numerous back up plans do not have huge presentation to mortgage–backed securities
(MBS) and different types of securitization. Therefore, having not been specifically
influenced by the credit crunch that was at the foundation of the current money related
emergency straightforwardly influenced by the credit crunch that was at the base of
the2007 - 2008 crisis in finance industry.

21
Imane (2013) studied on the management of risk and performance in terms of finances in
insurance firms from Jordan. The research selected credit risk (debt and risk), operational
risk (efficiency, income and price ) liquidity risk (liquidity, capital) and market risks
(inflation, interest rates and financial crisis) as explanatory variables while return on the
assets and return on the equity, were utilized as dependent variables for the period of
fifteen years from 1998 to 2012. The research exposed that liquidity, credit and
operational hazard administration rehearses have a negative and noteworthy measurable
effect on Islamic banks' performance, and these protection firms fizzled in the meantime
in dealing with these risks. Second, showcase risk administration improvement have a
positive and huge factual effect on performance which means these institutions don‟t
suffer neither from the operational risk during the research period nor from managing this
type of risk.
Wani and Dar (2014) contemplated on the Relationship between the financial risk and
financial performance of Indian Insurance Industry. The research utilized different
straight regression model to decide the relationship between money related hazard and
budgetary execution. Data analysis was done using SPSS software. For determining the
relationship, the research used Return on Assets as an indicator for the firm‟s financial
performance as a dependent variable. The independent variables comprising of Capital
Management Risk, Solvency Risk, Liquidity Risk, and Underwriting Risk, size of a
company and volume of capital. , the research found a statistically significant and
relationship that was also positive between volume of capital and return on assets. Hence,

22
it can be said that that volume of capital is a major pull factor for the financial
performance of life insurers in India.
Locally several studies have been done. Obudho (2014) studied on the link between
financial risk and performance of Kenyan insurance firms financially. The research
applied a causal research design. The sample utilized for this research was 49 insurance
firms in Kenya. The research period was 5 years that covered from year 2009 to year
2013. Additional secondary data for insurance firms‟ annual report was collected on the
research variable, this included Financial Performance of the company that was measured
using return on Asset (ROA), Exchange Rate Risk, Financial risk, Solvency Risk and
Liquidity risk. Data analysis was done using SPSS Version 20. From the finding, the
research revealed that an increase in financial risk lead to the decrease in performance of
Kenyan insurance firms financially, thus the research concludes that increased financial
risk negatively influences insurance firms in Kenya performance financially.
Omasete (2014) studied on the effect of management of risk on the performance of
Kenyan insurance firms financially. A descriptive research design was adopted for the
research. The research adopted a census survey of all the 49 registered Kenyan insurance
firms (IRA, 2013). A census approach enables one to collect more accurate and 34
reliable data. Both the primary data and the secondary data were used in the research.
This research employed descriptive statistics to analyze the data. The research found risk
identification to be the most significant in influencing the financial performance of
Kenyan insurance firms, followed by risk mitigation, the management of risk program
implementation & monitoring and risk assessment & measurement respectively.

23
Wanjohi (2013) researched on the existing correlation between financial management of
risk and the performance of Kenyan commercial banks financially. The research used the
regression analysis condition to decide the relationship between the factors .The model
gave a factual system to evaluating the relationship between the financial risk
administration and the budgetary execution of the banks. The five segments of hazard
administration utilized as free factor were Risk Measurement, The management of risk
Environment, Risk Mitigation, Adequate Internal Control and Risk Monitoring. All the
mentioned segments were then connected with the mean of the ROA for the five years
(2008-2012). The research built up that financial hazard administration strongly affected
the budgetary execution of business banks in Kenya. The research also established that
the risk measurement practice had the biggest impact on financial performance followed
by risk mitigation practice. Thus, as each shilling invested in risk measurement
techniques, risk mitigation techniques increases earnings, and the increases financial
growth of the banks. The research by Wanjohi distinguishes an information gap since the
research was just centered on the relationship between financial risk administration and
budgetary execution of the Kenyan commercial banks.
2.5 Summary of Literature Review
From the above and entire chapter, it is evident that the management of risk in the
insurance industry has implication on the performance of the firms especially in the
financial performance. The management of risk is considered as a key concern for all
companies. The crisis that was experienced in the past could have been avoided if good
the management of risk practices had been put in place in all financial sectors. All the

24
previous studies established that financial institutions should have proper risk
management and control function and better the management of risk techniques so as to
lead to improved financial performance.
Research gaps exist since all the studies reviewed on the management of risk and
financial performances in insurance firms have focused only on five independent
variables. Increasing the independent variable results in the reduction in error and the
results are likely to be more accurate and precise. The financial performance will be
measured by use of ROA. ROA is one of the pointers that give an overview on the
direction taken by a business from its utilization of the total assets at its disposal.

25
2.6 Conceptual Frame work
Diagram 2.6.1 shows the conceptual framework of this research
Independent Variable Dependent Variable
Source: Self, 2016
Investment guidelines & strategies
Risk Management environment
Risk Measurement
Internal Controls
Risk Monitoring
Risk Mitigation
Financial Performance
26
CHAPTER THREE
RESEARCH METHODOLOGY
3.1 Introduction
This chapter enumerates the presentation and examination of the proper and reasonable
research strategy used to accomplish the motivation behind this exploration. The primary
subsection covers inquire about outline of the research. Subsection two covers the unit of
examination taken after by the information gathering techniques and lastly how
information will be analyzed.
3.2 Research Design
Research design gives the system for the accumulation and investigation of information
gathered (Bryman and Bell, 2007). Alternatively, it is the arrangement and structure of
the survey so considered as to acquire answers to the survey prompts (Cooper and
Emory, 1995). This therefore, gives the strategy vital for getting the data expected to take
care of the examination issues been researched. The researcher used the qualitative
approach to interview Insurance managers in the risk department because of the skills
possessed in this field of profession and a deep and greater understanding on the topic of
research.
3.3 Population
The target population is defined as the group of individuals from which the study seeks to
generalize it‟s and make conclusions on its findings. The target sample comprised of
census population of all the 51 registered insurance firms in Kenya.

27
3.4 Data Collection
The research employed both the primary data and the secondary data from published
results and administered questionnaire. The intention of using the data from the
primary source was to get perception of factual information on issues of the
management of risk by the Insurance. The primary data for this research was collected
using personally administered questionnaires as per appendix 2. The questionnaire was
adapted from Khan and Ahmed (2001) and Ariffin et al. (2009). The questionnaire
comprises of seven parts. The first part is designed to gather the respondent and
institutional information. The second section was designed to gather information
about the risk management environment. The other sections gathered the insurance
firms in Kenya adopt information about risk measurement followed by risk monitoring,
risk mitigation, internal control techniques and Investment guidelines and strategy. The
questionnaire is comprises the 5 Likert scale, starting with 5 as a strongly agree, 4 as
agree, 3 as neutral, 2 as disagree and the finally 1 as strongly disagree. The secondary
data was collected from the various insurance published reports, IRA reports and NSE.
The period under research covered the 3 years from 2013-2015
3.5 Data Analysis
Descriptive statistics describes the data and examines the links among all variables under
investigation. Descriptive statistics used included the measures of central tendency, the
frequency distributions, mean and line graphs that describe the data. The quantitative data
on the management of risk was measured in real values by normalizing. In addition,
regression analysis was conducted to determine the connection between the management
28
of risk practices (independent Variable) and the financial performance (dependent
variable) of Kenyan insurance firms. Probabilistic model was used to represent the
randomness using simple linear regression model to evaluate the interval variables, the
independent variables and dependent variables.
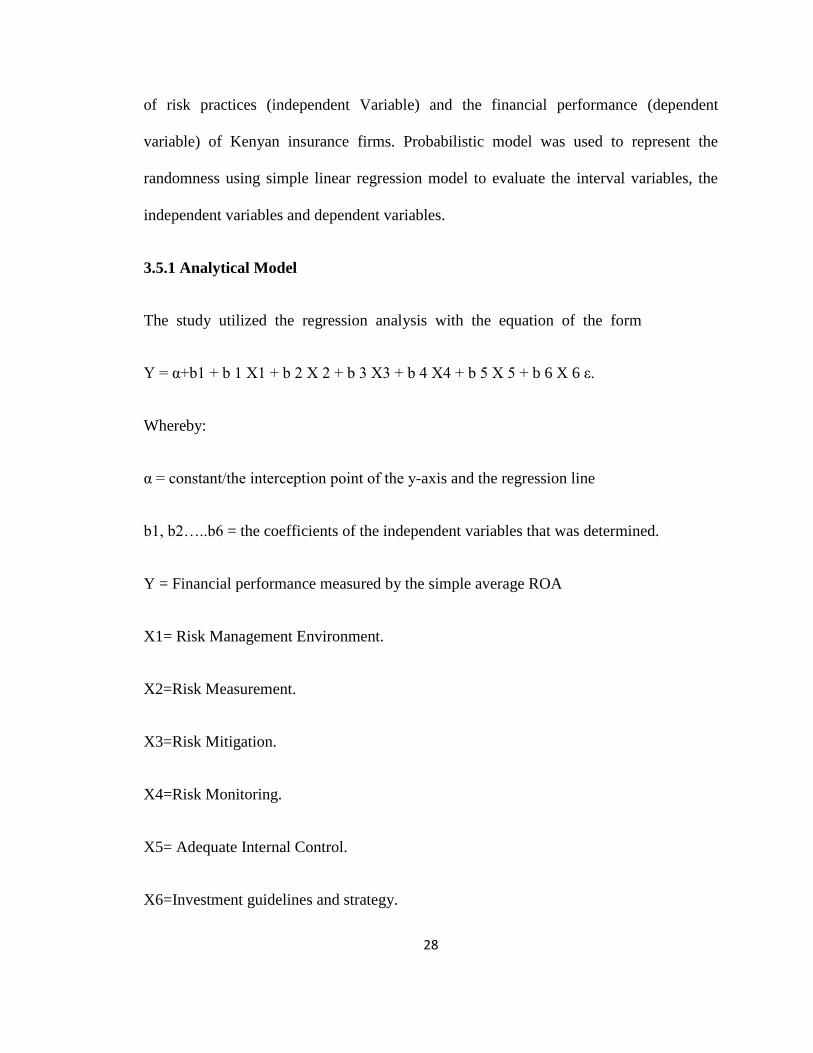
3.5.1 Analytical Model
The study utilized the regression analysis with the equation of the form
Y = α+b1 + b 1 X1 + b 2 X 2 + b 3 X3 + b 4 X4 + b 5 X 5 + b 6 X 6 ε.
Whereby:
α = constant/the interception point of the y-axis and the regression line
b1, b2…..b6 = the coefficients of the independent variables that was determined.
Y = Financial performance measured by the simple average ROA
X1= Risk Management Environment.
X2=Risk Measurement.
X3=Risk Mitigation.
X4=Risk Monitoring.
X5= Adequate Internal Control.
X6=Investment guidelines and strategy.
29
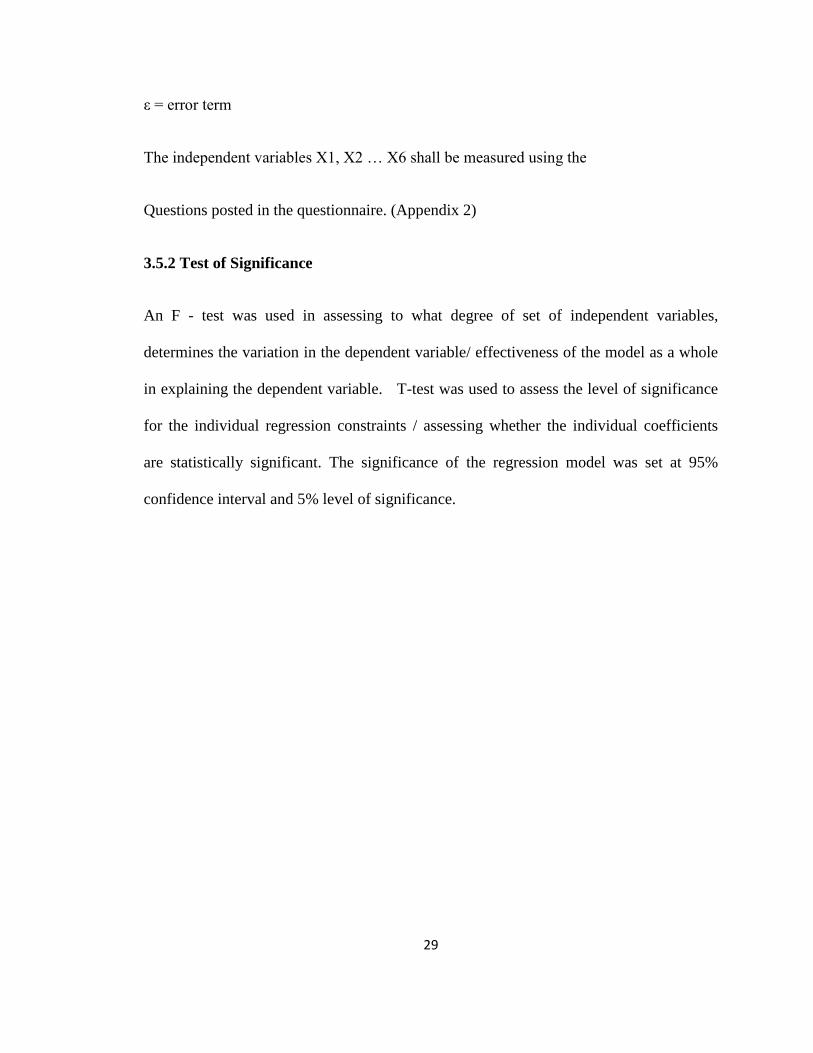
ε = error term
The independent variables X1, X2 … X6 shall be measured using the
Questions posted in the questionnaire. (Appendix 2)
3.5.2 Test of Significance
An F - test was used in assessing to what degree of set of independent variables,
determines the variation in the dependent variable/ effectiveness of the model as a whole
in explaining the dependent variable. T-test was used to assess the level of significance
for the individual regression constraints / assessing whether the individual coefficients
are statistically significant. The significance of the regression model was set at 95%
confidence interval and 5% level of significance.
30
CHAPTER FOUR
DATA ANALYSIS AND FINDINGS
4.1 Introduction
This chapter is a presentation about the data analysis results from collected data from
thirty (30) Kenyan insurance firms. These were general and life insurers in Kenya. The
chapter begins by discussing the results on the profiles of the respondents. This is
followed by results on the management of risk practices adopted by the insurance firms
surveyed. The last section presents the results on the connection between the
management of risk practices and the financial performance of Kenyan insurance firms.
4.2 Demographic Analysis
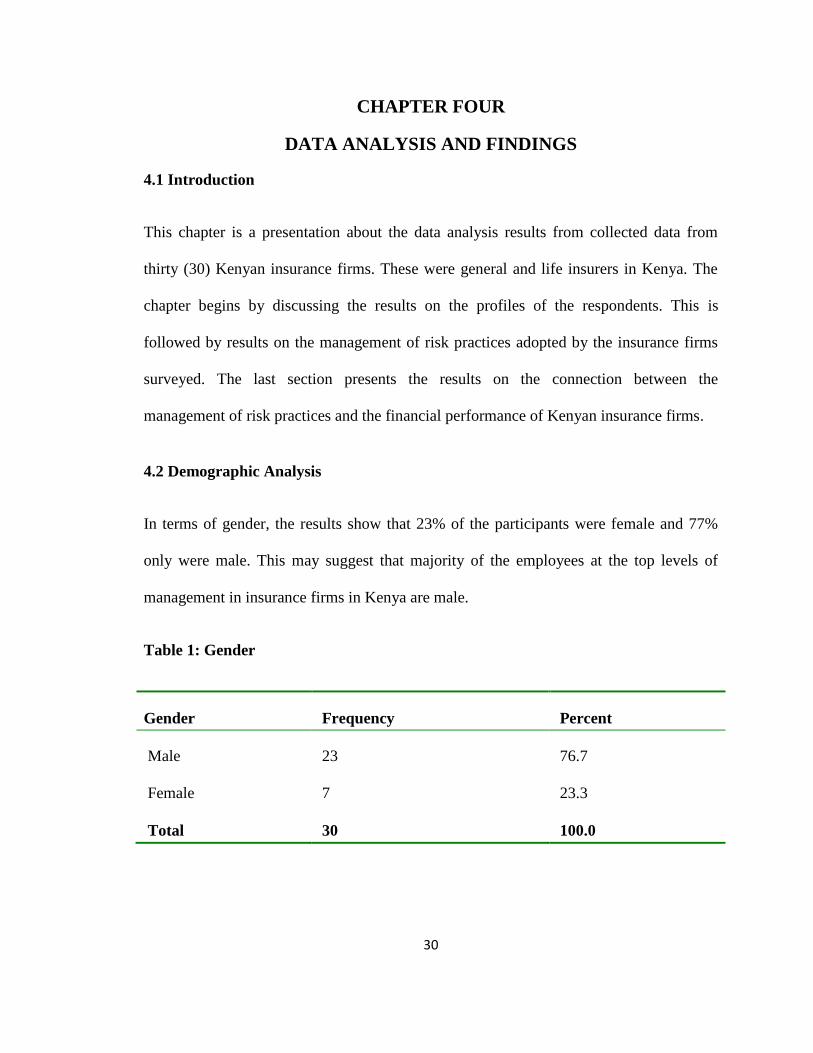
In terms of gender, the results show that 23% of the participants were female and 77%
only were male. This may suggest that majority of the employees at the top levels of
management in insurance firms in Kenya are male.
Table 1: Gender
Gender Frequency Percent
Male 23 76.7
Female 7 23.3
Total 30 100.0

31
On experience, the research found that 34% of the respondents had an experience of three
years or less in the organizations while 66% had more than three years in their
organizations. This shows that most of the respondents had stayed longer in the insurance
sector as well as in their organizations and, therefore, had longer institutional memory
that was important for this research.
Table 2: Experience
Experience Frequency Percent
3 years or less 10 34
More than 3 years 20 66
Total 30 100.0
4.3 Risk Management Practices
Table 3 shows the results for the management of risk practices adopted by insurance
firms in Kenya. As shown, the most prevalent practice of the management of risk in the
insurance sector is internal control where 92% of the respondents (mean = 4.60) agree
that it is the fact of the management of risk mostly applicable to their company. This was
followed by risk environment, policies and procedures where 91% of the respondents
agreed (mean = 4.54) and then risk investment guidelines and strategy as 90% of the
respondents agreed (mean = 4.50).

32
Table 3: Risk Management Practices
Risk Percent Mean SD
Internal control 92 4.60 0.35
Risk environment, policies and procedures 91 4.54 0.41
Risk investment guidelines and strategy 90 4.50 0.41
Risk mitigation 88 4.40 0.38
Risk monitoring 88 4.38 0.52
Risk measurement 81 4.06 0.72
Table 3 shows the results of the management of risk environment, policies and
procedures. The results show that board competence is highly rated by 97% of the
respondents. A further 97% also rate adoption of appropriate guidelines highly. Risk
management environment, policies and procedures are, therefore, important as part of the
management of risk in insurance firms in Kenya.

33
Table 4: Risk Management Environment, Procedures and Policies
Percent Mean SD
The Board is dynamic and has a proper level of
administration, specialized, and other skill, combined
with the outlook important to play out its oversight
obligations.
97 4.8333 .37905
The insurance company adopts and utilizes guidelines
internally generated and by regulatory authorities such
as IRA
97 4.8333 .37905
The existence of risks and management‟s recognition of
this is appropriately communicated to all employees.
93 4.6667 .47946
Management fully considers risk assessment in
determining the best course of action.
90 4.5000 .50855
Internal guidelines are in place to govern the institution 90 4.5000 .77682
Business objectives are appropriately communicated as
it relates to objectives targeted by the following
organization layers: Company, Divisional and
Departmental
87 4.3333 .75810
Individuals are aware of their activities interrelation and
add to accomplishment of the organization goals
87 4.3333 .47946
The Insurance company has adopted and utilized
Revised IRA Financial Risk Management Guidelines
84 4.2000 .76376
Table 4 shows the results on risk mitigation by Kenyan insurance firms. The results show
that the highest rated risk mitigation measure by 97% of the respondents was ethical
values followed by simulation analysis as rated highly by 90% of the respondents. Most

34
of these risk mitigation measures had higher scores (more than 80% agreement) and
shows, therefore, that insurance firms had risk mitigation measures in place.
Table 5: Risk Mitigation
Percent Mean SD
Moral values are imparted as well as joined by express
direction in regards to what is good and bad
97 4.8333 .37905
The insurance company regularly conducts simulation
analysis and measure benchmark (premium rates) rate
risk sensitivity.
90 4.5000 .50855
There exists the parameters for separate counterparty 87 4.3333 .47946
The firm has a regular reappraise of risks levels of the
covered properties (assets)
87 4.3333 .47946
There is analysis and report writing committee on the
risk rating of the prospective properties under cover
87 4.3333 .75810
The company analyses each insured loss ratio before
business renewal
87 4.3333 .75810
There is risk rating of prospective insured by checking
if there are no factual errors or misinterpretations of
data provided by prospective insured.
87 4.3333 .47946
There is risk rating of prospective insured property by
pre-visiting desk analysis of data and information
collected from the client.
83 4.1667 .69893
The results on risk monitoring are shown in Table 5. The research found that 93% of the
respondents noted that the lines of authority were ineffective in handling risks. However,

35
as 90% of the respondents showed, regular reporting systems were in place in insurance
firms. The results also show that 87% of the firms monitor credit limits of brokers and
other third parties. A further 80% of the firms also regularly compile maturity ladder
charts.
Table 6: Risk Monitoring
Percent Mean SD
Incapable lines of power or potentially inability to set
up clear approaches or points of confinement of power
that causes directors or workers to do things they
ought not do or neglect to do things they ought to be
accounted for by the administration.
93 4.6667 .47946
The insurance firm has set up a consistent reporting
framework with respect to hazard administration for
senior officers and administration
90 4.5000 .50855
The credit limits for insurance brokers and other third
parties is strongly monitored by doing background
check.
87 4.3333 .75810
The insurance firm has a consistent (e.g. week after
week) arranges a development stepping stool outline as
indicated by settlement date and screen money position
hole
80 4.0000 1.01710
Table 6 shows that internal control issues are adequately handled in most of the insurance
firms surveyed. For instance, 97% of insurance firms had principles and procedures
relating to decision making process. The results further show that duties were segregated
in 93% of the firms, the task to review and verify the management of risk systems was a
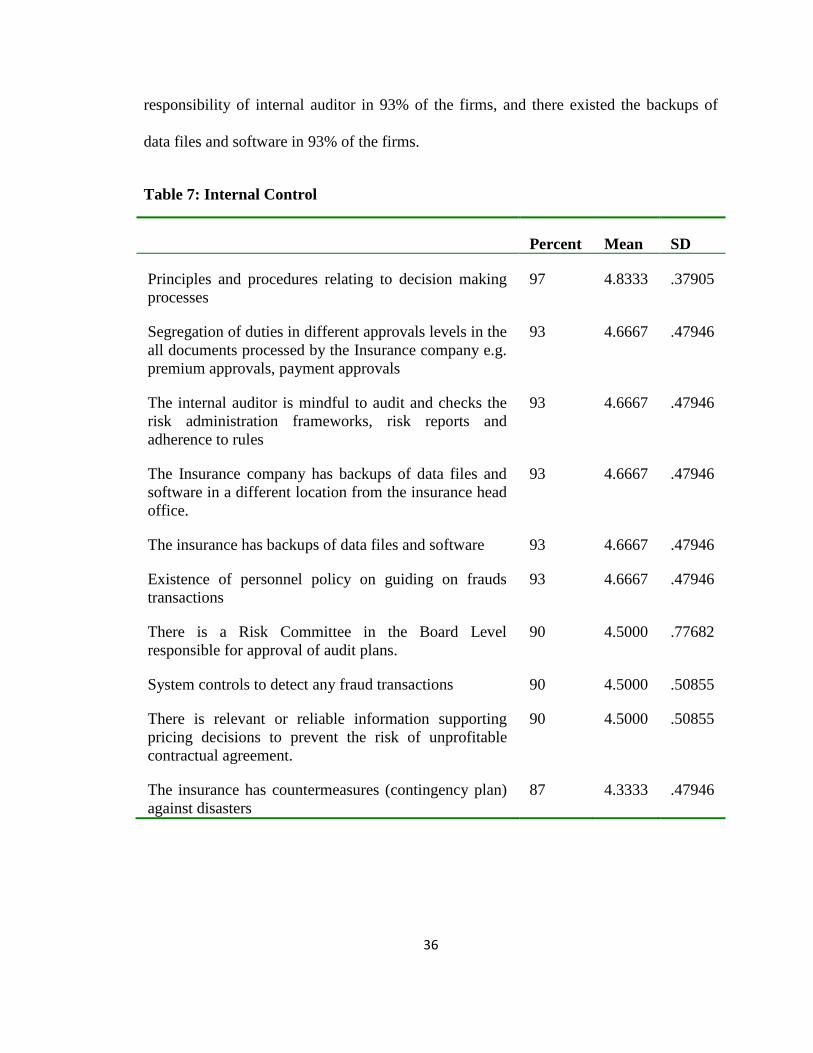
36
responsibility of internal auditor in 93% of the firms, and there existed the backups of
data files and software in 93% of the firms.
Table 7: Internal Control
Percent Mean SD
Principles and procedures relating to decision making
processes
97 4.8333 .37905
Segregation of duties in different approvals levels in the
all documents processed by the Insurance company e.g.
premium approvals, payment approvals
93 4.6667 .47946
The internal auditor is mindful to audit and checks the
risk administration frameworks, risk reports and
adherence to rules
93 4.6667 .47946
The Insurance company has backups of data files and
software in a different location from the insurance head
office.
93 4.6667 .47946
The insurance has backups of data files and software 93 4.6667 .47946
Existence of personnel policy on guiding on frauds
transactions
93 4.6667 .47946
There is a Risk Committee in the Board Level
responsible for approval of audit plans.
90 4.5000 .77682
System controls to detect any fraud transactions 90 4.5000 .50855
There is relevant or reliable information supporting
pricing decisions to prevent the risk of unprofitable
contractual agreement.
90 4.5000 .50855
The insurance has countermeasures (contingency plan)
against disasters
87 4.3333 .47946

37
Table 6 shows that risk measurement fared badly as opposed to other risk practices.
While 92% of the firms issued maturity matching analysis for life insurance and 90%
kept adequate records and had adequate internal audit process, only 57% of the firms
used duration analysis.
Table 8: Risk Measurement
Percent Mean SD
The insurance uses Maturity Matching Analysis for
life insurance
92 4.6000 .50000
Adequate record keeping processes 90 4.5000 .77682
Adequate internal audit processes 90 4.5000 .77682
The insurance uses stress testing for the risk
evaluation
87 4.3333 .75810
Adequate quality management processes 87 4.3333 .75810
The firm frequently directs reenactment examination
and measure benchmark (premium rates) rate hazard
affectability.
80 4.0000 .83045
The insurance firm has a quantitative supportive
network for surveying clients' credit standing (brokers
and agents )
77 3.8333 1.08543
There is a computerized support network for
evaluating the inconstancy of income and hazard
administration
73 3.6667 1.12444
The insurance uses Duration Analysis 57 2.8333 1.23409
In terms of risk investment guidelines and strategy, Table 8 reveals that 97% of the
organizations had sufficient and convenient inside correspondence of data on speculation,

38
93% had evidently determined strategies for changes to the usage of speculation
technique and 90% had a foot on their portfolio compositions.
Table 9: Risk Investment Strategy and Guidelines
Percent Mean SD
Satisfactory and auspicious internal correspondence of
data on investing undertakings
97 4.8333 .37905
Products are unmistakably determined for any
progressions to the execution of the speculation
technique
93 4.6667 .47946
The arrangement of a benefit portfolio is made of the
result of an all-around .reported organized venture
prepare with proper strides for usage.
90 4.5000 .50855
For any different portfolios held, for the insurance
agency there is a framework for recognizable proof,
estimation and evaluation of speculation risks to that
portfolio and where fitting for the gathering as entirety.
90 4.5000 .50855
Satisfactory strategies for the estimation and evaluation
of speculation execution;
90 4.5000 .77682
There are thorough and compelling review strategies
and observing exercises to distinguish and report
shortcomings in venture controls and consistence
87 4.3333 .47946
Strategies to recognize and control the reliance on and
vulnerability of the firm to important work force and
the systems
83 4.1667 .69893
4.4 Effect of the Management of Risk on Financial Performance
The correlation matrix in Table 8 shows that some of the independent variables were
highly and significantly related. On a closer look, risk monitoring was eliminated in the

39
final OLS regression model as it failed tolerance tests. The rest of the variables were
included in the analysis.
Table 10: Correlation matrix
ROA Env. Mit. Mon. Cont. Measure
Return on Assets 1
Risk environment, policies
and procedures
.181 1
Risk mitigation .195 .848**
1
Risk monitoring .230 .588**
.905**
1
Internal control .259 .847**
.927**
.806**
1
Risk measurement .198 .539**
.893**
.984**
.816**
1
Risk investments guidelines .241 .777**
.820**
.747**
.646**
.645**
Autocorrelation
Some of the independent variables are highly correlated. This means that there is a
problem of multicollinearity. In order to address this problem, a number of solutions are
provided by scholars. One of the ways is to delete the offending variable from the model.
Here, the variable that was deleted to remove autocorrelation from the model was
monitoring. Hence, the final model without monitoring variable did not have a problem
of autocorrelation.
The regression model was run with performance (ROA) as the dependent variable and the
rest of the variables as the independent variables with the exception of risk monitoring.
Table 10 shows a relatively moderate relationship between the performance in terms of

40
finances and the management of risk (r = 0.471). The model accounted for only 22.1% of
the variance in performance (r2 = 0.221).
Table 11: Model Summary
R R Square Adjusted R Square Std. Error of the Estimate
.471a .221 .059 .39187
Table 12 shows the ANOVA results. The F statistic of 1.366 was not significant at 5%
level of significance (p = 0.272) which suggests that the model used was unfit in
explaining the influence that management of risk had on the Kenyan insurance firms
performance financially.
Table 12: ANOVA
Sum of Squares df Mean Square F Sig.
Regression 1.049 5 .210 1.366 .272b
Residual 3.685 24 .154
Total 4.734 29
In Table 12, the coefficients show that risk environment and risk mitigation both had
negative effects on performance although none was significant. The rest of the variables
(internal control, risk measurement, and risk investment guidelines) had positive effects
on performance. However, these effects were also non-significant at 5% level of

41
significance. However, at 10% level, both internal control and risk investment guidelines
had significant effects. The equation becomes:
ROA = -2.435 – 0.488 RiskEnv -1.597 RiskMit +1.701 IntCont + 0.022 RiskMeas +
0.876 RiskInv + 2.552
Table 13: Coefficients
Unstandardized
Coefficients
Standardized
Coefficients
t Sig.
B Std. Error Beta
(Constant) -2.435 2.552 -.954 .349
Risk environment -.488 1.168 -.507 -.418 .680
Risk mitigation -1.597 1.819 -1.544 -.878 .389
Internal control 1.701 .937 1.504 1.814 .082
Risk measurement .022 .712 .039 .030 .976
Risk investments
guidelines
.876 .437 .904 2.002 .057

42
CHAPTER FIVE
SUMMARY, CONCLUSION, AND RECOMMENDATIONS
5.1 Introduction
This chapter presents the summary of research findings, conclusions of the research, and
recommendations for policy, practice and research.
5.2 Summary of Findings
The research sought to determine the relationship between the management of risk
practices and the financial performance of Kenyan insurance firms. To do this, data was
collected from 30 insurance firms in Kenya. Both primary and secondary data were
collected.
The research found that the most prevalent practice of the management of risk in the
insurance sector is internal control where 92% of the respondents agreed that it is the fact
of the management of risk mostly applicable to their company. This was followed by risk
environment, policies and procedures where 91% of the respondents agreed and then risk
investment guidelines and strategy as 90% of the respondents agreed.
The regression showed a moderate relationship between performance and the
management of risk (r = 0.471). The model accounted for only 22.1% of the variance in
performance (r2 = 0.221). The F statistic of 1.366 was not significant at 5% level of
significance (p = 0.272) meaning that the model used was not fit to explain the
connection between the management of risk practices and the financial performance of
Kenyan insurance firms.

43
The coefficients showed that risk environment and risk mitigation both had negative
effects on performance although none was significant. The rest of the variables (internal
control, risk measurement, and risk investment guidelines) had positive effects on
performance. However, these effects were also non-significant at 5% level but significant
at 10% level of significance.
5.3 Conclusions
The research concludes that the management of risk has been adopted as part of the
practices in most of the insurance firms in Kenya. This is seen in the number of facets of
various risk management approaches adopted by the firms. Thus, firms have better
internal controls and risk environment to sustain better performance in the organizations.
The research further concludes that while the management of risk may have an influence
on performance of insurance firms, the relationship is weak at best. This calls into
question whether the management of risk is well engineered within the institutions
surveyed to transmit benefits to the bottom-line of these organizations.
5.4 Limitation of the Research
The key impediments in this research was that, out of the 51 Kenyan insurance firms
recorded as the target, just 30 firms managed to return completed surveys. A few
respondents did not respond to the inquiries to the researcher even after a formal request
to do so. There were respondents who considered the requested inform as confidentiality
breach and requested the researcher to use the released information through insurance
regulator. This decreased the likelihood of achieving a more decisive research.
44
The researcher encountered a challenge of persuading the busy officers of the sampled
insurance firms. This may have kept the evaluation to take longer than expected, as most
of the respondents were reluctant to fill out the survey as provided on paper. There was
an instant where a targeted respondent referred the researcher to obtained issue the
questioner to a junior officer citing to attend mandatory management seminar.
Some unanticipated imperative occurred, for example, funds prevented the researcher
from completing all the expected meetings on the effect of the risk administration on all
Kenyan insurance firms. This could have restricted the information accessible to the
researcher.
The data collection process could not be verified since all the respondents filed the
questioner anonymously. This could lead to obtaining of arbitrary data hence skewed
results after the analysis.
The time constraint likewise prompted the confinement in the number of insurance
officers who took an interest in the research by filling the poll in time and returning them.
The time constraint made it impossible to carry out a pilot survey with a view of
determining the effectives of the questioner design as the respondents did not give
feedback.
5.5 Recommendations
The research makes a number of recommendations. First, insurance firms should evaluate
the way in which the management of risk is implemented in the organizations. All facets

45
of the management of risk should form the culture of the organizations in order to
enhance the performance of these institutions.
Secondly, while the management of risk has a weak effect on performance, insurance
firms should enhance their internal control and risk investment strategies as these may
have a positive impact on their profitability if well implemented.
Lastly, the insurance regulator in Kenya, as well as the industry association body, should
enhance their training on the management risk to insurance institutions to equip the
players with the requisite expertise to handle risks.
5.6 Suggestions for Further Research
Further studies are needed in this area. First, research should be done to examine other
risk management variables that may have a significant impact on the performance of
insurance firms in Kenya. Thus, the definition of risk should be expanded beyond the one
used in this paper.
Secondly, future studies should incorporate other measures of performance other than
ROA to assess whether management of risk in other ways may influence performance
than were tested in the present research.
The research paper also recommends on a research to be carried out in the relationship
between risk management and financial performance of other financial institutions such
as micro finance institutions and SACCOS.
The research paper also recommends that a study should be done on other determinants
of financial performance of insurance companies in Kenya.
46
The research paper also recommends on a study to be on how financial institutions have
adopted risk management procedures and other control measures as actuarial functions
guidelines recommendations and its effects on the financial performance of these
institutions.

47
REFERENCES
Ali.T. & Luft .H. (2002). Risk Management Practices: An Empirical Analysis of the UAE
Commercial Banks. Finance journal.
Ariffin, N. M. & Kassim, S.H. (2003). Risk Management Practices and Financial
Performance of Islamic Banks. Malaysian Evidence
Association of Kenya Insurers (AKI) 2015 Insurance industry Annual report Nairobi,
Kenya
Bryman, A. & Bell, E. (2007) .Business Research Methods, 2nd edition. Oxford
University Press.
Carey, A. A. (2001).Effective risk management in financial institutions: The turn bull
approach, Balance Sheet, 9. (3), 24 – 27
Cooper, D.R. & Emory, C.W. (1995). Business research methods (5th ed.). Chicago:
Irwin.
Dutta, J., Sefton, J., & Weale, M. (1999). Education and public policy. Fiscal
Studies, 20(4), 351-386.
Fabozzi, F. J., Gupta, F., & Markowitz, H. M. (2002). The legacy of modern portfolio
theory. The Journal of Investing, 11(3), 7-22.

48
Gollier, C. (2012), Evaluation of long-dated investments under uncertain growth trend,
volatility and catastrophes, mimeo, Toulouse School of Economics
Gregory, S. H. & Richard, M. C. (1998). What not Survey of Financial Risk Management
by Non-Financial Firms. Financial Management, 27, 70-91.
Horcher, M. & Karen, A. (2005). Essentials of financial risk management. John Wiley
and Sons
Insurance Regulatory Authority (IRA) 2015 Website, http://www.ira.go.ke
Javed, A. & Iqbal, R. (2007). The Relationship between corporate governance indicators
and firm value: A case study of Karachi stock exchange. PIDE Working Papers,
Jensen, M. C. & Murphy, K. J. (1990). Performance pay and top-management incentives.
The Journal of Political Economy, 98(2), 225-264.
Khan, M. A. (1991), Comparative Economics of Some Islamic Financing Techniques,
Research Paper No. 12, Islamic Research and Training Institute, Islamic
Development Bank, Jeddah.
Maher, M. & Anderson, T. (2002). Corporate Governance: Effects on Firm Performance
and Economic Growth. Corporate Governance Regimes: Convergence and
Diversity, 386.
Markowitz, H. 1. (1959). Portfolio selection: Efficient diversification of investments.
New Haven: Yale University Press.

49
Merton, R. C. (1992). Financial Innovation and Economic Performance. Journal of
Applied Corporate Finance, (4), 12-22.
Ntim, C.G. (2009).Internal corporate governance structures and firm financial
performance: evidence from South African listed firms. PhD thesis, University of
Glasgow Retrieved on 15th July 2014.
Okotha, H. (2003). Corporate Risk Management: Costs and Benefits. Global Finance
Journal, 13 (1), 29-38
Oluwafemi, A. S & Simeon O.S. (2013). Risk Management and Financial Performance
of Banks in Nigeria. 14(6), 52-562
Omasete, C.A. (2014).The effect of risk management on financial performance of
insurance companies in Kenya. Unpublished MBA project, School of Business,
University of Nairobi
Omondi, O.G. (2015). Basel Accords on Risk Management: A Survey of Kenya‟s
Commercial Banks. Global Economics 3.
Phillips, J. D, Lewis, C. M. & Wei, R. (2003). The Market Value Impact of Operational
Risk Events for U.S. Banks and Insurers
Rejda, E. G. (2003). Principles of Risk management and Insurance: edition New York,
Pearson education Inc.
50
Stein, R .M. (2000). Evidence on the incompleteness of Merton-type structural models
for default prediction. Quantitative Risk Modeling, Moody’s Risk Management
Services, Technical Paper 1(2), 2-3
Tobin, J. & Brainard, W. (1968). Pitfalls in financial model building. American
Economic Review, 58(2), 99-122.
Wanjohi, C. M. (2013). Research on relationship between financial risk management and
financial performance of banks in Kenya. Unpublished MBA project, School of
Business, University of Nairobi

51
APPENDICES
Appendix 1: Insurance firms in Kenya
1. AAR INSURANCE OF KENYA
2. AFRICAN MERCHANT ASSURANCE
3. AIG INSURANCE COMPANY
4. ALLIANZ INSURANCE COMPANY
5. APA INSURANCE COMPANY
6. APA LIFE ASSURANCE COMPANY
7. BARCLAYS LIFE ASSURANCE
8. BRITAM GENERAL INSURANCE COMPANY
9. BRITAM LIFE ASSURANCE COMPANY
10. CANNON ASSURANCE COMPANY
11. CAPEX LIFE ASSURANCE COMPANY
12. CIC GENERAL INSURANCE COMPANY
13. CIC LIFE ASSURANCE COMPANY
14. CORPORATE INSURANCE COMPANY
15. DIRECTLINE ASSURANCE COMPANY
16. FIDELITY SHIELD INSURANCE
17. FIRST ASSURANCE COMPANY
18. GA INSURANCE COMPANY
19. GA LIFE ASSURANCE LIMITED
20. GATEWAY INSURANCE COMPANY

52
21. GEMINIA INSURANCE COMPANY
22. HERITAGE INSURANCE COMPANY
23. ICEA LION GENERAL INSURANCE
24. ICEA LION LIFE ASSURANCE COMPANY
25. INTRA-AFRICA ASSURANCE
26. INVESCO ASSURANCE COMPANY
27. JUBILEE INSURANCE COMPANY
28. KENINDIA ASSURANCE COMPANY
29. KENYA ORIENT INSURANCE
30. KENYA ORIENT LIFE ASSURANCE
31. LIBERTY LIFE ASSURANCE KENYA
32. MADISON INSURANCE COMPANY
33. MAYFAIR INSURANCE COMPANY
34. METROPOLITAN LIFE ASSURANCE
35. OCCIDENTAL INSURANCE COMPANY
36. OLD MUTUAL ASSURANCE COMPANY
37. PACIS INSURANCE COMPANY
38. PAN AFRICA INSURANCE COMPANY
39. PHOENIX OF EAST AFRICA
40. PIONEER ASSURANCE COMPANY
41. PRUDENTIAL LIFE ASSURANCE KENYA
42. RESOLUTION HEALTH INSURANCE
43. SAHAM INSURANCE COMPANY

53
44. TAKAFUL INSURANCE OF AFRICA
45. TAUSI ASSURANCE COMPANY
46. THE KENYAN ALLIANCE INSURANCE
47. THE MONARCH INSURANCE COMPANY
48. TRIDENT INSURANCE COMPANY
49. UAP INSURANCE COMPANY
50. UAP LIFE ASSURANCE COMPANY
51. XPLICO INSURANCE COMPANY

54
Appendix 2: Questionnaire
This questionnaire is intended to provide anonymous data for the study on the connection
between the management of risk practices and the financial performance of Kenyan
insurance firms. Please note that the information provided is useful for academic purpose
only and was treated with highest confidentiality possible.
Kindly fill out the following prompts by marking (x) as provided in the section or by
giving the necessary details in the spaces provided.
TABLE 1.PROFILE OF THE RESPONDENTS
Gender
Institution name
Level of experience(years)
Department of the respondent
Occupation ranking of the respondent
Highest education level of the respondent
Annual company turnover (Ksh)
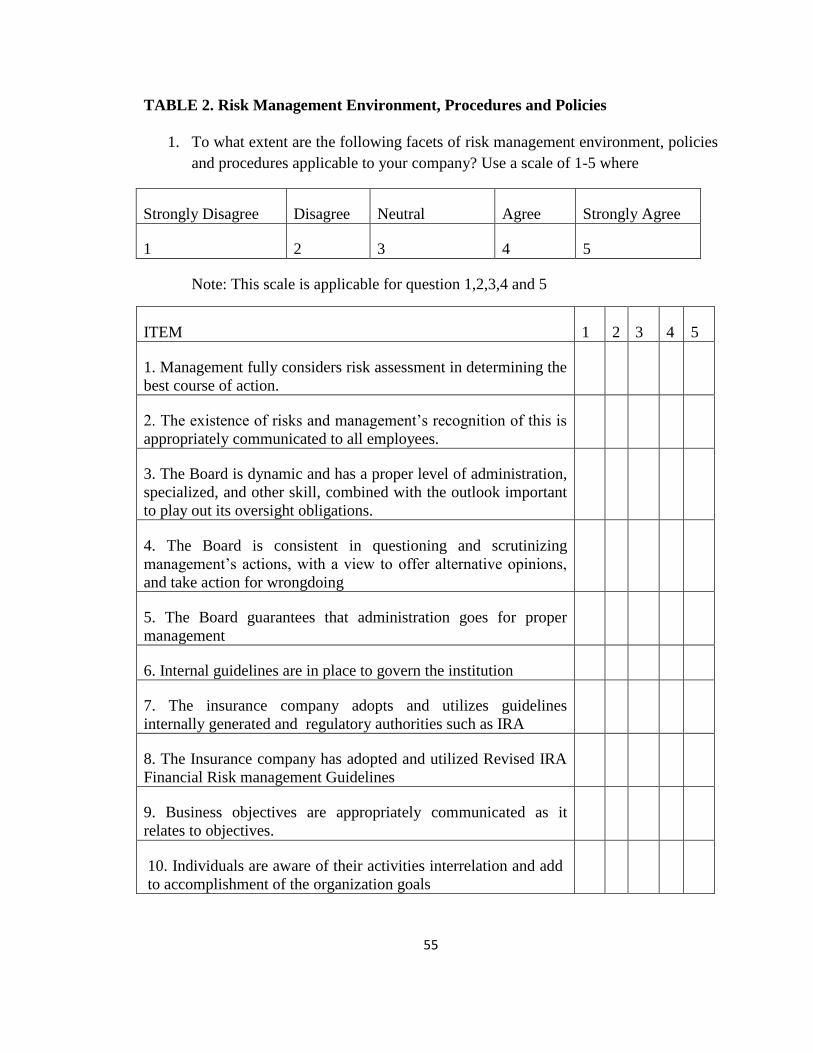
55
TABLE 2. Risk Management Environment, Procedures and Policies
1. To what extent are the following facets of risk management environment, policies
and procedures applicable to your company? Use a scale of 1-5 where
Strongly Disagree Disagree Neutral Agree Strongly Agree
1 2 3 4 5
Note: This scale is applicable for question 1,2,3,4 and 5
ITEM 1 2 3 4 5
1. Management fully considers risk assessment in determining the
best course of action.
2. The existence of risks and management‟s recognition of this is
appropriately communicated to all employees.
3. The Board is dynamic and has a proper level of administration,
specialized, and other skill, combined with the outlook important
to play out its oversight obligations.
4. The Board is consistent in questioning and scrutinizing
management‟s actions, with a view to offer alternative opinions,
and take action for wrongdoing
5. The Board guarantees that administration goes for proper
management
6. Internal guidelines are in place to govern the institution
7. The insurance company adopts and utilizes guidelines
internally generated and regulatory authorities such as IRA
8. The Insurance company has adopted and utilized Revised IRA
Financial Risk management Guidelines
9. Business objectives are appropriately communicated as it
relates to objectives.
10. Individuals are aware of their activities interrelation and add
to accomplishment of the organization goals

56
TABLE 3. Risk Mitigation
2. To what extent does your company adopt the following risk mitigation
procedures? Use a scale of 1-5
ITEM 1 2 3 4 5
1. Counterparty risk limits for each individual are
considered.
2. The firm has a regular reappraise of risks levels of the
covered properties (assets)
3. There is analysis and report writing committee on the risk
rating of the prospective properties under cover
4. The insurance company regularly conducts simulation
analysis and measure benchmark (premium rates) rate risk
sensitivity.
5. The company analyses each insured loss ratio before
business renewal
6. There is risk rating of prospective insured property by
pre-visiting desk analysis of data and information collected
from the client.
7. There is risk rating of prospective insured by checking if
there are no factual errors or misinterpretations of data
provided by prospective insured.
8 Ethical are communicated and accompanied by explicit
direction concerning what is wrong and right

57
TABLE 4. Risk Monitoring
3. To what extent, does the company follow the following risk monitoring
procedures? Use a scale of 1-5
ITEM 1 2 3 4 5
1. The credit limits for insurance brokers and other third
parties is strongly monitored by doing background check.
2. The insurance firm has a consistent (e.g. week after
week) arranges a development stepping stool outline as
indicated by settlement date and screen money position gap
3. The insurance firm has set up a consistent reporting
framework with respect to hazard administration for senior
officers and administration
4. Incapable lines of power or potentially inability to set up
clear approaches or points of confinement of power that
causes directors or workers to do things they ought not do
or neglect to do things they ought to are accounted for to
the administration.

58
TABLE 5. Internal control
4. To what extent does your company employ the following internal control
measures? Use a scale of 1-5
ITEM 1 2 3 4 5
1.Principles and procedures relating to decision making
processes
2. Segregation of duties in different approvals levels in the
all documents processed by the Insurance company e.g.
premium approvals, payment approvals
3. The insurance has contingency plan in case of a disasters
4. The internal auditor is mindful to audit and checks the
risk administration frameworks, risk reports and adherence
to rules
5. The Insurance company has backups of data files and
software in an offsite location from the insurance head
office.
6. There is a Risk Committee in the Board Level
responsible for approval of audit plans.
7. system controls to detect any fraud transactions
8.Existence of personnel policy on guiding on frauds
transactions
9. There is relevant or reliable information supporting
pricing decisions to prevent the risk of unprofitable
contractual agreement.

59
TABLE6. Risk Measurement
5. To what extent has your company implemented the following risk measurement
process? Use a scale of 1-5
ITEM 1 2 3 4 5
1. There is a computerized support network for evaluating
the inconstancy of income and hazard administration
2. The firm frequently directs reenactment examination and
measure benchmark (premium rates) rate hazard
affectability.
3. Adequate quality management processes
4.The insurance uses Maturity Matching Analysis for life
insurance
5. The insurance uses stress testing for the risk evaluation
6. The insurance firm has a quantitative supportive network
for surveying clients' credit standing (brokers and agents )
7.Adequate quality management processes
8.Adequate record keeping processes
9. Adequate internal audit processes

60
TABLE7. Risk Investment Guidelines and Strategy
6. To what extent, has your company implemented the following Risk Investment
Guidelines and Strategy?
Use a scale of 1-5
ITEM 1 2 3 4 5
1. The arrangement of a benefit portfolio is made of the
result of an all-round .reported organized venture prepare
with proper strides for usage.
2. For any different portfolios held, for the insurance
agency there is a framework for recognizable proof,
estimation and evaluation of speculation risks to that
portfolio and where fitting for the gathering as entirety.
3. Satisfactory strategies for the estimation and evaluation
of speculation execution
4. Satisfactory and auspicious internal correspondence of
data on investing undertakings
5. Strategies to recognize and control the reliance on and
vulnerability of the firm to important work force and the
systems
6. There are thorough and compelling review strategies and
observing exercises to distinguish and report shortcomings
in venture controls and consistence
Thank you for filling this questionnaire

61
Appendix 3: Data
Company riskman riskmit riskmon internal riskmeasure riskinvest roa
Kenindia 4.75 4.50 4.50 4.70 4.22 4.43 4.17
Liberty 4.88 4.75 5.00 5.00 4.78 5.00 2.16
GA 5.00 5.00 5.00 5.00 5.00 5.00 6.50
Sanlam 4.38 4.00 3.75 4.10 3.00 4.57 1.38
Jubilee 4.50 4.13 3.75 4.60 3.33 4.00 2.72
Xplico 3.75 4.00 4.25 4.20 4.00 4.00 0.68
Barclays 4.75 4.50 4.50 4.70 4.22 4.43 3.52
Britam 4.88 4.75 5.00 5.00 4.78 5.00 0.96
Capex 5.00 5.00 5.00 5.00 5.00 5.00 0.26
Cannon 4.38 4.00 3.75 4.10 3.00 4.57 4.02
CIC 4.50 4.13 3.75 4.60 3.33 4.00 6.24
Pioneer 3.75 4.00 4.25 4.20 4.00 4.00 6.84
Corporate 4.75 4.50 4.50 4.70 4.22 4.43 7.93
Direct Line 4.88 4.75 5.00 5.00 4.78 5.00 5.08
Occidental 5.00 5.00 5.00 5.00 5.00 5.00 9.22
Fidelity 4.38 4.00 3.75 4.10 3.00 4.57 4.37
Fists Assurance 4.50 4.13 3.75 4.60 3.33 4.00 7.10
Allianz 3.75 4.00 4.25 4.20 4.00 4.00 3.43
Gateway 4.75 4.50 4.50 4.70 4.22 4.43 0.74

62
Geminia 4.88 4.75 5.00 5.00 4.78 5.00 12.06
Heritage 5.00 5.00 5.00 5.00 5.00 5.00 10.06
ICEA 4.38 4.00 3.75 4.10 3.00 4.57 6.37
Intra Africa 4.50 4.13 3.75 4.60 3.33 4.00 2.79
Invesco 3.75 4.00 4.25 4.20 4.00 4.00 3.10
Trident 4.75 4.50 4.50 4.70 4.22 4.43 3.46
UAP 4.88 4.75 5.00 5.00 4.78 5.00 5.55
Kenya Orient 5.00 5.00 5.00 5.00 5.00 5.00 2.82
Pacis 4.38 4.00 3.75 4.10 3.00 4.57 8.83
Madison 4.50 4.13 3.75 4.60 3.33 4.00 8.52
Mayfair 3.75 4.00 4.25 4.20 4.00 4.00 9.27
All mean 4.54 4.40 4.38 4.60 4.06 4.50 5.00
All SD 0.41 0.38 0.52 0.35 0.72 0.41 3.08