Embed Size (px)
Citation preview
39
Pakistan Economic and Social Review Volume 48, No. 1 (Summer 2010), pp. 39-60
RELATIONSHIP BETWEEN SCHOOL EDUCATION AND ECONOMIC GROWTH IN PAKISTAN ARDL Bounds Testing Approach to Cointegration
MUHAMMAD AFZAL, MUHAMMAD SHAHID FAROOQ HAFIZ KHALIL AHMAD, ISHRAT BEGUM and M. ABDUL QUDDUS*
Abstract. The present study is designed to investigate short-run and long-run linkage between school education and economic growth in Pakistan using annual time series data on real GDP, real physical capital, inflation and general school enrollment for the period 1970-71 to 2008-09. Cointegration between school education and economic growth is found in the present study. The results of this study also confirm the existence of direct relationship between school education and economic growth in Pakistan, both in the short-run and the long-run. Macroeconomic instability due to inflation retards economic growth both in the short-run and the long-run while it retards school education only in the long-run. A statistical significant and inverse relationship between school education and economic growth is observed only in the short-run.
I. INTRODUCTION Education is generally considered as a powerful tool in reducing poverty, enhancing economic growth, empowering people, improving private earnings, promoting a flexible and healthy environment and creating competitive economy. It plays a vital role in shaping the way in which future generations learn to cope with the complexities of economic growth. Educational institutions prepare the citizens to be able to participate actively in all walks of life including economic activities. Human capital has proved *The authors, respectively, are Lecturer, Department of Economics; Lecturer, Institute of
Education and Research; Assistant Professor, Department of Economics at the University of the Punjab, Lahore; Lecturer in Political Science, Queen Marry College, Lahore; and Director, Punjab Economic Research Institute, P&D Department, Lahore (Pakistan).
40 Pakistan Economic and Social Review
itself to be one of the most important determinants of sustainable economic growth and hence development. The positive and significant contribution of human capital through education development is being well recognized. Most of the studies on education and productivity witness their significant positive correlation (Lockheed, Jamison and Lan, 1980). High drop out from school causes a decline in human capital which ultimately hampers development and economic growth (Seebens and Wobst, 2003).
Education has multidimensional impacts on the economy. On one side, it influences economic growth positively and on the other, it reduces poverty and creates such a social and political environment that attracts investment. It makes workers more productive, more polite and promotes reasonable socio economic policies. Education development plays a vital role not only in economic development but in the overall development process of the nation also. The role of education in building the efficient and effective labour force is well recognized. McMahon (1998), using cross country panel data for East Asia and measuring human capital by gross enrollment rates, found that secondary and higher education expenditures were more significant in enhancing enrollments.
Two periods, (a) 1950s and 1960s and (b) late 1980s and 1990s, are very important regarding economic growth theories. In the first period, physical capital proved to be the major contributing factor towards economic growth (neo classical growth theories). Neo classical theorists believe that increase in physical capital can enhance economic growth. In the growth models of Solow (1956), Cass and Coupmanes (1965), Romer (1987), Barro (1990), and some others, population and technological progress were exogenously determined. The research on growth theories in the first period failed to provide the satisfactory answer to the question of how a sustainable economic growth can be achieved? Human capital (acquisition of knowledge and skills) proved to be one of the main sources of sustainable economic growth in the second period (endogenous growth theories). Romer (1986, 1990) and Lucas (1988) in their endogenous growth models gave a central role to education in the economic growth process. Renelt and Levine (1992) found that education appeared to exert a high positive impact on economic growth.
The human capital formed in youth through better schooling is an important determinant of long-run economic growth. Schooling is persis-tently and consistently found to enhance productivity and hence individual’s earning. Emadzadeh et al. (2000) analyzed the effect of education on economic growth in Iran and found that education had a positive and
AFZAL et al.: School Education and Economic Growth in Pakistan 41
significant effect on economic growth. Contribution of education towards growth in real output proved to be higher than physical capital contribution. Similar results for Iran were observed by Nili and Nafisi (2003), Mohamadi (2006), Dargahi and Gadiri (2003), and Komijani and Memernejad (2004).
The role of education cannot be ignored or dishonored for the development of competitive, integrated and knowledge based progressive society at national and international levels. It is an integral component or agent for the economic growth of a country. Educational enterprises and institutions serve as power houses for the production of progressive work force in the country (Saint, 2009). Process of education starts right from the birth of an individual and continues till the end of life. It is an ongoing process and is usually seen as growth. Education can be attained formally and informally (Moser and Eliot, 2005).
Human capital is measured by using its proxy as enrollment rate of primary, secondary and tertiary level (Chatterji, 1998). Countries having high rate of enrollment in schools made faster growth in per capita income because high enrollment rate causes rapid improvement in productivity (Bils and Klenow, 2000). Progress and prosperity of a nation depends upon the state of economy of a country. Economy of a country depends upon labour productivity which relies on education. In the long-run, growth of educational opportunities and level of education attained by the individual leads to the economic growth rate and household income (Seebens and Wobst, 2003).
The significance and direct role of education cannot be ignored for sustainable development. Poverty and inflation are stumbling block for achieving economic development. Education and human capital are essential ingredients for economic growth. Poverty and education are expected to be inversely correlated. Knowledge and skills are imparted through education (Tilak, 1994). Human poverty reduces as education improves because the latter enhances the income. This increase in income helps in fulfilling the basic needs of individuals. It is also noted that lack of education and poverty are mutually reinforced by each other at macro as well as micro levels. Education poverty leads to income poverty (Tilak, 2005; Awan, Malik and Sarwar, 2008).
Pakistan came into being in 1947, with literacy rate of about 10% and only 10,000 primary schools. After implementing various policy measurers and reforms, the literacy rate in Pakistan became 29.5%, 40.7%, 52.7% and 57.4% in 1980s, 1990s, 2000s and 2008-09 respectively This increase in literacy rate is far below the Millennium Development Goals’s literacy rate.
42 Pakistan Economic and Social Review
The Government of Pakistan has set a target to raise the literacy rate to 85% by 2015. The number of primary, middle and high schools in the country has reached 147,700, 25,500 and 14,800 in 2000-01 and 157,400, 40,800 and 24,000 in 2007-08 respectively. The primary, middle and high school enrolment in the country has reached to 14,104, 3,759 and 1,565 thousands in 2000-01. It increased and became 18,715, 5,445 and 2,700 thousands in 2009-10. There are 230,699 educational institutions in the country in 2009-10 out of which 222,700 are school educational institutions (156,400 are primary, 41,500 are middle and 24,800 are high schools). Three levels of education, i.e. school, college and university exist in Pakistan. School level is further categorized as: Primary (grade 1 to 5), Middle (grade 6 to 8) and Matric (grade 9 to 10). Education in Pakistan is a provincial subject and only 2.1% of GNP was spent on it in the fiscal year 2008-09. Education expenditure as a percentage of GNP remained 0.8%, 2.3%, and 2.1% in 1980s, 1990s, and 2000s respectively (Finance Division, 2009). The main focus of different policy measures and reforms was to make school education more functional and more productive. In order to increase school education, schools educational expenditure as a percentage of GDP must be increased that has almost remained stagnant for decades. All the educational policies and reforms since independence focused on the improvement of supply side determinants of school education. Demand side determinants of school education, especially household demand side characteristics, need to be addressed to further increase school education.
Schooling of the individuals has a positive effect on the economic growth of a country. Schooling and economic growth are highly positively correlated with each other (Barro, 1991; Benhabib and Spiegel, 1994; Barro and Sala-i-Martin, 1995; 1997). There exist many other variables like inflation, poverty, physical capital, political instability, literacy, socioeconomic status, foreign aid, microeconomic and macroeconomic policies which affect directly or indirectly both the main variables, i.e. school education and economic growth. In spite of clear linkage between school education and economic growth, there exists hardly any study for Pakistan that has empirically examined the relationship among school education and economic growth with the inclusion of inflation and poverty. Much attention has been paid to empirically investigating the role of higher education in enhancing economic growth in Pakistan. The main purpose of the present study is to empirically examine the linkage between school education and economic growth of Pakistan in the presence of some other relevant economic variables like physical capital, poverty and inflation that may have significant relationship with the two variables under consideration.
AFZAL et al.: School Education and Economic Growth in Pakistan 43
It may be noted that the present study is confined only to relationship between general school education and economic growth. It does not study the role of technical and vocational school education because the time series data for technical and vocational education for the whole period 1970-71 to 2008-2009 are not available in case of Pakistan. This study does also not focus on the aspect that how supply side or demand side or both supply side and demand side determinants of school education affect the relationship between school education and economic growth. It may be further noted that this study is of unique significance because this is perhaps the first study in Pakistan that utilizes ARDL approach to cointegration to examine the short-run (SR) and long-run (LR) relationship between school education and economic growth in Pakistan.
OBJECTIVES OF THE STUDY This study aims:
● To examine the relationship between economic growth and school education development with inclusion of some other macroeconomic variables such as physical capital, poverty and inflation.
● To evaluate empirically SR and LR effect of school education on economic growth in Pakistan.
II. METHODOLOGY AND DATA SOURCES
DATA SOURCES The underlying study comprises of the relationship between school education and economic growth in Pakistan. In this study, the annual time series data for the period 1970-71 to 2008-09 were used. The data were taken from various issues of Pakistan Economic Survey, Pakistan Labour Force Survey, State Bank of Pakistan Annual Reports and 50 Years of Pakistan in Statistics.
METHODOLOGY The specification of the regression models for the variables: economic growth, school education and poverty are given below:
EGr = f (PC, MEI, Edu, POV) (Model 1)
Edu = f (EGr, MEI, POV) (Model 2)
POV = f (EGr, MEI, Edu) (Model 3)
44 Pakistan Economic and Social Review
Various functional forms of the above models were experimented, however, only the best possible ones are presented below:
ln (EGr) = α0 + α1 (PC) + α2 (MEI) + α3 (Edu) + α4 (POV) + εt (Model 4)
ln (Edu) = β0 + β1 ln (EGr) + β2 ln (MEI) + β3 (POV) + εt (Model 5)
POV = γ0 + γ1 (EGr) + γ2 (MEI) + γ3 (Edu) + εt (Model 6)
Where,
ln = Natural logarithm
EGr = Real GDP as a measure of economic growth. This proxy has been utilized by Abbas and Peck (2007), Jin (2008), Katircioglu (2009), Islam, Wadud and Islam (2007) and Chaudhary, Iqbal and Gillani (2009).
PC = Fixed capital formation in real term as a measure of physical capital. Gross fixed capital formation deflated by GDP deflator. This proxy for RPC has been used by Abbas and Peck (2007), Khorasgani (2008), and Chaudhary, Iqbal and Gillani (2009). PC is considered as the fundamental ingredient of growth theories.
Edu = School enrollment ratio (%) as a measure of general school education. School education enrollment ratio is derived by dividing total school enrollment (5-15 years) to the population of that age group. This proxy has been used by Hassan and Ahmed (2008).
MEI = Inflation rate or GDP deflator as one of the measure of macroeconomic instability.
POV = Head count index as a measure of absolute poverty.
To avoid any possibility of specification bias due to omission of important variables from a bivariate regression model, i.e. EGr = f (Edu), the variables: PC, MEI and POV have been included in the model.
The SR and LR relationship between school education and economic growth was estimated by using ARDL approach to cointegration. A brief introduction of ARDL model is given below.
AFZAL et al.: School Education and Economic Growth in Pakistan 45
AUTOREGRESSIVE DISTRIBUTIVE LAG (ARDL) APPROACH TO COINTEGRATION ARDL approach to cointegration was developed by Pesaran et al. (2001). It is a unification of autoregressive models and distributed lag models. In any ARDL model, a time series is a function of its lagged values, current and lagged values of one or more explanatory variables.
ARDL approach to cointegration is not only capable of distinguishing between dependent and explanatory variables (i.e. it avoids the problem of endogeneity) but can also simultaneously estimate LR and SR components of the model. This approach also removes the problems associated with the omitted variables and autocorrelation. The estimates obtained from the ARDL approach to cointegration are unbiased and efficient since they avoid the problems that may arise due to serial correlation and endogeneity (Pesaran, Shin and Smith, 2001).
ARDL approach to cointegration has some merits over and above the other cointegration technique, such as: Engle and Granger (1987), Johansen (1988), Johansen-Juselius (1990), Gregory and Hansen (1996), Saikkonen and Lutkepohl (2000). The ARDL bounds testing approach to cointegration can be applied irrespective of whether the regressors are of I(0) or I(1). However, it requires that the dependent variable is of I(1) in levels and none of the explanatory variables is I(2) or higher.
Following Pesaran and Pesaran (1997), Pesaran and Shin (1999) and Pesaran and Smith (2001), the error-correction version of ARDL model of Model 1 can be written as follows:
Δ ln (EGr) = a + ∑=
n
iib
1 Δ ln (EGr)t–i + ∑
=
n
iic
0 Δ (PC)t–i +
∑=
n
iid
0 Δ (MEI)t–i + ∑
=
n
iie
0 Δ (Edu)t–i +
∑=
n
iip
0 Δ (POV)t–i + δ1 ln EGrt–1 + δ2 PCt–1 +
δ3 MEIt–1 + δ4 (Edut–1) + δ5 (Povt–1) + εt (Model 7)
Similarly the error-correction version of ARDL models for Model 2 and Model 3 can be written. ARDL model uses a three-step procedure:
(a) Dynamic analysis
(b) Long-run relationship
(c) ECM analysis
46 Pakistan Economic and Social Review
The coefficients (a, b, c, d, e) of part first of Model 7 measure the SR dynamics of the model whereas δs represents the LR relationship.
III. EMPIRICAL RESULTS AND ANALYSIS
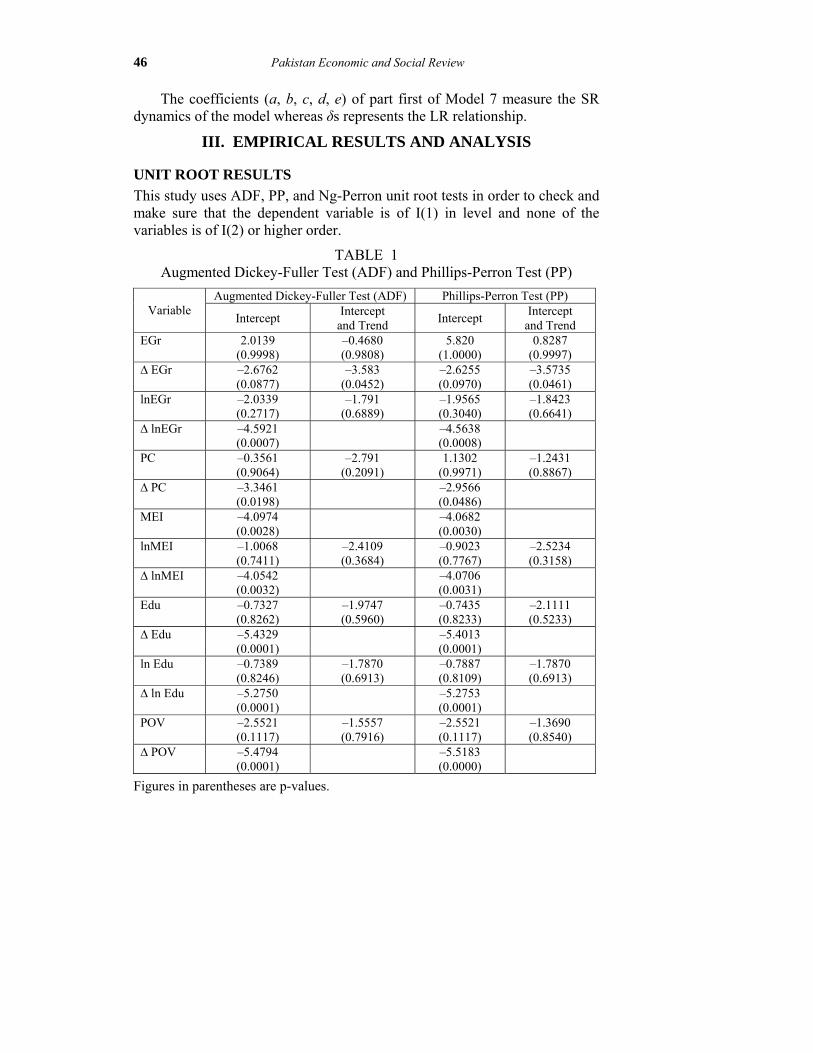
UNIT ROOT RESULTS This study uses ADF, PP, and Ng-Perron unit root tests in order to check and make sure that the dependent variable is of I(1) in level and none of the variables is of I(2) or higher order.
TABLE 1 Augmented Dickey-Fuller Test (ADF) and Phillips-Perron Test (PP)
Augmented Dickey-Fuller Test (ADF) Phillips-Perron Test (PP) Variable Intercept Intercept
and Trend Intercept Intercept and Trend
EGr 2.0139 (0.9998)
–0.4680 (0.9808)
5.820 (1.0000)
0.8287 (0.9997)
∆ EGr –2.6762 (0.0877)
–3.583 (0.0452)
–2.6255 (0.0970)
–3.5735 (0.0461)
lnEGr –2.0339 (0.2717)
–1.791 (0.6889)
–1.9565 (0.3040)
–1.8423 (0.6641)
∆ lnEGr –4.5921 (0.0007)
–4.5638 (0.0008)
PC –0.3561 (0.9064)
–2.791 (0.2091)
1.1302 (0.9971)
–1.2431 (0.8867)
∆ PC –3.3461 (0.0198)
–2.9566 (0.0486)
MEI –4.0974 (0.0028)
–4.0682 (0.0030)
lnMEI –1.0068 (0.7411)
–2.4109 (0.3684)
–0.9023 (0.7767)
–2.5234 (0.3158)
∆ lnMEI –4.0542 (0.0032)
–4.0706 (0.0031)
Edu –0.7327 (0.8262)
–1.9747 (0.5960)
–0.7435 (0.8233)
–2.1111 (0.5233)
∆ Edu –5.4329 (0.0001)
–5.4013 (0.0001)
ln Edu –0.7389 (0.8246)
–1.7870 (0.6913)
–0.7887 (0.8109)
–1.7870 (0.6913)
∆ ln Edu –5.2750 (0.0001)
–5.2753 (0.0001)
POV –2.5521 (0.1117)
–1.5557 (0.7916)
–2.5521 (0.1117)
–1.3690 (0.8540)
∆ POV –5.4794 (0.0001)
–5.5183 (0.0000)
Figures in parentheses are p-values.
AFZAL et al.: School Education and Economic Growth in Pakistan 47
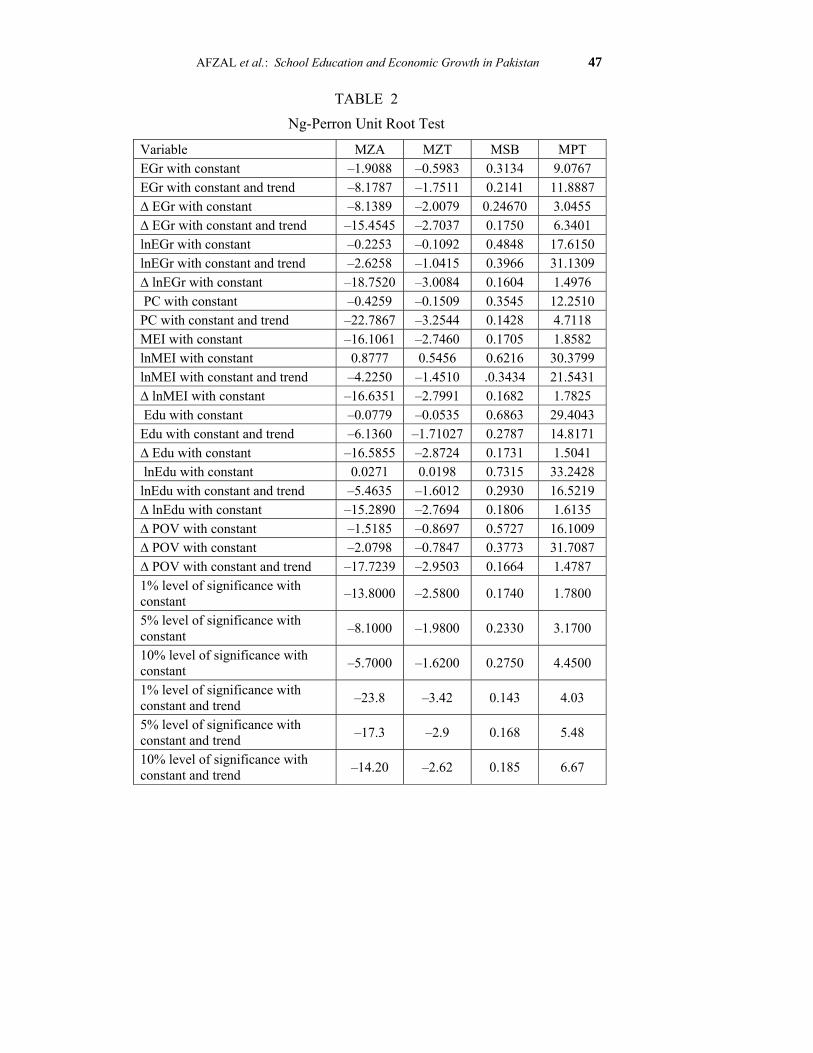
TABLE 2
Ng-Perron Unit Root Test
Variable MZA MZT MSB MPT EGr with constant –1.9088 –0.5983 0.3134 9.0767 EGr with constant and trend –8.1787 –1.7511 0.2141 11.8887 ∆ EGr with constant –8.1389 –2.0079 0.24670 3.0455 ∆ EGr with constant and trend –15.4545 –2.7037 0.1750 6.3401 lnEGr with constant –0.2253 –0.1092 0.4848 17.6150 lnEGr with constant and trend –2.6258 –1.0415 0.3966 31.1309 ∆ lnEGr with constant –18.7520 –3.0084 0.1604 1.4976 PC with constant –0.4259 –0.1509 0.3545 12.2510 PC with constant and trend –22.7867 –3.2544 0.1428 4.7118 MEI with constant –16.1061 –2.7460 0.1705 1.8582 lnMEI with constant 0.8777 0.5456 0.6216 30.3799 lnMEI with constant and trend –4.2250 –1.4510 .0.3434 21.5431 ∆ lnMEI with constant –16.6351 –2.7991 0.1682 1.7825 Edu with constant –0.0779 –0.0535 0.6863 29.4043 Edu with constant and trend –6.1360 –1.71027 0.2787 14.8171 ∆ Edu with constant –16.5855 –2.8724 0.1731 1.5041 lnEdu with constant 0.0271 0.0198 0.7315 33.2428 lnEdu with constant and trend –5.4635 –1.6012 0.2930 16.5219 ∆ lnEdu with constant –15.2890 –2.7694 0.1806 1.6135 ∆ POV with constant –1.5185 –0.8697 0.5727 16.1009 ∆ POV with constant –2.0798 –0.7847 0.3773 31.7087 ∆ POV with constant and trend –17.7239 –2.9503 0.1664 1.4787 1% level of significance with constant –13.8000 –2.5800 0.1740 1.7800
5% level of significance with constant –8.1000 –1.9800 0.2330 3.1700
10% level of significance with constant –5.7000 –1.6200 0.2750 4.4500
1% level of significance with constant and trend –23.8 –3.42 0.143 4.03
5% level of significance with constant and trend –17.3 –2.9 0.168 5.48
10% level of significance with constant and trend –14.20 –2.62 0.185 6.67
48 Pakistan Economic and Social Review
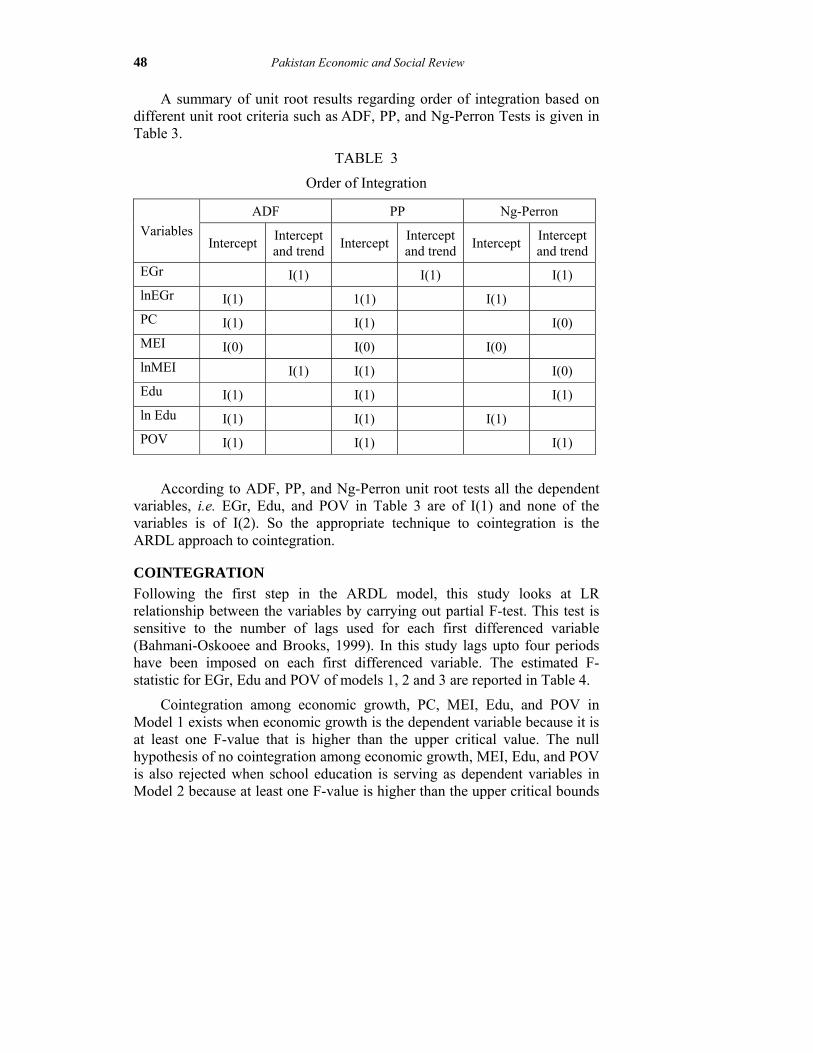
A summary of unit root results regarding order of integration based on different unit root criteria such as ADF, PP, and Ng-Perron Tests is given in Table 3.
TABLE 3
Order of Integration
ADF PP Ng-Perron Variables
Intercept Intercept and trend Intercept Intercept
and trend Intercept Intercept and trend
EGr I(1) I(1) I(1) lnEGr I(1) 1(1) I(1) PC I(1) I(1) I(0) MEI I(0) I(0) I(0) lnMEI I(1) I(1) I(0) Edu I(1) I(1) I(1) ln Edu I(1) I(1) I(1) POV I(1) I(1) I(1)
According to ADF, PP, and Ng-Perron unit root tests all the dependent variables, i.e. EGr, Edu, and POV in Table 3 are of I(1) and none of the variables is of I(2). So the appropriate technique to cointegration is the ARDL approach to cointegration.
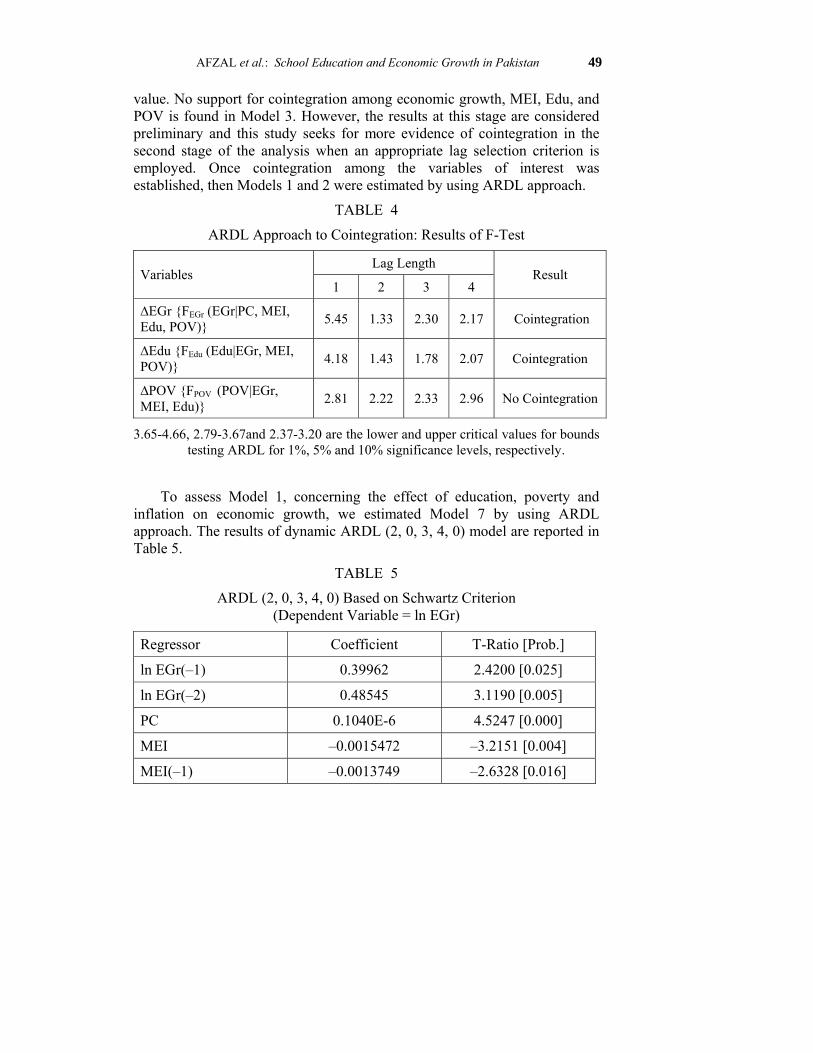
COINTEGRATION Following the first step in the ARDL model, this study looks at LR relationship between the variables by carrying out partial F-test. This test is sensitive to the number of lags used for each first differenced variable (Bahmani-Oskooee and Brooks, 1999). In this study lags upto four periods have been imposed on each first differenced variable. The estimated F-statistic for EGr, Edu and POV of models 1, 2 and 3 are reported in Table 4.
Cointegration among economic growth, PC, MEI, Edu, and POV in Model 1 exists when economic growth is the dependent variable because it is at least one F-value that is higher than the upper critical value. The null hypothesis of no cointegration among economic growth, MEI, Edu, and POV is also rejected when school education is serving as dependent variables in Model 2 because at least one F-value is higher than the upper critical bounds
AFZAL et al.: School Education and Economic Growth in Pakistan 49
value. No support for cointegration among economic growth, MEI, Edu, and POV is found in Model 3. However, the results at this stage are considered preliminary and this study seeks for more evidence of cointegration in the second stage of the analysis when an appropriate lag selection criterion is employed. Once cointegration among the variables of interest was established, then Models 1 and 2 were estimated by using ARDL approach.
TABLE 4
ARDL Approach to Cointegration: Results of F-Test
Lag Length Variables
1 2 3 4 Result
∆EGr {FEGr (EGr|PC, MEI, Edu, POV)} 5.45 1.33 2.30 2.17 Cointegration
∆Edu {FEdu (Edu|EGr, MEI, POV)} 4.18 1.43 1.78 2.07 Cointegration
∆POV {FPOV (POV|EGr, MEI, Edu)} 2.81 2.22 2.33 2.96 No Cointegration
3.65-4.66, 2.79-3.67and 2.37-3.20 are the lower and upper critical values for bounds testing ARDL for 1%, 5% and 10% significance levels, respectively.
To assess Model 1, concerning the effect of education, poverty and inflation on economic growth, we estimated Model 7 by using ARDL approach. The results of dynamic ARDL (2, 0, 3, 4, 0) model are reported in Table 5.
TABLE 5
ARDL (2, 0, 3, 4, 0) Based on Schwartz Criterion (Dependent Variable = ln EGr)
Regressor Coefficient T-Ratio [Prob.]
ln EGr(–1) 0.39962 2.4200 [0.025]
ln EGr(–2) 0.48545 3.1190 [0.005]
PC 0.1040E-6 4.5247 [0.000]
MEI –0.0015472 –3.2151 [0.004]
MEI(–1) –0.0013749 –2.6328 [0.016]
50 Pakistan Economic and Social Review
MEI(–2) –0.0021962 –4.3660 [0.000]
MEI(–3) –0.0013580 –2.4387 [0.024]
ln Edu 0.0019646 1.8830 [0.074]
ln Edu(–1) 0.5592E-3 0.39117 [0.700]
ln Edu(–2) –0.0019971 –1.4437 [0.164]
ln Edu(–3) –0.0017290 –1.3541 [0.190]
ln Edu(–4) 0.0041531 4.5552 [0.000]
POV –0.7837E-3 –0.85154 [0.404]
Constant 1.6755 4.9115 [0.000]
R2 = 0.99, F-stat = 7055.8 [0.000], SBC = 95.32, Serial Correlation (LM) = 1.0441 [0.307], Ramsey’s Reset Test = 2.3112 [0.128], Heteroscedasticity (LM) = 0.96818 [0.325], Normality (LM) = 0.028201 [0.986]
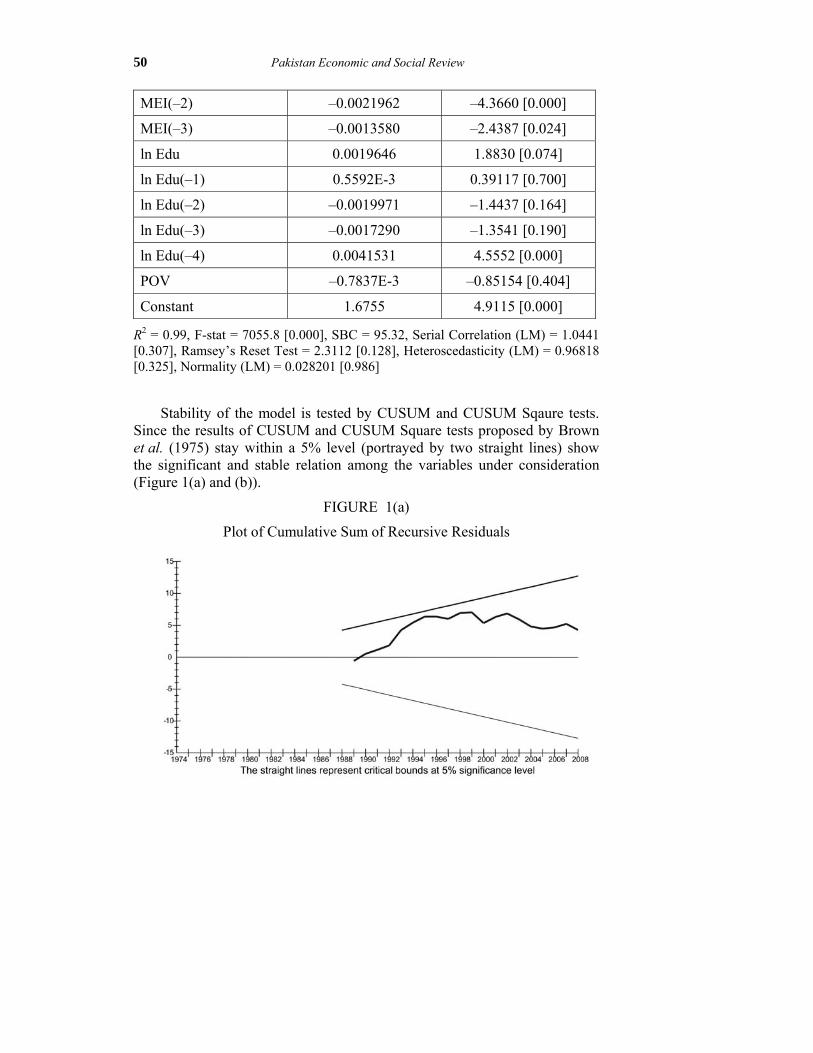
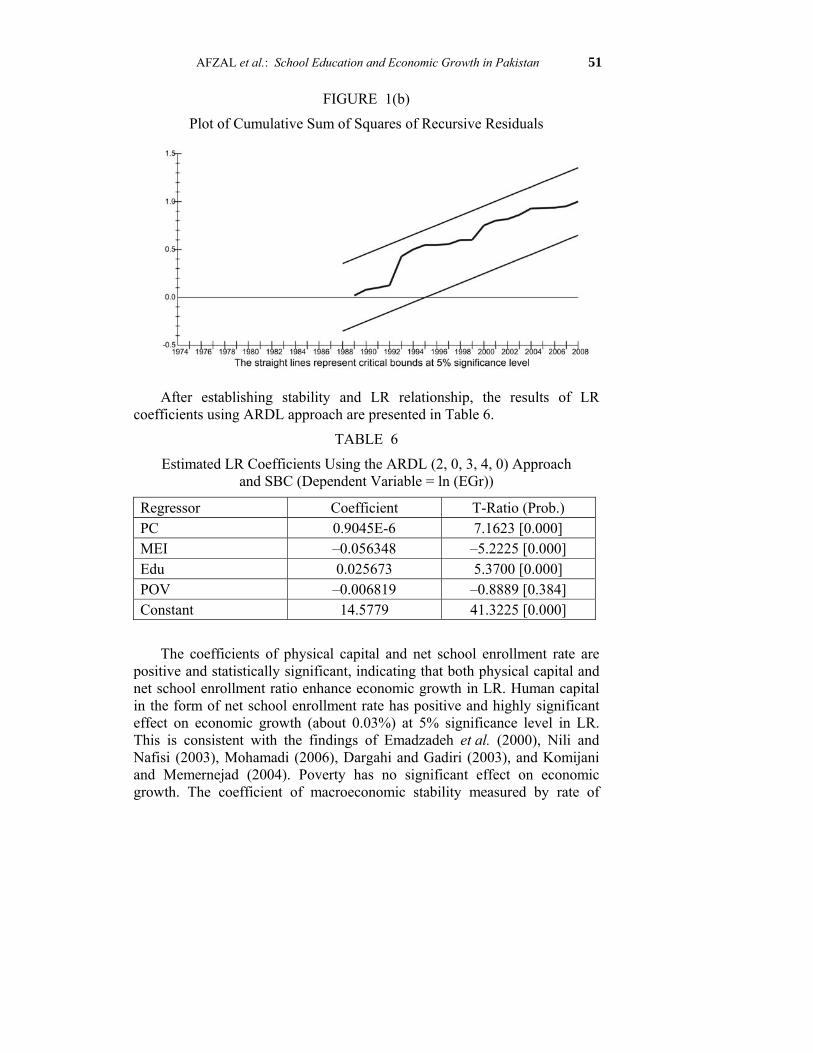
Stability of the model is tested by CUSUM and CUSUM Sqaure tests. Since the results of CUSUM and CUSUM Square tests proposed by Brown et al. (1975) stay within a 5% level (portrayed by two straight lines) show the significant and stable relation among the variables under consideration (Figure 1(a) and (b)).
FIGURE 1(a)
Plot of Cumulative Sum of Recursive Residuals
AFZAL et al.: School Education and Economic Growth in Pakistan 51
FIGURE 1(b)
Plot of Cumulative Sum of Squares of Recursive Residuals
After establishing stability and LR relationship, the results of LR coefficients using ARDL approach are presented in Table 6.
TABLE 6
Estimated LR Coefficients Using the ARDL (2, 0, 3, 4, 0) Approach and SBC (Dependent Variable = ln (EGr))
Regressor Coefficient T-Ratio (Prob.) PC 0.9045E-6 7.1623 [0.000] MEI –0.056348 –5.2225 [0.000] Edu 0.025673 5.3700 [0.000] POV –0.006819 –0.8889 [0.384] Constant 14.5779 41.3225 [0.000]
The coefficients of physical capital and net school enrollment rate are positive and statistically significant, indicating that both physical capital and net school enrollment ratio enhance economic growth in LR. Human capital in the form of net school enrollment rate has positive and highly significant effect on economic growth (about 0.03%) at 5% significance level in LR. This is consistent with the findings of Emadzadeh et al. (2000), Nili and Nafisi (2003), Mohamadi (2006), Dargahi and Gadiri (2003), and Komijani and Memernejad (2004). Poverty has no significant effect on economic growth. The coefficient of macroeconomic stability measured by rate of
52 Pakistan Economic and Social Review
inflation is negative and significant. It means that economic growth retards as macroeconomic instability increases.
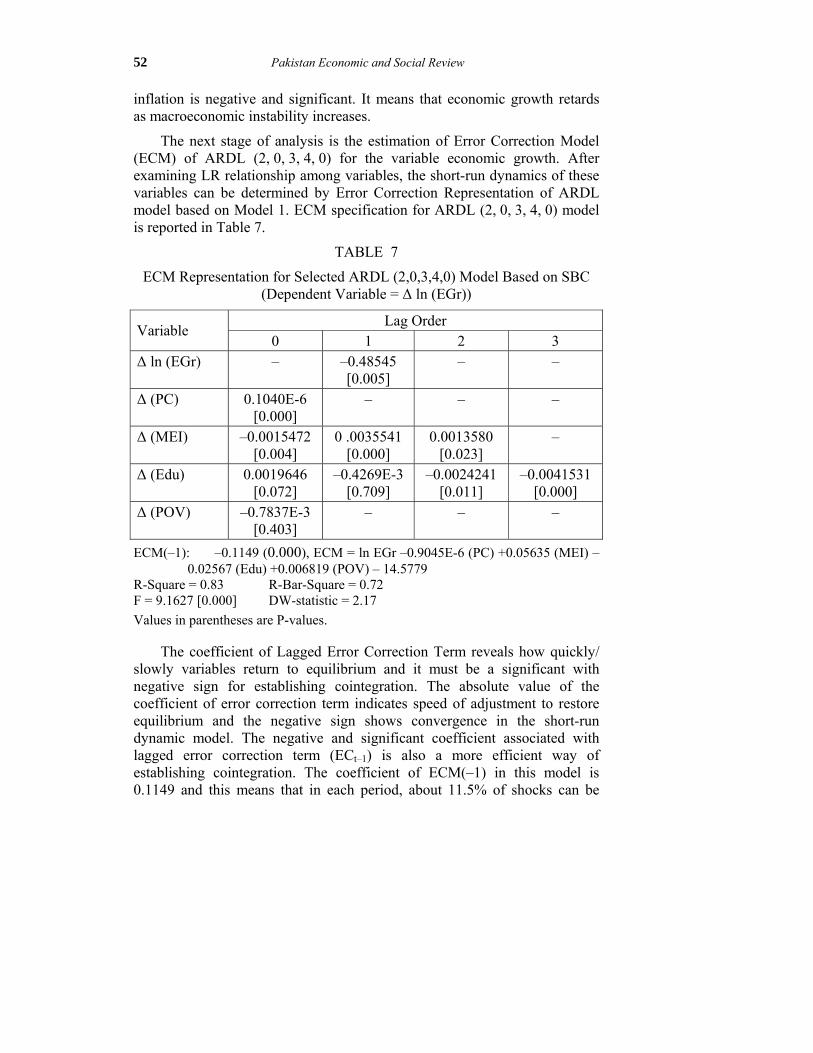
The next stage of analysis is the estimation of Error Correction Model (ECM) of ARDL (2, 0, 3, 4, 0) for the variable economic growth. After examining LR relationship among variables, the short-run dynamics of these variables can be determined by Error Correction Representation of ARDL model based on Model 1. ECM specification for ARDL (2, 0, 3, 4, 0) model is reported in Table 7.
TABLE 7
ECM Representation for Selected ARDL (2,0,3,4,0) Model Based on SBC (Dependent Variable = Δ ln (EGr))
Lag Order Variable
0 1 2 3 Δ ln (EGr) – –0.48545
[0.005] – –
Δ (PC) 0.1040E-6 [0.000]
– – –
Δ (MEI) –0.0015472 [0.004]
0 .0035541 [0.000]
0.0013580 [0.023]
–
Δ (Edu) 0.0019646 [0.072]
–0.4269E-3 [0.709]
–0.0024241 [0.011]
–0.0041531 [0.000]
Δ (POV) –0.7837E-3 [0.403]
– – –
ECM(–1): –0.1149 (0.000), ECM = ln EGr –0.9045E-6 (PC) +0.05635 (MEI) –0.02567 (Edu) +0.006819 (POV) – 14.5779
R-Square = 0.83 R-Bar-Square = 0.72 F = 9.1627 [0.000] DW-statistic = 2.17 Values in parentheses are P-values.
The coefficient of Lagged Error Correction Term reveals how quickly/ slowly variables return to equilibrium and it must be a significant with negative sign for establishing cointegration. The absolute value of the coefficient of error correction term indicates speed of adjustment to restore equilibrium and the negative sign shows convergence in the short-run dynamic model. The negative and significant coefficient associated with lagged error correction term (ECt–1) is also a more efficient way of establishing cointegration. The coefficient of ECM(–1) in this model is 0.1149 and this means that in each period, about 11.5% of shocks can be
AFZAL et al.: School Education and Economic Growth in Pakistan 53
justified as a long-run trend. The coefficient of ECt–1 in our model is negative and highly significant. It implies that, in Pakistan, economic growth, physical capital, school education, inflation and poverty are cointegrated when economic growth serves as dependent variable. The positive and significant effect of physical capital on economic growth is supported by both LR and SR dynamics models. The significant effect of net school enrollment ratio on economic growth is found in SR as well as in LR. An insignificant negative effect of poverty measured by head count index on economic growth is found in the short-run. Inflation, a measure of macroeconomic instability, retards economic growth both in SR and LR.
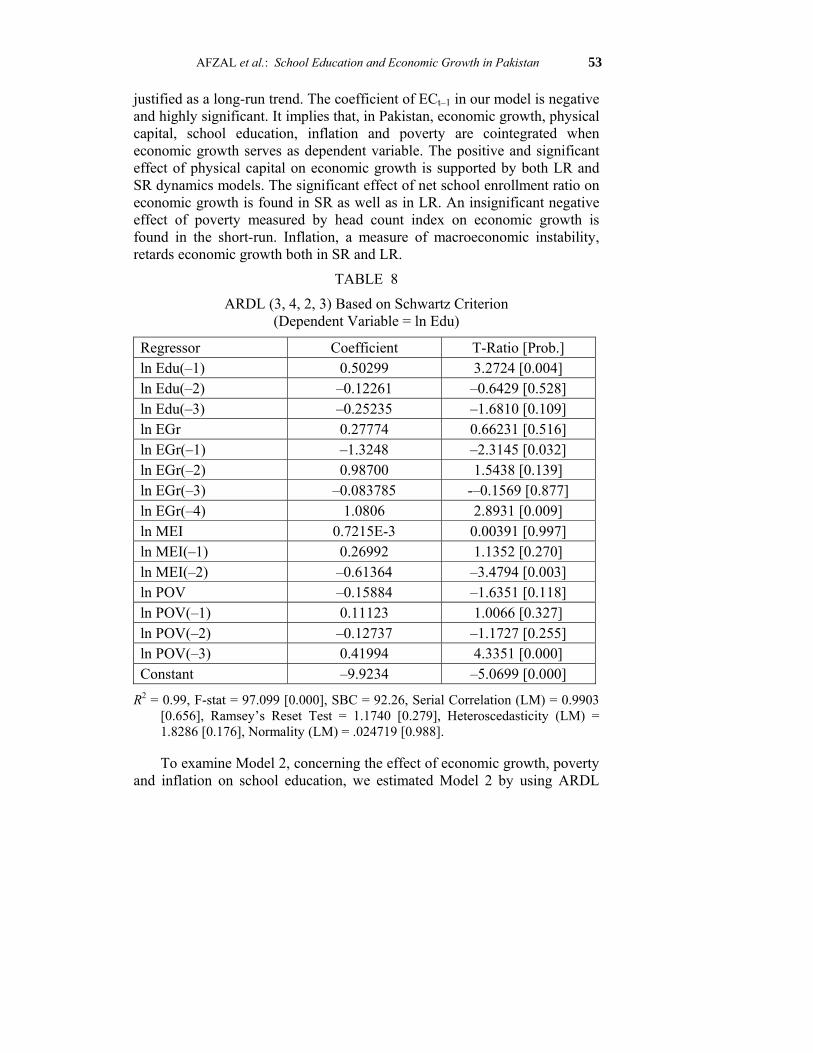
TABLE 8
ARDL (3, 4, 2, 3) Based on Schwartz Criterion (Dependent Variable = ln Edu)
Regressor Coefficient T-Ratio [Prob.] ln Edu(–1) 0.50299 3.2724 [0.004] ln Edu(–2) –0.12261 –0.6429 [0.528] ln Edu(–3) –0.25235 –1.6810 [0.109] ln EGr 0.27774 0.66231 [0.516] ln EGr(–1) –1.3248 –2.3145 [0.032] ln EGr(–2) 0.98700 1.5438 [0.139] ln EGr(–3) –0.083785 -–0.1569 [0.877] ln EGr(–4) 1.0806 2.8931 [0.009] ln MEI 0.7215E-3 0.00391 [0.997] ln MEI(–1) 0.26992 1.1352 [0.270] ln MEI(–2) –0.61364 –3.4794 [0.003] ln POV –0.15884 –1.6351 [0.118] ln POV(–1) 0.11123 1.0066 [0.327] ln POV(–2) –0.12737 –1.1727 [0.255] ln POV(–3) 0.41994 4.3351 [0.000] Constant –9.9234 –5.0699 [0.000]
R2 = 0.99, F-stat = 97.099 [0.000], SBC = 92.26, Serial Correlation (LM) = 0.9903 [0.656], Ramsey’s Reset Test = 1.1740 [0.279], Heteroscedasticity (LM) = 1.8286 [0.176], Normality (LM) = .024719 [0.988].
To examine Model 2, concerning the effect of economic growth, poverty and inflation on school education, we estimated Model 2 by using ARDL
54 Pakistan Economic and Social Review
approach. The results of dynamic ARDL (3, 4, 2, 3) model are reported in Table 8.
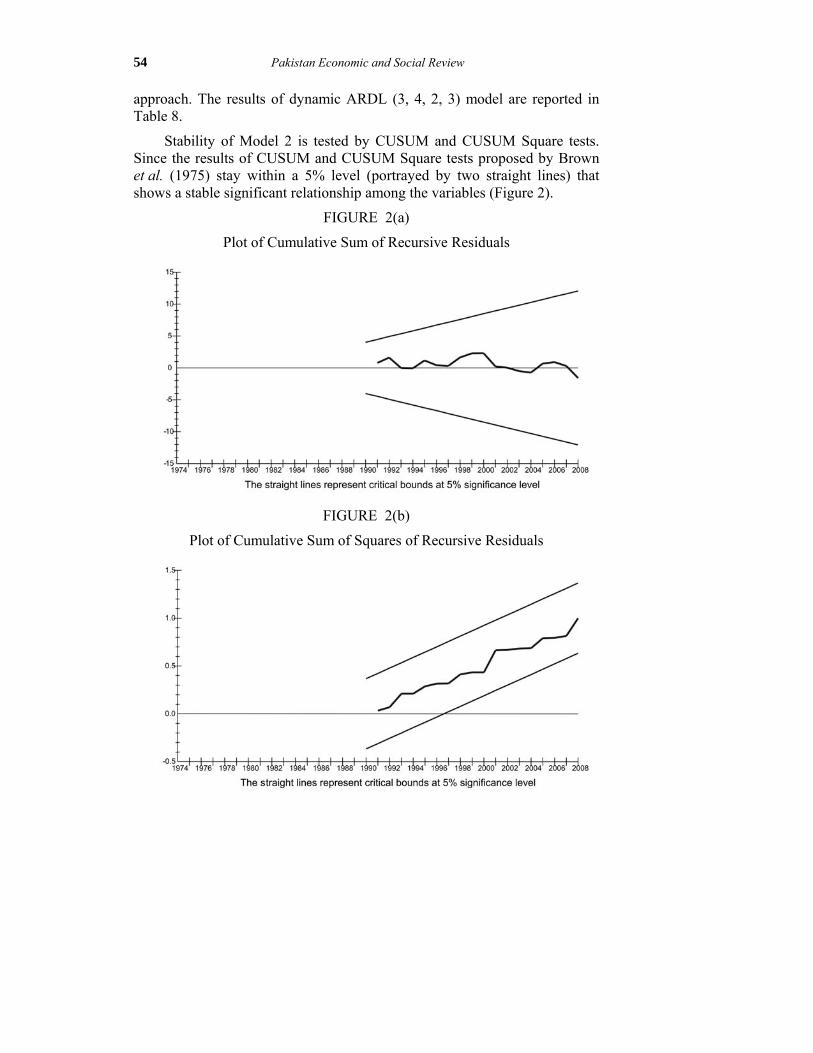
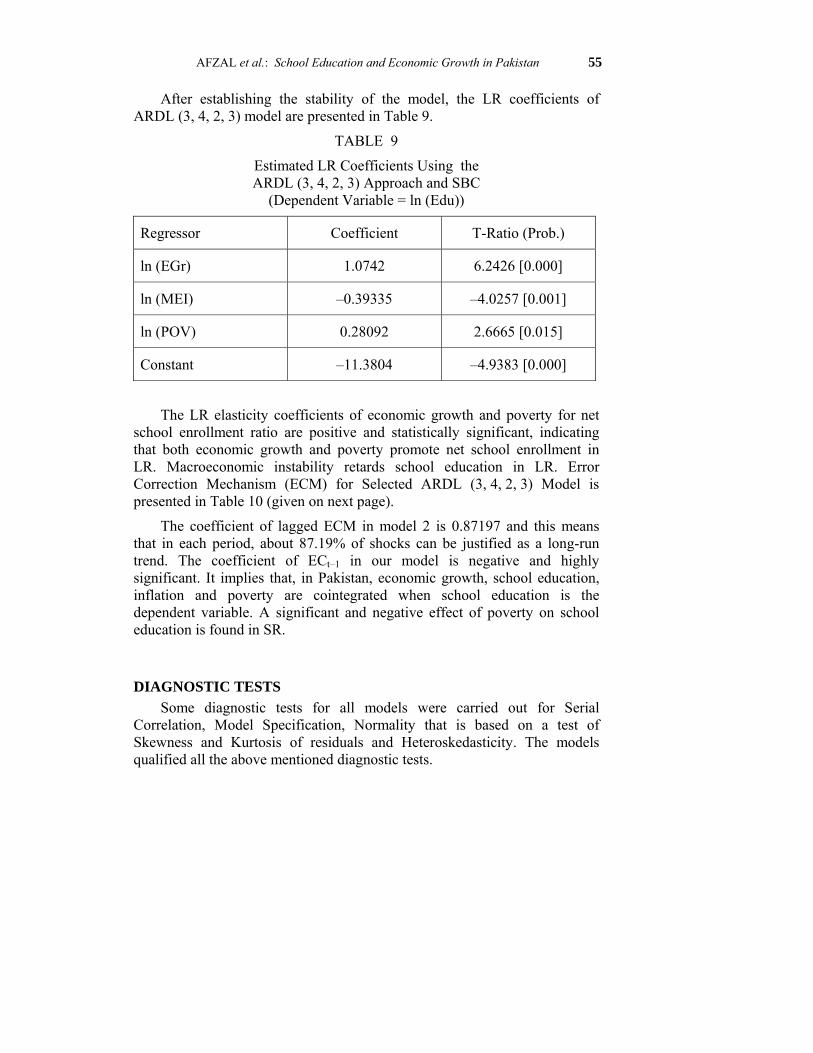
Stability of Model 2 is tested by CUSUM and CUSUM Square tests. Since the results of CUSUM and CUSUM Square tests proposed by Brown et al. (1975) stay within a 5% level (portrayed by two straight lines) that shows a stable significant relationship among the variables (Figure 2).
FIGURE 2(a)
Plot of Cumulative Sum of Recursive Residuals
FIGURE 2(b)
Plot of Cumulative Sum of Squares of Recursive Residuals
AFZAL et al.: School Education and Economic Growth in Pakistan 55
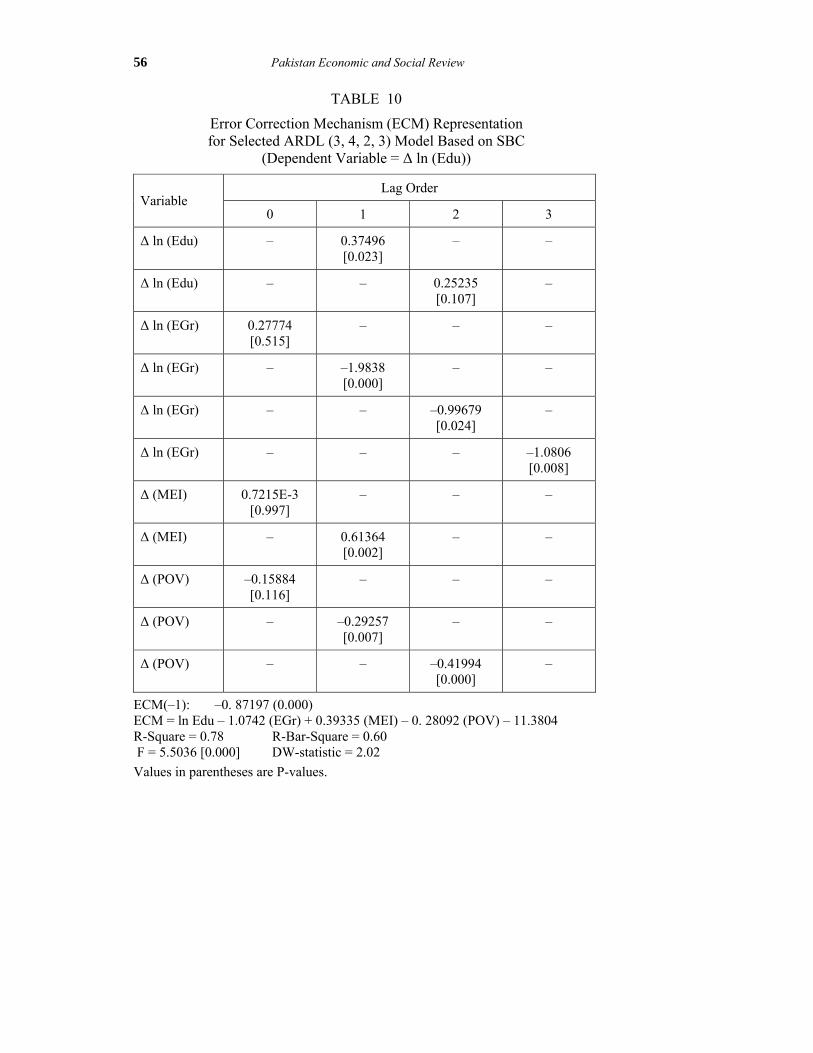
After establishing the stability of the model, the LR coefficients of ARDL (3, 4, 2, 3) model are presented in Table 9.
TABLE 9
Estimated LR Coefficients Using the ARDL (3, 4, 2, 3) Approach and SBC
(Dependent Variable = ln (Edu))
Regressor Coefficient T-Ratio (Prob.)
ln (EGr) 1.0742 6.2426 [0.000]
ln (MEI) –0.39335 –4.0257 [0.001]
ln (POV) 0.28092 2.6665 [0.015]
Constant –11.3804 –4.9383 [0.000]
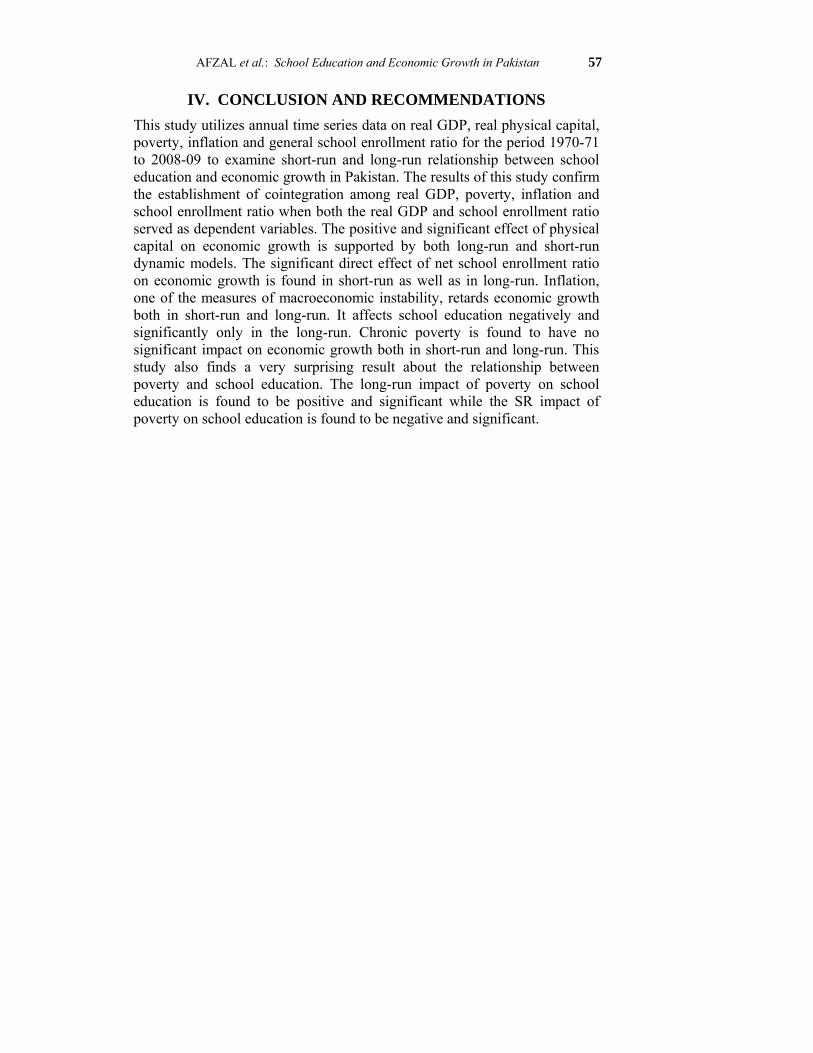
The LR elasticity coefficients of economic growth and poverty for net school enrollment ratio are positive and statistically significant, indicating that both economic growth and poverty promote net school enrollment in LR. Macroeconomic instability retards school education in LR. Error Correction Mechanism (ECM) for Selected ARDL (3, 4, 2, 3) Model is presented in Table 10 (given on next page).
The coefficient of lagged ECM in model 2 is 0.87197 and this means that in each period, about 87.19% of shocks can be justified as a long-run trend. The coefficient of ECt–1 in our model is negative and highly significant. It implies that, in Pakistan, economic growth, school education, inflation and poverty are cointegrated when school education is the dependent variable. A significant and negative effect of poverty on school education is found in SR.
DIAGNOSTIC TESTS Some diagnostic tests for all models were carried out for Serial Correlation, Model Specification, Normality that is based on a test of Skewness and Kurtosis of residuals and Heteroskedasticity. The models qualified all the above mentioned diagnostic tests.
56 Pakistan Economic and Social Review
TABLE 10
Error Correction Mechanism (ECM) Representation for Selected ARDL (3, 4, 2, 3) Model Based on SBC
(Dependent Variable = Δ ln (Edu))
Lag Order Variable
0 1 2 3
Δ ln (Edu) – 0.37496 [0.023]
– –
Δ ln (Edu) – – 0.25235 [0.107]
–
Δ ln (EGr) 0.27774 [0.515]
– – –
Δ ln (EGr) – –1.9838 [0.000]
– –
Δ ln (EGr) – – –0.99679 [0.024]
–
Δ ln (EGr) – – – –1.0806 [0.008]
Δ (MEI) 0.7215E-3 [0.997]
– – –
Δ (MEI) – 0.61364 [0.002]
– –
Δ (POV) –0.15884 [0.116]
– – –
Δ (POV) – –0.29257 [0.007]
– –
Δ (POV) – – –0.41994 [0.000]
–
ECM(–1): –0. 87197 (0.000) ECM = ln Edu – 1.0742 (EGr) + 0.39335 (MEI) – 0. 28092 (POV) – 11.3804 R-Square = 0.78 R-Bar-Square = 0.60 F = 5.5036 [0.000] DW-statistic = 2.02 Values in parentheses are P-values.
AFZAL et al.: School Education and Economic Growth in Pakistan 57
IV. CONCLUSION AND RECOMMENDATIONS This study utilizes annual time series data on real GDP, real physical capital, poverty, inflation and general school enrollment ratio for the period 1970-71 to 2008-09 to examine short-run and long-run relationship between school education and economic growth in Pakistan. The results of this study confirm the establishment of cointegration among real GDP, poverty, inflation and school enrollment ratio when both the real GDP and school enrollment ratio served as dependent variables. The positive and significant effect of physical capital on economic growth is supported by both long-run and short-run dynamic models. The significant direct effect of net school enrollment ratio on economic growth is found in short-run as well as in long-run. Inflation, one of the measures of macroeconomic instability, retards economic growth both in short-run and long-run. It affects school education negatively and significantly only in the long-run. Chronic poverty is found to have no significant impact on economic growth both in short-run and long-run. This study also finds a very surprising result about the relationship between poverty and school education. The long-run impact of poverty on school education is found to be positive and significant while the SR impact of poverty on school education is found to be negative and significant.
58 Pakistan Economic and Social Review
REFERENCES
Abbas, Q. and J. F. Peck (2007), Human capital and economic growth: Pakistan, 1960-2003. Retrieved from www.cardiff.ac.uk/carbs/econ/workingpapers/ papers/ E2007_22.pdf.
Awan, M. S., N. Malik and H. Sarwar (2008), Impact of education on poverty reduction. EABR and TLC Conference proceedings, Germany.
Bahmani-Oskooee, M. and Hafeez ur Rehman (2005), Stability of the money demand function in Asian developing countries. Applied Economics, Volume 37(7), pp. 773-792.
Barro, R. J. (1991), Economic growth in a cross section of countries. Quarterly Journal of Economics, Volume 106(2), pp. 407-443.
Barro, R. J. and X. Sala-i-Martin (1995), Economic Growth. New York: McGraw-Hill.
Benhabib, J. and M. M. Spiegel (1994), The role of human capital in economic development: Evidence from aggregate cross-country data. Journal of Monetary Economics, Volume 34(2), pp. 143-174.
Bils, M. and P. J. Klenow (2000), Does schooling cause growth? The American Economic Review, Volume 90(5), pp. 1160-1183.
Cass, D. and C. Coupmanes (1965), Optimum growth in an aggregative model of capital accumulation. Review of Economic Studies, Volume 32, pp. 233-240.
Chatterji, M. (1998), Tertiary education and economic growth. Regional Studies, Volume 32(4), pp. 349-354.
Chaudhary, A. R., I. Asim and S. Y. M. Gillani (2009), The nexus between higher education and economic growth: An empirical investigation for Pakistan. Pakistan Journal of Commerce and Social Sciences, Volume 3.
Dargahi, J. (2003), Analyses of economic growth elements in Iran. Journal of Research in Economics, p. 26.
Emadzadeh et al. (2000), The role of human capital in economic growth. Journal of Planning and Development, Volume 5(1), pp. 21.
Engel, R. and C. Granger (1987), Cointegration and error correction: Representation, estimation and testing. Econometrica, Volume 55, pp. 251-276.
Government of Pakistan (2010), Pakistan Economic Survey 2009-2010. Islamabad: Finance Division, Economic Advisory Wing.
Gregory, A. W. and B. E. Hansen (1996), Residual-based tests for cointegration in models with Regime Shifts. Journal of Econometrics, Volume 70, pp. 99-126.
AFZAL et al.: School Education and Economic Growth in Pakistan 59
Hassan, S. and H. Ahmed (2008), Education’s contribution to the economic growth of Sub-Saharan Africa. Southwestern Economic Review, Volume 1(32), pp. 175-190.
Islam, T. S., M. A. Wadud and Q. B. T. Islam (2007), Relationship between Education and GDP Growth: A multivariate causality analysis for Bangladesh. Economics Bulletin, Volume 3(35), pp. 1-7.
Jin, J. C. (2009), Economic research and economic growth: Evidence from East Asian Economies. Journal of Asian Economics, Volume 20, pp. 150-155.
Johansen, S. (1988), Statistical analysis of cointegration vectors. Journal of Economic Dynamics and Control, Volume 12, pp. 231-254.
Johansen, S. (1991), Estimation and hypothesis testing of co-integration vectors in Gaussian vector autoregressive models. Econometrica, Volume 59, pp. 1551-1580.
Johansen, S. and K. Juselius (1990), Maximum Likelihood Estimation and Inference on Cointegration with Applications to the Demand for Money. Oxford Bulletin of Economics and Statistics, Volume 52, pp. 169-210.
Khorasgani, M. F. (2008), Higher education development and economic growth in Iran. Education, Business and Society: Contemporary Middle Eastern Issues, Volume 1, pp. 162-174.
Komijani and Memernejad (2004), Impotence of human capital and R&D in economic growth of Iran. Journal of Research in Economics, Volume 31.
Lau, L., D. Jamison, S. Liu and S. Rivkin (1993), Education and economic growth: Some cross-sectional evidence from Brazil. Journal of Development Economics, Volume 41, pp. 45-70.
Lee, M., B. Liu and P. Wang (1994). Education, human capital enhancement and economic development: Comparison between Korea and Taiwan. Economics of Education Review, Volume 13(4), pp. 275-288.
Liu, C. and M. Armer (1993), Education’s effect on economic growth in Taiwan. Comparative Education Review, Volume 37(3), pp. 304-321.
Lockheed, M. E., D. T. Jamison and L. J. Lan (1980), Farmer education and farm efficiency: A survey. Economic Development and Cultural Change, Volume 29, pp. 37-76.
Lucas, R. (1988). On the mechanics of economic development. Journal of Monetary Economics, p. 22.
McMahon, W. (1998), Education and growth in East Asia. Economics of Education Review, Volume 17(2), pp. 159-172.
Mohamadi, A. (2006), Role of education in Iran economic growth: Fars Province. Education, Volume 22(4), pp. 57-84.
60 Pakistan Economic and Social Review
Moser, C. and G. Eliot (2005), Education and Economic Growth. Uppsala: Department of Development Studies.
Nili, M. and S. H. Nafisi (2003), Relationship between human capital and economic growth. Quarterly Journal of Economic Researches of Iran, p. 17.
Pesaran, H. M. and Y. Shin (1999), An autoregressive distributed lag modeling approach to cointegration analysis. In Strom, S. (ed.), Econometrics and Economic Theory in the 20th Century: The Ragnar Frisch Centennial Symposium. Cambridge: Cambridge University Press.
Pesaran, H. M., Y. Shin and R. J. Smith (2001), Bounds testing approaches to the analysis of long-run relationships. Journal of Applied Econometrics, Volume 16, pp. 289-326.
Pesaran, M. H. and B. Pesaran (1997), Working with Microfit 4.0: Interactive Econometric Analysis. Oxford: Oxford University Press.
Renelt, D. and R. Levine (1992), A sensitivity analysis of cross country growth regressions. American Economic Review, Volume 82, pp. 942-963.
Romer, P. (1987), Endogenous technical change. Journal of Political Economy, Volume 89, pp. 71-102.
Saikkonen, P. and H. Lutkepohl (2000), Testing for the cointegration rank of a VAR process with structural shifts. Journal of Business and Economic Statistics, Volume 18(4), pp. 451-464.
Saint, W. (2009), Tertiary education and economic growth in sub-Saharan Africa. The World Bank Report. Retrieved April 29, 2009, from www.bc.edu/bc_org/ avp/soe/cihe/newsletter/Number 54/p14_saint.htm.
Sala-i-Martin, X. (1997), I just ran four million regressions. Cambridge: National Bureau of Economic Research, Working Paper No. 6252.
Seebens, H. and P. Wobst (2003), The Impact of Increased School Enrollment on Economic Growth in Tanzania. Bonn: Center for Development Research.
Solow, R. M. (1956), A contribution to the theory of economic growth. Quarterly Journal of Economics, Volume 70, pp. 65-95.
Tilak, Jandhyala B. G. (1994), Education for Development in Asia. Sage Publications.
Tilak, Jandhyala B. G. (2005), Post-elementary education, poverty and development in India. Post-Basic Education and Training Working Paper Series No. 6, Centre of African Studies, University of Edinburgh.