Embed Size (px)
Citation preview
RELATIONSHIP OF HISPANIC STUDENTS’ SCHOOL ABSENTEEISM TO
MATHEMATICS ACHIEVEMENT AND INTEREST IN STEM CAREERS
by
Rolando Casado
Liberty University
A Dissertation Presented in Partial Fulfillment
Of the Requirements for the Degree
Doctor of Education
Liberty University
October 2020
2
RELATIONSHIP OF HISPANIC STUDENTS’ SCHOOL ABSENTEEISM TO
MATHEMATICS ACHIEVEMENT AND INTEREST IN STEM CAREERS
by Rolando Casado
A Dissertation Presented in Partial Fulfillment
Of the Requirements for the Degree
Doctor of Education
Liberty University, Lynchburg, VA
October 2020
APPROVED BY:
Jillian L. Wendt, Ed.D., Committee Chair
Shante Austin, Ph.D., Committee Member
3
ABSTRACT
The purpose of this bivariate correlational study was to identify whether there was a relationship
between Hispanic students’ high school absenteeism and their scores on the Algebra I Florida
Standards Assessment (FSA) and to identify whether there was a relationship between Hispanic
students’ high school absenteeism and their aspiration to pursue STEM careers. The population
sample consisted of 431 Hispanic students from two Title I high schools located in a Florida
school district. A quantitative design was used for this study and the researcher obtained ex
post facto data from the high schools with the largest number of enrolled Hispanic students in
the school district in the 2018-2019 school year. The data collected included achievement data
from test standard scale scores, attendance records including the number of days absent for the
year, and career survey information from 431 Hispanic students enrolled in both high schools.
Gender breakdown of 221 males and 210 females provides for 51% males and 49% females of
the total sample. Instruments used to obtain data include the Algebra I FSA, FOCUS school
gradebook software to track absenteeism, and Naviance webtool ‘Do What You Are’ (N-
DWYA) survey. SPSS 25® generated two bivariate linear regressions for the study. Results
indicated that Hispanic students’ high school absenteeism was not a statistically significant
predictor of Algebra 1 FSA standard scale scores for null hypothesis one. Results indicated that
Hispanic students’ interest to pursue STEM careers was not a statistically significant predictor
of students’ high school absenteeism for null hypothesis two. The conclusion along with any
limitations and recommendations for future research are reported.
Keywords: absenteeism, compulsory age, expectancy-value theory, gatekeeper, STEM,
truancy
4
Dedication
I dedicate this work to my Lord Jesus Christ and savior for giving me the resilience to
continue working and still able to manage my home responsibilities. Through it all, I can say
that it was not the strength of my own strength and leading of His Holy Spirit. To some of my
brothers and sisters from the church, I am grateful as they have picked up some of my functions
during the last three years and have prayed so I could be focused on this important work. I am
thankful for my family’s tolerance as they have missed me in events , yet understood my labor
and commitment to this project. And finally, my amazing loving wife Ana, whose support has
been selfless and unconditional. She has made sure our home was a peaceful environment where
I could work on my dissertation two or three nights each week. We have made this
accomplishment possible through mutual sacrifice, effort, and love. Thank you.
5
Table of Contents
ABSTRACT............................................................................................................................ 3
Dedication (Optional) .............................................................................................................. 4
List of Tables .......................................................................................................................... 8
List of Figures ......................................................................................................................... 9
List of Abbreviations ............................................................................................................. 10
CHAPTER ONE: INTRODUCTION ..................................................................................... 12
Overview ................................................................................................................... 12
Background................................................................................................................ 12
Problem Statement ..................................................................................................... 18
Purpose Statement ...................................................................................................... 20
Significance of the Study ............................................................................................ 21
Research Questions .................................................................................................... 22
Definitions ................................................................................................................. 22
CHAPTER TWO: LITERATURE REVIEW .......................................................................... 25
Overview ................................................................................................................... 25
Theoretical Framework............................................................................................... 25
Related Literature....................................................................................................... 35
Mathematics as a Gatekeeper........................................................................... 38
Factors Affecting Hispanic Students’ Mathematics Achievement...................... 42
Hispanics in STEM Careers............................................................................. 49
Summary ................................................................................................................... 53
CHAPTER THREE: METHODS ........................................................................................... 56
6
Overview ................................................................................................................... 56
Design ....................................................................................................................... 56
Research Questions .................................................................................................... 57
Hypothesises .............................................................................................................. 58
Participants and Setting .............................................................................................. 58
Instrumentation .......................................................................................................... 59
Procedures ................................................................................................................. 63
Data Analysis............................................................................................................. 64
CHAPTER FOUR: FINDINGS.............................................................................................. 67
Overview ................................................................................................................... 67
Research Questions .................................................................................................... 67
Null Hypotheses ......................................................................................................... 67
Descriptive Statistics .................................................................................................. 68
Assumptions Testing .................................................................................................. 69
Results ....................................................................................................................... 73
Hypothesis One............................................................................................... 73
Hypothesis Two .............................................................................................. 74
Summary ................................................................................................................... 76
CHAPTER FIVE: CONCLUSIONS....................................................................................... 77
Overview ................................................................................................................... 77
Discussion ................................................................................................................. 77
Implications ............................................................................................................... 79
Limitations................................................................................................................. 80
7
Recommendations for Future Research ....................................................................... 81
REFERENCES...................................................................................................................... 83
APPENDICES .................................................................................................................... 107
Appendix A ............................................................................................................. 107
Appendix B.............................................................................................................. 109
8
List of Tables
Table 1: MBTI Types Correlation to Career Clusters ............................................................. 63
Table 2: Descriptive Frequency of Participants ...................................................................... 68
Table 3: Descriptive Statistics of Variables............................................................................ 69
Table 4: Model 1 Correlation between Variables.................................................................... 74
Table 5: Model 1 ANOVA Totals ......................................................................................... 74
Table 6: Model 2 Correlation between Variables.................................................................... 75
Table 7: Model 2 ANOVA totals........................................................................................... 75
9
List of Figures
Figure 1: Bivariate Scatterplot of the Criterion Variable, Algebra 1 Scores ............................. 70
Figure 2: Bivariate Scatterplot of the Criterion Variable, STEM Carrers Selected ................... 70
Figure 3: Histogram of Algebra 1 Scores ............................................................................... 71
Figure 4: Normal Q-Q Plot of Algebra 1 Scores..................................................................... 72
Figure 5: Histogram of STEM Carrers Selected ..................................................................... 72
Figure 6: Normal Q-Q Plot of STEM Carrers Selected ........................................................... 73
10
List of Abbreviations
Adequate Yearly Progress (AYP)
American Institutes of Research (AIR)
Average Daily Attendance (ADA)
Avon Longitudinal Study of Parents and Children (ALSPAC)
Common Core State Standards (CCSS)
Common Core State Standards for Mathematics (CCSSM)
Confirming Factor Analysis (CFA)
Depth of Knowledge (DOK)
Early Warning System (EWS)
Expectancy-Value Theory (EVT)
Florida Department of Education (FLDOE)
Florida Standards Assessment (FSA)
Family Education Rights and Privacy Act (FERPA)
Hispanic Serving Institutions (HSI)
Institutional Review Board (IRB)
Mathematics Florida Standards (MAFS)
Mathematics Teaching Association (MTA)
Mathematics Teaching Outcome Expectancy (MTOE)
Multi-Tiered System of Support (MTSS)
National Assessment of Educational Progress (NAEP)
National Center for Education Statistics (NCES)
National Governor’s Association (NGA)
11
National Institute of Child’s Health and Human Development Study of Early Child Care and
Youth Development (NICHDS-SECCYD)
Naviance-Do What You Are (N-DWYA)
No Child Left Behind (NCLB)
Panel Study of Income Dynamics-Child Development Supplement (PSID-CDS)
Personal Mathematics Teaching Efficacy (PMTE)
Professional Learning Community (PLC)
Race to the Top (RTTT)
Realistic, Investigative, Artistic, Social, Enterprising, Conventional (RIASEC)
Research, Evaluation, and Accountability (REA)
School Climate Assessment Instrument (SCAI)
Science, Technology, Engineering, and Mathematics (STEM)
Statistical Package for the Social Sciences (SPSS)
Subject Task Value (STV)
12
CHAPTER ONE: INTRODUCTION
Overview
The opening chapter provides insight into the problem of absenteeism among Hispanic
students as well as the impacts of absenteeism on the Hispanic community. This is followed by a
description of how poor mathematical cognitive development affects postsecondary career
selection. Reasoning for conducting the study is provided and leads into why school leaders
must act on this empirically-supported, significant problem.
Background
School absenteeism is a complex problem that is ubiquitous in schools throughout the
nation and has negatively impacted students’ academic performance (Gottfried, 2010; 2019). In
addition to poor academic achievement, absenteeism makes it difficult for students to follow
specific career fields (Smerillo, Reynolds, Temple, & Ou, 2018). High school absenteeism is at
chronic levels in the United States and in other countries around the world (Cabus & De Witte,
2015; Maynard, McCrea, Pigott, & Kelly, 2013). School leadership considers absenteeism to be
a problem when a student is absent for five days during the first semester or 10-15 days for the
entire school year based on the most common 180-school-days model (Kearney & Graczyk,
2014; Owings et al., 2017; U.S. Department of Education, 2016). The intricacy of this problem
is predominantly rooted in medical and mental health of students or family dysfunction
(Espinoza-Herold & González-Carriedo, 2017). Students who are frequently absent due to these
dynamics may eventually escalate into chronic absenteeism (Kaiser & Schulze, 2015). The
problem of absenteeism is correlated with negative social outcomes such as early pregnancy,
substance abuse, criminal behavior, truancy, or school dropout (Kearney & Graczyk, 2014;
Romero & Lee, 2017). Additionally, “chronic absence is a proven sign of academic risk, as
13
students who miss school are less likely to meet key academic milestones” (Rafa, 2017, p. 2).
Furthermore, students who miss 15-20% of instructional time are less likely to maintain adequate
academic performance and most importantly, academic deficiencies contributing to the widening
of the White-Hispanic student achievement gap, especially in mathematics (Gottfried, 2010;
2019; Paschall, Gershoff, & Kuhfeld, 2018). The number of students absent from schools ranged
between 5 to 7.5 million students in 2016 (U.S. Department of Education, 2016). The collective
data provides overwhelming evidence that absenteeism is a glaring problem in school districts
across the country (Espinoza-Herold & González-Carriedo, 2017; Rafa, 2017).
This study focuses on Hispanic students because this ethnic group tops the list of students
who have the highest absenteeism rates and the highest number of high school dropouts, which
stands at 20 percentage points over White students (Espinoza-Herold & González-Carriedo,
2017; Maynard, Vaughn, Nelson, Salas-Wright, Heyne, & Kremer, 2017; Skedgell & Kearney,
2016). Students in this demographic group are performing at particularly low rates on
mathematics state assessments (Paschall, Gershoff, & Kuhfeld, 2018). School absenteeism is a
significant contributor to students’ low mathematics academic performance (Gottfried, 2010;
Gottfried & Ehrlich, 2018; Paschall, Gershoff, & Kuhfeld, 2018).
Low mathematics performance became a priority to Americans at the time when the
document A Nation at Risk (National Commission on Excellence in Education, 1983) was
released and gave a wide-lens view of the country’s Department of Education. The report placed
emphasis on increasing mathematics and science skills to ensure the U.S. could regain global
superiority in the areas of science and engineering (National Commission on Excellence in
Education, 1983). A Nation at Risk positioned education reform at the center of major political
agendas that continued over the years leading to legislations like Goals 2000, No Child Left
14
Behind (NCLB), and Race to the Top (RTTT) (Dee & Jacob, 2011; Paris, 1994; Tichnor-Wagner
& Socol, 2016).
Under Presidents George H.W. Bush and Bill Clinton, Goals 2000 aimed at making the
U.S. the top nation in mathematics and science achievement among all industrialized countries
(Paris, 1994). NCLB was President G.W. Bush’s educational initiative for the 21st century that
required greater supervision for all students and ethnic subgroups (DuFour, 2017). This
legislation established what would be considered the adequate yearly progress (AYP) and it
mandated a report card system for schools that monitored students and student subgroups (e.g.,
race, gender, and students with disabilities) to identify whether AYP had been reached for each
student and student subgroup (Peterson & Ackerman, 2015). The RTTT legislation came under
President Barack Obama with the vision of implementing the Common Core State Standards
(CCSS) nationally (Tichnor-Wagner & Socol, 2016). The CCSS standards dedicated for
mathematics instruction were designed to improve mathematics achievement levels (Khaliqi,
2016).
Over the past 30 years, legislators have been deliberate about raising the quality of
mathematics and science instruction and achievement levels for students. Increasing
mathematics rigor has become a greater barrier for Hispanic students to overcome as this
community is challenged with chronic absenteeism and low achievement test scores (Romero &
Lee, 2017; Saw & Chang, 2018). School attendance is a national problem that continues to grow
among all ethnic groups in the country (Gottfried & Ehrlich, 2018). Students who are absent will
not receive direct instruction, intervention, or remediation from a certified teacher, nor will they
be able to participate in student-to student interactions which are invaluable for processing
information. The literature suggests that students who are frequently absent will not learn at the
15
same rate as students who attend school regularly (Green, Liem, Martin, Colmar, Marsh, &
McInerney, 2012; London, Sanchez, & Castrechini, 2016; Rogers, Duncan, Wolford, Ternovski,
Subramanyam, & Reitano, 2017; Romero & Lee, 2017).
The scope of the present study is to determine whether a correlation exists between
Hispanic students’ high school absenteeism and their mathematics achievement and Hispanic
students’ interest in STEM careers and school absenteeism. Students in this ethnic group are
significantly underrepresented in STEM career fields as a result of students’ low expectancy of
success in mathematics (Saw & Chang, 2018). The Hispanic population is experiencing the most
rapid population growth compared to other demographic groups in the U.S. (Espinoza-Herold &
González-Carriedo, 2017; Koppelman, 2017). Consequently, Hispanic students represent a large
portion of the group of citizens who will replace the aging labor force in the STEM field (Mau,
2018; National Science Board, 2016).
This study samples Hispanic students enrolled in Florida schools where they exceeded
38% of the total enrolled population at the state level for the 2017-2018 school year (Florida
Department of Education Enrollment, 2019). The study aims at finding whether absenteeism can
predict Hispanic students’ mathematics performance outcome and their interest to enter the
STEM career field. Currently in Florida, 54% of migrants into the state are of Hispanic heritage
including Cuba, Puerto Rico, and other Hispanic countries in Central and South America (Wang
& Rayer, 2016). Additionally, Hispanic student enrollment in the state has grown 3% in the last
five years compared to a 2.8% decrease in White students over the same period of time (Florida
Department of Education Enrollment, 2019).
The literature points at Hispanic students as the ethnic group most affected by chronic
absenteeism and high school dropout in the country (Espinoza-Herold & González-Carriedo,
16
2017; Musu-Gillette et al., 2017; Rogers et al., 2017; Romero & Lee, 2017). Research suggests
that the effects of high absenteeism have led to a downward spiral of Hispanic students ’
mathematics achievement scores as measured by state annual assessments (National Science
Board, 2016). Hispanic students who engage in chronic absenteeism and miss considerable
amounts of instruction as a result of absenteeism are likely to receive lower achievement scores
in mathematics when compared to other subject areas (Smerillo et al., 2018).
Students aspiring to enter career fields in STEM play a vital role in continuing the drive
for the U.S. to grow as an innovative nation (Khatri, Henderson, Cole, Froyd, Friedrichsen, &
Stanford, 2017). The Hispanic population is identified as an untapped group of Americans that
could contribute to innovation but are underrepresented in STEM careers and in STEM
educational settings (Callahan et al., 2017; Edwin, Prescod, & Bryan, 2019). Hispanic
underrepresentation is amplified by the growth in STEM career opportunities (Johnson &
Kritsonis, 2006; Smerillo et al., 2018). The low percentage of Hispanics that choose to pursue a
career in the field of STEM reduces their chances to compete for jobs with high wages in a
continually thriving industry in which mathematics skills are the basis for most jobs (Rincon,
2017; Lauen & Gaddis, 2016). STEM jobs are suited to provide a better quality of life to the
Hispanic community as the industry maintains an unemployment rate of 3.8% compared to the
national unemployment rate of 8.1% (National Science Foundation, 2016). In order for
Hispanics to be part of this industry, the White-Hispanic achievement gap in mathematics scores
from primary to secondary schools needs to be addressed by school districts.
Empirical evidence demonstrates how school attendance is a strong precursor to students’
mathematics levels of achievement gap (Gottfried, 2019). Absenteeism has been found to be a
contributor to the White-Hispanic mathematics achievement gap (Owings et al., 2017). In
17
addition, an examination of the extent to which low mathematics performance affects Hispanic
students’ career interest in the field of STEM is completed here. This study is framed on the
theoretical framework of Eccles’ (2009) Expectancy Value Theory (EVT) and Holland’s (1959)
Theory of Vocational Choice to address the following research questions: Is there a predictive
relationship between Hispanic students’ high school absenteeism and mathematics achievement?
Also, is there a predictive relationship between Hispanic students’ interest to pursue careers in
the STEM field and high school absenteeism?
EVT is directly related to how individuals select a career. Its “basic premise is that
individuals choose to engage in tasks and activities that have high value to them and at which
they expect to succeed” (Lauermann, Tsai, & Eccles, 2017, p. 1540). In addition, EVT supports
the idea of students having an interest in mathematics and inherently longing for a career field
related to mathematics and sciences (Eccles, 2009). Wigfield and Eccles (2000) assert that to
experience success in mathematics, the student must embrace a level of expectancy to succeed
and a level of enjoyment on the applicable subject task. The EVT rests upon the low sense of
self-confidence students have in themselves to succeed. The low expectancy is especially
marked in the area of mathematics (Lauermann et al., 2017; Romero & Lee, 2017). The second
aspect to the EVT is the subject task value that students place upon the completion of a task
(Lanza, Osgood, Eccles, & Wigfield, 2002).
The Theory of Vocational Choice provides an additional framework for this study.
Holland’s theory (1959) includes six personality types that codify how individuals are likely to
select a career. Holland (1959) believes that most people can be identified as one of the
following personality types: realistic, investigative, artistic, social, enterprising, and conventional
(Campbell & Holland, 1972). The codes are referred to as RIASEC and generally relate to
18
individuals based on the career interest profiler (Bakker & Macnab, 2004). Holland determined
that occupational classification depends on individuals’ interactions with others and the work
environment (1959). Once categorized, a code is given in the form of one to three letters such as
RIA (Realistic-Investigative-Artistic) which represents the personality traits that associate an
individual with a career type (Hogan & Blake, 1999). This framework is relevant to the present
study as the researcher endeavors to examine Hispanic students’ career interests in the field of
STEM.
The purpose of the present correlational study is to research the relationship between
Hispanic students’ absenteeism as the predictive variable and students’ mathematics achievement
measured by the Florida Standards Assessments as the criterion variable (Florida Department of
Education, 2017). The second relationship researched is between Hispanic students’ aspiration
to pursue STEM careers, the predictive variable, and absenteeism as the criterion variable.
Problem Statement
Studies have repeatedly emphasized how much Hispanics are underrepresented in career
fields associated with STEM (Borman, Margolin, Garland, Rapaport, Park, & LiCalsi, 2017;
Hinojosa et al., 2016; Mau & Li, 2017; National Science Foundation, 2019; Safavian & Conley,
2016; Saw & Chang, 2018; U.S. Department of Education, 2016). This lack of representation in
STEM careers may be an effect of Hispanic students’ low mathematics performance exacerbated
by habitual school absenteeism that is highest among Hispanics when compared to other races
and ethnicities (Maynard, Vaughn, Nelson, Salas-Wright, Heyne, & Kremer, 2017; Skedgell &
Kearney, 2016). The problem of absenteeism is well documented in the literature and is
considered an extreme situation that affects many stakeholders in school communities in the U.S.
and other modern industrialized countries (Cabus & De Witte, 2015; Rafa, 2017; U.S.
19
Department of Education, 2016). Students who are habitually absent require more remediation
to achieve mastery of the learning goals associated with each respective subject area (Gottfried,
2019).
However, the existing research does not provide clear connections to whether and to what
extent Hispanic students’ absenteeism significantly dampers their potential to excel in
mathematics and to aspire to enter STEM careers. Saw and Chang (2018) call for the need to
continue the research of the implications of Hispanic students’ underrepresentation in the field of
STEM. Within the current research literature, there is not any one factor that is strongly
correlated to Hispanic students’ low interest in entering STEM career fields (Saw & Chang,
2018).
The present study will add to the literature related to the effects of Hispanic students’
absenteeism on mathematics achievement and on STEM career interest in this subgroup.
Hispanic underrepresentation in STEM careers was a problem recognized by Congress in the
Goals 2000 Educate America Act that allocated billions of dollars to institutions that became
Hispanic serving institutions (HSI) addressing STEM initiatives (Crisp, Nora, & Taggart, 2009;
Goals, 2000). Hispanic population numbers in the U.S. stands at 17% of the total population
(Koppelman, 2017) and the White-Hispanic gap in the STEM industry has not declined since the
enactment of Goals 2000 (Carpi, Ronan, Falconer, & Lent, 2017). This is indicative of the need
of a national goal of increased equity in participation in STEM careers for Hispanics, to develop
the ability of Hispanics to compete globally, and for economic stability for this sector of the
population. Existing literature on STEM, especially among Hispanics in urban populations,
speaks to these needs (Mau & Cheng, 2018). The problem is that there is not sufficient literature
20
connecting Hispanic students’ absenteeism to mathematics achievement or to the consequential
effects of Hispanic students having a low interest in STEM careers.
Purpose Statement
The purpose of this bivariate correlational study is to determine whether there is a
relationship between Hispanic students’ absenteeism as the predictive variable and students’
mathematics achievement as the criterion variable as measured by the Algebra 1 Florida
Standards Assessments given in high school (Florida Department of Education, 2017). Student
absenteeism is generally defined as missing instruction on any of the required 180 instructional
days, regardless of whether the absence was excused or unexcused per local school board
guidelines (Kearney & Graczyk, 2014; Owings et al., 2017; U.S. Department of Education,
2016). Additionally, Hispanic students’ aspirations to enter a STEM career field will serve as a
predictive variable to Hispanic students’ absenteeism as a second criterion variable. Aspiration
to enter a STEM career field is generally defined as the willingness to enter a post-secondary
program of study with a focus in a STEM field such as biotechnology, cybertechnology,
robotics, and automation manufacturing as measured by students who complete the Naviance
program Do What You Are (N-DWYA) career survey (Randall, Issacson, & Ciro, 2017).
The study aims at expanding the literature on the issue of absenteeism in the Hispanic
community and the effect of reducing the chances of entering into the competitive field of
STEM. Additionally, this study shows stakeholders the data regarding the important role
Hispanic students play as viable members of the community in Florida and across the U.S. The
Hispanic demographic is the largest ethnic minority group in the country. It is extremely
important to explore the factor of absenteeism and the relationship to this demographic’s
21
mathematics achievement and their interest to enter the STEM career field (Lauermann et al.,
2017; Porter & Snipp, 2018).
Significance of the Study
The problem of absenteeism is considered a condition that affects community
stakeholders within a school’s locale across the U.S. and other modern industrialized countries
(Cabus & De Witte, 2015). It is critically important that students attend school regularly based
on the positive correlation between attendance and academic achievement (Sahin, Arseven, &
Kilic, 2016). Research also supports that students who are absent 15 days or more are
academically impacted to a greater degree than students missing less than 15 days in a school
year (U.S. Department of Education, 2016). The literature suggests that Hispanic students have
the highest rate of absenteeism nationally and are the demographic group most likely to dropout
(Koppelman, 2017; Maynard et al., 2017).
The significance of this study asserts whether Hispanic students’ absenteeism can be
correlated to low mathematics achievement or low interest in entering STEM career fields
(Paschall et al., 2018; Saw & Chang, 2018). As current STEM workers retire and as Hispanics
continue growing as a larger demographic group, Hispanics have the potential to succeed in
replacing this growing employment sector and secure jobs in this industry (Callahan et al.,
2017). Empirical support contends that habitual absenteeism is denying Hispanic students the
opportunity to compete for high wage jobs in STEM career clusters (Mau, 2016). As a result of
this study, new information is now added to the existing body of knowledge pertinent to school
districts with high numbers of enrolled Hispanic students. In turn, school districts have
additional research to allow better allocation of resources that bring awareness and career
attainment and success to the Hispanic community.
22
Research Questions
RQ1: Is there a predictive relationship between Hispanic students’ high school
absenteeism and mathematics achievement?
RQ2: Is there a predictive relationship between Hispanic students’ interest to pursue
careers in the STEM field and high school absenteeism?
Definitions
1. Ability belief - Ability belief is one aspect of the expectancy value theory and refers to
what students are able to do, what they presently know, and how their abilities compare
to other students (Wigfield & Eccles, 2000).
2. Absenteeism or Chronic Absenteeism - Both terms are used to categorize students who
miss 15 days of school or more over the course of the school year that is based on a
standard 180-school-days academic year or when 25% of days are missed during a two-
week period (Kearney & Graczyk, 2014; Owings, Kaplan, Myran, & Doyle, 2017; U.S.
Department of Education, 2016).
3. Average Daily Attendance - This is a figure that school districts across the U.S. use to
determine the percentage of students who are present in school. This calculation,
however, does not account or pinpoint students who are engaging in absenteeism (Rafa,
2017).
4. Compulsory Age - Students must be over the compulsory age to legally stop attending
school; however, this number varies from state to state, where the requirement generally
is for students to receive no less than 9 years and up to 13 years of formal schooling
(Owings et al., 2017).
23
5. Expectancy of success - This is the other feature of the expectancy value theory regarding
the belief students have in themselves to accomplish future tasks and is measured by
focusing on only one task such as a new mathematics skill (Wigfield & Eccles, 2000).
6. Expectancy Value Theory (EVT) - A behavior theory that is related to Bandura’s self-
efficacy construct that establishes how ‘well’ an individual’s self-beliefs can predict the
level of success a student has to accomplish a subject task (Bandura, Barbaranelli,
Caprara, & Pastorelli, 1996; Wigfield & Eccles, 2000).
7. Gatekeeper - This term relates to the effect and fear Algebra courses generate in high
school students where this course is a necessary requirement for graduation and for
acceptance to and for postsecondary programs (Laughbaum, 2017).
8. Hispanic or Latino - These two terms are used interchangeably when referring to people
whose ethnic heritage originates in a Spanish-speaking country such as Mexico, Puerto
Rico, or Cuba (Blase, 2001). This ethnic minority group is the largest in the U.S. and ,
according to the Census Bureau, this demographic group is further categorized by race
whether White, Hispanic, or non-White Hispanic (Porter & Snipp, 2018).
9. Multi-Tiered System of Support (MTSS) - MTSS is a framework that operates in a multi-
tiered ladder designed to render support to students once identified and placed in any of
the three tiers of support (Lancaster & Hougen, 2017).
10. Science, Technology, Engineering, and Mathematics (STEM) - STEM education involves
the clustering of careers that encompass science, technology, engineering, and
mathematics disciplines to create 21st century innovations to solve problems (Kubat,
2018).
24
11. Truancy - A student who engages in truancy is refusing to attend school after
experiencing chronic absenteeism due to emotional trauma that occurred while attending
school or some other behaviors affecting teenagers (Chen, Culhane, Metraux, Park, &
Venable, 2016). The legal definition must be looked at in a more humane form because it
deals with very young people whose lives are in danger of becoming disaster-prone for
adulthood. Related literature notes the reasoning and consequences of engaging in school
absenteeism, habitual or chronic, and how it may lead to truancy when the student does
not want to be at school any longer (Gottfried & Kirksey, 2017).
25
CHAPTER TWO: LITERATURE REVIEW
Overview
The research literature in this chapter situates this study within the ongoing question of
what correlation absenteeism might have with mathematics achievement and on career choice in
the STEM industry. The review of the literature first establishes the theoretical and conceptual
frameworks along with published research articles that support the need to complete this
quantitative study, focusing on the two underlying factors being addressed in this study. The
expectancy-value theory (EVT) and Holland’s Theory of Vocational Choice are the rooted
frameworks for the present study. The researcher is focused on two underlying factors addressed
in the literature review. The researcher first tackles the relationship between high school
absenteeism experienced by Hispanic students and any effects absenteeism has on mathematics
performance in annual assessments (Callahan et al., 2017; Eccles, Vida, & Barber, 2004;
Lauermann et al., 2017). The second factor the researcher examines is the impact of Hispanic
students’ interest to enter STEM occupations and high school absenteeism (Eccles & Wigfield,
2002; Paschall et al., 2018).
Theoretical Framework
The theoretical framework (EVT) based on Eccles et al.’s (1983) research is applicable to
students showing a given amount of motivation based on their expectancy to succeed and their
beliefs in their abilities to accomplish academic goals (Eccles & Wigfield, 2002). Additionally,
Holland’s (1959) Theory of Vocational Choice is a second theoretical framework used to make
important connections of student-to-career interest. The basis for Holland’s theory is the six
career typologies that link a career field to an individual’s interest normally referred to as
RIASEC types (Bakker & Macnab, 2004). Holland’s career assessment measures interest toward
26
an area of work based on the following personality types: realistic, investigative, artistic, social,
enterprising, and conventional (Sheldon, Holliday, Titova, & Benson, 2019).
Expectancy-Value Theory
Eccles’ model is a modern version of Atkinson’s (1957) early work of the expectancy-
value theory (EVT) (Lauermann et al., 2017; Schunk, 2016). Atkinson demonstrates that an
individual’s willingness to perform a task was dependent upon the person’s expectancy of
accomplishing the task and on the value the person placed upon the obtained result (Schunk,
2016). Atkinson considers expectancy to be “a cognitive anticipation usually aroused by cues in
a situation that performance of some act will be followed by a particular consequence” (p. 360).
The strength of the probability to attain a goal is represented by the level of expectancy for
success before accomplishing the act (Atkinson, 1957). The principle of motivation is
represented on a multiplicative formula where motivation = f (motive x expectancy x incentive)
(Atkinson, 1957). The three variables in the formula are related to Eccles et al. (1983) three-part
EVT where individuals’ expectancy of success, ability beliefs, and subject task value (STV)
were clearly implied from Atkinson’s (1957) work.
Expectancy for success. Expectancy for success is the first aspect of Eccles et al. (1983)
modern EVT model. The expectancy for success component measures a learner’s own beliefs
about succeeding or accomplishing a future academic task when the opportunity arises (Wigfield
& Eccles, 2000). Bandura (1996) states that the efficacy expectation construct is distinctly based
on the outcome expectations rather than a prediction of performance and choice (Bandura,
Barbaranelli, Caprara, & Pastorelli). Outcome expectations are subjective estimates of how
likely it is that a specific behavior will be followed by particular consequences (Lippke, 2017).
Wigfield and Eccles (2000) sustain that expectancy for success is similar to Bandura’s efficacy
27
expectation without attributing the outcome expectancy construct. Therefore, the expectancy for
success aspect of EVT determines a student’s self-belief to complete an upcoming task
successfully in contrast to the ability belief that is a proven indication of a student’s current
capacity to perform the task (Eccles et al., 1983).
Ability belief. A second aspect of the EVT is an individual’s ability belief to perform a
task at the present time (Muenks, Wigfield, & Eccles, 2017; Wigfield & Eccles, 2000). Ability
belief is rooted in the students’ perceptions of their capabilities to accomplish tasks or their
abilities to judge how they compare to other students facing similar problems (Wigfield &
Eccles, 2000). Ability belief is a critical aspect of the expectancy-value theory (Wigfield &
Eccles, 2000). Researchers have different views on how to measure ability belief. One is by the
level of specificity measurement of a behavior (Covington, 1992; Deci & Ryan, 1985; Nichols,
1978; Winer, 1985). As part of the EVT, ability belief is directly related to an individual’s
current abilities to perform a task successfully (Wigfield & Eccles, 2000). Expectancy for
success and ability beliefs address an individual’s level of confidence and motivation to
complete a task whether at the present or in a future time frame. The subjective task value
(STV) refers to the weight of the importance individuals place upon a task (Wigfield & Eccles,
2000).
Subjective task value. The third part of the expectancy-value theory is the subjective
task value (STV). STV is outlined as a salient part of Eccles et al.’s (1983) framework of task
value that is frequently applied in the areas of mathematics, reading, music, and sports (Wigfield
& Eccles, 2000). STV refers to the value an individual places upon achievement-related
opportunities in areas such as college coursework selection and career occupations (Eccles,
2009). STV is divided into the following four areas: intrinsic value, attainment value, utility
28
value, and cost as each one affords a level of worth to each task (Eccles, 2009; Eccles &
Wigfield, 2002).
Intrinsic value. The intrinsic or interest value refers to the enjoyment that individuals
undergo while accomplishing a task or engaging in a behavior (Eccles, 2009). The level of
importance students attach to a task over time will build students’ competence at performing the
task (Eccles, 2009). Essentially, the “skill at this activity will become part of the individual’s
‘Me’ self” (Eccles, 2009, p. 83). The interest or intrinsic motivation in the “Me” self plays an
important factor in keeping students engaged in activities (Jacobs, Lanza, Osgood, Eccles, &
Wigfield, 2002). Individuals with high-interest value in a task enjoy performing, increase
competence, and remain engaged longer in the activity (Eccles, 2009; Jacobs et al., 2002). An
individual performing a task based on interest value creates fulfillment and enjoyment that
stimulates the attainment value as the individual has developed the ability to perform the task
successfully (Eccles, 2009).
Attainment value. Attainment value is an area of the STV that explains the reasoning
people engage in a task or behavior. Individuals determine the level of attainment value when
the tasks are consistent with their personal image and overall identity (Eccles, 2009; Gottlieb,
2018). Eccles (2009) sustains that a student’s identity or image may change over time as the
individual grows and matures. Students’ collective identities are transformed over the years and
new values will influence their educational and career choices (Eccles, 2009). Students choose a
career field of study as the goals for that career are aligned with their identities (Gottlieb, 2018).
Specifically, the requirements of a task can influence if individuals perceive the task as either an
opportunity or a burden related to their personal identities (Eccles, 2009; Gottlieb, 2018).
Attainment value is the product of an individual’s image that is linked to a task and affects the
29
individual when deciding on a course of study or selecting career opportunities (Eccles, 2009;
Gottlieb, 2018). Individuals selecting mathematics consider the utility and cost values as these
aspects of STV play a role in achieving the individual’s goals.
Utility value and cost value. Utility value refers to the usefulness of a specified task in
relation to the achievability of the task (Eccles, 2009). Students consider this portion of the STV
as the useful value of accomplishing a task that impacts a current or future goal such as entering
a STEM career field (Caspi et al., 2019). Additional consideration is given to the cost value an
individual is willing to invest in the form of effort, time, finances, and emotional energy to
engage in a task. Students often find that a prerequisite course is worth the time and investment
because the cost value for taking the class ensures success in a future course (Caspi et al., 2019).
Utility and cost values are important aspects of the subjective task value portion of the EVT
(Eccles, 2009). Interest, attainment, utility, and cost values are the four elements of the
subjective task value component of the EVT that contribute to predicting whether individuals
will make a decision for a post-secondary program or a career field (Eccles, 2009; Eccles et al.,
2004; Updegraff, Eccles, Barber, & O'Brien, 1996).
EVT provides a suitable framework to study predictive factors related to students’
mathematics performance that potentially drives away their aspiration to enter STEM careers.
This framework is especially important in understanding the low performance of many Hispanic
students (Mau & Li, 2018; Saw & Chang, 2018). Studies have shown Hispanic students as the
ethnic group that maintains the highest school dropout rate among other races (Kearney &
Graczyk, 2014; Owings et al., 2017). Hispanics have trailed White students for three decades in
mathematics proficiency scores with a 20%-point gap as measured by the National Center for
Education Statistics (Musu-Gillette et al., 2017). This group of the American society is not
30
building the necessary competence to enter careers in the field of STEM (National Science
Foundation, 2019). Hispanic students’ mathematics skills deficiencies are linked to the EVT and
provide a correlate to students in Hispanic communities whose aspirations to pursue STEM
careers are stifled as a result of their low expectancy-values toward mathematics (Lauermann et
al., 2017; Safavian & Conley, 2016; Saw & Chang, 2018). EVT was developed and applied to
the field of mathematics education by Eccles who claimed that success is based on expectancy
and subjective task values (Wigfield & Eccles, 2000). Expectancy-value theory underlines the
plausible key predictors of why Hispanic students with low achievement scores in mathematics
could be lacking the motivation to pursue careers in the field of STEM.
Expectancy value influences students in selecting their vocational pathways which can be
predicted based on the students self-assessing their abilities to succeed (Eccles, 2009). Students
develop a self-perception of the importance of increasing or decreasing their involvement in
various tasks (Eccles, 2009). Therefore, a student’s outlook for the future can be directly
influenced by what is known as causal attribution (Eccles, 2009). Causal attribution is a believed
notion of failures that students bring upon themselves as they perceive their inabilities to achieve
given tasks. This causal attribution originates from a student’s interactions with family, peers, or
teachers (Rudolph & Reisenzein, 2008). Hispanic students’ poor performances in mathematics
may be the effect of causal attribution as a derivative of expectancy-value or may be a lack of
willingness to accomplish a task for which the student finds no value (Safavian & Conley, 2016).
High school students face the challenge of making post-secondary plans for careers. They
especially have a difficult time deciding on career options when they are struggling in
mathematics courses throughout high school (Lauermann, Tsai, & Eccles, 2017). Saw and
Chang (2018) assert how Hispanic students’ low expectations for success in mathematics
31
negatively influences their decisions to select STEM careers when completing a career interest
survey (Saw & Chang, 2018).
Students who engage in absenteeism have poor academic achievement in mathematics as
a consequence of the amount of missed instruction (Paschall et al., 2018). Hispanic students
with high absenteeism tend to have low expectations of success in any mathematics-related
STEM career (Gottfried, 2019; Lauermann et al., 2017). According to the literature, a large
proportion of Hispanic students choose to enter into different career fields not associated with
strong mathematics skills (Lauermann et al., 2017). In the contemporary EVT version of Eccles’
theory, “choices are assumed to be influenced by both negative and positive task characteristics,
and all choices are assumed to have costs associated with them” (Eccles & Wigfield, 2002, p.
118). Therefore, individuals who experienced a level of success or failure have the option to
move beyond some of the tasks related to the negative characteristics (Eccles & Wigfield, 2002).
Eccles et al.’s EVT (1983) framework influences career choices based on a student’s perceived
expectancy to succeed. Holland’s Theory of Vocational Choice provides students with
characteristics and traits that unpack their interest in career clusters.
Theory of Vocational Choice
Holland’s (1959) theoretical framework is based on the classification of personality types
and environmental organizations. Holland suggests that “the person is the product of the
interaction of his particular heredity with a variety of cultural and personal forces including
peers, parents and significant adults, his social class, American culture, and the physical
environment” (Holland, 1959, p. 35).
Individuals searching to make a career choice consider the occupational environment,
personal development, and personal interactions within the vocational environment (Holland,
32
1959). The occupational environment is the actual categorization used by Holland in the
RIASEC model. Holland found that differentiation of the occupational environment makes
career selection a simpler process (Holland, 1959). Personal development is also simplified
when individuals make job selections realizing the occupation is aligned with their intelligence
level (Holland, 1959). This also brings fulfillment and more satisfaction to their personal
lifestyle (Holland, 1959). Personal interaction of an individual with the environment involves a
function where the personal strengths, interests, and lifestyle are aligned with the career
(Neukrug, Sparkman, & Moe, 2017). These areas are factored into an aptitude assessment that
generates Holland’s code report (Sheldon et al., 2019). Holland grouped various careers and
aligned them with a specific personality type framework (Holland, 1959; Hogan & Blake, 1999).
The Theory of Vocational Choice is comprised of six personality types that make up the
acronym RIASEC: realistic, investigative, artistic, social, enterprising, and conventional (Bakker
& Macnab, 2004; Campbell & Holland, 1972; Neukrug, Sparkman, & Moe, 2017). Drawing
from his clinical experience working as a vocational counselor, Holland developed the
personality types (Campbell & Holland, 1972). The RIASEC scale measures interest while
labeling the individual by the six personality types. Holland’s RIASEC scale is represented in the
shape of a hexagon. An individual is assigned a code consisting of one to three letters of the
scale corresponding to the type of personality and the work environment best suited to their
interests (Bakker & Macnab, 2004). Holland’s (1959) description of each of the six personality
types within RIASEC is explained as a code that identif ies a plausible occupation of interest for
students completing the career interest profiler based on their answer choices.
Realistic. Realistic students seek employment that involves hands-on and physical
activities such as work that requires building things. Additionally, individuals with realistic
33
characteristics are considered doers. This personality type is increasingly practical as well as
self-reliant; therefore, people classified as realistic will avoid careers where social interactions
are necessary. Individuals with this personality type “avoid situations which require verbal and
interpersonal skill, because they lack such skills and are often threatened by close relationships
with others” (Holland, 1957, p. 36). People with a realistic personality type consider themselves
aggressive and deficient of sensitivity (Holland, 1957). Careers that realistic students may be
most suited for include construction, mechanical equipment operators, and farming (Bakker &
Macnab, 2004).
Investigative. Students who fall under this personality type are referred to as thinkers as
they look to answer why things happen and how things work. They solve problems in an
analytical fashion making sense of data and coming up with a conclusive theory or principle.
They prefer to work alone to avoid missing information while sorting their thoughts. The
investigative personality type is characterized as an individual who does not enjoy leading,
selling, or persuading others (Bakker & Macnab, 2004). Career interests for students in this
group involve mathematics, science, research, computing, and comprehending the world (Bakker
& Macnab, 2004). The investigative or thinker personality type is associated with students who
show interest in the STEM career field (Sheldon et al., 2019).
Artistic. Students identified with the artistic type are individuals who express their
feelings through the arts (Bakker & Macnab, 2004). People in this personality type “prefer
dealing with environmental problems through self-expression in artistic media” (Holland, 1957,
p. 37). They have a gift for creation and imagination while creating a product. Students in the
artistic category include musicians, painters, and graphic artists (Bakker & Macnab, 2004). As
an artist, individuals in this personality type are more interested in the cultural aesthetic than the
34
sciences (Bakker & Macnab, 2004). Although musicians engage in repetitive tasks while
rehearsing, people in this category do not enjoy repeating the same tasks over time without
variety and certainly do not appreciate working with numbers (Bakker & Macnab, 2004; Hogan
& Bake, 1999).
Social. The social trait aligns with people who are known as helpers and who are found
in careers that support people such as nursing, counseling, and teaching. Individuals in this
group “are concerned about human welfare and are excited by work that allows them to
overcome interpersonal problems and mediate disputes” (Bakker & Macnab, 2004, p. 8). People
with social personalities are drawn to socialization in a safe environment (Bakker & Macnab,
2004). This personality type is characterized by the dislike of working with data, machinery, or
things as people in this category are driven by interpersonal relationships (Bai & Liao, 2018).
Enterprising. The enterprising attribute defines people in the trade industry from real
estate broker to car salesman. Unlike individuals with strong social-type characteristics, people
in the enterprising personality category use their strong verbal network skills to influence deals
(Sheldon et al., 2019). Students categorized with the enterprising personality type share
persuasive qualities similar to politicians and business owners (Bakker & Macnab, 2004;
Holland, 1959). People identified with the enterprising personality type show interest in data
analysis and performing calculations to help them make decisions and relate to people working
in STEM careers (Bakker & Macnab, 2004). People in this personality type have a preference to
work directly with people over working with data interpretation and calculations (Bakker &
Macnab, 2004).
Conventional. The conventional personality type describes individuals who can also be
characterized as organizers as they follow workplace policies and regulations (Bakker &
35
Macnab, 2004). People identified as conventional are highly methodical and efficient when
working on a project (Bakker & Macnab, 2014). Their career choices include business
administration, executive secretaries, accountants, and database managers (Bakker & Macnab,
2004). This group of individuals also enjoys working with data and numbers to generate reports
that keep the organization working smoothly (Campbell & Holland, 1972). People in this
personality type have problems working in an unorganized environment (Bakker & Macnab,
2004).
EVT and the Theory of Vocational Choice establish a strong framework to develop
predictability between absenteeism, mathematical achievement, and interest in careers in the
STEM field. The related literature provides support and guidance for the present study. The
related literature explores the reasoning and consequences of engaging in school absenteeism,
habitual or chronic, and how absenteeism may lead to truancy (Gottfried & Kirksey, 2017;
Smerillo et al., 2018). The National Science Board (2016) express concerns about how the
Hispanic population of young adults may miss opportunities to work in STEM careers. The
literature review explains and narrows the focus for examining the predictability of Hispanic
students’ absenteeism to their test scores in mathematics and their interest to pursue careers in
the field of STEM (Lancaster & Hougen, 2017; Saw & Chang, 2018; Vaughn et al., 2013).
Related Literature
In an age of technological advances, the United States needs to maintain a strong
workforce in the field of international business to remain at the leading edge in global economies
(Andersson, Dasi, Mudambi, & Pedersen, 2018). Businesses in the fields of science, technology,
engineering, and mathematics play a vital role in continued innovation and world market
competitiveness (Khatri et al., 2017). Labor projections in the fields of STEM will exceed
36
current market needs and will be outpaced as more job opportunities in the economy become
available (Jackson & Rudin, 2019). The U.S. has a growing responsibility to maintain a well-
trained STEM workforce to support the nation’s global prosperity as the country’s demographic
makeup changes (Falco, 2017; Jackson & Rudin, 2019).
Hispanic communities are exponentially growing across the United States; however, this
ethnic group is underrepresented in the STEM industry (Callahan et al., 2017; National Science
Foundation, 2019). Over the last 20 years, data from the National Center for Science and
Engineering Statistics show that Hispanic students have increased the number of graduates in
STEM programs. The White-Hispanic gap in STEM jobs is very large at 60% even with the
number of Hispanic students entering and graduating in STEM programs (National Science
Foundation, 2019). Hispanics continue to grow as a strong ethnic contributor in the areas of
business, politics, and education in the United States (Koopmans, 2017). However, studies have
shown there is a challenge in getting the Hispanic population to become a stronger part of the
21st century STEM workforce which might be influenced by their lack of interest in STEM post-
secondary programs (Lauermann et al., 2017; Ozkan, 2017; Safavian & Conley, 2016). The
literature has yet to determine whether there is a correlation between absenteeism and
mathematics skills among Hispanic students as a contributing factor to Hispanics’
underrepresentation in the field of STEM.
Previously, Hispanic students’ low mathematics achievement was the subject of a study
that aimed to define Hispanic students’ perceptions toward mathematics. Safavian and Conley
(2016) conducted a study with the purpose to replicate Eccles et al. (1983) expectancy-value
belief construct and student achievement levels in mathematics. The variables analyzed included
expectancy for success, subjective task values (interest, utility, attainment, and cost), and
37
achievement in mathematics (Safavian & Conley, 2016). The research sample came from a
National Science Foundation program that researched mathematics and science motivation where
N = 926 seventh graders represented by Hispanics (76%), Vietnamese (13%), and White (6%)
students (Safavian & Conley, 2016). A four-factor correlation model was used for data analysis.
The researchers found that “Hispanic youth had lower scores in the sixth and seventh grades
when compared to their non-Hispanic peers. They also reported significantly lower expectancy
beliefs, interest, and attainment values” (Safavian & Conley, 2016, p. 6). The data showed a
correlation for expectancy for success, STV, and achievement with moderate to strong correlate
among expectancy for success with interest, utility, and attainment that ranged from r = .44 -.67,
with p < .001 (Safavian & Conley, 2016). Other statistical analyses employed in the study
included: t-test, hierarchical multiple regressions, ordinary least squares regressions, modeled
regression, and logistic regressions (Safavian & Conley; Warner, 2013). Although Safavian and
Conley (2016) addressed the association of EVT, STV, and achievement in mathematics, they
suggested studying additional factors to compare a Hispanic sample size closer in number to a
White sample size.
Deficiencies in mathematics skills are a problem for many students, but are more
prevalent in the Hispanic community (Romero & Lee, 2017). Findings of the A Nation at Risk
report demonstrate how mathematics scores dropped 40 points in the Scholastic Aptitude Test
(SAT) between 1963 and 1980 (Laughbaum, 2017). The focus of education reform has been to
improve mathematics and science skills in order to provide adequate preparation for students
entering the STEM career fields (Romero & Lee, 2017). Ironically, as mathematics education
increased in rigor and accountability measures were placed upon the country’s Departments of
Education, Hispanic students’ positive expectancy values toward mathematics dropped (Romero
38
& Lee, 2017). An in-depth analysis of academic achievement levels show how high school
mathematics coursework has turned into a gatekeeper for Hispanic students if they are to
graduate (Laughbaum, 2017). Studies show Hispanic students as having the highest dropout rate
as compared to other demographics (Musu-Gillette et al., 2017; Rogers et al., 2017; Romero &
Lee, 2017). Graduation could greatly depend on students’ willingness to attend school regularly
and to embrace the learning process afforded by the schools (Gottfried, 2018).
Mathematics as a Gatekeeper
Mathematics courses are referred to as gatekeeper courses because of the high number of
students repeating high school algebra curriculum in the college setting (Douglas & Attewell,
2017; Laughbaum, 2017). The term gatekeeper can be taken literally as prestigious universities
use mathematics standardized scores to control admittance into the university (Douglas &
Attewell, 2017). In addition to the use of standardized scores, university admissions officers will
examine high school transcripts searching for the highest-level mathematics course taken
(Douglas & Attewell, 2017). Historically, mathematics coursework is the subject area wherein
most students struggle in the K – 12 educational system (Laughbaum, 2017). According to the
American College Test (ACT), in the United States 59% of high school graduates in 2016 did
not meet mathematics college readiness (ACT, 2016; Laughbaum, 2017). Furthermore, the lack
of mathematics college readiness justified increasing the number of remediation courses in
colleges by 22% (Laughbaum, 2017).
Data from a longitudinal educational study provided Douglas and Attewell (2017) a
sample size of 15,000 participants who were followed for 10 years. The outcome from the study
supports the need for gatekeeper courses that help determine program admittance in post-
secondary institutions (Douglas & Attewell, 2017). Moreover, the study finds that Hispanic
39
students “with higher standardized math performance are not as likely as their white counterparts
to attend a four-year college” (Douglas & Attewell, 2017, p. 660). Douglas and Attewell’s study
assert that Hispanic students with high standardized scores are likely to attend a two-year college
(2017). Even when students enter a mathematics-based program, only 50% to 55% of those
students intending to complete a STEM program earn a STEM degree (Clarkson, Ntow,
Chidthachack, & Crotty, 2017). Some student populations, such as Hispanic students, who are
historically underrepresented in STEM are still being hindered from participating in STEM
career opportunities due to challenges in the gatekeeper course method of student prerequisites
for admission (Douglas & Attewell, 2017). Another issue compounding the problem for
Hispanic students and further keeping them from pursuing STEM-related careers is the difficulty
of Common Core State Standards for Mathematics (CCSSM) (Dossey et al., 2016).
Common Core State Standards of Mathematics. The level of complexity in
mathematics instruction increased with the adoption of Common Core State Standards for
Mathematics in 2009 (Dossey et al., 2016). The CCSSM places an emphasis on college and
career readiness necessary for American students to be able to compete in the global economy
(Dossey et al., 2016). Mathematics coursework is associated with STEM careers and students
need to dominate algebraic skills in order to pursue careers in the STEM fields (Laughbaum,
2017). The increase of rigor in mathematics standards imposes a barrier for Hispanic students to
overcome while trying to meet all high school graduation requirements (Laughbaum, 2017).
Most school districts mandate students complete three or four credits in mathematics as a
requirement for receipt of a high school diploma. The courses required for credit include
Algebra 1 and 2, Geometry, and an additional equally demanding course as established by the
40
Department of Education (Education Commission of the States, 2019; Rodriguez, 2018; Zinth,
2012).
Algebra as a requirement for high school graduation has increasingly become an
unattainable goal for many Hispanic students (Paschall et al., 2018). Students of low
socioeconomic status and minorities are the students most affected by the algebra requirement as
they do not have home structures, discipline, or role models who can facilitate strategies to
overcome their lack of mathematical skills (Paschall et al., 2018). Mathematics skills are the top
reason schools hold back students from graduating from high school (Glennie et al., 2016).
Additionally, students struggle to get passing grades in mathematics and to obtain proficiency
scores in standardized exams such as the Algebra 1 Florida Standards Assessment (FSA)
(Florida Department of Education, 2019; Glennie et al., 2016; Hacker, 2012). Kotok (2017) and
Woods et al. (2018) suggest that Hispanic students entering the 9 th grade will not have mastery of
mathematics skills to substantiate placement in higher-level mathematics courses throughout
high school. With such a mathematics skills deficit, Hispanic students’ chances of taking higher-
level mathematics courses and being prepared for more rigorous coursework in a post-secondary
institution are lessened (Kotok, 2017; Paschall et al., 2018; Woods et al., 2018).
A large population of Hispanic students have not exhibited high interest or attainment
value toward mathematics (Saw & Chang, 2018). The initial goal of a cross-lagged panel design
was to determine “whether and to what extent mathematics achievement and motivational factors
for Hispanics differ from other racial/ethnic groups” (Saw & Chang, 2018, p. 245). The
researchers analyzed the interrelationship of the following variables: mathematics achievement,
expectancy for success, and subjective task value measured in the 9th and 11th grades. The
analyses included a three-parameter logistic model with valid Cronbach’s alpha scores ranging
41
from 0.88 to 0.90 that compared standardized test achievement levels. Additionally, a
confirmatory factor analysis (CFA) with valid Cronbach’s alpha scores ranging from 0.71 to .073
was utilized to measure mathematics interest, mathematics utility, and mathematics identity. The
data sample was obtained from a 2009 high school longitudinal study from the National Center
for Education (Saw & Chang, 2018). Saw and Chang (2018) determined that Hispanic students
had a lower level of expectation to be successful in mathematics courses when compared to
White students. This study also reported that Hispanics’ self-efficacy for mathematics was the
lowest among other ethnic groups (Saw & Chang, 2018). The job market has grown in
complexity especially in the STEM career field that requires a strong conceptual understanding
of mathematics skills to find advancement (Saw & Chang, 2018; Wood & Neal, 2007). Strong
mathematics skills are critical for Hispanic students aspiring to enter careers in STEM.
The coursework in mathematics empowers Hispanic students who aspire to be successful
in a STEM program. These students must be able to complete pre-calculus or calculus courses at
the regular or advanced placement level so that they can be on a pathway for careers in the
STEM field (Hinojosa, Rapaport, Jaciw, LiCalsi, & Zacamy, 2016). Park et al. (2018) report that
students well prepared with high-level mathematics courses in high school predicted a passing
rate of 47% in college Intermediate Algebra (Park et al., 2018). Research suggests that Hispanic
students need to take advantage of high-level mathematics courses offered at the high school to
overcome their low expectancy for success in mathematics and to better prepare for post-
secondary education (Hinojosa et al., 2016; Safavian & Conley, 2016). Unfortunately, Hispanic
students tend to steer away from these courses due to their poor mathematics skill levels that
create a mindset of low expectations to succeed (Lauermann et al., 2017). Research outcomes
empirically link the level of expectancy-value belief toward mathematics directly to career plans
42
students select in their early high school years (Chang & Saw, 2018; Douglas & Attewell, 2017;
Safavian & Conley, 2016).
The National Science Foundation (2016) statistics report a 3.8% unemployment rate in
the STEM industry compared to 4.3% for non-STEM jobs and the national unemployment rate
of 8.1%. However, only a collective 27% of all minority groups are represented in the STEM’s
labor market in the U.S. (National Science Foundation, 2016). Mathematics skills proficiency
must increase within the Hispanic community to see greater representation in the STEM industry
(Rincon, 2017). After 15 years since the NCLB authorization, school systems have not been able
to close the White-Hispanic student achievement gap in mathematics across the nation (Kotok,
2017; Musu-Gillette et al., 2017; National Science Foundation, 2019). Addressing the problem
of mathematics deficiency is critical in order to enable Hispanic students to be better suited for
success and more competitive in the STEM job market in the national or global economies
(Lauermann et al., 2017). Secondary schools and post-secondary institutions acknowledgment of
the barrier that mathematics imposes upon Hispanic students is a key step in def ining and
correcting the factors contributing to their low performance in mathematics.
Factors Affecting Hispanic Student Mathematics Achievement
In the United States, factors associated with academic achievement inequalities include
racial/ethnic demographic, gender, and socioeconomic status (Bécares & Priest, 2015). These
factors remain unfamiliar territory for researchers who endeavor to pinpoint predictive
characteristics that affect Hispanic students’ mathematics achievement (Bécares & Priest, 2015).
However, two factors associated to poor mathematics performance include students’ self-
confidence towards mathematics and students’ absenteeism. Without even considering that
mathematics skills can be considered a barrier or gatekeeper course for many students,
43
Laughbaum (2017) suggests that Hispanic students are greatly affected and struggle with
reaching the milestone of high school graduation.
Other factors also influence Hispanic students’ mathematics achievement. Teachers in
primary and secondary education have a responsibility to build content knowledge and to ensure
that learning is happening at high levels measured by formative and summative assessments
(Buffum, Mattos, & Malone, 2018). The annual state exam is the method states use to gather
information pertaining to the level of achievement attained by individual students and how
teachers have impacted the growth in knowledge for the year (Buffum et al., 2018).
As mathematics teachers prepare to influence student learning, they must consider how to
equip students with the skills and concepts they will need to function in a multifaceted world
economy. Furthermore, educational institutions must be able to deliver information and provide
appropriate adaptations to link learning strategies to purposeful skills students will find in a
workforce that continually changes (Tan, 2015). Analysis of current data has shown the number
of Hispanic students who are interested in following STEM careers versus the number of them
who are not interested in following STEM careers is based on their mathematics skills (Saw &
Chang, 2018). School principals must establish a culture of high academic success to ensure that
the entire school community embraces and fosters excellence while experiencing academic
success. This culture must include the way teachers collaborate and build their capacity to meet
the needs of a community that is underrepresented in the field of STEM as a result of low
mathematics skills (Callahan et al., 2017). Students’ responses to the high expectation culture
yielded great academic achievement even when some students experienced failures which shows
both teacher ability to meet the mathematics needs of Hispanic students and student self -
44
confidence can contribute to Hispanic students’ success, or lack thereof (Espinoza-Herold &
González-Carriedo, 2017).
Student self-confidence. Researchers indicate that Hispanic students were reluctant to
engage in mathematical courses due to their low expectancy of success (Eccles, 2009; Saw &
Chang, 2018). Cleary and Kitsantas (2017) refer to self-confidence, self-efficacy, and
expectancy-value to succeed interchangeably when addressing how these factors support
students’ mathematical outcomes. Students with a high self-concept to succeed is a predicting
factor to improved outcomes in mathematics. Clarkson, Love, and Ntow (2017) suggest that a
positive correlation exists between students’ self-confidence and mathematics achievement based
on the individual’s self-perception to accomplish the tasks. The purpose of the Clarkson et al.,
(2017) study was to “find a relationship between students’ levels of proficiency and how they
describe themselves in terms of confidence doing mathematics” (p. 441). The study used
multiple regression analyses with sample data from a Trends in Mathematics and Science Study
(TIMSS) consisting of 7,377 eighth graders from 239 schools throughout the United States
(Clarkson et al., 2017). The study revealed that the level of confidence as a predictor of
mathematics achievement, F(1, 75) = 121.16, p < .001 was statistically significant (Clarkson et
al., 2017). The results for patterns of students’ confidence as a predictor of mathematics
achievement, F(1,75) = l41.08, p < .001 was also significant. Students’ confidence is an intrinsic
factor that can determine their expectations of success or how they will achieve proficiency when
attempting to solve mathematical problems (Eccles, 2009; Foster, 2016; Lauermann et al., 2017;
Saw & Chang, 2018). Furthermore, empirical evidence directly supports that students with a
strong self-efficacy showed that to be a significant predictor of mathematics outcome (Cleary &
Kitsantas, 2017; Wang & Eccles, 2013). Mathematics ability and competence are two predic ting
45
aspects of students’ academic success in mathematics, yet student self-confidence and self-
concept must also be considered when researching and defining correlated relationships for
mathematics success.
Student self-concept. Students’ self-concept of ability towards mathematics is
associated to mathematics achievement (Denner, Valdes, Dickson, & Laursen, 2019). Self-
concept refers to students’ self-assessments of their abilities to complete a task. Therefore, “if a
student feels competent in an academic domain, this sense of ability might enhance his or her
self-concept” (Susperreguy, Davis-Kean, Duckworth, & Chen, 2018, p.2197). Students who
receive positive feedback from teachers or peers are likely to succeed in mathematics classes as
academic praise builds up their self-concept toward mathematics (Susperreguy et al., 2018).
Susperreguy et al. (2018) also assert that an individual who gets positive feedback will be
encouraged to seek out more challenging tasks and increasingly demanding problems.
Susperreguy et al. (2018) used three data sets from Avon Longitudinal Study of Parents and
Children (ALSPAC), the National Institute of Child Health and Human Development-Study of
Early Child Care and Youth Development (NICHD-SECCYD), and the Panel Study of Income
Dynamics-Child Development Supplement (PSID-CDS). The purpose of the study was to
determine whether a relationship exists between self-concept and academic achievement from
students with different achievement levels using each data set (Susperreguy et al., 2018). The
variables of the study measured the level of self-concept of ability and the level of academic
achievement in mathematics. The sample size was 13,901 students between 9 and 17 years of
age with data obtained in elementary, middle, and high school. The instrument used in the
mathematics study included an adaptation from a mathematics Scale Self-Description
Questionnaire validated with a Cronbach’s alpha of .80 for the ALSPAC data set. Data analyses
46
were conducted using linear and quantile regression to determine the relationship between self-
concept and academic achievement over time (Susperreguy et al., 2018).
The analyses conducted in the Susperreguy et al. (2018) study reveals positive
relationships between the students’ self-concepts of ability in mathematics and their mathematics
achievement levels. The linear regression analyses show a moderate positive prediction for the
elementary age students and a high positive prediction for high school age students with an effect
size ranging between .22 for the PSID-CDS and .48 for the ALSPAC data sets (Susperreguy et
al., 2018). The quantile regression data reveals a strong relationship between self-concept of
ability in mathematics and mathematics achievements (Susperreguy et al., 2018). The linear and
quantile regressions analyses provide robust outcomes to support the relationship between self-
concept of ability in mathematics and mathematics achievements (Susperreguy et al., 2018).
Susperreguy et al.’s findings on the factor of students’ self-concept of ability in mathematics
positively predict mathematics performance (2018). In addition to Susperreguy and colleagues’
work, Denner et al. (2019) add that Hispanic students’ low self-concept is a contributor to their
low performance in mathematics. Hispanics’ self-concept of ability in mathematics must be
further explored to determine whether an association exists with their low performance in
mathematics. Another potential factor that influences mathematics achievement within the
Hispanic community is school absenteeism.
Student absenteeism. Student high school absenteeism is a negative behavior that
tremendously affects Hispanic students (Smerillo et al., 2018). Studies show an association of
school absenteeism with poor academic achievement specifically in mathematics (Gottfried,
2014; 2017; 2019; Gottfried & Kirksey, 2017). However, gaps exist in the body of research
related to the predictability of absenteeism of Hispanic students and their low academic
47
achievement in standardized testing (London et al., 2016; Romero & Lee, 2017). Research
studies suggest that absenteeism is a national problem and affects many industrialized countries
around the globe (Cabus & De Witte, 2015; Maynard et al., 2017; Rafa, 2017). Empirically
supported research indicates that school attendance is a predictor of students’ reading and
mathematics levels of achievement (Gottfried, 2019). However, not much of the existing
research examines how Hispanic students’ absenteeism affects their performance in mathematics
or influences their interest in STEM careers (Gottfried, 2010; 2014; 2019; Safavian & Conley,
2016; Saw & Cheng, 2018). Gottfried (2010; 2014; 2019) suggests that consistent school
attendance can be an indicator of the level of academic performance that students attain
throughout the school year and reduce the potential of facing grade-level retention. Absenteeism
is a known contributor to the White-Hispanic mathematics achievement gap, especially in urban
schools located in low income or high poverty communities (Gottfried, 2010; 2019; Owings et
al., 2017). The effects of the lack of attendance are associated with low academic achievement
in reading and mathematics attributed to Hispanic students (Green et al., 2012; Rogers et al.,
2017; Romero & Lee, 2017). Koopmans (2017) asserts that reading skills may be a remediable
skill upon the students’ return to school. However, students who do not learn mathematics
concepts and skills properly show frustration as a result of the learning gaps (Smerillo et al.,
2018).
Hispanic students are discouraged from their lack of learning gains shown in classroom
academic achievement data and on annual mathematics assessments (Green et al., 2012). These
students have high levels of academic frustration to the point that they are not motivated to
attend school (Rafa, 2017). Consequently, Hispanic communities must deal with low social-
economic problems continually exacerbated by obtaining low-paying jobs or experiencing
48
unemployment for not obtaining a high school diploma in four years or before 21 years of age
(Smerillo et al., 2018). The continual decline in academic achievement and the rise in
absenteeism of Hispanic students is creating a critical setback in their community as students in
this constant struggle end up as truants (Mallet, 2016; United States Department of Education,
2016).
In response to absenteeism in Florida schools, the daily task of taking attendance in
classrooms has become one of the most important teacher responsibilities before instruction
takes place (Koopmans, 2017; Watson & Hemmer, 2015). Accurate average daily attendance
(ADA) reporting is a strong indicator that connects student attendance to academic achievement
(Gottfried, 2019; Rafa, 2017). The national education legislation, Every Student Succeeds Acts
(ESSA), was signed by President Obama in 2015 as the reauthorization of the Elementary and
Secondary Education Act (Every Student Succeeds Act, 2017). ESSA mandated the
implementation of strategies to address absenteeism as part of the yearly accountability system to
be included in a school’s improvement plan (Rafa, 2017). The early warning system (EWS)
functions as “a system based on student data to identify students who exhibit behavior or
academic performance that puts them at risk of dropping out of school” (Rafa, 2017, p. 4). The
data collected through the EWS are analyzed, monitored, and used by school-based Multi-Tiered
Systems of Support (MTSS) teams to allocate resources that tackle absenteeism and academic
deficiencies (Lancaster & Hougen, 2017; Rafa, 2017).
School absenteeism is associated with poor academic performance and may predict high
school dropouts (Gottfried, 2019). Students involved in absenteeism are more likely to become
high school dropouts and engage in risky behaviors such as delinquency, substance abuse, and
early pregnancy (Kearney & Graczyk, 2014; London et al., 2016).
49
Hispanics in STEM Careers
Hispanic students are not aspiring to enter STEM-related career fields even with the
opportunities afforded by an industry of wages above national average and workforce shortages
(Fayer, Lacey, & Watson, 2017; Mau & Li, 2017). The United States Bureau of Labor Statistics
report that the national average income in STEM jobs was over $80,000 and the employment
demands are projected to increase 13% by 2022 (Fayer et al., 2017; Segovia, 2019). A close
comparison to these numbers has industry experts concerned as they believe the number of jobs
projected will not be filled due to a shortage in labor force (Mau, 2018). Therefore, STEM jobs
are instrumental for economic development of the Hispanic community and providing access to
high-wage careers (Hinojosa et al., 2016). An increase in the number of Hispanic students
pursuing math and science programs in post-secondary institutions directly impact the United
States university ranking in terms of STEM producing degrees among countries that compete for
this global market (Dossey et al., 2016). Universities in the U.S. are generating 12% of degrees
compared to China’s 23% of all engineering careers among industrialized nations (National
Science Board, 2016).
The National Science Board (2016) reviewed existing studies with the goal of
determining which indicators are associated with Hispanics underrepresentation in STEM
careers. The body of research expresses ideas to understand why Hispanics have fallen behind in
career fields where strong mathematics skills are necessary (Lauermann et al., 2017; Porter &
Snipp, 2018). C These factors are considered to be contributing influences to Hispanics’ lack of
aspiration to enter the STEM field.
A plethora of studies that connect students’ absenteeism to low performance in
mathematics exists; consequently, the evidence supports that absenteeism detracts one from
50
developing strong mathematics skills (Mallet, 2016; Musu-Gillette et al., 2017; Rafa, 2017;
United States Department of Education, 2016). A secondary association was shown in prior
studies: Hispanic students’ low expectancy-value to succeed in acquiring strong mathematical
skills steers them away from entering STEM careers. As students are absent from classrooms in
America, reading comprehension and mathematics achievement levels continue to fall across the
nation’s schools making it difficult to close the achievement gap that continues to challenge the
education system (Kearney & Graczyk, 2014). Mathematics is the subject area most affected by
absenteeism and missing instructional time is unrecoverable (Coelho, Fischer, McKnight,
Matteson, & Schwartz, 2015).
Mathematics courses build confidence and provide pathways for students to enter STEM
careers; however, “the underrepresentation of Hispanic people in the STEM workforce may be
explained in part by differences in the STEM knowledge, skills, and motivation that are instilled
into Hispanic students in grades K–12” (Hinojosa et al., 2016, p. 1). The United States
Department of Education and the Department of Labor Statistics connect Hispanic students’ low
expectancy-value to their low level of mathematics performance. Furthermore, Hispanic
students’ low expectancy-value may be associated with their underrepresentation in the STEM
career field (Eccles, 2009; National Science Board, 2016; Saw & Chang, 2018). The competitive
edge for the 21st century lies in the nation’s capacity to lead the global economy in the areas of
science and technology innovation and to invest in the education sector that can generate a
workforce capable of filling STEM career jobs (Andersson et al., 2018).
Mathematics subject areas will continue to be an access point into STEM career fields for
secondary and postsecondary students so that they may fill jobs as qualified college graduates
across all demographics (Ozkan, 2017). A study conducted by the United States Department of
51
Education provides robust evidence that students with successful completion of mathematics
courses in high school will have greater aspirations to pursue STEM careers (Borman et al.,
2017). In the case of Hispanic youths who aspire to pursue a career in the field of mathematics
or science, low performance in those subject areas is a discouraging factor preventing them to
turning those aspirations into real, attainable goals (Riegle-Crumb, Moore, & Ramos-Wada,
2010). Nonetheless, academic performance in mathematics and science as access points into the
field of STEM are strong predictors of students’ aspiration for STEM careers (Borman et al.,
2017; Saw & Chang, 2018).
In search for answers to Hispanic students’ low mathematics achievement levels,
Safavian and Conley (2016) point toward the disparity that exists among different races in
expectancy values (E-V) as related to mathematics in primary and secondary schools. E-V are
“expectancies and values that are assumed to be influenced by task-specific beliefs such as
ability beliefs, the perceived difficulty of different tasks, and individuals’ goals, self-schema, and
affective memories” (Wigfield & Eccles, 2000, p. 69). Hispanic high school students are shown
to have a lower E-V toward mathematics when compared to White students, thus, correlating to
the low achievement levels in mathematics which contributes to the math achievement gap (Saw
& Chang, 2018). In addition to E-V, the subject task value plays an important role in whether
Hispanic students perceived value of mathematics as worthy of their willingness to complete a
task (Safavian & Conley, 2016).
Students pursuing STEM careers score higher on standardized testing than non-STEM
pursing students. Mau & Li (2018) f ind that students who are interested in STEM careers have
significantly higher annual assessments scores and better academic achievement in advanced
mathematics and science courses than students who are not interested in the STEM career field.
52
In the study, the following factors are found to be supporting and positive predictors of which
students aspire to enter a STEM career: mathematics self-efficacy, mathematics interests, school
engagement, gender familial background, and educational aspirations (Mau & Li, 2018).
Students who complete a college degree in a STEM career field score higher in standardized
annual assessments as they are influenced to persist working toward accomplishing the degree
(Mau & Li, 2018). Among the STEM degree completers, the data reveal that Hispanics only
represent 6% of STEM workers in the industry (Segovia, 2019).
Hispanic students’ representation in the field of STEM careers is critically low and the
literature provides evidence of the prevalence of this 21st-century problem (Kubat, 2018; United
State Department of Education, 2016). These studies explore themes that point at possible
relationships regarding the lack of Hispanic students’ representation in STEM careers and their
poor mathematics skills. Studies also indicate that poor attendance leads to low motivation to
succeed in math and science courses throughout the K-12 education system. Increasing school
attendance improves the chances of Hispanic students participating in rigorous mathematical
coursework. As more Hispanic students succeed in advanced mathematics courses, more
Hispanic students are on a pathway to STEM post-secondary programs and careers (Hinojosa et
al., 2016). The existing research gaps and limitations do not address how Hispanic students’
high school absenteeism can potentially predict mathematics achievement or interest in STEM
careers and this possible correlation will need to be considered with subsequent research. The
present study proposes to answer the following research questions: Is there a predictive
relationship between Hispanic students’ absenteeism and mathematics achievement? Is there a
predictive relationship between Hispanic students’ absenteeism and their interest in STEM
careers?
53
Summary
The body of literature within this review conveys ample evidence to support the claim
that Hispanic students’ absenteeism is extremely high. A large portion of Hispanic students
affected by absenteeism find difficulty to excel in mathematics courses that build their skills to
enter careers in the field of STEM. Evidence in the literature suggests a negative impact of
absenteeism on academic performance in mathematics. Hispanic students are identified as a
demographic group frequently engaged in chronic absenteeism. Their academic achievement
suffers to the point that many decide to drop out of school. Hispanic students that remain in
school are underrepresented in STEM career clusters. They are more reluctant to enter STEM
programs in their post-secondary pathways due to a low expectancy to succeed in mathematics
foundational coursework.
In Eccles et al.’s (1983) synthesis of expectancy-value theory, the authors postulate the
importance of an individuals’ expectation to succeed and their ability belief to accomplish a task
specifically in mathematics. This motivational framework is applicable to this study as Hispanic
students are not building strong mathematical skills to enable them to build an ability belief that
gives them the confidence to pursue careers that are fundamentally based on mathematics.
Deficits in math competencies are recognized in Hispanic students’ who engaged in habitual
school absenteeism. This problem has caught the attention of leaders at state-level Departments
of Education as well as school district superintendents. The lack of school attendance coupled
with low expectation to succeed is resulting in Hispanic students having low aspirations toward
STEM careers.
This salient problem also draws from Holland’s vocational choice theory that uses a
coding method to pinpoint students career aspirations predicated on an individual’s personality
54
type. Students typically entering the STEM career field have traits associated with investigative
or thinker interests. Hispanic students who are chronically absent from mathematics courses
have a more difficult time acquiring these problem-solving competencies necessary to be
successful in the STEM industry.
The related literature provides a wide-lens view of how mathematics skills are
foundational in American education and a main precursor to technology and innovation. A
Nation at Risk (1983) delivered a blow to the United States education system chiefly in the area
of mathematics. In the views that A Nation at Risk presents, legislators have made it their
mission to ensure that mathematics education is addressed through legislative initiatives
including Goals 2000, NCLB, and RTTT. With Race to the Top comes the Common Core State
Standards, increasing the rigor of English language arts and mathematics courses across the
education system in the country. The goals of the legislation differs from one political
administration to the next; however, the common objective is to improve critical thinking skills
and to close the achievement gap of American students ensuring they are college and career
ready and have the ability to compete in the global market.
STEM jobs are expected to grow 12.5% by the year 2022; however, experts believe that
those jobs will not be filled because of a lack in workforce trained for these positions. As a
rapidly growing ethnic group, Hispanic students can become the replacement to an aging
population in the STEM field. A significant amount of research demonstrates the need for the
importance of Hispanic communities to access STEM careers jobs as this industry affords
opportunities to high-wage careers. Studies also suggest that a lack of expectancy-value to
succeed and motivation created by chronic absenteeism can affect how Hispanic students learn
mathematics. The research exposes the ideas of absenteeism interfering with direct instruction

55
which has a highly desired effect in mathematics. The gap in the literature implies further
studies should work to identify key barriers that are preventing Hispanic students from entering
STEM fields. Other implications of correlation could exist within these barriers and should be
further researched for direct connections.
56
CHAPTER THREE: METHODS
Overview
The purpose of this correlational study is twofold. First, the study uses the Expectancy
Value Theory model (Eccles & Wigfield, 2002) to determine whether a relationship exists
between Hispanic students’ absenteeism and mathematics achievement and, if a relationship
does exist, to what strength. The second determination this study tries to prove using Holland’s
Theory of Vocational Choice (1959) is whether a relationship exists between Hispanic students’
aspiration to enter the STEM career field and students’ absenteeism, if a relationship does exist,
to what strength. This chapter presents the research design, the research questions, the
hypotheses, the participant selection criteria, the setting for data collection, the instruments, the
procedures, and the statistical analyses.
Design
In the present quantitative study, the researcher utilizes a correlational design as the most
appropriate approach to determine the correlation and strength of the relationship between two
variables (Joyner, Rouse, & Glatthorn, 2013; Warner, 2013). This design is chosen because it
appropriately aligned when seeking for a predictive relationship between the predictor variable
and criterion variables (Gall, Gall, & Borg, 2007). Statistical significance resulting from this
correlational design does not imply a causal relationship among the variables (Gall et al., 2007).
A correlational design aligns with research studies and the present study is modeled after
previous research that examined similar factors among a different population (Gottfried, 2019;
Laurment et al., 2017; Saw & Cheng, 2018).
In this correlational study, the researcher employs two bivariate linear regression analyses
seeking to find a predictive relationship, first, between Hispanic students’ absenteeism and
57
mathematics achievement level. Based on extant definitions of student absenteeism, the
operational definition for the predictor variable is percent of the year missed per 180 school days
(Kearney & Graczyk, 2014; 2018; Owings et al., 2017; United States Department of Education,
2016). Students’ mathematic scores, operationally defined as the achievement level obtained on
the Algebra 1 Florida Standards Assessment (Florida Department of Education, 2017; Giambo,
2017), serves as one criterion variable. The researcher conducted a second bivariate linear
regression analysis seeking to determine whether a predictive relationship exists between
aspirations to enter a STEM career and school absenteeism. Aspiration, the predictor variable, is
operationally defined as an educational direction determined by a career employment survey
(Bakker & Macnab, 2004; Mau & Li, 2018; Morgan, 2006).
In a bivariate linear regression analysis, one can assume “that the relation of the X and Y
variables is linear” (Warner, 2013, p. 344). In similar studies, bivariate regressions were used to
examine factors that influenced students’ aspirations to enter careers in the STEM field (Borman
et al., 2017; Cleary & Kitsantas, 2017; Mau & Li, 2018; Saw & Chang, 2018). This study uses
archival data—information held in the school district’s and schools’ electronic database archives
(Gall et al., 2007).
Research Questions
The following research questions are considered in the present study:
RQ1: Is there a predictive relationship between Hispanic students’ high school
absenteeism and mathematics achievement?
RQ2: Is there a predictive relationship between Hispanic students’ interest to pursue
careers in the STEM field and high school absenteeism?
58
Hypotheses
The corresponding null hypotheses that addressed the research questions are:
H01: There is no significant predictive relationship between Hispanic students’ high
school absenteeism and mathematics achievement.
H02: There is no significant predictive relationship between Hispanic students’ interest to
pursue careers in the STEM field and high school absenteeism.
Participants and Setting
The participants for this study are drawn from a convenience sample of high school
students who attended two schools located in a school district in Florida. The school district
consists of approximately 64,000 students enrolled at the time of the study, with a demographic
breakdown of 59% Hispanics, 26% Whites, 11% Blacks, 2% Asians, and 2% Native Americans
(Data U.S.A., 2018). The school district enrollment by gender is 49% male and 51% female
students. The correlational study uses a population sample consisting of 431 Hispanic students
from two Title I high schools in the school district’s most southern location. The researcher uses
a matched sample as both high schools are located in similar communities with similar Hispanic
student density and socioeconomic and cultural milieu (Eccles &Wigfield, 2002). Throughout
the population of all other high schools in the observed Central Florida school district, none have
representative demographics that could be matched into the sample.
High school A has an enrollment of 2,030 students with a demographic breakdown of
64% Hispanic, 9% White, 23% Black, 2% Asian, and 2% Native American. High school B has
an enrollment of 1,740 students with a demographic breakdown of 64% Hispanic, 13% White,
19% Black, 1% Asian, and 3% Native American. For this study, the researcher uses sample data
from these two high schools, A and B, with the highest number of enrolled Hispanic students in
59
the school district. Ex post facto data are collected for the 2018-2019 school year to analyze the
following factors: annual mathematics achievement standard scale scores, attendance records
with the number of days absent for the year, and the career survey DWYA information from 431
Hispanic students enrolled in the selected high schools. The gender breakdown of 221 males and
210 females provides for 49% females and 51% males of the total sample. The inclusion of 431
students in the sample population (N) exceeds the required minimum of 66 students for a
medium effect size and a statistical power of .7 at the .05 alpha level (Gall et al., 2007).
Instrumentation
The present study uses archival data generated from the following instruments: Algebra 1
Florida Standards Assessment, the state-mandated assessment used for end-of-course mastery
determination; FOCUS school software that records, tracks, and manages attendance; and
Naviance – Do What You Are survey that is used to determine students’ career interests.
Algebra 1 Florida Standards Assessment
The Florida Standards Assessment (FSA) is used as Florida’s standardized summative
exam administered yearly in third through tenth grades (Florida Department of Education FSA,
2017). The FSA serves as students’ demonstration of proficiency and as a high school
graduation requirement in the Algebra 1 subject area (Giambo, 2017). The FSA is a summative
assessment that measures the level of mastery students attained throughout the school year. This
type of assessment is used to determine mathematics achievement in an effort to ascertain
whether a student is ready to enter college or a career at an entry level (Giambo, 2017).
Additionally, this information provides state legislators accountability data to evaluate the
effectiveness of school districts, schools, and teachers (FLDOE Secondary, 2017). The FSA,
developed by the American Institutes of Research (AIR) in collaboration with the Florida
60
Department of Education, uses mixed item types such as multiple choice, short response, and
extended response. The test is designed to measure 21 mathematics Florida standards that
include algebra and modeling, functions, statistics, and the number system (Florida Department
of Education FSA, 2017). The test items are aligned in complexity to Webb’s (1977) depth of
knowledge (DOK) from level 1 to 4 with a distribution of 20% of the test items at DOK 1, a low-
level range of difficulty; 60% of the test items at DOK 2, medium-range level of difficulty; and
20% of test items are DOK 3, the highest level of difficulty assessed; however, students are not
measured at DOK 4 (Florida Department of Education FSA, 2017). The Algebra 1 FSA scores
are divided in levels 1 through 5 with the proficiency attainment beginning at level 3 and
advanced proficiency at levels 4 and 5. In the 2018-2019 school year, the test’s scale score range
for the corresponding levels were level 1 = 425-486, level 2 = 487-496, level 3 = 497-515, level
4 = 518-531, and level 5 = 532-575, as determined on 51 test items completed during two 90-
minute sessions over two days (Florida Department of Education FSA, 2017).
The Florida Department of Education (2017) uses three reliability tests to obtain
measures of internal consistency and test reliability of the Algebra 1 FSA. The tests FLDOE
implemented are Cronbach’s alpha, stratified alpha, and Feldt-Raju coefficient. The 2016-2017
Algebra 1 FSA reliability coefficient for Cronbach’s alpha was α = .85, for the stratified alpha
was α = .85, and for the Feldt-Raju coefficient was α = .85 (Florida Department of Education
FSA, 2017). The Algebra 1 FSA test is found to be internally consistent and reliable as indicated
by an overall Cronbach’s alpha of .84 (Warner, 2013). Due to the subtests embedded in the
Algebra 1 FSA, a stratified alpha of .84 provides a better reliability estimate of the test items
(Osburn, 2000). Cronbach’s alpha can underestimate parallel form and split-half reliability;
therefore, the Feldt-Raju coefficient of .85 is within the acceptable range of .70 and .95.
61
Consequently, based on the combined Feldt-Raju coefficient of .85 and Cronbach’s alpha of .84,
it is determined that the Algebra 1 FSA is reliable (Feldt & Qualls, 1996; Gall et al., 2007).
The Algebra 1 FSA test validity denotes the measurements that are used to ensure that the
test items are properly aligned with the standards the item is intended to assess (Warner, 2013).
Test developers validate each test item to ensure that field-tested items are not giving cues or
clues to answers of other field-test items. The test developers include a mixed range of items
composed of multiple reporting categories and standards that reflect a range of difficulty and
cognitive levels. Throughout test development, abrupt transitions between subject strands are
eliminated or minimized, and selected items within strands are placed and organized in the
appropriate variety and number (Florida Department of Education FSA, 2017; Giambo, 2017).
FOCUS School Software
FOCUS is an electronic gradebook developed as a data clearinghouse system that collects
students’ attendance tracking information, students’ academic performance, students’ historical
and demographic data, scheduling tools, discipline records, and counseling documentation
(FOCUS, n.d.). Attendance data from FOCUS is used in this study as a predicting variable. The
face validity of the FOCUS program relies on the number of school districts in which the
program is actively in operation. Currently, FOCUS school software has data from 1.5 million
students in their records (FOCUS, n.d.).
Teachers use FOCUS electronic gradebook to input daily attendance. The attendance
clerk evaluates reports on a weekly basis and generates a parent letter for students missing five
days of school with no excuse. Parents get a second letter when their students miss 10 school
days without excuse. These letters inform parents and document that the child has not been
attending school. Some of the characteristics and structures provided by the FOCUS system include the
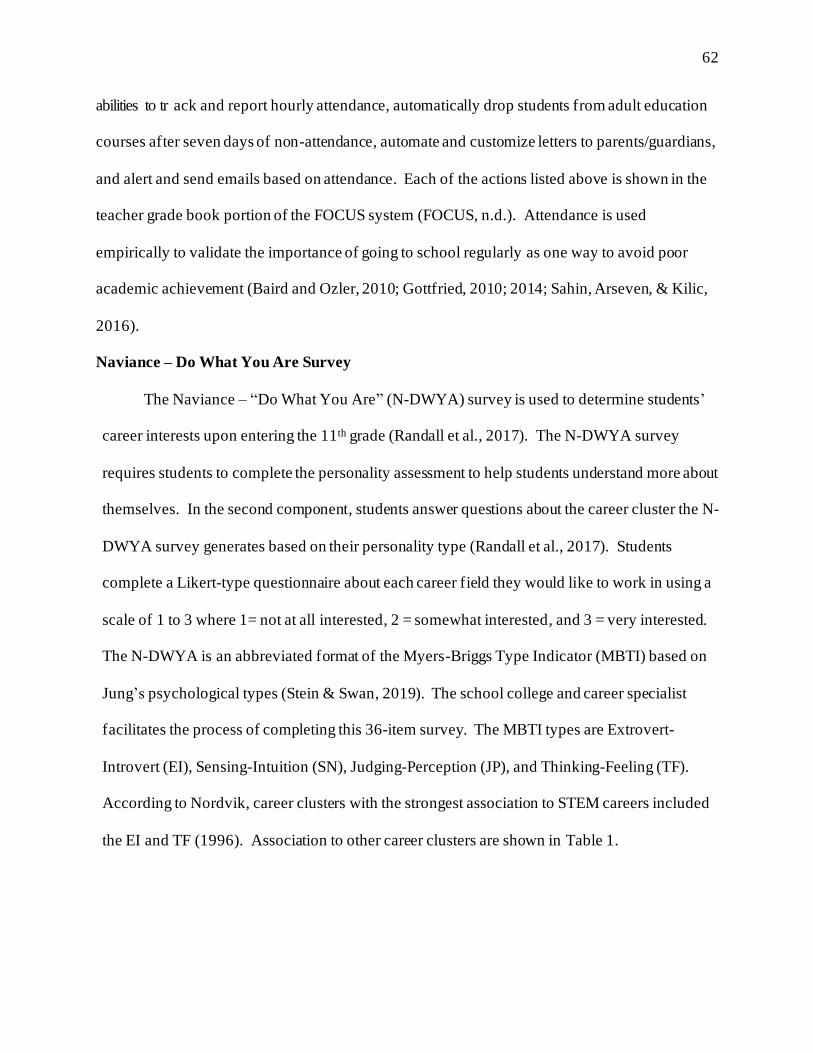
62
abilities to tr ack and report hourly attendance, automatically drop students from adult education
courses after seven days of non-attendance, automate and customize letters to parents/guardians,
and alert and send emails based on attendance. Each of the actions listed above is shown in the
teacher grade book portion of the FOCUS system (FOCUS, n.d.). Attendance is used
empirically to validate the importance of going to school regularly as one way to avoid poor
academic achievement (Baird and Ozler, 2010; Gottfried, 2010; 2014; Sahin, Arseven, & Kilic,
2016).
Naviance – Do What You Are Survey
The Naviance – “Do What You Are” (N-DWYA) survey is used to determine students’
career interests upon entering the 11th grade (Randall et al., 2017). The N-DWYA survey
requires students to complete the personality assessment to help students understand more about
themselves. In the second component, students answer questions about the career cluster the N-
DWYA survey generates based on their personality type (Randall et al., 2017). Students
complete a Likert-type questionnaire about each career field they would like to work in using a
scale of 1 to 3 where 1= not at all interested, 2 = somewhat interested, and 3 = very interested.
The N-DWYA is an abbreviated format of the Myers-Briggs Type Indicator (MBTI) based on
Jung’s psychological types (Stein & Swan, 2019). The school college and career specialist
facilitates the process of completing this 36-item survey. The MBTI types are Extrovert-
Introvert (EI), Sensing-Intuition (SN), Judging-Perception (JP), and Thinking-Feeling (TF).
According to Nordvik, career clusters with the strongest association to STEM careers included
the EI and TF (1996). Association to other career clusters are shown in Table 1.
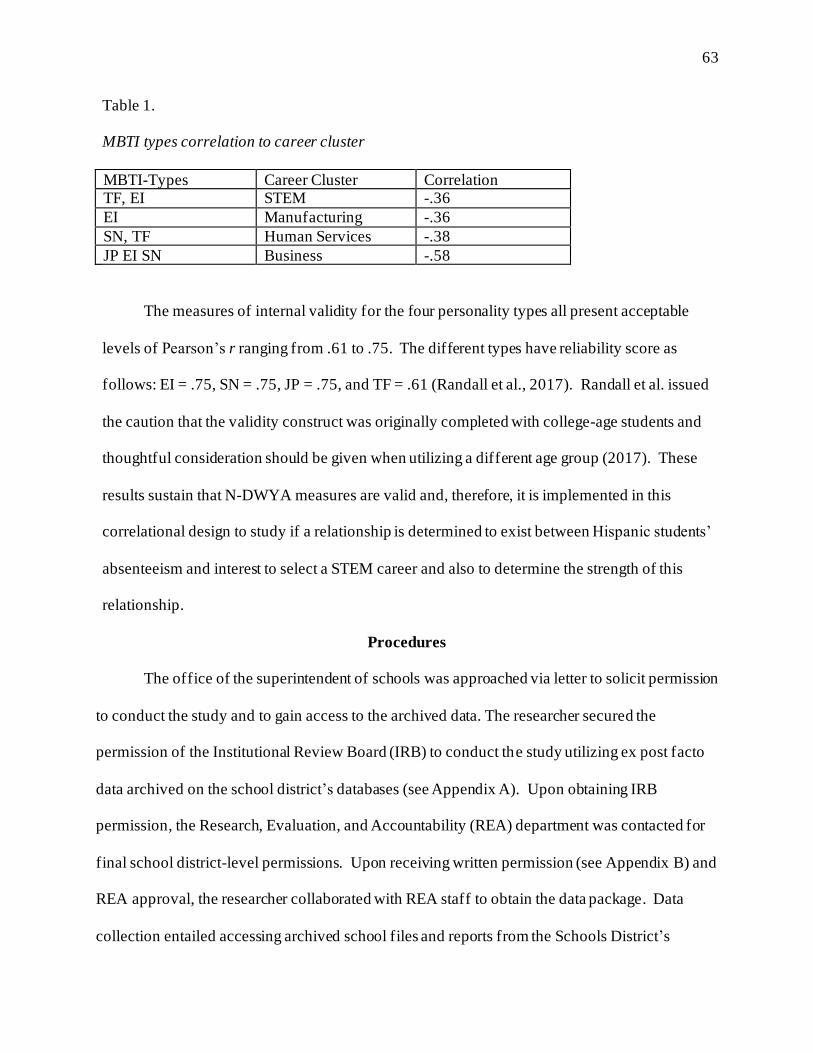
63
Table 1.
MBTI types correlation to career cluster
MBTI-Types Career Cluster Correlation TF, EI STEM -.36
EI Manufacturing -.36
SN, TF Human Services -.38
JP EI SN Business -.58
The measures of internal validity for the four personality types all present acceptable
levels of Pearson’s r ranging from .61 to .75. The different types have reliability score as
follows: EI = .75, SN = .75, JP = .75, and TF = .61 (Randall et al., 2017). Randall et al. issued
the caution that the validity construct was originally completed with college-age students and
thoughtful consideration should be given when utilizing a different age group (2017). These
results sustain that N-DWYA measures are valid and, therefore, it is implemented in this
correlational design to study if a relationship is determined to exist between Hispanic students’
absenteeism and interest to select a STEM career and also to determine the strength of this
relationship.
Procedures
The office of the superintendent of schools was approached via letter to solicit permission
to conduct the study and to gain access to the archived data. The researcher secured the
permission of the Institutional Review Board (IRB) to conduct the study utilizing ex post facto
data archived on the school district’s databases (see Appendix A). Upon obtaining IRB
permission, the Research, Evaluation, and Accountability (REA) department was contacted for
final school district-level permissions. Upon receiving written permission (see Appendix B) and
REA approval, the researcher collaborated with REA staff to obtain the data package. Data
collection entailed accessing archived school files and reports from the Schools District’s
64
database. The data was immediately saved to an external hard drive and remained locked in a
cabinet until the researcher began to process and analyze the information. The data package did
not have student names as they were anonymized to maintain confidentiality in accordance with
the Family Educational Rights and Privacy Act (FERPA). Each student’s data file received a
corresponding case number generated in Microsoft Excel to preserve anonymity.
The researcher created an Excel spreadsheet with all the data files to simplify the
information and to increase efficiency during the data analysis process. IBM Statistical Package
for the Social Science (SPSS) was used to examine the relationship of Hispanic students’ high
school absenteeism with mathematics achievement. SPSS also examined the relationship of
Hispanic students’ high school absenteeism and their interests to pursue careers in the STEM
field. The researcher entered the data into the SPSS program for statistical analyses that
generated tables, plots, and graphs for the study.
Data Analysis
Bivariate linear regressions were used to analyze FOCUS software absenteeism data,
Algebra 1 FSA standard scale score achievement data, and N-DWYA result data to determine
whether a predictive relationship exists among the predictor and criterion variables (Florida
Department of Education FSA, 2017; Giambo, 2017; Mau & Li, 2018; Morgan, 2006; Randall et
al., 2017). The researcher used two bivariate linear regression analyses as the statistical
techniques to address each of the null hypothesis (Gall et al., 2007). In order to accomplish these
goals, two separate bivariate linear regressions were used. Bivariate linear regression is
appropriate to use because the predictor variable of school absenteeism was operationalized as
the number of days Hispanic students were absent from school through the 2018-2019 school
year. The criterion variable was operationalized as the Algebra 1 standard scale score of
65
mathematics achievement for the first regression. For the second regression, interest in STEM
careers was represented by the number of careers selected from the STEM cluster, manufacturing
cluster, human services cluster, and business cluster, in the STEM field selected. The N-DWYA
survey was operationalized as the predictor variable (Warner, 2013). The effect size was
determined in addition to Pearson r (Warner, 2013). Pearson’s r was used to determine whether
a correlation exists and, if so, the strength of the relationship between variables (Warner, 2013).
Pearson’s r is preferred when conducting educational research “because most educational
measures yield continuous scores and because r has a small standard of error” (Gall et al., 2007,
p. 347).
Data was screened for outliers, inconsistencies, and missing values that can skew the
results. To ensure the data were free of outliers, the researcher used a scatter plot to detect and
eliminate any extreme outliers. Missing values include relevant data that are left out during the
data collection process (Warner, 2013). The test for missing values was completed using SPSS
25® missing values add-on procedure (Warner, 2013). The data screening included testing for
the assumption of bivariate outliers using a scatter plot. The assumption of bivariate normal
distribution was also examined with a scatter plot. A scatterplot was also used to check for the
assumption of linearity looking at all data points to see how closely they fall along the line of
best fit (Warner, 2013).
The SPSS data output for the present correlation study was analyzed for significance at
the alpha level of p < .05 statistical power. In order to meet the desired statistical power, the
number of cases (N) need to be at least 105 (Warner, 2013). However, for the present study N =
431. Pearson’s r analysis indicated tenable levels of linearity between variable X, Hispanic
students’ absenteeism, and variable Y, the Algebra 1 FSA level of achievement. Furthermore, a
66
second Pearson’s r analysis indicated a tenable level of linearity between variable X, Hispanic
students’ absenteeism, and variable Y, Hispanic students’ aspirations to enter the STEM career
field. Warner (2013) sustains that the degree of linearity between variables should not be
considered evidence of causation in a non-experimental research study. Two bivariate
regressions were conducted to analyze the strength of the independent variable in predicting the
dependent variables. The researcher analyzed the following SPSS 25® correlation output:
Pearson’s r, N, p-values, and R2.
Descriptive statistics were generated for the sample utilizing SPSS 25® as described in
the data instruments (see table 1 and 2). The statistical output included sample size, the mean
scores and standard deviation of FSA achievement standard scale scores, and the likelihood scale
of selecting a career according to the N-DWYA survey results.
67
CHAPTER FOUR: FINDINGS
Overview
The purpose for this, nonexperimental, quantitative, ex post facto, correlational study is
to determine whether there is a relationship between Hispanic students’ high school absenteeism
as the predictive variable and mathematics achievement as the criterion variable . Additionally,
this study seeks to determine if a relationship exists between Hispanic students’ high school
absenteeism as a predictive variable and their aspiration to enter STEM career fields as the
second criterion variable. In this chapter, the research questions and null hypotheses are
reviewed. Also, the descriptive statistics and bivariate assumptions are reported. Their analyses
determine whether to reject or fail to reject the null hypotheses.
Research Question(s)
The following research questions are examined in this study:
RQ1: Is there a predictive relationship between Hispanic students’ high school
absenteeism and mathematics achievement?
RQ2: Is there a predictive relationship between Hispanic students’ interest to pursue
careers in the STEM field and high school absenteeism?
Null Hypothesis(es)
The null hypotheses for this study are the following:
𝐇𝟎𝟏: There is no significant predictive relationship between Hispanic students’ high
school absenteeism and mathematics achievement.
𝐇𝟎𝟐: There is no significant predictive relationship between Hispanic students’ interest to
pursue careers in the STEM field and high school absenteeism.
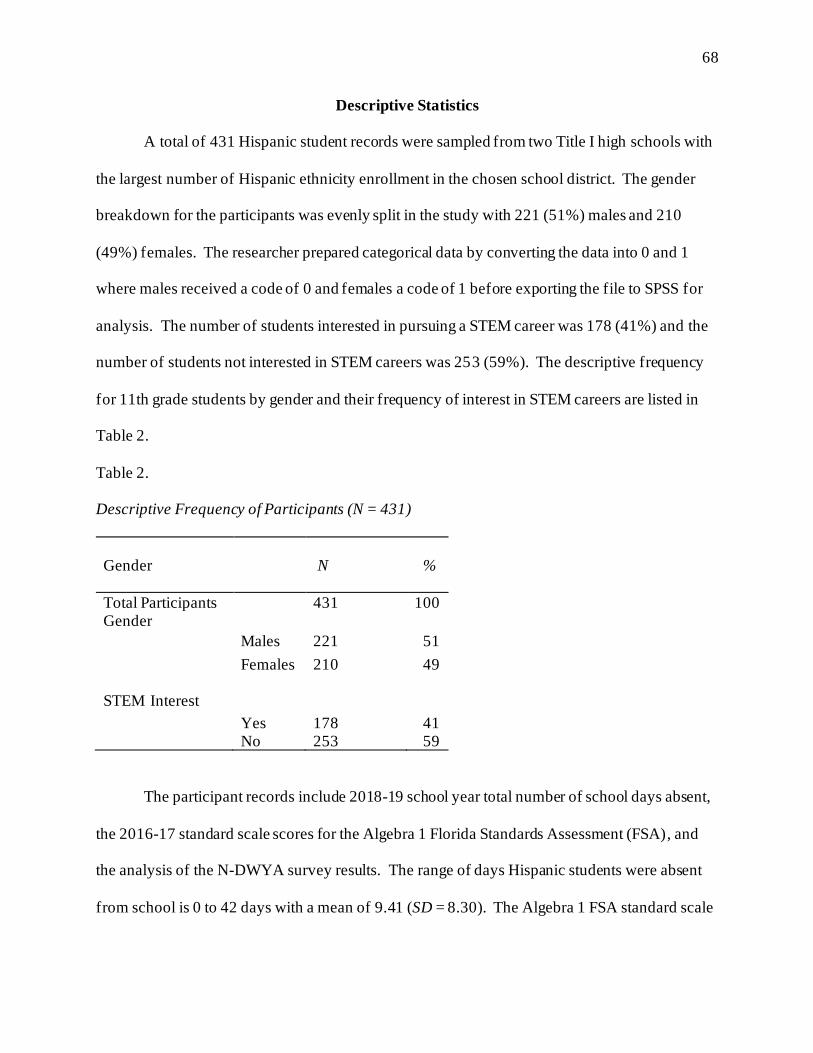
68
Descriptive Statistics
A total of 431 Hispanic student records were sampled from two Title I high schools with
the largest number of Hispanic ethnicity enrollment in the chosen school district. The gender
breakdown for the participants was evenly split in the study with 221 (51%) males and 210
(49%) females. The researcher prepared categorical data by converting the data into 0 and 1
where males received a code of 0 and females a code of 1 before exporting the file to SPSS for
analysis. The number of students interested in pursuing a STEM career was 178 (41%) and the
number of students not interested in STEM careers was 253 (59%). The descriptive frequency
for 11th grade students by gender and their frequency of interest in STEM careers are listed in
Table 2.
Table 2.
Descriptive Frequency of Participants (N = 431)
Gender N %
Total Participants 431 100 Gender
Males 221 51
Females
210 49
STEM Interest
Yes 178 41 No 253 59
The participant records include 2018-19 school year total number of school days absent,
the 2016-17 standard scale scores for the Algebra 1 Florida Standards Assessment (FSA), and
the analysis of the N-DWYA survey results. The range of days Hispanic students were absent
from school is 0 to 42 days with a mean of 9.41 (SD = 8.30). The Algebra 1 FSA standard scale
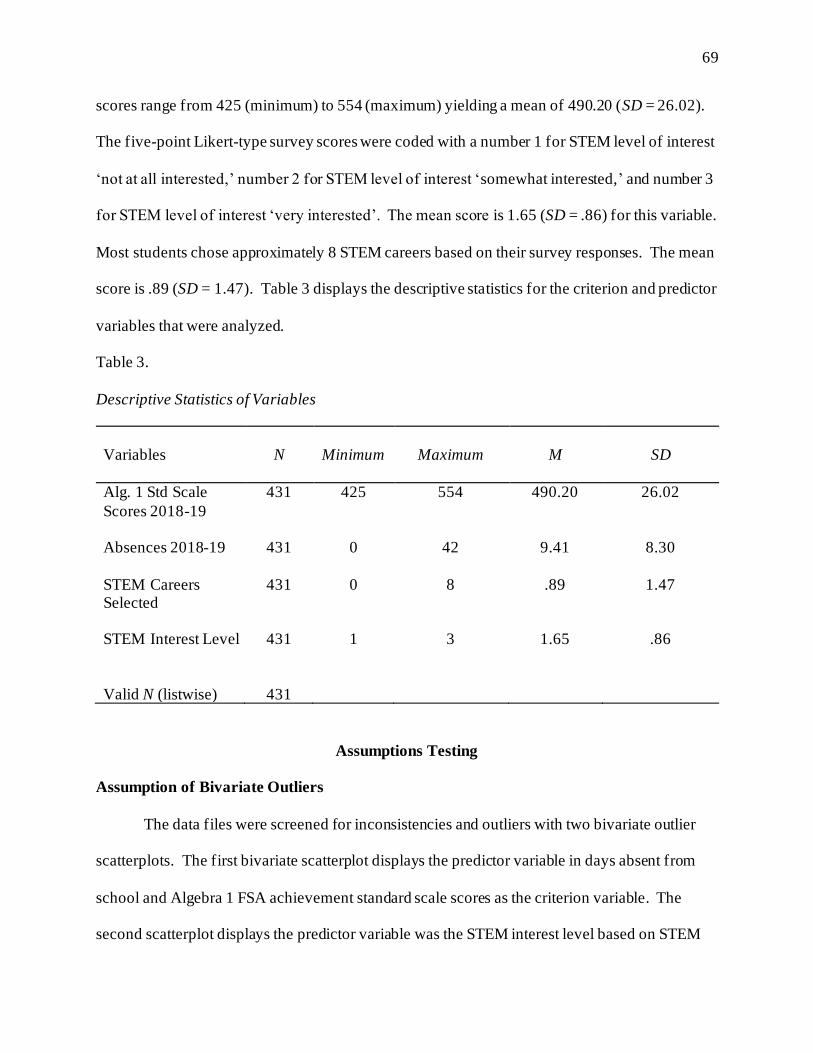
69
scores range from 425 (minimum) to 554 (maximum) yielding a mean of 490.20 (SD = 26.02).
The five-point Likert-type survey scores were coded with a number 1 for STEM level of interest
‘not at all interested,’ number 2 for STEM level of interest ‘somewhat interested,’ and number 3
for STEM level of interest ‘very interested’. The mean score is 1.65 (SD = .86) for this variable.
Most students chose approximately 8 STEM careers based on their survey responses. The mean
score is .89 (SD = 1.47). Table 3 displays the descriptive statistics for the criterion and predictor
variables that were analyzed.
Table 3.
Descriptive Statistics of Variables
Variables N Minimum Maximum M
SD
Alg. 1 Std Scale
Scores 2018-19
431 425 554 490.20 26.02
Absences 2018-19
431
0
42
9.41
8.30
STEM Careers Selected STEM Interest Level
Valid N (listwise)
431
431
431
0
1
8
3
.89
1.65
1.47
.86
Assumptions Testing
Assumption of Bivariate Outliers
The data files were screened for inconsistencies and outliers with two bivariate outlier
scatterplots. The first bivariate scatterplot displays the predictor variable in days absent from
school and Algebra 1 FSA achievement standard scale scores as the criterion variable. The
second scatterplot displays the predictor variable was the STEM interest level based on STEM
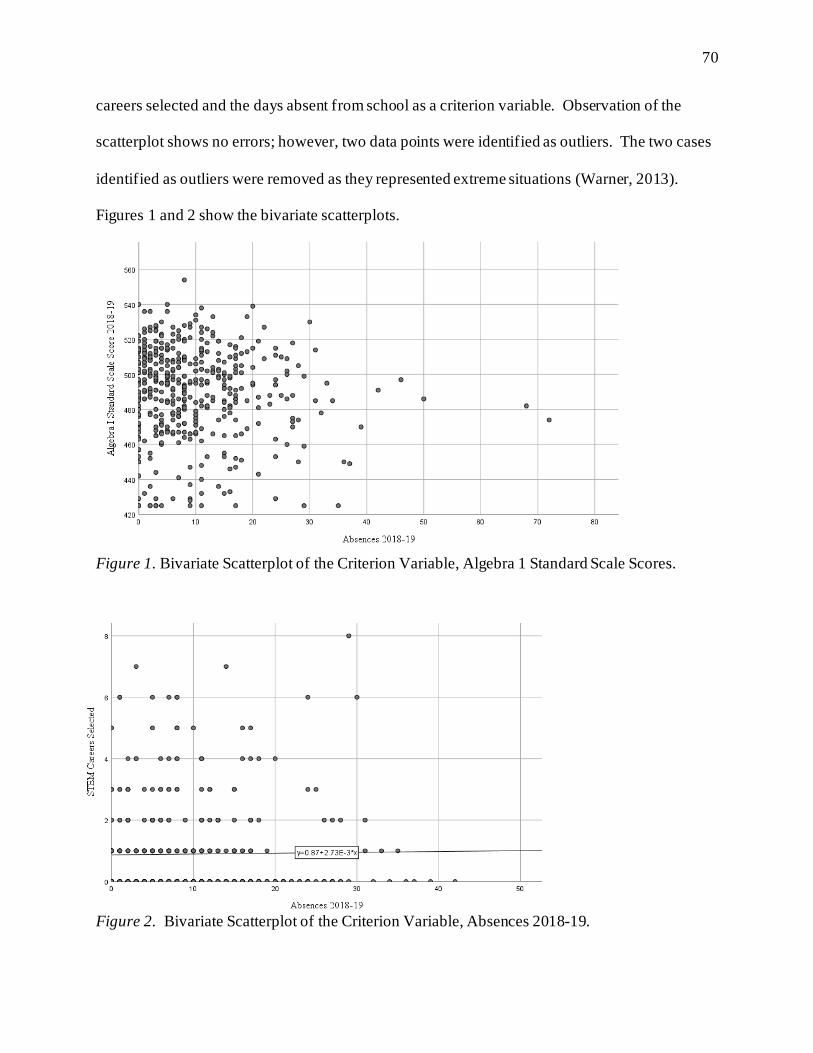
70
careers selected and the days absent from school as a criterion variable. Observation of the
scatterplot shows no errors; however, two data points were identified as outliers. The two cases
identified as outliers were removed as they represented extreme situations (Warner, 2013).
Figures 1 and 2 show the bivariate scatterplots.
Figure 1. Bivariate Scatterplot of the Criterion Variable, Algebra 1 Standard Scale Scores.
Figure 2. Bivariate Scatterplot of the Criterion Variable, Absences 2018-19.
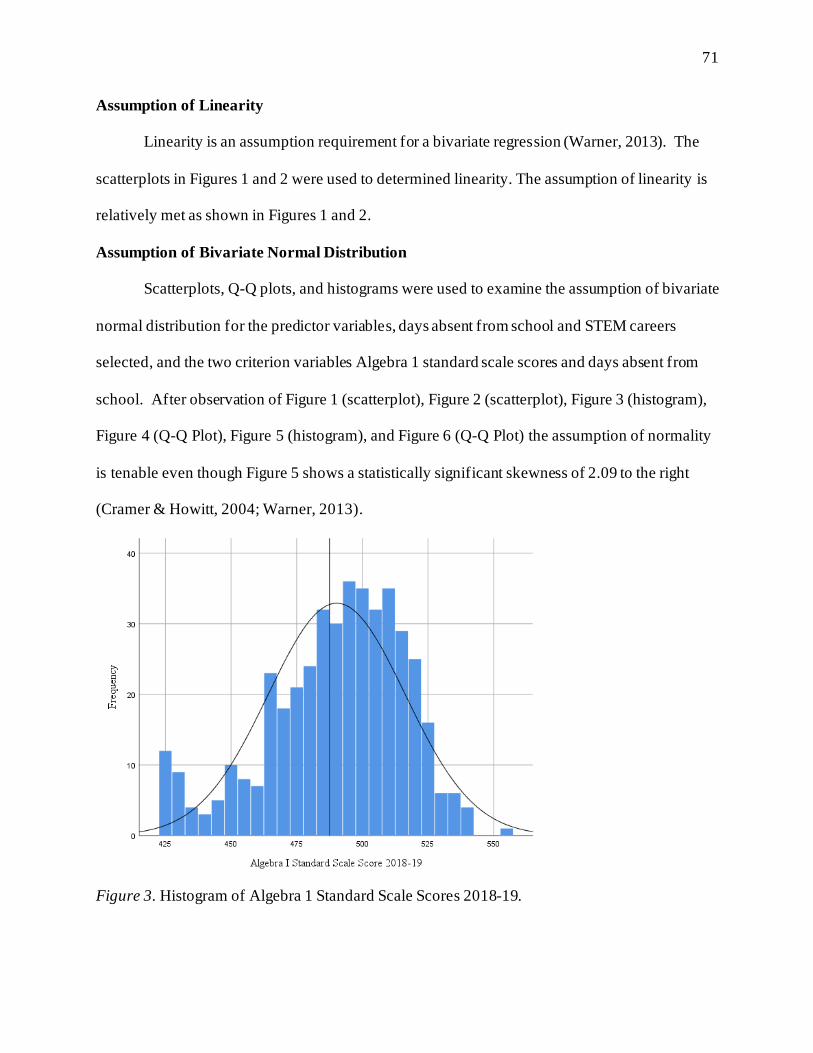
71
Assumption of Linearity
Linearity is an assumption requirement for a bivariate regression (Warner, 2013). The
scatterplots in Figures 1 and 2 were used to determined linearity. The assumption of linearity is
relatively met as shown in Figures 1 and 2.
Assumption of Bivariate Normal Distribution
Scatterplots, Q-Q plots, and histograms were used to examine the assumption of bivariate
normal distribution for the predictor variables, days absent from school and STEM careers
selected, and the two criterion variables Algebra 1 standard scale scores and days absent from
school. After observation of Figure 1 (scatterplot), Figure 2 (scatterplot), Figure 3 (histogram),
Figure 4 (Q-Q Plot), Figure 5 (histogram), and Figure 6 (Q-Q Plot) the assumption of normality
is tenable even though Figure 5 shows a statistically significant skewness of 2.09 to the right
(Cramer & Howitt, 2004; Warner, 2013).
Figure 3. Histogram of Algebra 1 Standard Scale Scores 2018-19.
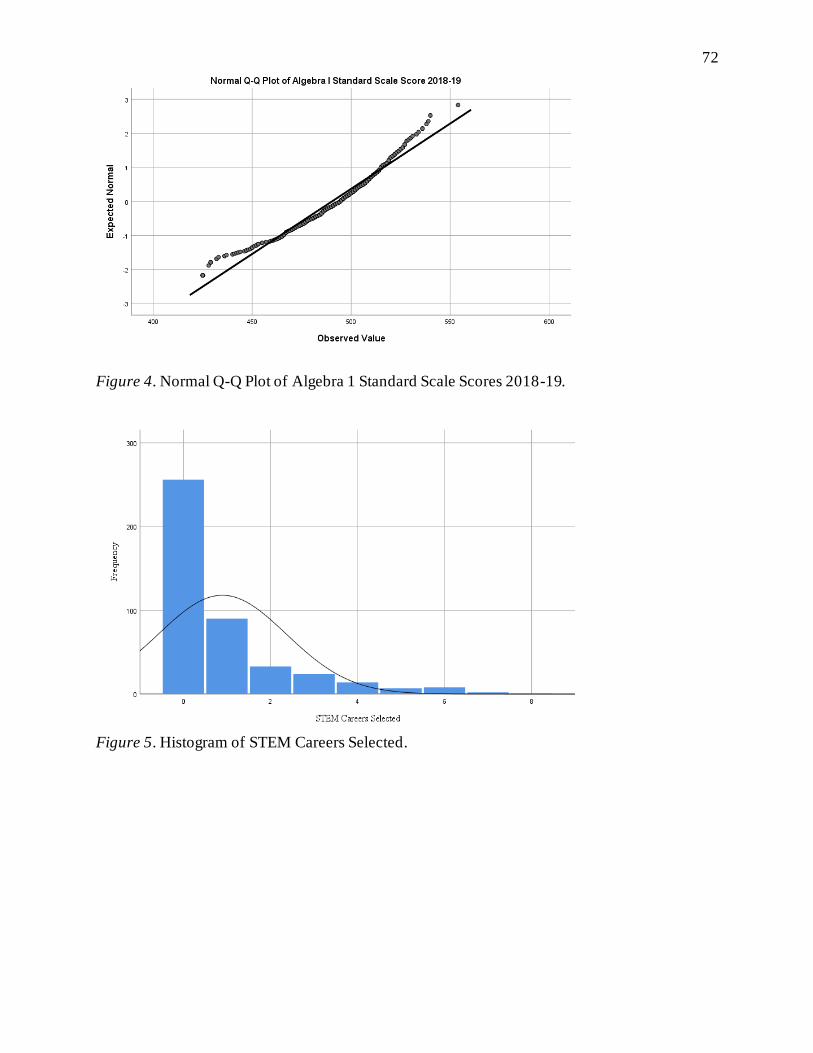
72
Figure 4. Normal Q-Q Plot of Algebra 1 Standard Scale Scores 2018-19.
Figure 5. Histogram of STEM Careers Selected.
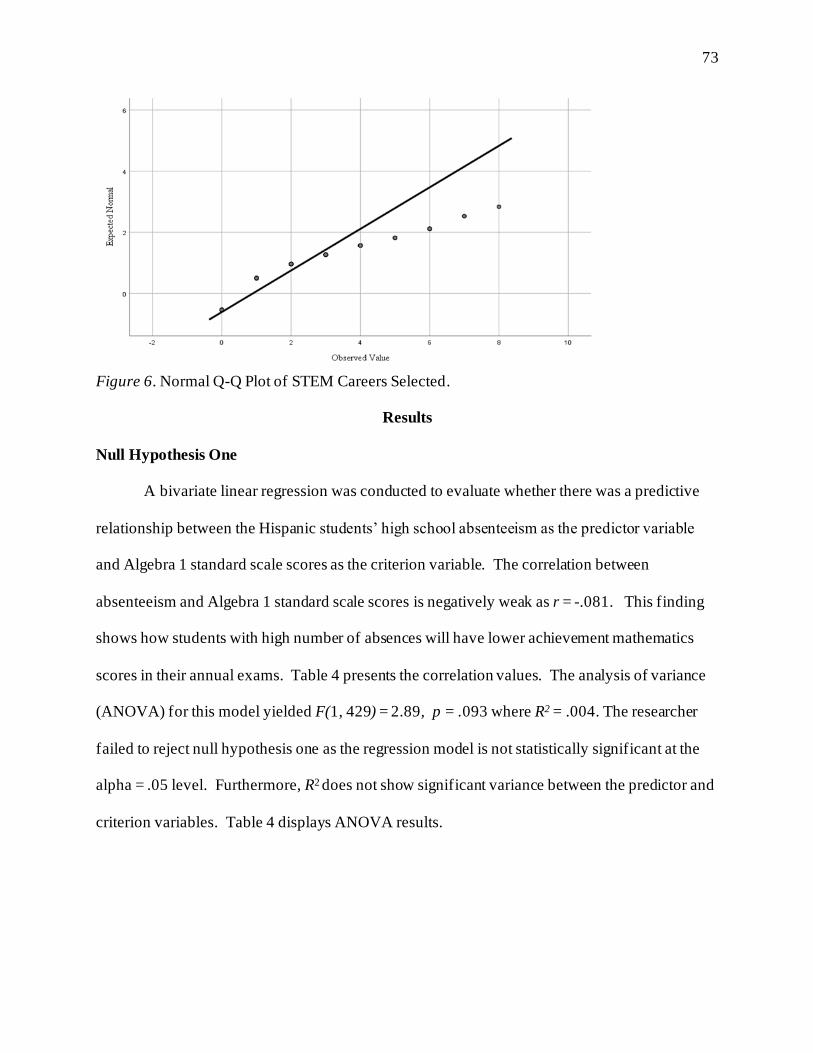
73
Figure 6. Normal Q-Q Plot of STEM Careers Selected.
Results
Null Hypothesis One
A bivariate linear regression was conducted to evaluate whether there was a predictive
relationship between the Hispanic students’ high school absenteeism as the predictor variable
and Algebra 1 standard scale scores as the criterion variable. The correlation between
absenteeism and Algebra 1 standard scale scores is negatively weak as r = -.081. This finding
shows how students with high number of absences will have lower achievement mathematics
scores in their annual exams. Table 4 presents the correlation values. The analysis of variance
(ANOVA) for this model yielded F(1, 429) = 2.89, p = .093 where R2 = .004. The researcher
failed to reject null hypothesis one as the regression model is not statistically significant at the
alpha = .05 level. Furthermore, R2 does not show significant variance between the predictor and
criterion variables. Table 4 displays ANOVA results.
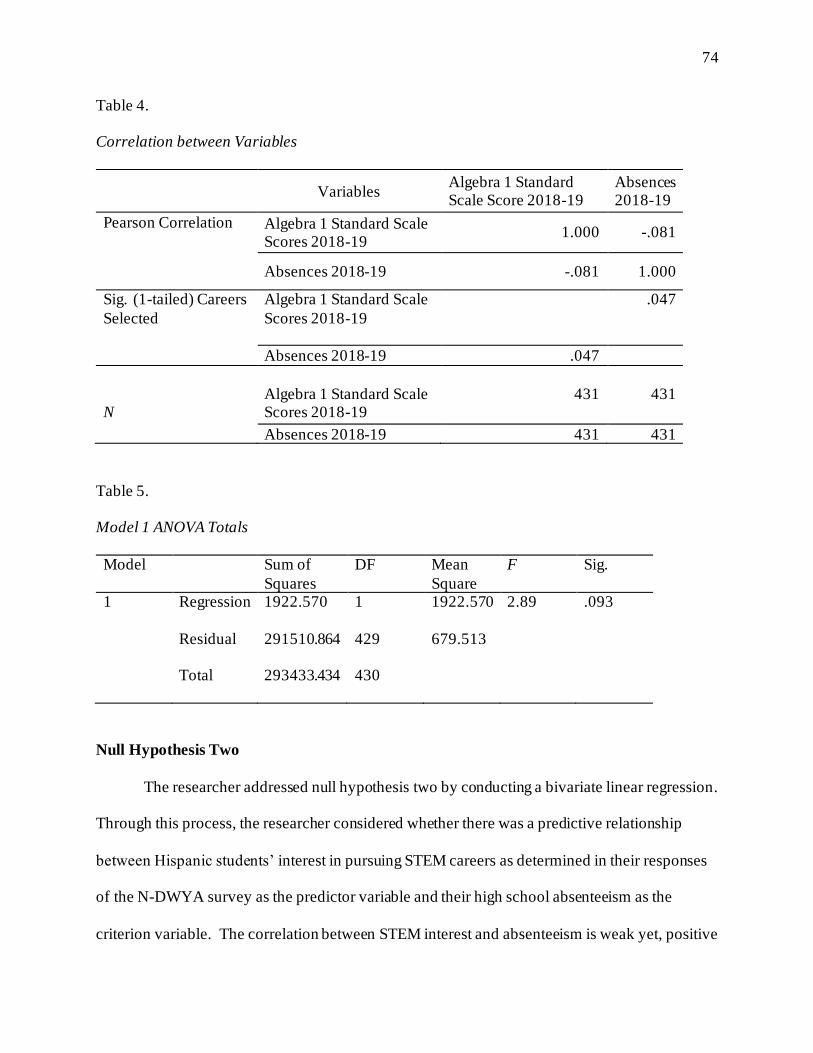
74
Table 4.
Correlation between Variables
Variables
Algebra 1 Standard Scale Score 2018-19
Absences 2018-19
Pearson Correlation Algebra 1 Standard Scale Scores 2018-19
1.000 -.081
Absences 2018-19 -.081 1.000
Sig. (1-tailed) Careers
Selected
Algebra 1 Standard Scale
Scores 2018-19
.047
Absences 2018-19 .047
N
Algebra 1 Standard Scale Scores 2018-19
431 431
Absences 2018-19 431 431
Table 5.
Model 1 ANOVA Totals
Model Sum of
Squares
DF Mean
Square
F Sig.
1 Regression 1922.570 1 1922.570 2.89 .093
Residual 291510.864 429 679.513
Total 293433.434 430
Null Hypothesis Two
The researcher addressed null hypothesis two by conducting a bivariate linear regression.
Through this process, the researcher considered whether there was a predictive relationship
between Hispanic students’ interest in pursuing STEM careers as determined in their responses
of the N-DWYA survey as the predictor variable and their high school absenteeism as the
criterion variable. The correlation between STEM interest and absenteeism is weak yet, positive
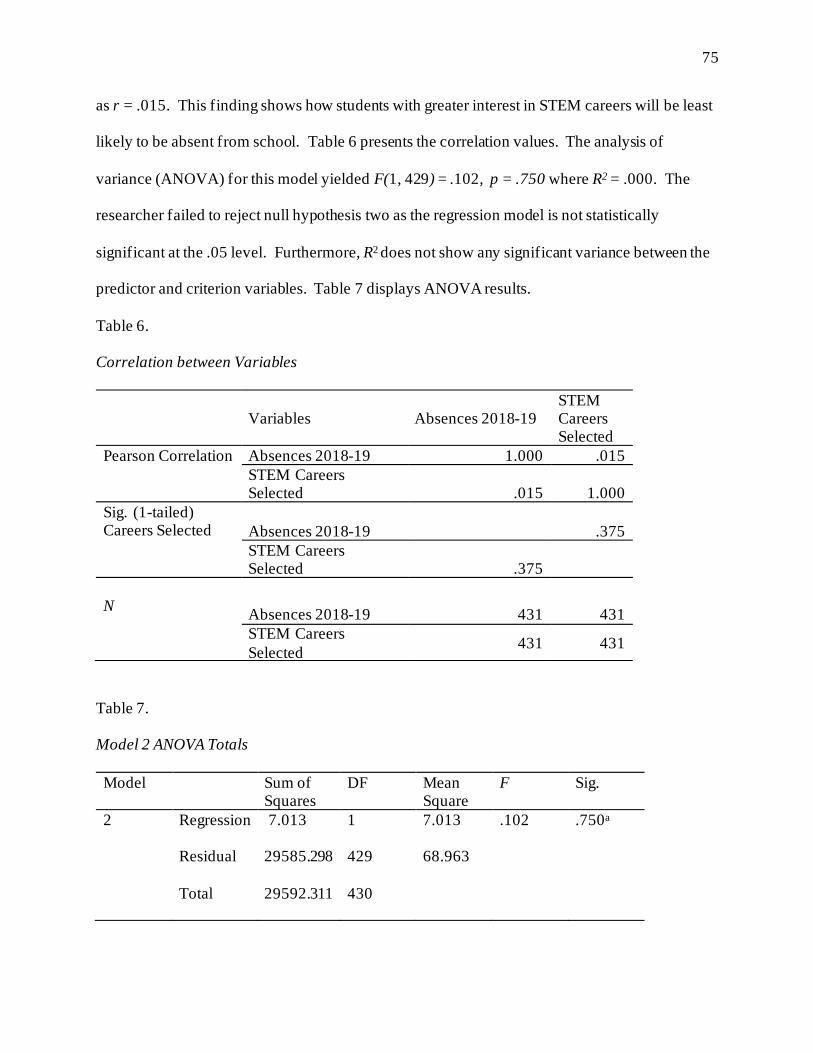
75
as r = .015. This finding shows how students with greater interest in STEM careers will be least
likely to be absent from school. Table 6 presents the correlation values. The analysis of
variance (ANOVA) for this model yielded F(1, 429) = .102, p = .750 where R2 = .000. The
researcher failed to reject null hypothesis two as the regression model is not statistically
significant at the .05 level. Furthermore, R2 does not show any significant variance between the
predictor and criterion variables. Table 7 displays ANOVA results.
Table 6.
Correlation between Variables
Variables Absences 2018-19
STEM Careers Selected
Pearson Correlation Absences 2018-19 1.000 .015
STEM Careers Selected .015 1.000
Sig. (1-tailed) Careers Selected Absences 2018-19
.375
STEM Careers Selected .375
N
Absences 2018-19 431 431
STEM Careers
Selected 431 431
Table 7.
Model 2 ANOVA Totals
Model Sum of Squares
DF Mean Square
F Sig.
2 Regression 7.013 1 7.013 .102 .750a
Residual 29585.298 429 68.963
Total 29592.311 430
76
Summary
Chapter four presents the statistical results for the current study including the descriptive
statistics to address two null hypotheses. The initial goal was to examine Hispanic students’
Algebra 1 standard scale scores as measured with the FSA. A secondary goal was to determine
Hispanic students’ interest in STEM careers through the completion of the N-DWYA survey.
Algebra 1 FSA represents the criterion variable and student absenteeism was the predictor
variable for the first bivariate regression analysis. Students’ absenteeism is the number of days
Hispanic students were absent from class. Student’s interest for STEM careers was the predictor
variable for the second bivariate regression analysis.
Two linear regressions analyses were employed to determine the predictability of the
Algebra 1 scores and Hispanic student’s school absenteeism. Based on the results from both
linear regression analyses, the researcher failed to reject both null hypotheses.
77
CHAPTER FIVE: CONCLUSIONS
Overview
Chapter Five addresses the results presented in chapter four and aligns those results with
the literature in light of the theoretical framework. The implications of the study, the limitations
of the study, and recommendation for further research is provided.
Discussion
The purpose for this study is to determine whether there is a predictive relationship of
Hispanic students’ high school absenteeism to mathematics achievement and their aspirations to
enter careers in the STEM field. This study deals with a real-time problem that is affecting a
large portion of the Hispanic community across the U.S. (Smerillo et al., 2018). School
absenteeism is prevalent among Hispanic students. This ethnic group is also underrepresented in
the STEM career industry where soon there will be a need to replace the retiring workforce
(Mau, 2018; National Science Board, 2016). The current study contributes to the existing body
of knowledge that addresses the correlation effects of chronic absenteeism among Hispanic
students. Furthermore, the study presents relevant literature for school districts with high
numbers of enrolled Hispanic students to consider the impact chronic absenteeism has on
mathematics achievement and these students’ interest in selecting STEM careers.
The first research question seeks to find out whether there is a predictive relationship
between Hispanic students’ high school absenteeism and mathematics achievement. The
literature establishes how Hispanic demographics top the list of students with the highest number
of school absences (Gottfried, 2010; 2019; Paschall, Gershoff, & Kuhfeld, 2018). Additionally,
Hispanic students’ mathematics academic performance is consistently at 20 percentage points
lower than White students over the last 20 years (Paschall, Gershoff, & Kuhfeld, 2018). School
78
absenteeism plays an important role in students’ low academic performance as appropriate
grade-level skills and self-confidence are not developing (Gottfried & Ehrlich, 2018). This study
is framed upon the Expectancy Value Theory (EVT) which suggests Hispanic students’ poor
mathematic skills are connected to their low expectation to succeed (Eccles, 2009). EVT further
supports how Hispanic students do not pursue mathematics studies and therefore, do not develop
the necessary self-confidence to experience a level of success in the mathematics subject area
content (Saw & Chang, 2018). Clarkson et al. (2017) finds that a student’s level of confidence
towards mathematics is statistically significant in predicting mathematics achievement.
Susperreguy et al. also find that self-confidence is a strong predictor of mathematics performance
(2018). In contrast, the results from the current study show a negative weak correlation of r = -
.081 between school absenteeism and Algebra 1 standard scale scores even with a sample size of
431 cases. This outcome concurs with prior finding on the effects of high school absenteeism
has on mathematics achievement (Gottfried, 2019). Regardless of attendance, EVT sustains that
students who build self-confidence do advance academically as they embrace the learning
environment. The intrinsic aspect of self-confidence or expectancy to succeed play an important
role as Hispanic students engage in mathematics instruction (Cleary & Kitsantas, 2017; Wang &
Eccles, 2013).
The second research question addressed in this study evaluates whether there is a
predictive relationship between Hispanic students’ interest to pursue careers in the STEM field
and their high school absenteeism. The literature review in this study shows Hispanic students
are not pursuing STEM careers and are considered an underrepresented group in the STEM field
(Fayer et al., 2017; Mau & Li, 2017). Descriptive data presented in Table 2 are consistent with
the literature as 41% of the students selected STEM careers. However, the findings from the
79
linear regression show a weak correlation (r = .015) between Hispanic students’ selection of
career opportunities in the STEM field and their school absenteeism . The ANOVA yields a
non-statistically significant (p = .750) result. Consequently, students’ interest in STEM career is
not a predictor of Hispanic students’ high school absenteeism. The researcher used the Theory
of Vocational Choice as an additional framework to address this research question (Holland,
1959). The theory uses students’ personality traits to help them discover areas that influence
career selection (Campbell & Holland, 1972). The applicability of this framework lies on the
alignment of a student’s intellectuality when choosing a career field (Holland, 1959). In
addition, students who enjoy interpretation of data are more inclined to select STEM careers
(Bakker & Macnab, 2004). Sheldon et al. support the claim that students possessing
investigative and thinking personality traits also show interest in pursuing careers or
opportunities in the STEM field (2019).
Implications
The purpose of this study is to examine whether a predictive relationship exists between
school absenteeism and mathematics achievement. Furthermore, the researcher aims to find
whether a predictive relationship exists between students’ STEM career interest and school
absenteeism. Hispanic students who are absent from school frequently miss valuable classroom
instruction. Students missing over 10% of instruction in a regular 180-day model, show a
decrease in academic performance (Gottfried, 2019). Students who do not build strong
foundational skills in mathematics impede their development of self-confidence or ability belief
(Muenks et al., 2017). The implication of students lacking ability belief in mathematics creates a
barrier for students to think of pursuing mathematically-oriented careers. The behavior of
80
absenteeism has created a problem for Hispanic demographics and the STEM industry (Mau,
2018; Segovia, 2019).
The researcher logically laid out the procriblem of how underrepresentation of Hispanics
in STEM careers could be associated with school absenteeism among Hispanic students and their
low mathematics achievement scores (Borman et al., 2017). The outcome data from the present
study does not support such association. However, the study brings to light the important role
Hispanic students have to potentially repla ce the retiring STEM workforce (National Science
Foundation, 2019). Consequently, school districts need to adequately undertake the problem of
school absenteeism and design targeted interventions to reduce absenteeism, close the
mathematics achievement gap, and increase interest in STEM careers among Hispanic students.
The present study does not show statistically significant results that school absenteeism is a
suitable predicting variable for Algebra 1 achievement scores. Also, the study does not show
statistically significant results that STEM career interest may be a suitable predicting variable for
school absenteeism. Therefore, in view of the non-statistically significant correlations, the
researcher failed to reject null hypotheses one and two.
Limitations
The limitations of this bivariate correlational study in terms of internal and external
validity includes the school district archived data package used in the analyses. The researcher
used archived data from a relatively large sample size. School absenteeism as the predictive
variable was collected from a database that gathers absenteeism information from approximately
100 teachers in each of the schools where the students attended. However, there could be a level
of inconsistency with such a large number of teachers who input attendance daily throughout the
school year. Other inconsistencies exist when attendance is taken by a substitute teacher, when
81
attendance is assumed, or whenever not taken at all. Algebra 1 standard scale scores
achievement are limited by the internal factors influencing the test taker. The school district data
package reflects how students who missed 23% of the instructional days were able to score
within the proficiency range in mathematics. In contrast, students with zero days absent actually
scored below proficiency range in mathematics and even scored in the bottom 25% of the entire
grade level, raising questions regarding the students’ mindset and testing setting. These
inconsistencies can challenge the validity of student effort, motivation, and treatment of such an
important assessment.
The last variable employed in the study was the N-DWYA survey questionnaire used to
ascertain the level of interest students have in STEM careers. Students have the choice to select
up to 8 careers that allow the researcher to determine whether associations exists through the
examination of the scatterplots. The career survey proved to have a certain level of
inconsistency when correlated to the number of days a student is absent from school. Students
with high absenteeism tend to exhibit poor academic achievement (Gottfried, 2019). Collection
of anecdotal data can be helpful in explaining why the data analysis in the current study
demonstrate how students within the chronic absenteeism range selected 2 or more STEM
careers. The survey intent is to help students clarify career options as they define who they are
as a person while the survey identifies their strengths and personality types. The outcome may
come as a surprise since students with high absenteeism may not see themselves interested in
careers that require above average academic achievement. Results from this study show 5% of
students with chronic absenteeism selected multiple STEM career choices. A point of interest
from the survey results show 22% of students scoring within mathematics proficiency range and
not selecting STEM careers in their choices. Although it can be a generalization, students who
82
demonstrate above average mathematics skills typically have an inclination toward the
‘Investigative’ personality that is associated to careers in the STEM field (Sheldon et al., 2019).
As the survey limits participants’ options for responses, utilizing qualitative approaches to
determine students’ intended career path could yield further insight.
Recommendations for Future Research
The data for this study comes from two high schools with the largest number of Hispanic
students enrolled in the chosen school district. The first recommendation is to replicate this
study using a sample population from a non-Title I school where a large number of Hispanic
students attend. Additional variables recommended include whether the students are English
Language Learners (ELL), the students’ socio-economic status (SES), the number of students
with disabilities (SWD) and the students’ family structure or composition. The second
recommendation is to use attendance data files from teachers whose accurate attendance record
contains less than 3% margin of error determined in the semiannual school district accountability
report. A third recommendation is to use the N-DWYA career survey supplemental instrument
for students to provide reflective information explaining their selections. The validity of the
survey accuracy is dependent on external factors such as the administration instruction, time
allotted, assurance of completion, and the administration environment. The survey shows that
41% of students who selected between 1 and 7 careers left the other options blank.
Continued research is recommended with the implementation of other factors that can
effectively predict why Hispanic students perform relatively poor in mathematics and have a low
interest in pursuing careers in the STEM field. The findings of the current study mirror those in
a junior high school study, which did not find a correlation between mathematics self-efficacy
and STEM interest (Blotnicky et al. 2018). Questions that need further investigation include:
83
what factors contribute to Hispanic students’ interest in STEM careers? Will STEM career
planning in elementary school increase post-secondary STEM career interest? How can post-
secondary counseling or the knowledge of the counselor serve as effective predictors in creating
an interest in Hispanic students to pursue a STEM career pathway? Despite the need for further
examination, the findings from the current study add to the body of literature and support the
need for school districts to develop effective interventions addressing the problem of school
absenteeism in the Hispanic community and the low interest in STEM careers.
84
REFERENCES
ACT (2016). The Condition of college & career readiness 2016-national, 1-20. Retrieved from
https://www.act.org/content/dam/act/unsecured/documents/CCCR_National_2016.pdfhttp
Andersson, U., Dasi, A., Mudambi, R., & Pedersen, T. (2018). Technology, innovation and
knowledge: The importance of ideas and international connectivity. Journal of School
Psychology, 66, 11-24. doi: 10.1016/j.jwb.2015.08.017
Arden, S.V., & Pentimonti, J.M. (2017). Data-based decision making in multi-tiered systems of
support: 19 principles, practices, tips, and tools. Perspectives on Language and Literacy,
43(4), 19-23. Retrieved from
https://cdn.coverstand.com/13959/445106/3989cf72b28363e158b637f2f4abfbda5cbc45b
3.pdf
Atkinson, J. W. (1957). Motivational determinants of risk-taking behavior. Psychological
Review, 64(6, Pt.1), 359-372. doi: 10.1037/h0043445
Bai, L., & Liao, H.-Y. (2019). The relation between interest congruence and college major
satisfaction: Evidence from the Basic Interest Measures. Journal of Career Assessment,
27(4), 1-17. doi: 10.1177/1069072718793966
Baker, B. D. (2014). Evaluating the recession’s impact on state school finance systems.
Education Policy Analysis Archives, 22(91), 1-33. Retrieved from
http://dx.doi.org/10.14507/epaa.v22n91.2014
Bakker, S., & Macnab, D. (2004). Career interest profiler. Edmonton, AB: Psychometrics
Canada Ltd.
85
Balfanz, R., & Byrnes, V. (2012). The importance of being in school: A report on absenteeism in
the nation’s public schools. The Education Digest, 78, 4-9. Retrieved from
http://www.eddigest.com
Bandura, A., Barbaranelli, C., Caprara, G., & Pastorelli, C. (1996). Multifaceted impact of self-
efficacy beliefs on academic functioning. Child Development, 67(3), 1206-1222.
doi:10.2307/1131888
Bécares, L., & Priest, N. (2015). Understanding the influence of race/ethnicity, gender, and class
on inequalities in academic and non-academic outcomes among eighth-grade students:
findings from an intersectionality approach. PloS one, 10(10), e0141363.
doi:10.1371/journal.pone.0141363
Betters-Bubon, J., Brunner, T., & Kansteiner, A. S. (2016). Success for all? The role of the school
counselor in creating and sustaining culturally responsive positive behavior interventions
and supports programs. The Professional Counselor, 6(3), 263–277. doi:
10.15241/jbb.6.3.263
Bicehouse, V., & Faieta, J. (2017). IDEA at age forty: Weathering common core standards and
data driven decision making. Contemporary Issues in Education Research , 10, 33-44.
Retrieved from https://files.eric.ed.gov/fulltext/EJ1126838.pdf
Blase, J. (2001, June 21). Defining “Hispanic” and “Latino.” Christian Science Monitor, p. 15.
Retrieved from https://www.csmonitor.com
Blotnicky, K.A., Franz-Odendaal, T., French, F., & Joy, P. (2018). A study of the correlation
between STEM career knowledge, mathematics self-efficacy, career interests, and career
activities on the likelihood of pursuing a STEM career among middle school students.
86
International Journal of STEM Education, 5(22), 1-15. Retrieved from
https://doi.org/10.1186/s40594-018-0118-3
Bohanon, H., Gilman, C., Parker, B., Amell, C., & Sortino, G. (2016). Using school
improvement and implementation science to integrate multi-tiered systems of support in
secondary schools. The Australasian Journal of Special Education, 40(2), 99-116. doi:
http://doi.org/10.1017/jse.2016.8
Borman, T., Margolin, J., Garland, M., Rapaport, A., Park, S. J., & LiCalsi, C. (2017).
Associations between predictive indicators and postsecondary science, technology,
engineering, and mathematics success among Hispanic students in Texas (REL 2018–
279). Washington, DC: U.S. Department of Education, Institute of Education Sciences,
National Center for Education Evaluation and Regional Assistance, Regional Educational
Laboratory Southwest. Retrieved from http://ies.ed.gov/ncee/edlabs.
Bottia, M. C., Valentino, C. L., Moller, S., Mickleson, R. A., & Stearns, E. (2016). Teacher
collaboration and Latinos/as’ mathematics achievement trajectories. American Journal of
Education, (122), 505-535. Retrieved from
https://www.journals.uchicago.edu/AJE/index.html
Cabus, S. J., & De Witte, K. (2015). The effectiveness of active school attendance interventions
to tackle dropout in secondary schools: A Dutch pilot case. Empirical Economics, 49, 65-
80. doi: 10.1007/s00181-014-0865-z
Callahan, C. N., LaDue, N. D., Baber, L. D., Sexton, J., van der Hoeven Kraft, K. J., & Zamani-
Gallaher, E. M. (2017). Theoretical perspectives on increasing recruitment and retention
of underrepresented students in the geosciences. Journal of Geoscience Education, 65(4),
563-576. doi: 10.5408/16-238.1
87
Callingham, R., Carmichael, C., & Watson, J. M. (2016). Explaining student achievement: The
influence of teachers’ pedagogical content knowledge in statistics. International Journal
of Science and Mathematics Education, 14(7), 1339-1357. Retrieved from https://doi-
org/10.1007/s10763-015-9653-2
Campbell, D. P., & Holland, J. L. (1972). A merger in vocational interest research: Applying
Holland’s theory to Strong’s data. Journal of Vocational Behavior, 2, 353-376. Retrieved
from: https://www.journals.elsevier.com/journal-of-vocational-behavior
Carpi, A., Ronan, D. M., Falconer, H. M., & Lent, N. H. (2017) Cultivating minority scientists:
self-efficacy and career ambitions for underrepresented students in STEM. Journal of
Research in Science Teaching, 54(2), 169 - 194. doi: 10.1002/tea.21341
Caspi, A., Gorsky, P., Nitzani‐Hendel, R., & Zacharia, Z. (2019). Ninth‐grade students’
perceptions of the factors that led them to major in high school science, technology,
engineering, and mathematics disciplines. Science Education, 103(5), 1176–1205.
doi: 10.1002/sce.21524
Chapman, G. V., Hendron, M., Loftis, R., & Kearney, C. A. (2014). Evaluation of a truancy
diversion program at nine at-risk middle schools. Psychology in the Schools, 51, 779-788.
doi:10.1002/pits.21775
Chen, C-C., Culhane, D. P., Metraux, S., Park, J. M., & Venable, J. C. (2016). The heterogeneity
of truancy among urban middle school students: A latent class growth analysis. Journal of
Child and Family Studies, 25(4), 1066-1075. doi: 10.1007/s10826-015-0295-3
Clarkson, L. M., Ntow, F. D., Chidthachack, S., & Crotty, E. A. (2017). Should I stay or should I
go? Persistence in postsecondary mathematics coursework. The Mathematics Educator,
26(2), 54-81. Retrieved from http://math.coe.uga.edu/tme/tmeonline.html
88
Clarkson, L. M. C., Love, Q. U., & Ntow, F. D. (2017). How confidence relates to mathematics
achievement: A new framework. Mathematics Education and Life at Times of Crisis, 1-
12
Cleary, T. J., & Kitsantas, A. (2017). Motivation and self-regulated learning influences on
middle school mathematics achievement. School Psychology Review, 46(1), 88-107.
Retrieved from http://ezproxy.liberty.edu/login?url=https://search-proquest-
com.ezproxy.liberty.edu/docview/1863559381?accountid=12085
Coelho, R., Fischer, S., McKnight, F., Matteson, S., & Schwartz, T. (2015, Spring). The effects of
early chronic absenteeism on third-grade academic achievement measures. Workshop in
Public Affairs conducted at the University of Wisconsin-Madison. Retrieved from
www.lafollette.wisc.edu/research-public-service/workshops-in-public-affairs
Crede, M., Roch, S. G., & Kieszczynka, U. M. (2010). Class attendance in college: A Meta-
analytic review of the relationship of class attendance with grades and student
characteristics. Review of Educational Research, 80(2), 272-295. doi:
10.3102/0034654310362998
Creswell, J. W. (2007). Qualitative inquiry and research design: Choosing among five
approaches. Thousand Oaks, CA: Sage.
Crisp, G., Nora, A., & Taggart, A. (2009). Student characteristics, pre-college, college, and
environmental factors as predictors of majoring in and earning a STEM degree: An
analysis of students attending a Hispanic serving institution. American Educational
Research Journal, 46(4), 924 – 942. doi: 10.3102/0002831209349460
Data U.S.A. (2018, August 24). Retrieved from https://datausa.io/profile/geo/osceola-county-
fl/#demographics
89
Dee, T., & Jacob, B. (2011). The Impact of No Child Left Behind on student achievement.
Journal of Policy Analysis and Management, 30(3), 418-446. Retrieved from
http://www.jstor.org/stable/23018959
Denner, J., Valdes, O., Dickson, D. J., & Laursen, B. (2019). Math interest and self-concept
among Latino/a students: Reciprocal influences across the transition to middle school.
Journal of Adolescence, 75, 22-36. Retrieved from
http://doi.org/10.1016/j.adolescence.2019.06.015
Dossey, J. A., McCrone, S. S., & Halvorsen, K. T. (2016). Mathematics education in the United
States 2016. A capsule summary fact book: Written for the thirteenth international
congress on mathematical education (ICME-13). Reston, VA: National Council of
Teachers of Mathematics.
Douglas, D., & Attewell, P. (2017) School mathematics as gatekeeper. The Sociological
Quarterly, 58(4), 648-669. doi: 10.1080/00380253.2017.1354733
DuFour, R. (2017). In praise of American educators. And how they can become even better .
Bloomington, IN: Solution Tree Press.
Eccles, J. S. (2009). Who am I and what am I going to do with my life? Personal and collective
identities as motivators of action. Educational Psychologist, 44(2), 78–89. doi:
10.1080/00461520902832368
Eccles, J. S., Adler, T. F., Futterman, R., Goff, S. B., Kaczala, C. M., Meece, J. L., & Midgley, C.
(1983). Expectancies, values, and academic behaviors. In J. T. Spence (Ed.), Achievement
and achievement motives: Psychological and sociological approaches (pp. 75–146). San
Francisco, CA: W. H. Freeman.
90
Eccles, J. S., Vida, M. N., & Barber, B. (2004). The relation of early adolescents’ college plans
and both academic ability and task-value beliefs to subsequent college enrollment. The
Journal of Early Adolescence, 24(1), 63–77. doi: org/10.1177/0272431603260919
Eccles, J. S., & Wigfield, A. (2002). Motivational beliefs, values, and goals. Annual Review of
Psychology, 53, 109–132. Retrieved from https://www.annualreviews.org/journal/psych
Education Commission of the States, Age Requirements for Free and Compulsory Education,
retrieved January 8, 2018 from https://www.ecs.org/age-requirements-for-free-and-
compulsory-education/
Education Commission of the States, 50-State Comparison: High School Graduation
Requirements, retrieved March 4, 2019 from
https://c0arw235.caspio.com/dp/b7f93000cbf881ebb9e14a828a17
Edwin, M., Prescod, D. J., & Bryan, J. (2019). Profiles of high school students' STEM career
aspirations. The Career Development Quarterly, 67(3), 255-263. doi: 10.1002/cdq.12194
Espinoza-Herold, M., & González-Carriedo, R. (2017). Issues in Latino education race, school
culture, and the politics of academic success. New York, NY: Routledge.
Falco, L. D. (2017). The school counselor and stem career development. Journal of Career
Development, 44(4), 359–374. doi: 10.1177/0894845316656445
Fayer, S., Lacey, A., & Watson, A. (2017). STEM occupations: Past, present, and future.
Retrieved from https://www.bls.gov
Feldt, L.S., & Qualls, A.L. (1996). Bias in coefficient alpha arising from heterogeneity of test
content. Applied Measurement in Education, 9(3), 277-286. Retrieved from
http://www.tanfonline.com
91
Fiske, E. B. (1982). Education; Sputnik recalled: Science and mathematics in trouble again. The
New York Times. Retrieved from
https://www.nytimes.com/1982/10/05/science/education-sputnik-recalled-science-and-
mathematics-in-trouble-again.html
Florida Department of Education. (2017, Oct 4). Graduation requirements for Florida’s
Statewide Assessments. Retrieved from
http://www.fldoe.org/core/fileparse.php/7764/urlt/GradRequireFSA.pdf
Florida Department of Education. (2018, July 4). Florida Standards Assessment 2016-2017.
Annual Technical Report, 4, 1-92. Retrieved from
https://fsassessments.org/assets/documents/V4_FSA_Technical_Report_Year_2016-
2017_FINAL_508.pdf
Florida Department of Education. (2019, Mar 31). Federal percent of points index by subgroup.
Retrieved from
http://www.fldoe.org/core/fileparse.php/14196/.../FederalIndexSubgroup18.xlsx
Florida Department of Education. (2019, Mar 3). PK-12 Public school data publications &
reports. Retrieved from http://www.fldoe.org/accountability/data-sys/edu-info-
accountability-services/pk-12-public-school-data-pubs-reports/
FOCUS School Software. (2018, July 4). School software solutions.
http://www.focusschoolsoftware.com/
Foster, C. (2016). Confidence and competence with mathematical procedures. Educational
Studies in Mathematics, 91(2), 271- 288. http://doi.org/10.1007/s10649-015-9660-9
Freeman, J., Simonsen, B., McCoach, B. D., Sugai, G., Lombardi, A., & Horner, R. (2015). An
analysis of the relationship between implementation of school-wide positive behavior
92
interventions and supports and high school dropout rates. The High School Journal, 18,
1-27. doi: 10.10007/s11121-017
Gall, M., Gall, J., & Borg, W. (2007). Educational research (8th ed.). Boston, MA:
Pearson/Allyn & Bacon.
Giambo, D.A. (2017). “I will study more . . . And pray”: metacognition about high -stakes test
preparation among culturally & linguistically diverse students. Multicultural Education,
24(3), 26-34. Retrieved from
https://eric.ed.gov/?q=fcat+replaces+by+the+fsa&pr=on&ft=on&id=EJ1162648
Gillette, L., de Brey, C., McFarland, J., Hussar, W., Sonnenberg, W., & Wilkinson-Flicker, S.
(2017). Status and Trends in the Education of Racial and Ethnic Groups 2017 . [NCES
2017-051]. U.S. Department of Education, National Center for Education Statistics.
Washington D.C. Retrieved from http://nces.ed.gov/pubsearch.
Glennie, E., Mason, M., & Dalton, B. (2016). The role of stem high schools in reducing gaps in
science and mathematics course taking: Evidence from North Carolina. RTI Press
Publication No. RR-0025-1603. Research Triangle Park, NC: RTI Press.
Gottfried, M. A. (2010). Evaluating the relationship between student attendance and achievement
in urban elementary and middle schools: An instrumental variable approach. American
Educational Research Journal, 47(2), 443-465. Doi: 103102/000283120935049
Gottfried, M. A. (2014). Chronic absenteeism and its effects on students’ academic and
socioemotional outcomes, Journal of Education for Students Placed at Risk (JESPAR),
19(2), 53-75. doi: 10.1080/10824669.2014.962696
93
Gottfried, M. A., & Ehrlich S. B. (2018). Introduction to the special issue: Combating chronic
absence. Journal of Education for Students Placed at Risk, 23(1-2), 1-4. doi:
10.1080/10824669.2018.1439753
Gottfried, M. A., & Kirksey, J. J. (2017). “When” students miss school: The role of timing of
absenteeism on students’ test performance. Educational Researcher, 46(3),119-130.
Retrieved from https://doi-org/10.33102/0013189x17703945
Gottfried, M. A. (2019). Chronic absenteeism in the classroom context: Effects on achievement.
Urban Education, 54(1), 3–34. https://doi.org/10.1177/0042085915618709.
Green, E. (2014). Why do Americans stink at mathematics? The New York Times Magazine, 1-
21. Retrieved from https://www.nytimes.com/2014/07/27/magazine/why-do-americans-
stink-at-mathematics.html
Green, J., Liem, G. A. D., Martin, A. J., Colmar, S., Marsh, H. W., & McInerney, D. (2012).
Academic motivation, self-concept, engagement, and performance in high school: Key
processes from a longitudinal perspective. Journal of Adolescence, 35, 1112-1122.
Retrieved from https://doi-org/10.1616/j.adolecence
Hattie, J. (2009). Visible learning. A synthesis of over 800 meta-analyses relating to achievement.
Oxon, OX: Routledge.
Hill, H. C., Rowan, B., & Loewenberg Ball, D. (2005). Effects of teachers' mathematical
knowledge for teaching on student achievement. American Educational Research
Journal, 42(2), 371- 406. Retrieved from http://www.jstor.org/stable/3699380
Hinojosa, T., Rapaport, A., Jaciw, A., LiCalsi, C., & Zacamy, J. (2016). Exploring the
foundations of the future STEM workforce: K–12 indicators of postsecondary STEM
success (REL 2016–122). Washington, DC: U.S. Department of Education, Institute of
94
Education Sciences, National Center for Education Evaluation and Regional Assistance,
Regional Educational Laboratory Southwest. Retrieved from
http://ies.ed.gov/ncee/edlabs.
Hogan, R., & Blake, R. (1999). John Holland’s vocational typology and personality theory.
Journal of Vocational Behavior, 55, 41–56. Retrieved from http://www.idealibrary.com
Holland J. L. (1959). A theory of vocational choice. Journal of Counseling Psychology, 6, 35-45.
doi: 10.1037/h0040767
Hoover, M., Mosvold, R., Ball, D. L., & Lai, Y. (2016). Making progress on mathematical
knowledge for teaching. The Mathematics Enthusiast, 13, 3-34. Retrieved from
https://scholarworks.umt.edu/tme/vol13/iss1/3
Horn, I. S., Garner, B., Kane, B. D., & Brasel, J. (2017). A taxonomy of instructional learning
opportunities in teachers’ workgroup conversations. Journal of Teacher Education, 68,
41-54. doi: 10.1177/0022487116676315
Individuals with Disability Act of 2004, U.S.C. 1400, 600.
Jacobs, J. E., Lanza, S., Osgood, D. W., Eccles, J. S., & Wigfield, A. (2002). Changes in
children’s self-competence and values: Gender and domain differences across grades one
through twelve. Child Development, 73(2), 509. Retrieved from
http://ezproxy.liberty.edu/login?url=http://search.ebscohost.com/login.aspx?direct=true&
db=a9h&AN=6327019&site=ehost-live&scope=site
Jackson, L. M., & Rudin, T. (2019). Minority-serving institutions: America's overlooked STEM
asset. Issues in Science and Technology, 35(2), 53-55. Retrieved from
http://ezproxy.liberty.edu/login?url=https://search-proquest-
com.ezproxy.liberty.edu/docview/2177597672?accountid=12085
95
Johnson, C., & Kritsonis, W. L. (2006). A national dilemma: African American students
underrepresented in advanced mathematics courses. National Journal for Publishing and
Mentoring Doctoral Student Research, 3, 1-8. Retrieved from
http://www.nationalforum.com
Kaiser, S., & Schulze, G. C. (2015). Between inclusion and participation: Young careers who are
absent. Journal of Cognitive Education and Psychology, 14, 314-328. doi: 10.1891/1945-
8959
Kanadli, S. (2019). A meta-summary of qualitative findings about STEM education.
International Journal of Instruction, 12(1), 959-976. Retrieved from www.e-iji.
Kearney, C. A., & Graczyk, P. (2014). A Response to Intervention model to promote school
attendance and decrease school absenteeism. Child Youth Care Forum, 43, 1-25. doi:
10.1007/s10566-013-9222-1
Khaliqi, D. (2016). How common is the Common Core? A global analysis of mathematics
teaching and learning. School Science and Mathematics, 116(4), 199-211. doi:
10.1111/ssm.12170
Khatri, R., Henderson, C., Cole, R., Froyd, J. E., Friedrichsen, D., & Stanford, C. (2017).
Characteristics of well-propagated teaching innovations in undergraduate STEM.
International Journal of STEM Education, 4, 1-10. doi:10.1186/s40594-017-0056-5
Killion, J. (2015). High-quality collaboration benefits teachers and students. Journal of Staff
Development, 36(5), 62-64. Retrieved from http://www.learningforward.org
Kimongo Kemboi, R. J., Kindiki, N., & Misigo, B. (2016). Relationship between personality
types and career choices of undergraduate students: A case of Moi University, Kenya.
Journal of Education and Practice, 7(3), 102-112. Retrieved from www.iiste.org
96
Kızıltoprak, A., & Yavuzsoy Köse, N. (2017). Relational thinking: The bridge between
arithmetic and algebra. International Electronic Journal of Elementary Education, 10(1),
131-145. Retrieved from https://www.iejee.com/index.php/IEJEE/article/view/305
Koopmans, M. (2017). Nonlinear Processes in Time-Ordered Observations: Self-Organized
Criticality in Daily High School Attendance. Complicity: An International Journal of
Complexity and Education, 14(2), 78-87. Retrieved from
https://ejournals.library.ualberta.ca/index.php/complicity
Koppelman, K. L. (2017). Understanding human differences: Multicultural education for a
diverse America (5th ed.). Boston, MA: Pearson.
Kotok, S. (2017). Unfulfilled potential: High-achieving minority students and the high school
achievement gap in mathematics. The High School Journal, 183-202. Retrieved from
https://soe.unc.edu/hsj/issues.php
Kubat, U. (2018). The integration of STEM into science classes. World Journal on Educational
Technology, 10(3), 165-173. doi: 10.18844/wjet.v10i3.3557
Lancaster, P., & Hougen, M. (2017). Preparing educators to work in an MTSS model: Making a
case for partnerships. Perspectives on Language and Literacy, 43(4), 41-44,46. Retrieved
from https://cdn.coverstand.com/13959/445106/3989cf72b28363e158b637f2f4a
bfbda5cbc45b3.pd
Lauen, D. L., & Gaddis, S. M. (2016). Accountability pressure, academic standards, and
educational triage. Educational Evaluation and Policy Analysis, 38(1), 127-147. doi:
10.3102/0162373715598577
97
Lauermann, F., Tsai, Y.-M., & Eccles, J. S. (2017). Mathematics-related career aspirations and
choices within Eccles et al.’s expectancy-value theory of achievement-related behaviors.
Developmental Psychology, 53(8), 1540–1559. doi:10.1037/dev0000367
Laughbaum, E. (2017). Why is Algebra a gatekeeper? Working Paper, 1-14. doi:
10.13140/RG.2.2.30770.61129
Loera, G., Rueda, R., & Oh, Y. J. (2018). Learning and motivational characteristics of urban
Latino high school youth. Urban Education, 53(7), 875–898.
https://doi.org/10.1177/0042085915602536
London, R. A., Sanchez, M., & Castrechini, S. (2016). The dynamics of chronic absence and
student achievement. Education Policy Analysis Archives, 24(112). Retrieved from
http://dx.doi.org/10.14507/epaa.24.2741
Mallett, C. A. (2016). Truancy: It’s not about skipping school. Child and Adolescent Social
Worker Journal, 33, 337-347. doi: 10.1017/s10560-015-0433-1
Mau, W. J., & Li, J. (2018). Factors influencing STEM career aspirations of underrepresented
high school students. The Career Development Quarterly, 66(3), 246-258.
doi:10.1002/cdq.12146
Maynard, B. R, Vaughn, M. G., Nelson, E. J., Salas-Wright, C. P., Heyne, D. A., & Kremer, K. P.
(2017). Truancy in the United States: Examining temporal trends and correlates by race,
age, and gender. Children and Youth Services Review, 81, 188-196. Retrieved from http://
www.elsevier.com/locate/childyouth
Morgan, S. L. (2006). Expectations and aspirations. In G. Ritzer (Ed.), The Blackwell
encyclopedia of sociology (pp. 1528–1531). doi:10.1111/b.9781405124331.2007.x
98
Miller, F. G., Cook, C. R., & Zhang, Y. (2018). Initial development and evaluation of the Student
Intervention Matching (SIM) form. Journal of School Psychology, 66, 11-24. doi:
D10.1016/j.jsp.2017.10.005.
Musu-Gillette, L., de Brey, C., McFarland, J., Hussar, W., Sonnenberg, W., & Wilkinson-Flicker,
S. (2017). Status and Trends in the Education of Racial and Ethnic Groups 2017. (NCES
2017-051). U.S. Department of Education, National Center for Education Statistics.
Washington, DC. Retrieved from http://nces.ed.gov/pubsearch.
Muhammad, A. (2018). Transforming school culture. How to overcome staff division.
Bloomington, IN: Solution Tree Press.
National Commission on Excellence in Education. (1983). A Nation at Risk: The imperative for
educational reform: A report to the Nation and the Secretary of Education , United States
Department of Education. Washington, DC: Author
National Science Board. (2016). Science and engineering indicators 2016. Arlington, VA:
National Science Foundation.
National Science Foundation, National Center for Science and Engineering Statistics. (2019).
Women, minorities, and persons with disabilities in science and engineering (NSF 19-
304). Retrieved from https://www.nsf.gov/statistics/wmpd
No Child Left Behind (NCLB) Act of 2001, Pub. L. No. 107-110, 20 U.S.C. § 3619 (2002).
Neukrug, E., Sparkman, N., & Moe, J. (2017), The Holland Code of members of the national
organization for human services: A preliminary study of human services professionals.
Journal of Employment Counseling, 54, 146-155. doi:10.1002/joec.12063
Nordvik, H. (1996). Relationships between Holland's vocational typology, Schein's career
anchors and Myers-Briggs' types. Journal of Occupational and Organizational
99
Psychology, 69, 263-275. Retrieved from
http://ezproxy.liberty.edu/login?qurl=https%3A%2F
Osburn, H.G. (2000). Coefficient Alpha and related internal consistency reliability coefficients.
Psychological Methods, 5(3), 343-335. doi: IO.I037//I082-989X.5.3.343
Owings, W., Kaplan, L. S., Myran, S., & Doyle, P. (2017). How variations in state policies and
practices impact student outcomes: What principals and professors need to know.
National Association of Secondary School Principals Bulletin, 101(4), 299-314. doi:
10.1177/0192636517745582
Ozkan, E. (2017). Differential peer effects, student achievement, and student absenteeism:
Evidence from a large-scale randomized experiment. Demography, 54, 745-773. doi:
10.1007/s13524-017-0552-8
Park, J. (2009). A Nation at Risk. Education Week. Retrieved from
https://www.edweek.org/ew/issues/a-nation-at-risk/index.html
Park, T., Woods, C. S., Hu, S., Bertrand Jones, T., & Tandberg, D. (2018). What happens to
underprepared first time-in-college students when developmental education is optional?
The case of developmental math and intermediate algebra in the first semester. The
Journal of Higher Education, 89(3), 318-340. DOI: 10.1080/00221546.2017.1390970
Paris, K. (1994). A leadership model for planning and implementing change for school to-work
transition (pp. 22-25). Madison, WI: University of Wisconsin-Madison
Paschall, K. W., Gershoff, E. T., & Kuhfeld, M. (2018). A two-decade examination of historical
race/ethnicity disparities in academic achievement by poverty status. Journal of Youth &
Adolescence, 47(6), 1164. doi:10.1007/s10964-017-0800-7
100
Peterson, P. E., & Ackerman, M. (2015). States raise proficiency standards in mathematics and
reading. Commitments to Common Core may be driving the proficiency bar upward.
Education Next, 15(3), 16-21. Retrieved from http://www.educationnext.org
Porter, S. R., & Snipp, C. M. (2018). Measuring Hispanic origin: Reflections on Hispanic race
reporting. Annals of the American Academy of Political and Social Science, 677, 140–
152. doi: 10.1177/0002716218767384
Quin, D. (2017). Longitudinal and contextual associations between teacher–student relationships
and student engagement. A systematic review. Review of Educational Research, 87(2),
345-387. doi: 10.3102/0034654316669434
Rafa, A. (2017). Chronic absenteeism: A key indicator of student success. Education
Commission of the States, 1-7. Retrieved from www.ecs.org
Randall, K., Isaacson, M., & Ciro, C. (2017). Validity and Reliability of the Myers-Briggs
Personality Type Indicator: A Systematic Review and Meta-analysis. Journal of Best
Practices in Health Professions Diversity, 10(1), 1-27. doi:10.2307/26554264
Reyes, L. H. (1984). Affective variables and mathematics education. The Elementary School
Journal, 84(5), 558-581. Retrieved from http://dx.doi.org/10.1086/461384
Riegle-Crumb, C., Moore, C., & Ramos-Wada, A. (2010). Who wants to have a career in science
or mathematics? Exploring adolescents' future aspirations by gender and
race/ethnicity. Science Education, 95(3), 458-476. doi: 10.1002/sce.20431
Rincon, R. (2017, December 18) Re: Is there a shortage of STEM jobs to STEM graduates? It’s
complicated. Retrieved from https://alltogether.swe.org/2017/12/is-there-a-shortage-of-
stem-jobs-to-stem-graduates-its-complicated/
101
Rodriguez, A. (2018). Inequity by design? Aligning high school math offerings and public
flagship college entrance requirements. The Journal of Higher Education, 89(2), 153-
183. doi: 10.1080/00221546.2017.1341757
Rogers, T., Duncan, T., Wolford, T., Ternovski, J., Subramanyam, S., & Reitano, A. (2017). A
randomized experiment using absenteeism information to “nudge” attendance (REL
2017– 252). Washington, DC: U.S. Department of Education, Institute of Education
Sciences, National Center for Education Evaluation and Regional Assistance, Regional
Educational Laboratory Mid-Atlantic. Retrieved from http://ies.ed.gov/ncee/edlabs.
Romero, M. L., & Lee, Y-S. (2017). A national portrait of chronic absenteeism in the Early
Grades. The National Center for Children in Poverty, 1-8. Retrieved from
https://www.attendanceworks.org/wp-content/uploads/2017/09/A-National-Portrait-of-
Chronic-Absenteeism-in-the-Early-Grades-Oct-2007.pdf
Ronfeldt, M., Owens-Farmer, S., & McQueen, K. (2015). Teacher collaboration in instructional
teams and student achievement. American Educational Research Journal, 52(3), 475–
514. https://doi.org/10.3102/0002831215585562
Rudolph, U., & Reisenzein, R. (2008). 50 years of attribution research. Social Psychology, 39(3),
123-124. doi:10.1027/1864-9335.39.3.123
Safavian, N., & Conley, A. (2016). Expectancy-value beliefs of early-adolescent Hispanic and
non-Hispanic youth: Predictors of mathematics achievement and enrollment. AERA Open
2(4),1–17. doi:10.1177/2332858416673357
Sahin, S., Arseven, Z., & Kilic, A. (2016). Causes of student absenteeism and school dropouts.
International Journal of Instruction, 9, 195-210. doi: 10.12973/iji.2016.9115a
102
Saritas, T., & Akdemir, O. (2009). Identifying factors affecting the mathematics achievement of
students for better instructional design. International Journal of Instructional Technology
& Distance Learning, 6(12). Retrieved from http://itdl.org/Journal/Dec_09/article03.htm
Saw, G., & Chang, C-N. (2018). Cross-Lagged models of mathematics achievement and
motivational factors among Hispanic and non-Hispanic high school students. Hispanic
Journal of Behavioral Sciences, 40(2), 240-256. doi: 10.1177/0739986318766511
Segovia, E. (2019). Expanding the presence of difference: Diversity in engineering. Chemical
Engineering Progress, 115(5), 62. Retrieved from http://aiche.org/cep
Schunk, D. H. (2016). Learning theories: An educational perspective (7th ed.). Greensboro, NC:
Pearson.
Sheldon, K. M., Holliday, G., Titova, L., & Benson, C. (2019). Comparing Holland and Self-
Determination Theory measures of career preference as predictors of career choice.
Journal of Career Assessment, 28(1), 28-42. doi:10.1177/1069072718823003
Sheu, B. H., Lent, R. W., Miller, M. J., Penn, L. T., Cusick, M. E., & Truong, N. N. (2018).
Sources of self-efficacy and outcome expectations in science, technology, engineering,
and mathematics domains: A meta-analysis. Journal of Vocational Behavior, 109, 118–
136. Retrieved from https://doi.org/10.1016/j.jvb.2018.10.003
Shindler, J., Jones, A., Williams, A. D., Taylor, C., & Cardenas, H. (2016). The school climate-
student achievement connection: If we want achievement gains, we need to begin by
improving the climate. Journal of School Administration Research and Development, 1,
9-16. Retrieved from http://www.jsard.org
Skedgell, K., & Kearney, C.A. (2016). Predictors of absenteeism severity in truant youth: A
dimensional and categorical analysis. American Secondary Education, 45, 46-58.
103
Retrieved from http://ezproxy.liberty.edu/login?url=https://search-proquest-
com.ezproxy.liberty.edu/docview/1845747516?accountid=12085
Skedgell, K., & Kearney, C. A. (2018). Predictors of school absenteeism severity at multiple
levels: A classification and regression tree analysis. Children and Youth Services Review,
86, 236-245. doi:10.1016/j.childyouth.2018.01.043
Slade, S., & Griffith, D. (2013). A whole child approach to student success. KEDI Journal of
Educational Policy, 10(3), 21-35. Retrieved from
http://eng.kedi.re.kr/khome/eng/webhome/Home.do
Smerillo, N. E., Reynolds, A. J, Temple, J. A., & Ou, S.-R. (2018). Chronic absence, eighth-
grade achievement, and high school attainment in the Chicago Longitudinal Study.
Journal of School Psychology, 67, 163-178. doi: 10.1016/j.jsp.2017.11.001
Smith, W. C. (2014). The global transformation toward testing for accountability. Education
Policy Analysis Archives, 22(116), 1-30. Retrieved from
http://dx.doi.org/10.14507/epaa.v22.1571
Spear, N. E., Ekstrand, B. R., & Underwood, B. J. (1964). Association by contiguity. Journal of
Experimental Psychology, 67(2), 151-161. doi: 10.1037/h0047886
Susperreguy, M. I., Davis-Kean, P. A., Duckworth, K., & Chen, M. (2018). Self-concept predicts
academic achievement across levels of the achievement distribution: Domain specificity
for math and reading. Child Development, 89(6), 2196 – 2214. doi: 10.1111/cdev.12924.
Stanton-Chapman, T. L., Virginia L. Walker, V. L., Voorhees, M. D., & Snell, M. E. (2016). The
evaluation of a three-tier model of positive behavior interventions and supports for
preschoolers in head start. Remedial and Special Education, 37(6), 333–344. doi:
10.1177/0741932516629650
104
Stein, R., & Swan AB. (2019). Evaluating the validity of Myers‐Briggs Type Indicator theory: A
teaching tool and window into intuitive psychology. Soc Personal Psychol Compass, 13,
1-11. Retrieved from https:// doi.org/10.1111/spc3.12434
Strand Cary, M. G., Clarke, B., Doabler, C. T., Smolkowski, K., Fien, H., & Baker, S. K. (2017).
A practitioner implementation of a Tier 2 first-grade mathematics intervention. Learning
Disability Quarterly 2017, 40(4) 211-224. doi: 10.1177/0731948717714715
Tan, O. S. (2015). Innovating teacher education in a complex era. Education Research Policy
Practice, 14, 193-200. doi: 10.1007/s10671-015-9181-4
Tavsancil, E., & Yalcin, S. (2015). A determination of Turkish student’s achievement using
hierarchical linear models in trends in international mathematics-science study (TIMSS)
2011, The Anthropologist, 22(2), 390-396. doi: 10.1080/09720073.2015.11891891
Taylor, R., Watson, R., & Nutta, J. (2014). Leading, teaching, and learning the Common Core
Standards: Rigorous expectations for all students. Lanham, MD: Rowman &
Littlefield.
Tichnor-Wagner, A., & Socol, A. R. (2016). The presidential platform on twenty-first century
education goals. Education Policy Analysis Archives, 24(64), 1-33. Retrieved from
http://dx.doi.org/10.14507/epaa.24.2224
Tribbe, M. D. (2014). No requiem for the space age: The Apollo moon landings and American
culture. New York, NY: Oxford.
Updegraff, K., Eccles, J. S., Barber, B. L., & O'Brien, K. M. (1996). Course enrollment as self-
regulatory behavior: Who takes optional high school math courses? Learning and
Individual Differences, 8(3), 239–259. doi: 10.1016/S1041-6080(96)90016-3
105
U.S. Department of Education. (2008). A Nation accountable: Twenty-five years after A Nation
at Risk. Retrieved from http://www.ed.gov/rschstat/research/pubs/accountable/
U.S. Department of Education. (2016). Chronic absenteeism in the Nation’s schools. An
unprecedented look at a hidden educational crisis. Retrieved from
https://www2.ed.gov/datastory/chronicabsenteeism.html#four
Vanneste, Y., Van De Loó, M., Feron, F., Rots-De Vries, C., & Van De Goor, L. (2016). Attitudes
towards addressing medical absenteeism of students: A qualitative study among
principals and special education needs coordinators in Dutch secondary schools. Plos
One, 11, 1-18. doi: 10.1371/journal.pone.0148427
Vaughn, M. G., Maynard, B., Salas-Wright, C., Perron, B. E., & Abdon, A. (2013). Prevalence
and correlates of Truancy in the US: Results from a national sample. National Institutes
of Health, 36(4), 767-776. doi: 10.1016/j.adolescence.2013.03.015
Wang, M., & Eccles, J. S. (2013). School context, achievement motivation, and academic
engagement: A longitudinal study of school engagement using a multidimensional
perspective. Learning and Instruction, 28, 12-23. doi:10.1016/j.learninstruc.2013.04.002
Warner, R. (2013). Applied statistics (2nd ed.). Thousand Oaks, CA: Sage.
Watson, M., & Hemmer, L. (2015). The argument is not compulsory law, but how attendance is
recorded. eJEP: eJournal of Education Policy, 1-7. Retrieved from
https://nau.edu/COE/eJournal
Webb, N. (1997). Research monograph number 6: “Criteria for alignment of expectations and
assessments on mathematics and science education. Washington, DC: CCSSO.
106
Weibell, C. J. (2011). Principles of learning: 7 principles to guide personalized, student-
centered learning in the technology-enhanced, blended learning environment. Retrieved
July 4, 2011 from [https://principlesoflearning.wordpress.com].
Weiner, B. (2000). Intrapersonal and interpersonal theories of motivation from an attributional
perspective. Educational Psychology Review, 12(1), 1-14. Retrieved from
https://about.jstor.org/terms
Wigfield, A., & Eccles, J.S. (2000). Expectancy–Value Theory of achievement motivation.
Contemporary Educational Psychology, 25 , 68–81. doi:10.1006/ceps.1999.1015
Wood, W., & Neal, D. T. (2007). A new look at habits and the habit–goal interface. Psychological
Review, 114(4), 843–863. doi: 10.1037/0033-295X.114.4.843
Yalcin, S., Demirtasli, R. N., Dibeki, M. I., & Yavuziv, H.C. (2017). The effect of teacher and
student characteristics on TIMSS 2011 mathematics achievement of fourth-and eighth-
grade students in Turkey. International Journal of Progressive Education,13(3), 79-94.
This study was presented at the 10th International Test Commission (ITC) Conference in
1-4 July 2016 in Vancouver, Canada.
Yong, M. & Cheney, A. (2013). Essential features of tier 2 social-behavioral interventions.
Psychology in the Schools, 50, 844-862. doi: 10.1002/pits.21710
Zinth, J. D. (2012). 50-State mathematics requirements for the Standard High School Diploma.
Education Commission of the States, 1-9. Retrieved from
http://www.ecs.org/clearinghouse/01/01/28/10128.pdf
107
APPENDICES
Appendix A
IRB Permission
May 11, 2020 Rolando Casado
Re: IRB Exemption - IRB-FY19-20-229 Relationship of Hispanic Students' School Absenteeism to Mathematics Achievement and Interest in STEM Careers
Dear Rolando Casado: The Liberty University Institutional Review Board (IRB) has reviewed your application in accordance with the Office for Human Research Protections (OHRP) and Food and Drug
Administration (FDA) regulations and finds your study to be exempt from further IRB review. This means you may begin your research with the data safeguarding methods mentioned in your approved application, and no further IRB oversight is required.
Your study falls under the following exemption category, which identifies specific situations in which human participants research is exempt from the policy set forth in 45 CFR 46: 101(b):
Category 4. Secondary research for which consent is not required: Secondary research uses of identifiable private information or identifiable biospecimens, if at least one of the following criteria is met: (i) The identifiable private information or identifiable biospecimens are publicly available;
(ii) Information, which may include information about biospecimens, is recorded by the investigator in such a manner that the identity of the human subjects cannot readily be ascertained directly or through identifiers linked to the subjects, the investigator does not contact the subjects, and the investigator will not re-identify subjects;
(iii) The research involves only information collection and analysis involving the investigator’s use of identifiable health information when that use is regulated under 45 CFR parts 160 and 164, subparts A and E, for the purposes of “health care operations” or “research” as those terms are defined at 45 CFR 164.501 or for “public health activities and purposes” as
described under 45 CFR 164.512(b); or (iv) The research is conducted by, or on behalf of, a Federal department or agency using government-generated or government-collected information obtained for nonresearch activities, if the research generates identifiable private information that is or will be maintained on
information technology that is subject to and in compliance with section 208(b) of the E-
108
Government Act of 2002, 44 U.S.C. 3501 note, if all of the identifiable private information collected, used, or generated as part of the activity will be maintained in systems of records subject to the Privacy Act of 1974, 5 U.S.C. 552a, and, if applicable, the information used in the
research was collected subject to the Paperwork Reduction Act of 1995, 44 U.S.C. 3501 et seq. Your stamped consent form can be found under the Attachments tab within the Submission Details section of your study on Cayuse IRB. This form should be copied and used to gain the
consent of your research participants. If you plan to provide your consent information electronically, the contents of the attached consent document should be made available without alteration.
Please note that this exemption only applies to your current research application, and any modifications to your protocol must be reported to the Liberty University IRB for verification of continued exemption status. You may report these changes by completing a modification submission through your Cayuse IRB account.
If you have any questions about this exemption or need assistance in determining whether possible modifications to your protocol would change your exemption status, please email us at [email protected].
Sincerely, G. Michele Baker, MA, CIP Administrative Chair of Institutional Research
Research Ethics Office
109
Appendix B
Permission to Conduct Research at the School District