Embed Size (px)
Citation preview
MACROECONOMICS
255
Zeynep KaraçorSelçuk University Department of Economics, Faculty of Economics and Administrative Sciences , Turkey, KonyaE-mail: [email protected]
Burcu GüvenekSelçuk University Department of Economics, Faculty of Economics and Administrative Sciences , Turkey, KonyaE-mail: [email protected]
Esra EkinciSelçuk University Department of Economics, Faculty of Economics and Administrative Sciences, Turkey, KonyaE-mail: [email protected]
Sevilay Konya Selçuk University Department of Foreign Trade, Taşkent Vocational High School, Turkey, KonyaE-mail: [email protected]
RELATIONSHIP WITH EDUCATION EXPENDITURE AND ECONOMIC GROWTH IN OECD COUNTRIES: A PANEL DATA ANALYSIS
Original scientific paperUDK: 37:330.35JEL classification: C 33, O10, I22, I25, O47
Abstract From the second half of the twentieth century, human capital has begun to be added in an increasing manner, especially to the basic production factors considered as labor, capital, entrepreneur and natural resource in classical economic theory. With this structural change in production, the development of human capital has become of great importance for internal growth models. Nowadays, as the strength of the arm power is greatly reduced in production, the brain power has increased in importance, and the idea of people investing in themselves has begun to be widely accepted. Education, which is one of the important dynamics of human capital with health, plays an important role in this context. Increasing the level of success with the higher education level, recruitment of qualified workers, better employment opportunities and increased earnings are significant contributors to growth and prosperity
DIEM
256
in OECD countries. In this study, the relationship between educational expenditures and economic growth for selected 19 OECD countries is analyzed using the panel data method.
Keywords: Educational Expenditures, Growth, Panel Data Analysis
1. INTRODUCTIONThe concept of education; is defined as the process of creating changes
in the behavior and thought structure and skills of the individual. Education is also expressed as processes in which the individual acquires behavioral patterns such as ability and attitude in the society (Çalışkan et al., 2013: 31). Education determines the value of countries in the global marketplace with the available skills in the labor and the price of these skills.
The main problem of the human capital theory is the contribution of the increase in the amount of labor to economic growth. In the context of this problem, two important conferences were held in 1961 on how investment in human beings influenced the extent of economic growth. One of them was concentrating on education and other one is health. The structure of human capital is largely shaped by education and health. Thanks to the education and health investments made on the same individual, the individual is more productive both as a producer and as a consumer in the society (Mushkin, 1962: 129). As service and production systems become more complex, workers with higher education levels are sought. In order to attract and retain skilled workers, societies must balance the right balance between promoting general equality and providing strong economic incentives. With increasing levels of achievement on population, better employment opportunities and increasing gains due to education level, OECD countries are growing and contribute to prosperity. In this context, the growth of labor income in GDP, in some of the education categories, is a simple measure to demonstrate its impact on high skills and economic growth (OECD, 2012: 26). Individuals want to learn more because more training means more earnings and a better job. For many, education means more schooling and a source of social mobility. Similarly, nation states and regions are concerned with raising the average level of education in their population. Because it is thought that raising the efficiency of labor will increase the quality of business in the economy and trigger economic growth.
The interest of researchers in the mutual relationship between economic growth and educational expenditure, in particular with the Inner Growth Theories, is in line with the foreground of human capital. In this study, which is trying to show the effect of economic growth on educational expenditures, 20 selected countries including our country were analyzed using data for 1995-2010 period.
MACROECONOMICS
257
2. EDUCATION AND ECONOMIC GROWTH RELATIONSHIPThe purpose of the economic activities that individuals put forth
in social life is fulfill to their basic needs. While fulfill the basic needs, it is necessary to struggle with the limitations encountered. Looking at the economy as a whole, it is aimed at increasing and maintaining the prosperity levels of the society are a basic economic policy.
Economic growth; Is defined as number and volume changes in such a way that the basic sizes of the national economy are sustained per capita income growth. The realization of economic growth depends mostly on the efficient use of the human and physical capital that the country has, and at the same time, depends of increase those capitals (Afşar, 2009: 87). Nowadays, while the strength of arm power is greatly reduced in production, the role of brain power and machines is increasing. This structural change in production, while reducing the physical role of people in the production process, gives people more time for activities such as AR-GE. This can only be achieved by making the necessary investments for human capital.
The question of the effect of education on economic growth has begun with the emergence of human capital. Until the 1960s, the concept of human capital, which was not much emphasized, gained importance along with the theories of internal growth. Education plays an important role in the development of human capital, which is the key to scientific and technological progress. Education is also seen as a sustainable path to economic prosperity and is of utmost importance in the fight against unemployment, ensuring social equality, ensuring solid foundations, awareness and cultural vitality (Mekdad et al., 2014: 56).
3. EDUCATIONAL EXPENDITURES IN OECD COUNTRIESRaising the level of equipment for growth and prosperity in OECD
countries can increase earnings through better employment opportunities and higher education levels. On average, about half of the economic growth is related to the increase in labor income at tertiary level of education. In France, Norway, Switzerland and the UK, 60% or more of the GDP is produced by who is taking tertiary education (OECD, 2012: 38).
In most OECD countries, high school education is a level of education completed by all students and trying to the minimum level of education is being increased. The policies applied to raise the minimum level of education vary from country to country. The economic conditions and financing structures that countries have are directly affecting their education expenditures (Altundemir, 2008: 52). All government spending on education (except for international sources) is classified into three categories: central, regional and local. In some
DIEM
258
countries education financing is centralized, while in some countries funds are centralized after regional and local allocations. For example; Education expenditures in France, Ireland, the Netherlands, Spain, Luxembourg, Italy, Greece and Portugal are mainly covered by the central government on a general budget, as in Turkey. In Germany, Austria, Belgium and the UK, it is covered by local governments. In Sweden, Denmark and Finland, education expenditure has been covered by public and local governments, but responsibility has been passed on to local governments (Egeli and Hayrullahoğlu, 2014: 99).
The ways in which public money is used for education in OECD countries are different. Public funds can flow directly to institutions or can be directed to institutions through state programs or by means of handles. Public expenditure on education supports that educational institutions and living expenses of students and other private spending outside institutions. Public and private spending in educational institutions does not even account for 10 per cent of OECD countries’ total GDP (Temple, 2002: 58).
4. EDUCATION AND ECONOMIC GROWTH RELATIONSHIP LITERATUREThere are many studies that examine the relationship between
education and economic growth. In some of these studies, there was a positive and significant relationship between education and economic growth, and the result was that economic growth positively affected education.
Schultz (1963) found that raising the education level of the labor was a major contribution to growth both in developing and developed countries.
Hicks (1980) analyzed the social and private benefits of educated investments in his work. The result is that investment in human resources has increased the growth rate.
Another study that should be mentioned regarding the subject is the work of Uzawa (1965) and the contribution of Lucas (1988). In these models, the output level is defined as a function of the human capital. Long-lasting and constantly growing have stated that human capital can grow without borders. In Uzawa and Lucas’s model, it has been suggested that the quality of education may increase over time.
Romer (1990) concludes that with the contribution to internal growth models based on research and development analysis he found that the stable state growth rate is partly due to the level of human capital. Even if there is a sudden increase in stocks of human capital, it can increase its growth rate indefinitely.
Benhabib and Spiegel (1994) measure the effect of human capital investments on the economic growth rate using the mass production function. In the measurement of human capital, they used various variables such as education, literacy rates and secondary education enrollment rates. Regardless
MACROECONOMICS
259
of the training variable selected, the coefficients were found to have a negligible or negative effect.
According to Weiss (1995), those who are better educated and have more work experience receive higher wages. This increases the productivity of employees.
Quiggin (1999) asserts that education has particularly non-monetary benefits, as well as the decline in economic growth, leading to the cut-off of educational spending.
Devarajan et al. (1996) focused on the impact of public spending on health, education, infrastructure, etc. on economic growth. Education spending within public spending has been associated with economic growth negatively and not important.
Engelbrecht (1997) also argues that human capital is not only considered as a factor in the study, but is also an important input of new growth theories. The effects of R & D expenditures in the empirical model are also estimated.
Barro and Lee (1993) used training data for the population aged 25 years and over. According to the results, they found that the increase in productivity is due to the change in average education years.
Patrinos and Psacharopoulos (2002) conducted a study to analyze the effects of educational investments on society. In Africa, Asia, and Latin America, the incidence of investments in primary education is high, but this ratio is low in OECD countries. Moreover, the regression between the schooling rate and the per capita income is the result of the fact that the schooling rate coefficient is both lower and higher in emerging economies.
According to Çoban (2004) study, the increase in primary school enrollment rate is due to the increase in economic growth, which is attributed to the increase in high school enrollment rate. In addition, the increase in college schooling is due to the increase in high school enrollment rate, and the increase in education expenditures is reason for the increase in high school enrollment rate.
Blankenau et al. (2007), a study was conducted using panel data from 23 developed countries, and a positive relationship was found between public education expenditures and long-term growth when the government’s budget constraint was taken into consideration.
Şimşek and Kadılar (2010) showed that both the increase in exports and the accumulation of human capital in Turkey in the 1960-2004 period for the Turkish sample in the long term supported the long-term economic growth and the increase in GDP increased the human capital accumulation.
Çalışkan et al. (2013) reached the conclusion that in the study covering the years 1923-2011, the excess resource allocated especially to higher education in Turkey will support the development process.
DIEM
260
Eriçok and Yılancı (2013) analyzed the relationship between educational expenditure and economic growth using the boundary test approach and found that the effect of educational expenditures on economic growth is temporary.
Kıran (2014) examined the impact of educational expenditures on economic growth for 18 Latin American countries and found a cointegration relationship between economic growth and educational spending, excluding the seven countries.
5. MATERIALS AND METHODSIn this study the relationship between education expenditure and
economic growth was examined for 19 OECD member countries (Australia, Austria, Belgium, Canada, Denmark, Finland, France, Iceland, Ireland, Italy, Japon, Mexico, Netherland, New Zeland, Norway, Portugal, Spain, Sweeden, Switzerland, UK) using panel data estimations (models) based on annual data for the period 1998-2012.
Cross-sectional data, time series and panel data consisting of time series or the combination of cross-sectional data and time series are used for analyzing the relationship between economic variables statistically and econometrically. The functional form of panel data econometrics is as follows;
TtNi
eXY ittiititit
,......,2,1,......,2,1
==
++++= γµβa (1)
As it can be seen in the functional form of panel data econometrics, t shows the time and i shows the sections. In this equation, an individual effect exists. This effect cannot be observed by independent variables, does not change depending on time, but includes characteristics peculiar to sections (Baltagi, 2005).
In panel data econometrics, the next step after converting cross-sectional data and time series data to the panel system is to determine if the cross-section and period effects can be explained by the fixed effects model or the random-effects model. The fixed effects model creates a different fixed value for each cross-sectional unit. In the fixed effects model, it is assumed that the slope coefficients which are shown with “$” do not change, but fixed coefficients show differences among only cross-sectional data or time data or among both types of data. If the differentiation occurs only depending on time, these types of models are named as one-way time dependent fixed effect models. If a differentiation occurs in panel data depending on both time and section, these models are named as two-way fixed effects model. However, because the cross-sectional effect is generally investigated more in panel data studies, panel data models are generally considered as one-way models (Hsiao, 2002). One-way and two-way fixed effects models can be seen in the Eq. (2) and (3) given below:
MACROECONOMICS
261
itkitkitititiitit eXXaY +++++= ββµ ....)( 11 (2)
itkitkititittiitit eXXaY ++++++= ββλµ ....)( 11 (3)
In this equation, it is considered that the error terms are distributed independently and identically in a manner that their variances equal to zero. In the fixed effects model, the fixed effects estimator allows the fixed constant to differ across cross-section units by estimating different constants for each cross-section (Baltagi, 2005).
The changes that occur depending on cross-sections or both cross-sections and time are observed when they are integrated into the model as a component of the error terms. The advantage of random effects model over the fixed effects model is that, without loss of degree of freedom, the random effects model allows the inclusion of the effects that are out of the sample to the model. The functional relation for the mentioned models can be demonstrated as follows:
)(..........11 itikitkititititit vXXaY ++++++= µββ (4)
)(..........11 titikitkititititit vXXaY λµββ +++++++= (5)
Here, Eq. (4) shows the one-way random-effects model and Eq. (5) shows the two-way random-effects model. The error terms in random effects have two components. The first of these components is the :i value of the crosssection i = 1,2,…….,N, which does not vary over time, and the vit value which signifies the rest of the crosssection where the values are correlated over time. In this model, the :i value, which signifies the cross-section effect, and the vit value, which includes the remaining error terms, are independent from each other. In addition, these two components of the error term are independent from an observed value of each independent variable. For this reason, the ordinary least squares estimators are consistent and unbiased estimators of the error term components (:i and vit) shown in Eq. (4) and (5) which explain the random effects model (Özer and Çiftçi, 2008).
5.1. Results and discussionThe data used in the study was taken from the official OECD database
on an annual basis for 19 OECD member countries including Australia, Austria, Belgium, Canada, Denmark, Finland, France, Iceland, Ireland, Italy, Japon, Mexico, Netherland, New Zeland, Norway, Portugal, Spain, Sweeden, Switzerland, UK.
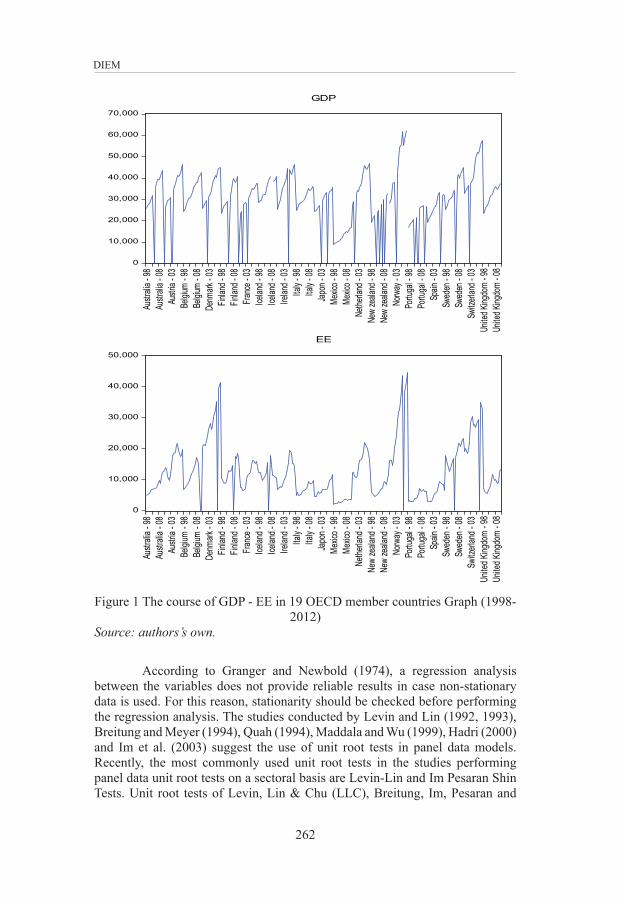
In the study, the simple interaction between education expenditure and economic growth in 19 OECD member countries for the years between 1998 and 2012 can be seen in the graph (Fig. 1)
DIEM
262
0
10,000
20,000
30,000
40,000
50,000
60,000
70,000
Austr
alia -
98Au
strali
a - 08
Austr
ia - 0
3Be
lgium
- 98
Belgi
um - 0
8De
nmark
- 03
Finlan
d - 98
Finlan
d - 08
Franc
e - 03
Icelan
d - 98
Icelan
d - 08
Irelan
d - 03
Italy
- 98
Italy
- 08
Japo
n - 03
Mexic
o - 98
Mexic
o - 08
Nethe
rland
- 03
New
zeala
nd - 9
8Ne
w ze
aland
- 08
Norw
ay - 0
3Po
rtuga
l - 98
Portu
gal -
08Sp
ain - 0
3Sw
eden
- 98
Swed
en - 0
8Sw
itzerl
and -
03Un
ited K
ingdo
m - 9
8Un
ited K
ingdo
m - 0
8
GDP
0
10,000
20,000
30,000
40,000
50,000
Austr
alia -
98Au
strali
a - 08
Austr
ia - 0
3Be
lgium
- 98
Belgi
um -
08De
nmark
- 03
Finlan
d - 98
Finlan
d - 08
Fran
ce -
03Ice
land -
98Ice
land -
08Ire
land -
03Ita
ly - 9
8Ita
ly - 0
8Ja
pon -
03Me
xico -
98Me
xico -
08Ne
therla
nd -
03Ne
w ze
aland
- 98
New
zeala
nd -
08No
rway
- 03
Portu
gal -
98Po
rtuga
l - 08
Spain
- 03
Swed
en -
98Sw
eden
- 08
Switz
erlan
d - 03
Unite
d King
dom
- 98
Unite
d King
dom
- 08
EE
Figure 1 The course of GDP - EE in 19 OECD member countries Graph (1998- 2012)
Source: authors’s own.
According to Granger and Newbold (1974), a regression analysis between the variables does not provide reliable results in case non-stationary data is used. For this reason, stationarity should be checked before performing the regression analysis. The studies conducted by Levin and Lin (1992, 1993), Breitung and Meyer (1994), Quah (1994), Maddala and Wu (1999), Hadri (2000) and Im et al. (2003) suggest the use of unit root tests in panel data models. Recently, the most commonly used unit root tests in the studies performing panel data unit root tests on a sectoral basis are Levin-Lin and Im Pesaran Shin Tests. Unit root tests of Levin, Lin & Chu (LLC), Breitung, Im, Pesaran and
MACROECONOMICS
263
Shin (IPS), Augmented Dickey-Fuller (ADF), PP (Phillips Peron) and Hadri were used in our study.
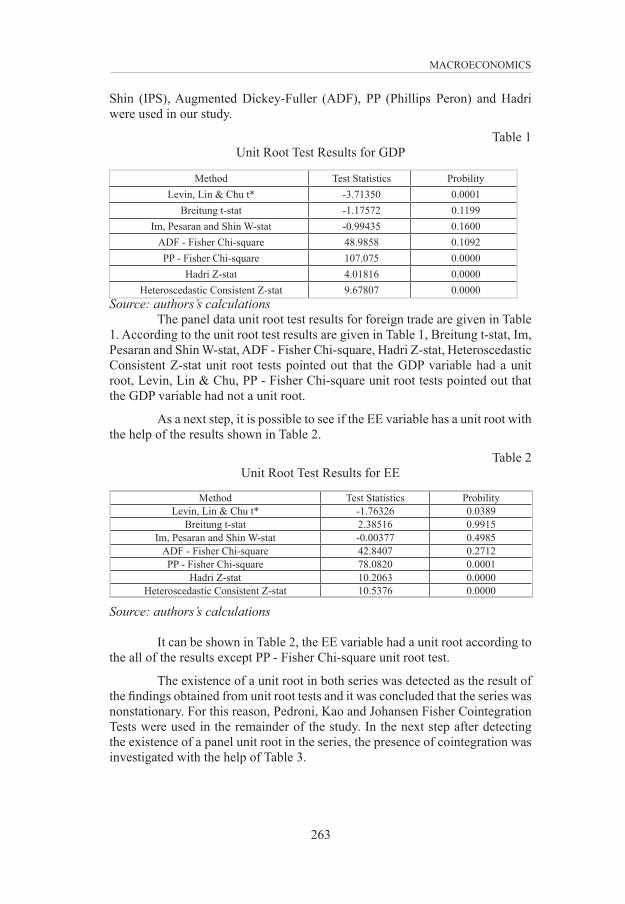
Table 1Unit Root Test Results for GDP
Method Test Statistics ProbilityLevin, Lin & Chu t* -3.71350 0.0001
Breitung t-stat -1.17572 0.1199Im, Pesaran and Shin W-stat -0.99435 0.1600
ADF - Fisher Chi-square 48.9858 0.1092PP - Fisher Chi-square 107.075 0.0000
Hadri Z-stat 4.01816 0.0000Heteroscedastic Consistent Z-stat 9.67807 0.0000
Source: authors’s calculationsThe panel data unit root test results for foreign trade are given in Table
1. According to the unit root test results are given in Table 1, Breitung t-stat, Im, Pesaran and Shin W-stat, ADF - Fisher Chi-square, Hadri Z-stat, Heteroscedastic Consistent Z-stat unit root tests pointed out that the GDP variable had a unit root, Levin, Lin & Chu, PP - Fisher Chi-square unit root tests pointed out that the GDP variable had not a unit root.
As a next step, it is possible to see if the EE variable has a unit root with the help of the results shown in Table 2.
Table 2Unit Root Test Results for EE
Method Test Statistics ProbilityLevin, Lin & Chu t* -1.76326 0.0389
Breitung t-stat 2.38516 0.9915Im, Pesaran and Shin W-stat -0.00377 0.4985
ADF - Fisher Chi-square 42.8407 0.2712PP - Fisher Chi-square 78.0820 0.0001
Hadri Z-stat 10.2063 0.0000Heteroscedastic Consistent Z-stat 10.5376 0.0000
Source: authors’s calculations
It can be shown in Table 2, the EE variable had a unit root according to the all of the results except PP - Fisher Chi-square unit root test.
The existence of a unit root in both series was detected as the result of the findings obtained from unit root tests and it was concluded that the series was nonstationary. For this reason, Pedroni, Kao and Johansen Fisher Cointegration Tests were used in the remainder of the study. In the next step after detecting the existence of a panel unit root in the series, the presence of cointegration was investigated with the help of Table 3.
DIEM
264
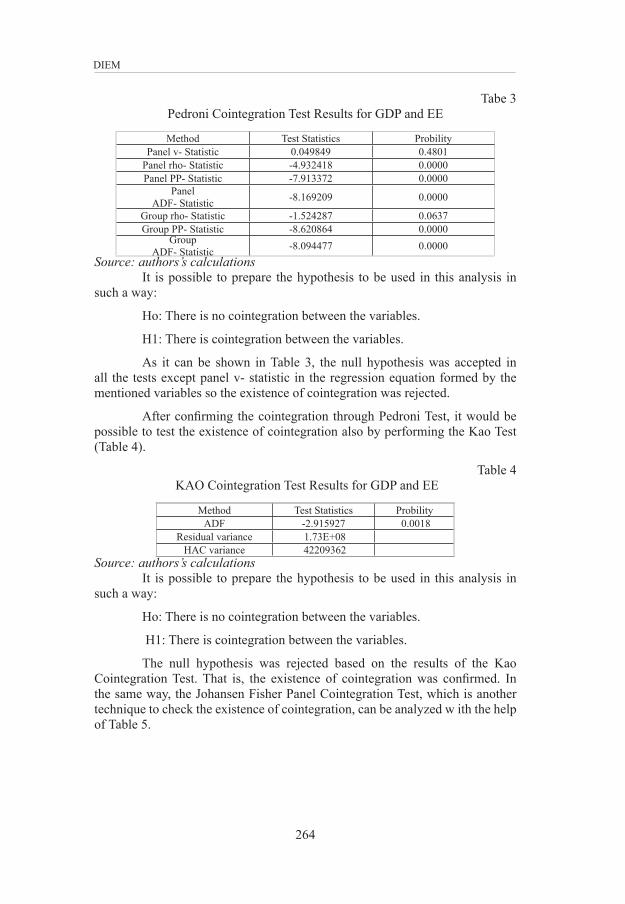
Tabe 3 Pedroni Cointegration Test Results for GDP and EE
Method Test Statistics ProbilityPanel v- Statistic 0.049849 0.4801
Panel rho- Statistic -4.932418 0.0000Panel PP- Statistic -7.913372 0.0000
PanelADF- Statistic -8.169209 0.0000
Group rho- Statistic -1.524287 0.0637Group PP- Statistic -8.620864 0.0000
GroupADF- Statistic -8.094477 0.0000
Source: authors’s calculationsIt is possible to prepare the hypothesis to be used in this analysis in
such a way:
Ho: There is no cointegration between the variables.
H1: There is cointegration between the variables.
As it can be shown in Table 3, the null hypothesis was accepted in all the tests except panel v- statistic in the regression equation formed by the mentioned variables so the existence of cointegration was rejected.
After confirming the cointegration through Pedroni Test, it would be possible to test the existence of cointegration also by performing the Kao Test (Table 4).
Table 4 KAO Cointegration Test Results for GDP and EE
Method Test Statistics ProbilityADF -2.915927 0.0018
Residual variance 1.73E+08HAC variance 42209362
Source: authors’s calculationsIt is possible to prepare the hypothesis to be used in this analysis in
such a way:
Ho: There is no cointegration between the variables.
H1: There is cointegration between the variables.
The null hypothesis was rejected based on the results of the Kao Cointegration Test. That is, the existence of cointegration was confirmed. In the same way, the Johansen Fisher Panel Cointegration Test, which is another technique to check the existence of cointegration, can be analyzed w ith the help of Table 5.
MACROECONOMICS
265
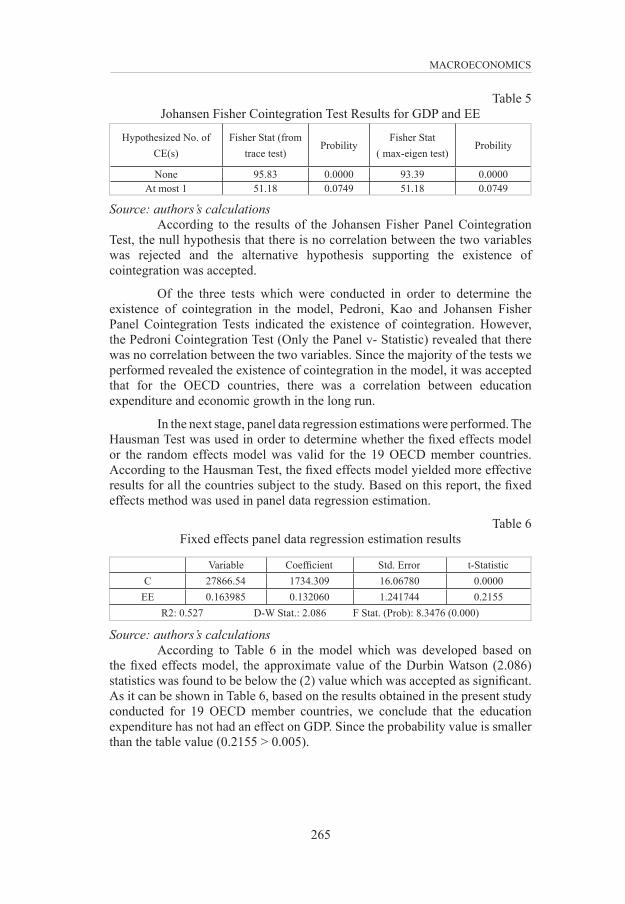
Table 5Johansen Fisher Cointegration Test Results for GDP and EE
Hypothesized No. of CE(s)
Fisher Stat (from trace test)
ProbilityFisher Stat
( max-eigen test)Probility
None 95.83 0.0000 93.39 0.0000At most 1 51.18 0.0749 51.18 0.0749
Source: authors’s calculationsAccording to the results of the Johansen Fisher Panel Cointegration
Test, the null hypothesis that there is no correlation between the two variables was rejected and the alternative hypothesis supporting the existence of cointegration was accepted.
Of the three tests which were conducted in order to determine the existence of cointegration in the model, Pedroni, Kao and Johansen Fisher Panel Cointegration Tests indicated the existence of cointegration. However, the Pedroni Cointegration Test (Only the Panel v- Statistic) revealed that there was no correlation between the two variables. Since the majority of the tests we performed revealed the existence of cointegration in the model, it was accepted that for the OECD countries, there was a correlation between education expenditure and economic growth in the long run.
In the next stage, panel data regression estimations were performed. The Hausman Test was used in order to determine whether the fixed effects model or the random effects model was valid for the 19 OECD member countries. According to the Hausman Test, the fixed effects model yielded more effective results for all the countries subject to the study. Based on this report, the fixed effects method was used in panel data regression estimation.
Table 6 Fixed effects panel data regression estimation results
Variable Coefficient Std. Error t-StatisticC 27866.54 1734.309 16.06780 0.0000
EE 0.163985 0.132060 1.241744 0.2155R2: 0.527 D-W Stat.: 2.086 F Stat. (Prob): 8.3476 (0.000)
Source: authors’s calculationsAccording to Table 6 in the model which was developed based on
the fixed effects model, the approximate value of the Durbin Watson (2.086) statistics was found to be below the (2) value which was accepted as significant. As it can be shown in Table 6, based on the results obtained in the present study conducted for 19 OECD member countries, we conclude that the education expenditure has not had an effect on GDP. Since the probability value is smaller than the table value (0.2155 > 0.005).
DIEM
266
6. CONCLUSIONHuman capital is the knowledge and skills contained by the labor force.
In relation to this statement, the knowledge that the labor force will obtain is provided through training. In this case, education is very important in terms of human capital. Another reason why education is so important is that it gives people the ability to increase productivity in the capital (Türkmen, 2002: 67). The labor force in an economy grows with the increase in population, population, and participation of the labor force in a certain part of this increasing population. The qualification or quality of the labor force, especially the education of the schools and the workplaces, also grows as the human capital of the country grows. Human capital can be expressed as the sum of knowledge and skills contained by the labor force (Kibritçioğlu, 1998: 207).
In the present study, the economies of 19 OECD member countries. Accordingly, first, the panel data system consisting of time series and cross-sectional series was used for analyzing the relationship between the variables. In the next step, using panel data, the existence of panel unit root in the mentioned variables was investigated. The test results indicated the presence of a unit root in the variables and the finding was reported.
After this step, a panel cointegration test was conducted and it was reported that a panel cointegration relationship existed among the variables consisting of the data obtained for 19 OECD member countries. Afterwards, it was investigated whether the fixed effects model or the random-effects model would be used in the model by using the Hausman Test statistics. Based on the results of the test statistics, it was reported that the fixed effects model yielded more effective results for all the countries subject to the study.
Based on the final model on which structural and diagnostic tests were performed, it was concluded in this study of 19 OECD member countries that the education expenditure has not had an effect on GDP.
When viewed from literature, most of the studies on the subject -overlapping to the theory- have reached the conclusion that education expenditures affect economical growth positively. On the other hand some of the studies have proved results which is similar to this study. (Devarajan et al. (1996), Patrinos and Psacharopoulos (2002), Eriçok and Yılancı (2013)). This result difference has been basically caused by the development differences of countries which are based on analysis. Especially examined in terms of OECD countries, it has observed that income of investments is low.
REFERENCESAfşar, M. (2009). Türkiye’de Eğitim Yatırımları ve Ekonomik Büyüme
İlişkisi. Anadolu Üniversitesi Sosyal Bilimler Dergisi, Volume: 9, No: 1, pp. 85-98.
Altundemir, M.E. (2008). Eğitim Harcamalarında Türkiye ve OECD Ülkeleri. İktisadi ve İdari Bilimler Fakültesi Dergisi, Volume: 27, No: 2, pp. 51-70.
MACROECONOMICS
267
Barro, R.J., Lee, J.W. (1993). International Comparisons Of Educational Attainment. Journal of Monetary Economics, 32, pp. 363-394.
Baltagi, B.H. (2005). Econometric Analysis Of Panel Data. Third Edition, John Wiley & Sons Gmbh, West Sussex, England.
Benhabib, J., Spiegel, M.M. (1994). The Role Of Human Capital In Economic Development: Evidence From Aggregate Crosscountry Data. Journal of Monetary Economics, Volume: 34, No: 2, pp. 143-173.
Blankenau,W.F., Simpson, N.B., Tomljanovich, M. (2007). Public Education Expenditures, Taxation and Growth: Linking Data To Theory. American Economic Association, 97(2), pp. 393-397.
Breitung, J., Meyer W. (1994). Testing for Unit Roots in Panel Data: Are Wages on Different Bargaining Levels Cointegrated?. Applied Economics, 26, pp. 353-361.
Çalışkan, Ş., Karabacak M., Meçik, O. (2013). Türkiye’de Eğitim-Ekonomik Büyüme İlişkisi: 1923-2011 (Kantitatif Bir Yaklaşım). Yönetim Bilimleri Dergisi, Volume: 11, No: 21, pp. 29-48.
Çoban, O. (2004). Beşeri Sermayenin İktisadi Büyüme Üzerindeki Etkisi: Türkiye Örneği. İ.Ü. SBF Dergisi, No: 30, pp. 131-142.
Devarajan, S., Swaroop,V., Zou, H. (1996). The Composition Of Public Expenditure And Economic Growth. Journal of Monetary Economics 37, pp. 313-344
Egeli, H., Hayrullahoğlu, B. (2014). Türkiye ve OECD Ülkelerinde Eğitim Harcamalarının Analizi. Finans, Politik&Ekonomik Yorumlar, Volume: 51 No: 593, pp. 93-108.
Engelbrecht, H.J. (1997). International R&D Spillovers, Human Capital And Productivity İn OECD Economies: An Empirical Investigation. European Economic Review, 41, pp. 1479-1488.
Eriçok, R.E., Yılancı, V. (2013). Eğitim Harcamaları ve Ekonomik Büyüme İlişkisi: Sınır Testi Yaklaşımı. Bilgi Ekonomisi ve Yönetimi Dergisi, Volume: 8, No:1, pp. 87-101.
Granger, C.W.J., Newbold, P. (1974). Spurious Regressions in Econometrics. Journal of Econometrics, 2, pp. 111-120.
Hadri, K. (2000). Testing For Stationarity in Heterogeneous Panel Data. The Econometrics Journal 3, pp. 148-161.
Hicks N. (1980). Economic Growth and Human Resources, World Bank Staff Working Paper No: 408, Washington DC, USA.
Hsiao, C. (1981). Autoregressive Modeling And Money Income Causality Detection. Journal of Monetary Economics 7, pp. 85-106.
DIEM
268
Im, K.S., Paseran M.H., Shin Y. (2003). Testing For Unit Roots in Heterogeneous Panels, Journal of Econometrics, 115, pp. 53- 74.
Kıran, B. (2014). Testing The Impact of Educational Expenditures on Economic Growth: New Evidence From Latin American Countries. Quality & Quantity, Volume: 48, Issue: 3, pp. 1181-1190.
Kibritçioğlu, A. (1998). İktisadi Büyümenin Belirleyicileri ve Yeni Büyüme Modellerinde Beşeri Sermayenin Yeri, http://www.econturk.org/Türkiye ekonomisi/aykut4.pdf, [Accessed 19.08.2017].
Levin, A., Lin, C. (1992). Unit Root Tests in Panel Data: Asymptotic and Finite Sample Properties. University of California, San Diego Working Paper, pp. 23- 92.
Levin, A., Lin C. (1993). Unit Root Tests in Panel Data: New Results. University of California, San Diego Working Paper, pp.56- 93.
Lucas, R.E. (1988). On The Mechanics Of Economic Development. Journal of Monetary Economics, Volume: 22, No:1, pp. 3-42.
Maddala, G. S. ,Wu, S. (1999). A Comparative Study of Unit Root Tests With Panel Data and A New Simple Test. Oxford Bulletin of Economics and Statistics, Special Issue, pp. 631-652.
Mekdad, Y., Dahmani,A., Louaj, M. (2014). Public Spending On Education And Economic Growth in Algeria: Causality Test. International Journal of Business and Management, Volume: 2, No: 3, pp. 55-70.
Mushkin, S. J. (1962). Health as an Investment. Journal of Political Economy, 70(5), pp. 129-157.
OECD (2012). Education at a Glance 2012: OECD Indicators, OECD Publishing, http://dx.doi.org/10.1787/eag-2012-en [Accessed 19.08.2017].
Özer, M., Çiftçi, N. (2008). AR-GE Tabanlı İçsel Büyüme Modelleri ve AR-GE HarcamalarınınEkonomik Büyüme Üzerine Etkisi: OECD Ülkeleri Panel Veri Analizi. Selçuk Üniversitesi İktisadi ve İdari Bilimler Fakültesi Sosyal ve Ekonomik Araştırmalar Dergisi, Year: 9, No:16, pp. 219-240.
Psacharopoulos, G., Patrinos, H.A. (2002). Returns to Investment in Education A Further Update. Policy Research Working Paper 2881.
Quah, D., (1994). Exploting Cross-Section Variations For Unit Root Inference in Dynamic Data. Economic Letters, Volume: 44, Issue: 1-2 pp. 9- 19.
Quiggin, J. (1999). Human Capital Theory And Education Policy In Australia. Australian Economic Review, Volume:32, No:2, pp. 130-144.
Romer, P.M. (1990). Endogenous Technological Change. Journal of Political Economy, Volume:98, No:5, pp. 71-102.
Schultz T.W. (1963). The Economic Value of Education. Columbia University Press, New York, USA.
MACROECONOMICS
269
Şimşek, M.,C. Kadılar (2010). Türkiye’de Beşeri Sermaye, İhracat ve Ekonomik Büyüme Arasındaki İlişkinin Nedensellik Analizi. Cumhuriyet Üniversitesi İ.İ.B.F. Dergisi,Volumr:11, No:1, pp. 115-140.
Temple, J. (2002). Growth Effects Of Education And Socıal Capıtal In The OECD Countries. OECD Economic Studies, No: 11, Volume: 2001, Issue: 2, pp. 57-101.
Türkmen, F. (2002). Eğitimin Ekonomik ve Sosyal Faydaları ve Türkiye’de Eğitim Ekonomik Büyüme İlişkisinin Araştırılması. State Planning Organization Dissertations, Issue No: 2655, Ankara.
Uzawa, H. (1965). Optimal Technical Change In An Aggregative Model Of Economic Growth. International Economic Review, pp. 18-31.
Weiss, A. (1995). Human Capital vs. Signalling Explanations Of Wages. Journal of Economic Perspectives, Volume:9, No:4, pp. 133-154.