Embed Size (px)
Citation preview
RELATIONSHIPS BETWEEN CUSTOMER SATISFACTION
AND SERVICE LOYALTY: USERS’ PERCEPTION ON
TELECOMMUNICATION SERVICE PROVIDERS IN
MALAYSIA
CHONG HUI LING
Relationships between Customer Satisfaction and Service
Loyalty: Users’ Perception on Telecommunication Service
Providers in Malaysia
Chong Hui Ling Bachelor of Arts
Deakin University
Melbourne, Victoria
Australia
2000
Submitted to the Graduate School of Business
Faculty of Business and Accountancy
University of Malaya, in partial fulfilment
Of the requirements for the Degree of
Master of Business Administration
5th December 2008
ii
Abstract
This dissertation reports the results of a yearlong study focused on describing and
coming to understand the perceptions of mobile phone users on relationships between
customer satisfaction and service loyalty towards telecommunication service
providers in Malaysia. This study seeks to contribute to the development of a
conceptual framework that integrate service quality, corporate image, price, customer
satisfaction, and service loyalty.
The study was conducted using based on non probability sampling in Malaysia with
focus point is on Klang Valley area. The research sample was selected from a range
of demographic elements for processing based on convenience sampling. Methods of
data-collection included online questionnaire, and self-administered questionnaire.
Quantitative data obtained and the data gathered were being treated by using the
statistical software program namely Statistical Package for Social Research (SPSS)
version 14.0 for analysis and summarization purposes.
In preparation for the study, a comprehensive literature review was performed. The
literature review informed the theoretical framework which guided the study.
Additional literature, where needed, was introduced through the data collection and
analysis processes. The study uncovered that service quality, corporate image, and
price are found to act on service loyalty via customer satisfaction. Price has been
found to be the most important input to customer satisfaction. It gives implications for
differentiated marketing strategies according to the perceived value and type of
customer loyalty and summative overview topics for further study.
iii
Acknowledgment The work of this thesis represents the concerted efforts of many individuals over the
past one year. One of the features of the paper is collaboration and certainly, it
required many acts of collaboration by quite a few people in order to come to fruition.
First, I would like to express my thanks to my supervisor, Prof. Madya Dr. Sharifah
Latifah Syed A. Kadir, for her guidance and supervision in completing this thesis
project. There would not be a thesis if it were not for you.
I owe a debt of gratitude to my family who sacrificed time with their daughter and
wife so that she could climb her own personal Mount Everest. A special thank to my
loving husband, Tan Chee Leong, who especially supportive in listening to my ideas
and helping me work out logistical details throughout this long process.
I would also like to acknowledge my thanks to Mr. Chang Peng Kee for his guidance
and helpful recommendations concerning statistical procedures. I am deeply indebted
and much grateful to my employer, CompuMed Services Sdn Bhd, for the unreserved
support and understanding rendered during this period.
Finally, I would like to acknowledge all the people who participated in my thesis
project.

iv
Table of Contents Topic Page 1. 1.0 Introduction 1 1.1 Purpose and Significance of the Study 3 1.2 Objectives and Questions of the Study 4 1.3 Scope of the Study 5 1.4 Limitations of the Study 6 1.5 Organization of the Study 7 2. 2.0 Literature Review 9 2.1 Service Quality 9 2.1.1 Parasuraman’s SERVQUAL 11 2.1.2 Gronroos’s Methodology 14 2.1.3 Cronin’s SERVPERF 16 2.1.4 Service Quality and Customer Satisfaction 18 2.1.5 Recent Findings 20 2.2 Corporate Image 21 2.2.1 Corporate Image and Customer Satisfaction 24 2.2.2 Recent Findings 25 2.3 Price 26 2.3.1 Price Sensitivity 26 2.3.2 Price Acceptance 27 2.3.3 Price Perception 28 2.3.4 Price Fairness 29 2.3.5 Price and Customer Satisfaction 30 2.3.6 Recent Findings 30 2.4 Customer Satisfaction 31 2.4.1 Customer Satisfaction and Service Loyalty 33 2.4.2 Recent Findings 34 2.5 Service Loyalty 35 2.5.1 Recent Findings 37 3. 3.0 Research Methodology 39 3.1 Theoretical Framework 39 3.2 Research Hypotheses 39 3.3 Selection and Measures 40 3.4 Sample Design 41 3.5 Development of Test Measures 42 3.5.1 Items to Measure Service Quality 42 3.5.2 Items to Measure Corporate Image 43 3.5.3 Items to Measure Price 43
v
Table of Contents (Continued)
Topic Page 3.5.4 Items to Measure Customer Satisfaction 44 3.5.5 Items to Measure Service Loyalty 45 3.6 Data Analysis Techniques 45 3.6.1 Reliability Test 45 3.6.2 Factor Analysis 46 3.6.3 ANOVA Test 47 3.6.4 Correlation 47 3.6.5 Partial Correlation 48 3.6.6 Multiple Regression 48 3.7 Pilot Test 49 4.0 Research Results 50 4.1 Respondents’ Demographic Profiles 50 4.2 Analysis of Measures 53 4.2.1 Reliability Test 53 4.2.2 Factor Analysis 53 KMO and Bartlett’s Test 53 4.2.3 ANOVA Test 56 4.2.4 Correlation 57 4.3 Testing of Hypotheses 57 Independent Variables as Predictors to Service Loyalty 58 Independent Variables as Predictors to Customer Satisfaction 59 Partial Correlation 60 Customer Satisfaction as Predictor to Service Loyalty 61 Independent Variables and Customer Satisfaction as Predictors to Service Loyalty
62
4.4 Summary of Research Results 64 5.0 Conclusion and Recommendations 68 5.1 Summary and Conclusion 68 5.2 Suggestions for Future Research 69 5.3 Implications 69 5.3.1 Service Quality 69 5.3.2 Corporate Image 70 5.3.3 Price 71 5.3.4 Customer Satisfaction 72 5.3.5 Service Loyalty 73
vi
Table of Contents (Continued)
Topic Page 6. 6.0 References 74 7. 7.0 Appendix 92 Appendix A – Questionnaire Appendix B – Report in CD
vii
List of Figures Title Page
Figure 2.1 Main Research Streams on Service Quality 9
Figure 2.2 Gaps in Service Quality 13
Figure 2.3 Perceived Service Quality 15
Figure 2.4 Relationship between Customer Satisfaction and Service Quality
19
viii
List of Tables Title Page Table 1 Respondents’ Demographic Profiles 52
Table 2 KOM & Barlett’s Test 54
Table 3 Factor Analysis and Reliability 55
Table 4 Descriptive Summary for the Three Telecommunication Service Providers
57
Table 5 Correlations Matrix between Variables 57
Table 6 Model Summary (Independent Variables as Predictors to Service Loyalty)
58
Table 7 ANOVA (Independent Variables as Predictors to Service Loyalty)
58
Table 8 Coefficients (Independent Variables as Predictors to Service Loyalty)
59
Table 9 Model Summary (Independent Variables as Predictors to Customer Satisfaction)
59
Table 10 ANOVA (Independent Variables as Predictors to Customer Satisfaction)
59
Table 11 Coefficients (Independent Variables as Predictors to Customer Satisfaction)
60
Table 12 Correlations – Control Variables (Corporate Image and Price) 61
Table 13 Correlations – Control Variables (Service Quality and Corporate Image)
61
Table 14 Model Summary (Customer Satisfaction as Predictor to Service Loyalty)
62
Table 15 ANOVA (Customer Satisfaction as Predictor to Service Loyalty)
62
Table 16 Coefficients (Customer Satisfaction as Predictor to Service Loyalty)
62
Table 17 Model Summary (Independent Variables and Customer Satisfaction as Predictors to Service Loyalty)
63
Table 18 ANOVA (Independent Variables and Customer Satisfaction as Predictors to Service Loyalty)
63
Table 19 Coefficients (Independent Variables and Customer Satisfaction as Predictors to Service Loyalty)
64
Table 20 Result Table of the Tested Hypotheses 64

1
1.0 Introduction
Asia's telecommunications industry has seen rapid development in the past decade
and looks poised for further expansion, charting growth rates of 25% in 2006 (The
Star, 21 July 2007). While for the Malaysian telecommunications industry, growth
rate is mainly driven by the mobile services segment. In general, there will be wider
subscriber base, increases in international calls and increased popularity in the usage
of mobile data (SMS, ringtones and songs downloads, GPRS) supported the growth in
the Malaysian mobile services segment.
As per the report by The Star dated 21st July 2007, the number of cellular phone
subscribers has risen to 19.464 million as at end-2006 vs. 5.122 million in
2000. Mobile phone subscribers are expected to reach 24.4 million by 2010. Cellular
phone penetration rate per 100 population stood at 72.3% as at end-2006 vs. 21.8% in
2000. Mobile penetration rate is expected to trend higher to 85% by 2010, driven by
convenience, affordability and in keeping with changing lifestyles. In terms of market
share of telecommunication players, Maxis dominated the cellular services market at
40%, followed closely by TM-Celcom at 35% and Digi at 25%.
The following information was found from the Malaysian Communications and
Multimedia Commission’s “Handphone Users Survey 2007” report. The report stated
that Selangor continues as the state with the highest number of hand phone users at
22.1 percent followed by Johor (13.5 percent), Federal Territory of Kuala Lumpur
(8.6 percent) and Perak (7.8 percent). Among other states, Sabah (including Federal
Territory of Labuan), Penang, Kedah, and Sarawak have between 6 and 7 percent of
hand phone users, while Pahang, Kelantan, Negeri Sembilan, Terengganu and Melaka
2
have between 4 and 5 percent users. Perlis has the smallest number of users with only
0.8 percent.
In June 2003, the Malaysian Communications and Multimedia Commission launched
an independent study to assess dominance within the communications and multimedia
industry in Malaysia. The study was conducted as part of the Commission’s role as
industry regulator, a key function of which is to promote effective competition in the
communications and multimedia industry. The study showed that the mobile market is
very competitive. A high percentage of “churn” experienced by the mobile operators
indicates that consumers are willing to switch operators rather easily. To stay ahead,
quality of service and cost will be a key competitive advantage for the mobile
operators in order to retain customer loyalty.
Competition between mobile providers is getting stronger nowadays by citing
evidence of reductions in the price of pre –paid starter kits, free airtime offers for pre-
paid customers, rebates on monthly access fees for post-paid customers, more
attractive call tariff packages (such as “family and friends”), and lower SMS tariffs. It
also argued that this competition has been to the benefit of customers not only in
terms of lower prices, but also in terms of quality of services. Expenditure on capital
(to enhance service coverage and quality of service) and the introduction of initiatives
to better manage relationships with customers are both further evidence of this
competition.
This situation makes telecommunication service providers pay less attention on or
ignore other factors that might affect customer satisfaction and retention. Mobile
3
phone users have been increasingly demand for affordable and reliable services that
correspond exactly to their specific individual needs, lifestyle and preferences.
Telecommunication service providers require good knowledge of the needs and
perceived quality of the user segments. It is essential for service providers to
understand how their service brings value to users’ everyday life.
1.1 Purpose and Significance of the Study
The purposes of the study are to examine the determinants of customer satisfaction
and the loyalty intentions for the mobile service providers. In addition, the study aims
to investigate the characteristics of the mobile consumers with regards to their
satisfaction and loyalty.
Service quality, corporate image and price are the identified independent variables in
this study. As mentioned by Albert Caruana (2002), “an important reason for the
interest in service quality by practitioners results from the belief that this has a
beneficial effect on bottom-line performance for the firm.” It gives indications to
telecommunication service providers as to where best to devote marketing attention
and scare their resources.
While for corporate image, if a service provider has a positive image in the eyes of
customers, minor mistake will be forgiven but the image will be damaged if mistakes
often occur. On the other hand, if a service provider’s image is negative, the impact of
any mistake will be significant and affect level of satisfaction. Davies et al. (2002)
demonstrated the positive impact of corporate image on customer satisfaction in the
retailing context. It can be assumed that this kind of positive influence will also hold
4
in the mobile phone service sector as image represents an essential factor for the
perception of satisfaction.
Huber et al. (2001) stated that if the central role of pricing in consumer behaviour as
well as cost effectiveness is considered as one of the criteria that consumers rank as
being particularly important when selecting a product or service, the fact that the price
has received little attention when analyzing customer satisfaction is astonishing.
Huber reiterated that service marketing is different to goods marketing, and is usually
more complex to manage. In this circumstance, price is an important factor in
purchasing and post-purchasing processes. As such, it is an important variable in
services. It is also crucial for organizations to set and manage price which it directly
influence an inflow of resources.
1.2 Objectives and Questions of the Study
This study seeks to contribute to the development of a conceptual framework that
integrate service quality, corporate image, price, customer satisfaction, and service
loyalty. As mentioned by Albert Caruana (2002), work that integrates the role of
service loyalty within the context of other service marketing variables like service
quality and customer satisfaction have received less attention. As a result, a survey of
consumers will be conducted to provide insight into these issues in Malaysian context.
This study tries to answer to the following questions:
1. Does service quality, corporate image and price influence customer satisfaction?
2. Is there a trade-off between price and service quality which is most often
materialized in term of customer satisfaction?
5
3. Does customer satisfaction mediates the relationship among service quality,
corporate image and price towards service loyalty?
The research objectives of the study are:
1. To investigate the determinants of perceived service quality, corporate image and
price and which is more significantly affecting customer satisfaction.
2. To investigate the effect of customers’ satisfaction on service loyalty of
telecommunication service providers.
1.3 Scope of the Study
This study focuses on telecommunication service providers in Malaysia, which has
three major players at time of writing: Celcom, Digi, and Maxis. The research sample
will be selected from a range of demographic elements for processing based on non
probability sampling in Malaysia with focus point is on Klang Valley area.
The data for this study was collected through self-administered questionnaire during
the period from 16th May 2008 to 30th June 2008. Extra effort has been made by using
a survey website (http://freeonlinesurveys.com) for respondents to participate in this
study through internet.
Periodical researches have been referred in justifying and supporting the design of an
effective research study. Reviewing the literatures could provide a basis for revising
the proposed study by extending parts of previous studies. It also gives an idea to
researchers on how to conduct a study.
6
Based on literature review, the scope of this study uses perceived service quality
determinants, corporate image, price as the independent variables while customer
satisfaction as the mediating variable and service loyalty as dependent variable.
1.4 Limitations of the Study
All researches have their limitation and it is no exception on this study. The survey is
only conduct in Klang Valley, therefore base on the collected sample size and the
regional distribution of the population concerned, the questions will be whether the
findings can be generalized. Such generalization requires further in depth studies with
larger samples and a variety of industries. In a strict sense the results pertain only to
the respondents and generalizations to a wider population or industry should be done
with caution. The sample size is not large enough but shall be adequate for the type of
analysis undertaken.
Another limitation is on the scope of study. From a theoretical point of view, the
framework of this research is restricted to its own objectives. This study has pondered
the relationship among service quality, corporate image, price, customer satisfaction,
and service loyalty. While other antecedents or consequences, such as “relationship”
(Guan Xi in Chinese), promotions, employees behavior, have not been considered.
Factors affecting consumers’ satisfaction and service loyalty on mobile phone
services could be examined in many perspectives and in more details.
Additionally, this research and the model propose have been devised as a basis for
future studies. It would be interesting to analyze how the proposed relationships may
differ when compared with other service sectors or tangible products. In addition, due
7
to the fact that service industries are heterogeneous, presenting a wide variety of
pricing structures, further research should be carried out in respect of other services,
concentrating on analyzing other antecedents and consequences. Finally, it should be
noted that the study focused on mobile phone service sector alone, ignoring fixed-
lines service sector. Future research may derive benefit from focusing on consumer
behavior in the fixed-line industry.
1.5 Organization of the Study
This paper is divided into five chapters that covered “Introduction”, “Literature
Review”, “Research Methodology”, “Research Result”, and “Conclusion &
Recommendation”. The outlines of the five chapters are as below.
Chapter 1: Introduction
This chapter gives an overview of the study. It contains general introduction to the
issues with which the study is concerned, purposes and significance of the study,
followed by the research objectives, scope of the study and limitation.
Chapter 2: Literature Review
This chapter assesses to previous literature and studies relevant to the fields and
related topics. A literature review also provides a rationale for the proposed study by
placing it next to previous studies.
8
Chapter 3: Research Methodology
It describes and explains the research methodology used in the study. Key topics of
this chapter include theoretical framework, methodologies, hypotheses, selection of
measures, sampling design, data collection procedures, and data analysis techniques.
Chapter 4: Research Result
This chapter describes overall findings, summarizes the statistics of respondents,
result of statistical analysis, and discussion of the research result. Results and data
analysis are presented in the form of text, figures, tables, etc.
Chapter 5: Conclusion and Recommendation
In this chapter, the findings are summarized and implications of the findings are being
discussed. It looks at the implications of the findings practise, accepted theoretical
model or paradigm and indicate the overall importance of the research to the field.
This chapter also outlines recommendation for future research.
9
2.0 Literature Review
This chapter assesses to previous literature and studies relevant to the fields and
related topics. A literature review also provides a rationale for the proposed study by
placing it next to previous studies.
2.1 Service Quality
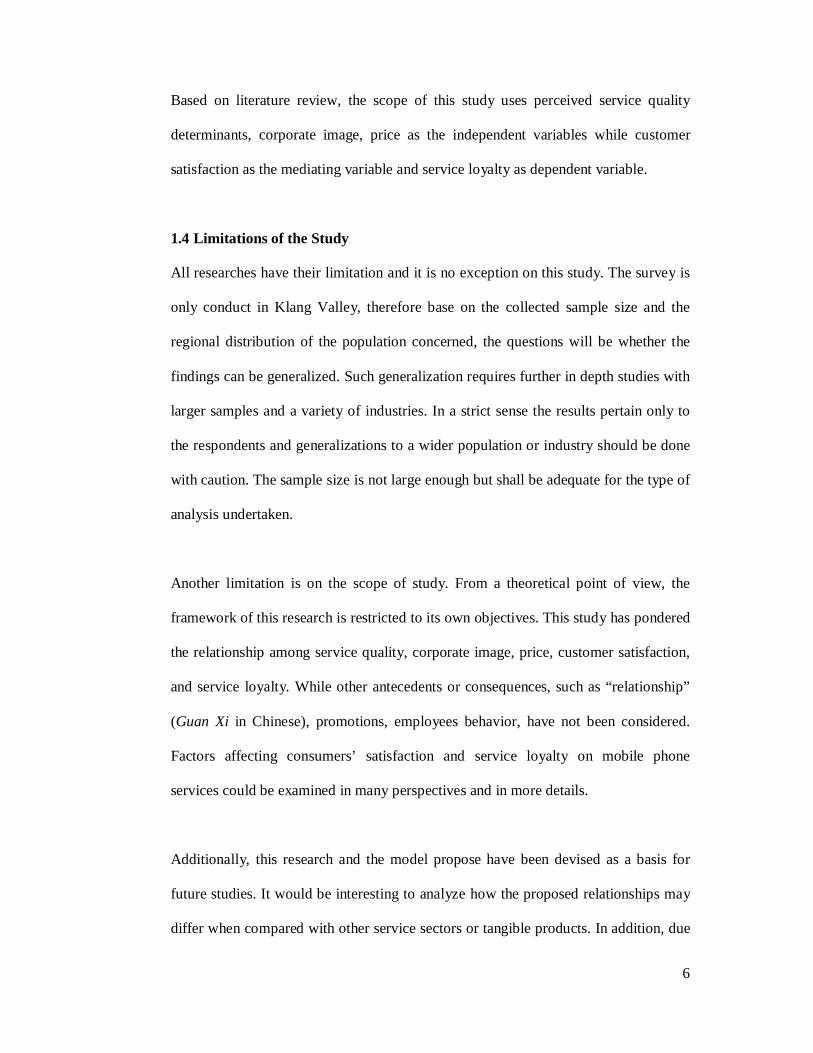
Research into service quality research has followed various lines of enquiry. The
present study has identified five main research streams, as illustrated in Figure 2.1.
Figure 2.1: Main Research Streams on Service Quality (Source: Manuel Sanchez Perez, Juan Carlos Gazquez Abad, Gema Maria Marin
Carrillo and Raquel Sanchez Fernandez (2007), “Effects of Service Quality
Dimensions on Behavioural Purchase Intentions: A Study in Public-Sector
Transport”.)
First, there have been many studies of the concept and nature of service quality. Those
involve are Gronroos (1982), Berry et al. (1985), Parasuraman et al. (1985), and
Zeithaml et al. (1985). Although there is no general consensus about the nature or
10
content of the dimensions of service quality (Morrison, 2004), there is a general
recognition that service quality is a multi-dimensional construct (Cronin and Taylor,
1992; Gronroos, 1990; Parasuraman et al., 1985, 1988; Brady and Cronin, 2001).
A second research stream into service quality has focused on the strategic
consequences of quality. It has been claimed that an improvement in quality has a
measurable effect on customer retention, market share, and profitability as a result of
increased sales, lower prices, and decreased costs (Manuel Sanchez Perez, 2007).
However, it should be noted that some authors like Rust have analyzed the return on
quality and concluded that not all quality efforts are equally valid.
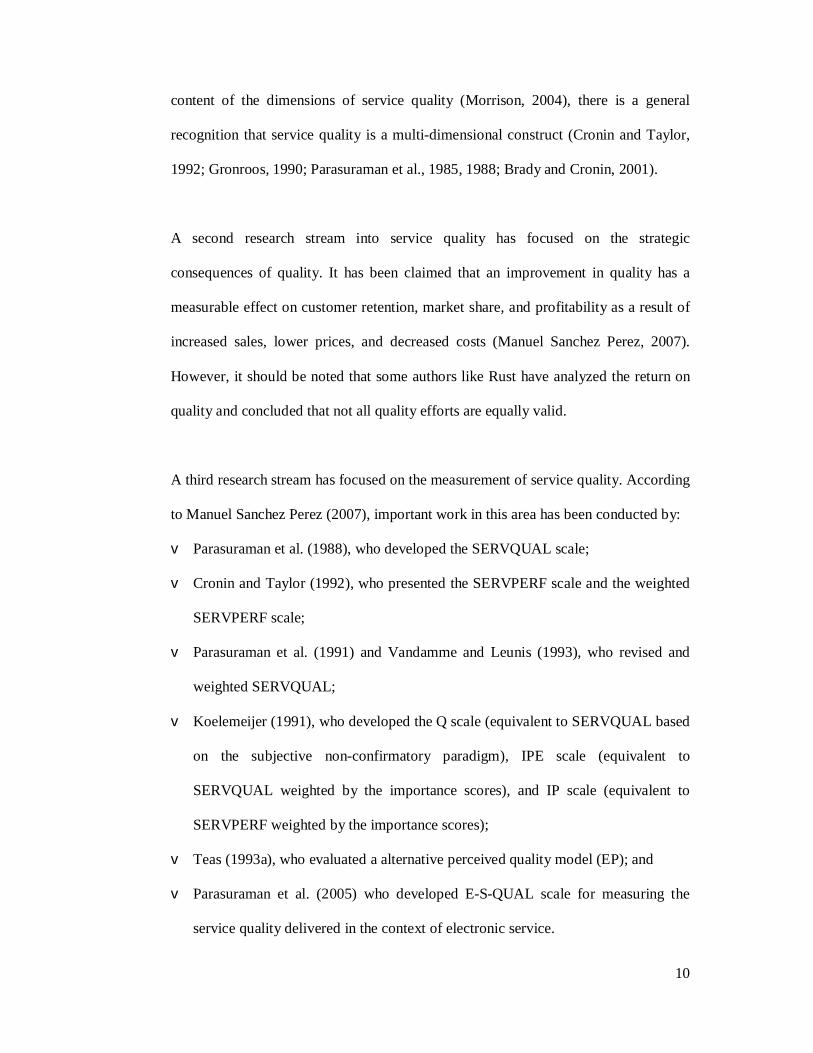
A third research stream has focused on the measurement of service quality. According
to Manuel Sanchez Perez (2007), important work in this area has been conducted by:
v Parasuraman et al. (1988), who developed the SERVQUAL scale;
v Cronin and Taylor (1992), who presented the SERVPERF scale and the weighted
SERVPERF scale;
v Parasuraman et al. (1991) and Vandamme and Leunis (1993), who revised and
weighted SERVQUAL;
v Koelemeijer (1991), who developed the Q scale (equivalent to SERVQUAL based
on the subjective non-confirmatory paradigm), IPE scale (equivalent to
SERVQUAL weighted by the importance scores), and IP scale (equivalent to
SERVPERF weighted by the importance scores);
v Teas (1993a), who evaluated a alternative perceived quality model (EP); and
v Parasuraman et al. (2005) who developed E-S-QUAL scale for measuring the
service quality delivered in the context of electronic service.
11
Despite considerable work undertaken in this research stream, there is no consensus
as to which of the measurement scales is best suited to measure service quality
(Morrison, 2004).
The fourth research stream has analyzed how an organization can improve service
quality. Authors such as Berry, Hensel, Harvey, Johnston and Heineke, Reicheld and
Sasser, and Rust are involved both normative formulations and empirical studies.
The fifth research stream has focused on the effects of service quality on consumer
behavior. Authors involved in this research stream such as Zahorik and Rust have
concentrated on the link between service quality and an improvement in the
profitability of the company. While others like Boulding, Zeithaml, and Liu have
studied the antecedents of consumer loyalty, and the effect on the profitability of a
service organization. These studies supported the contention that an improvement in
service quality has a positive influence on behavioral intentions, but they also showed
that superior levels of service quality should be achieved in a cost-effective manner
(Manuel Sanchez Perez, 2007).
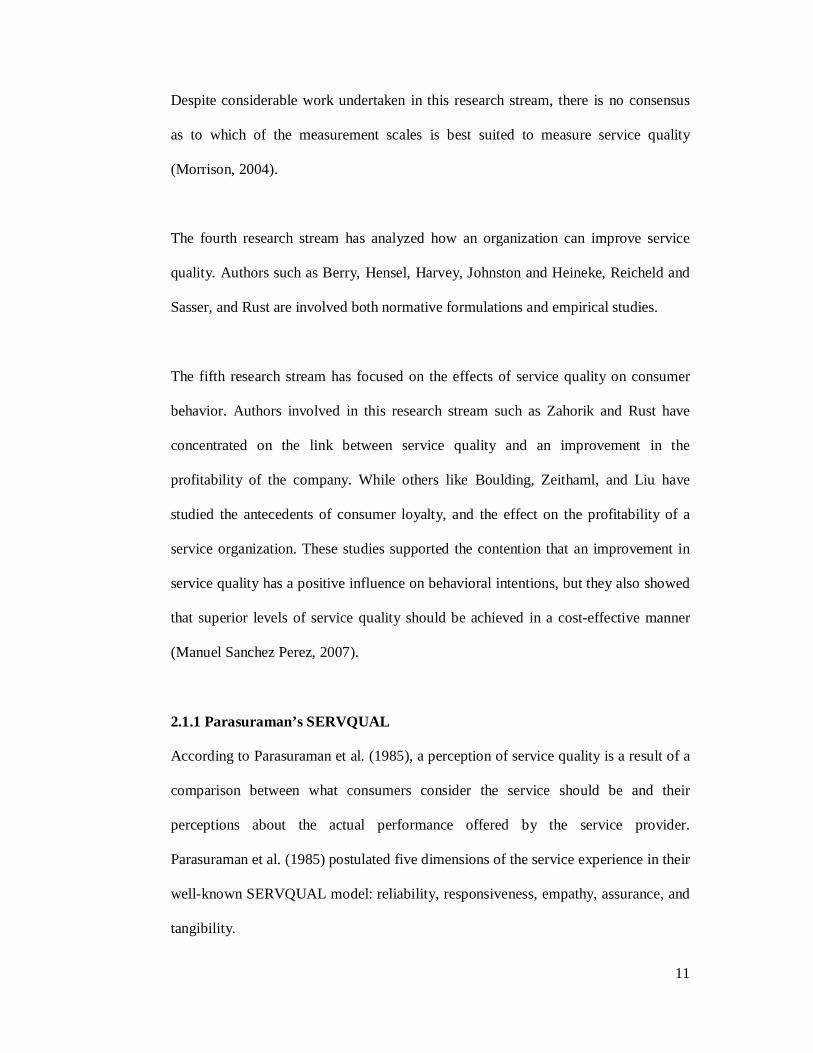
2.1.1 Parasuraman’s SERVQUAL
According to Parasuraman et al. (1985), a perception of service quality is a result of a
comparison between what consumers consider the service should be and their
perceptions about the actual performance offered by the service provider.
Parasuraman et al. (1985) postulated five dimensions of the service experience in their
well-known SERVQUAL model: reliability, responsiveness, empathy, assurance, and
tangibility.
12
Reliability is defined as the ability to deliver the promised service dependably and
accurately. It is about keeping promises - promises about delivery, pricing, complaint
handling, etc. Responsiveness can be described as the willingness to help customers
and provide prompt service. Assurance is the service quality dimension that focuses
on the ability to inspire trust and confidence. Empathy is the service aspect that
stresses the treatment of customers as individuals. Finally, tangibles are the service
dimension that focuses on the elements that represent the service physically.
Parasuraman et al. (1985, 1988, 1994) has made use of qualitative and quantitative
research following psychometric procedures which resulted in the development of the
original 22-item SERVQUAL (based on the five dimensions of service quality -
tangibles, reliability, responsibility, assurance, and empathy) instrument that
representing operationalizing of the service quality paradigm. Since then, the
SERVQUAL measurement has been applied to measure the service quality in various
service industries by many researchers.
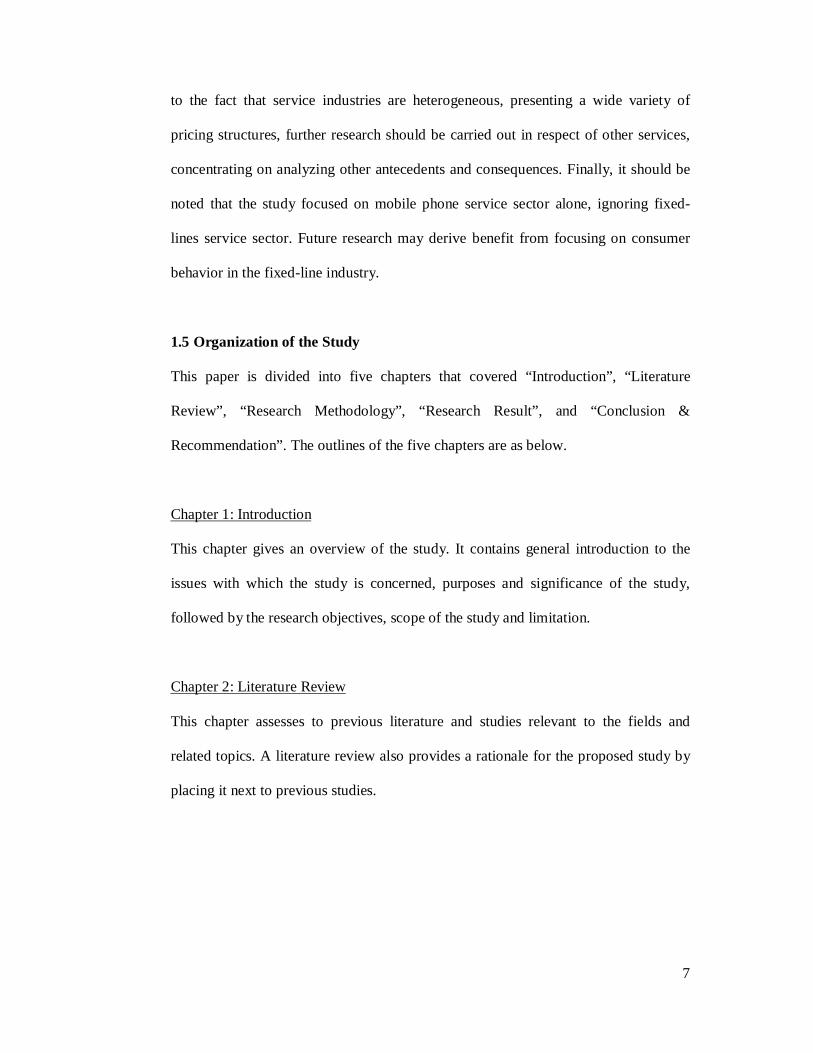
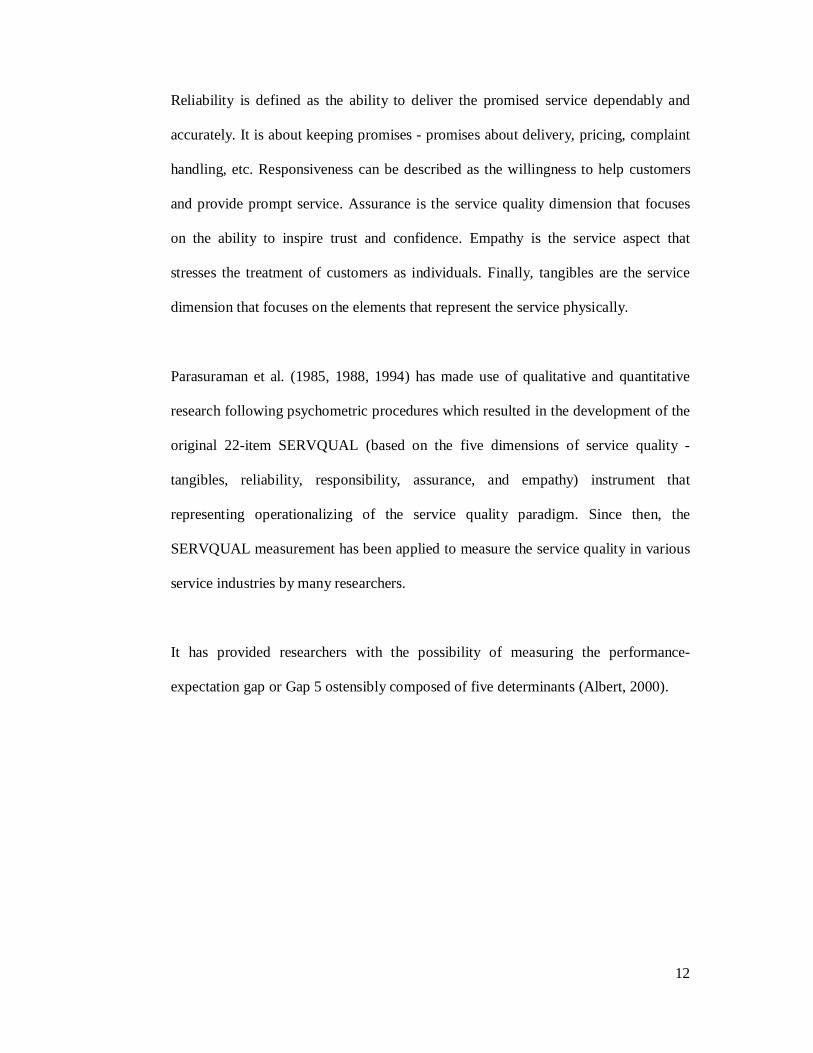
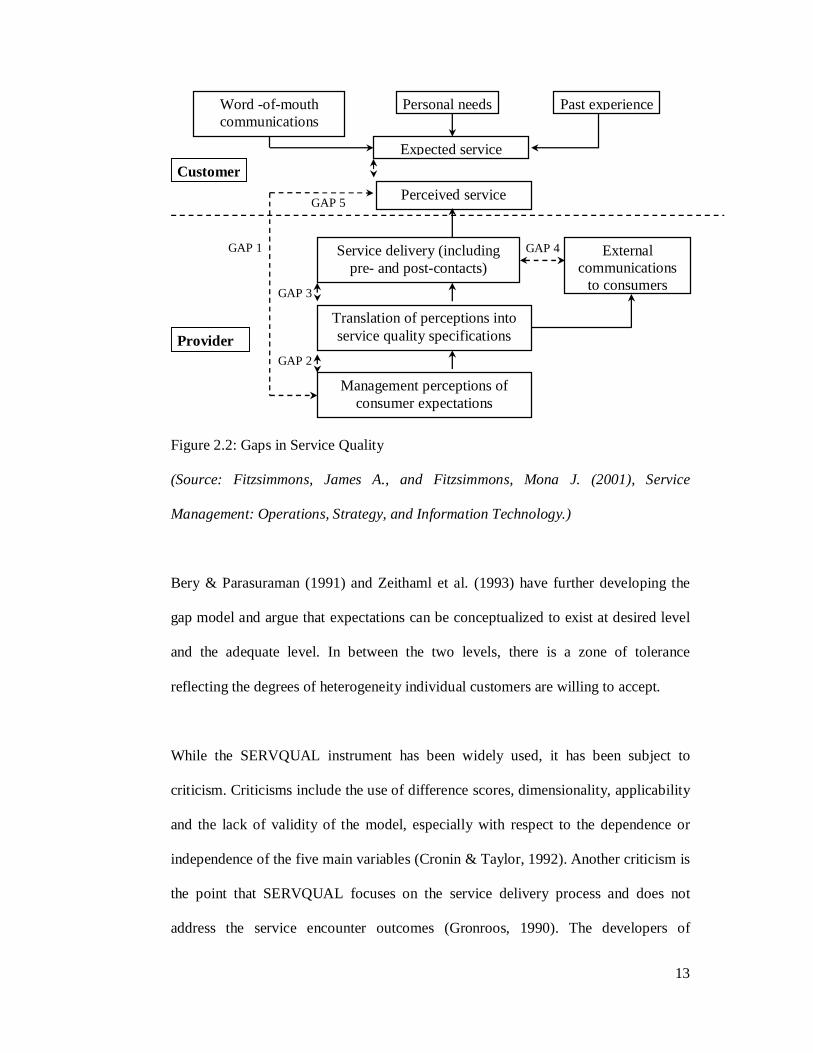
It has provided researchers with the possibility of measuring the performance-
expectation gap or Gap 5 ostensibly composed of five determinants (Albert, 2000).
13
Figure 2.2: Gaps in Service Quality
(Source: Fitzsimmons, James A., and Fitzsimmons, Mona J. (2001), Service
Management: Operations, Strategy, and Information Technology.)
Bery & Parasuraman (1991) and Zeithaml et al. (1993) have further developing the
gap model and argue that expectations can be conceptualized to exist at desired level
and the adequate level. In between the two levels, there is a zone of tolerance
reflecting the degrees of heterogeneity individual customers are willing to accept.
While the SERVQUAL instrument has been widely used, it has been subject to
criticism. Criticisms include the use of difference scores, dimensionality, applicability
and the lack of validity of the model, especially with respect to the dependence or
independence of the five main variables (Cronin & Taylor, 1992). Another criticism is
the point that SERVQUAL focuses on the service delivery process and does not
address the service encounter outcomes (Gronroos, 1990). The developers of
Word -of-mouth communications
Expected service
External communications
to consumers
Perceived service
Service delivery (including pre- and post-contacts)
Translation of perceptions into service quality specifications
Management perceptions of consumer expectations
GAP 5
GAP 3
GAP 2
GAP 1 GAP 4
Customer
Provider
Past experience Personal needs

14
SERVQUAL were initially suggested that service quality consists of functional and
technical dimensions (Parasuraman et al., 1985). However, the SERVQUAL
instrument does not include any measure of the technical quality dimension (Gi-Du &
Jeffrey, 2004). Basically, according to Gi-Du and Jeffrey (2004), technical quality has
been neglected in efforts to study and measure service quality.
2.1.2 Gronroos’s Methodology
Gronroos (1984) relates definition of service quality with the result of the comparison
that customers make between their expectations about a service and their perception
of the way the service has been performed.
Services differ from physical goods in several characteristics (Gronroos, 2000):
v Services are intangible and heterogeneous;
v The production, distribution, and consumption of services are simultaneous
processes;
v Service is an activity or process;
v Service is a core value created in buyer-seller interactions;
v Customers participate in the production of services;
v Services cannot be kept in stock; and
v There is no transfer of ownership in service transactions.
Services are thus produced, distributed, and consumed in the interaction between the
service provider and the service receiver. Accordingly, services must be viewed from
an interactive perspective.
15
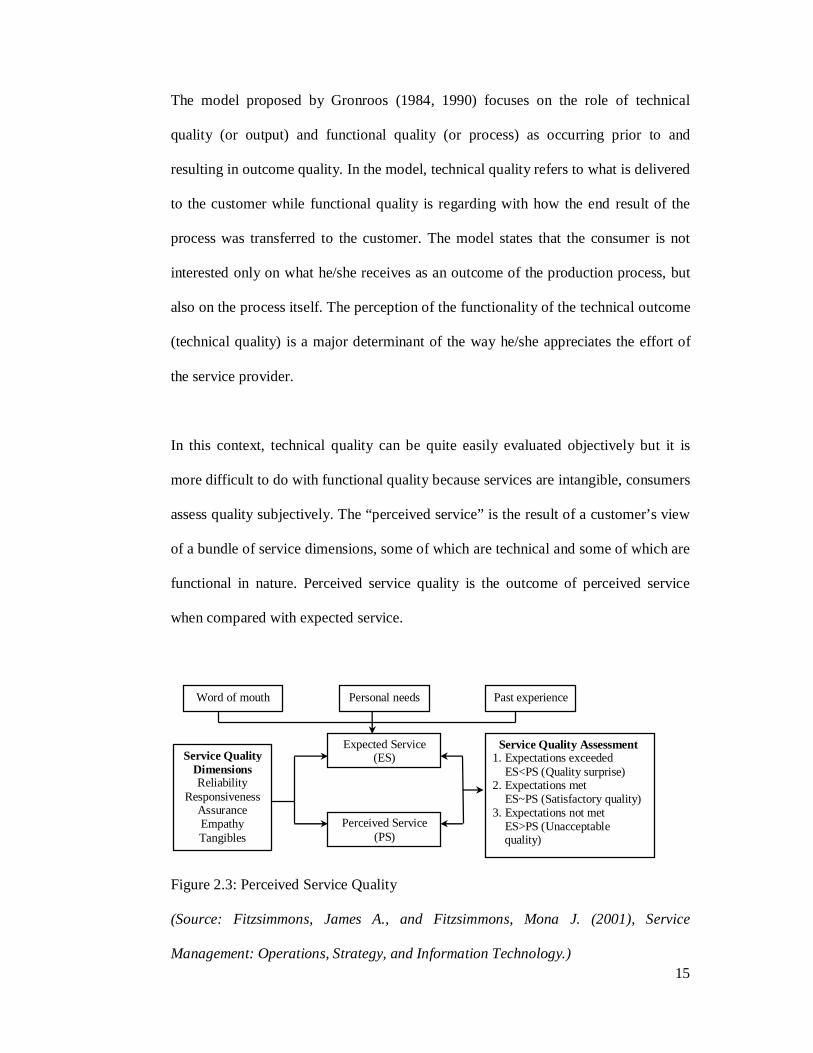
The model proposed by Gronroos (1984, 1990) focuses on the role of technical
quality (or output) and functional quality (or process) as occurring prior to and
resulting in outcome quality. In the model, technical quality refers to what is delivered
to the customer while functional quality is regarding with how the end result of the
process was transferred to the customer. The model states that the consumer is not
interested only on what he/she receives as an outcome of the production process, but
also on the process itself. The perception of the functionality of the technical outcome
(technical quality) is a major determinant of the way he/she appreciates the effort of
the service provider.
In this context, technical quality can be quite easily evaluated objectively but it is
more difficult to do with functional quality because services are intangible, consumers
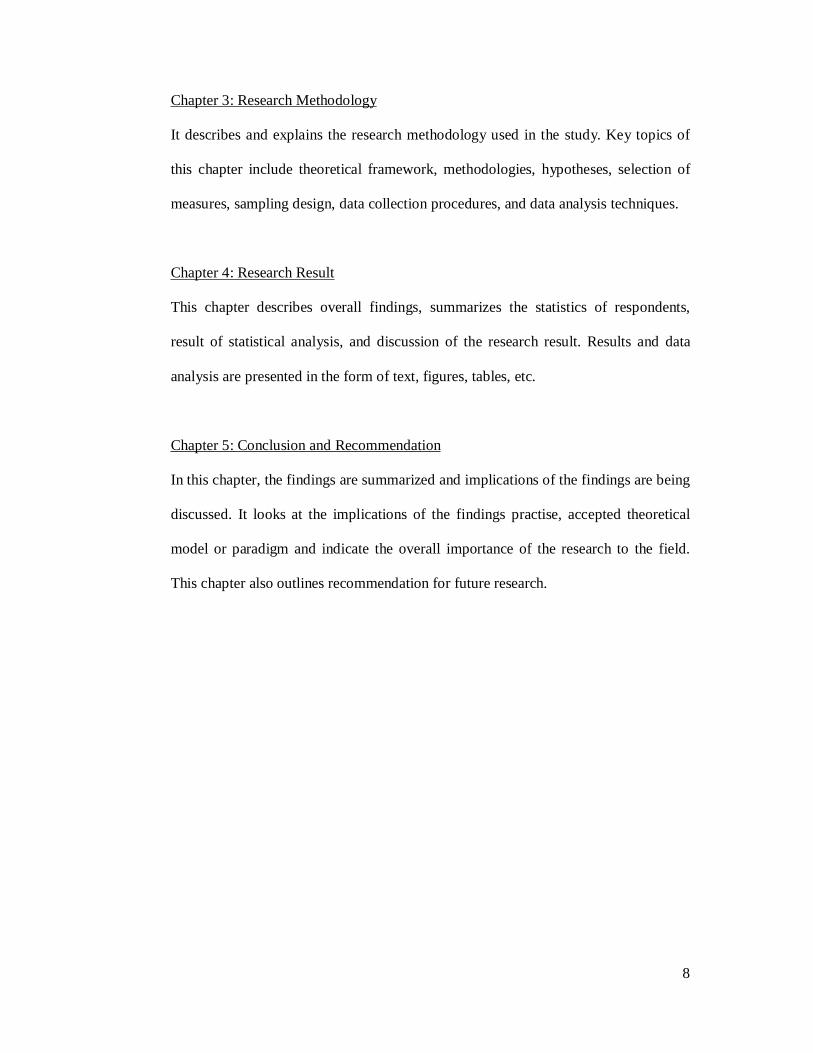
assess quality subjectively. The “perceived service” is the result of a customer’s view
of a bundle of service dimensions, some of which are technical and some of which are
functional in nature. Perceived service quality is the outcome of perceived service
when compared with expected service.
Figure 2.3: Perceived Service Quality
(Source: Fitzsimmons, James A., and Fitzsimmons, Mona J. (2001), Service
Management: Operations, Strategy, and Information Technology.)
Word of mouth Personal needs Past experience
Expected Service (ES)
Perceived Service (PS)
Service Quality Dimensions Reliability
Responsiveness Assurance Empathy Tangibles
Service Quality Assessment 1. Expectations exceeded ES<PS (Quality surprise) 2. Expectations met ES~PS (Satisfactory quality) 3. Expectations not met ES>PS (Unacceptable quality)

16
In Gronroos’s model, he also recognizes that customers have some type of image of
an organization that has a quality impact in itself and functions as a filter. According
to Gronroos, quality as experienced by a customer is based on two dimensions –
technical and functional – moderated by the company image. The customers’
perceived quality is the result of the evaluation they make of what was expected and
what was experienced, taking into account the influence of the organization’s image
(Albert, 2000).
2.1.3 Cronin’s SERVPERP
SERVQUAL, grounded in the Gap model, measures service quality as the calculated
difference between customer expectations and performance perceptions of a service
encounter (Parasuraman et al., 1988, 1991). Cronin and Taylor (1992) challenged this
approach and developed the SERVPERF scale based on Parasuraman's SERVQUAL
methodology which directly captures customers’ performance perceptions in
comparison to their expectations of the service encounter.
SERVPERF only measures performance perceptions and operationalizes service
quality as customers’ evaluations of the service encounter. It uses only performance
data because it assumes that respondents provide their ratings by automatically
comparing performance perceptions with performance expectations. As a result,
SERVPERF uses only the performance items of the SERVQUAL scale (Brady et al.,
2002; Cronin and Taylor, 1992, 1994).
Arguments in favour of SERVPERF are based on the notion that performance
perceptions are already the result of customers’ comparison of the expected and actual
17
service (Babakus and Boller, 1992; Oliver and DeSarbo, 1988). Therefore,
performance only measures should be preferred to avoid redundancy. Thus,
SERVPERF assumes that directly measuring performance expectations is
unnecessary. Cronin and Taylor (1992) built their argument for the superiority of
SERVPERF over SERVQUAL by empirically showing that SERVPERF is a better
predictor of overall service quality than SERVQUAL.
Nevertheless, many authors concur that customer’ assessments of continuously
provided services may depend solely on performance. Hence, the authors suggesting
that performance-based measures explain more of the variance in an overall measure
of service quality (Oliver, 1989; Bolton and Drew, 1991a, b; Cronin and Taylor,
1992; Boulding et al., 1993; Quester et al., 1995). These findings are consistent with
other research that have compared these methods in the scope of service activities,
thus confirming that SERVPERF (performance-only) results in more reliable
estimations, greater convergent and discriminant validity, greater explained variance,
and consequently less bias than the SERVQUAL and EP scales (Cronin and Taylor,
1992; Parasuraman et al., 1994a; Quester et al., 1995; Llusar and Zornoza, 2000).
Whilst its impact in the service quality domain is undeniable, SERVPERF being a
generic measure of service quality may not be a totally adequate instrument by which
to assess perceived quality. This research bears on these conclusions and adopts the
performance-based SERVPERF paradigm.
18
2.1.4 Service Quality and Customer Satisfaction
The relationship between service quality and individual service loyalty dimensions
has been examined empirically by Boulding et al. (1993), Cronin, and Taylor (1992).
Cronin and Taylor (1992) focused solely on repurchase intentions, whereas Boulding
et al. (1993) focused on both repurchase intentions and willingness to recommend. In
the study by Cronin and Taylor (1992) service quality did not appear to have a
significant (positive) effect on intentions to purchase again, while Boulding et al.
(1993) found positive relationships between service quality and repurchase intentions
and willingness to recommend.
Customer satisfaction often depends on the quality of product or service offering. In
the context of services, some describe customer satisfaction as an antecedent of
service quality (Bitner, 1990; Cronin and Taylor, 1992). Service quality is thus
related, though not equivalent, to satisfaction (Oliver, 1980). For this reason, research
on customer satisfaction is often closely associated with the measurement of quality
(East, 1997). Customer satisfaction can thus be based not only on the judgment of
customers towards the reliability of the delivered service but also on customers'
experiences with the service delivery process (Naser et al., 1999).
De Ruyter et al. (1997) summarized the conceptual gap between the two constructs as
the following: customer satisfaction is directly influenced by the intervening variables
of disconfirmation (the difference between perceptions and expectations), while
service quality is not; satisfaction is based on predictive expectation while service
quality is based on an ideal standard expectation; and the number of antecedents of
19
the two concepts differ considerably. Therefore, it is worthwhile to investigate the
relative importance of service quality dimensions to customers’ satisfaction.
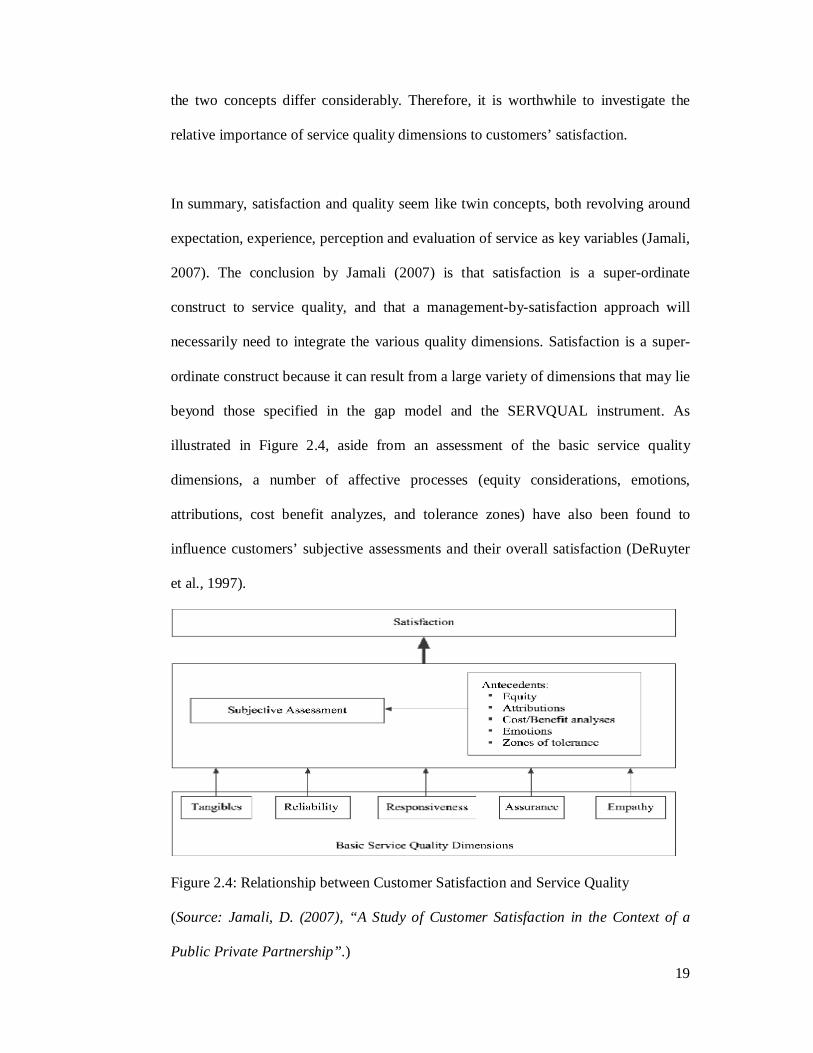
In summary, satisfaction and quality seem like twin concepts, both revolving around
expectation, experience, perception and evaluation of service as key variables (Jamali,
2007). The conclusion by Jamali (2007) is that satisfaction is a super-ordinate
construct to service quality, and that a management-by-satisfaction approach will
necessarily need to integrate the various quality dimensions. Satisfaction is a super-
ordinate construct because it can result from a large variety of dimensions that may lie
beyond those specified in the gap model and the SERVQUAL instrument. As
illustrated in Figure 2.4, aside from an assessment of the basic service quality
dimensions, a number of affective processes (equity considerations, emotions,
attributions, cost benefit analyzes, and tolerance zones) have also been found to
influence customers’ subjective assessments and their overall satisfaction (DeRuyter
et al., 1997).
Figure 2.4: Relationship between Customer Satisfaction and Service Quality
(Source: Jamali, D. (2007), “A Study of Customer Satisfaction in the Context of a
Public Private Partnership”.)
20
2.1.5 Recent Findings
Many practitioners and academicians in service quality aspects have recently focused
on how to improve online services to attract potential customers and on how to retain
current customers with the development and popularity of electronic channels.
Zeithaml (2002) has emphasized that companies should focus on online service
encompassing all cues and encounters that occur before, during, and after the
transactions.
It is important for online service providers to understand in depth what online
customers perceive to be the key dimensions of service quality and what impacts the
identified dimensions have on customers’ satisfaction. According to Cox and Dale
(2001), traditional service quality dimensions, such as competence, courtesy,
cleanliness, comfort, and friendliness, are not relevant in the context of online
retailing, whereas other factors, such as accessibility, communication, credibility, and
appearance, are critical to the success of online businesses.
Because electronic channels are a recently emerging field, little academic literature in
this field has addressed in-depth online systems quality. Online systems quality can be
divided into information systems quality and information quality. Information systems
quality refers to the quality of software development while information quality is
related to the accuracy, timeliness, currency, and reliability of information (DeLone
and McLean, 1992). To measure end-users’ satisfaction with information systems,
Doll and Torkzadeh (1988) have purified 13 items proposed by Baroudi and
Orlikowski (1988) into 12 items that gauge five quality dimensions influencing end-
user satisfaction: content, accuracy, format, ease of use, and timeliness.
21
Beyond the five attributes employed in the measurement scale, other attributes unique
to the Internet, such as security and privacy can also be considered important in
assessing online systems quality. Another important aspect of online systems is to
enable customers to function more independently and conduct transactions on their
own. As end-users, consumers often seek desired products/services information or
perform other activities through web sites. Thus, in this online market, customers are
essentially “self-served” much of the time. Basically, the Internet has created a new
form of relationship marketing that provides direct linkage between target customers
and service providers.
2.2 Corporate Image
A favorable image is considered as a critical aspect of an organization’s ability to
maintain its market position as image has been related to core aspects of
organizational success such as customer patronage. Corporate image has been
identified as an important factor in the overall evaluation of a firm (Bitner, 1990) and
is argued to be what comes to the mind of a customer when they hear the name of a
firm (Nguyen, 2006).
The theme “building the corporate image” has been referred to in the Market
Research Society Conference in March 1970 (Worcester, 1970), and in the Consumer
Market Research Handbook entitled simply “Corporate image research”. In these
papers the author defined the “corporate image” as “the net result of the interaction of
all experiences, impressions, beliefs, feelings and knowledge people have about a
company”.
22
The corporate image is based on what people associate with the company or all the
information (perceptions, inferences, and beliefs) about it that people hold (Rita,
2007). Some researchers use image and reputation as substitutes, others such as
Fombrun (1996) sees reputation as the esteem in a long-term perspective that the
company has, as opposed to image that can be more short-term in nature. Rita (2007)
proposed that image and reputation could be used as substitutes, since it is likely that
the early studies on corporate image would have used the concept “reputation” had
they been done today.
According to McInnis and Price (1987), the research on “image” field shows that
image is a process originating from ideas, feelings and the previous experience of an
organization that are recalled and transformed into metal pictures (Yuille &
Catchpole, 1977). As a rule, people are exposed to realities created by the
organization and may consciously or unconsciously select facts that are well suited
with their configuration of attitudes and beliefs. These facts are retained and later
retrieved from memory to reconstruct an image when the organization is brought to
mind. Dobni and Zinkhan (1990) conclude that image is a perceptual phenomenon
that is formed by rational and emotional interpretation and that has cognitive
components, the beliefs, and affective components, the feelings.
There are two principal components of corporate image according to Kennedy (1997):
functional and emotional. The functional component is related to those tangible
characteristics that can easily be measured, such as the physical environment offered
by the hotel; the emotional component is associated with those psychological
23
dimensions that are manifested by feelings and attitudes towards an organization (Jay
& Hui, 2007).
These feelings are derived from the numerous experiences with an organization and
from the processing of information on the attributes that constitute functional
indicators of image (Kennedy, 1977). Although the quality of service is “defined” by
the customer, but “created” by the employees, it is the “human factor” that holds the
ultimate balance of quality in service industries (Jay & Hui, 2007).
Researchers have found image to be a very complicated concept because it is more
than just the summing up of all the factual attributes of an organization. Image is
influenced by the interactions among all factual and emotional elements of an
organization in generating consumer’s impression and suggesting a “gestalt” view of
the firm’s image (Jay & Hui, 2007). Moreover, many studies have reported that the
organization’s ability to consistently offer superior service and the resulting customer
satisfaction has a strong positive influence on the firm’s image.
A growing number of service companies have embarked on a journey of positioning
through the communication channel (i.e. advertising and personal selling)
(Andreassen and Bredal, 1996), with the objective of building strong corporate
images in order to create relative attractiveness. This development is in line with
Lovelock (1984) who claims that:
(images) … are likely to play only a secondary role in customer choice
decisions unless competing services are perceived as virtually identical on
performance, price, and availability…
24
Consequently, we would expect that corporate image under current market conditions
will play an important role in both attracting and retaining customers.
An organization does not project a unique image rather; it may posses various images
that different according to specific groups, such as clients, employees and
shareholders, each of whom has different types of experiences and contacts with the
organization (Gray, 1986). Since incongruent perceptions can counteract favorable
impressions related to an organization’s image, the harmonization of activities is
consequently important (Nguyen & LeBlanc, 2001). Often related to symbols and
values, the building of institutional image is a lengthy process that can be improved
rapidly by technological breakthroughs and unexpected achievements or destroyed by
neglecting the needs and expectations of the various groups who interact with the
organization (Dichter, 1985; Herbig et al., 1994).
2.2.1 Corporate Image and Customer Satisfaction
According to Nguyen & LeBlanc, satisfaction has no significant direct effect on
corporate image. However, it contradicts with other findings that indicate that
corporate image is a function of the accumulated effect of satisfaction or
dissatisfaction (Bolton & Drew, 1991; Fornell, 1992). In other way, image acts as a
filter of satisfaction in a simplification of the decision process that was indicated in
the works of Weiner (1985) and Folkes (1998).
However, it can be seen that in the study of Nguyen & LeBlanc (1998), there is an
indirect effect on image through the perceived value of the service. It reinforces the
assertion of Barich & Kotler (1991) that a company has a strong image if the clients

25
believe that they receive good value in their transactions with the company.
Andreassen & Lindestad (1998) verified that corporate image has a string influence
on customer satisfaction, especially if the customer has little knowledge about the
service.
2.2.2 Recent Findings
The majority of existing empirical studies treated corporate reputation as a uni-
dimensional construct (e.g. Doney and Cannon, 1997), whereas more recent approach
recognize its multi-dimensional nature (e.g. Fombrun et al., 2000; Davies et al.,
2002). Fombrun et al. (2000) define corporate reputation as a “collective assessment
of a company’s ability to provide valued outcomes to a representative group of
stakeholders”. In this context, reputation can be taken to be the aggregate of the
perception of all relevant stakeholders. This might refer to the services, persons and
communicative activities of a company as well as the result over time of corporate
activity in the minds of the stakeholders.
Walsh, Dinnie & Widemann (2006) report that corporate reputation is rightly
regarded as a multidimensional construct, with a diverse range of stakeholders, the
current study focuses strictly on customer based corporate reputation (i.e. corporate
reputation as perceived by customers). Focusing on customers (as opposed to other
stakeholder groups) is in agreement with more recent work on customer reputation
and customer satisfaction that focuses on the stakeholder group of customers (Walsh
and Wiedmann, 2004). It is assumed that corporate reputation has a positive effect on
various commercially relevant economic and pre-economic dimensions.
26
However, Rose and Thomsen (2004) term the conventional wisdom that corporate
reputation has an impact on firm value – the market to book value of equity. Rose and
Thomsen contend that corporate financial performance affects reputation rather than
vice-versa. While not questioning that reputation is vital for the survival of an
organization in long-term basis, they argue that reputation may influence stock market
performance via profitability and growth rather than having a direct effect on the
stock markets.
2.3 Price
It is common knowledge that price influences a customer’s buying decision. Although
companies offering superior service levels are able to charge a slightly higher price
than their competitors are, the marginal difference is often modest and requires a
better than average performance on service quality (Gale, 1992), which then
jeopardizes the cost effectiveness.
Among the several factors that affect to customers’ buying behaviour, two important
ones are “price” and “quality of service” (Jacoby & Olson, 1977). This means that
there is trade-off between price and service quality (Tse, 2001) which is most often
materialized in terms of customer satisfaction. As such, price has been observed as an
important element affecting to customer satisfaction paradigm.
2.3.1 Price Sensitivity
Fornell et al. (1996) have stated that through satisfaction there can be increased or
decreased price sensitivity. At an aggregated level, price sensitivity is often used as a
synonym for price elasticity (Link, 1997). Sensitivity demand refers to how volume-
27
sensitive a product or a service is to price changes. Sensitivity represents a valuable
strategic tool in pricing (Tucker, 1966).
Price sensitivity on the individual adopter level appears to be equivalent to the
concept of price consciousness for a potential buyer of a product or service. Price
consciousness has been defined as “the degree to which he or she is unwilling to pay a
high price for a product and willing to refrain from buying a product whose price is
unacceptably high” (Monroe, 1990). Price consciousness is related to the price
acceptability level as well as to the width of latitude of price acceptability
(Lichtenstein et al., 1998). Individuals who are price conscious are generally not
willing to pay high prices for the product in question. Furthermore, the range of
acceptable price is relatively narrow for price conscious individuals (Link, 1997).
2.3.2 Price Acceptance
Measurements of consumer price acceptance represent a direct attempt to establish the
potential buyers' willingness to purchase as a function of various prices (Monroe,
1990). The level of acceptance can thus be defined as the maximum price, which a
buyer is prepared to pay for the product (Monroe, 1990). Several different methods
are suitable for determining the price that the consumer subjectively presumes to be
appropriate observations of the market, experimentation with prices and surveys
(either direct or indirect) of experts' or customers' opinions (Monroe, 1990).
Price acceptance is based on the assimilation-contrast theory (Sherif, 1963). This
theory suggests that a new stimulus encountered by an individual is judged against a
background of previous experience (reference scale) in the category. Subsequent
28
stimuli are judged in relation to a reference scale and this provides the basis for
comparisons and evaluations. The level of price acceptance can thus be defined as the
maximum price that a buyer is prepared to pay for the product or service (Monroe,
1990).
Marshall (1980) indicates that the excess of price that a customer would be willing to
pay, rather than go without having a thing, over what he actually pays is the economic
measure of his satisfaction surplus. It means that customers could have a greater price
acceptance for products or services providing greater satisfaction. In this field,
Anderson (1996) investigates whether the association between satisfaction and price
acceptance is positive or negative, as well as gauging the degree of association
between these two important constructs.
2.3.3 Price Perception
Price perception has made important contributions to understanding of consumer
behaviour (Kalyanaram and Winer, 1995). When a consumer plans to make a
purchase, the price perception process can be described as follows: if the selling price
of the brand is greater than the internal reference price, the selling price is perceived
negatively by the consumer. Conversely, if the product is being sold at a lower price
than what was expected to be paid, the selling price is perceived positively, thereby
increasing the consumer’s purchase intent (Kalwani and Yim, 1992).
Zeitham et al. (1990) have suggested that improving service quality in the eyes of
customers creates “true customers” through higher customer satisfaction. Although
Nagle and Holden (2002) believe that price merely represents the monetary value a
29
buyer must give to a seller as part of a purchase agreement, customers’ price
perception is closely related on their perception of quality, value and other beliefs.
It is more or less known how customers of mobile service perceive the charged prices
and what are the dynamics affecting to price perceptions. The perceived price is
formed from the bases of a customer’s experience about mobile services and in
comparison to prices of other optional service delivery channels.
2.3.4 Price Fairness
Garbarino and Slonim (2003) propose that fair price will always be lower than
expected price because consumers, without knowledge of the firm’s actual profit
margins, assume the firm is making a reasonable profit even at the lowest observed
price. It was found that both customers and firms compare the selling price with the
prices paid by other customers for the same products or services (Martins and
Monroe, 1994). To sum up, consumers evaluate the fairness of a quoted price by
making appropriate comparisons with other references, but also taking into account
situational circumstances (Beldona and Namasivayam, 2006).
Perceptions of customer value and perceptions of price fairness share the dimension
of price as a reference for comparison; the two perceptions are closely related.
Customer value is the customer’s assessment of what the customer actually receives
in benefits against what he or she sacrifices in terms of price and other non-monetary
resources. On the other hand, perceptions of price fairness assess what the customer
pays against what the company is making from the product or service. Therefore, as
customer value increases (decreases), it can be expected that customers’ perceptions
30
of price fairness will also increase (decrease). It is because there will be greater
(lower) distributive justice between the two.
2.3.5 Price and Customer Satisfaction
The marketing literature emphasizes price as an important factor of consumer
satisfaction, because whenever consumers evaluate the value of an acquired product
or service, they usually think of the price (Fornell, 1992; Cronin et al., 2000). As for
the relationship of price to satisfaction, Zeithaml and Bitner (1996) indicated that the
extent of satisfaction was subject to the factors of service quality, product quality,
price, situation, and personal factors.
However, price has not been fully investigated in previous empirical studies (Bei and
Chiao, 2001). According to Zeithaml (1988) price is something that must be sacrificed
to obtain certain kinds of products or services from consumers’ cognitive conception.
In other words, the lower the perceived price there will be the lower the perceived
sacrifice. In addition, a sense of price fairness should be generated. If customers view
a firm’s practices as unfair, negative consumer responses are likely to occur (Wirtz
and Kimes, 2007). Immediate attitudinal and affective responses include
dissatisfaction (Oliver and Swan, 1989), lower purchase intentions (Campbell, 1999),
heightened price consciousness and focus on the monetary sacrifice of a purchase
(Xia et al., 2004).
2.3.6 Recent Findings
Since the internet is becoming an important channel for commerce, organizations can
benefit from a multi-channel sales strategy. Multi-channel pricing strategy is
31
becoming a very important issue. Some of the studies specifically focus on the price
competition between online retailers and brick and mortar organizations. For instance,
Smith et al. (1999) conducted an empirical study to show that online prices for digital
products are 9-16 percent lower than traditional brick and mortar prices.
Dolan and Moon (2000) studied the pricing and market making on the internet and
found that it is optimal for the multi-channel organizations to use a different pricing
mechanism on different channels. Baker et al. (2001) and Kung et al. (2002) did a
research to show that the internet is not driving prices down and may help firms to
design better pricing strategies. Ancarani and Shankar (2004) did an empirical study
to reveal that multi-channel organizations have the highest prices and pure play e-
tailers may have the lowest prices if shipping costs are included.
2.4 Customer Satisfaction
With reference to the various relevant aspects of customer behavior, satisfaction
represents a central determinant from which come different types of influence on
other variables and the economic success of an organization. Customer satisfaction is
perceived as being a key driver of long-term relationships between suppliers and
buyers (Geyskens et al., 1999), as it is positively related to customer loyalty (Johnson
et al., 2001) and customer profitability (Zeithaml, 2000). Customer satisfaction has
become an important marketing metric in the last two decades.
Customer satisfaction is generally described as the full meeting of one’s expectations
(Oliver, 1980). Customer satisfaction is the feeling or attitude of a customer towards a
product or service after being used. Customer satisfaction is a major outcome of
32
marketing activity whereby it serves as a link between the various stages of consumer
buying behavior. If customers are satisfied with a particular service offering after its
use, then they are likely to engage in repeat purchase and try line extensions (East,
1997).
Giese and Cote (2000) suggest in their literature review that consumer satisfaction
comprises three basic components:
(1) the type of response, that is to say, whether the response is cognitive, affective or
conative, and its level of intensity, although those authors concluded from their
validation, carried out by means of group and personal interview data, that satisfaction
is a summary affective response which varies in intensity;
(2) the centre of interest or the subject on which the response is focused, which could
be based on an evaluation of product-related standards, product consumption
experiences and/or purchase-related attributes (e.g. salesperson); and
(3) the moment in time at which the evaluation is made, which may be before choice,
after choice, after consumption, after extended experience, or at just about any other
time.
Along with Giese and Cote’s suggestion, Halstead et al. (1994) consider satisfaction
as an affective response, focused on product performance compared to some pre-
purchase standard during or after consumption. Mano and Oliver (1993) establish that
satisfaction is an attitude or evaluative judgment varying along the hedonic continuum
focused on the product, which is evaluated after consumption. Fornell (1992)
identifies satisfaction as an overall evaluation based on the total purchase and
consumption experience focused on the perceived product or service performance
33
compared with pre-purchase expectations over time. Oliver (1997, 1999) regards
satisfaction as a fulfillment response or judgment, focused on product or service,
which is evaluated for one-time consumption or ongoing consumption.
Customer satisfaction is widely recognized as a key influence in the formation of
customers’ future purchase intentions (Taylor & Baker, 1994). Satisfied customers are
also likely to tell others about their favorable experiences and thus engage in positive
word of mouth advertising (Richens, 1983; File & Prince, 1992). While for
dissatisfied customers, they are likely to switch brands and engage in negative word
of mouth advertising. Levesque and McDougall (1996) confirmed that unsatisfactory
customer service leads to a drop in customer satisfaction and willingness to
recommend the service to a friend. This would in turn lead to an increase in the rate of
switching by customers.
Hence, the customer feels satisfied if the perceived performance exceeds a customer’s
expectations (or a positive disconfirmation). In contrast, if the perceived performance
unable to meet a customer’s expectations (or a negative disconfirmation), then the
customer feels dissatisfied. Churnchill & Surprenant (1982) reported that
disconfirmation positively affected satisfaction. That is, when customers perceived
the product performing better than expected, they became on more satisfied
(Churnchill & Suprenant, 1982).
2.4.1 Customer Satisfaction and Service Loyalty
Customer satisfaction is a central element in the marketing exchange process, because
it undoubtedly contributes to the success of service providers (Darian et al., 2001).
34
Furthermore, satisfaction is one of the essential factors to predict consumer behavior
and, more specifically, purchase repetition. Oliver (1997) defines loyalty as a deeply
held commitment to repeat purchases of a preferred product or service consistently in
the future, despite situational influences and marketing efforts (e.g. pricing policies)
having the potential to bring out change. The more consumers fulfill their
expectations during the purchase or service use, the higher the probability that
consumers will repeat purchase in the same establishment (Wong and Sohal, 2003).
Thus, customer satisfaction along with other antecedents is essential factors in order
to acquire loyal customers who would also recommend their regular product or
service provider to other customers. Many related empirical studies reported that
satisfied consumers demonstrate more loyal behavior (Gwinner et al., 1998; Henning-
Thurau et al., 2002). Therefore, consumer satisfaction leads to customer loyalty.
2.4.2 Recent Findings
Recent studies recognize that emotion is a core attribute in satisfaction and suggest
that customer satisfaction should include a separate emotional component (Cronin et
al., 2000). Stauss & Neuhaus (1997) argue that most satisfaction studies only focus on
the cognitive component and the omission of the affective (or emotional) component
is one of the main issues in satisfaction research.
According to Yu et al. (2001), it is important to note that emotional component is a
form of affect, and it is response to service delivery. In this context, “consumption
emotions are the affective responses to one’s perceptions of the series of attributes
that compose a product or service performance” (Dube & Menon, 2000). Such
35
emotions are usually intentional (have an object or referent) and are different to the
concept of mood, which is a generalized state induced by a variety of factors, and is
usually diffused and non-intentional (Bagozzi et al., 1999).
Emotions and mood (and attitudes) are all elements of a general category for mental
feeling processes, referred to as “affect” (Bagozzi et al., 1999). The emotional
component in the satisfaction judgment is therefore independent from the overall
affective sense present in the respondent at the time of the service (DeRutyer &
Bloemer, 1998). In summary, positive emotions [such as happiness, surprise, etc] may
lead an individual to share the positive experience with others, while negative
emotions [such as depression] may result in complaining behaviour (Bagozzi et al.,
1999; Liljander & Strandvik, 1997).
2.5 Service Loyalty
Customer loyalty has been largely treated by researchers as either repurchase
behaviour or repurchases behaviour combined with an attitudinal component. While
the first of these two approaches remains popular with services researchers, other
researchers have recognized the problems associated with treating loyalty as
repurchase behaviour exclusively because measures do not distinguish spuriously
loyal customers (Moulson, 1965). By focusing on purchase, shoppers who are
retained customers by default are aggregated with truly loyal customers who shop as a
positive choice (Denison and Knox, 1995).
Normally, customers are retained for long periods but without a genuine relationship
ever being developed. The problem with spurious loyalty is not alleviated by the

36
alternative approach of adding attitudinal components to repurchase behaviour. The
weakness of the repeat purchase with attitude model was demonstrated by Iacobucci
et al. (1994) as the attitude component is not unique in this form of additive model.
As oppose to the additive model, Blodgett et al. (1997) distinguish loyalty as a
psychological outcome and repurchase intentions as a behavioural outcome. It means
that a psychologically loyal customer may not intend to purchase from a service
provider because their circumstance prevent them (Barnes, 1997). Czepiel (1990) and
Kingstrom (1983) support this paradigm and argue that for loyalty to be treated as a
psychological construct. Oliver (1999) extends the notion of incorporating repeat
purchase with loyalty by suggesting that psychological strategies are needed to
achieve ultimate loyalty.
The relationship building between customers and service provider produces a sense of
ownership over the service with customers referring to “my accountant”, “my
hairdresser”, or “my mechanic” (Grabbott and Hogg, 1994). Bhattacharya et al.
(1995) found that membership of an organization “creates a sense of belongingness”.
Both Oliver (1999), and Crosby and Taylor (1983) stated that identification is linked
to the customer’s resistance to change. Crosby and Taylor (1983) argue that resistance
is maximized when the customer identifies strongly with the service provider and that
these values are important to the customer.
According to Oliver (1999), loyalty is an attained state of enduring preference. This
key role of preference is also supported by social identity theory which indicates that
group membership leads to consistent in-group favouritism because it boots self-
37
esteem (Lippa, 1990). When the customer identifies with the service provider’s
values, involvement or ego defence will maintain consistent in-group favouritism
(Crosby and Taylor, 1983). Loyal customers need to be seen as acting out of volition
(Barnes, 1997) in making their preferred choice.
Loyalty, with its high repeat patronage and high relative attitude, would obviously be
the ultimate goal for marketers. Raj (1985) found that firms with large market shares
also have larger groups of loyal consumers. Loyal customers are less motivated to
search for alternatives, they are more resistant to counter-persuasion from other
brands, and are more likely to pass along positive word-of-mouth communication
about the service to other consumers (Dick and Basu, 1994). Marketers with loyal
consumers can expect repeat patronage to remain high until competitors find a way to
close the gap in attitude among brands. Competition can close the gap in three main
ways (Dick and Basu, 1994). They can:
(1) try to reduce the differential advantage of the leading brand,
(2) increase the differentiation of their own brand, or
(3) encourage spurious loyalty from consumers.
2.5.1 Recent Findings
More recently, three-dimensional conceptualizations have been proposed where
loyalty includes a behavioral, attitudinal, and a cognitive. The majority of research in
marketing now represents loyalty as a multi-dimensional construct; however,
agreement on whether it has two or three dimensions is lacking.
38
Researchers are increasingly recognizing the importance of interpersonal relationships
that develop between service providers and service consumers (Bendapudi and Berry,
1997; Gwinner et al., 1998). A number of relational variables such as commitment,
closeness, and relationship quality have been empirically linked to a variety of service
loyalty-related outcomes such as repurchase intentions, advocacy, and consumers’
willingness to pay more (Hennig-Thurau et al., 2002).
Fournier’s (1998) ground-breaking work on brand relationships found utility in the
use of the interpersonal relationship literature to examine loyalty-related outcomes
with consumer durables. Because of the interpersonal nature of most services, it is
likely that this literature would provide theoretical guidance for the conceptualization
of service loyalty.
In sharp contrast to the increasingly complicated approaches to conceptualizing and
measuring loyalty, Reichheld (2003) has recently argued that it is possible for many
service firms to adequately assess loyalty using only one measure. That is
“willingness to recommend”. He reports that for many of the firms he studied, this
one indicator of loyalty was a strong predictor of a firms’ growth rate. In essence, his
results imply a uni-dimensional conceptualization of loyalty.
39
3.0 Research Methodology
This chapter outlines the methodology used for this study. Key topics of this chapter
include theoretical framework, methodologies, hypotheses, selection of measures,
sampling design, data collection procedures, and data analysis techniques.
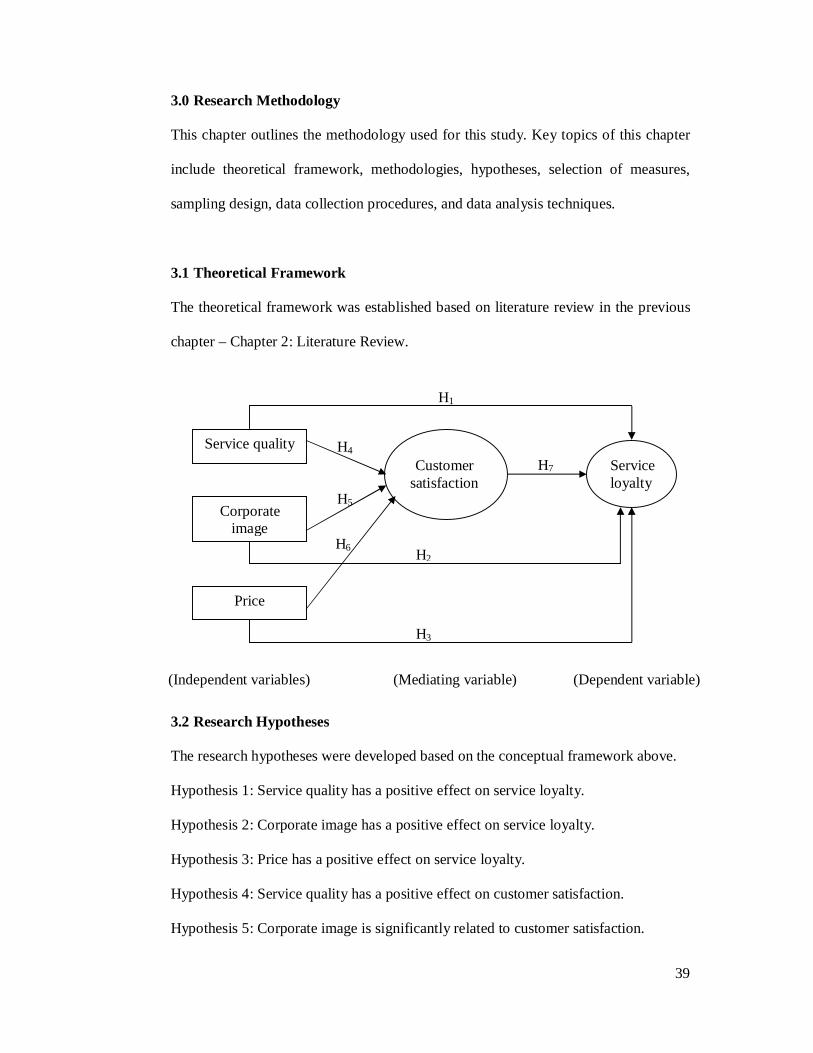
3.1 Theoretical Framework
The theoretical framework was established based on literature review in the previous
chapter – Chapter 2: Literature Review.
3.2 Research Hypotheses
The research hypotheses were developed based on the conceptual framework above.
Hypothesis 1: Service quality has a positive effect on service loyalty.
Hypothesis 2: Corporate image has a positive effect on service loyalty.
Hypothesis 3: Price has a positive effect on service loyalty.
Hypothesis 4: Service quality has a positive effect on customer satisfaction.
Hypothesis 5: Corporate image is significantly related to customer satisfaction.
(Independent variables) (Mediating variable) (Dependent variable)
H7
H6
H5
H4
H3
H1
H2
Service quality
Corporate image
Price
Customer satisfaction
Service loyalty
40
Hypothesis 6: The pricing plans are significantly related to customer satisfaction.
Hypothesis 7: Customer satisfaction has a positive effect on service loyalty.
Hypothesis 8: Customer satisfaction is the mediator of the relationship among service
quality, corporate image, and price and service loyalty.
3.3 Selection and Measures
The most frequent use of data collection is by way of questionnaires. It is used to
measure the past behaviour, and respondent characteristics (Kinnear & Tiylor, 1996).
It is very versatile and enables to gather wide range of information required for the
study. Chrinsnall (1997) defines that “questionnaire is a method of obtaining specific
information about a defined problem, so that the data, after analysis and
interpretation, result in better appreciation of the problem.”
The questionnaire designed for this research was formulated as closed-end questions
which were normally structured for respondents to select their choices of statement
from a list of questions presented to them. The popularity of the closed-end method
provides less effort by respondents to complete the questionnaire and it is easy for
analysis.
The questionnaire was divided into three sections. First section was on profiling of
telecommunication service provider. It stated number of mobile phone service
providers the respondent is using and to name the most frequently used network.
Second section was regarding perception towards telecommunication service
provider. It consisted of 52 items split between five instruments that each measured
service quality, corporate image, price, customer satisfaction and service loyalty.

41
Seven-point scales described at either end by “strongly agree” and “strongly disagree”
were used. The last section of the questionnaire represented demographic profile of
respondents.
One of the advantages of self-administered questionnaire is it can reach a
geographically dispersed sample simultaneously. In addition, respondents can fill up
questionnaire when they have time. Thus, there is a better chance that respondents
will take time to think about their replies. Extra effort was made to get as much
respondents as possible through distributing the questionnaire via email.
In addition to distributing questionnaire by hand and through email, respondents also
have a choice to participate in this research study via an internet link
(http://freeonlinesurveys.com/rendersurvey.asp?sid=apeh2b5rsplzvgi439982). This
facility is considered perfectly anonymous as the system unable to track who are the
respondents. Unlike email, the name of senders will appear on the email itself.
Internet facility spans through time and space barriers whereby respondents can
submit their completed questionnaire anytime without the physical appearance of the
researcher.
3.4 Sample Design
The research sample was selected from a range of demographic elements for
processing based on non probability sampling in Malaysia with focus point is on
Klang Valley area. Non probability sampling techniques are in which units of the
sample are selected on the basis of personal judgement or convenience; the
42
probability of any particular member of the population being chosen is unknown
(Zikmund, 1997).
The technique employed under non probability sampling for this study was
convenience sampling. Zikmund (1997) mentions that convenience sampling is the
sampling procedure of obtaining those people or units those are most conveniently
available. It is also called haphazard or accidental sampling. Researchers generally
use convenience samples to obtain a large number of completed questionnaires
quickly and economically. According to Hair (1998), the critical sample size for the
intended analysis is considered to be 200 replies. Hence, the pre-determine sample
size is 200.
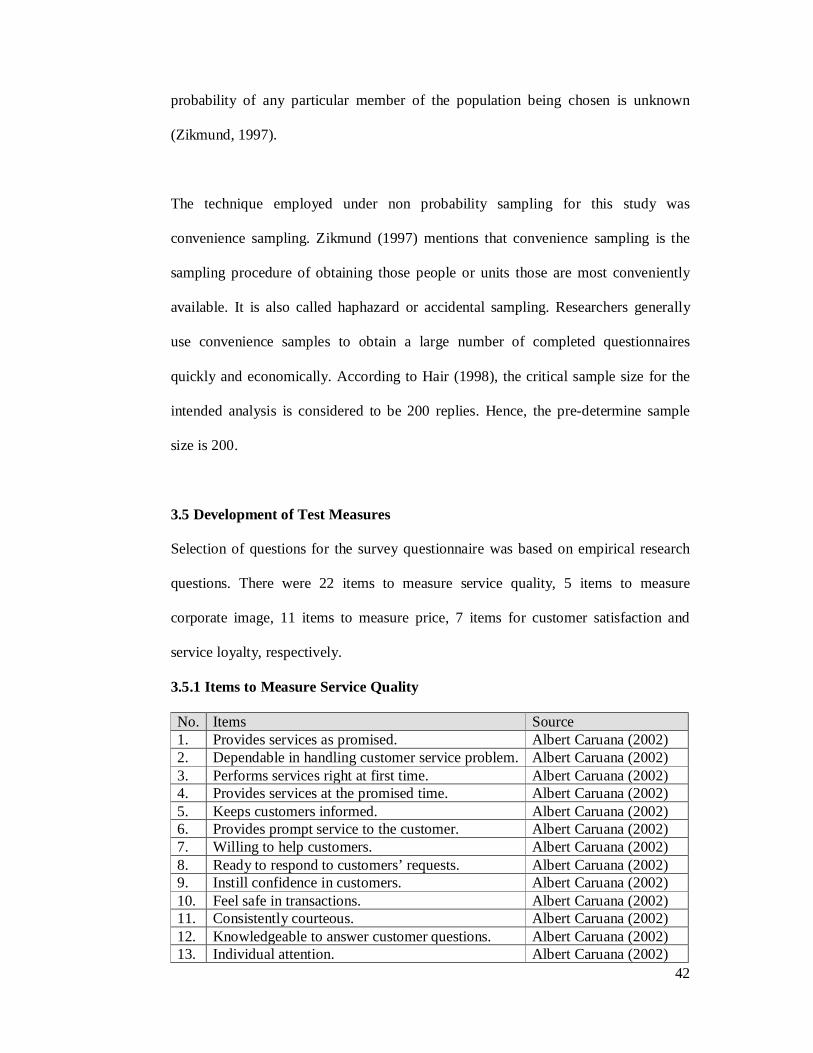
3.5 Development of Test Measures
Selection of questions for the survey questionnaire was based on empirical research
questions. There were 22 items to measure service quality, 5 items to measure
corporate image, 11 items to measure price, 7 items for customer satisfaction and
service loyalty, respectively.
3.5.1 Items to Measure Service Quality No. Items Source 1. Provides services as promised. Albert Caruana (2002) 2. Dependable in handling customer service problem. Albert Caruana (2002) 3. Performs services right at first time. Albert Caruana (2002) 4. Provides services at the promised time. Albert Caruana (2002) 5. Keeps customers informed. Albert Caruana (2002) 6. Provides prompt service to the customer. Albert Caruana (2002) 7. Willing to help customers. Albert Caruana (2002) 8. Ready to respond to customers’ requests. Albert Caruana (2002) 9. Instill confidence in customers. Albert Caruana (2002) 10. Feel safe in transactions. Albert Caruana (2002) 11. Consistently courteous. Albert Caruana (2002) 12. Knowledgeable to answer customer questions. Albert Caruana (2002) 13. Individual attention. Albert Caruana (2002)

43
3.5.1 (continued) Items to Measure Service Quality 14. Caring manner. Albert Caruana (2002) 15. Has best customers’ interest at heart. Albert Caruana (2002) 16. Understand the needs of customers. Albert Caruana (2002) 17. Opening hours convenient to customers.
Riichan Kayaman & Hnseyin Arasli (2007)
18. Modern looking equipment.
Riichan Kayaman & Hnseyin Arasli (2007)
19. Visually appealing physical facilities.
Riichan Kayaman & Hnseyin Arasli (2007)
20. Neat appearance. Albert Caruana (2002) 21. Visually appealing materials. Albert Caruana (2002) 22. Insists on error-free service. Albert Caruana (2002)
3.5.2 Items to Measure Corporate Image No. Items Source 1. Innovative and pioneering.
Nizar Souiden, Norizan M. Kassim, Heung-Ja Hong (2006)
2. Successful and self-confident.
Nizar Souiden, Norizan M. Kassim, Heung-Ja Hong (2006)
3. Persuasive.
Nizar Souiden, Norizan M. Kassim, Heung-Ja Hong (2006)
4. Does business in an ethical way.
Nizar Souiden, Norizan M. Kassim, Heung-Ja Hong (2006)
5. Open and responsive to consumers.
Nizar Souiden, Norizan M. Kassim, Heung-Ja Hong (2006)
3.5.3 Items to Measure Price No. Items Source 1. Continue if prices increase. Teemu Santonen (2007) 2. Willing to pay a higher price. Teemu Santonen (2007) 3. Switch to a competitor that offers better prices. Teemu Santonen (2007) 4. Paid a fair price. David Martin-Consuegra,
Arturo Molina and Agueda Esteban (2007)
5. Fair Pricing policy.
David Martin-Consuegra, Arturo Molina and Agueda Esteban (2007)
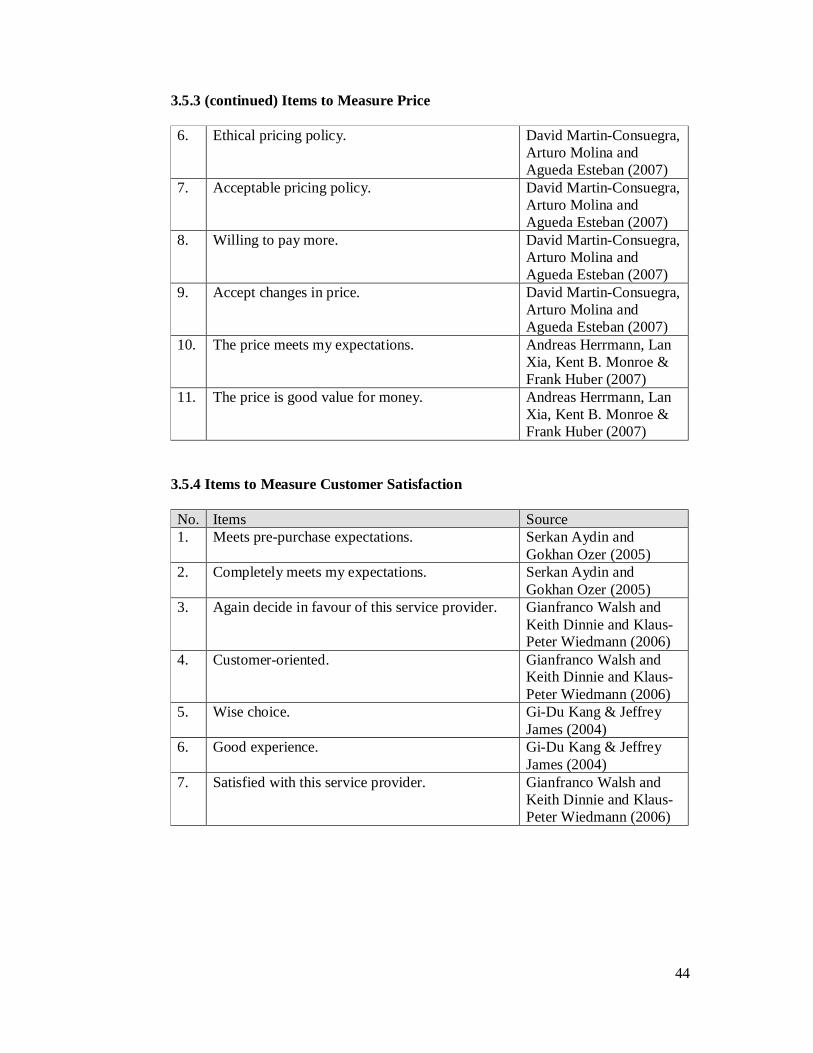
44
3.5.3 (continued) Items to Measure Price 6. Ethical pricing policy.
David Martin-Consuegra, Arturo Molina and Agueda Esteban (2007)
7. Acceptable pricing policy.
David Martin-Consuegra, Arturo Molina and Agueda Esteban (2007)
8. Willing to pay more. David Martin-Consuegra, Arturo Molina and Agueda Esteban (2007)
9. Accept changes in price. David Martin-Consuegra, Arturo Molina and Agueda Esteban (2007)
10. The price meets my expectations. Andreas Herrmann, Lan Xia, Kent B. Monroe & Frank Huber (2007)
11. The price is good value for money. Andreas Herrmann, Lan Xia, Kent B. Monroe & Frank Huber (2007)
3.5.4 Items to Measure Customer Satisfaction No. Items Source 1. Meets pre-purchase expectations.
Serkan Aydin and Gokhan Ozer (2005)
2. Completely meets my expectations. Serkan Aydin and Gokhan Ozer (2005)
3. Again decide in favour of this service provider. Gianfranco Walsh and Keith Dinnie and Klaus-Peter Wiedmann (2006)
4. Customer-oriented.
Gianfranco Walsh and Keith Dinnie and Klaus-Peter Wiedmann (2006)
5. Wise choice. Gi-Du Kang & Jeffrey James (2004)
6. Good experience. Gi-Du Kang & Jeffrey James (2004)
7. Satisfied with this service provider. Gianfranco Walsh and Keith Dinnie and Klaus-Peter Wiedmann (2006)
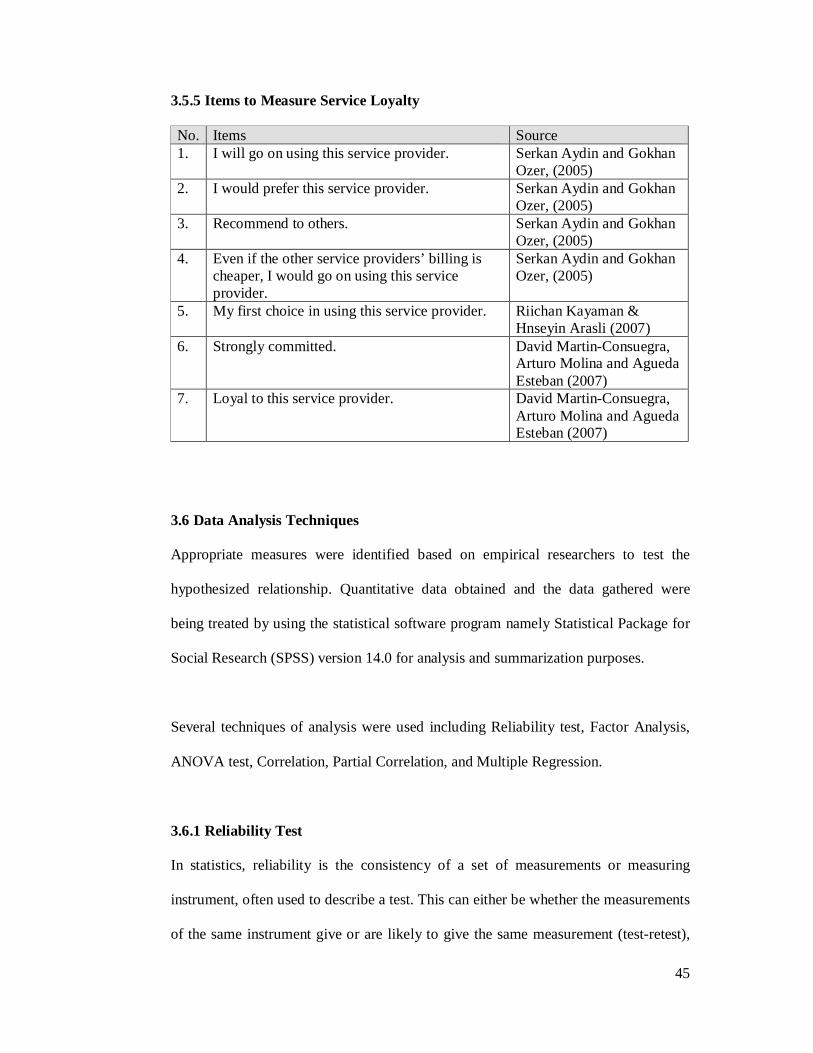
45
3.5.5 Items to Measure Service Loyalty No. Items Source 1. I will go on using this service provider.
Serkan Aydin and Gokhan Ozer, (2005)
2. I would prefer this service provider. Serkan Aydin and Gokhan Ozer, (2005)
3. Recommend to others. Serkan Aydin and Gokhan Ozer, (2005)
4. Even if the other service providers’ billing is cheaper, I would go on using this service provider.
Serkan Aydin and Gokhan Ozer, (2005)
5. My first choice in using this service provider. Riichan Kayaman & Hnseyin Arasli (2007)
6. Strongly committed.
David Martin-Consuegra, Arturo Molina and Agueda Esteban (2007)
7. Loyal to this service provider. David Martin-Consuegra, Arturo Molina and Agueda Esteban (2007)
3.6 Data Analysis Techniques
Appropriate measures were identified based on empirical researchers to test the
hypothesized relationship. Quantitative data obtained and the data gathered were
being treated by using the statistical software program namely Statistical Package for
Social Research (SPSS) version 14.0 for analysis and summarization purposes.
Several techniques of analysis were used including Reliability test, Factor Analysis,
ANOVA test, Correlation, Partial Correlation, and Multiple Regression.
3.6.1 Reliability Test
In statistics, reliability is the consistency of a set of measurements or measuring
instrument, often used to describe a test. This can either be whether the measurements
of the same instrument give or are likely to give the same measurement (test-retest),
46
or in the case of more subjective instruments, such as personality or trait inventories,
whether two independent assessors give similar scores. Reliability is inversely related
to random error (Coakes & Steed, 2007).
There are several different reliability coefficients. One of the most commonly used is
called Cronbach’s Alpha. Cronbach’s Alpha is based on the average correlation of
items within a test if the items are standardized. It has an important use as a measure
of the reliability of a psychometric instrument. It was first named as alpha by
Cronbach (1951), as he had intended to continue with further instruments. It is the
extension of an earlier version, the Kuder-Richardson Formula 20 (or KR-20), which
is the equivalent for dichotomous items.
3.6.2 Factor Analysis
According to Coakes & Steed (2007), Factor Analysis is a data reduction technique
used to reduce a large number of variables to a smaller set of underlying factors that
summarize the essential information contained in the variables. Factor Analysis is
more frequently used as an exploratory technique when to achieve the objective of
summarize the structure of a set of variables.
Coakes & Steed (2007) also mention that for testing a theory about the structure of a
particular domain, confirmatory Factor Analysis is appropriate. This technique is an
additional means of determining whether items are tapping into the same construct if
this technique is used to construct a reliable test.
47
3.6.3 ANOVA Test
In statistics, analysis of variance (ANOVA) is a collection of statistical models, and
their associated procedures, in which the observed variance is partitioned into
components due to different explanatory variables. The initial techniques of the
analysis of variance were developed by the statistician and geneticist R .A. Fisher in
the 1920s and 1930s, and is sometimes known as Fisher's ANOVA or Fisher's
analysis of variance.
The basic procedure is to derive two different estimates of population variance from
the data, then calculate a static from the ratio of these two estimates (Coakes & Steed,
2007). One of these estimates (between-groups variance) is a measure of the effect of
the independent variable combined with error variance while within-group variance is
a measure of error variance by itself. A significant F-ratio indicates that the
population means are probably not all equal.
3.6.4 Correlation
In statistic, correlation, (often measured as a correlation coefficient), indicates the
strength and direction of a linear relationship between two random variables. In
general statistical usage, correlation or co-relation refers to the departure of two
variables from independence. In this broad sense there are several coefficients,
measuring the degree of correlation, adapted to the nature of data (Coakes & Steed,
2007).
A number of different coefficients are used for different situations as mentioned by
Coakes & Steed (2007). The best known is the Person product-moment correlation
48
coefficient, which is obtained by dividing the covariance of the two variables by the
product of their standard deviations. Pearson's correlation reflects the degree of linear
relationship between two variables. It ranges from +1 to -1.
A correlation of +1 means that there is a perfect positive linear relationship between
variables. A correlation of -1 means that there is a perfect negative linear relationship
between variables. A correlation of 0 means there is no linear relationship between the
two variables. Correlations are rarely if ever 0, 1, or -1. A certain outcome could
indicate whether correlations are negative or positive.
3.6.5 Partial Correlation
Partial correlation provides a single measure of linear association between two
variables while adjusting for the effects of one or more additional variables (Coakes
& Steed, 2007). The partial correlation represents the actual importance of attribute,
with the effect of a set of controlling random variables removed.
3.6.6 Multiple Regression
According to Coakes & Steed (2007), multiple regression is an extension of bivariate
correlation. They state that the result of regression is an equation that represents the
best prediction of a dependent variable from several independent variables.
Regression analysis is used when independent variables are correlated with one
another and with the dependent variable.
49
3.7 Pilot Test
Before the official distribution of questionnaire to the population, a pilot test activity
has been deployed. Pilot test involves administering a questionnaire to a small group
of respondents to detect ambiguity or bias in the questions or to iron out fundamental
problems in the instructions or administrative procedure (Zikmund, 1997). Pilot test
also used to measure the reliability of those questions stated in questionnaire.
According to Zikmund (1997), reliability is the degree to which measures are free
from random error and therefore yield consistent results.
Usually the questionnaire is tried out on a group selected on a convenience basis and
similar in makeup to the one that ultimately will be sampled later. Pilot test allows the
researchers to determine whether respondents have any difficulty in understanding the
questionnaire or if there are any ambiguous or biased questions.
A total of 50 questionnaires have been sent out to test the level of reliability. The pilot
test exercise gathered 33 respondents replies. Reliability was measured through an
examination of Cronbach’s Alpha coefficients. For scale acceptability, Nunnally
(1978) suggested should be over 0.7. Overall Cronbach’s Alpha coefficients were
found at 0.917 and which exceed the threshold value, conforming to Nunnally’s
(1978) criterion.
Although the overall Cronbach’s Alpha coefficients were found at 0.917, some
questions have been amended as per the comments from the respondents. Questions
have been reviewed to eliminate bias and ambiguity before the distribution to the
population.

50
4.0 Research Result
This section first describes the respondents’ demographic profiles, and provides
statistical results of the variables described. It follows by hypotheses testing and
summary of the result findings.
4.1 Respondents’ Demographic Profiles
241 replies were received for the survey. Respondents were almost equally split
between males (52.7%) and female (47.3%). From the total replies, 66% of
respondents were Chinese, followed by Malay (26.1%), Indian (6.6%), and other
ethnic group (1%). However, there were two missing values for ethnic group, which
represented 0.8% of the total respondents.
The above ethnic group result did not represent the overall population of Malaysia as
the survey was conducted based on convenience sampling. It depends on willingness
of respondents to participate in this study and the convenience to seek participation
from respondents.
The majority (45.6%) of the respondents were between 21 and 30 years old. It
followed by age group between 31 and 40 years old (38.2%). The minority (0.8%) of
the respondents were above 50-year-old. There was 0.4% of missing value in ethnic
group whereby a respondent did not indicate the age group.
Majority of the respondents were single which represented 55.6% of the total
respondents. Only one respondent indicated that he or she has divorced. The majority

51
were executive (44.0%) and managerial (21.6%) level, which in line with the
educational backgrounds as most of them (73.9%) have obtained tertiary education.
64.7% of respondents were currently using only one telecommunication service
provider. Only 13 of respondents (or 5.4%) using more than two service providers.
The most frequently used network among respondents was Maxis (64.3%), followed
by Digi (23.2%) and Celcom (11.6%) while 0.8% of respondents did not answer
which is their most frequently used network.
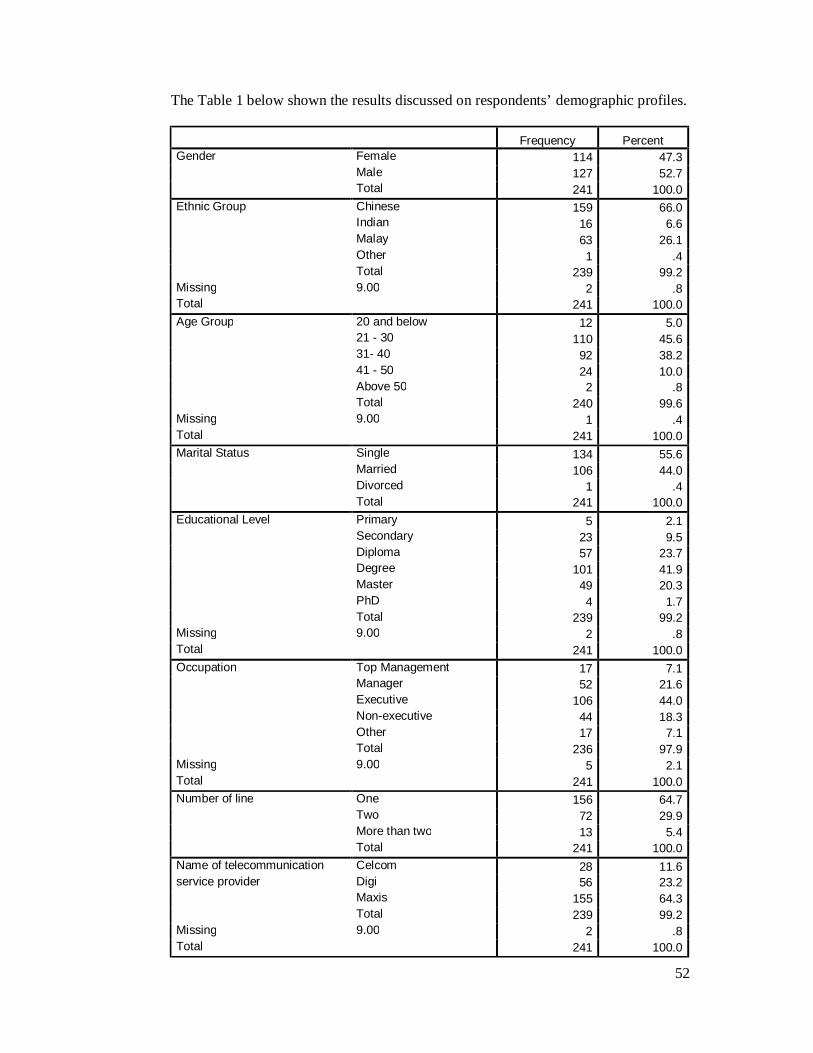
52
The Table 1 below shown the results discussed on respondents’ demographic profiles.
Frequency Percent Gender Female 114 47.3 Male 127 52.7 Total 241 100.0 Ethnic Group Chinese 159 66.0 Indian 16 6.6 Malay 63 26.1 Other 1 .4 Total 239 99.2 Missing 9.00 2 .8 Total 241 100.0 Age Group 20 and below 12 5.0 21 - 30 110 45.6 31- 40 92 38.2 41 - 50 24 10.0 Above 50 2 .8 Total 240 99.6 Missing 9.00 1 .4 Total 241 100.0 Marital Status Single 134 55.6 Married 106 44.0 Divorced 1 .4 Total 241 100.0 Educational Level Primary 5 2.1 Secondary 23 9.5 Diploma 57 23.7 Degree 101 41.9 Master 49 20.3 PhD 4 1.7 Total 239 99.2 Missing 9.00 2 .8 Total 241 100.0 Occupation Top Management 17 7.1 Manager 52 21.6 Executive 106 44.0 Non-executive 44 18.3 Other 17 7.1 Total 236 97.9 Missing 9.00 5 2.1 Total 241 100.0 Number of line One 156 64.7 Two 72 29.9 More than two 13 5.4 Total 241 100.0 Name of telecommunication Celcom 28 11.6 service provider Digi 56 23.2 Maxis 155 64.3 Total 239 99.2 Missing 9.00 2 .8 Total 241 100.0

53
4.2 Analysis of Measures
4.2.1 Reliability Test
A reliability analyses was conducted to each variable of the instrument. The reliability
of the measures was examined through the calculation of Cronbach’s alpha
coefficients. For scale acceptability, Hair et al. (1998) suggested that Cronbach’s
alpha coefficient of construct is 0.6 if each domain obtains the value 0.6; it means that
the items in each domain are understood by most of the respondents.
On the other hand, if the findings are far from the expected value of 0.6, this might be
caused by respondents’ different perception toward each item of the domain. The
corrected item correlation at 0.3 and above is accepted as a good item to explain a
domain (Hair et al., 1998).
The Cronbach’s alpha and correlation value are reported as follow. Service quality
yield Cronbach’s alpha = .971, corporate image yield Cronbach’s alpha = .888, the
Cronbach’s alpha for price was at .874, Cronbach’s alpha for customer satisfaction
was at .920, and Cronbach’s alpha for service loyalty was at .918. Please refer to
Table 3: Factor Analysis and Reliability for more details.
4.2.2 Factor Analysis
KMO and Bartlett's Test
Bartlett’s test of sphericity is significant for all domains. The Kaiser-Meyer-Olkin
measure of sampling adequacy is greater than .6 for all domains with a value of .953
for service quality, .824 for corporate image, .886 for price, .891 for customer
satisfaction, and .892 for service loyalty.
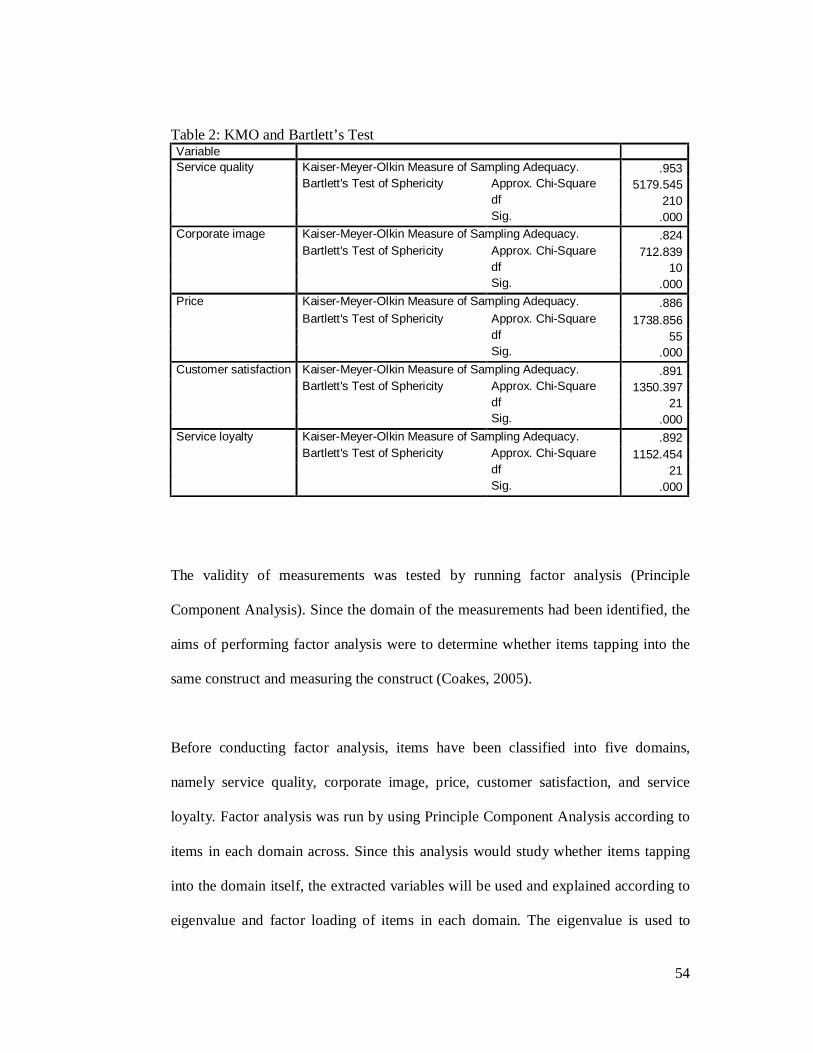
54
Table 2: KMO and Bartlett’s Test Variable Service quality Kaiser-Meyer-Olkin Measure of Sampling Adequacy. .953 Bartlett's Test of Sphericity Approx. Chi-Square 5179.545 df 210 Sig. .000 Corporate image Kaiser-Meyer-Olkin Measure of Sampling Adequacy. .824 Bartlett's Test of Sphericity Approx. Chi-Square 712.839 df 10 Sig. .000 Price Kaiser-Meyer-Olkin Measure of Sampling Adequacy. .886 Bartlett's Test of Sphericity Approx. Chi-Square 1738.856 df 55 Sig. .000 Customer satisfaction Kaiser-Meyer-Olkin Measure of Sampling Adequacy. .891 Bartlett's Test of Sphericity Approx. Chi-Square 1350.397 df 21 Sig. .000 Service loyalty Kaiser-Meyer-Olkin Measure of Sampling Adequacy. .892 Bartlett's Test of Sphericity Approx. Chi-Square 1152.454 df 21 Sig. .000
The validity of measurements was tested by running factor analysis (Principle
Component Analysis). Since the domain of the measurements had been identified, the
aims of performing factor analysis were to determine whether items tapping into the
same construct and measuring the construct (Coakes, 2005).
Before conducting factor analysis, items have been classified into five domains,
namely service quality, corporate image, price, customer satisfaction, and service
loyalty. Factor analysis was run by using Principle Component Analysis according to
items in each domain across. Since this analysis would study whether items tapping
into the domain itself, the extracted variables will be used and explained according to
eigenvalue and factor loading of items in each domain. The eigenvalue is used to
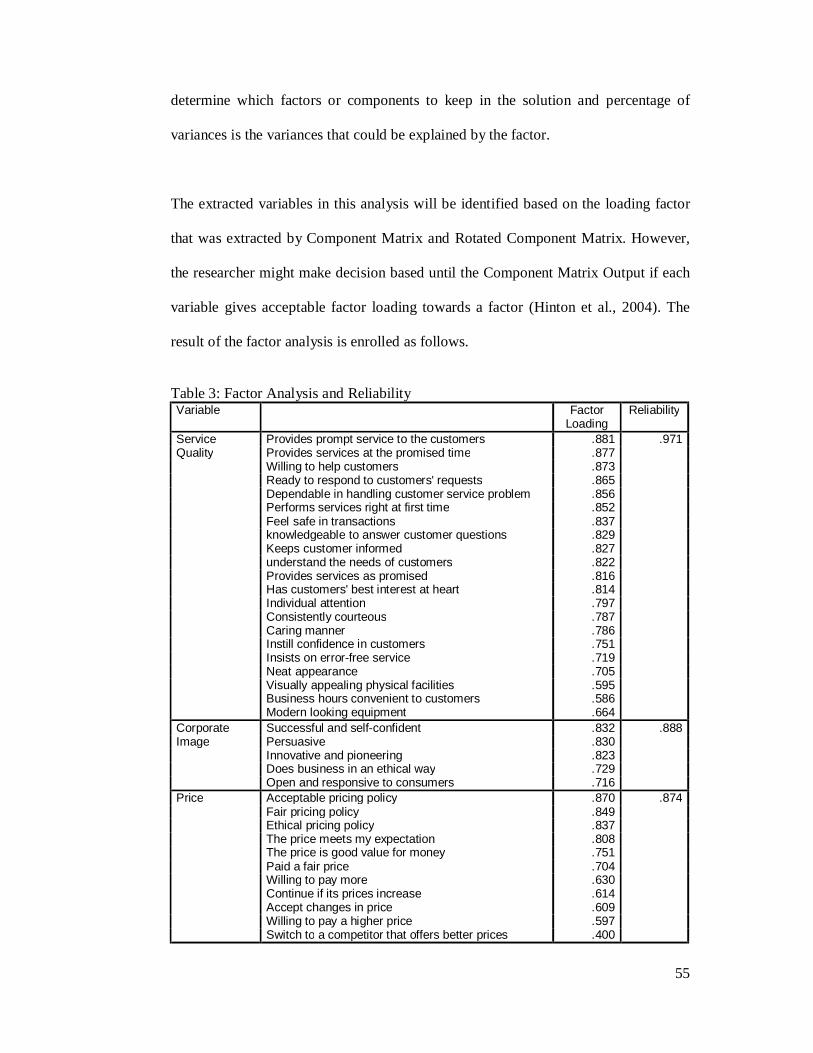
55
determine which factors or components to keep in the solution and percentage of
variances is the variances that could be explained by the factor.
The extracted variables in this analysis will be identified based on the loading factor
that was extracted by Component Matrix and Rotated Component Matrix. However,
the researcher might make decision based until the Component Matrix Output if each
variable gives acceptable factor loading towards a factor (Hinton et al., 2004). The
result of the factor analysis is enrolled as follows.
Table 3: Factor Analysis and Reliability Variable
Factor
Loading Reliability
Service Provides prompt service to the customers .881 .971 Quality Provides services at the promised time .877 Willing to help customers .873 Ready to respond to customers' requests .865 Dependable in handling customer service problem .856 Performs services right at first time .852 Feel safe in transactions .837 knowledgeable to answer customer questions .829 Keeps customer informed .827 understand the needs of customers .822 Provides services as promised .816 Has customers' best interest at heart .814 Individual attention .797 Consistently courteous .787 Caring manner .786 Instill confidence in customers .751 Insists on error-free service .719 Neat appearance .705 Visually appealing physical facilities .595 Business hours convenient to customers .586 Modern looking equipment .664 Corporate Successful and self-confident .832 .888 Image Persuasive .830 Innovative and pioneering .823 Does business in an ethical way .729 Open and responsive to consumers .716 Price Acceptable pricing policy .870 .874 Fair pricing policy .849 Ethical pricing policy .837 The price meets my expectation .808 The price is good value for money .751 Paid a fair price .704 Willing to pay more .630 Continue if its prices increase .614 Accept changes in price .609 Willing to pay a higher price .597 Switch to a competitor that offers better prices .400
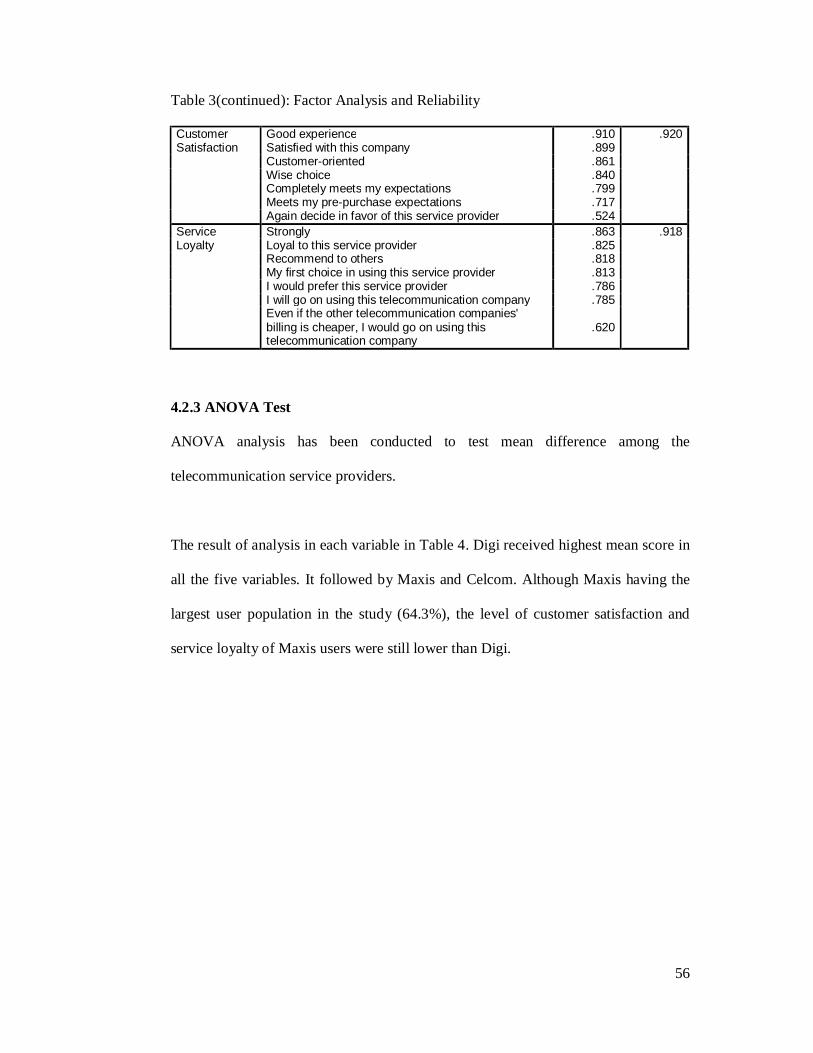
56
Table 3(continued): Factor Analysis and Reliability
Customer Good experience .910 .920 Satisfaction Satisfied with this company .899 Customer-oriented .861 Wise choice .840 Completely meets my expectations .799 Meets my pre-purchase expectations .717 Again decide in favor of this service provider .524 Service Strongly .863 .918 Loyalty Loyal to this service provider .825 Recommend to others .818 My first choice in using this service provider .813 I would prefer this service provider .786 I will go on using this telecommunication company .785 Even if the other telecommunication companies'
billing is cheaper, I would go on using this telecommunication company
.620
4.2.3 ANOVA Test
ANOVA analysis has been conducted to test mean difference among the
telecommunication service providers.
The result of analysis in each variable in Table 4. Digi received highest mean score in
all the five variables. It followed by Maxis and Celcom. Although Maxis having the
largest user population in the study (64.3%), the level of customer satisfaction and
service loyalty of Maxis users were still lower than Digi.
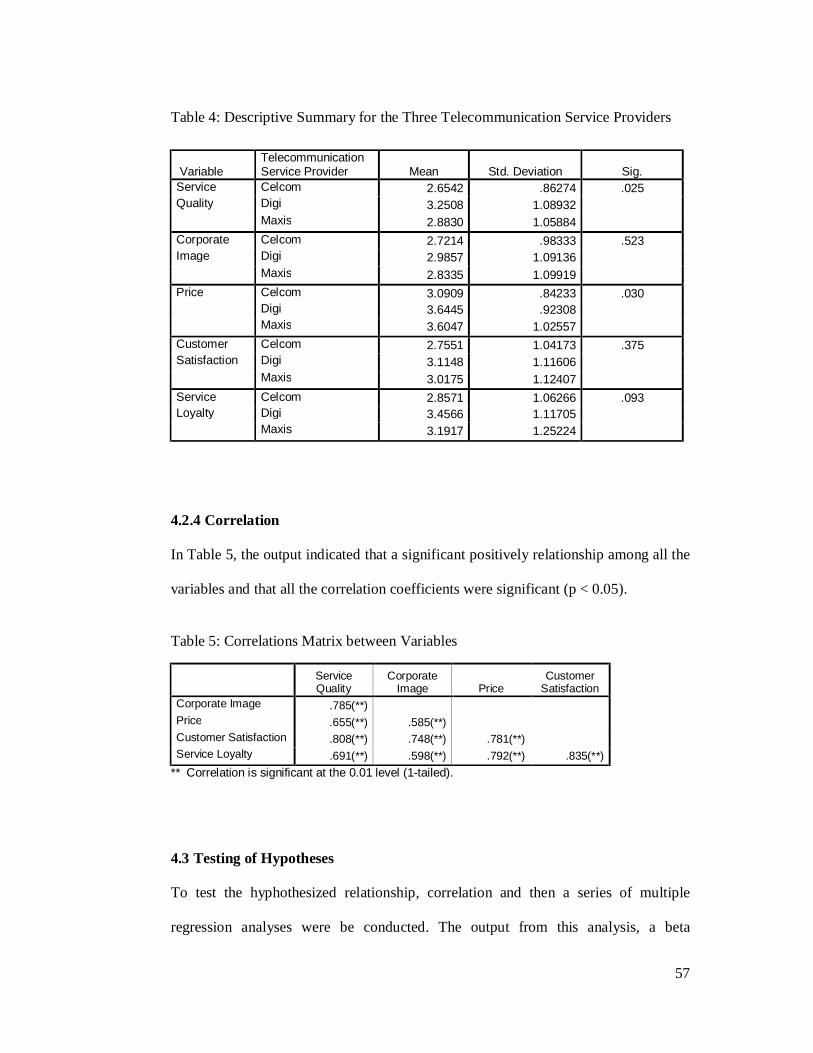
57
Table 4: Descriptive Summary for the Three Telecommunication Service Providers
4.2.4 Correlation
In Table 5, the output indicated that a significant positively relationship among all the
variables and that all the correlation coefficients were significant (p < 0.05).
Table 5: Correlations Matrix between Variables
Service Quality
Corporate Image Price
Customer Satisfaction
Corporate Image .785(**) Price .655(**) .585(**) Customer Satisfaction .808(**) .748(**) .781(**) Service Loyalty .691(**) .598(**) .792(**) .835(**)
** Correlation is significant at the 0.01 level (1-tailed).
4.3 Testing of Hypotheses
To test the hyphothesized relationship, correlation and then a series of multiple
regression analyses were be conducted. The output from this analysis, a beta
Variable Telecommunication Service Provider Mean Std. Deviation Sig.
Service Celcom 2.6542 .86274 .025 Quality Digi 3.2508 1.08932 Maxis 2.8830 1.05884 Corporate Celcom 2.7214 .98333 .523 Image Digi 2.9857 1.09136 Maxis 2.8335 1.09919 Price Celcom 3.0909 .84233 .030 Digi 3.6445 .92308 Maxis 3.6047 1.02557 Customer Celcom 2.7551 1.04173 .375 Satisfaction Digi 3.1148 1.11606 Maxis 3.0175 1.12407 Service Celcom 2.8571 1.06266 .093 Loyalty Digi 3.4566 1.11705 Maxis 3.1917 1.25224
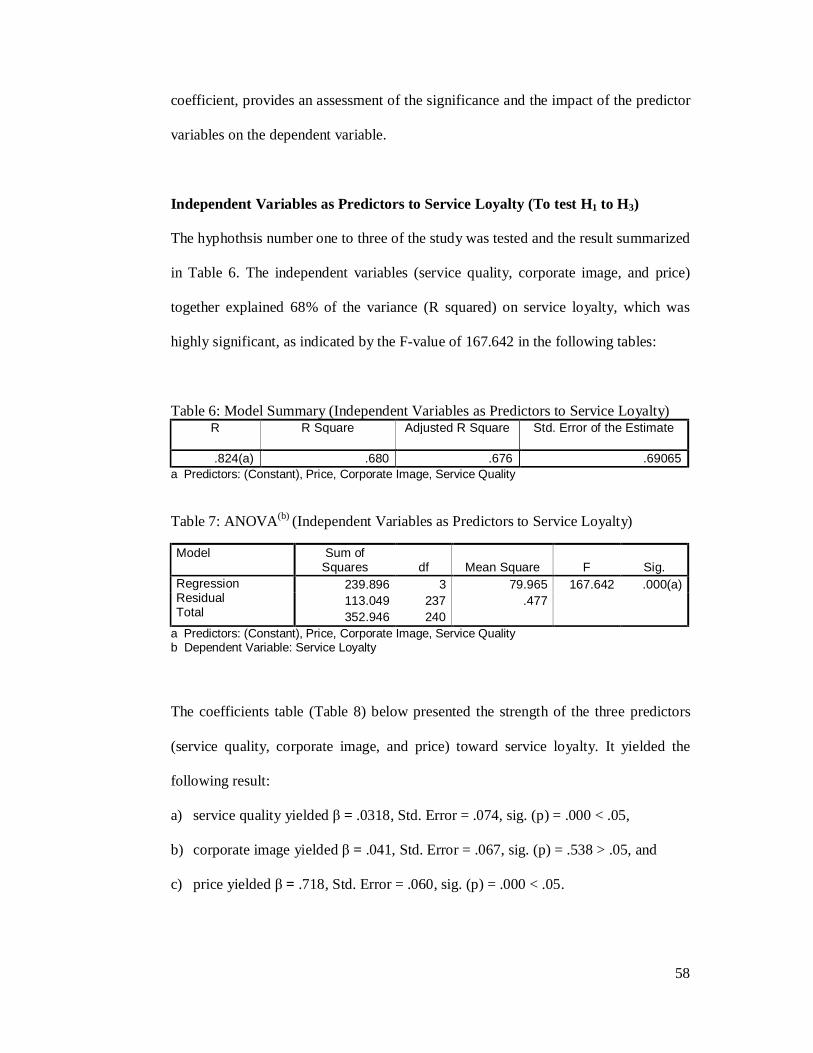
58
coefficient, provides an assessment of the significance and the impact of the predictor
variables on the dependent variable.
Independent Variables as Predictors to Service Loyalty (To test H1 to H3)
The hyphothsis number one to three of the study was tested and the result summarized
in Table 6. The independent variables (service quality, corporate image, and price)
together explained 68% of the variance (R squared) on service loyalty, which was
highly significant, as indicated by the F-value of 167.642 in the following tables:
Table 6: Model Summary (Independent Variables as Predictors to Service Loyalty) R R Square Adjusted R Square Std. Error of the Estimate
.824(a) .680 .676 .69065 a Predictors: (Constant), Price, Corporate Image, Service Quality Table 7: ANOVA(b) (Independent Variables as Predictors to Service Loyalty) Model
Sum of Squares df Mean Square F Sig.
Regression Residual Total
239.896 3 79.965 167.642 .000(a) 113.049 237 .477 352.946 240
a Predictors: (Constant), Price, Corporate Image, Service Quality b Dependent Variable: Service Loyalty
The coefficients table (Table 8) below presented the strength of the three predictors
(service quality, corporate image, and price) toward service loyalty. It yielded the
following result:
a) service quality yielded β = .0318, Std. Error = .074, sig. (p) = .000 < .05,
b) corporate image yielded β = .041, Std. Error = .067, sig. (p) = .538 > .05, and
c) price yielded β = .718, Std. Error = .060, sig. (p) = .000 < .05.

59
Table 8: Coefficients(a) (Independent Variables as Predictors to Service Loyalty)
Unstandardized Coefficients
Standardized Coefficients t Sig.
B Std. Error Beta (Constant) -.396 .168 -2.355 .019 Service Quality .318 .074 .276 4.288 .000
Corporate Image .041 .067 .037 .617 .538
Price .718 .060 .589 11.965 .000 a Dependent Variable: Service Loyalty
Independent Variables as Predictors to Customer Satisfaction (To test H4 to H6)
The hyphothsis number four to six of the study was tested and the result summarized
in Table 9. The independent variables (service quality, corporate image, and price)
together explained 78.2% of the variance (R squared) in customer satisfaction, which
was highly significant, as indicated by the F-value of 282.858 in Table 10.
Table 9: Model Summary (Independent Variables as Predictors to Customer Satisfaction)
R R Square Adjusted R Square
Std. Error of the Estimate
.884(a) .782 .779 .52428 a Predictors: (Constant), Price, Corporate Image, Service Quality Table 10: ANOVA(b) (Independent Variables as Predictors to Customer Satisfaction)
Model Sum of
Squares df Mean Square F Sig. Regression 233.244 3 77.748 282.858 .000(a) Residual 65.143 237 .275 Total 298.388 240
a Predictors: (Constant), Price, Corporate Image, Service Quality b Dependent Variable: Customer Satisfaction

60
The coefficients table (Table 11) below presented the strength of the three predictors
(service quality, corporate image, and price) toward customer satisfaction. The
multiple regression shown values of contribution of each predictor as follow:
a) service quality yielded β = .383, Std. Error = .056, sig. (p) = .00 < .05,
b) corporate image yielded β = .228, Std. Error = .051, sig. (p) = .00 < .05, and
c) price yielded β = .465, Std. Error = .046, sig. (p) = .00 < .05.
Table 11: Coefficients(a) (Independent Variables as Predictors to Customer Satisfaction)
Model
Unstandardized Coefficients
Standardized Coefficients t Sig. Correlations
B Std. Error Beta
Zero-order Partial Part
(Constant) -.419 .128 -3.289 .001 Service Quality .383 .056 .363 6.814 .000 .808 .405 .207
Corporate Image .228 .051 .221 4.458 .000
Price .465 .046 .414 10.196 .000 .781 .552 .309 a Dependent Variable: Customer Satisfaction
Partial Correlation
Partial correlation provides a single measure of linear association between two
variables while adjusting for the effects of one or more additional variables (Coakes
& Steed, 2007). The partial correlation represents the actual importance of attribute,
with the effect of a set of controlling random variables removed. It is used to test the
trade-off relationship between price and service quality in term of customer
satisfaction.
When corporate image and price were entered as the controlling variables, a
significant positive relationship existed between service quality and customer
satisfaction (r = .405, p < .05). However, it is interesting to note that controlling for
corporate image and price did lower the strength of the relationship between service
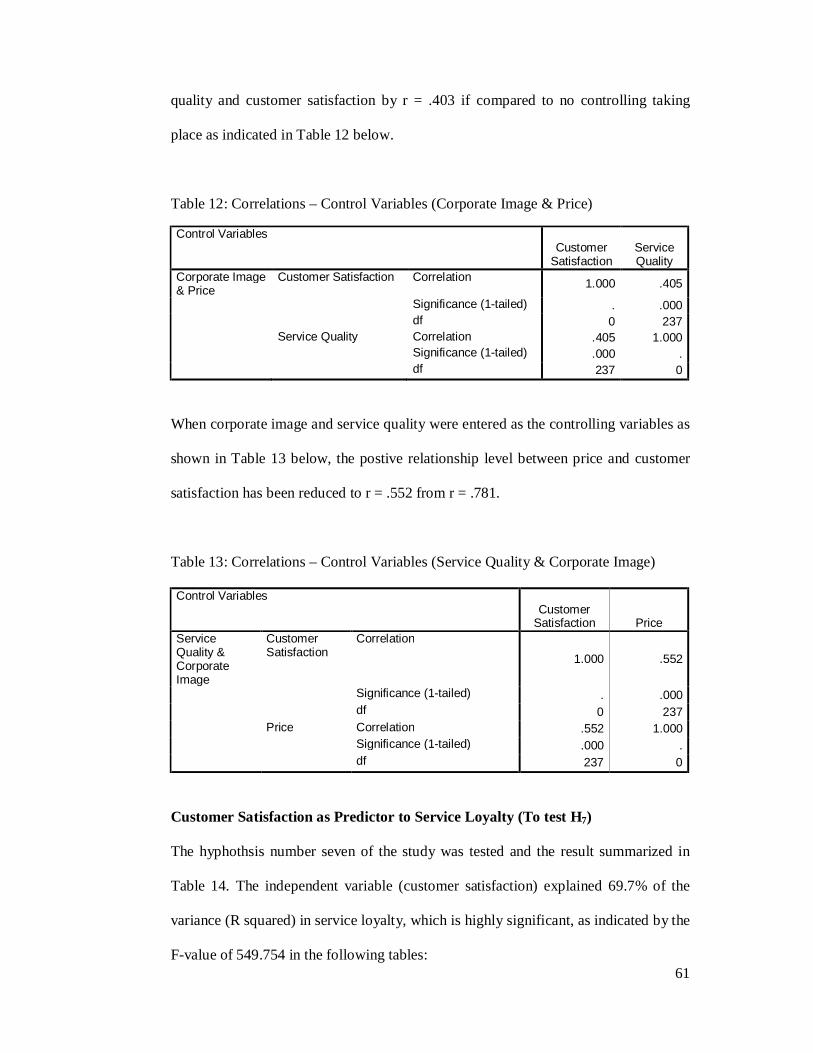
61
quality and customer satisfaction by r = .403 if compared to no controlling taking
place as indicated in Table 12 below.
Table 12: Correlations – Control Variables (Corporate Image & Price) Control Variables
Customer Satisfaction
Service Quality
Corporate Image & Price
Customer Satisfaction Correlation 1.000 .405
Significance (1-tailed) . .000 df 0 237 Service Quality Correlation .405 1.000 Significance (1-tailed) .000 . df 237 0
When corporate image and service quality were entered as the controlling variables as
shown in Table 13 below, the postive relationship level between price and customer
satisfaction has been reduced to r = .552 from r = .781.
Table 13: Correlations – Control Variables (Service Quality & Corporate Image)
Control Variables
Customer Satisfaction Price
Service Quality & Corporate Image
Customer Satisfaction
Correlation
1.000 .552
Significance (1-tailed) . .000 df 0 237 Price Correlation .552 1.000 Significance (1-tailed) .000 . df 237 0
Customer Satisfaction as Predictor to Service Loyalty (To test H7)
The hyphothsis number seven of the study was tested and the result summarized in
Table 14. The independent variable (customer satisfaction) explained 69.7% of the
variance (R squared) in service loyalty, which is highly significant, as indicated by the
F-value of 549.754 in the following tables:
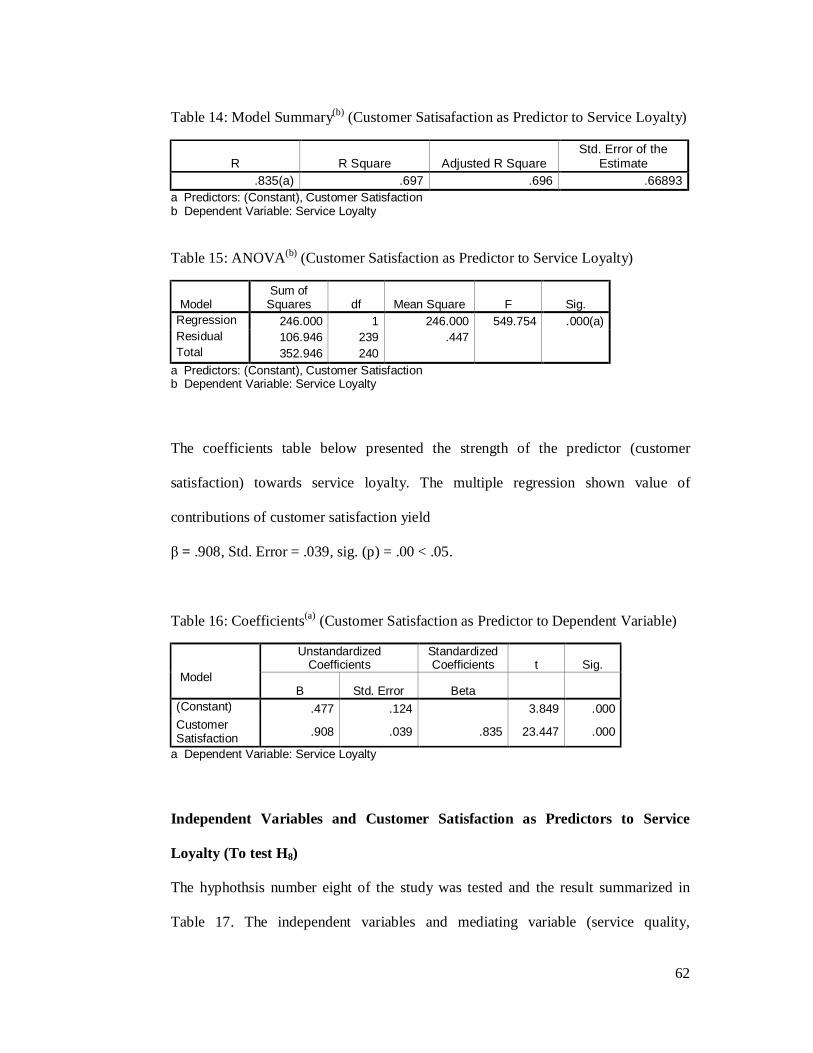
62
Table 14: Model Summary(b) (Customer Satisafaction as Predictor to Service Loyalty)
R R Square Adjusted R Square Std. Error of the
Estimate .835(a) .697 .696 .66893
a Predictors: (Constant), Customer Satisfaction b Dependent Variable: Service Loyalty Table 15: ANOVA(b) (Customer Satisfaction as Predictor to Service Loyalty)
Model Sum of
Squares df Mean Square F Sig. Regression 246.000 1 246.000 549.754 .000(a) Residual 106.946 239 .447 Total 352.946 240
a Predictors: (Constant), Customer Satisfaction b Dependent Variable: Service Loyalty
The coefficients table below presented the strength of the predictor (customer
satisfaction) towards service loyalty. The multiple regression shown value of
contributions of customer satisfaction yield
β = .908, Std. Error = .039, sig. (p) = .00 < .05.
Table 16: Coefficients(a) (Customer Satisfaction as Predictor to Dependent Variable)
Model
Unstandardized Coefficients
Standardized Coefficients t Sig.
B Std. Error Beta (Constant) .477 .124 3.849 .000 Customer Satisfaction .908 .039 .835 23.447 .000
a Dependent Variable: Service Loyalty
Independent Variables and Customer Satisfaction as Predictors to Service
Loyalty (To test H8)
The hyphothsis number eight of the study was tested and the result summarized in
Table 17. The independent variables and mediating variable (service quality,
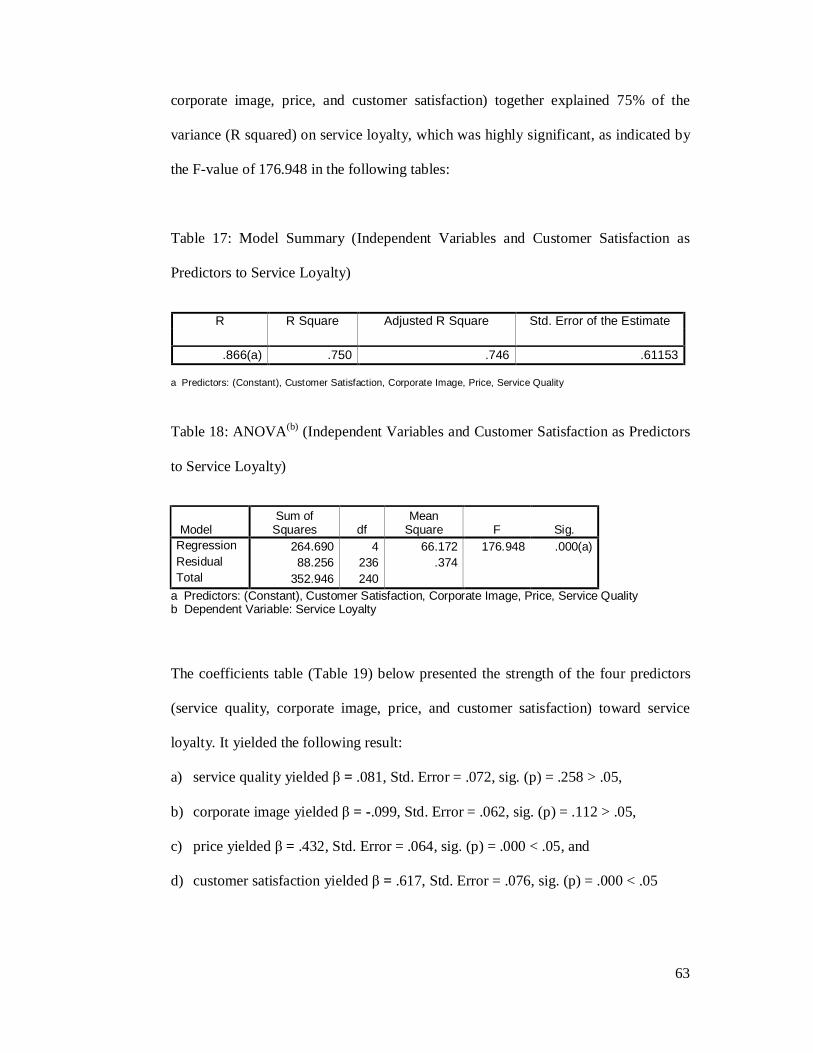
63
corporate image, price, and customer satisfaction) together explained 75% of the
variance (R squared) on service loyalty, which was highly significant, as indicated by
the F-value of 176.948 in the following tables:
Table 17: Model Summary (Independent Variables and Customer Satisfaction as
Predictors to Service Loyalty)
a Predictors: (Constant), Customer Satisfaction, Corporate Image, Price, Service Quality
Table 18: ANOVA(b) (Independent Variables and Customer Satisfaction as Predictors
to Service Loyalty)
Model Sum of
Squares df Mean
Square F Sig. Regression 264.690 4 66.172 176.948 .000(a) Residual 88.256 236 .374 Total 352.946 240
a Predictors: (Constant), Customer Satisfaction, Corporate Image, Price, Service Quality b Dependent Variable: Service Loyalty
The coefficients table (Table 19) below presented the strength of the four predictors
(service quality, corporate image, price, and customer satisfaction) toward service
loyalty. It yielded the following result:
a) service quality yielded β = .081, Std. Error = .072, sig. (p) = .258 > .05,
b) corporate image yielded β = -.099, Std. Error = .062, sig. (p) = .112 > .05,
c) price yielded β = .432, Std. Error = .064, sig. (p) = .000 < .05, and
d) customer satisfaction yielded β = .617, Std. Error = .076, sig. (p) = .000 < .05
R
R Square
Adjusted R Square
Std. Error of the Estimate
.866(a) .750 .746 .61153
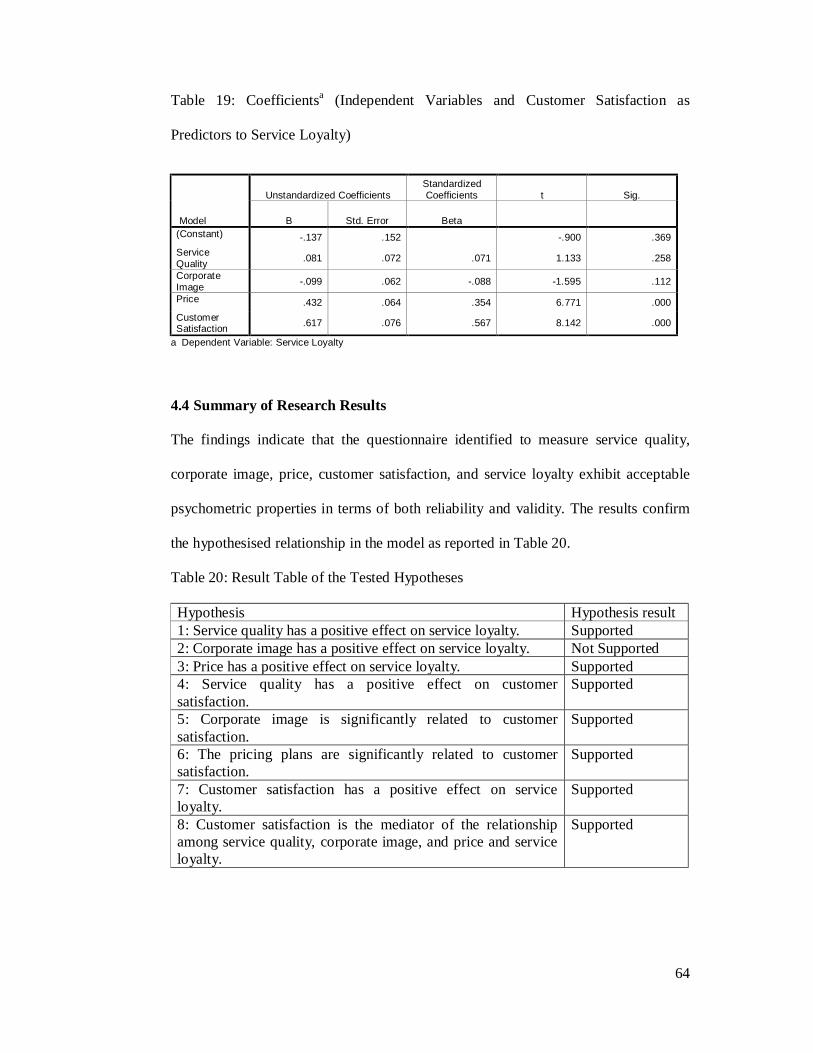
64
Table 19: Coefficientsa (Independent Variables and Customer Satisfaction as
Predictors to Service Loyalty)
Model
Unstandardized Coefficients Standardized Coefficients t Sig.
B Std. Error Beta (Constant) -.137 .152 -.900 .369 Service Quality .081 .072 .071 1.133 .258
Corporate Image -.099 .062 -.088 -1.595 .112
Price .432 .064 .354 6.771 .000 Customer Satisfaction .617 .076 .567 8.142 .000
a Dependent Variable: Service Loyalty
4.4 Summary of Research Results
The findings indicate that the questionnaire identified to measure service quality,
corporate image, price, customer satisfaction, and service loyalty exhibit acceptable
psychometric properties in terms of both reliability and validity. The results confirm
the hypothesised relationship in the model as reported in Table 20.
Table 20: Result Table of the Tested Hypotheses
Hypothesis Hypothesis result 1: Service quality has a positive effect on service loyalty. Supported 2: Corporate image has a positive effect on service loyalty. Not Supported 3: Price has a positive effect on service loyalty. Supported 4: Service quality has a positive effect on customer satisfaction.
Supported
5: Corporate image is significantly related to customer satisfaction.
Supported
6: The pricing plans are significantly related to customer satisfaction.
Supported
7: Customer satisfaction has a positive effect on service loyalty.
Supported
8: Customer satisfaction is the mediator of the relationship among service quality, corporate image, and price and service loyalty.
Supported
65
Service quality, corporate image, and price are found significantly influence customer
satisfaction. It answered the first research question (Does service quality, corporate
image and price influence customer satisfaction?).
Correlation and partial correlation analysis have been used to find out if there is any
trade-off between price and service quality (research question number two). The result
confirmed that there is a trade-off between price and service quality in terms of
customer satisfaction. Under correlation analysis, the Coefficient of Determination
(r2) indicated 65% shared variance between service quality and customer satisfaction
while price served to explain 61% of the variance in respondents’ scores on the
customer satisfaction. It shows that the correlation is higher for service quality if
compared to price.
However, the percentage of variance did change when partial correlation was being
used. The shared variance between service quality and customer satisfaction has been
reduced to 16% and the shared variance between price and customer satisfaction has
been reduced to 30%. The changes indicated that price is now contributing more than
service quality towards customer satisfaction. In short, consumers are influenced by
price then trade-off service quality. Although the statistical result shown not very high
significant on the trade-off relationship, it is still consider significant.
There are evidences showing that customer satisfaction performs a mediating role on
the link among service quality, corporate image and price towards service loyalty
through multiple regression testing. The mediating effect was tested based on
procedure provided by Baron & Kenny (1986). This involves the computation of four

66
regression equations. First, the regression of the independent variables (service
quality, corporate image, and price) on the dependent variable (service loyalty) as per
Independent Variables as Predictors to Service Loyalty.
Second, the regression of the mediator (customer satisfaction) on the independent
variables (service quality, corporate image, and price) as reported in Independent
Variables as Predictors to Customer Satisfaction. Third, the regression of the
dependant variable (service loyalty) on the mediator (customer satisfaction) as stated
in Customer Satisfaction as Predictor to Service Loyalty. Lastly, the regression of the
dependant variable (service loyalty) on both the independent variables (service
quality, corporate image, and price) and on the mediator (customer satisfaction) as
stated in Independent Variables and Customer Satisfaction as Predictors to Service
Loyalty.
There are few conditions for mediation to hold. In the first regression equation, the
independent variables must be shown to affect the dependent variables. In the second
regression equation, the independent variables must affect the mediator. In the third
regression equation, the mediator must be shown to affect the dependent variable; and
the final equation the mediator must affect the dependent variable to the exclusion of
the independent variable (Baron & Kenny, 1986).
From the computed regression equations, the conditions required for mediation to
hold are present. When the direct effect between the independent variable and the
dependent variable is no longer statistically different from zero fixing the mediator
variable, the mediation effect is said to be complete. However, from the above
67
regression equations, the absolute size of the direct effect between the independent
variable and the dependent variable is reduced after controlling for the mediator
variable, but the direct effect is still significantly different from zero, the mediation
effect is said to be partial (Baron & Kenny, 1986). Through the tests and analysis, it
answered the research question number three (does customer satisfaction mediates the
relationship among service quality, corporate image and price towards service
loyalty?).
Among the independent variables, price has been found to be the most important input
to customer satisfaction and explains standardized coefficients (β) of 0.414. It follows
by service quality (β = 0.363) and corporate image (β = 0.221). It represented that the
first research objective in this study has been answered. However, corporate image is
found not significantly affecting service loyalty with sig. (p) > .05 although the
relationship is positive. As explained by Bailey & Ball (2006), corporate image is not
a key dimension of service loyalty. Corporate image alone is not a guarantee of
success and there is little opportunity for organizations to develop a strong reputation.
While for customer satisfaction, it explains 0.835 of standardized coefficients towards
service loyalty. Result has shown that customer satisfaction is positively and
significantly influences loyalty. It answered research objective number two, that is to
investigate the effect of customer satisfaction on service loyalty.
68
5.0 Conclusion and Recommendations
In this section, the findings are summarised and their implications discussed. This
chapter also outlines recommendation for future research.
5.1 Summary and Conclusions
The study examines the relationship among service quality, corporate image, price,
customer satisfaction, and service loyalty and found a positive relationship among
these variables. From the study, it is confirmed that service quality, corporate image,
and price are factors that contributing to customer satisfaction in the
telecommunication industry of Malaysia.
Among the established variables, price is found to be the most important factor for
telecommunication consumers when choosing telecommunication service provider. It
is therefore has a high significant level on consumers’ satisfaction judgement. The
results indicated that price is directly influenced by satisfaction judgements and
loyalty followed by service quality and corporate image.
In conclusion, the results demonstrate the importance of improving the quality
management of mobile phone services, and show that customer satisfaction depends
on the perceived level of quality delivered. Finally, this study of the mobile telephone
market in Malaysia supports the contention in the general marketing literature that the
main factor creating and improving customer loyalty is customer satisfaction. It gives
implications for differentiated marketing strategies according to the perceived value
and type of customer loyalty.
69
5.2 Suggestions for Future Research
This study was conducted in a single service industry, mobile phone service sector.
While the environment of this industry may be considered representative of issues
faced by the general population of service industries, care should be taken in applying
the findings of this study to other industries. Alternatively, in the future research,
researchers might include the fixed line consumers and pre-paid telecommunication
service users in order to wider the scope of telecommunication service providers.
Ideally, research should be conducted using multiple industries in order to eliminate
peculiarity of a single industry and to ensuring the observed relationships are
generalizable to a broader population. However, in exploratory studies such as this
study, the use of a single industry may provide more accurate results in terms of
gaining a basic understanding of the nature of specific relationships.
In addition to examining whether the proposed loyalty conditions typically exist for
specific industries, service loyalty research needs to link loyalty with the issues
identified in the discussion of implications. Loyalty can be measured before and after
changes are made at service organizations to test empirically the relationships
between marketing strategies and the building and retention of service loyalty.
5.3 Implications
5.3.1 Service Quality
One of the primary implications of this study is that quality is not an end in itself; but
a means to an end ... namely, enhanced company performance and sustained
competitive advantage (Molly & Brent, 1998). For many years, firms have sought to
70
improve customer service in order to avoid potential problems. The result is that many
people view quality as merely a support mechanism, rather than a viable competitive
strategy (Molly & Brent, 1998). In contrast, successful firms define their strategy
around the pursuit of quality. Results indicate that this singular pursuit has a positive
impact on company performance.
A strategy built on quality can be sustainable for several reasons. First, quality is
something that not all firms do extremely well. Providing quality services require a
commitment in terms of planning, leadership, and implementation. This commitment
leads to the development of a corporate culture that internalizes a quality orientation
in all activities. Thus, organizations that possess the requisite skills and resources are
better able to pursue a quality-based strategy that less-adept firms cannot. The pursuit
of quality should be motivated by a desire to build competitive advantages that can be
uniquely translated into superior organizational performance.
5.3.2 Corporate Image The results from the current study confirm the role of corporate image as a factor in
the perception of customer satisfaction. One implication of these findings for
managers is to assess corporate image as part of an assessment of perceptions of
customer satisfaction. A positive corporate image makes it easier for organizations to
communicate effectively, and it makes people more perceptive to favorable word-of-
mouth messages. It is very important for organizations to have a clear, favorable
image (Gi-Du & Jeffrey, 2004).
71
A good corporate image can positively affect a firm’s sales and market share
(Shapiro, 1982), and the establishment and maintenance of a loyal relationship with
customers (Andreassen and Lindestad, 1998; Nguyen and Leblanc, 2001). As reported
by Keller and Aaker (1997), a strong corporate image can be used to increase
communication efficiency. De Ruyter and Wetzels (2000) state that the corporate
image is an information cue that consumers use to judge matters such as credibility,
perceived quality and purchase intentions. Additionally, some researchers affirm that
a corporate image builds the reputation of the company and that a favorable corporate
image leads to a positive corporate reputation in the minds of the public (Alessandri,
2001).
5.3.3 Price
The study findings indicate clearly the complexity and multidimensionality that
characterizes pricing decisions given that different pricing behavior patterns. This fact
has been also supported from a normative perspective within the existing literature on
pricing in that different categories of services necessitate formulating different pricing
strategies (e.g. Zeithaml & Bitner, 1996). This complexity is also reflected on the fact
that different service, organizational and environmental characteristics were found to
lead to different pricing policies especially in different service contexts (Zeithaml &
Bitner, 1996).
Within this context, there does not seem to be a solely method for pricing decisions,
which can be applied to all circumstances and service contexts. Formulating the
pricing strategy seems to be a business activity that requires managers to place their
72
emphasis on the unique characteristics of the services that they render in the market
together with their companies’ overall strategy and goals and their market structure.
A number of different authors (e.g. Shipley and Jobber, 2001) have stressed the
significance of incorporating customers’ needs and characteristics into the pricing
process if effective pricing decisions are to be made. After all, as Narver and Slater
(1990) have suggested better performance can be achieved only if every business
activity is implemented by having the customer in mind. Therefore, an implication for
managers responsible for pricing decisions within their firms is to always have their
customers in mind and design their pricing strategies from a customer perspective.
5.3.4 Customer Satisfaction
For the customer to remain satisfied, everyone in the organization has to take the
responsibility for helping the customer (Goldzimmer, 1990). Berry (1995) talks of
competing for talent in employees, setting high standards and sticking to those
standards, whilst Berry and Parasuraman (1991) highlight the importance of bringing
purpose and meaning to employees’ jobs and of empowering them without the fear of
reprisal. Additionally, changing the organizational culture to encourage employees to
adopt the “right first time” philosophy is essential (Oakland, 2000).
It is apparent that a multidimensional construct of service quality explains consumer
behavioral intentions in service industry. Managers should therefore be aware of the
need to include all service-quality dimensions in their efforts to improve service
quality. Organizations should not wait until complaints arise from customers about
73
service quality. An organization that continuously monitors the satisfaction of its
customers can improve its services by listening to the evaluations of customers.
5.3.5 Service Loyalty
The foregoing statement about what drives loyalty should be understood with the
proviso that loyalty is not entirely divorced from satisfaction (Mittal & Lassar, 1998).
The disloyalty/loyalty groups contrasted are from a subpopulation that is already
satisfied. In separating disloyal versus loyal customers, therefore, managers have to
ask what drives loyalty beyond satisfaction. In addition to measuring satisfaction,
managers must also measure customer intention to patronize the organization in the
future (Mittal & Lassar, 1998).
Another implication of this finding is to emphasize the importance of sustaining and
developing customer loyalty based on a differentiated approach to retain customers
who have different levels of loyalty development. It is important for manager to
remember that customers benchmark not just from what similar service companies are
doing, but what the best service providers in general are doing. Loyalty is built
through a positive differentiation that is usually achieved by providing superior
customer service.
74
6.0 References Albert Caruana (1997), “Corporate Reputation: Concept and Measurement”, Journal of Product & Brand Management, Vol. 6 No. 2, pp. 109-118. Albert Caruana (2002), “Service Loyalty: The Effects of Service Quality and the Mediating Role of Customer Satisfaction”, European Journal of Marketing, Vol 36, No. 7/8, pp. 811-828. Alessandri, S.W. (2001), “Modeling Corporate Identity: A Concept Explication and Theoretical Explanation”, Corporate Communications, Vol. 6 No. 4, pp. 173-82. Ancarani, F. and Shankar, V. (2004), “Price Levels and Price Dispersion Across and Within Multiple Retailer Channels: Further Evidence and Extension”, Journal of the Academy of Marketing Science, Vol. 32 No. 2, pp. 176-87. Anderson, E.W. (1996), “Customer Satisfaction and Prince Tolerance”, Marketing Letters, Vol. 7 No. 3, pp. 265-74. Anderson, W.T. Jr, Cox, E.P. III and Fulcher, D.G. (1976), “Bank Selection Decisions and Market Segmentation”, Journal of Marketing, Vol. 40 (January), pp. 40-5. Andreassen, T.W. and Lindestad, B. (1998), “Customer Loyalty and Complex Services: The Impact of Corporate Image on Quality, Customer Satisfaction and Loyalty for Customers with Varying Degrees of Service Expertise”, International Journal of Service Industry Management, Vol. 9 No. 1, pp. 7-23. Asuncion Beerli, Josefa D. Martın and Agustın Quintana (2004), “A Model of Customer Loyalty in the Retail Banking Market”, European Journal of Marketing Vol. 38 No. 1/2, pp. 253-275. Aydin, S. and Ozer, G. (2005), “National Customer Satisfaction Indices: An Implementation in the Turkish Mobile Telephone Market”, Marketing Intelligence & Planning, Vol. 23 No. 5, pp. 486-504. Bagozzi, R.P., Gopinath, M. & Nyer, P.H. (1999), “The Role of Emotions in Marketing”, Journal of the Academy of Marketing Science, Vol. 27 No. 2, pp. 184-206. Bailey & Ball (2006), “An Exploration of the Meanings of Hotel Brand Equity”, The Service Industries Journal, Vol. 26, No. 1, pp. 15-38. Baker, W., Marn, M. and Zawada, C. (2001), “Price Smarter on the Net”, Harvard Business Review, Vol. 79 No. 2, pp. 122-7. Balmer, J.M.T. (1998), “Corporate Identity and the Advent of Corporate Marketing”, Journal of Marketing Management, Vol. 14, pp. 963-96. Barich, H. and Kotler, P. (1991), “A Framework of Marketing Image Management”, Sloan Management Review, Vol. 32 No. 2, pp. 94-104.

75
Baron, R.M. and Kenny D.A. (1986), “The Moderator-Mediator Variable Distinction in Social Psychological Research: Conceptual, Strategic, and Statistical Considerations”, Journal of Personality and Social Psychology, Vol. 51, No. 6, 1173-1182. Barnes, J.G. (1997), “Closeness, Strength, and Satisfaction; Examining the Nature of Relationships between Providers of Financial Services and Their Retail Customers”, Psychology and Marketing, Vol. 14 No. 8, pp. 765-90. Bass, F.M. (1974), “The Theory of Stochastic Preference and Brand Switching”, Journal of Marketing Research, Vol. 11 No. 1. Bearden, W.O. and Teel, J.E. (1983), “Selected Determinants of Consumer Satisfaction and Complaint Reports”, Journal of Marketing Research, Vol. 20 No. 1 (February), pp. 21-8. Bei, L.T. and Chiao, Y.C. (2001), “An Integrated Model for the Effects of Perceived Product, Perceived Service Quality, and Perceived Price Fairness on Consumer Satisfaction and Loyalty”, Journal of Consumer Satisfaction, Dissatisfaction and Complaining Behavior, Vol. 14, pp. 125-40. Beldona, S. and Namasivayam, K. (2006), “Gender and Demand-based Pricing: Differences in Perceived (un)Fairness and Repatronage Intentions”, Journal of Hospitality & Leisure Marketing, Vol. 14 No. 4, pp. 89-107. Bendapudi, N. and Berry, L.L. (1997), “Customers’ Motivations for Maintaining Relationships with Service Providers”, Journal of Retailing, Vol. 73 No. 1, pp. 15-37. Berry, L.L. (1995), On Great Service, Free Press, New York, NY. Berry L.L. and Parasuraman, A. (1991), Marketing Services – Competing through Quality, Free Press, Macmillan, New York, NY. Bharadwaj, S., Varadarajan, P.R. and Fahy, J. (1993), “Sustainable Competitive Advantage in Service Industries: A Conceptual Model and Research Propositions”, Journal of Marketing, Vol. 57 (October), pp. 83-99. Bhattacharya, C.B., Rao, H. and Glynn, M.A. (1995), “Understanding the Bond of Identification: An investigation of Its Correlates among Art Museum Members”, Journal of Marketing, Vol. 59 No. 4, pp. 46-57. Bitner, M.J. (1990), “Evaluating Service Encounters: The Effects of Physical Surroundings and Employee Responses”, Journal of Marketing, Vol. 54 (April), pp. 69-82. Bitner, M.J. (1992), “Servicescapes: The Impact of Physical Surroundings on Customers and Employees”, Journal of Marketing, Vol. 56, pp. 57-71.
76
Bitner, M.J., Booms, B.H. and Tetreault, M.S. (1990), “The Service Encounter: Diagnosing Favorable and Unfavorable”, Journal of Marketing, Vol. 54 (January), pp. 71-84. Blodgett, J.G., Hill, D.J., and Tax, S.S. (1997), “The Effects of Distributive, Procedural, and Interactional Justice on Post Complaint Behavior”, Journal of Retailing, Vol. 73 No. 2, pp. 185-210. Bloemer, J., de Ruyter, K. and Peeters, P. (1998), “Investigating the Drivers of Bank Loyalty: The Complex Relationship between Image, Service Quality and Satisfaction”, International Journal of Bank Marketing, Vol. 16 No. 7, pp. 276-86. Bolton, L.E. and Alba, J.W. (2006), “Price Fairness: Good and Service Differences and the Role of Vendor Costs”, Journal of Consumer Research, Vol. 33, September, pp. 258-65. Bolton, L.E., Warlop, L. and Alba, J.W. (2003), “Consumer Perceptions of Price (un)Fairness”, Journal of Consumer Research, Vol. 29 No. 4, pp. 474-91. Bolton, R.N. and Drew, J.H. (1991), “A Multistage Model of Customers’ Assessments of Service Quality and Value”, Journal of Consumer Research, Vol. 17, March, pp. 375-84. Boulding, W., Kalra, A., Staelin, R. and Zeithaml, V.A. (1993), “A Dynamic Process Model of Service Quality: From Expectations to Behavioural Intentions'', Journal of Marketing Research, Vol. 30, pp. 7-27. Brady, M. and Cronin, J. (2001), “Some New Thoughts on Conceptualizing Perceived Service Quality: A Hierarchical Approach”, Journal of Marketing, Vol. 65 No. 3, pp. 34-49. Brady, M., Cronin, J. and Brand, R. (2002), “Performance-only Measurement of Service Quality: A Replication and Extension”, Journal of Business Research, Vol. 55 No. 1, pp. 17-31. Brown, J.R. and Goolsbee, A. (2000), Customer Equity, Building and Managing Relationships as Valuable Assets, Harvard Business School Press, Boston, MA. Brown, S.W., Fisk, R.P. and Bitner, M.J. (1994), “The Development and Emergence of Services Marketing Thought”, International Journal of Service Industry Management, Vol. 5 No. 1, pp. 22-48. Cadotte, E.R., Woodruff, R.B. and Jenkins, R.L. (1987), “Expectations and Norms in Models of Consumer Satisfaction”, Journal of Marketing Research, Vol. 24 (August), pp. 305-14. Campbell, M.C. (1999), “Perceptions of Price Unfairness: Antecedents and Consequences”, Journal of Marketing Research, Vol. 36 No. 2, pp. 187-99. Carlzon, J. (1987), Moments of Truth, Ballinger Publishing, Cambridge, MA.
77
Christensen, L.T. and Askegaard, S. (2001), “Corporate Identity and Corporate Image Revisited – A Semiotic Perspective”, European Journal of Marketing, Vol. 35 Nos 3/4, pp. 292-317. Chui, C.H. (2002), “A Study on the Cognitive and Affective Components of Service Quality”, Total Quality Management, Vol. 13 No. 2, pp. 265-74. Churchill, G. A. Jr & Suprenant, C. (1982), “An Investigation Into Determinants of Customer Satisfaction”, Journal of Marketing Research, Vol 1 No. 4 (November), pp. 491-504. Coakes, S.J. (2005), SPSS Version 12.0 for Windows: Analysis Without Anguish, CMO Image Printing Price, Singapore. Coakes, S.J. and Steed, L. (2007), SPSS Version 14.0 for Windows: Analysis Without Anguish, John Wiley & Sons Australia Ltd., Australia. Cox, J. and Dale, B.G. (2001), “Service Quality and E-commerce: An Exploratory Analysis”, Managing Service Quality, Vol. 11 No. 2, pp. 121-31. Cronin, J., Brady, M.K. & Hult, G.T.M. (2000), “Assessing the Effects of Quality, Value and Customer Satisfaction on Consumer Behavioral Intentions in Service Environments”, Journal of Retailing, Vol. 76 No. 2, pp. 193-218. Cronin, J. and Taylor, S. (1992), “Measuring Service Quality: A Reexamination and Extension”, Journal of Marketing, Vol. 56 (July), pp. 55-68. Cronin, J. and Taylor, S. (1994), “SERVPERF versus SERVQUAL: Reconciling Performance Based and Perceptions-minus-expectations Measurement of Service Quality”, Journal of Marketing, Vol. 58, January, pp. 125-31. Crosby, L.A. and Taylor, J.R. (1983), “Psychological Commitment and Its Effects on Post-decision Evaluation and Preference Stability among Voters”, Journal of Consumer Research, Vol. 9 (March), pp. 413-31. Cunningham, R. M (1956), “Brand Loyalty to Store Brand”, Harvard Business Review, Vol 39 (Nov-Dec), pp. 127-37. Cunningham, R. M (1956), “Brand Loyalty – What, Where, How Much”, Harvard Business Review, Vol 39 (Nov-Dec), pp. 116-38. Cunningham, R. M (1961), “Customer Loyalty to Store and Brand”, Harvard Business Review, Vol 39 (Nov-Dec), pp. 127-37. Czepiel, J.A. (1990), “Managing Relationships with Customers: A Differentiating Philosophy of Marketing”, in Bowen, D.E., Chase, R.B., Cummings, T.G. and Associates (Eds), “Service Management Effectiveness”, Jossey-Bass Publishers, San Francisco, CA, pp. 299-323.

78
Dahaner, P.J. and Haddrell, V. (1996), “A Comparison of Question Scales Used for Measuring Customer Satisfaction”, International Journal of Service Industry Management, Vol. 7 No.4, pp. 4-26. Darian, J.C., Tucci, L.A. and Wiman, A.R. (2001), “Perceived Salesperson Service Attributes and Retail Patronage Intentions”, International Journal of Retail & Distribution Management, Vol. 29 Nos 4/5, pp. 205-13. David Martin-Consuegra, Arturo Molina & Agueda Esteban (2007), “An Integrated Model of Price, Satisfaction and Loyalty: An Empirical Analysis in the Service Sector”, Journal of Product and Brand Management 16/7, pp. 459-468. Davies, G., Chun, R., Da Silva, R.V. and Roper, S. (2002), “Corporate Reputation and Competitiveness, Routledge”, London. Day, G.S. (1969), “A Two-Dimensional Concept of Brand Loyalty”, Journal of Advertising Research, Vol. 9, pp. 29-36. DeLone, W.H. and McLean, E.R. (1992), “Information System Success: The Quest for the Dependent Variable”, Information Systems Research, Vol. 3 No. 1, pp. 60-95. DeRuyter, K. & Bloemer, J. (1998), “Customer Loyalty in Extended Service Settings: The Interaction Between Satisfaction, Value Attainment and Positive Mood”, International Journal of Service Industry Management, Vol. 10 No. 3, pp. 320-36. DeRuyter, K., Bloemer, J. and Peeters, P. (1997), “Merging Service Quality and Service Satisfaction: An Empirical Test of an Integrative Model”, Journal of Economic Psychology, Vol. 18, pp. 387-406. DeRuyter, K. and Wetzels, M. (2000), “The Role of Corporate Image and Extension Similarity in Service Brand Extensions”, Journal of Economic Psychology, No. 21, pp. 639-59. Denison, T.J. and Knox, S. (1995), “Loyal by Default or by Design? A Study Profiling Loyal Shoppers”, paper presented at 2nd Recent Advances in Retailing and Services Science Conference, EIRASS, Gold Coast. Dick, A.S. and Basu, K. (1994), “Customer Loyalty: Toward an Integrated Conceptual Framework”, Journal of the Academy of Marketing Science, Vol. 22 No. 2, pp. 99-113. Ditchter, E. (1985), “What’s In An Image?”, Journal of Consumer Marketing, Vol. 2 No. 1, pp. 75-81. Dobni, D. & Zinkhan, G.M. (1990), “In Search of Brand Image: A Foundation Analysis”, Advances in Consumer Research, Vol. 17, pp.110-19. Dolan, R.J. and Moon, Y. (2000), “Pricing and Market Making on the Internet”, Journal of Interactive Marketing, Vol. 14 No. 2, pp. 56-73.

79
Doll, W.J. and Torkzadeh, G. (1988), “The Measurement of End-user Computing Satisfaction”, MIS Quarterly, Vol. 12, June, pp. 259-74. Doney, P.M. and Cannon, J.P. (1997), “An Examination of the Nature of Trust in Buyer-seller Relationships”, Journal of Marketing, Vol. 61 No. 2, pp. 35-51. Dube, L. & Menon, K. (2000), “Multiple Roles of Consumption Emotions in Post-purchase Satisfaction with Extended Service Transactions”, International Journal of Service Industry Management, Vol. 11 No. 3, pp. 287-306. Dwyer, R.F., Schurr, P.H. and Oh, S. (1987), “Developing Buyer-seller Relationships”, Journal of Marketing, Vol. 51 No. 2, pp. 11-27. East, R. (1997), Consumer Behaviour: Advances and Applications in Marketing, Prentice-Hall, London. Eskildsen, J., Kristensen, K., Juhl, J. and Ostergaard, P. (2004), “The Drivers of Customer Satisfaction and Loyalty: The Case of Denmark 2000-2002”, Total Quality Management, Vol. 15 Nos 5/6, pp. 859-68. Fazio, R.H. (1990), “Multiple Processes by Which Attitudes Guide Behavior: The MODE Model as an Integrative Framework”, in Zanna, M.P. (Ed.), Advances in Experimental Social Psychology, Vol. 23, Academic, Orlando, FL, pp. 75-109. File, K.M. and Prince, R.A. (1992), “Positive Word of Mouth: Customer Satisfaction and Buyer Behaviour”, International Journal of Bank Marketing, Vol.10 No. 1, pp. 25-9. Fitzsimmons, James A., and Fitzsimmons, Mona J. (2001), Service Management: Operations, Strategy, and Information Technology, 3rd Edition, New York: McGraw-Hill. Folkes, V.S. (1998), “Recent Attribution Research in Consumer Behavior: A Review and New Directions”, Journal of Consumer Research, Vol. 14, pp. 548-65. Fombrun, C.J. (1996), Reputation: Realizing Value from the Corporate Image, Harvard Business School Press, Boston, MA. Fombrun, C.J., Gardberg, N.A. and Sever, J.W. (2000), “The Reputation Quotient: A Multi-stakeholder Measure of Corporate Reputation”, The Journal of Brand Management, Vol. 7 No. 4, pp. 241-55. Fornell, C. (1992), “National Satisfaction Barometer: the Swedish Experience”, Journal of Marketing, Vol. 56 (January), pp. 6-21. Fornell, C., Johnson, M., Anderson, E., Cha, J. and Bryant, B. (1996), “The American Customer Satisfaction Index: Nature, Purpose, and Findings”, Journal of Marketing, Vol. 60 No. 4, pp. 7-18.

80
Fournier, S. (1998), “Consumers and Their Brands: Developing Relationship Theory in Consumer Research”, Journal of Consumer Research, Vol. 24, March, pp. 343-73. Fred Selnes (1993), “An Examination of the Effect of Product Performance on Brand Reputation, Satisfaction and Loyalty”, European Journal of Marketing, Vol 27 No 9, pp. 19-35. Fredericks, J.O. and Salter, J.M. II (1995), “Beyond customer satisfaction”, Management Review (May), pp. 29-32. Gabbott, M. and Hogg, G. (1994), “Consumer Behaviour and Services, A Review”, Journal of Marketing Management, Vol. 10, pp. 311-24. Gale, B. (1992), “Monitoring Customer Satisfaction and Market-perceived Quality”, American Marketing Association Worth Repeating Series, No. 922CSO 1, American Marketing Association, Chicago, IL. Garbarino, E. and Slonim, R. (2003), “Interrelationships and Distinct Effects of Internal Reference Prices on Perceived Expensiveness”, Psychology and Marketing, Vol. 20 No. 3, pp. 227-48. Gatewood, R.D., Gowan, M.A. and Lautenschlager, G.J. (1993), “Corporate Image, Recruitment Image, and Initial Job Choice Decisions”, Academy of Management Journal, Vol. 36, pp. 414-27. Geyskens, I., Steenkamp, J-B.E.M. and Kumar, N. (1999), “A Meta-analysis of Satisfaction in Marketing Channel Relationships”, Journal of Marketing Research, Vol. 40 (May), pp. 223-38. Gi-Du Kang and Jeffrey James (2004): “Service Quality Dimensions: An Examination of Groonroos’s Service Quality Model”, Managing Service Quality, Volume 14 No 4, pp. 266–277. Gianfranco Walsh, Keith Dinnie and Klaus-Peter Wiedmann (2006), “How Do Corporate Reputation and Customer Satisfaction Impact Customer Defection? A study of Private Energy Customers in Germany”, Journal of Services Marketing, No. 20/60, pp. 412–420. Giese, J.L. and Cote, J.A. (2000), “Defining Consumer Satisfaction”, Academy of Marketing Science Review. Gilbert, G.R. (2000), “Measuring Internal Customer Satisfaction”, Managing Service Quality, Volume 10 Number 3, pp. 178-186, MCB University Press. Gilmore, R. and Czepiel, J.A. (1987), “Reconceptualizing Loyalty in Economic Exchange Relationships: Are Marketers People?”, Graduate School of Business Administration, New York University, New York, NY. Goldzimmer, L.S. (1990), Customer Driven, Hutchison Business Books Ltd, London.
81
Goran Svensson (2004), “Interactive Service Quality in Service Encounters: Empirical Illustration and Models”, Managing Service Quality, Vol 14 No 4, pp. 278-287. Goran Svensson (2002), “A Triadic Network Approach to Service Quality”, Journal of Services Marketing, Vol. 16 No. 2, pp. 158-77. Gray, J.G (1986), Managing the Institutional Image, Quorum Books, Westport, CT. Green, G.B. and Salkind, N.J. (2005), Using SPSS for Windows and Macintosh: Analyzing and Understanding Data, Upper Saddle River, Prentice Hall. Gremler, D. D. and Brown, S. W. (1996), “Service Loyalty: Its Nature, Importance and Implications”, in Edvardsson B., Brown, S. W., Johnson, R. Scheuing, E. E., Proceedings American Marketing Association, pp. 171-80. Grewal, D., Monroe, K.B. and Krishnan, R. (1998), “The Effects of Price Comparison Advertising on Buyers’ Perceptions of Acquisition Value, Transaction Value and Behavioral Intentions”, Journal of Marketing, Vol. 62, pp. 46-59. Gronroos, C. (1982), “An Applied Service Marketing Theory”, European Journal of Marketing, Vol. 16 No. 7, pp. 30-41. Groonroos, C. (1984), “A Service Quality Model and Its Market Implications”, European Journal of Marketing, Vol. 18 No. 4, pp. 36-44. Groonroos, C. (1990), Service Management and Marketing, D.C. Health, Lexington, MA. Gronroos, C. (1990), Service Management and Marketing: Managing the Moment of Truth in Service Competition, Lexington Books, Lexington, MA. Gronroos, C. (2000), Service Management and Marketing: A Customer Relationship Management Approach, Wiley, New York, NY. Gronroos, C. (2001), “The Perceived Service Quality Concept – A Mistake?”, Managing Service Quality, Vol. 11 No. 3, pp. 150-2. Gwinner, K.P., Gremler, D.D. and Bitner, M.J. (1998), “Relational Benefits in Services Industries: The Customer’s Perspective”, Journal of the Academy of Marketing Science, Vol. 26 No. 2, pp. 101-14. Hair, J. F., Anderson, R. E., Tatham, R. L. & Black, W. C, Multivariate Data Analysis, 4th ed., Macmillan, New York, NY. Hakansson, H. and Snehota, I. (1995), Developing Relationships in Business Networks, Routledge, London.
82
Halstead, D., Hartman, D. and Schmidt, S.L. (1994), “Multisource Effects on the Satisfaction Formation Process”, Journal of the Academy of Marketing Science, Vol. 22, Spring, pp. 114-29. Herbig, P., Mileuicz, J. & Golden, J. (1994), “A Model of Reputation Building and Destruction”, Journal of Business Research, Vol. 31, pp. 23-31. Henning-Thurau, T., Gwinner, K.P. and Gremler, D.D. (2002), “Understanding Relationship Marketing Outcomes: An Integration of Relational Benefits and Relationship Quality”, Journal of Service Research, Vol. 4 No. 3, pp. 230-47. Hinton R., Perry, et al. (2004), SPSS Explained. Roulledge Inc., New York. Hirschmann, A.O. (1970), Exit Voice and Loyalty – Responses to Decline in Firms, Organizations and States, Harvard University Press, Cambridge, MA. Hubert, F., Herrmann, A. & Wricke, M. (2001), “Customer Satisfaction as an Antecedent of Price Acceptance: Results of an Empirical Study”, Journal of Product and Brand Management, Vol. 10 No. 3, pp. 160-9. Hsieh, M.H., Pan, S.L. and Setiono, R. (2004), “Product-, Corporate-, and Country-Image Dimensions and Purchase Behavior: A Multicountry Analysis”, Journal of the Academy of Marketing Science, Vol. 32 No. 3, pp. 251-70. Iacobucci, D., Grayson, K.A., and Ostrom, A.L. (1994), “The Calculus of Service Quality and Customer Satisfaction”, in Swartz, T.A., Bowen, D.E., and Brown, S.W. (Eds), Advance in Services Marketing and Management, Vol. 3, JAI Press Inc, Greenwich, CT, pp. 1-67. Ishak Ismail, Hasnah Haron, Daing Nasir Ibrahim and Salmi Mohd Isa (2006): “Service Quality, Client Satisfaction and Loyalty towards Audit Firms”, Managerial Auditing Journal Vol. 21 No. 7, pp. 738-756. Jacoby, J. (1969), “Towards a Multi-brand Model of Brand Loyalty”, Paper 105, Department of Psychology, Purdue University, West Lafayette, IN. Jacoby, J. (1971), “A Model of Multi-Brand Loyalty”, Journal of Advertising Research, Vol. 11, pp. 25-31. Jacoby, J. and Chestnut, R. W. (1978), Brand Loyalty: Measurement and Management, John Wiley, New York, NY. Jacoby, J. and Olson, J. (1977), “Consumer Response to Price: An Attitudinal Information Processing Perspective”, American Marketing Association Proceedings, Chicago, IL, pp. 73-86. Jamali, D. (2007), “A Study of Customer Satisfaction in the Context of a Public Private Partnership”, International Journal of Quality & Reliability Management, Vol. 24 No. 4, pp. 370-385.
83
Jay Kandampully, Hsin-Hui Hu (2007), “Do Hoteliers Need to Manage Image to Retain Loyal Customers?”, International Journal of Contemporary Hospitality Management, Vol. 19 No. 6, pp. 435-443. Johnson, M.D., Gustafsson, A., Andreassen, T.W., Lervik, L. and Cha, J. (2001), “The Evolution and Future of National Customer Satisfaction Index Models”, Journal of Economic Psychology, Vol. 22, pp. 217-45. Josee Bloemer, Ko de Ruyter and Martin Wetzels (1999), “Linking Perceived Service Quality and Service Loyalty: A Multi-dimensional Perspective”, European Journal of Marketing, Vol. 33 No. 11/12. Kalwani, M.U. and Yim, C.K. (1992), “Consumer Price and Promotion Expectations: An Experimental Study”, Journal of Marketing Research, Vol. 29 No. 1, pp. 90-100. Kalyanaram, G. and Little, J.D.C. (1994), “An Empirical Analysis of Latitude of Price Acceptance in Consumer Package Goods”, Journal of Consumer Research, Vol. 21, December, pp. 408-18. Kalyanaram, G. and Winer, R.S. (1995), “Empirical Generalizations from Reference Price Research”, Marketing Science, Vol. 14 No. 3, Part 2, pp. G161-9. Kandampully, J. and Suhartanto, D. (2000), “Customer Loyalty in the Hotel Industry: The Role of Customer Satisfaction and Image”, International Journal of Contemporary Hospitality Management, Vol. 12 No. 6, pp. 346-51. Keaveney, S.M. & Hunt, K.A. (1992), “Conceptualization and Operationalization of Retail Store Image: A Case of Rival Middle-level Theories”, Journal of Academy of Marketing Science, Vol. 20 No. 2, pp. 165-175. Keller, K.L. and Aaker, D.A. (1997), “Managing the Corporate Brand: The Effect of Corporate Marketing Activity on Consumer Evaluations of Brand Extensions”, Working Paper Report No. 97-106 (May), Marketing Science Institute, Cambridge, MA. Kennedy, S.H. (1977), “Nurturing corporate image”, European Journal of Marketing, Vol. 11 No. 3, pp. 120-64. Kingstorm, P.O. (1983), “Patient Ties to Ambulatory Care Providers: The Concept of Providr Loyalty”, Journal of Health Care Marketing, Vol. 3 No. 2, pp. 27-34. Kotler, Ph., Armstrong, G., Saunders, J. and Wong, V. (1999), Principles of Marketing, Prentice-Hall Europe, Cambridge. Kostecki, M. M. (1994), Marketing Strategies for Services: Globalization, Client Orientation, Deregulation, Pergamon Press, Oxford. Kung, M., Monore, K.B. and Cox, J.L. (2002), “Pricing on the Internet”, Journal of Product & Brand Management, Vol. 11 No. 5, pp. 274-88.
84
Lamb, C.W. and Dunne, P.M. (Eds), “Theoretical Developments in Marketing”, American Marketing Association, Chicago, IL, pp. 72-6. Laura M.A. (2005), “Integration of Information About Corporate Social Performance”, Corporate Communications: An International Journal Vol. 10 No. 1, pp. 83-98. Lawrence O. H. (2006), “A Confirmation Perspective on Perceived Service Quality”, Journal of Services Marketing, 20/4, pp. 219–232. Lee, M. and Cunningham, L.F. (2001), “A Cost/Benefit Approach to Understanding Service Loyalty”, Journal of Services Marketing, Vol. 15 No. 2, pp. 113-30. Levesque, T. and McDougall, G.H.G. (1996), “Determinants of Customer Satisfaction in Retail Banking”, International Journal of Bank Marketing, Vol. 14 No. 7, pp. 12-20. Levitt, T. (1965), “Industrial Purchasing Behavior: A Study of Communications Effects”, Division of Research, Harvard Business School, Boston, MA. Lichtenstein, D., Blonch, D. and Black, W. (1988), “Correlates of Price Acceptability”, Journal of Consumer Research, Vol. 15 No. 2, pp. 243-52. Liljander, V. and Strandvik, T. (1997), “Emotions in Service Satisfaction”, International Journal of Service Industry Management, Vol. 8 No. 2, pp. 148-69. Lippa, R.A. (1990), Introduction to Social Psychology, Wadsworth Publishing Company, Belmont, CA. Link, F. (1997), “Diffusion Dynamics and the Pricing of Innovations”, PhD Thesis, Lund University. Lovelock, C.H. (1980), “Towards a Classification of Services”, in Lamb, C.W. and Dunne, P.M. (Eds), Theoretical Developments in Marketing, American Marketing Association, Chicago, IL, pp. 72-6. Lovelock, C.H. (1983), “Classifying Services to Gain Strategic Marketing Insights”, Journal of Marketing, Vol. 47 No. 3, pp. 9-20. Madu, C.N. and Madu, A.A. (2002), “Dimensions of E-quality”, International Journal of Quality & Reliability Management, Vol. 19 No. 3, pp. 246-58. Malaysian Communications and Multimedia Commission (2007), Communication and Multimedia: Selected Facts and Figures, Kuala Lumpur: Malaysian Communications and Multimedia Commission. Malaysian Communications and Multimedia Commission (2007), Hand Phone Users Survey 06, Kuala Lumpur: Malaysian Communications and Multimedia Commission.
85
Manfred Bruhn (2003), “Internal Service Barometers: Conceptualization and Empirical Results of A Pilot Study in Switzerland”, European Journal of Marketing Vol. 37 No. 9, pp. 1187-1204. Mano, H. and Oliver, R.L. (1993), “Assessing the Dimensionality and Structure of the Consumption Experience: Evaluation, Feeling, and Satisfaction”, Journal of Consumer Research, Vol. 20 (December), pp. 451-66. Manuel Sanchez Perez, Juan Carlos Gazquez Abad, Gema Maria Marin Carrillo and Raquel Sanchez Fernandez (2007), “Effects of Service Quality Dimensions on Behavioural Purchase Intentions: A Study in Public-Sector Transport”, Managing Service Quality, Vol. 17 No. 2, pp. 134-151. Marshall, A. (1980), Principles of Economics, Macmillan Press, London. Martins, M. and Monroe, K.B. (1994), “An Integrated Model of Price, Satisfaction and Loyalty: An Empirical Analysis in the Service Sector”, in Allen, C.T. and Roedder John, D. (Eds), Advances in Consumer Research, Vol. 21, Association for Consumer Research, Provo, UT. Mazursky, D. & Jacoby, J. (1986), “Exploring the Development of Store Images”, Journal of Retailing No. 62, pp. 145-65. McGravy, D.E. (1995), “The Road to Customer Loyalty”, Canadian Business Review, Vol. 22 No. 1, pp. 35-6. McInnis, D.J. & Price, L.L. (1987), “The Role of Imagery in Information Processing: Review and Extensions”, Journal of Consumer Research, Vol. 13, pp. 473-91. Minjoon Jun, Zhilin Yang, DaeSoo Kim (2004), “Customers’ Perceptions of Online Retailing Service Quality and Their Satisfaction”, International Journal of Quality & Reliability Management, Vol. 21 No. 8, pp. 817-840. Mittal, B., and Lassar, W. M. (1998), “Why Do Customers Switch? The Dynamics of Satisfaction versus Loyalty”, The Journal of Services Marketing, Vol. 12 No. 3, pp. 177-194. Molly Inhofe Rapert & Brent M. Wren (1998), “Service Quality as A Competitive Opportunity”, The Journal of Services Marketing, Vol. 12 No. 3, pp. 223-235. Monroe, K.B. (1973), “Buyers’ Subjective Perceptions of Price”, Journal of Marketing Research, Vol. 10 (February), pp. 70-80. Monroe, K.B. (1990), Pricing: Making Profitable Decisions, McGraw-Hill, New York, NY. Morgan, R.M. and Hunt, S.D. (1994), “The Commitment-Trust Theory of Relationship Marketing”, Journal of Marketing, Vol. 58 No. 3, pp. 20-38.
86
Morrison, L. (2004), “Measuring Service Quality: A Review and Critique of Research Using SERVQUAL”, International Journal of Market Research, Vol. 46 No. 4, pp. 479-97. Morton, F.S., Zettelmeyer, F. and Risso, J.S. (2001), “Internet Car Retailing”, Journal of Industrial Economics, Vol. 49 No. 4, pp. 501-19. Moulson, T.J. (1965), “Danger Signals: How to Spot Erosion in Brand Loyalty”, Printer’s Ink, March, pp. 55-61. Mymode (www.mymode.com.my), “Mobile Business - The Next Big Thing”, accessed on 31 July 2007. Nagle, T.T. and Holden, R.K. (2002), The Strategy and Tactics of Pricing: A guide to Profitable Decision Making, Prentice-Hall, Englewood Cliffs, NJ. Naser, K., Jamal, A., and Al-Khatib, A. (1999), “Islamic Banking: A Study of Customer Satisfaction and Preferences in Jordan”, International Journal of Bank Marketing 17/3, pp. 135-50. Nunnally, J. (1978), Psychometric Theory, McGraw-Hill, New York, NY in David Martin-Consuegra, Arturo Molina & Agueda Esteban (2007), “An Integrated Model of Price, Satisfaction and Loyalty: An Empirical Analysis in the Service Sector”, Journal of Product and Brand Management 16/7, pp. 459-468. Nguyen, N. (2006), “The Collective Impact of Service Workers and Servicescape on the Corporate Image Formation”, International Journal of Hospitality Management, Vol. 25 No. 2, pp. 227-44. Nguyen, N. & LeBlanc, G. (1998), “The Mediating Role of Corporate Image on Customers Retention Decisions: An Investigation in Financial Services”, International Journal of Bank Management, Vol. 16 No. 2, pp. 52-65. Nguyen, N. & LeBlanc, G. (2001), “Image and Reputation of Higher Education Institutions in Students’ Retention Decision”, The International Journal of Educational Management 15/6, pp. 303-311. Oakland, J. (2000), Total Quality Management, Butterworth-Heinemann, Oxford. Oliver, R.L. (1980), “A Cognitive Model of the Antecedents and Consequences of Satisfaction Decisions”, Journal of Marketing Research, Vol. XVII No. 11, pp. 460-9. Oliver, R.L. (1981), “Measurement and Evaluation of Satisfaction Processes in Retail Settings”, Journal of Retailing, Vol. 57 No. 3, pp. 25-47. Oliver, R.L. (1997), Satisfaction: A Behavioral Perspective on the Consumer, McGraw-Hill, New York, NY. Oliver, R.L. (1999), “Whence Consumer Loyalty?”, Journal of Marketing, Vol. 63 (October), pp. 33-44.
87
Oliver, R.L. and Swan, J.E. (1989), “Consumer Perceptions of Interpersonal Equity and Satisfaction in Transactions: A Field Survey Approach”, Journal of Marketing, Vol. 53 No. 2, pp. 21-35. Parasuraman, A., Berry, L.L. and Zeithml, V.A. (1985), “A Conceptual Model of Service Quality and Its Implication for Future Research”, Journal of Marketing, Vol. 49 No. 4, pp. 41-50. Parasuraman, A., Berry, L.L. and Zeithml, V.A. (1990), “An Empirical Examination of Relationships in Extended Service Quality Model”, MSI Report, Marketing Science Institute, Cambridge, pp. 90-122. Parasuraman, A., Berry, L.L. and Zeithml, V.A. (1991), “Refinement and Reassessment of the SERVQUAL Scale”, Journal of retailing, Vol. 67 No. 4, pp. 420-50. Parasuraman, A., Berry, L.L. and Zeithml, V.A. (1994), “Alternative Scales for Measuring Service Quality: A Comparative Assessment Based on Psychometric and Diagnostic Criteria”, Journal of marketing, Vol. 70 No. 3, pp. 201-30. Parasuraman, A., Berry, L.L. and Zeithml, V.A. (1998), “SERVQUAL: A Multiple-Item Scale for Measuring Customer Perceptions of Service Quality”, Journal of Retailing, Vol. 64 No. 1, pp. 12-40. Payne, A. (1993) The Essense of Services Marketing, Prentice-Hall, London. Peter Kangis and Vassiliki Passa (1997), “Awareness of Service Charges and Its Influence on Customer Expectations and Perceptions of Quality in Banking”, The Journal of Services Marketing, Vol. 11 No. 2 1997 pp. 105-117. Peter, P.J. and Olson, J.C. (1996), Consumer Behaviour and Marketing Strategy, 4th ed., Irwin, Chicago, IL. Pritchard, M.P., Havitz, M.E. and Howard, D.R. (1999), “Analyzing the Commitment-Loyalty Linking Service Contexts”, Journal of the Academy of Marketing Science, Vol. 27 No. 3, pp. 333-48. Raj, S.P. (1985), “Striking a Balance Between Brand ‘Popularity’ and Brand Loyalty,” Journal of Marketing, Winter, Vol. 49 No. 1, pp. 53-9. Reichheld, F.F. (2003), “The One Number You Need to Grow”, Harvard Business Review, Vol. 81 No. 12, pp. 46-54. Richens M.L. (1983), “Negative Word of Mouth by Dissatisfied Consumers: A Pilot Study”, Journal of Marketing (Winter), p. 69. Rita Martenson (2007), “Corporate Brand Image, Satisfaction and Store Loyalty: A Study of the Store as a Brand, Store Brands and Manufacturer Brands”, International Journal of Retail & Distribution Management, Vol. 35 No. 7, pp. 544-555.

88
Roest, H. and Pieters, R. (1997), “The Nomological Net of Perceived Service Quality”, The International Journal of Service Industry Management, Vol. 8 No. 4, pp. 336-51. Rosa-Diaz, I.M. (2004), “Price Knowledge: Effects of Consumers’ Attitudes towards Prices, Demographics, and Socio-cultural Characteristics”, Journal of Product & Brand Management, Vol. 13 No. 6, pp. 406-28. Rose, C. and Thomsen, S. (2004), “The Impact of Corporate Reputation on Performance: Some Danish Evidence”, European Management Journal, Vol. 22 No. 2, pp. 201-10. Roskos-Ewoldsen, D.R. (1997), “Attitude Accessibility and Persuasion: Review and a Transactive Model”, Communication Yearbook, Vol. 20, pp. 185-225. Ruben, C. C. and Nicholas, G. P. (2007), “Service Quality, Relationship Satisfaction, Trust, Commitment and Business-to-business Loyalty”, European Journal of Marketing, Vol. 41 No. 7/8, pp. 836-867. Rust, R. T. and Oliver, R. L. (1994), “Service Quality: Insights and Managerial Implications from the Frontier”, in Rust, R. T. and Oliver, R. L. (Eds), Service Quality: New Directions in Theory and Practice, pp. 241-68. Sanbonmatsu, D.M. and Fazio, R.H. (1990), “The Role of Attitudes in Memory-based Decision Making”, Journal of Personality and Social Psychology, Vol. 59, pp. 614-22. Scholten, P. and Smith, M. (2002), “Price Dispersion Then and Now: Evidence from Retail and e-tail Markets”, Advances in Microeconomics: Economics of the Internet and E-commerce, Vol. 11, pp. 63-88. Selnes, F. (1993), “An Examination of the Effect of Product Performance on Brand Reputation, Satisfaction & Loyalty”, European Journal of Marketing, Vol. 27 No. 9, pp. 19-35. Shapiro, C. (1982), “Consumer Information, Product Quality, and Seller Reputation”, The Bell Journal of Economics, Vol. 13 No. 1, pp. 20-35. Sherif, C.W. (1963), “Social Categorization as a Function of Latitude of Acceptance and Series Range”, Journal of Abnormal and Social Psychology, Vol. 67 No. 2, pp. 148-56. Sigala, M. (2002), “Competitive Strategies for Mobile Portals”, paper presented at the Internal Conference on Mobile Business, “M-Business 2002”, Athens, 8-9 July 2002. Sirgy, M.J. and Samli, A.C. (1989), “A Path Analytic Model of Store Image, Geographic Loyalty, and Socioeconomic Status”, Journal of the Academy of Marketing Science, Vol. 13 No. 3, pp. 265-91.
89
Smith, M.D., Bailey, J. and Brynjolfsson, E. (1999), “Understanding Digital Markets: Review and Assessment”, in Brynjolfsson, E. and Kahin, B. (Eds), Understanding the Digital Economy, MIT Press, Cambridge, MA. Spangenberg, E.R., Crowley, A.E. and Henderson, P.W. (1996), “Improving the Store Environment: Do Olfactory Cues Affect Evaluations and Behaviors?”, Journal of Marketing, Vol. 66, pp. 67-80. Stern, E. & Krakover, S. (1993), “The Formation of A Composite Urban Image”, Geographical Analysis, Vol. 25 No. 5, pp. 130-46. Souiden N., Kassim N.M., Hong H.J (2006), “The Effect of Corporate Branding Dimensions on Consumers’ Product Evaluation”, European Journal of Marketing, Vol. 40 No. 7/8, pp. 825-845. Spreng, R.A. and Mackoy, R.D. (1996), “An Empirical Examination of a Model of Perceived Services Quality and Satisfaction”, Journal of Retailing, Vol. 72 No. 2, pp. 201-14. Stauss, B. & Neuhaus, P. (1997), “The Qualitative Satisfaction Model”, International Journal of Service Industry Management, Vol. 8 No. 3, pp. 236-49. Stum, D.L and Thiry, A. (1991), “Building Customer Loyalty”, Training and Development Journal, Vol. 45 No. 4, pp. 34-6. Svensson, G. (2002), “A Triadic Network Approach to Service Quality”, Journal of Services Marketing, Vol. 16 No. 2, pp. 158-77. Tang, F. and Xing, X. (2001), “Will the Growth of Multi-channel Retailing Diminish the Pricing Efficiency of the Web?”, Journal of Retailing, Vol. 77 No. 3, pp. 319-33. Taylor, S.A. and Baker, T.L. (1994), “An Assessment of the Relationship between Service Quality and Customer Satisfaction in the Formation of Consumers’ Purchase Intentions”, Journal of Retailing, Vol. 70 No. 2, pp. 163-78. The Star Online (www.thestar.com.my), “Asia's Resilient Telecom Sector Is Poised for A Mobile Revolution, Says Kuwait Finance House in A Recent Report” dated 21 July 2007, accessed on 22 July 2007.
Tranberg, H. and Hansen, F. (1986), “Patterns of Brand Loyalty: Their Determinants and Their Role for Leading Brands”, European Journal of Marketing, Vol. 20 No. 3, pp. 81-109. Tse, A. (2001), “How Much More Are Consumers Willing to Pay for a Higher Level of Service? A Preliminary Survey”, Journal of Service Marketing, Vol. 15 No. 1, pp. 11-17.
Tucker, S. (1966), Pricing for Higher Profit: Criteria, Method, Applications, McGraw-Hill, New York, NY.
90
Tucker, W. T. (1964), “The Development of Brand Loyalty”, Journal of Marketing Research, Vol. 1 August, pp. 32-35.
Ueltschy, L.C. and Laroche, M. (2004), “Co-brand Internationally: Everyone Wins?”, Journal of Applied Business Research, Vol. 20 No. 3, pp. 91-103.
Wah, L. (1998), “What’s in a Clumsy Name?”, Management Review, Vol. 87 No. 10, pp. 9-10. Walsh, G. and Wiedmann, K.P. (2004), “A Conceptualization of Corporate Reputation in Germany: An Evaluation and Extension of the RQ”, Corporate Reputation Review, Vol. 6 No. 4, pp. 304-12. Weiner, B. (1985), “Spontaneous Causal Thinking”, Psychology Bulletin, Vol. 97 No. 1, pp. 74-84. Wirtz, J. and Kimes, S.E. (2007), “The Moderating Role of Familiarity in Fairness Perceptions of Revenue Management Pricing”, Journal of Service Research, Vol. 9 No. 3, pp. 229-40. Wong, A. and Sohal, A. (2003), “A Critical Incident Approach to the Examination of Customer Relationship Management in a Retail Chain: An Exploratory Study”, Qualitative Market Research: An International Journal, Vol. 6 No. 4, pp. 248-62. Xia, L., Monroe, K.B. and Cox, J.L. (2004), “The Price is Unfair! A Conceptual Framework of Price Fairness Perceptions”, Journal of Marketing, Vol. 68 No. 4, pp. 1-15. Yonggui Wang, Hing-P. Co & Yer V. Hui (2003), “The Antecedents of Service Quality and Product Quality and Their Influences on Bank Reputation: Evidence from the Banking Industry in China”, Managing Service Quality, Vol 13 – No. 1, pp. 72-83., Vol. 12 No. 3, pp. 234-250. Yu, Y.T. & Dean, A. (2001), “The Contribution of Emotional Satisfaction to Consumer Loyalty”, International Journal of Service Industry Management. Yuille, J.C. & Catchpole, M.J. (1977), “The Role of in Models of Cognition”, Journal of Mental Imagery, Vol. 1, pp. 171-80. Zeithaml, V.A. (1988), “Consumer Perceptions Price, Quality, and Value: A Means-end Model and Synthesis of Evidence”, Journal of Marketing, Vol. 52, July, pp. 2-22. Zeithaml, V.A. (2000), “Service Quality, Profitability, and the Economic Worth of Customers: What We Know and What We Need to Learn”, Journal of the Academy of Marketing Science, Vol. 28 No. 1, pp. 67-85. Zeithaml, V.A. (2002), “Service Excellence in Electronic Channels”, Managing Service Quality, Vol. 12 No. 3, pp. 135-8.
91
Zeithaml, V.A. and Bitner, M.J. (1996), Service Marketing, McGraw-Hill, New York, NY. Zeithaml, V.A., Berry, L.L. and Parasuraman, A. (1993), “The Nature and Determinants f Customer Expectations of Service”, Journal of the Academy of Marketing Science, Vol. 21 No. 1, pp. 1-12. Zeithaml, V.A., Berry, L.L. and Parasuraman, A. (1996), “The Behavioral Consequences of Service Quality”, Journal of Marketing, Vol. 60, pp. 31-46. Zeithaml, V.A. and Bitner, M.J. (2003), Service Marketing Integrating Customer Focus across the Firm, McGraw-Hill, New York. Zeithaml, V.A., Parasuraman, A. and Berry, L. (1985), “Problems and strategies in services marketing”, Journal of Marketing, Vol. 49, Spring, pp. 33-46. Zeithaml, V.A., Parasuraman, A. and Berry, L. (1990), Delivering Quality Service: Balancing Customer Perception and Expectations, Free Press, New York, NY. Zikmund, W. G (1997), Exploring Marketing Research, 6th ed., The Dryden Press, Orlando.

92
7.0 Appendix - Appendix A: Questionnaire
- Appendix B: Report in CD
Appendix A – Questionnaire
Perception towards Telecommunication Service Providers in Malaysia
Dear Sir / Madam, The following questionnaire is conducted as part of my fulfillment of the Master of Business Administration degree with University of Malaya. The general purpose of this study is to understand mobile phone users’ perception towards telecommunication service providers in Malaysia. Please be assured that all information will be treated with strictest confidentiality and only the aggregate data will be analyzed. I am therefore inviting you to participate in this survey by filling up the attached questionnaire. The said questionnaire is constructed in a straightforward manner and easy to answer which should take not more than 15 minutes of your valuable time to complete the attached questionnaire. As the successful completion of this study is largely dependent upon obtaining an adequate and representative sample, your participation in this survey is highly appreciated. If you have any concerns regarding this study, please feel free to contact the undersigned at [email protected]. Thank you for your time and participation. Sincerely, Chong Hui Ling (Matrix number: CGA040034)
UNIVERSITY OF MALAYA Faculty of Business and Accountancy Master of Business Administration
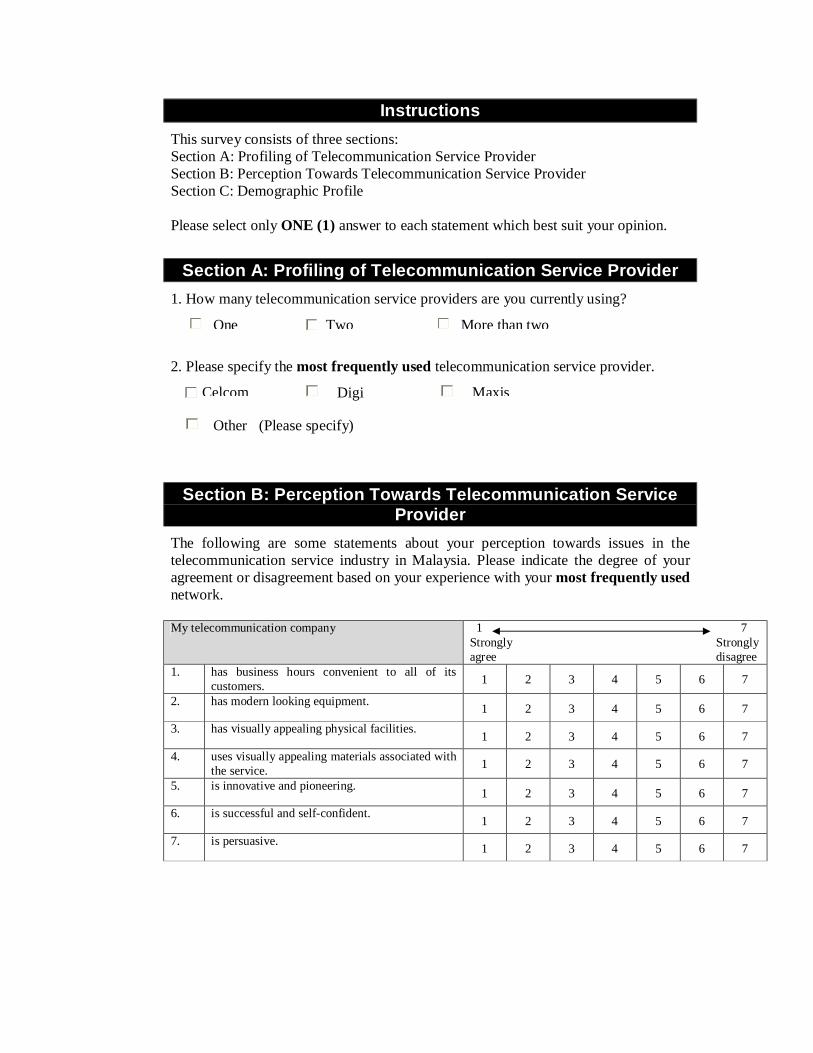
Celcom
Instructions This survey consists of three sections: Section A: Profiling of Telecommunication Service Provider Section B: Perception Towards Telecommunication Service Provider Section C: Demographic Profile Please select only ONE (1) answer to each statement which best suit your opinion.
Section A: Profiling of Telecommunication Service Provider 1. How many telecommunication service providers are you currently using?
2. Please specify the most frequently used telecommunication service provider.
Section B: Perception Towards Telecommunication Service Provider
The following are some statements about your perception towards issues in the telecommunication service industry in Malaysia. Please indicate the degree of your agreement or disagreement based on your experience with your most frequently used network. My telecommunication company 1 7
Strongly Strongly agree disagree
1. has business hours convenient to all of its customers. 1 2 3 4 5 6 7
2. has modern looking equipment. 1 2 3 4 5 6 7 3. has visually appealing physical facilities. 1 2 3 4 5 6 7 4. uses visually appealing materials associated with
the service. 1 2 3 4 5 6 7
5. is innovative and pioneering. 1 2 3 4 5 6 7 6. is successful and self-confident. 1 2 3 4 5 6 7 7. is persuasive. 1 2 3 4 5 6 7
One Two More than two
Digi Maxis
Other (Please specify)
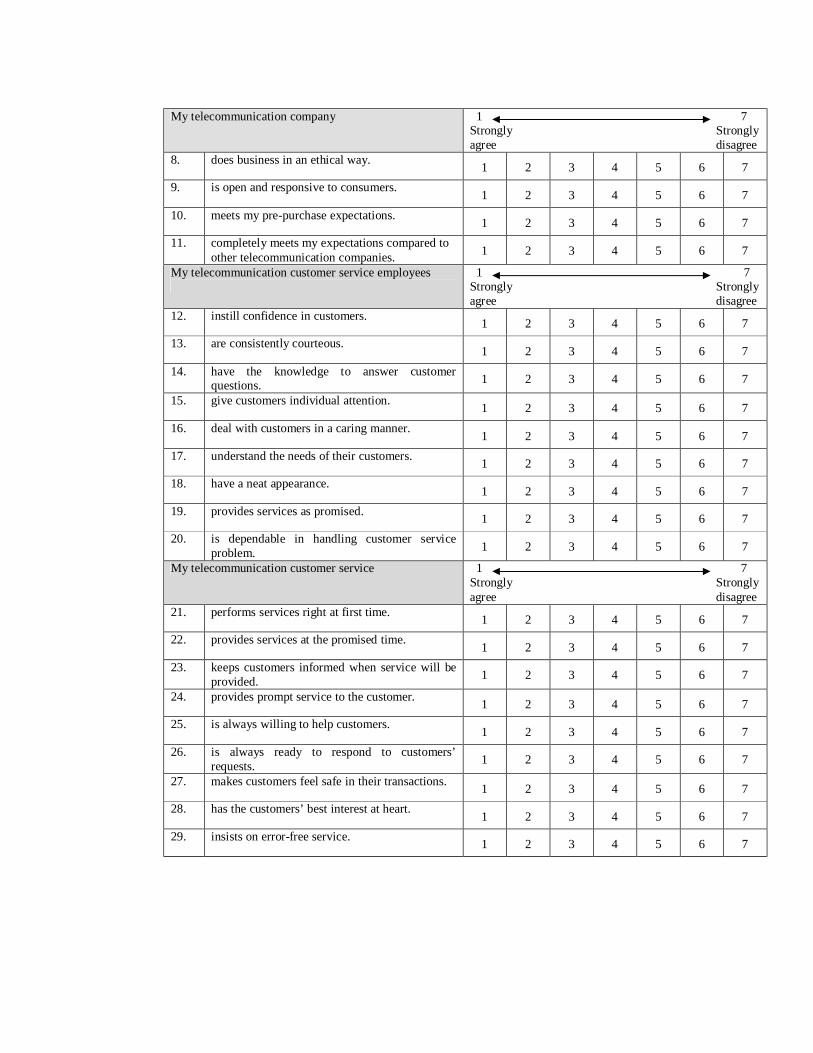
My telecommunication company 1 7
Strongly Strongly agree disagree
8. does business in an ethical way. 1 2 3 4 5 6 7 9. is open and responsive to consumers. 1 2 3 4 5 6 7 10. meets my pre-purchase expectations. 1 2 3 4 5 6 7 11. completely meets my expectations compared to
other telecommunication companies. 1 2 3 4 5 6 7
My telecommunication customer service employees
1 7 Strongly Strongly agree disagree
12. instill confidence in customers. 1 2 3 4 5 6 7 13. are consistently courteous. 1 2 3 4 5 6 7 14. have the knowledge to answer customer
questions. 1 2 3 4 5 6 7
15. give customers individual attention. 1 2 3 4 5 6 7 16. deal with customers in a caring manner. 1 2 3 4 5 6 7 17. understand the needs of their customers. 1 2 3 4 5 6 7 18. have a neat appearance. 1 2 3 4 5 6 7 19. provides services as promised. 1 2 3 4 5 6 7 20. is dependable in handling customer service
problem. 1 2 3 4 5 6 7
My telecommunication customer service 1 7 Strongly Strongly agree disagree
21. performs services right at first time. 1 2 3 4 5 6 7 22. provides services at the promised time. 1 2 3 4 5 6 7 23. keeps customers informed when service will be
provided. 1 2 3 4 5 6 7
24. provides prompt service to the customer. 1 2 3 4 5 6 7 25. is always willing to help customers. 1 2 3 4 5 6 7 26. is always ready to respond to customers’
requests. 1 2 3 4 5 6 7
27. makes customers feel safe in their transactions. 1 2 3 4 5 6 7 28. has the customers’ best interest at heart. 1 2 3 4 5 6 7 29. insists on error-free service. 1 2 3 4 5 6 7
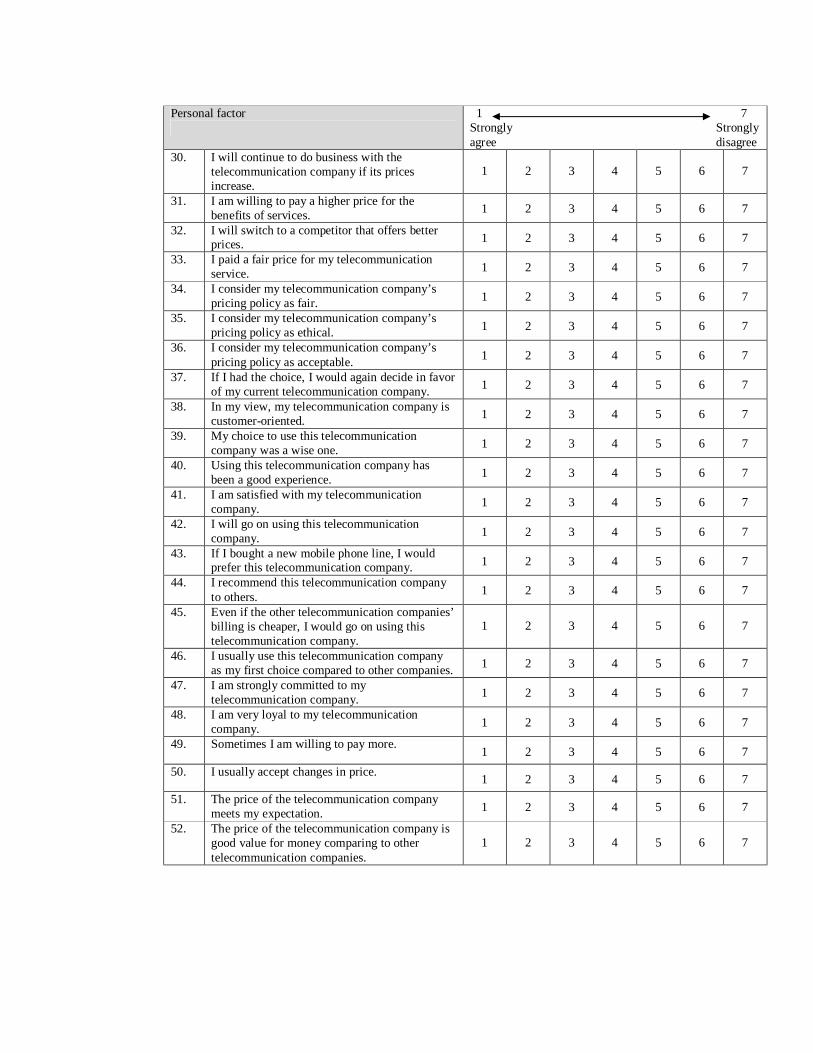
Personal factor
1 7 Strongly Strongly agree disagree
30. I will continue to do business with the telecommunication company if its prices increase.
1 2 3 4 5 6 7
31. I am willing to pay a higher price for the benefits of services. 1 2 3 4 5 6 7
32. I will switch to a competitor that offers better prices. 1 2 3 4 5 6 7
33. I paid a fair price for my telecommunication service. 1 2 3 4 5 6 7
34. I consider my telecommunication company’s pricing policy as fair. 1 2 3 4 5 6 7
35. I consider my telecommunication company’s pricing policy as ethical. 1 2 3 4 5 6 7
36. I consider my telecommunication company’s pricing policy as acceptable. 1 2 3 4 5 6 7
37. If I had the choice, I would again decide in favor of my current telecommunication company. 1 2 3 4 5 6 7
38. In my view, my telecommunication company is customer-oriented. 1 2 3 4 5 6 7
39. My choice to use this telecommunication company was a wise one. 1 2 3 4 5 6 7
40. Using this telecommunication company has been a good experience. 1 2 3 4 5 6 7
41. I am satisfied with my telecommunication company. 1 2 3 4 5 6 7
42. I will go on using this telecommunication company. 1 2 3 4 5 6 7
43. If I bought a new mobile phone line, I would prefer this telecommunication company. 1 2 3 4 5 6 7
44. I recommend this telecommunication company to others. 1 2 3 4 5 6 7
45. Even if the other telecommunication companies’ billing is cheaper, I would go on using this telecommunication company.
1 2 3 4 5 6 7
46. I usually use this telecommunication company as my first choice compared to other companies. 1 2 3 4 5 6 7
47. I am strongly committed to my telecommunication company. 1 2 3 4 5 6 7
48. I am very loyal to my telecommunication company. 1 2 3 4 5 6 7
49. Sometimes I am willing to pay more. 1 2 3 4 5 6 7 50. I usually accept changes in price. 1 2 3 4 5 6 7 51. The price of the telecommunication company
meets my expectation. 1 2 3 4 5 6 7
52. The price of the telecommunication company is good value for money comparing to other telecommunication companies.
1 2 3 4 5 6 7
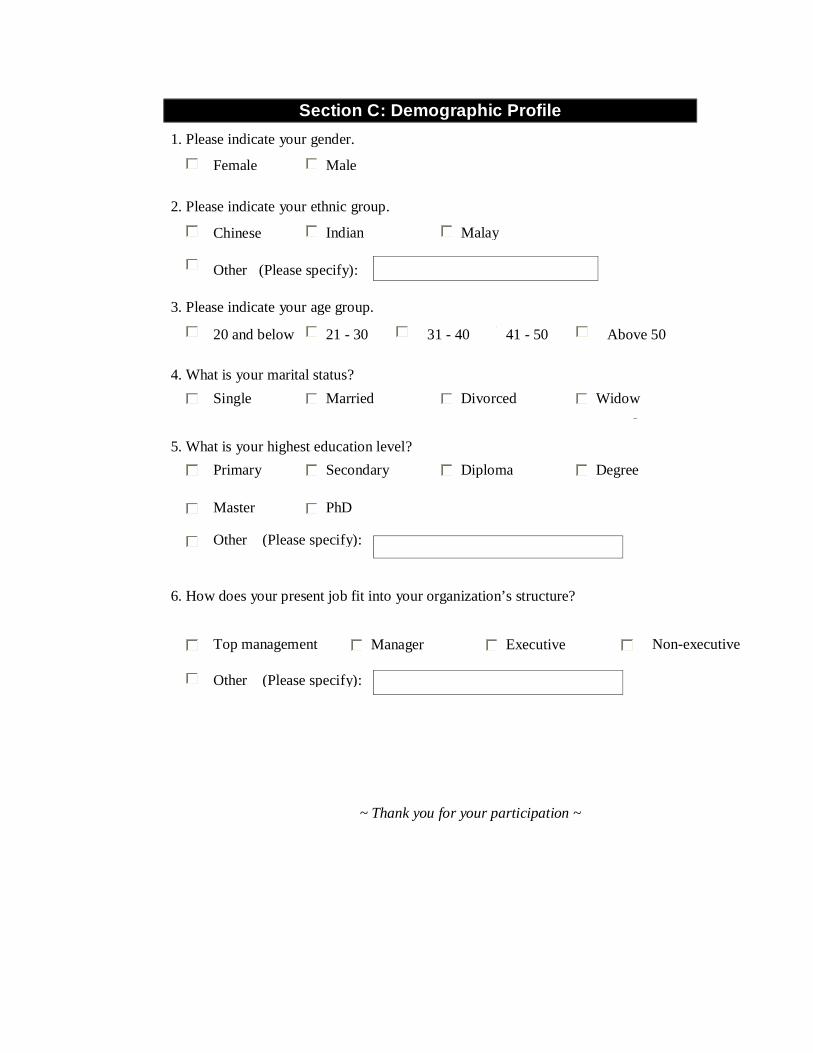
Other (Please specify):
Section C: Demographic Profile 1. Please indicate your gender.
2. Please indicate your ethnic group.
3. Please indicate your age group.
4. What is your marital status?
□ Single 5. What is your highest education level?
□
6. How does your present job fit into your organization’s structure?
Male Female
20 and below 21 - 30 31 - 40 41 - 50 Above 50
Chinese Indian Malay
Single Married Divorced Widow
Primary Secondary Diploma Degree
Master PhD
Top management Manager Executive
Other (Please specify):
Non-executive
Other (Please specify):
~ Thank you for your participation ~