Embed Size (px)
Citation preview
1
Relationships between form, morphology, density and energy in urban environments GEA Background Paper, prepared by: Michael Doherty, Hitomi Nakanishi, Xuemei Bai and Jacqui Meyers CSIRO Sustainable Ecosystems, Canberra, Australia 1.0 INTRODUCTION Around the world, populations are urbanising. Coupled with the potential impacts of human-induced climate change, this shift provides renewed impetus to efforts to understand how form, function and resource usage interact in urban environments. In some cities, per capita energy consumption has grown at approximately the same rate as their spatial growth (Baynes and Bai, 2009). From an urban metabolic viewpoint, energy is one of the most critical resource flows in urban environments. It is a primary driver of both the physical and economic systems; in the form of fossil fuels it is also a primary source of greenhouse gas (GHG) emissions and a driver of human-induced climate change. Therefore, managing urban energy use is fundamental to strategies to mitigate GHG emissions by reducing energy use or substituting fossil fuels with non-GHG-producing alternatives. Moreover, if they are to cope with existing and future changes in climate, urban populations need to develop adaptation strategies that draw on knowledge about energy usage, energy performance and energy efficiency. In an ideal world, energy would be sourced from non-polluting renewable sources and the relativities of energy usage and energy efficiency would matter less. Society, however, remains highly dependent on fossil fuels and an understanding of energy relationships within cities is still of critical importance. Given the significant (and growing) contribution of cities to GHG emissions (Bai, 2007), addressing global climate change effectively in cities is a major challenge. Linking urban energy consumption to urban form, density and morphology provides an opportunity to address climate change at this local level. Much of the literature (e.g. Jenks, Burton and Williams (1996), Williams, Burton and Jenks (2000), Jenks and Burgess (2000) and Jenks and Dempsey (2005)) focuses on mitigation as a driver of urban sustainability. Nevertheless, improved planning, urban design and management should be able to both mitigate climate change and provide adaptive approaches that reduce the direct and indirect impacts of climate change on urban areas. Cities and other urban areas are complex social-ecological systems. The primary focus of this paper, however, is not on the behaviour or preferences of individuals within such systems and differences in their energy use and consumption, although
2
we touch on those briefly in relation to urban transportation. Rather, this paper examines the underlying interactions and relationships between materials, their spatial configurations, and their energy consumption, particularly within and between residential land-use types. It focuses on energy performance rather than on the way in which different individuals might utilise the same structures: human behaviour adds another layer of operational complexity which will vary socioeconomically within cities and culturally between countries. The paper has six sections, including this introduction. Section 2 defines and discusses some of the terms used in the paper. Section 3 examines the relationship between operational energy and urban density, morphology and vegetation. Section 4 discusses the relationship between transport energy and urban form and density. Section 5 highlights some of the trade-offs that affect the relationship between urban energy use and urban form, density and morphology. Section 6 presents the paper’s conclusions. 2.0 TERMS AND DEFINITIONS 2.1 Energy in urban environments Urban environments receive both natural and anthropogenically derived energy inputs. These can interact in complex ways. Solar radiation, a natural energy input, is a primary influence on regional and local climates; its direct and re-directed radiant heat is expressed as the mean-radiant-temperature impact (Olgyay, 1963). The intensity of solar radiation is modified to varying extents by ambient air pollution, with its ultraviolet component particularly affected (Landsberg, 1981). Solar radiation interacts with buildings and other infrastructure. The thermal mass of dwellings and structures is greater than an equivalent area of trees; hence, dwellings act as relatively large reservoirs for heat storage and release (Oke, 1989). Most anthropogenic energy is generated outside cities and delivered via infrastructure such as electricity grids and natural gas pipelines for use in industrial, commercial and residential dwellings. Energy to power transportation in the form of petrol and liquid petroleum gas is also a fundamental component of urban environments; it is generally delivered via shipping, road and rail networks. The production, transport and subsequent consumption of this anthropogenic energy leads to direct and indirect GHG emissions. It also produces waste heat, which interacts with local conditions to produce pollution and contributes to the urban heat island effect. Energy consumed in urban environments can be grouped into three categories: • Embodied energy consumed in the manufacture, distribution and deployment of
materials used in the construction of dwellings and their associated infrastructure • Operational energy consumed in the heating and cooling of dwellings and in
running the appliances used within them
3
• Transport energy (both private and public) consumed in travels undertaken for both work and domestic purposes.
A fourth category, maintenance energy, should also be considered (Newton et al., 2000): that is, the embodied energy of a structure should be discounted over the life of the structure, including the energy cost of ongoing maintenance. Similarly, the concept of primary energy versus delivered energy can be applied when investigating operational energy use in dwellings. Primary energy includes a factor for the energy used in the manufacture and delivery of energy to a dwelling – it is, therefore, a measure of the embodied energy contained in the delivered energy type (Pullen, 2000). The relative benefits of achieving efficiencies or reductions in one category of energy over another can only be assessed over the full life cycle of dwellings and their associated infrastructure, including transport infrastructure. In an assessment of the urban energy budget for a particular area, the type, durability and recyclability of materials used will dictate the importance of embodied energy. The number of occupants and their habits will dictate the importance of operational energy; their places of residence and work and the provision of local amenities will dictate the importance of transport energy. Codoban and Kennedy (2008) attempted to address these components at a neighbourhood scale in Toronto. They assessed three key metabolic processes: 1) operation of buildings (operational energy); 2) the preparation and consumption of meals and beverages (human processing); and 3) the use of personal and public transport (transport energy). Although the human processing component is not directly relevant to our focus on energy consumption, the other two components of the study clearly are; such research shows that the metabolic approach can be used at different scales, from city to household. 2.2 Measures of density The concept of density in urban environments is plagued by a plethora of definitions that vary depending on purpose. Confusion arises partly because density can refer to either dwellings or people per unit area, and most calculations of people per unit area are based on an assumed average number of people per dwelling (Jenks and Dempsey, 2005). Most definitions are linked in the sense that they at least attempt to identify low-, medium- and high-density categories in a relative sense for planning purposes, but the precise meaning of such categories varies enormously both within and between countries. Greed (2004), for example, specified two main types of residential density in the United Kingdom: net and gross. Net density (‘net residential density’ in Australia) is measured as the dimensions of a given urban block, including the distance halfway into the facing road; gross density (‘neighbourhood density’ in Australia) includes net density plus the land occupied by shops, schools, amenity and distributor roads, etc. Densities of housing types in the United Kingdom can vary from 2.5 to 10 dwellings per hectare for large detached houses on the urban edge, to 200 dwellings per hectare for 10-to-15-storey inner-urban high-rises. Assuming three persons per dwelling, the population density varies from 7 to 30 persons per hectare on the urban edge to 600 persons per hectare in inner-urban areas. By way of contrast, Boyden et al. (1981) reported that 43% of the population in Hong Kong were living at
4
densities of greater than 1000 people per hectare; only 14% were living in areas with a density of less than 250 people per hectare. Note that ‘high rise’ does not always equate to higher density or greater energy efficiency. Isolated high-rise towers of greater than nine floors, such as those constructed along the lines of Le Corbusier’s designs in the early to mid 20th century and found in many European cities, result in lower person-per-unit-area densities than more closely spaced but lower (4-6 floor) apartments, such as those found in older parts of Paris and London (Salat and Morterol, 2006). The relationship between density and energy use is not straightforward. Changes to urban form and density are part of wider changes to the demographic structures of cities, including decreasing household sizes, increasing numbers of households, and increasing income levels. The changing nature of households can have a significant impact on energy consumption in cities. Increasing divorce or separation rates, for example, can contribute to higher energy use if they lead to smaller-sized but more numerous households (Yu and Liu, 2007). 2.3 Urban morphology and urban form Although the terms ‘urban morphology’ and ‘urban form’ are sometimes used interchangeably in the literature, they are generally discussed and treated at different spatial scales. Urban morphology, sometimes referred to as the ‘urban fabric’ or ‘urban texture’, deals primarily with the particular shape and dimensions of the built environment and with the aggregations and configurations of building types. At this fine scale the configurations of cities directly affect both outdoor and indoor climates and have a direct bearing on embodied and operational energy use (Adolphe, 2001). Urban form refers to the arrangement of the larger functional units of a city, reflecting both the historical development of the city and its more recent planning history; it is defined by the spatial patterning of industrial, commercial and residential land uses and also by different levels of residential density (Rose, 1967). Newton (2000) summarised the key alternative urban forms or ‘archetypal urban geometries’: the dispersed city, the compact city, the edge city, the corridor city, and the fringe city. The respective merits of the dispersed and compact cities (‘suburban spread’ versus ‘urban densification’) have been debated since the early 19th century. Brehny (1986) categorised the protagonists as belonging to either the ‘decentrist’ (advocating the dispersed city model) or ‘centrist’ (advocating the compact city model) camps. Arguments for reduced urban density by the decentrists in the 1800s were driven by a desire to mitigate the squalid conditions that occurred in urban centres at that time. With the advent of cheap, mass-produced automobiles after World War II, however, the debate for increased urban density by centrists has been driven by a desire to reduce environmental impacts, particularly those caused by transport emissions and the outward sprawl of urban areas into agricultural land (Jenks, Burton and Williams, 1986; Jenks and Burgess, 2000). Jabareen (2006) provided a thematic typology of literature from the sustainable development and environmental planning fields and suggested that urban sustainable development has traditionally been addressed at four spatial levels: 1) the regional and
5
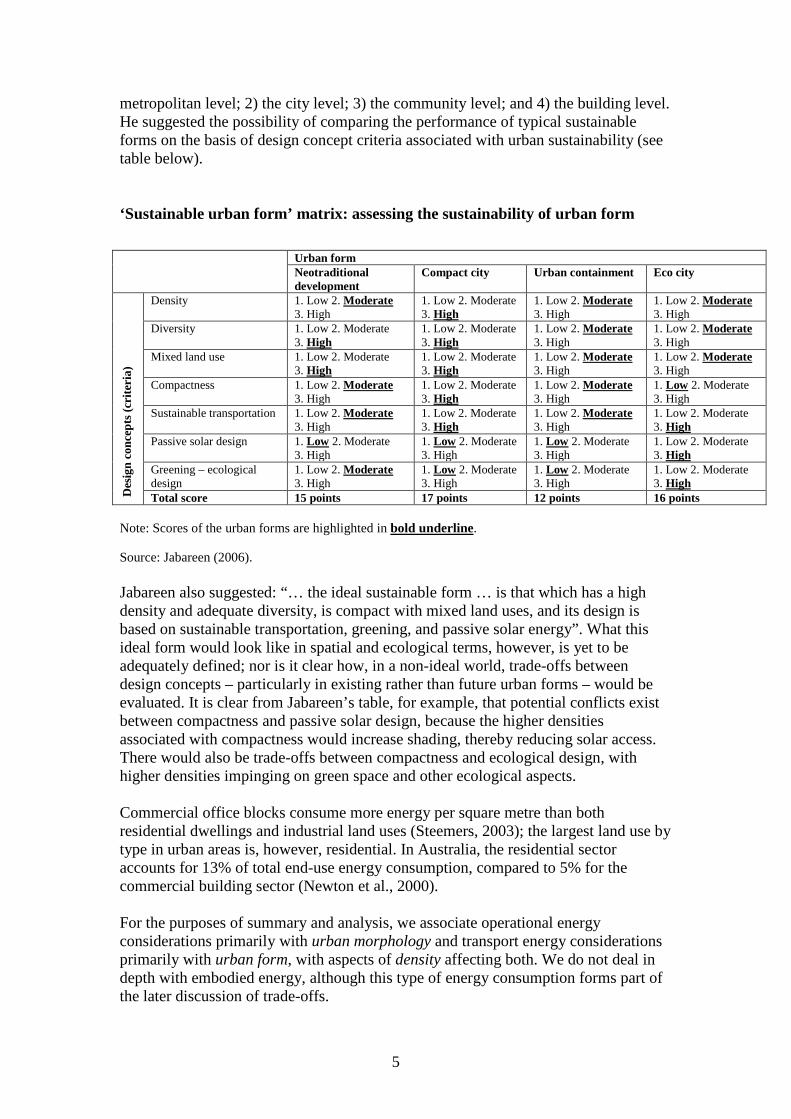
metropolitan level; 2) the city level; 3) the community level; and 4) the building level. He suggested the possibility of comparing the performance of typical sustainable forms on the basis of design concept criteria associated with urban sustainability (see table below). ‘Sustainable urban form’ matrix: assessing the sustainability of urban form Urban form
Neotraditional development
Compact city Urban containment Eco city
Des
ign
conc
epts
(cri
teri
a)
Density 1. Low 2. Moderate 3. High
1. Low 2. Moderate 3. High
1. Low 2. Moderate 3. High
1. Low 2. Moderate 3. High
Diversity 1. Low 2. Moderate 3. High
1. Low 2. Moderate 3. High
1. Low 2. Moderate 3. High
1. Low 2. Moderate 3. High
Mixed land use 1. Low 2. Moderate 3. High
1. Low 2. Moderate 3. High
1. Low 2. Moderate 3. High
1. Low 2. Moderate 3. High
Compactness 1. Low 2. Moderate 3. High
1. Low 2. Moderate 3. High
1. Low 2. Moderate 3. High
1. Low 2. Moderate 3. High
Sustainable transportation 1. Low 2. Moderate 3. High
1. Low 2. Moderate 3. High
1. Low 2. Moderate 3. High
1. Low 2. Moderate 3. High
Passive solar design 1. Low 2. Moderate 3. High
1. Low 2. Moderate 3. High
1. Low 2. Moderate 3. High
1. Low 2. Moderate 3. High
Greening – ecological design
1. Low 2. Moderate 3. High
1. Low 2. Moderate 3. High
1. Low 2. Moderate 3. High
1. Low 2. Moderate 3. High
Total score 15 points 17 points 12 points 16 points Note: Scores of the urban forms are highlighted in bold underline. Source: Jabareen (2006). Jabareen also suggested: “… the ideal sustainable form … is that which has a high density and adequate diversity, is compact with mixed land uses, and its design is based on sustainable transportation, greening, and passive solar energy”. What this ideal form would look like in spatial and ecological terms, however, is yet to be adequately defined; nor is it clear how, in a non-ideal world, trade-offs between design concepts – particularly in existing rather than future urban forms – would be evaluated. It is clear from Jabareen’s table, for example, that potential conflicts exist between compactness and passive solar design, because the higher densities associated with compactness would increase shading, thereby reducing solar access. There would also be trade-offs between compactness and ecological design, with higher densities impinging on green space and other ecological aspects. Commercial office blocks consume more energy per square metre than both residential dwellings and industrial land uses (Steemers, 2003); the largest land use by type in urban areas is, however, residential. In Australia, the residential sector accounts for 13% of total end-use energy consumption, compared to 5% for the commercial building sector (Newton et al., 2000). For the purposes of summary and analysis, we associate operational energy considerations primarily with urban morphology and transport energy considerations primarily with urban form, with aspects of density affecting both. We do not deal in depth with embodied energy, although this type of energy consumption forms part of the later discussion of trade-offs.
6
3.0 OPERATIONAL ENERGY RELATIONSHIPS 3.1 Density, morphology and operational energy Dwelling operational energy is consumed by activities such as heating, cooling and running a household, all of which affect liveability and all of which interact with external climatic drivers. The amount of heating or cooling varies climatically and particularly latitudinally. This was well summarised by Olgyay (1963): “The relation of the seasonal load amplitudes indicates that a structure in the hot-humid zone should be constructed for the single purpose of reducing heat loads. The shelters of the temperate and hot-arid zones have the dual role of conserving or decreasing thermal impacts in the appropriate seasons. The structure of the cool zone tends to have the single function of avoiding heat loss, and this unilateral function will be even more prominent at higher latitudes.” Newton et al. (2000) also suggested that, as a general rule, the warmer the climate the lower the overall operational energy required, as heating is the major driver of energy consumption ahead of cooling and refrigeration. Reducing the operational energy associated with heating has been the focus of a great deal of literature from northern European countries (Littler and Thomas, 1984).
Given regional climatic variation and differences in dwelling designs between climatic zones, an important research question is: what is the variation in operational energy consumption between different building types within a particular climatic zone or region? Literature on this question has emerged in the past decade. Pullen (2000), for example, estimated embodied and operational energy for a sample of 25 dwellings in Adelaide over a 50-year period (from construction to demolition), calculating a ratio of operational to embodied energy of 4:1. Although the estimate of embodied energy was larger than previously considered, the operational energy required to run a household was still significantly higher than the embodied energy used to build it.
Newton et al. (2000) evaluated and modelled the energy performance of two ‘typical’ dwelling types – detached houses and apartments – across a range of climatic zones in Australia. Two main conclusions were drawn: 1) annual heating and cooling energy and embodied energy per unit area were similar for apartments and detached houses. Per person, however, the life cycle energy of apartments was significantly (10–30%) less than that of detached houses in all circumstances because the area occupied per person was much less; and b) life cycle carbon dioxide emissions per unit area varied considerably by climatic zone. Newton et al. suggested that a shift in dwelling type from detached house to apartment would result in significant operational energy savings and concomitant GHG reductions.
Pullen has further developed approaches to mapping embodied energy in both Adelaide (Pullen et al., 2002; Pullen, 2007) and Sydney (Pullen et al., 2006); such approaches are equally applicable to mapping operational energy consumption, which, given the ratio of operational to embodied energy of 4:1 stated above, is arguably more useful for assessing the energy performance of dwellings.
In Canada, the CANMET Energy Technology Centre developed its Canadian Urban Archetypes Project in 2004 to: “… investigate linkages between urban form, resident lifestyle patterns and associated energy consumption within selected Canadian
7
neighbourhoods” (Webster, 2007). The project aims to undertake the comparative analysis of energy consumption based on a range of urban morphological types. For each type, the energy costs and GHG emissions of typical houses are estimated on the basis of two key components: housing and transportation.
Steemers (2003) investigated density, building energy and transport in the United Kingdom. For domestic buildings there are three primary ways to increase density: 1) by increasing building depth; 2) by increasing building height; and 3) by increasing compactness (i.e. moving from detached dwellings to apartments). Steemers suggested that, since most existing dwellings are not solar passive, the energy consequences for a non-solar urban dwelling of obstructions caused by increasing density are small. Assuming adequate access to sun, light and air, Steemer concluded that relatively high housing densities could be achieved before a negative impact on energy demand became significant.
Salat and Morterol (2006) compared 18th-century, 19th-century and modernist urban morphologies in Paris, assessing five factors (sensu Baker and Steemers, 2000) in relation to carbon dioxide emissions for heating: 1) the efficiency of urban form in relation to compactness; 2) a building’s envelope performance; 3) heating equipment type, age and efficiencies; 4) inhabitant behaviour; and 5) type of energy used. Salat and Morterol asserted that an efficiency factor of up to 20 could be achieved from the worst-performing to the best-performing urban morphology by taking these five factors into account. Salat and Guesne (2008) investigated a greater range of morphologies in Paris and suggested that, when considering heating energy, the less dense the texture the greater the energy required for heating.
Steemers (2003) calculated a ratio of operational energy to transport energy of 2:1 for the United Kingdom. As dwelling density increases, however, the relative importance of transport energy declines due to proximity to the city centre and greater transport choices, increasing this ratio. Within the city itself, Steemers noted that commercial buildings had greater energy consumption than residential buildings on a per unit area basis. In line with the study of Newton et al. (2000), Steemers also found that within-house energy consumption was dominated by space heating, contributing 60% of the energy used in the household. In lower latitudes, such as those occupied by Australia’s capital cities with the possible exception of Hobart, summer cooling is a significant issue. Some inland cities have a significant need for both summer cooling and winter heating; in Canberra, for example, the temperature can range from minimums of –8 in winter to maximums of +36 in summer. Efforts to reduce humidity in buildings is also a significant factor in the energy consumption of tropical or subtropical cities such as Singapore and Hong Kong. 3.2 Operational energy and urban vegetation Urban areas are typically warmer than surrounding areas, with temperature differences greatest at night and in summer (Rizwan, 2008); this phenomenon is known as the urban heat island effect (Landsberg, 1981). The difference in temperature between the city centre and surrounding suburbs can be several degrees Celsius, adding to demands on summer cooling systems and therefore increasing
8
energy consumption (Akbari et al., 2001; Bolund and Hunhammar, 1999). Increases of 0.5–3.0ºC and a corresponding increase in electricity demand of 2–4% for each 1ºC increase in temperature have been found in several United States cities (Akbari et al., 2001). Warmer cites exhibit increased human mortality rates (Changnon et al., 1996), higher levels of ground-level ozone and smog (Rosenfeld et al., 1998; Bolund and Hunhammar, 1999), and a generally lower-quality living environment. Vegetation can play a significant role in regulating the urban microclimate and can influence operational energy demand through solar absorption and the cooling effects provided by shade and evapotranspiration (Yamamoto, 2006; Akbari and Conopacki, 2005; Carvet et al., 2004; Akbari, 2002; Akbari et al., 2001, Shashua-Bar and Hoffman, 2000; Ca et al., 1998; Heisler, 1986). Such interactions can be used to mitigate both macroclimatic and urban heat island effects. Since the urban heat island effect occurs at a mesoclimatic scale, it forms the interactive boundary between the extrinsic effects of the macroclimate and the intrinsic effects of the microclimate. Many studies of the urban heat island effect have been conducted in recent years, with a particular focus on the study of boundary-layer climatology (Arnfield, 2001; Alberti, 2008); recent general reviews of the urban heat island effect include Oke (1997), Rizwan (2008) and Alberti (2008). The main cause of the urban heat island effect is the large amount of solar radiation that is absorbed by building materials such as walls, roofs and pavements during the day and released at night (Rizwan, 2008). This effect is exacerbated by several factors specific to cities. Cities have a low albedo (reflectance) because of the canyon-like geometry of buildings and streets and therefore they absorb more solar radiation. Moreover, the massive building structures can store immense amounts of heat and also impede the flow of heat into the cooler night sky (Oke, 1982). High buildings block the movement of cooling convective winds and the lack of vegetation inhibits cooling by evapotranspiration. Air pollutants in cities absorb and re-radiate long-wave radiation, adding to the urban heat island effect (Rizwan, 2008). In addition, urban environments are heated directly by sources including air conditioners, vehicles and power plants. Four key factors influence climate at the local scale in urban environments: 1) urban structure (the dimensions of buildings and the spaces between them, street widths and street spacing); 2) land cover (the proportion of built-up, paved and vegetated surfaces, bare soil and water); 3) the urban fabric (construction and natural materials); and 4) urban heat metabolism (heat, water and pollutants due to human activity) (Oke, 2004). Of particular interest at the landscape scale is the extent to which land-cover type (e.g. vegetation, bare soil or paved area) and land-use type (e.g. residential, commercial or industrial) account for variations in temperature across the urban landscape (Alberti, 2008). There is a strong relationship, for example, between the amount of impervious cover in a city and the relative increase in temperature difference. Many strategies have been suggested at the scale of buildings to reduce the urban heat island effect, such as reducing energy use (Urano et al., 1999; Kikegawa et al., 2006), using high-albedo building and roofing materials (Rosenfeld et al., 1998; Ihara et al., 2008; Takebayashi and Moriyama, 2007), increasing ventilation (Kolokotroni et al., 2006), using green roofs (Wong et al., 2003, 2007) and using water to cool buildings (Sodha et al., 1980; Tiwara et al., 1982; Urana et al., 1999). A recent innovation is a concrete mix that can achieve up to 71% higher albedo than conventional concrete
9
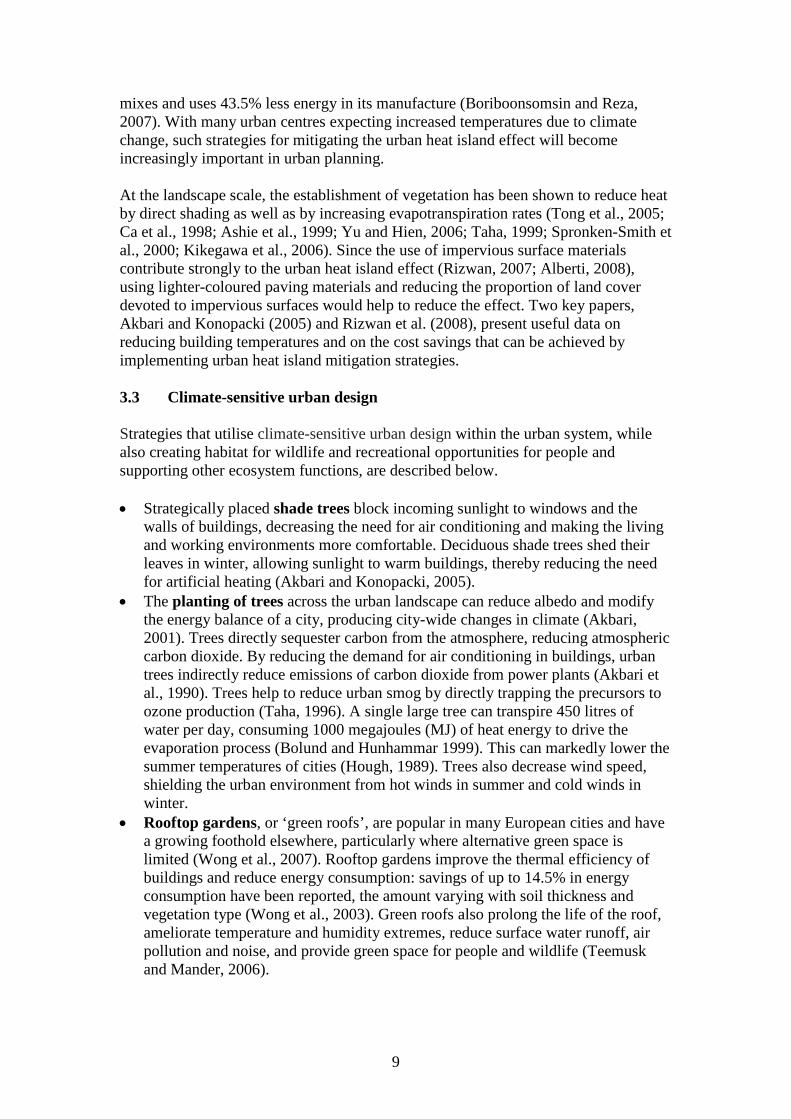
mixes and uses 43.5% less energy in its manufacture (Boriboonsomsin and Reza, 2007). With many urban centres expecting increased temperatures due to climate change, such strategies for mitigating the urban heat island effect will become increasingly important in urban planning. At the landscape scale, the establishment of vegetation has been shown to reduce heat by direct shading as well as by increasing evapotranspiration rates (Tong et al., 2005; Ca et al., 1998; Ashie et al., 1999; Yu and Hien, 2006; Taha, 1999; Spronken-Smith et al., 2000; Kikegawa et al., 2006). Since the use of impervious surface materials contribute strongly to the urban heat island effect (Rizwan, 2007; Alberti, 2008), using lighter-coloured paving materials and reducing the proportion of land cover devoted to impervious surfaces would help to reduce the effect. Two key papers, Akbari and Konopacki (2005) and Rizwan et al. (2008), present useful data on reducing building temperatures and on the cost savings that can be achieved by implementing urban heat island mitigation strategies. 3.3 Climate-sensitive urban design Strategies that utilise climate-sensitive urban design within the urban system, while also creating habitat for wildlife and recreational opportunities for people and supporting other ecosystem functions, are described below. • Strategically placed shade trees block incoming sunlight to windows and the
walls of buildings, decreasing the need for air conditioning and making the living and working environments more comfortable. Deciduous shade trees shed their leaves in winter, allowing sunlight to warm buildings, thereby reducing the need for artificial heating (Akbari and Konopacki, 2005).
• The planting of trees across the urban landscape can reduce albedo and modify the energy balance of a city, producing city-wide changes in climate (Akbari, 2001). Trees directly sequester carbon from the atmosphere, reducing atmospheric carbon dioxide. By reducing the demand for air conditioning in buildings, urban trees indirectly reduce emissions of carbon dioxide from power plants (Akbari et al., 1990). Trees help to reduce urban smog by directly trapping the precursors to ozone production (Taha, 1996). A single large tree can transpire 450 litres of water per day, consuming 1000 megajoules (MJ) of heat energy to drive the evaporation process (Bolund and Hunhammar 1999). This can markedly lower the summer temperatures of cities (Hough, 1989). Trees also decrease wind speed, shielding the urban environment from hot winds in summer and cold winds in winter.
• Rooftop gardens, or ‘green roofs’, are popular in many European cities and have a growing foothold elsewhere, particularly where alternative green space is limited (Wong et al., 2007). Rooftop gardens improve the thermal efficiency of buildings and reduce energy consumption: savings of up to 14.5% in energy consumption have been reported, the amount varying with soil thickness and vegetation type (Wong et al., 2003). Green roofs also prolong the life of the roof, ameliorate temperature and humidity extremes, reduce surface water runoff, air pollution and noise, and provide green space for people and wildlife (Teemusk and Mander, 2006).
10
• Water bodies such as lakes, wetlands and rivers moderate the local climate and reduce temperature extremes (Bolund and Hunhammar 1999). They also provide habitat for plants and animals and recreational opportunities for people.
• Permeable, or porous, paving allows water to filter into the ground, keeping the pavement cool when moist (Ferguson, 2005). These can be constructed from porous concretes and asphalts, plastic lattices filled with soil, gravel or grass, or soft paving materials such as wood mulch, crushed shell and decking (Frazer 2005).
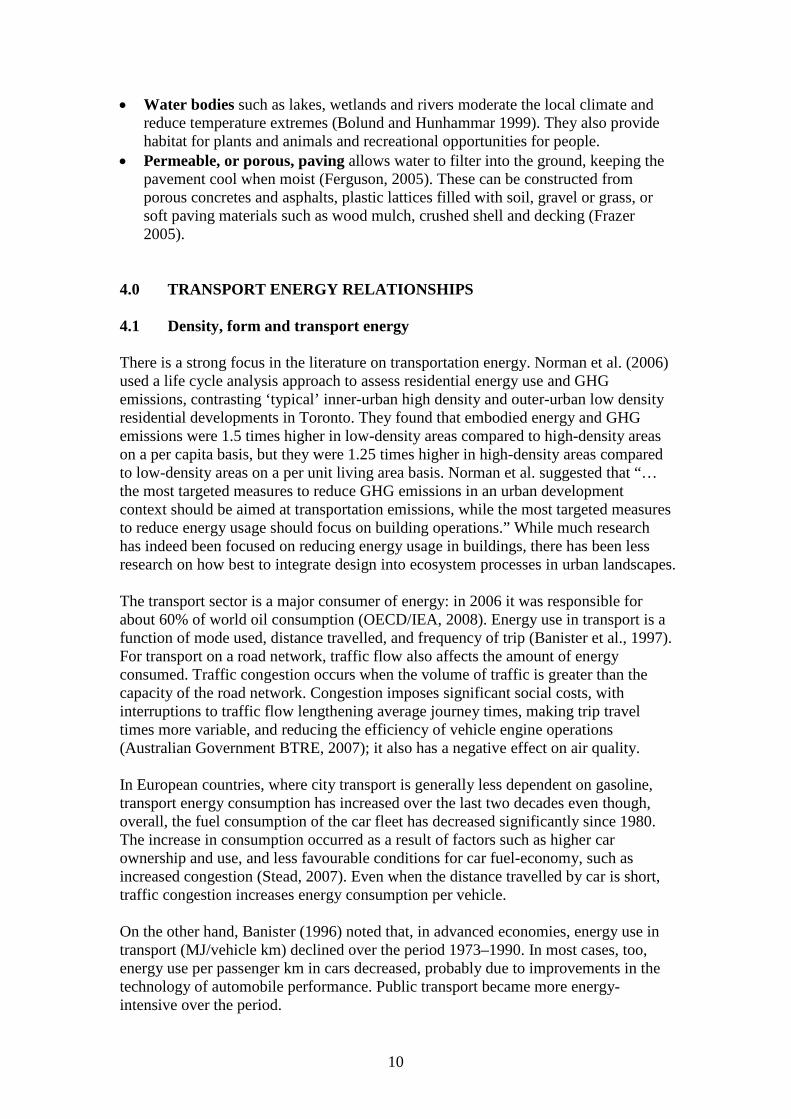
4.0 TRANSPORT ENERGY RELATIONSHIPS 4.1 Density, form and transport energy There is a strong focus in the literature on transportation energy. Norman et al. (2006) used a life cycle analysis approach to assess residential energy use and GHG emissions, contrasting ‘typical’ inner-urban high density and outer-urban low density residential developments in Toronto. They found that embodied energy and GHG emissions were 1.5 times higher in low-density areas compared to high-density areas on a per capita basis, but they were 1.25 times higher in high-density areas compared to low-density areas on a per unit living area basis. Norman et al. suggested that “… the most targeted measures to reduce GHG emissions in an urban development context should be aimed at transportation emissions, while the most targeted measures to reduce energy usage should focus on building operations.” While much research has indeed been focused on reducing energy usage in buildings, there has been less research on how best to integrate design into ecosystem processes in urban landscapes. The transport sector is a major consumer of energy: in 2006 it was responsible for about 60% of world oil consumption (OECD/IEA, 2008). Energy use in transport is a function of mode used, distance travelled, and frequency of trip (Banister et al., 1997). For transport on a road network, traffic flow also affects the amount of energy consumed. Traffic congestion occurs when the volume of traffic is greater than the capacity of the road network. Congestion imposes significant social costs, with interruptions to traffic flow lengthening average journey times, making trip travel times more variable, and reducing the efficiency of vehicle engine operations (Australian Government BTRE, 2007); it also has a negative effect on air quality. In European countries, where city transport is generally less dependent on gasoline, transport energy consumption has increased over the last two decades even though, overall, the fuel consumption of the car fleet has decreased significantly since 1980. The increase in consumption occurred as a result of factors such as higher car ownership and use, and less favourable conditions for car fuel-economy, such as increased congestion (Stead, 2007). Even when the distance travelled by car is short, traffic congestion increases energy consumption per vehicle. On the other hand, Banister (1996) noted that, in advanced economies, energy use in transport (MJ/vehicle km) declined over the period 1973–1990. In most cases, too, energy use per passenger km in cars decreased, probably due to improvements in the technology of automobile performance. Public transport became more energy-intensive over the period.
11
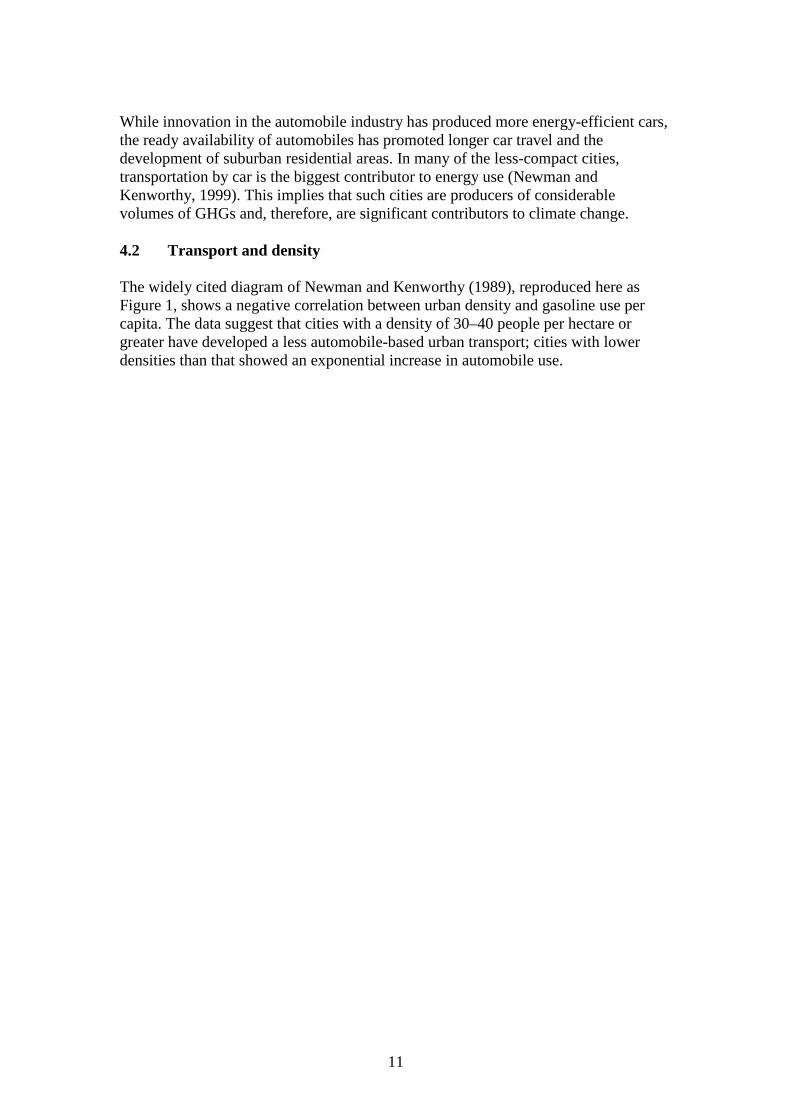
While innovation in the automobile industry has produced more energy-efficient cars, the ready availability of automobiles has promoted longer car travel and the development of suburban residential areas. In many of the less-compact cities, transportation by car is the biggest contributor to energy use (Newman and Kenworthy, 1999). This implies that such cities are producers of considerable volumes of GHGs and, therefore, are significant contributors to climate change. 4.2 Transport and density The widely cited diagram of Newman and Kenworthy (1989), reproduced here as Figure 1, shows a negative correlation between urban density and gasoline use per capita. The data suggest that cities with a density of 30–40 people per hectare or greater have developed a less automobile-based urban transport; cities with lower densities than that showed an exponential increase in automobile use.
12
Australia showed no statistical correlation. A negative correlation between urban density and energy consumption, therefore, cannot be assumed. Banister et al. (1997) supported the importance of urban density to energy consumption but drew attention to the problems associated with the measurement of density. Newman and Kenworthy (1999) noted that, overall, the auto-city of the United States and Australia were characterised by low density in residences and businesses; European cities were generally three to four times denser. Travel patterns and energy use are also affected by the form of a city. Handy (1992), for example, suggested that local accessibility plays a role: in areas with high levels of local accessibility, residents can make low-energy trips, such as walking to downtown, that are infeasible in other areas. Mindali et al. (2004) suggested that the urban structure of a city has a significant influence on its transportation flows but does not determine them entirely. 4.3 The compact city The relationship between transport energy use and density has multi-dimensional aspects. To reduce transport energy through higher-density land use, conditions must be suitable for non-auto travel. According to Meurs and Haaijer (2001), reduced car mobility will be achieved when shops, schools and other daily-use facilities are located close to the home, the road network in the neighbourhood is laid out for slow traffic (e.g. bicycles and pedestrians) and is therefore unsuitable for cars, and the accessibility of locations beyond the neighbourhood discourages car use. The reduction in car use and transport energy consumption will be greatest when such conditions occur in densely built-up areas. Newman and Kenworthy (1999) deemed that the benefits of higher density (and mixed land use), such as reduced travel and better transit options, are unlikely to occur, or to be effective on a large scale, unless development is designed to bring transportation and land use together in a coordinated and planned way. Mixed land uses and concepts of self-containment are important in reducing energy consumption in transport. Nevertheless, local jobs and local facilities must be suitable for local residents; otherwise, long-distance, energy-intensive movements will continue (Banister et al., 1997). The ‘compact city’ might be an appropriate urban form to cope with these concerns. Good examples of compact cities exist, including Hong Kong, Singapore and Freiburg. It might be difficult to achieve all the conditions required to make a perfect compact city, but some can be set by good planning. Stockholm’s planners, for example, believe that a good city has: 1) a railway station within 500–900 metres of most housing; 2) a train service without a timetable; and 3) people living no more than thirty minutes from the city centre. These policies ensure a compact urban form based around a fast electric train service, with housing and other land uses concentrated around stations (Newman and Kenworthy, 1999). This coordination of land-use and transportation policies has been termed transit-oriented development. The idea of location efficiency emphasises the accessibility of opportunities, rather than how mobile one must be to find them (Doi et al., 2008); this is a central concept in recent approaches to transit-oriented development and other forms of sustainable urban development. 4.4 Travel-choice behaviour
13
Transport cannot be discussed without considering the travel-choice behaviour of residents, which is determined by their economic and social circumstances relative to their payable travel costs and available travel time. As citizens, most people agree with the long-term aims of reducing GHG emissions and energy consumption by, for example, reducing travel distances and using more environmentally friendly forms of transport. As consumers, however, people still want to use cars, to not be inconvenienced by public transport, and to consume goods at present high rates (Farthing et al., 1996). Some residents do not change their travel behaviour, even when convenient, low-energy alternatives, such as public transport, walking and cycling, are available. Nijkamp and Rienstra (1996) noted that the private car has brought low-density living within the reach of large groups of upper and lower middle-class families. Moreover, correlations between car ownership and income suggest that more affluent car owners have a higher propensity to travel longer distances by energy-consumptive modes (Banister et al., 1997). In the Netherlands, Nijkamp and Rienstra (1996) found that 40% of all car trips covered a distance of less than 5 km, while only 16% of all public transport trips were shorter than 5 km. Barter (2000) asserted that very high levels of public transport use is possible in high-density cities, even among high-income groups. 4.5 Comprehensive approach to reducing transport energy use There is no single method for reducing energy use in transport. Nevertheless, Crookston et al. (1996) pointed out that a comprehensive approach is required: addressing urban form alone is insufficient. Barret (1996) also suggested that efforts to create or preserve traditional urban forms have some short-run potential for reducing travel but are probably best seen as a form of contingency planning. Soft measures to reduce car travel are also important; options include demand management (pricing, parking and access control, congestion charging); investment in public transport; giving priority to pedestrians and cyclists; and a range of measures designed primarily to reduce the use of single-occupancy cars (Banister, 1996). Many cities are now pursuing transport demand management, which attempts to match demand for travel to the supply of infrastructure, rather than endlessly expanding supply to meet demand (Kenworthy, 2006). Local problems should also to be considered. Congested and dangerous traffic discourages pedestrians and cyclists (Engwicht, 1992). Public road transport is often caught in congested traffic, trains and buses are often overcrowded, and commuter parking can be a significant problem (Farthing et al., 1996). The rail network in the Tokyo metropolitan area The rail network in the Tokyo metropolitan area, comprising rail, subway and monorail (Figure 2), is regarded as the biggest such network in the world. Owned and operated by a mixture of public, private and quasi-private entities, it serves a commuter-shed that extends more than 100 km from the central Tokyo station and includes 3,216 directional km of track and 1,501 stations (Cervero, 2008). Shinjuku station has the greatest ridership in the world, with over 3.5 million people passing through it each day.
14
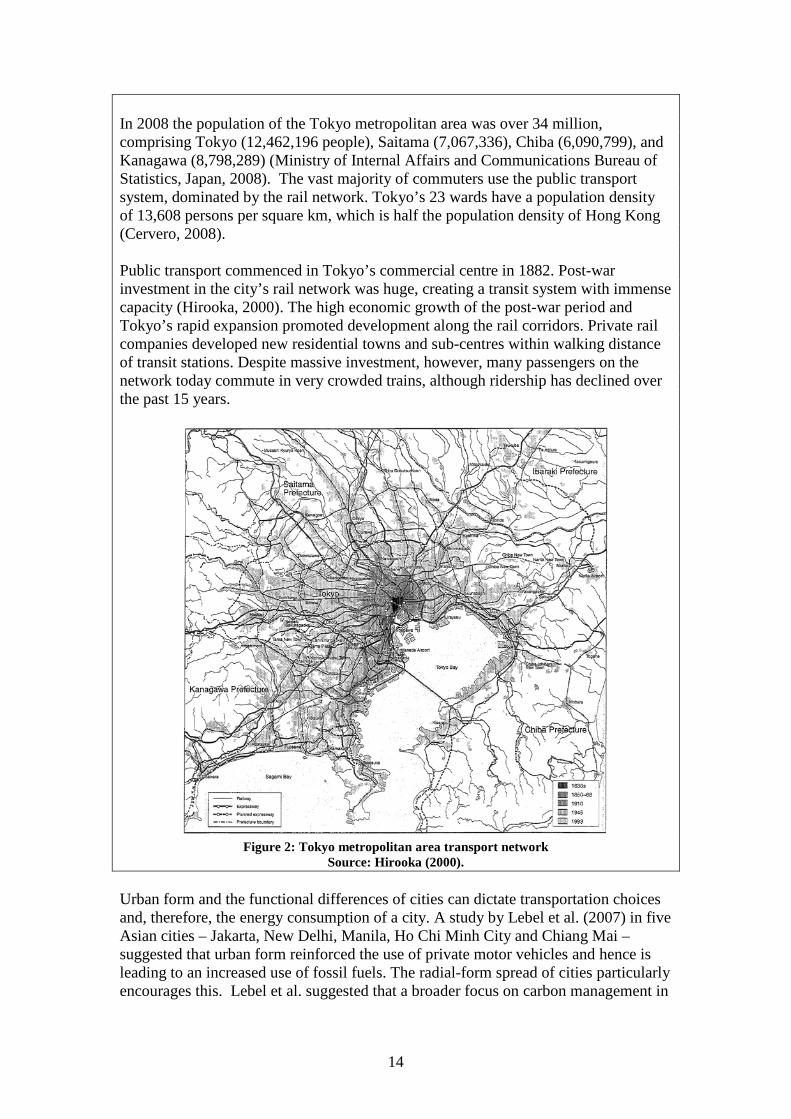
In 2008 the population of the Tokyo metropolitan area was over 34 million, comprising Tokyo (12,462,196 people), Saitama (7,067,336), Chiba (6,090,799), and Kanagawa (8,798,289) (Ministry of Internal Affairs and Communications Bureau of Statistics, Japan, 2008). The vast majority of commuters use the public transport system, dominated by the rail network. Tokyo’s 23 wards have a population density of 13,608 persons per square km, which is half the population density of Hong Kong (Cervero, 2008). Public transport commenced in Tokyo’s commercial centre in 1882. Post-war investment in the city’s rail network was huge, creating a transit system with immense capacity (Hirooka, 2000). The high economic growth of the post-war period and Tokyo’s rapid expansion promoted development along the rail corridors. Private rail companies developed new residential towns and sub-centres within walking distance of transit stations. Despite massive investment, however, many passengers on the network today commute in very crowded trains, although ridership has declined over the past 15 years.
Figure 2: Tokyo metropolitan area transport network
Source: Hirooka (2000). Urban form and the functional differences of cities can dictate transportation choices and, therefore, the energy consumption of a city. A study by Lebel et al. (2007) in five Asian cities – Jakarta, New Delhi, Manila, Ho Chi Minh City and Chiang Mai – suggested that urban form reinforced the use of private motor vehicles and hence is leading to an increased use of fossil fuels. The radial-form spread of cities particularly encourages this. Lebel et al. suggested that a broader focus on carbon management in
15
all its forms might be better than a strategy focused only on energy efficiency or GHG reductions 5.0 TRADE-OFFS Summarizing the discussion so far, the relationships between urban morphology, urban form, urban density and energy consumption are not straightforward; we argue that it is important to recognize the existence of trade-offs and tensions between them. There are trade-offs, for example, between the operational energy used to run a particular dwelling versus the embodied energy needed to build it and the lifetime over which the building will operate: double-brick dwellings might have a higher embodied energy than a brick-veneer dwelling but, in a given climate, a lower operational energy. There is a trade-off between the transport energy savings achieved with higher urban density versus the higher energy use of high-rise buildings. There are also trade-offs between urban density, dwelling type, block size and the ecosystem services provided by vegetation. On both a theoretical and empirical basis it is unclear if there is an ideal urban form and morphology that can maximise energy performance and satisfy all other sustainability criteria. 5.1 Operational energy versus embodied energy While it is important to know the operational and embodied energy of built structures, it is only possible to compare their overall energy performance within and between cities when the typical life cycle of the structures is known. At the extreme ends of the spectrum are structures that last many hundreds of years and others – such as in some rapidly developing Chinese cities (Economist 2005) – that last only a decade or so before demolition and replacement. Assuming that embodied energy is the same, differences in building lifespan will have a significant effect on total life cycle energy. High-density but low-quality buildings that are knocked down and rebuilt within 20 years are unlikely to offer energy savings. At a finer scale, the building materials used in dwelling construction often involve trade-offs between embodied and operational energy. While concrete slabs tend to engender better thermal performance than raised timber flooring, for example, they also have a higher embodied energy (Newton, Tucker and Ambrose 2000). The energy involved in the maintenance and replacement of components over a building’s life is another factor to be taken into account in assessing the energy performance of a building. Behavioural aspects also come into play, such as the number of appliances used in a dwelling, and their energy efficiency. The energy use of individuals in dwellings and the size of dwellings required will also change with changing family circumstances. 5.2 Trends in Australian dwelling size, block size and household size:
implications for energy consumption Despite an increasing understanding of the need for urban sustainability, energy efficiency and energy conservation, new suburban developments in Australia show a worrying trend that is at odds with reducing both embodied and operational energy consumption and, therefore, GHG emissions. In Perth, for example, the average size
16
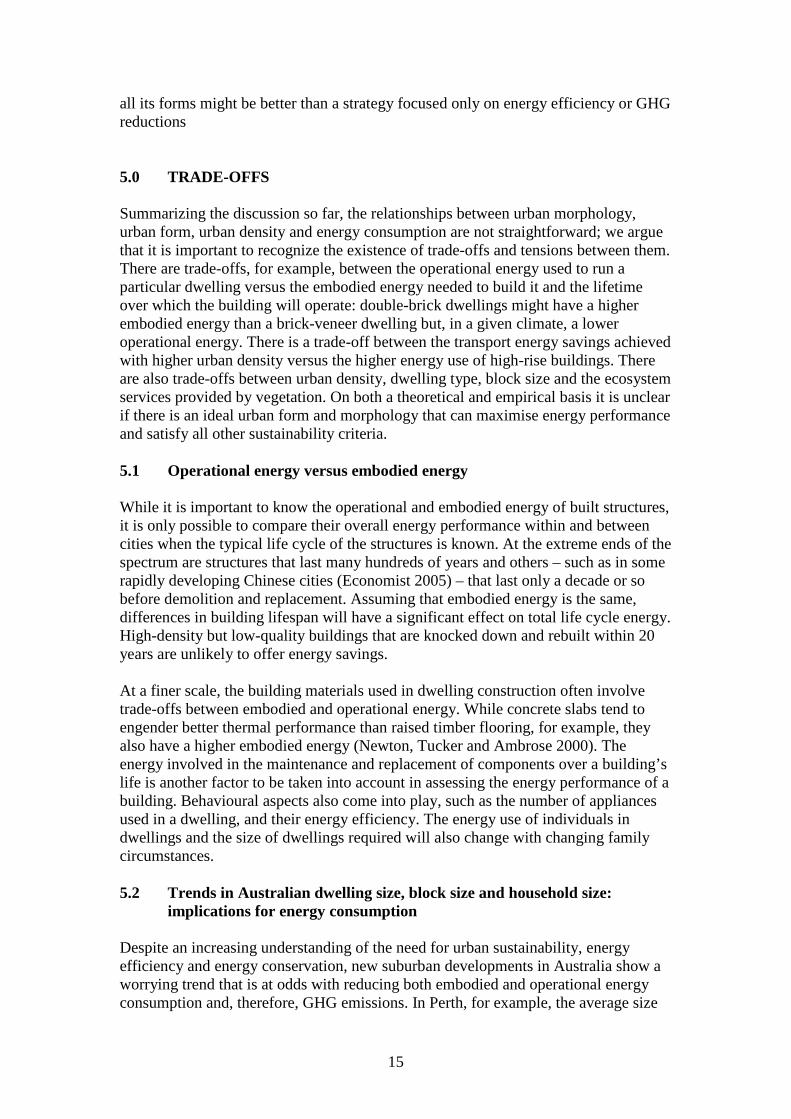
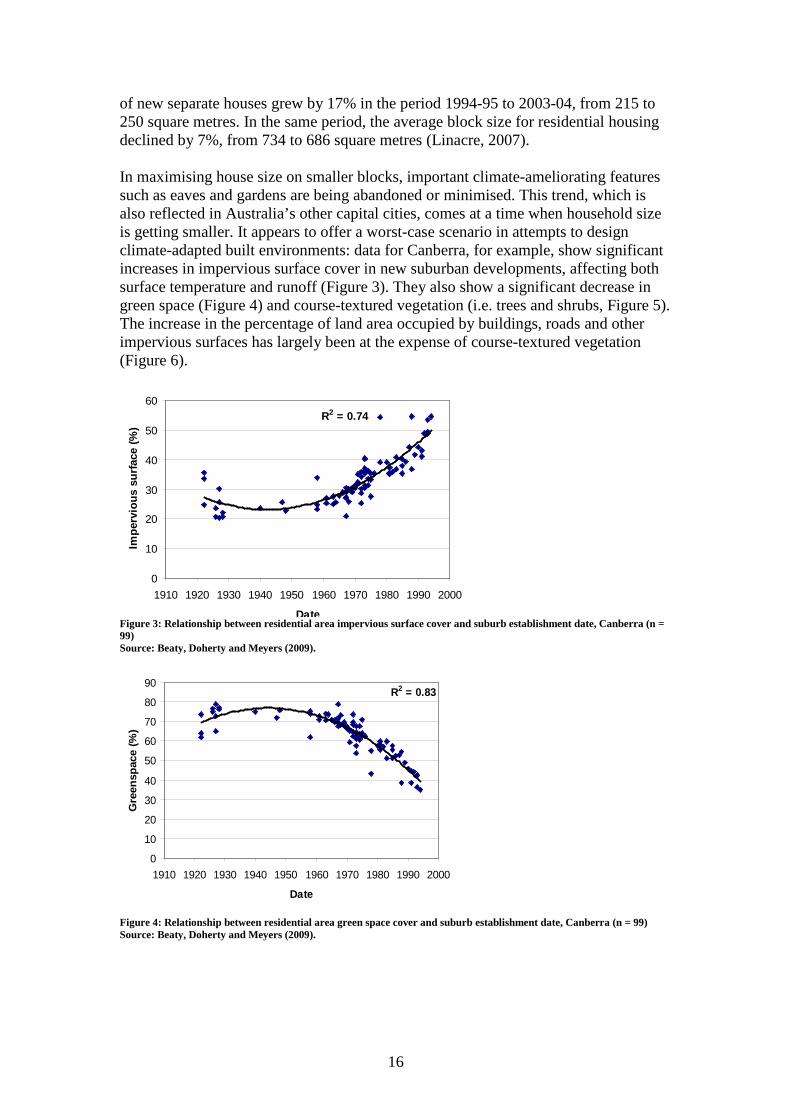
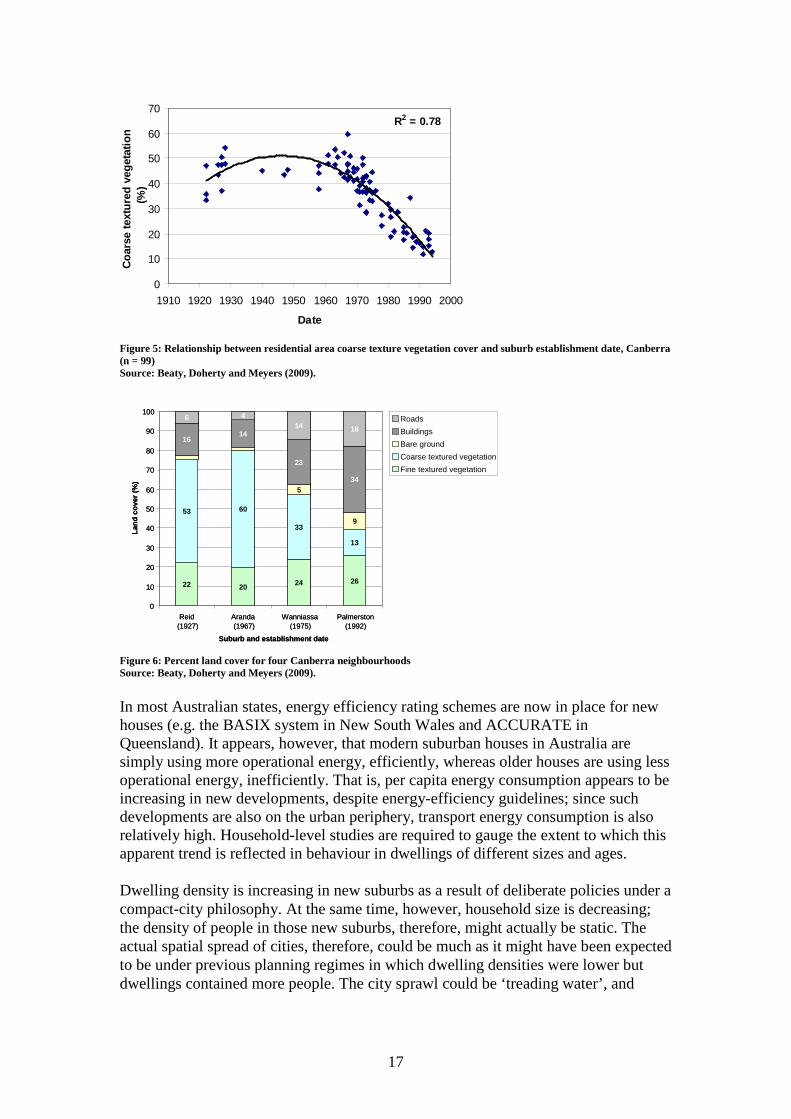
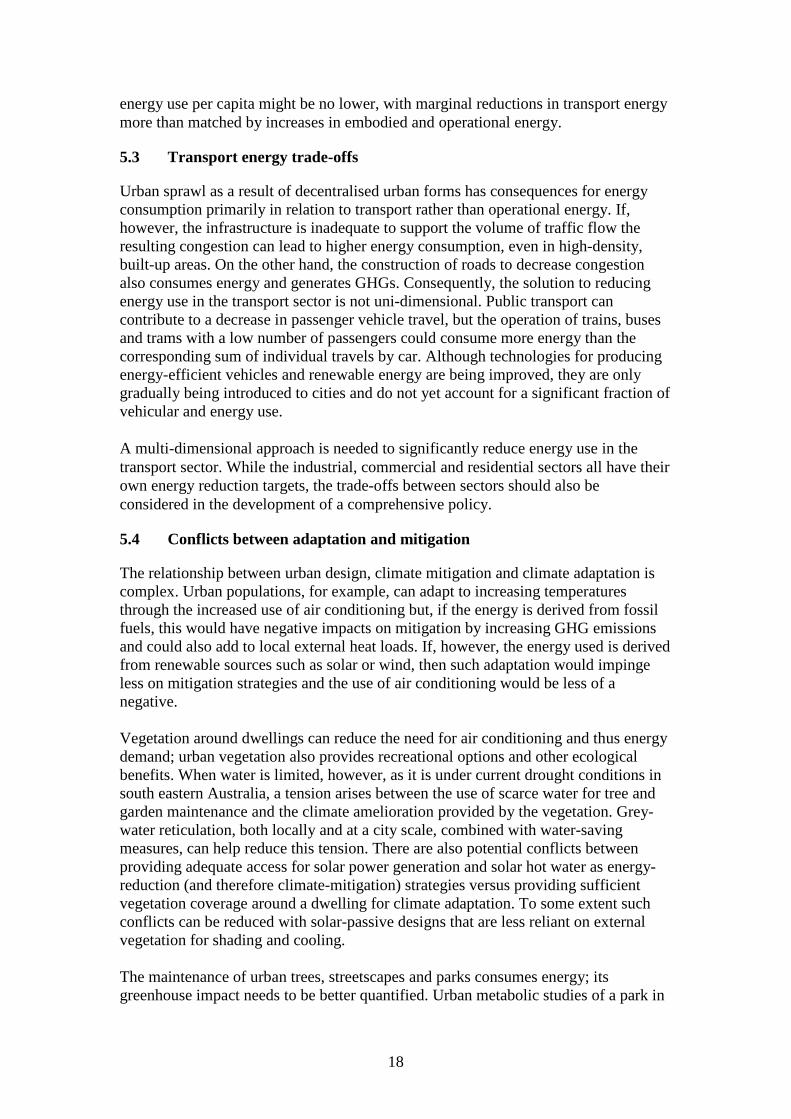
of new separate houses grew by 17% in the period 1994-95 to 2003-04, from 215 to 250 square metres. In the same period, the average block size for residential housing declined by 7%, from 734 to 686 square metres (Linacre, 2007). In maximising house size on smaller blocks, important climate-ameliorating features such as eaves and gardens are being abandoned or minimised. This trend, which is also reflected in Australia’s other capital cities, comes at a time when household size is getting smaller. It appears to offer a worst-case scenario in attempts to design climate-adapted built environments: data for Canberra, for example, show significant increases in impervious surface cover in new suburban developments, affecting both surface temperature and runoff (Figure 3). They also show a significant decrease in green space (Figure 4) and course-textured vegetation (i.e. trees and shrubs, Figure 5). The increase in the percentage of land area occupied by buildings, roads and other impervious surfaces has largely been at the expense of course-textured vegetation (Figure 6).
Figure 3: Relationship between residential area impervious surface cover and suburb establishment date, Canberra (n = 99) Source: Beaty, Doherty and Meyers (2009).
Figure 4: Relationship between residential area green space cover and suburb establishment date, Canberra (n = 99) Source: Beaty, Doherty and Meyers (2009).
R2 = 0.83
0
10
20
30
40
50
60
70
80
90
1910 1920 1930 1940 1950 1960 1970 1980 1990 2000
Date
Gre
ensp
ace
(%)
R2 = 0.74
0
10
20
30
40
50
60
1910 1920 1930 1940 1950 1960 1970 1980 1990 2000
Date
Impe
rvio
us s
urfa
ce (%
)
17
Figure 5: Relationship between residential area coarse texture vegetation cover and suburb establishment date, Canberra (n = 99) Source: Beaty, Doherty and Meyers (2009).
22 20 24 26
53 60
33
13
5
9
1614
23
34
6 414 18
0
10
20
30
40
50
60
70
80
90
100
Reid (1927)
Aranda (1967)
Wanniassa(1975)
Palmerston(1992)
Suburb and establishment date
Land
cov
er (%
)
RoadsBuildingsBare groundCoarse textured vegetationFine textured vegetation
22 20 24 26
53 60
33
13
5
9
1614
23
34
6 414 18
0
10
20
30
40
50
60
70
80
90
100
Reid (1927)
Aranda (1967)
Wanniassa(1975)
Palmerston(1992)
Suburb and establishment date
Land
cov
er (%
)
RoadsBuildingsBare groundCoarse textured vegetationFine textured vegetation
Figure 6: Percent land cover for four Canberra neighbourhoods Source: Beaty, Doherty and Meyers (2009). In most Australian states, energy efficiency rating schemes are now in place for new houses (e.g. the BASIX system in New South Wales and ACCURATE in Queensland). It appears, however, that modern suburban houses in Australia are simply using more operational energy, efficiently, whereas older houses are using less operational energy, inefficiently. That is, per capita energy consumption appears to be increasing in new developments, despite energy-efficiency guidelines; since such developments are also on the urban periphery, transport energy consumption is also relatively high. Household-level studies are required to gauge the extent to which this apparent trend is reflected in behaviour in dwellings of different sizes and ages. Dwelling density is increasing in new suburbs as a result of deliberate policies under a compact-city philosophy. At the same time, however, household size is decreasing; the density of people in those new suburbs, therefore, might actually be static. The actual spatial spread of cities, therefore, could be much as it might have been expected to be under previous planning regimes in which dwelling densities were lower but dwellings contained more people. The city sprawl could be ‘treading water’, and
R2 = 0.78
0
10
20
30
40
50
60
70
1910 1920 1930 1940 1950 1960 1970 1980 1990 2000
Date
Coar
se te
xtur
ed v
eget
atio
n (%
)
18
energy use per capita might be no lower, with marginal reductions in transport energy more than matched by increases in embodied and operational energy.
5.3 Transport energy trade-offs
Urban sprawl as a result of decentralised urban forms has consequences for energy consumption primarily in relation to transport rather than operational energy. If, however, the infrastructure is inadequate to support the volume of traffic flow the resulting congestion can lead to higher energy consumption, even in high-density, built-up areas. On the other hand, the construction of roads to decrease congestion also consumes energy and generates GHGs. Consequently, the solution to reducing energy use in the transport sector is not uni-dimensional. Public transport can contribute to a decrease in passenger vehicle travel, but the operation of trains, buses and trams with a low number of passengers could consume more energy than the corresponding sum of individual travels by car. Although technologies for producing energy-efficient vehicles and renewable energy are being improved, they are only gradually being introduced to cities and do not yet account for a significant fraction of vehicular and energy use. A multi-dimensional approach is needed to significantly reduce energy use in the transport sector. While the industrial, commercial and residential sectors all have their own energy reduction targets, the trade-offs between sectors should also be considered in the development of a comprehensive policy.
5.4 Conflicts between adaptation and mitigation
The relationship between urban design, climate mitigation and climate adaptation is complex. Urban populations, for example, can adapt to increasing temperatures through the increased use of air conditioning but, if the energy is derived from fossil fuels, this would have negative impacts on mitigation by increasing GHG emissions and could also add to local external heat loads. If, however, the energy used is derived from renewable sources such as solar or wind, then such adaptation would impinge less on mitigation strategies and the use of air conditioning would be less of a negative. Vegetation around dwellings can reduce the need for air conditioning and thus energy demand; urban vegetation also provides recreational options and other ecological benefits. When water is limited, however, as it is under current drought conditions in south eastern Australia, a tension arises between the use of scarce water for tree and garden maintenance and the climate amelioration provided by the vegetation. Grey-water reticulation, both locally and at a city scale, combined with water-saving measures, can help reduce this tension. There are also potential conflicts between providing adequate access for solar power generation and solar hot water as energy-reduction (and therefore climate-mitigation) strategies versus providing sufficient vegetation coverage around a dwelling for climate adaptation. To some extent such conflicts can be reduced with solar-passive designs that are less reliant on external vegetation for shading and cooling. The maintenance of urban trees, streetscapes and parks consumes energy; its greenhouse impact needs to be better quantified. Urban metabolic studies of a park in
19
Barcelona (Oliver-Solá et al., 2007) found that visitor use of the park’s formal facilities, such as cafes, consumed more carbon than was fixed by the trees and other vegetation in the park, negating the potential carbon gain from the vegetation in that location. Because of the large potential for trade-offs and unintended effects, a simple rule of thumb would be that any adaptation measure must also reduce GHG emissions, or at least be emission-neutral; such a rule would, however, raise issues in relation to access to alternative power sources and differences in price between current and alternative power sources. Generally, investment in initial benign-by-design approaches will, in the long run, be cost-effective, but the problem of the thermal inefficiencies of existing building stocks remains. Measures to reduce the carbon footprints of existing buildings are being explored. There is the possibility, for example, of using existing building surfaces such as industrial rooftops as solar-energy farms that transform waste urban heat into clean energy. Similarly, efforts to increase urban density to reduce transport energy demand could, at the same time, ensure that developments were (at last to some degree) solar-powered so as to offset inefficiencies in high-rise urban dwellings. The idea of green roofs is another option for both new construction and the retro-fitting of existing commercial and residential stock to mitigate urban heat, lessen energy demand, and create more climate-friendly cities. 6.0 CONCLUSION Because the relationships between morphology, form, density and energy are complex, there is no one-size-fits-all solution for optimising embodied, operational and transport energy within the built environment; comparisons between countries or even within a country are problematic. By analysing the forms of energy use separately, however, it is possible to begin to assess differences in performance at different levels. A comparison of morphology, density and energy use between cities with similar climates is possible, for example, because climate is the key factor influencing operational energy demand in dwellings. On the other hand, understanding the interactions between urban form and transport is possible between cities with differing climates because transport energy is closely tied to density and the broader urban form and is less influenced by climate. As their cities grow, Australians will inevitably face choices in urban design with implications for climate change; it will be important to know the key factors that can be influenced to reduce energy consumption and GHG emissions. Can a city keep growing and still manage to reduce or cap operational and transport energy consumption? Most cities grow radially from a central hub, which is also often coastal; over time, new dwellings are constructed further and further away from the central business district. In the case of Melbourne, growth in the spatial extent of residential area and per capita energy consumption is significantly higher than population growth (Baynes and Bai, 2009). Improved dwelling design, construction and retrofitting can lead to better dwelling performance. It will be much more difficult, however, to influence where people live in relation to their work and, in that way, to reduce transport energy. Although there have been attempts in many of the world’s cities to decentralise employment, most people still work in central business districts
20
or sub-centrally in subsidiary areas. Consequently, as cities have expanded the occupants of new suburbs have travelled further and further to work. The push for greater urban density to reduce transport energy could compromise other aspects of sustainability. High densities, for example, could have major impacts on existing social networks and community interactions. While Boyden et al. (1981) suggested that Hong Kong was not obviously disadvantaged socially by its high population density, Troy (Counterpoint, 2006) argued that the Australian population prefers suburban-style housing rather than apartment living, and that this social and cultural preference should be respected. Newton et al. (2000), on the other hand, suggested that this attitude is slowly changing and that apartment living is becoming much more acceptable in Australia. Taking more of an ecosystem-based spatial approach might enable us to quantify energy consumption patterns in relation to multiple factors. Building on existing work by researchers such as Pullen, Troy and Salat to map embodied and operational energy, for example, a research area could be developed that correlates energy use with more detailed dwelling characteristics and surrounding environmental factors such as vegetation cover and impervious surface cover. Relating such correlations with the social characteristics of neighbourhoods would enable an examination of the ‘performance boundaries’ of urban forms: that is, the upper and lower bounds of energy performance, taking into account the dwelling, its surroundings, and the behaviour of its occupants.
21
REFERENCES Adolphe, L. (2001). A simplified model of urban morphology: application to an
analysis of the environmental performance of cities. Environment and Planning B - Planning and Design 28(2): 183-200.
Akbari, H. and S. Konopacki (2005). Calculating energy-saving potentials of heat-island reduction strategies. Energy Policy 33(6): 721-756.
Akbari, H., M. Pomerantz, et al. (2001). Cool surfaces and shade trees to reduce energy use and improve air quality in urban areas. Solar Energy 70(3): 295-310.
Andersson, E. (2006). Urban landscapes and sustainable cities. Ecology and Society 11(1): U593-U599.
Australian Government. (2007). Estimating urban traffic and congestion cost trends for Australian cities working paper. B. o. T. a. R. Economics. 71.
Bai, X.M. (2007). Integrating global concerns into urban management: The scale and readiness arguments. Journal of Industrial Ecology, 22(2): 15-30.
Bai, X. H., S. H. Tang, et al. (2003). Study of relation between thermal distribution and the underground medium in urban area." Igarss 2003: Ieee International Geoscience and Remote Sensing Symposium, Vols I - Vii, Proceedings: 1392-1394.
Banister, D. (1996). Energy, quality of life and the environment: the role of transport. Transport Reviews 16(1): 23-35.
Banister, D., S. Watson, et al. (1997). Sustainable cities: transport, energy, and urban form. Environment and Planning B-Planning and Design 24(1): 125-143.
Barrett, G. (1996). The Transport Dimension in: Jenks, M. and K. Williams. (eds.). The Compact City: A Sustainable Urban Form? Spon Press, Chapman and Hall, London, London.
Barter, P. A. (2000). Transport Dilemmas in Dense Urban Areas in: Jenks, M. (ed.). Compact Cities: Sustainable Urban Forms for Developing Countries. Taylor and Francis, London.
Baynes, T., X. M. Bai. (2009). Trajectories of change: Melbourne’s population, urban development, energy supply and use 1960-2006. GEA Working Paper.
Bolund, P. and S. Hunhammar. (1999). Ecosystem services in urban areas. Ecolog. Econom. 29: 293-301.
Boyden, S.; S. Millar. K. Newcombe and B. O’Neill. (1981). The Ecology of a City and its People. The Case of Hong Kong. Australian National University Press, Canberra.
22
Brehny, M. (1986). Centrists, Decentrists and Compromisers: Views on the Future of Urban Form pp. 13-35 in: M.E. Jenks, E. Burton and K. Williams. (eds.). The Compact City. A Sustainable Urban Form? Spon Press, Chapman and Hall, London.
Buchanan, N., R. Barnett, et al. (2006). The effect of urban growth on commuting patterns in Christchurch, New Zealand. Journal of Transport Geography 14(5): 342-354.
Burgess, S. C. and J. M. J. Choi (2003). A parametric study of the energy demands of car transportation: a case study of two competing commuter routes in the UK. Transportation Research Part D: Transport and Environment 8(1): 21-36.
Camagni, R., M. C. Gibelli, et al. (2002). Urban mobility and urban form: the social and environmental costs of different patterns of urban expansion. Ecological Economics 40(2): 199-216.
Carver, A. D., D. R. Unger, et al. (2004). Modelling energy savings from urban shade trees: an assessment of the CityGreen (R) Energy Conservation Module. Environmental Management 34(5): 650-655.
Cervero, R. (2008). Transit Transformations: Private Financing and Sustainable Urbanism in Hong Kong and Tokyo. 2009, from http://www.pbrc.soka.edu/Publications_WorkingPapers.aspx
Chen, C., H. M. Gong, et al. (2008). Role of the built environment on mode choice decisions: additional evidence on the impact of density. Transportation 35(3): 285-299.
Chen, H. Y., B. S. Jia, et al. (2008). Sustainable urban form for Chinese compact cities: challenges of a rapid urbanized economy. Habitat International 32: 28-40.
Coorey, S. B. A. and S. S. Y. Lau (2005). Urban Compactness and Its progress towards sustainability: the Hong Kong scenario. Sustainable Development and Planning II, 84: 87-97.
Counterpoint (2006). End of a Suburban Dream?:, radio broadcast, Australian Broadcasting Corporation, 6 March 2006 http://www.abc.net.au/rn/counterpoint/stories/2006/1581231.htm
Crabtree, L. (2005). Sustainable housing development in urban Australia: exploring obstacles to and opportunities for Ecocity efforts. Australian Geographer 36(3): 333-350.
Crookston, M., P. Clarke, et al. (1996). The Compact City and the Quality of Life. in: M.E. Jenks, E. Burton and K. Williams. (eds.). The Compact City. A Sustainable Urban Form? Spon Press, Chapman and Hall, London.
David, B. (2007). Cities, mobility, and climate change. Journal of Industrial Ecology 11(2): 7-10.
23
De Wilde, S. and A. Van Den Dobbelsteen (2004). Space use optimisation and sustainability - environmental comparison of international cases. Journal of Environmental Management 73(2): 91-101.
Dixon, J. and A. Dupuis (2003). Urban intensification in Auckland, New Zealand: a challenge for New Urbanism. Housing Studies 18(3): 353-368.
Doi, K., M. Kii, et al. (2008). An integrated evaluation method of accessibility, quality of life, and social interaction. Environment and Planning B: Planning and Design 35: 1098-1116.
Economist (2005). Building the Country. 374(8517): 46.
Farthing, S., J. Winter, et al. (1996). Travel behaviour and local accessibility to services and facilities. In: M.E. Jenks, E. Burton and K. Williams. (eds.). The Compact City. A Sustainable Urban Form? Spon Press, Chapman and Hall, London.
Ghosh, S., R. Vale, et al. (2007). Metrics of local environmental sustainability: a case study in Auckland, New Zealand. Local Environment 12(4): 355-378.
Greed, C. (2004). Introducing Planning. Continuum International Publishing Group, London.
Guindon, B. and Y. Zhang (2007). Using satellite remote sensing to survey transport-related urban sustainability - Part II. Results of a Canadian urban assessment. International Journal of Applied Earth Observation and Geoinformation 9(3): 276-293.
Hirooka, H. (2000). The Development of Tokyo's Rail Network. Japan Railway and Transport Review 23: 22-31.
Holden, E. and I. T. Norland (2005). Three challenges for the compact city as a sustainable urban form: household consumption of energy and transport in eight residential areas in the Greater Oslo Region. Urban Studies 42(12): 2145-2166.
Holloway, D. and B. R. (2006). Planning, housing and energy use: a review. Urban Policy and Research 24(1): 115-126.
Huang, S. L., H. Y. Lai, et al. (2001). Energy hierarchy and urban landscape system. Landscape and Urban Planning 53(1-4): 145-161.
Jabareen, Y.R. (2006). Sustainable urban forms. Their typologies, models and concepts. J. Plann. Edu. Res. 26:38-52.
Jenks, M. and R. Burgess. (eds.). (2000). Compact Cities. Sustainable Urban Forms for Developing Countries. Spon Press, Taylor and Francis Group, London.
Jenks, M., E. Burton and K. Williams. (eds.) (1996). The Compact City. A Sustainable Urban Form? Spon Press, Chapman and Hall, London.
24
Jenks, M. and N. Dempsey. (eds.) (2005). Future Forms and Design for Sustainable Cities. Architectural Press, Elsevier, Amsterdam.
Jenks, M. and N. Dempsey. (2005). The Language and Meaning of Density. Chapter 15, pp. 287 – 309 in: M. Jenks and N. Dempsey. (eds.) (2005). Future Forms and Design for Sustainable Cities. Architectural Press, Elsevier, Amsterdam.
Kenworthy, J. R. (2006). The Eco-City: Ten key transport and planning dimensions for sustainable city development. Environment and Urbanization 18(1): 67-85.
Lall, A. B., M. Pandit, et al. (1991). Climate and housing form - a case-study of New-Delhi. Energy and Buildings 16(3-4): 837-849.
Landsberg, H.E. (1981). The Urban Climate. International Geophysics Series. Volume 28. Academic Press, New York.
Laverne, R. J. and G. M. Lewis (1996). The effect of vegetation on residential energy use in Ann Arbor, Michigan. Journal of Arboriculture 22(5): 234-243.
Lebel et al. (2007). Integrating carbon management into the development strategies of urbanizing regions in Asia - Implications of urban function, form, and role, J. Industrial Ecology. 11 (2): 61-81
Linacre, S. (2007). Australian Social Trends 2007. Article: Larger dwellings, smaller households. Catalogue No. 4102.0. Australian Bureau of Statistics, Canberra.
Litman, T. (2005). Efficient vehicles versus efficient transportation. Comparing transportation energy conservation strategies. Transport Policy (2): 121-129.
Liu, H. and Q. H. Weng (2008). Seasonal variations in the relationship between landscape pattern and land surface temperature in Indianapolis, USA. Environmental Monitoring and Assessment 144(1-3): 199-219.
Longcore, T., C. Li, et al. (2004). Applicability of Citygreen urban ecosystem analysis software to a densely built urban neighbourhood. Urban Geography 25(2): 173-186.
Lu, D. S. and Q. H. Weng (2006). Spectral mixture analysis of ASTER images for examining the relationship between urban thermal features and biophysical descriptors in Indianapolis, Indiana, USA. Remote Sensing of Environment 104(2): 157-167.
Lu, D. S. and Q. H. Weng (2006). Use of impervious surface in urban land-use classification. Remote Sensing of Environment 102(1-2): 146-160.
Meurs, H. and R. Haaijer (2001). Spatial structure and mobility. Transportation Research Part D: Transport and Environment 6(6): 429-446.
Mindali, O., A. Raveh, et al. (2004). Urban density and energy consumption: a new look at old statistics. Transportation Research Part a-Policy and Practice 38(2): 143-162.
25
Moriarty, P. (2002). Environmental sustainability of large Australian cities. Urban Policy and Research 20(3): 233-244.
Muniz, I. and A. Galindo (2005). Urban form and the ecological footprint of commuting. The case of Barcelona. Ecological Economics 55(4): 499-514.
Newman, P. W. G. and J. R. Kenworthy (1989). Cities and automobile dependence : a sourcebook. Aldershot, Hants., England ; Brookfield, Vt., USA, Gower Technical.
Newman, P. W. G. and J. R. Kenworthy (1999). Sustainability and Cities : Overcoming Automobile Dependence. Island Press, Washington, D. C.
Newton, P.; S. Tucker and M. Ambrose. (2000). Housing form, energy use and greenhouse gas emissions. pp. 74 - 84 in: Williams, K., E. Burton and M. Jenks. (2000). Achieving Sustainable Urban Form. Spon Press, Taylor and Francis Group, London.
Nichol, J. (2005). Remote sensing of urban heat islands by day and night. Photogrammetric Engineering and Remote Sensing 71(5): 613-621.
Nijkamp, P. and S. A. Rienstra (1996). Sustainable transport in a compact city. pp. 190-199 in: M.E. Jenks, E. Burton and K. Williams. (eds.). The Compact City. A Sustainable Urban Form? Spon Press, Chapman and Hall, London.
Norman, J., H.L. MacLean, M. Asce and C. A. Kennedy. (2006). Comparing high and low residential density: life-cycle analysis of energy use and greenhouse gas emissions. J. Urb. Plan. Develop. March. 10-21.
OECD, I. E. (2008). Key World Energy Statistics 2008.
Oke, T.R. (1989). The micrometeorology of the urban forest. Phil. Trans. R. Soc. Lond. B 324: 335-349.
Olgyay, V. (1963). Design with Climate. Princeton University Press, Princeton, NJ.
Oliver-Solá, J., M. Núñez, X. Gabarrell, M. Boada, J. Rieradevall (2007). Service sector metabolism: Accounting for energy impacts of the montjuic urban park in Barcelona. Journal of Industrial Ecology 11(2): 83-98.
Pears, A. (2005). "Does higher density really reduce household energy requirements? It depends....." Urban Policy and Research 23(3): 367-369.
Pullen, S. (2000). Energy used in the construction and operation of houses. Architectural Science Review. 43(2): 87-94.
Pullen S. (2007). A Tool for Depicting the Embodied Energy of the Adelaide Urban Environment. Proceedings of Australian Institute of Building Surveyors. International Transitions Conference. Adelaide.
26
Pullen, S.; D. Holloway, B. Randolph and P. Troy (2006). Energy profiles of selected residential developments in Sydney with special reference to embodied energy. Proceedings of the Australian and New Zealand Architectural Science Association (ANZAScA) 40th Annual Conference ‘Challenges for architectural science in changing climates’. Adelaide. 22-25 November 2006.
Pullen, S.; P. Troy, D. Holloway and R. Bunker (2002). Estimating energy consumption in the urban environment with a focus on embodied energy. Proceedings of the 36th Australian and New Zealand Architectural Science Association (ANZAScA). 1-4 November 2002. Deakin University, Australia.
Ratti, C., D. Raydan and K. Steemers (2003). Building form and environmental performance: archetypes, analysis and an arid climate. Energy and Buildings 35 (1): 49-59.
Rose, A.J. (1967). Patterns of Cities. Nelson, Sydney.
Roy, J. R., J. F. Brotchie, et al. (1996). A study on urban residential density vs. transport energy consumption. [S.l.], CSIRO. Division of Building, Construction and Engineering.
Ryan, S. and J. A. Throgmorton (2003). Sustainable transportation and land development on the periphery: a case study of Freiburg, Germany and Chula Vista, California. Transportation Research Part D: Transport and Environment 8(1): 37-52.
Salat S (2008). Urban morphologies Densities Energy consumption, SB08 World Sustainable Building Conference, Melbourne.
Salat, S. and A. Mertorol. (2006). Factor 20: A multiplying method for dividing by 20 the carbon energy footprint of cities: the urban morphology factor. Urban Morphologies Laboratory, CSTB (French Scientific Centre for Building Research) and ENSMP (Ecole Nationale Superieure des Mines de Paris).
Salat, S. and C. Guesne. (2008). Energy and carbon efficiency of urban morphologies. The case of Paris. Urban Morphologies Laboratory, CSTB (French Scientific Centre for Building Research) and ENSMP (Ecole Nationale Superieure des Mines de Paris).
Schiller, G. (2007). Urban infrastructure: challenges for resource efficiency in the building stock. Building Research and Information 35(4): 399-411.
Shashua-Bar, L. and M. E. Hoffman (2000). Vegetation as a climatic component in the design of an urban street - an empirical model for predicting the cooling effect of urban green areas with trees. Energy and Buildings 31(3): 221-235.
Song, Y. and G.-J. Knaap (2004). Is Portland winning the war on sprawl? Journal of the American Planning Association 70(2): 210-225.
Stead, D. (2007). Transport energy efficiency in Europe: temporal and geographical trends and prospects. Journal of Transport Geography 15(5): 343-353.
27
Stead, D., J. Williams, et al. (2000). Land use, Transport and People: Identifying the Connections. Williams, K., E. Burton and M. Jenks. (2000). Achieving Sustainable Urban Form. Spon Press, Taylor and Francis Group, London.
Steemers, K. (2003). Energy and the city: density, buildings and transport. Energy and Buildings 35(1): 3-14.
Thomas, L. and W. Cousins (1996). The Compact City: A Successful, Desirable and Achievable Urban Form? M.E. Jenks, E. Burton and K. Williams. (eds.). The Compact City. A Sustainable Urban Form? Spon Press, Chapman and Hall, London.
Tiangco, M., A. M. F. Lagmay, et al. (2008). ASTER-based study of the night-time urban heat island effect in Metro Manila. International Journal of Remote Sensing 29(10): 2799-2818.
Tight, M. R., A. Vicat, et al. (2007). An exploration of household response to personal travel carbon-reduction targets. International Journal of Sustainable Transportation 1(3): 143 - 159
Troy, P., D. Holloway, et al. (2003). Embodied and operational energy consumption in the city. Urban Policy and Research 21(1): 9-44.
Webster, J. (2007). The Canadian Urban Archetypes Project: a tool facilitating the integration of energy-related information into urban planning decision making. 43rd ISOCARP Congress.
Webster, J. (2008). The Urban ‘energy’ Archetypes Project, SUST-CS3: Planning for Climate Change by Community Design, CIP 2008 Winnipeg, July 14th, 2008.
Wentz, E. A., D. Nelson, et al. (2008). Expert system classification of urban land use/cover for Delhi, India. International Journal of Remote Sensing 29(15): 4405-4427.
Williams, K., E. Burton, et al. (1996). Achieving the Compact City through Intensification: an acceptable option? in: Jenks, M., E. Burton and K. Williams. (eds.). (1996). The Compact City. A Sustainable Urban Form? Spon Press, Chapman and Hall, London.
Williams, K., E. Burton and M. Jenks. (2000). Achieving Sustainable Urban Form. Spon Press, Taylor and Francis Group, London.
Wong, N. H., D. K. Cheong, et al. (2003). The effects of rooftop garden on energy consumption of a commercial building in Singapore. Energy and Buildings 35(4): 353-364.
Wong, N. H., S. K. Jusuf, et al. (2007) Environmental study of the impact of greenery in an institutional campus in the tropics. Building and Environment 42(8): 2949-2970.

28
Xu, W., M. J. Wooster, et al. (2008). Modelling of urban sensible heat flux at multiple spatial scales: A demonstration using airborne hyperspectral imagery of Shanghai and a temperature-emissivity separation approach. Remote Sensing of Environment 112(9): 3493-3510.
Yu, E. and J. Liu (2007). Environmental impacts of divorce. PNAS 104: 20629-20634.