Embed Size (px)
Citation preview

University of Nebraska at OmahaDigitalCommons@UNO
Student Work
12-1963
Relationships within and between the 1960Stanford-Binet L-M and the Goodenoughintelligence test with intellectually sub-averagechildrenFrederick M. RudieUniversity of Nebraska at Omaha
Follow this and additional works at: https://digitalcommons.unomaha.edu/studentwork
Part of the Psychology Commons
This Thesis is brought to you for free and open access byDigitalCommons@UNO. It has been accepted for inclusion in StudentWork by an authorized administrator of DigitalCommons@UNO. Formore information, please contact [email protected].
Recommended CitationRudie, Frederick M., "Relationships within and between the 1960 Stanford-Binet L-M and the Goodenough intelligence test withintellectually sub-average children" (1963). Student Work. 133.https://digitalcommons.unomaha.edu/studentwork/133

RELATIONSHIPS WITHIN AND BETWEEN THE I960 STANFORD-BINET L-M k m THE GOODENOUGH INTELLIGENCE TEST WITH INTELLECTUALLY
SUBAVERAGE CHILDREN
A Thesis
Submitted to
The Faculty of the Department of Psychology
The University ©f Omaha
In Pertiel Fulfillment
of the Requirement for the Degree
Master of Arts
ByFrederick M. Rudie
December 1963
UMI Number: EP72779
All rights reserved
INFORMATION TO ALL USERS The quality of this reproduction is dependent upon the quality of the copy submitted.
In the unlikely event that the author did not send a complete manuscript and there are missing pages, these will be noted. Also, if material had to be removed,
a note will indicate the deletion.
UMIDissertation Publishing
UMI EP72779
Published by ProQuest LLC (2015). Copyright in the Dissertation held by the Author.
Microform Edition © ProQuest LLC.All rights reserved. This work is protected against
unauthorized copying under Title 17, United States Code
ProQuestProQuest LLC.
789 East Eisenhower Parkway P.O. Box 1346
Ann Arbor, Ml 48106- 1346

ACKNOWLEDGMENTS
1 want to thank and express my indebtedness to Dr* D. T* Pedrini*
my thesis chairman* He, along with giving helpful and necessary
suggestions, gave encouragement when encouragement was needed* Most
of all, Dr* Pedrini gave unsparingly of his time*
1 wish to acknowledge and express my gratitude to Dr* William E*
Jaynes for suggesting the statistical design for this study and to
Mr* Richard Nicholson for his helpful suggestions*
F*M.R.

TABLE OF CONTENTS
CHAPTER I
INTRODUCTION AND 6ACKGROUM) ..... .......... 1
Testing Movement ........ *...1
Binet Scales ..... 1
Goodenough Draw-A-Man Test ....... •••.,••,.....•,•,.•4
Stanford-Binet Vocabulary .... ..7
Stanford-Binet Scatter............. 3
Slow Learner .... 9
The Problem of This Study .............12
CHAPTER II
REVIEW OF TEE LITERATURE .................................... 13
Relationship of Goodenough Draw-A-Man Test to theStanford-Binet ..... 13
Stanford-Binet Vocabulary ........ 19
Stanford-Binet Scatter .... 21
CHAPTER III
SUBJECTS, MATERIALS, A M3 STATISTICAL METHODS ................ 24
Subjects ......... 24
Tests ...... • .26
Statistical Procedures ...... 28

CHAPTER IV
RESULT'S Am DISCUSSION ......................................... 34Correlations .... 34
Regressions ........
Hean Differences ............................................3S
Correlations with Binet Vocabulary .........................*41
Correlat ion of Stanford-Binet Scat ter ......... * *............43
Mean Binet IQ Differences ..................................*4$
Boys vs. Girls in Sample . •. ....... .45
CHAPTER V
SUMMARY A W CONCLUSIONS ..4?
BIBLIOGRAPHY .... ...................................52
APPENDIX ......................... SS
LIST OF TABLES
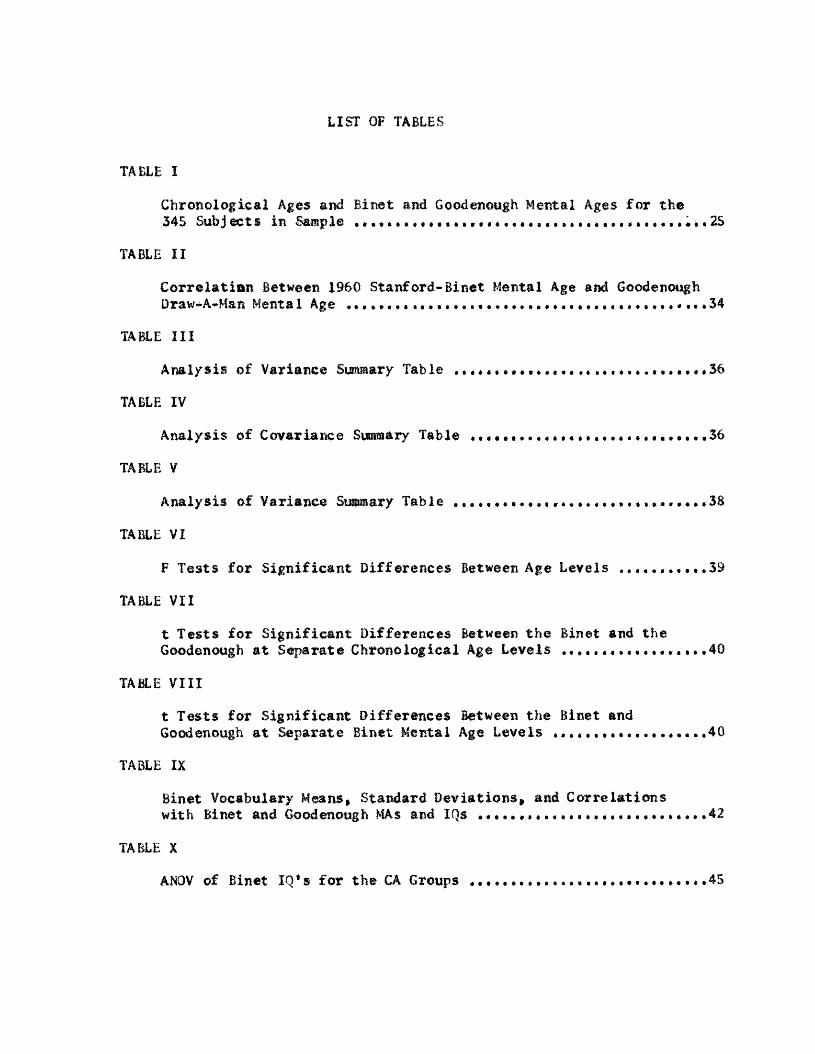
TABLE I
Chronological Ages and Binet and Goodenough Mental Ages for the 345 Subjects in Sample ...........................................25
TABLE II
Correlation Between 1960 Stanford-Binet Mental Age and Goodenough Draw-A-Man Menta1 Age 34
TABLE III
Analysis of Variance Sanmary Table ............................... 36
TABLE IV
Analysis of Covariance Summary Table .............................3b
TABLE V
Analysis of Variance Summary Table .... 38
TABLE VI
F Tests for Significant Differences Between Age Levels .... 39
TABLE VII
t Tests for Significant Differences Between the Binet and the Goodenough at Separate Chronological Age Levels ..................40
TABLE VIII
t Tests for Significant Differences Between the Binet and Goodenough at Separate Binet Mental Age Levels ...... ...40
TABLE IX
Binet Vocabulary Means* Standard Deviations* and Correlations with Binet and Goodenough MAs and IQs ........ .42
TABLE X
ANOV of Binet IQ• s for the CA Groups ...... .45

TABLE XINewraan-Keuis Test for Differences Between All Ordered Pairs of Means (binet IQs) «»••.*.... ♦..................44
TABLE XII
Means and Standard Deviations of S-B and DAM MA Scores for Boys and G ir 1 s ...... 45

CHAPTER I
INTRODUCTION AND BACKGROUND
The examination of relationships within and between the 1960
Stanford-Binet and the Goodenough Intelligence Test provided the basis
for this thesis* Before considering the relationships* some background
on the testing movement* Binet Scales* Stanford-Binet* Goodenough Draw-
A-Man Test* Stanford-Binet vocabulary subtest* Stanford-Binet scatter*
and the slow learner would prove useful.
Testing Movement. While it is somewhat arbitrary to associate a
person and date with the founding of psychology* it appears equally
arbitrary to assign a name and date to the beginning of intelligence
testing. For convenience however* it is necessary to select some person
to represent the beginning of the new science and the beginning of move
ments within the science* Wundt is generally designated as the “father”
of psychology mainly because he was the first man in the history of
psychology to be totally committed to the new subject* Other likely
candidates such as Helmholtz and Fechner contributed to psychology but
were more accurately classified as physiologists* physicists and philoso
phers. Analogously* Alfred Binet could be considered the “founder” of
intelligence testing. Certainly others such as Galton and James Mc-
Keen Cattell contributed to the field* but Binet introduced individual
intelligence testing as it is in its present form (Boring, 1950* p. 573)
Binet Scales* Just prior to the turn of the century* Binet began
his work on tests of intelligence or, more properly, subtests or items.
With characteristic thoroughness he investigated a wide range of areas
including graphology and palmistry (Peterson* 1925, p. 160-161).

2
In 1904 a commission in Paris decided that intellectually subaverag©
children should be removed from regular schools and given instruction
in special schools. It was to meet the obvious need to separate the
average from subaverage that Binet, with Simon, set about constructing
his first intelligence scale. The scale was published In 1905. Three
years later, a second scale appeared. Peterson (1925, p. 196) argues
that the 1908 revision should be considered the first real scale of
intelligence since the 1905 test was used to demonstrate that a test
could be constructed rather than as a test itself.
Fortunately, the 1908 scale was published with much greater accuracy
and detail. Interest in the new test grew. Translations by Goddard
and Huey helped promote it in America. Kuhlmann condensed and modified
the English version and at the same time included in it the various com
ments Binet and Simon had made regarding administration and scoring.
In 1911 the test ms again revised by Binet. In the same year
Terraan published his impressions of the 1908 revision. Though he found
the need for radical changes, particularly at the upper and lower ends
of the scale, Terman felt the test could be of great value. His interest
and appreciation of Binet’s method set the stage and form for the testing
movement in America• In 1916 Terman published his revision of the Binet-
Simon scales. The test, called the Stanford-Binet (S-B), became the
accepted criterion for measuring the intelligence of children, Indeed,
the Stanford-Binet and its subsequent revisions remain to this day
unchallenged as an intelligence test for children.
The 1916 revision was standardized on a sample of about 1,000
children and 400 adults. An attempt was made to obtain a representative

sample of the general population. While providing a good measure of
intelligence, the scale was perhaps equally important in establishing
sampling procedures which were refined and used in the construction
and restandardization of the 1937 scale (Terraan 6 Merrill, 1960, pp. 5-6)
The 1937 revision required nearly ten years of research. The
literature was surveyed for evaluations of the 1916 Binet and for test
items which could be used in the new S-B. Thousands of items were
tried out on 1,000 children who had earlier been given the 1916 revision.
In addition 500 preschool children were tested, Items with high
discriminating power were selected for further evaluation. Two forms of
the test, fora L containing 209 it mas, and form M containing 199 items,
were used in the final standardization. Item validity was checked by
an increase in percent-passing for successive ages and biserial
correlation of each item with the total score. The sample composed
of 3,184 native born white subjects tested in 17 communities in 11
widely separated states. There were approximately 100 subjects for each
half-year interval fro® 1 1/2 to 5 1/2 years, 200 subjects at each age
for years 6 through 14, and 100 at each age fro® 15 to 18* The final
forms of L and M contained 129 items each. The mean of the scale was
slightly above 100, and the S.D.*s fox the age levels varied around a
median value of approximately 16.
The I960 revision of the S-B was not a restandardization but an
attempt to improve and modernize its predecessor. Only the most
discriminating items of foras L and M were included and many of these had to be relocated. The items were chosen and relocated on the basis

■of performance ©f 4,498 subjects ages 2 1/2 to 18. The subjects were fro®
6 states of the Northeast, Midwest, and lest coast.
Goodenough Qraw*A*Man Teat. The Stanford*Binet had a number of
disadvantages. It was mainly a verbal test, it had to be administered
individually, it required a fair amount of training to administer, and
it required at least 40 minutes to administer and frequently longer.
Thus psychologists continued to investigate other means of assessing
intelligence. One such investigator was Florence Goodenough* In 1926
she published the Goodenough Draw-A-Man Intelligence Test (DAM Test).
The test was characterized by Terraan (Goodenough, 1926, p.x) as requiring
only a child’s drawing of a man, being nonverbal, taking but 10 minutes
to test an entire class plus a few minutes scoring time per child,
particularly useful between mental ages of 4 to 10, having a reliability
coefficient for an unselected age group of between *80 and .90 and
giving an average correlation of .76 with the S-B for separate age
groups*
According to Goodenough (1926, pp. 1*11) the idea of using the
drawings of children to study their development was not a new one. In
1885 Ebenezer Cooke noted successive stages in development in children’s
drawings. Two years later Corrado Ricci, working with Italian children,
published an account of their drawings. The attention Cooke’s work drew
an increased interest in child study and stimulated a great deal of
research which reached a peak between 1900 and 1915. The studies, which
contained 2 international undertakings, included collecting thousands of
drawings from different children in various schools and observing the
drawings of individual children in a biographical fashion as they
progressed from one age to the next.

s
Fro® this research Goodenough (1926, pp. 12-13) drew a number of
conclusions which appeared to be the rationale for her test. They
are as follows!
1. In young children a close relationship is apparent between concept development as shorn in drawing, and general intelligence.
2. Drawing, to the child, Is primarily a language, a fen* of expression* rather than a means of creating beauty*
3* In the beginning the child draws what he knows, rather than what he sees (Verworn’s "ideoplastic stage**). Later on he reaches a stage in which he attempts to draw objects as he sees them. The transition from the first stage to the second one is a gradual and continuous process.
4. The ideoplastic basis of children’s drawings is shown most conspicuously in the relative proportions given to the separate parts. The child exaggerates the size of items which see® interesting or important; other parts are minimized or emitted.
3. The order of development in drawing is remarkably constant, even among children of very different social antecedents. The reports of investigators the world over show very close ggraoaesit, both as regards the method of indicating the separate items in a drawingand the order in which these items tend to appear. This is especially true as regards the hiaaan figure, probably because of its universal familiarity.
6. The earliest drawings made by children consist almost entirely of what may be described as a graphic enumeration of items. Ideas of number, of the relative proportions of parts, and of spatial relationships are much later in developing.
7. In drawing objects placed before the® young children pay little or no attention to the model. Their drawings £r m the object are not likely to differ in any important respect fro® their memory drawings.
8. Drawings made by subnormal children resemble those of younger normal children in their lack of detail and in their defective sense of proportion. They often show qualitative differences, however, especially as regards the relationship of the separate parts to each other. Hot frequently the same drawing will be found to combine very primitive with rather mature characteristics,
9. Children of inferior mental ability sometimes copy well, but they rarely do good original work in drawing. Conversely, the

child who shows real creative ability in art is likely to rank high in general mental ability.
10. There is much disagreement among investigators regarding the relationship between children’s drawings and those made by primitive or prehistoric races* Until more careful study has been made of the many factors involved in such comparison, the legitimacy of drawing conclusions appears to be very doubtful.
11, Narked sex differences, usually in favor of the boys, are reported by several investigators, especially by Kerschensteiner and Ivanoff.
12., Up to about the age of ten years children draw the human figure in preference to any other subject. (Goodenough, 1926, pp. 12-
It was Goodenough*s hope that each child should be allowed to
choose the subject he wished to draw. The plan had to be abandoned
however since the relative difficulty of the various subjects presented
seemingly insurmountable problems in scoring. Thus the subject matter
had to be selected, The human figure was chosen since it was equally
familiar to all children. It was also simple enough for the very young
children and complex enough to challenge the adult, Moreover, it had
universal appeal and varied little in essential characteristics. It was
further decided that the subject matter should be restricted to **a man"
since the clothing of men show greater uniformity than that of women
or children.
In 1920 Goodenough obtained almost 4,000 drawings from Mew Jersey
kindergarten through fourth grade children. One hundred drawings were
selected for a preliminary analysis. Characteristic differences between
the drawings of younger and older children were noted. In this manner
an initial scale of 40 points was devised. The point of item validity
was established by an increase in percent passing with successive ages.
The first scale showed some obvious defects. More items were added and
7
changes in scoring were made. The drawings were rescored and the re
sulting curves plotted. Then another set of drawings were scored, curves
plotted and more changes in scoring were made. Five such revisions were
necessary before the present form, containing Si items, was developed.
The final standardisation was based on drawings from 3,593 children ranging
in. age from 4 to 10 years* A vast majority of the children were not of
American white parentage, but rather Southern European and Megro descent.
Kith completion of the final revision, the problems of reliability
and validity were again considered, Reliability was checked by the test-
retest and split-half methods. A correlation of ,937 was found for 194
first graders with a one day interval between test and retest. The split-
half correlation was ,77 for the separate ages 5 to 10 years. The validity
of the test was established in 2 main ways* (1) by an increase in the
percentage of children passing a point with successive ages as has
already been indicated, and (2) by correlations with grade placement
and other test scores. The correlations between the Stanford-Binet
mental ages and the Draw-A-Man mental ages will be given in Chapter 2.
Stanford-Binet Vocabulary. Vocabulary has long been considered
an important aspect of intelligence. The 1905 Binet-Simon Scale included
an item which required defining abstract terms. The 1908 revision again
required the definition of abstract words (age 11, item 4), (Freeman,
1962, pp. 188-191}, Ter®an*s 1916 revision placed an increased emphasis on
the importance of vocabulary. Items calling for the definitions of
words were found at ages 5, 8, 10, 12, 14, average adult and superior
adult (Freeman, 1962, pp. 201-203), Quite naturally the vocabulary
subtest remained an important part of both the 1937 and I960 Stanford-

Binet revisions.
Mcheraar (1942, p. 140), after indicating several product-moment
correlations between the number of words passed and the composite HA,
stated "the magnitude of these correlations indicate that the vocabulary
test alone contributes a good rough measure of intelligence." At
another point in the same bool McNemar (1942, p. 151) said, "the
vocabulary test alone yields a fairly adequate measure of the kind of
intelligence measured by the Mew Revision” (Mm Revision referred to
the 1937 revision). These quotations lead to two obvious conclusions,
First, that there would be some justification in using the vocabulary
subtest as a gross screener, Secondly, it would appear that the
Stanford-Binet is highly loaded with verbal items.
Stanford-Bluet. Scatter» Another aspect of the Stanford-IInet is
the scatter of performance shown by individuals, Scatter may be defined
as the difference between the basal and maximal» the difference is
expressed in months. Basal refers to ",..,that level at which all tests
are passed which just precedes the level where failure occurs" (Terman |
Merrill, 1960, p. 60). The maximal or ceiling level refers to the first
level at which all tests are failed beyond the last level in which
success occurred. While Terman and Merrill (I960, pp. 59-60) reject
the idea that diagnostic significance can be attached to scatter, they
recognize uneven manifestations of intelligence in individuals. Thus
scatter is likely to be the result of individual patterns of abilities.
For example, a particular youngster might have exceptional verbal abili
ties and therefore score relatively high on the vocabulary subtest. Since
the vocabulary test occurs at a number of age levels, it will likely in
crease the extent of his scatter.

9Slow Learner. Classification systems are needed to make inter
pretations of IQ possible. Two well known classifications are provided
by Terraan and Merrill (1937; 1960) and Kechsler (1949; 1958). It is
not the intent of the present investigator to present the classifications,
but rather to discuss the group of individuals whose IQ’s fall approxi
mately between 70 and 84. The American Association on Mental Deficiency
(1959) has termed the level of intelligence in this area as "borderline.’*
This investigation is concerned with a broader range of intelligence than
the slow learner, i.e., with Binet IQ’s extending below 70 into the 60*s.
Nevertheless, the majority of subjects fell into the slow learner class
and therefore a discussion of the slow learner would appear appropriate.
Unlike some forms of mental deficiency such as mongolism, the slow
learner cannot be distinguished by merely looking at him (Johnson,
1963, pp. 30-32). But, as a group, slow learners are slightly below
the average in height, weight, and motor abilities although a thorough
physical examination will indicate they are "normal." This is somewhat
contrary to the popular concept of the retarded being"aliIbrawn and no
brain.”
IQ”merely states that a person’s intelligence at any given time
is defined by his relative standing among his age peers” (Wechsler, 1958,
p.33). kith this in mind, the slow learner may be seen as an individual
whose relative intellectual standing is between the first and second
standard deviation of the lower half of the intelligence distribution.
Depending on what test is used, they represent about 14% of the popu
lation with a percentile rank ranging from 2 or 3 to about 16 (Wechsler,
1949, p. 15). That is, from 84 to 98 percent of their age peers will

10
be brighter in varying degrees than they. This intellectual retardation
strongly affects the slow learner’s educational development.
From a theoretical point of view a child with an IQ of 75 would
not have the minimum mental age for reading readiness until he is 8
years old. Theoretically, he would be capable of learning many "basic
skills,” but some would always be beyond his grasp. Theoretically,
he must be taught at a slower pace since each year his mental age drops
further behind the average. For example, at age 6 he will be 18
months below the average in mental age but at age 15 he will be 45 months
behind. However, the problem is neither this simple nor this clear-cut.
The theoretical point of view overlooks important factors such as
interest, aptitude, adjustment, temperament, motivation, and study habits.
In real life prediction of academic performance for the individual re
mains very difficult.
There is no evidence to indicate that the slow learner’s emotional
and social characteristics differ from the average. The possible exception
to this rule is that slower learner’s interests are more constricted than
the average or bright. Slower learners have the same basic needs, wants,
and desires as other children. An example of some of these needs are: a
need to belong, to be part of the group, and to be accepted by the group:
a need for the feeling of self worth, and the need for love, attention,
affection, and understanding.
Consider for a moment the plight of the slow learner in an average
school. Does he belong to a group? Does he feel he contributes to
class projects? Is he reinforced or rewarded for his academic efforts?

Can he identify with a group? Can he take pride in his work in the
light of external criterion? Are teachers as positive in their attention
affection,and understanding as they are to the average or bright?
Usually the answer to these questions is a resounding no* Frequently
the slow learner is- older and larger than his classmates due to failure
to be promoted. For this reason he may stand out or apart from the
group. Other children who are promoted yearly maintain their established
friendships whereas the slow learner must look for new friends each time
he fails to be promoted. The almost inevitable failures in promotion
are likely to damage his already weak self-esteem. His daily work is
often regarded as inferior and graded as such by the teacher* His
contributions to class projects are met with ridicule rather than
praise. The attention he gets is rarely for his good efforts but rather
for his misbehavior. Teachers become annoyed with him because he can
not "keep up” with the class. Tolerance, not understanding, is all that
be gets, Frequently, he becomes apathetic rather than interested in
learning and all too often becomes the playground bully or trouble
maker. Viewed by the school faculty he becomes a discipline problem.
The rather gloomy picture painted above is not true for all slow
learners, at least to the degree indicated. To be sure, there are many
happy, well adjusted slow learners. Nevertheless, there is a dis
proportionately large number of problem children in the slow learner
group (Johnson, 1963, p. 48) and consequently special attention has
been given to this problem in this paper.
In summary, slow learners are normal in physical appearance but
probably slightly below average in size and motor ability, The slow
learner is an individual whose relative intellectual standing ranges
from the 2nd and 3rd to about the 16th percentile. Quite naturally

12
their intellectual retardation has a severe effect on their academic
proficiency. If forced to compete with average students, they almost
inevitably fail. The constant failure frequently leads to varying
degrees of emotional and behavioral problems.
The Problem of This Study. The major problem of this study revolves
around the efficacy, value, or merit of using the GGodenough Draw-A-Nan
Intelligence Test as an estimate of intelligence with a subaverage
population. To test this problem it was necessary to assume the Binet
could act as a criterion of intelligence. Phrased another way, the S-i
became the external, independent, objective, observable, referent to
which the DAM could be compared. Without this assumption the statistical
techniques, correlations, and tests of mean differences between the
Binet and Goodenough would have been meaningless.
A second problem in this study was to examine the relationship
between the Binet vocabulary subtest and the total Binet and between
the Binet vocabulary and Goodenough test scores. A third problem was
to investigate the relationship between test scatter on the S-B and the
difference in scores made on the Binet and Goodenough tests. As in the
first, the second and third problems were checked with a subaverage
population.

CHAPTER II
REVIEW OF THE LITERATURE
Relationship of Goodenough Draw-A-Man Test to the Stanford*Binet,
As was mentioned earlier, part of Goodenough*s attempt to validate her
test was done by correlating it with the 1916 Stanford-8inet• Her
subjects were 334 children, ages 4 through 10 years. The correlations
between the MA of the tests for each age are as follows: age 4, ,863;
age 5, .699; age 6, *832; age 7, ,716; age 8 ,557; age 9 .728; and
age 10, i849. The overall correlation for the IQ*s of the group was
,741, Tests for mean differences between the Binet and Goodenough were
conspicuous by their absence.
Yepsen (1929, pp. 448-451) in an attempt to determine the reliability
of the Goodenough test used 37 feeble-minded subjects from the Vineland
training school. The subjects were all boys and ranged in ages from
9.0 to 18,2 years. The tost was administered 3 times with a 4 day in
terval between test and retest. The testing was carried out in accord
with Goodenough*s instructions. The drawings were scored and rescored
to eliminate errors. The resulting test scores (MAs) were correlated.
The correlation between the first and second administration was .89, be
tween the second and third ,91, and between the first and third ,91,
Binet MA scores were also correlated with the DAM test. The resulting
correlation was ,60. It was concluded that the test “appears to
measure something not entirely covered by the Binet" (Yepson, 1929,
p. 451). No tests for mean differences were made.
McElwee (1932, pp. 217-218) used 45 subnormal 14 year olds as
subjects in her study. The children, from ungraded classes of New York

14
City, were given the Goodenough and Binet tests at the same time. It
was found that the Binet median mental age was 8*0* while that of the
Goodenough was 7-3. Whether the 9 month difference is significant
was not pointed out. The product-moment correlation between the MA of
the two tests was .717 - .048. It was concluded that the test was as
equally satisfactory for subnormal children over 12 years as with
younger children.
Earl (1933, pp. 305-327) began his study with 420 drawings from
mental defective patients. Three hundred and seven subjects were
eliminated from the sample since they did not fall between the ages of
16 and 40 years and/or their Binet mental ages did not lie between 5
and 9, Others were eliminated, for example, because of clinical psy
chosis, speech defects and physical disabilities. The final sample in
cluded 113 mentally defective subjects who passed the above criterion.
The Goodenough was usually given after the Binet test. Earl varied
the instructions with the mental age of the subject and used 7 3/8 by
5 3/8 paper, When the 2 tests were correlated, a coefficient ©f
,48 - *07 was found. Unfortunately Earl failed to say whether this corre
lation was for MA or IQ, Moreover, no information was given as to the
sex of the subjects, their CAs except for range, their average IQs or MAs
on the Binet or Goodenough, means of scoring the Goodenough and so on.
In an attempt to throw further light on scoring and test reliability
Williams (1935, pp. 653-656) had 5 upper division education students
independently score the drawings of 100 children. The subjects ranged
in chronological age from 3 to 15 years. Binet tests were also given the
children and it was determined that their mental ages ranged from 4 to 12.

15
It should be noted that the chronological age range is far beyond
that suggested by Goodenough for use of the test. The scores of the 5
raters were intercorrelated, The resulting intercorrelations ranged from
.80 to *96, Correlations of .90 to .97 were obtained between the totals
of separate raters and mid-scores of rating.
The mid-scores of the rater and chronological age were also correlated.
The resulting coefficient was .491 - .051, A relatively high coefficient of
,801 - .024 was obtained between the mid-scores and the Binet mental age
while a coefficient of .651 - .058 resulted in correlating Goodenough
IQs with Binet IQs.
Williams found no sex differences on the Goodenough when considered
in relation of Binet mental age. Williams concluded that relatively
inexperienced persons could reliably score Goodenough drawings but that
a brief period of supervision is advisable before independent rating is
undertaken. Further, it was felt that this study gave added support to
the Goodenough Test's validity and reliability.
In a series of studies carried out by McHugh (1943, 1945a, 1945b)
the relationship between the 1937 Stanford-Binet and Goodenough test
was examined. The subjects were 90 public school kindergarten children,
43 of which were boys and 47 were girls. All the children were initially
testdd with both tests during the 2 weeks prior to the beginning of
school. They were retested shortly after school began (mean of 30,2,
SD * 12.2 school day), The average age at the time of the second test
was 64 months, SD t 3,97 months. The Goodenough test was given twice in
succession after the subjects had finished the Binet, This necessitated
modifying Goodenough *s instructions slightly. The drawings were scored
and rescored by others to check for accuracy. The highest of the 2 test
scores were selected for final analysis.

16
The relationship between the 2 tests was checked by way of
correlations. The resulting correlation between the Goodenough and Binet
MAs was ,45, PE * ,6 6 . Using the Goodenough and Binet IQs a correlation
of ,41, PE * ,06 was obtained, McHugh pointed out that correlations were
probably somewhat depressed since half the subjects were given for® L and
half of the subjects were given for® M of the S*i„ Biserial correlations
were also computed for the class B items of the Goodenough with the
Binet IQs, It was found that only 30 of the 51 items yielded a positive
correlation. The remaining 21 were either 0 or slightly negatively
correlated. The highest correlation with the Binet was obtained by
using 9 items with a biserial correlation of #36 or better, Tests for
significant differences were not made,
As part of a control group for the study of Indian children,
Havighurst, Gunther, and Pratt (1946) used white children from a small
mid-western city. Fifty-eight of the 6 6 subjects were 10 years old
while 8 were between 11 and 11 years 3 months. The size of the town
was small and the 58 10 year olds represented nearly ail the children
in that age group. The 6 6 subjects included 28 boys and 38 girls.
Among other tests, the Stanford-Binet and the Draw-A-Man were given.
The IQs of the 2 tests were correlated and yielded a coefficient of
,50 - ,06, Apparently because the study was concerned mainly with Indian
children, little other information was given concerning the white group.
Birch (1949, pp. 218-224) investigated the relationship between
the Goodenough test and the 1937 Binet with borderline and mental
defectives. The life age of the subjects ranged fra® 10 years 6 months
to 16 years 3 months, This is somewhat beyond the age Goodenough (1926)

17
intended the test to go. It should be remembered, however, that Goodenough
was referring to mental age, Forty*three boys and 25 girls all having
Binet IQs of 70 or less composed the 6 8 subjects in this sample.
As was true of other studies, car© was taken to check the scoring
of the drawings by someone other than the examiners. Using product-
moment correlations, a correlation of ,69 was found between the Binet and
Goodenough MAs, ,62 between Binet and Goodenough IQs, ,37 between CA
and Binet MA, ,38 between CA and Good enough MAs, and ,64 between the„.!inet
and Goodenough MAs after CA had been partialed out.
Birch (1949) noted that the mean 0AM MA of 85,8 was significantly
higher (at the 5% level) than the S-B MA mean of 80,5. The standard
deviation of the Goodenough was also significantly (1% level) larger
than the Binet. Birch attributed the significant differences in both
factors to the truncated Binet scores, that is to the fact that no
Binet scores above 70 were included in the sample, Birch concluded
that the Goodenough test is a valid measure of mental ability for
children ages 10 years 6 months to 16 years 3 months with Binet IQ's
of 70 or below.
Using children from the Dixon State hospital, Johnson, HIlard, and
Lahey (1950) obtained a correlation of .48 between the Binet and
Goodenough, It was felt the correlation was quite high considering the
sample included feeblemindedness, epilepsy, post-encephalitis, and brain
damage. West in a study with 48 4th and 5th grade children in 1960
obtained a correlation of ,45 between the Goodenough and Binet, (West
made no mention of which revision of the Binet was used so it was
assumed to be the 1937),

18
In a recent study Rohrs and Haworth (1062) examined the relationship
between the Goodenough and Stanford-Binet. The subjects were 46 mental
defectives. The correlation (.28) between the IQs of the 2 tests was
nonsignificant. In discussing the nonsignificant correlation the
authors pointed out that many of the performance items of the 1937
Binet have been omitted in the 1960 revision. This might* in part,
account for their results. No significant difference was found between
the mean DAM IQ of 56.46 and mean S-B IQ of 56,91,
With the exception of Goodenough’s standardisation, the studies
presented were concerned mainly with an overall relationship rather
than the degree of association for separate age groups. Presenting an
overall correlation when multiple age groups have been used has distinct
drawbacks. The ages which contribute the most and least to the relation
ship remain unknown, For example, it is possible that in the lower age
level there is no correlation between the 2 tests, but in the upper
age levels the correlation is high. An overall correlation will reflect
a compromise of the 2 extremes rather than the true picture. Thus the
ages which show the greatest correlation are not known and the overall
correlation is in question. Equally serious is the possibility of a
high correlation existing between the means at the various age levels
while within the age groups the correlation may be low. In such a case
the total correlation would be spuriously high and again not reflect the
true nature of the relationship,
A second aspect of the same problem is to determine whether the
scores rendered by the S-B and DAM are equal, Birch (1949) found the
mean Goodenough MAs were a significant 5.3 months higher than the
19Binet*s while Rohrs and Haworth (1962) found no difference in IQ means
in their sample. Here again there are advantages in considering each
age separately. It is possible for example* that at the lower age levels
the mean Goodenough score would be significantly higher than the Binet;
in the middle range they could be equal; and in the upper age levels
the Goodenough would be lower. In such a case, a test with overall
means might find no significant differences. This thesis, in large part*
considers the problem of significant or nonsignificant correlations and
m m ® differences between Binet and Goodenough scores*. (MA).
Stanford-binet Vocabulary, In 1918 Terman made a searing attack
against criticism of the vocabulary mental test. The offensive was
based on research with 631 school children; with 482 adults composed
of 150 "hobos", 150 prisoners* 150 deliquents, and 32 business men;
and 65 university students. The correlations between the vocabulary test
and Stanford-Binet MA for the 631 children* Terman pointed out, was a
creditable ,91. Even with the 482 adults a coefficient of ,81 was
obtained* Further evidence of the validity is the constant* regular* and
almost straight line of the vocabulary growth curves for successive
mental ages.
In discussing vocabulary in the manual for the 1S37 revision, Terman
reiterated ”we have found the vocabulary test to be the most valuable
single test in the scale,.,,It agrees to a high degree with the mental
age rating on the scale as a whole; correlations for single age groups
range from ,65 to ,91 with an average of .81,”
Shakow and Goldman (1938) reported a correlation of ,64 between
Binet vocabulary and education. They felt the degree of the relationship
20was due mainly to the indirect effect of mental level. A year later,
Elwood (1939) found an exceedingly high correlation (978-.0009)
between the Binet mental age arid vocabulary scores with a large number
of Pittsburgh school children. Using part of the standardization data
for the 1937 revision, McNem&r (1942, pp. 159-140) reported product-
moment correlations of *71, .83, .8 6 , and .83 for ages 8 , 11, 14, and
18 between vocabulary and composite MAs. There were better than 200
subjects at each age level except year 18 which had 1 0 1 subjects.
Cureton (1954) used McNemar*s data to provide mental age equivalents for
vocabulary scores. In doin| so, he acknowledged the usefulness and
validity of the vocabulary test.
Lewinski (1948), in a lengthy review of the literature on vocabulary
and mental tests, pointed out the acceptance of vocabulary tests in
general and the Binet vocabulary in particular. Tests such as the
Columbia Vocabulary Test, Wide Range Vocabulary Test, Knauber Art
Vocabulary Test, and the Michigan Vocabulary Profile Test all point to
the widespread use 3tnd acceptance of vocabulary tests. Tests of
deterioration such as the Shipley-Hartford Retreat Scale, Babcock and the
iiunt-Minnesota Test for Organic Brain Damage, assume vocabulary to be a
measure of intellect.
Levinson (1958) attempted to find the relationship between the
Binet MA and Binet vocabulary with foreign and native born American
subjects* With age groups of 4 to 5-11, 6 to 7-11, and 8 to 9-11,
he obtained correlations of .64,.44, and .61 for the foreign group, and
.62, .70, and *70 for the native born group. He felt that the
vocabulary over-estimated the MA of native born children and under
estimated the MA of foreign children. Nevertheless, the high

21
correlations indicate the test still provides a good index of intelligence.
Evidence from the literature is so conclusive there can be little
doubt that a strong relationship exists between the Binet and the Binet
vocabulary. Many feel the relationship is so high that the vocabulary
alone provides a good rough measure of intelligence* Thus the
Goodenough test and the Binet vocabulary are both proported to correlate
well with the total Stanford-Binet. Do they (Goodenough test
and S-B vocabulary) correlate well with each other? This question
and the relationship between the S-B vocabulary and the total Binet
became the basis for the second problem of this thesis*
Stanford-Binet Scatter* Scatter has long been of interest to
psychologists. Binet and Siiaon (1916) thought it was a characteristic
of the defective child. In 1937 Harris and Shakow (1937* pp. 134-150)
reviewed the literature on the significance of scatter. A number of
contradictions were found. For example, 5 studies reported feeble
minded subjects scatter more than normals while 4 studies indicated
that this was not true. Two studies reported greater scatter among
neurotic children, and 1 study indicated that this was not the case. In
3 studies children of superior intelligence scattered more than the
average and in 2 studies they did not. These and a number of other
studies of S-B scatter lead Harris and Shakow to conclude:
1 . Feebleminded, deliquent and neurotic children scatter little, if more, than normal children, so far as numerical measures of scatter are concerned.
2. Scatter is probably a little greater in bright than the average children, but not sufficiently so to be of diagnostic value.
3* Results vary somewhat with the test used and with the measure of scatter used.
224. At least some measures of scatter are systematically related to mental age. The results of studies which do not control this relationship allow only an ambiguous interpretation*
5. The relative merits of the various measures of scatter have not yet been satisfactorily determined*
6 . In order to draw correct inferences about the clinical importance of numerical scatter in test results from adults, normal adults rather than children must be used as a standard for comparison.No such study has yet been reported. (Harris 6 Shakow, 1937, p* 148)*
The following year the same writers (Harris 6 Shakow, 1938, pp. 100*111)
checked 154 schizophrenic patients, 133 normal adults, and 138 delinquent
adults with 4 scatter measures, The test was administered in the conven
tional manner except for some minor changes to make the test more suitable
for adults, The results were negative, only mental age was found to be
related to the amount of scatter.
After a brief review of the literature Hunt and Gofer (1944, pp. 548-550)
concluded,../'the scatter approach appears now to be a blind alley.”
A year later, in 1945, Mayman (pp. 548-551) concluded his review
of literature by stating,«♦."numerical measures of scatter on the
Stanford-Binet have proved to be virtually useless as aides in clinical
diagnosis; nevertheless, the clinical impression that the extent of
scatter on the Stanford-Binet may be indicative of maladjustment persisted,*'
Two more recent opinions were expressed by Crcmbach (I960, p. 186)
and Freeman (1962, p. 326). The former feels that "after many studies
of scatter, investigators now agree that it has no value as a score”, and
no diagnostic worth, The latter qualified his opinion by stating that
"in view of inconsistent data, we must conclude that numerical measures
of general scatter on the Stanford-Binet scales are, at present, of
limited use as clinical aides, so far as most individual cases are concerned

The evidence against scatter being a meaningful diagnostic aide
is overwhelming. In light of this, the belief that scatter is due to
differing patterns of abilities is much more acceptable (See earlier
comments of Terman and Merrill in section on scatter). Assuming this,
scatter would be due,in part, to individuals excelling on verbal and not
performance items or the reverse. Since the Binet tends to be primarily
a verbal test and the Goodenough a performance test, it would appear that
the difference in scores on the tests would be related to scatter, that
is, the greater the unevenness in verbal and performance abilities in
the individual, the greater will be his scatter and the greater will
be the difference between his Goodenough and Binet scores. The investi
gation of this relationship became the third problem of this thesis.
CHAPTER III
SUBJECTS, MATERIALS, AND STATISTICAL METHODS
The files of the Child Study Service of the University of Omaha
provided the source from which the data for this investigation was
abstracted. The files contained the records of ail children having
had intellectual evaluations in a 9 1/2 month period. The children came
from the Omaha Public Schools as referrals in need of special programming.
They were often suspected by their teachers and principals of being
slow learners (as'..'evidenced by low grades, for example) or not working
up to their capacity. The evaluations were not limited to, but always
included, the administration of the 1960 Stanford-Binet, Primarily for
research purposes the Goodenough DAM test was also contained in the test
battery.
Only those children 5 through 12 years, who were tested between
October 1, 1961 and July 15, 1962, and whose IQ scores were below 85
on either the Binet or Goodenough were selected as subjects. Of those
who met these requirements, II were not included for the following
reasons: 5 did not have Goodenough records, 2 drew heads rather than
complete figures, 1 produced the figure of a woman, 1 became ill during
testing, 1 was uncooperative during testing, and 1 did not achieve a
basal. It was later decided that only Class B (recognizable) Goodenough
drawings should be considered, thus eliminating IS subjects with Class
A drawings. The final sample included 226 boys and 119 girls for a
total of 345 subjects (See Table I). For the distribution of S-B and
DAM IQ scores see the appendix.
The actual testing of the children was done by 4 psychometrists

Chronological
Ages aiuj
Binet
ami
Goodenough Mental Ages for the 345 Subjects in
Sasapl
<s>
CM
'ft Cl N t-* «t r* H CM M3 »H<S4 -H H Ok 1/5 to cm *H
00 to H 0r» «-4 CO U*5 »H. «Mt 4/5 o*m4 to • • • • * « * * * »|<N» Kg o r~- O 'O' *H *H to •Hto im4 n>4 o esc —* c* >—4«—I -H H
c?»
00
M3
m
U)Q>m<
in'ftto
c-to
in
to«<fr
<75 *sr O M3 C?5 L.O CM O St <30oO to st e© O' c C- vO o CMSO o CM CM to to CM CM f*S tO• • • • * * • • ■» •N M3 00 © CM O O CM c* in©•H r-4 00 CM 00 CM 00 •"* !>. H
to to 00 o M3 00 tO O Q•*» c- o >© C© CM •sf 05 C" r-CM CM •HI fN, ■S' 05 CM O cm in• • • • • • • • • •O to O H Oi tn *•« m ■MU Oin CM CM 05 **h 00 »H %£)*-M r—1
s0 MO *H in CO C'- 05 js- *H to05 00 CM o c- Oi in o sD COH ■t ■S' a* tn 05 oo in C* o« • • • * • f • * *10 to to 05 to to CM st *5f 1«HCMH oH H a> *H CO '■H C'
SO o CM to st sO vC 50 '<j0 O'C- *■»! M3 CM to c© ■tr o C' m«t MS' c. m IS O 'M3 C5 c** * • • * • • * • •CM to C- to sO in St »H sO to•H c?» *“M OO fnttf C© i-H rs •H
in in in SO m m O 90 tnC- v£i CM CM CM -MS O 35 fH oo CO MS' m vo tO m2 C* cso 05■t « • • » • • * • •> ••H to ■5? tO O CM O CM 00 CM*H GO »H GO ■H CO •H H
to •-» in cm ♦H o st rs tH. to«sf 1/3 oO st M3 oc ■t oo •H CMCs in M3 o to m c- in O h4"tf « • • • • • • • * *•3i tO C5 05 •H Tf St O €55 ChCO \C l*S C> rH is H
GO o to »“M fv ■t CM to '-V»o o CM CO st m |N tO c m05 SO H ■t 't' o o st tO *i<t »Hm • • «k * • * * • • •r- to •H '4> C ' m C- CO Cs C5c> m3 «Mt r- GO r-4
oc in O 00 m to l3 in om o O 05 c* tn o oo CM sfst 05 -sO O vO 00 o m M3 CMCM • • • • • • • • « •O CM M3 00 to 00 rH CM Q CM\0 in <C m CO O' GO *H
t-i
jsO' 3l-H Ca s e
9e aO c® . _ _4> o a © ca -a ©3C W3 CS 2 C? os: ■w OL3 03 C3
O flj3 0 0Id
ooo••'S'
COcCg•H-oo
&S&f3Seg+•>o
oom>00aeg•H
4)es•HIiXi
In

26under the supervision of Dr. D. T, Pedxini, the director of the Child
Study Service. The 4 examiners were studying for Master’s degrees in
psychology and had undergraduate majors in psychology. All were enrolled
in a graduate course in individual mental testing, and, prior to
October 1, all had undergone an intensive 6 week training period in the
administration and scoring of the I960 Stanford-Binet. They were also
given instruction in the administration and scoring of the Goodenough
Intelligence test.
The procedure involved in testing a child followed a relatively
stable pattern. The referred child was usually brought to the Child
Study Service by his parent(s). He or she was introduced to the examiner
who made every effort to put the child at ease, and, in general, establish
rapport. When sufficient rapport was reached, the testing was begun,
The Goodenough was usually given first, with the Binet following
immediately after. With one exception both tests were administered'
according to the specific instructions of their respective authors.
The lone exception was the use of 8 1/2 x 11 yellow paper instead of the
test blank suggested by Goodenough.
Tests. The 1960 Stanford-Binet and Goodenough Intelligence tests
are too well known to warrant more than a cursory description* The
Binet test covers the range from age II through 3 Superior Adult levels.
Half-year intervals are found at ages II through V, yearly intervals
from V to XIV with the remaining levels designated as Average Adult and
Superior Adult I, II, and III, I here are a total of 142 subtests in the
Binet, 6 plus an alternate at each level except the Average Adult which
contains 8 plus an alternate.

27
The sub-tests at the lower age level frequently require eye-hand
coordination and the identification of common objects and minimize the
need for a great deal of verbal response. Examples are manipulating a
3 -hole form board, identifying parts of the body on a paper doll,
building a 4 block tower, requiring the child to point to a cup when
the examiner says, "Show me what we drink out of," and the drawing of
a vertical line.
In the middle range of the scale, a wide variety of subtests are
found, They include such areas as comprehension, memory, recall, and
spatial orientation, In the upper levels of the Binet, the subtests
ar© almost entirely verbal as opposed to non-verbal. Vocabulary,
abstract reasoning, and concept formation account, in a large part,
for the type of abilities tapped in the Superior Adult levels.
The new Binet, like its predecessor, is an age scale; that is,
the subtests are grouped and arranged in terms of various age levels.
Each subtest passed earns credits towards the mental age score, Between
Binet ages II and V, the subject is credited 1 month for each subtest
passed; from years VI through XIV he is credited 2 months for each
subtest success. Up through age XIV, a maximum of 12 months can be
earned at each year level, At age AA (Average Adult) a maximum of 16 credits can be earned, Superior Adult levels I, II, and III are
credited with a maximum of 24, 30, and 36 months respectively. The
MA score is computed simply by totalling the months credited at each
year. Kith the subjects MA and CA, his IQ can be found by referring
to Pinneau*s Revised IQ tables in the back of the' manual. The tables
provide deviation IQ*s with a theoretical mean of 100 and a standard

28deviation of 16. This means the IQs are, in effect, standard scores
and therefor© comparable at all ages. The use of deviation IQs is perhaps
the most important single innovation, of the 1960 Stanford-Binet compared
to the 1916 and 1937 $-B*
The Goodenough, a point scale, is a relatively simple test contrasted
with the Binet. A blank sheet of paper and a pencil is all the equipment
required. The subject is asked to draw a picture of a man, the very
best picture he can. The drawing is then scored on the basis of passing
or failing each of the 51 items of the test. In essence, the items
represent different details or aspects of the drawing. For example,
a point is given for the presence of a headj in the same manner, points
are given for showing a neck, eyes, hair, clothing, fingers, mouth and
legs. Points are also given for adequate body proportions, and for
varying degrees of motor coordination depicted in the drawing.
Mental age is determined by totalling the scores and referring to
the table of MA equivalents provided by Goodenough. Beginning at MA
3 years 3 months, each score is equivalent to 3 months. Thus a score
of 4 is converted to 4 years 0 months, a score of 5 to 4 years 3 months,
6 to 4 years 6 months, and up to the MA level of 13 years 0 months.
No mental age equivalents are given beyond 13. Intelligence
quotients are obtained by dividing the MA by chronological age and
multiplying by 1 0 0 ,
Theoretically the mean IQ is supposed to be 100, The standard
deviations, however, are not equal at all levels so IQ * s are not
comparable at all ages.
Statistical Procedures. The statistical procedures employed are,

29quite naturally# directly related to the questions raised* In this
section major statistical techniques and the questions it was hoped
they would answer will be discussed.
What was the relationship of the Goodenough to the Binet? The inquiry
was not merely to determine whether a relationship existed but to ascer
tain the degree with which it occurred. Further# this information was
desired for separate age levels as well as the sample as a whole.
Lastly# information was desired relative to the possible effect of the
correlation of the means of the age groups, (See Chapter II for the ad
vantages of considering separate age levels and the possible effect of
correlation of means,)
The statistical technique which would encompass the above problems
was the Analysis of Covariance for simple factor experiments as described
by kiner (1962# pp. 578-594), Minor changes in computation were
necessary due to the unequal cell frequencies in the sample, Winer
(1962, p, 594) provided the necessary computational formulae for the
transformations# and a number of checks for the assumptions underlying
the Analysis of Covariance, It was thus feasible to decide whether
regression coefficients within each treatment class were homogeneous#
whether regression coefficients within equalled regression coefficients
between classes, whether the between class regression was linear# and
whether the sample had overall linear regression. Intrinsic in the
testing of regression effect is the formulation of regression equations.
Consequently the prediction of the most likely score on one test from
knowledge of a. score on the other was made possible. The main importance
of the Analysis of Covariance however# was to yield within class# pooled

30
within class, between class, and overall correlations between the
covariate and the criterion. That is to say, the primary purpose of
the analysis was to give correlations within each age group, an average
correlation of the age groups, a correlation between age groups or
means of the age groups, and an overall correlation between the MA
scores of the Goodenough and Binet.
Were there significant differences between the viA»s of the
Goodenough and the MAs of the Binet? The answers sought for this
question appeared to fall in the realm of the Analysis of Variance (ANOV),
The data lent itself to a two-factor experiment with repeated measures
on one f actor (Winer, 1962, pp. 298-312), The general case is repre
sented schematically below (Winer, 1962, p. 362).
L'! ... b .2
b9
a, ... G . ... G1
•.
1 1 1
*aia 1• i
G „X ... G .i ... G.l
* Ia G .. * G ... Gp i! P P P
The repeated measurements are made on factor B. In this study
there were only two levels of factor B, b symbolizing the Binet testi.and b„ the Goodenough test scores. In like manner, factor A represented
the age levels, i.e., being the 5 year olds, 6 year olds, up to
ag the 12 year olds. The subjects are nested under the various levels
of factor A, The symbol refers to a group of n^ subjects of level
of factor A. It will be noted that the group of subjects from any level

31
of factor A is observed under all levels of factor B. The design assumes
an equal n at each level of factor A, To adapt the data (with n not
equal) to the design* major computational transmutations were required
but the general form remained the same. Since the unequal group size
did not appear to represent "different strata within the specific
population" (Winer, 1962* p. 374)* the unweighted-means solutions were
considered appropriate.
The use of the ANGV enabled the testing (f test) of overall
significance of differences between, the 2 levels of factor B on the
Binet and Goodenough. Non-chance variations among the means led to
further testing with the pairs of means at each level of factor A or
age groups. An F test was also used to determine whether means at the
age levels varied more than that expected by chance. It was assumed
they would since mental age generally increases with chronological age.
Because the F was significant* it meant individual t tests were in
order. Tests were made for interaction, that is, for the joint effects
of factor A and B acting together, or, more simply, whether significant
differences between the Binet and Goodenough were related to the age
levels*
In the foregoing ANOV discussion, the subjects had been grouped
by chronological age, To cast further light on the subject, the subjects
were regrouped by Binefc mental age, completely disregarding CA,
All children with a Binet MA of 5 years to S years 11 months formed
one level* those from 6 to 6 years 1 1 months formed another and so on.
All cases of MA 12 years and above were considered as one group as the
ii became small. Each year level was examined for significant differences

32
between the Binet and Goodenough MA scores. A two-tailed t test for
correlated observations was used (Winer, 1962, pp. 39-43).
The relationship of Binet vocabulary to the total Binet and the
vocabulary to the Goodenough was checked with the Pearson Product
Moment Correlation, The r between the vocabulary and the total Binet
MA score was in small part, spuriously higher because the vocabulary
is part of the total score, McKesa&r (1942, p. 140) however, has pointed
out that the degree of spuriousness is not great since the vocabulary
subtest contributes less than 5 percent of the total score.
First order partial correlation technique was used to investigate
the relationship between test scatter on the Stanford-Binet and the
difference in MA scores made on the Binet and Goodenough tests. Fro®
a scatter diagram, it was observed that the difference in the Binet and
Goodenough scores tended to increase with chronological age* Therefore,
in correlating scatter and the difference, it became essential to hold
age constant by partialling it out. The formula used may be found in
either MeNcmar (1962, p, 166) or Gilford (1956, p. 316).
The statistical procedures thus far discussed are directly related
to questions this study attempted to answer. One test was carried out
however, which was not related to any of the original hypotheses. The
sole purpose in making the test was simply to gain a clearer picture
of the sample. To learn whether the children at each age level were
of equal brightness, the Binet 10 scores were examined by a single
factor ANOV for unequal sizes (Finer, 1962, pp. 96-104), This was
followed by the fvewman-Keuls test for differences between all ordered
pairs of means. In the A W V the 8 age groups were considered treatments.
33
The seans were the mean Binet IQ scores of each of the 8 age groups.
In this section only the more complex statistical operations hare
been touched upon, it was felt there mas no need to discuss the
descriptive statistics such as moan* median, and standard deviation,
The formulas used for those statistics were the standard ones found in
most statistic textbooks. Also omitted were discussions of minor
questions such as percent passing the ilnet vocabulary at various
ages.

CHAPTER IV
RESULTS AMD DISCUSSION
The results given in this chapter will follow the same order as
the statistical procedures presented in the previous chapter. The results
are discussed as they are given. A unified discussion of the results
as a whole has been reserved for Chapter V.
Correlations. The Pearson correlations (r) between the Binet
and Goodenough MAs are given in Table II. Of the 8 age groups only
1 r was significant. It was particularly interesting to note that
Table II
Correlation Between I960 Stanford-Binet Mental Age and Goodenough Draw-A-Man Mental Age
Ages 5 6 7 8 9 1 0 1 1 1 2
N 24 r .169
59 47 .131 .182
40.300
43-.131
57.310*
38.205
37.028
* significant at the *0 $ level
between the 2 highest correlations, at ages 8 and 1 0 , a negative r was
found at age 9.
McNenar (1962, pp. 119-135) suggested 5 methods of interpreting r.
One is that r is ’’associated with the rate at which one variable changes
with another,” Viewed in this manner, the low and nonsignificant
correlations in Table II led to the conclusion that the rate at which
the Goodenough changes has little to do with the rate of change in the
Binet. Regardless of what interpretation is placed upon r, the degree
of relationship in this case remains low.
The pooled within-class correlation was .140, Basically this is an

35
average r of the 8 separate age groups. Contrasted with the almost
negligible degree of association indicated by an r of .140 is the
overall r of .623 significant at well beyond the . 0 1 level. The 2
correlations, one of moderate size and one low, would appear to be a
contradiction. Actually the overall correlation is strongly influenced
by the between class r or correlation of the means, which in this case
was .978. Consider for a moment the 8 ages plotted on a scatter diagram.
The tally marks for each age taken separately appear almost randanly
placed on the scattergram with the exception that the 5 year olds tend
to fall at the lower left of the diagram, the 8 year olds more toward
the middle and the 1 2 year olds nearer the upper right hand margin.
The 8 separate age groups viewed together or taken as a whole appear to
resemble a normal but somewhat fan shaped scatter plot. The overall
r is affected by a variable other than the relation of the covariate to
criterion. One method of controlling this is to hold the uncontrolled
variable constant via the partial correlation* Another method to make
the groups comparable is by the use of the Analysis of Covariance.
The latter method was used to make each group can parable with respect
to CA, resulting in a pooled within r of .140, It is this pooled
within-class r, not the spuriously high overall r, which best suggests
the degree of relationship between the MAs of the Binet and Goodenough
tests.
In the preceding paragraph it was assumed there was a difference
between the treatment means. Tables III and IV leave little doubt
that this was true.
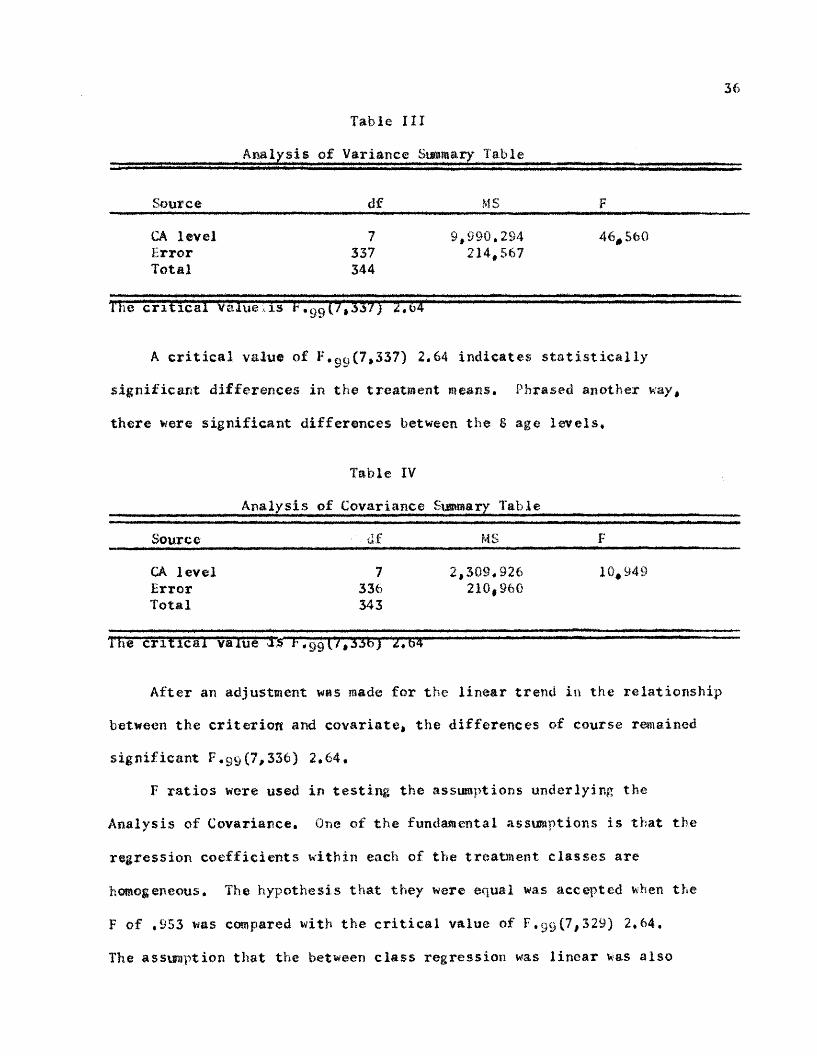
36Table III
Analysis of Variance Stawaary Table
Source df MS F
CA level 7 9,990.294 46*560Error 337 214,567Total 344
The criTTcal1 Value'is 357).2.
A critical value of F.gq(7,337) 2.64 indicates statistically
significant differences in the treatment means. Phrased another way,
there were significant differences between the S age levels.
Table IV
Analysis of Covariance Summary Table
Source ..df MS F
CA level 7 Error 336 Total 343
2,309.926210,960
10*949
m e critical value F.ggl/,33bJ 2.64
After an adjustment was made for the linear trend in the relationship
between the criterion and covariate, the differences of course remained
significant F,9 9 (7,336) 2*64,
F ratios were used in testing the assumptions underlying the
Analysis of Covariance, One of the fundamental assumptions is that the
regression coefficients within each of the treatment classes are
homogeneous. The hypothesis that they were equal was accepted when the
F of ,953 was compared with the critical value of F,.5 9 (7,329) 2,64.
The assumption that the between class regression was linear was also

37
accepted, F0^g 2.383 and F* 9 (6 ,336) 2,80. The assumption that the
regression coefficient within-class ©quailed the regression between-
class was not met, F0^s 62,330 and F,9 9 (1 ,3 3 6 ) 6.63, Also not met was
the assumption of linearity of the overall regression, F of 5.946
compared with a critical value of F.9 9 (14,329) 2,14,
The fact that the last 2 assisnptions were not satisfied does not
necessarily negate the value of the Analysis of Covariance, The lack
of overall linearity however, does suggest the overall r was not
accurate. To correct for the possible effect of curvilinearity corre
lation ratioisr were computed. The resulting etas for Y on X (Goodenough
on Binet) and X on Y were ,7012 and .8258 respectively, Unfortunately
the usefulness of the correlation ratios was extremely limited as they
are also influenced by the r between the means. They did, however, prove
curvilinearity, FQ^S of 11.45 and F*9 9 (6 ,3 3 7 ) 2,09,
Regressions. The overall regression equation was undoubtedly also
affected by the lack of overall linearity. The regression coefficient
was ,4811 for predicting the Goodenough (Y) from the Binet (X) and
,8063 for predicting the Binet from the Goodenough, The regression
equation for the prediction of the Goodenough (Y) from the Binet (X)
is Yf,*,4811X ♦ 39.9272, for predicting X from Y is X"*.8G63Y * 21.8778.
Since the within-class regression coefficients have been demon
strated to be homogeneous, it is possible to obtain a single pooled
estimate for the pooled within-class regression. The pooled within-class
regression coefficient was ,1368 for predicting the Goodenough from the
Binet and ,1437 for predicting the reverse, The value of the regression
equation is in predicting one variable with knowledge of another, The
efficiency of such forecasting lies in the degree of relation which
exists between the 2 variables* In this case the correlation is almost
negligible and therefore accurate prediction is highly unlikely. For
this reason, no regression equations will be given for the separate age
groups. Moreover, it is felt that the equations could give a false
sense of knowledge regarding the prediction of the Binet from the
Goodenough.
Mean Differences. It is conceivable that the Binet MAs and
Goodenough MAs could be highly correlated and still yield MA scores
which are significantly different. It has already been shown that the
tests are not highly correlated but the question of significant
differences remains.
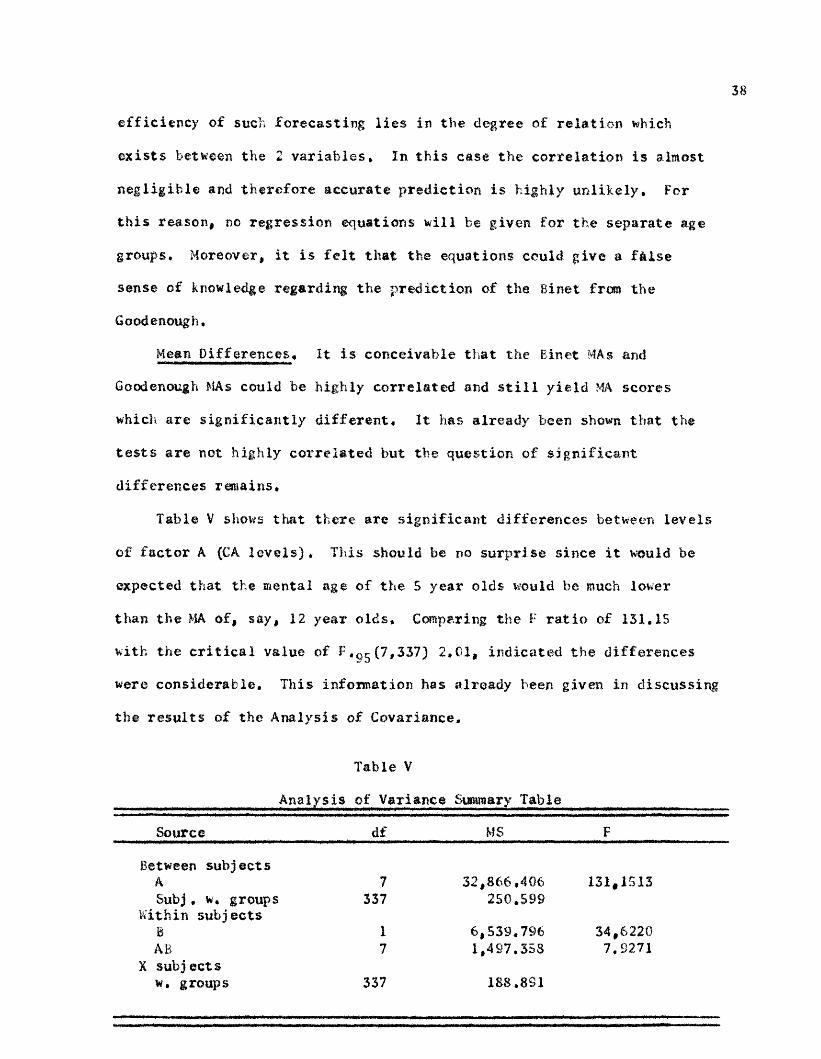
Table V shows that there are significant differences between levels
of factor A (CA levels). This should be no surprise since it would be
expected that the mental age of the 5 year olds would be much lower
than the MA of, say, 12 year olds, Comparing the F ratio of 131,IS
with the critical value of F,C5 (7,337) 2.01, indicated the differences
were considerable. This information has already been given in discussing
the results of the Analysis of Covariance,
Table V
Analysis of Variance Summary Table
Source df MS F
Between subjectsASubj. w. groups
7337
32,866,406 131,1513250.599
Within subjects BAB
1
76,539,796 34,62201,497.358 7.9271
X subjects w. groups 337 188.891

39Normally a significant F as that obtained on CA levels, would
call for individual comparison with all possible means. In this case
it was not necessary, for it could be assisaed that a significant
difference between ages 5 and 6 would also mean that differences existed
between 3 and 7, 8 , 9, etc*, so long as a significant difference was
found between ages 6 and 7, 8 , 9, etc. Stated another way, since the
MA increases with CA, significant difference between S and 6 would
automatically indicate a significant difference between 5 and 7 , 5 and
8 , 5 and 9 and so on. Therefore tests between each age and the age
level next to it were made. The F tests shown in Table VI point out
significant differences at each age.
Table VI
F Tests for Significant Differences Between Age Levels
Ages 586 687 788 889 9810 10811 11812F ratios12.568 6,811 25.732 14.677 11.518 7.544 2.258
l,;' .
While it was expected that significant differences would occur
between age levels, it was not necessarily anticipated that differences
would occur between the Binet and Goodenough (levels of factor B)•
Comparing the ANOV F ratio of 34,622 with the critical value of F.9 5 (1,7)
3.84 leaves little doubt that differences exist, To check this, a
separate F test was made for individual comparisons of factor B. The
resulting F ratio was 34,684 and the critical value was F*9 5 (1*337) 3.84.
The slight difference in F values was probably due to a rounding error.
Thus the investigator was forced to conclude that the means of the
Binet and Goodenough for the overall sample were decidedly significantly

40different. Are they significantly different at all age levels?
The F ratio for AB interaction suggests the differences are related
to age levels (levels of factor A). That is, when the P ratio of 7,927
was compared with the critical value of F,9 5 (7 ,337) 2.01, it was apparent
the difference in factor B (fhe Binet and Goodenough) was not solely
an attribute of factor b hut varied at the separate levels of factor A
(age levels). It was thus necessary to test each separate age level
for a significant difference between the Binet and Goodenough, Two-
tailed t tests for the difference between 2 means with correlated
observations were run. Table VII reveals significant differences at
ages 6 , 9, 10, 11, and 12. No differences were found at ages 5, 7, and 8 ,
Table VII
t Tests for Significant Differences Between the Binet and Goodenough atSeparate Chronological Age Bevels
Ages S 6 7 8 9 10 11 12tobs .963 -2.961 .959 1.706 3.115 4.357 3.089 4.778t ‘ ± 2.07 2.01 2.02 2.02 2.02 2.01 2.04 2*04df D 23 58 46 39 42 56 37 36
To examine this problem further, the subjects were regrouped by
Binet mental age levels. The results furnished in Table VIII, disclose
significant differences at all Binet mental ages but years 6 ami 7. The
regrouping has produced markedly similar results. In general, equal
Table VIII
t Tests for Significant Differences between the Binet and Goodenough atSeparate Binet Mental Age Levels
Ages below 5 5 6 7 8 9 10 II 12 plust bs 3.451 2.693 ,375 .813 3,855 6,715 9.881 14,063 14.632t.c7 r± 2.02 2.00 2,02 2.01 2 , 0 2 2.31 2,09 2.14 2.31df 42 74 40 52 43 44 IS 14 8

41
means are limited to the lower ages regardless of grouping while
significant differences tend to be found in the upper half of the age
levels.
Correlations with Binet Vocabulary« In Table IX information and
correlations (Pearson) relative to the Binet vocabulary is given. The
vocabulary scores are raw scores. The r between the Binet and Goodenough
IQ are also included.
All of the correlations between the S-B vocabulary and S-B MA
or IQ were significant beyond the .01 level; none of the correlations
between the S-B vocabulary and Goodenough MA or IQ (for separate ages)
reached significance at that level. The correlations between vocabu
lary and Binet MA fell approximately in the range Terman found for the
1937 revision. They are also in close agreement with the other studies
reported in the review of the literature. The total r between vocabulary
and Binet MA is slightly higher than the individual correlations and
probably reflects the influence of the correlations between the means.
The total r between the vocabulary and Binet IQ, on the other hand, is
slightly lower than most of the separate age correlations. This is
probably due, in part, to the vocabulary score increasing with age while
the IQ score remained nearly constant. Thus the vocabulary score would
correlate moderately high with IQ at any one age but less well with the
overall sample.
The correlations between the Goodenough MA and vocabulary are so
low, it can reasonably be concluded that no significant relationship
exists between them as far as this sample was concerned. The moderately
high total r is likely to be revealing the r between means rather than

♦i H< *j.♦«*.r+ Ct rftr rra a 03o 0 H"a S. 2<&• ♦ cth-4 x w,D % -O
SE as >0 «» W(A
1 to Ki• * • • • •o o -a "O Oi O'06 toO* ■45- tO fOtO <fts>tn © JL, tn
K)
# to• • * • • •o o tnO'.SO©k~«O'to© VIC5tn© 04JSL©
VI
tO tn#■**< {■Mt >4 "4 V-* *0»— 09 N> to 0* 'O© C© 4b- tn o O'
SO "O o• • * • * *tO so © ©> SO toSO o o to ©S oOo 05 to © tn
4Lt f SO to 04• • • • • •t—i © *o 06 04 ©© to O fwv* totn tO © 04
tn04 CO *oSO to *o •O 04 «oVI o 00 00 © *oSS3 to w 04 © !«*•
►** CP £# • * * « ♦SO to © © <?s «otn 04 o tn © 040c 09 46- 04 tn ©
fmwl 04l 1 04 to *o• * • • • •t— 1*4* CO 00 to toto tn o 04 ■oOo tn ©
t 04 -4• * • * • •to tn tn CO 00 tnto in -o 09 o 'Ooc 00 CD to 04
04 H ■is. O tn r* 93
■ wfa.s1fT<wOIScrc*»Ho-ZL1S3W•>tnft#»'»apHCL©©<H*S»ft*•*»0S3W*»*>S3 HCL 3
cra L-*o ©H mffi X.sortH-o3(A
«M-*ftjjr1fgs
3©rt«3Cl©0§©34K8
mtT*
e/i£SJCL<©

43
the relationship of the two variables.
Correlation of Stanford*Binet Scatter. The correlation of S-B
scatter and chronological age was .59. The r vas significant well be
yond the .01 level. Assuming that children’s abilities differentiate
with increasing CA and assuming that scatter represents differing abili
ties, the magnitude of the above r would not be unusual. Following
this logic and assuming the difference in Binet and Goodenough MA scores
represents differing abilities,, the obtained r of *35 between the
difference in individual S-B and DAM MA scores and CA would also not
be unusual. Scatter and the difference were correlated and yielded an
r of ,34, Both the .35 and .34 correlations were significant at the ,01
level. Part of the latter correlation could undoubtedly be attributed
to CA, Partialling out CA gave an r between scatter and the difference
in Binet and Goodenough MA scores of .23, While the r is low, it is
significant beyond the . 0 1 level.
The practical value of an r of ,23 even when statistically sig
nificant is almost nil. however, from a theoretical point of view, the
correlation has established beyond a reasonable doubt, the existence of
a relationship between scatter and the difference in MA scores, Fran
this relationship, we may speculate that Binet scatter is in part due
to differences in verbal and performance abilities or more generally to
unevenness of abilities.
Mean Binet IQ Differences. The means of the Binet IQ’s for the 8
age groups were examined for significant differences. The results of
the ANOV are presented in Table X. The F ratio of 2,95 compared with
the critical value of F.9S<7 .3»7) 2- 0 1 suggests significant differences,

Newaan-Keuls Test for Differences
Between
All Ordered
Pairs
of Means
(Blast
IQs)
to CO o to42 <~4 CM 43«* o 1M.o CO to to• • « •’'t © M3 toso
■43 o <“4 43cn to too L0 ■CO tO00 cO i-i* * • *
CM 00' to CM00
o «5f to oo to to ©o to CM oto h* o GO• * • •
»-* 42 MP00
CM ■43 r-* CMto 00 00 to
CM MT cn 43 «3>*H| CM Mr to• • • •«*t ■43 COSO
to O to("t >43 J". r~»im>4 to CO to toJPNi t«4 to43 <sr• • • •
r-» 500©
o to© to too to CM00 t-* 03 CM* • *o lO toco
to C30Qirst-*0 Mr r*%
• *CM
r~~
43«sftrr** fs.•’Cff"*
to M3 to ou *5f mt ©cs **? r» o©2£ • * •r-> o
m r* r- 00•MCto88ftI-
to to znCO 43 42 O "sf GO
H \0**m to VO to
to CO CO 42 42 eft
to CM O 43 tO tO O 02 42 K) V O ifl H N rt 00 O• * • • •<t rt H N
30 00 00 CO CO
N O SO H N to O Cl
cn * o *r**4
toCM
00
43
h-
o H N i f t O C i
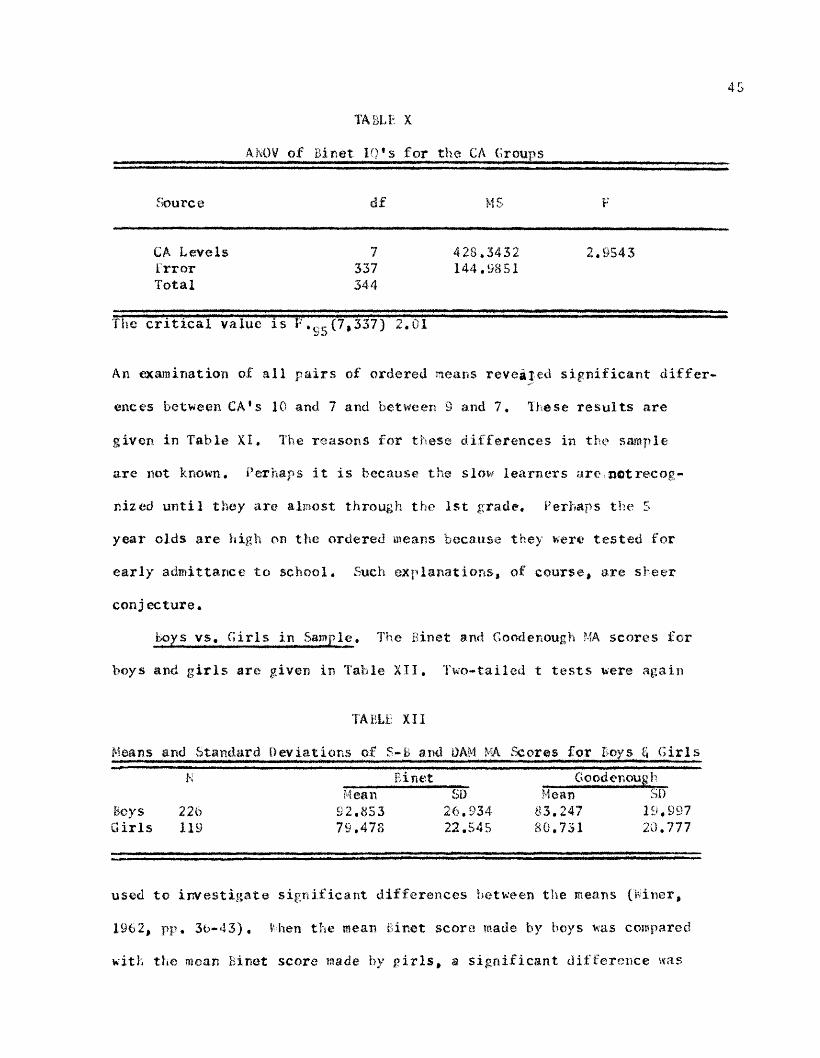
4STABLE X
ANOV of Binet IQ*s for the CA Groups ______________
Source df MS F
CA Levels 7 428.3432 2.9543Irror 337 144.9851Total 344
The critical value is E .cr (7*337) 2.01
An examination of all pairs of ordered means revealed significant differ
ences between CA*s 10 and 7 and between 9 and 7. These results are
given in Table XI. The reasons for these differences in the sample
are not known. Perhaps it is because the slow learners are net recog
nized until they are almost through the 1st grade. Perhaps the 5
year olds are high on the ordered means because they were tested for
early admittance to school. Such explanations, of course, are sheer
conjecture.
boys vs. Girls in Sample. The Binet and Goodenough MA scores for
boys and girls are given in Table XII. Two-tailed t tests were again
TABLE XII
Means and Standard Deviations of S-B and QAM MA Scores for Beys h GirlsN Binet Goodenough
Mean Si) Mean Si)Boys 226 S2.853 26.934 83.247 19.997Girls 119 79.478 22.545 80.731 20.777
used to investigate significant differences between the means ('finer,
1962, pp. 36-43), bhen the mean Binet score made by hoys was compared
with the mean Binet score made by girls, a significant difference was

found, of 4.889 and a critical value of t(279)*1,97, Making
the same comparison with the Goodenough test, no significant difference
between the boys and girls was found, t ^ of 1,083 and (225)-1.97.
A tobg of 8,386 and a critical value of t (225)-1.97 was found when
the me&n scores made by the boys on the Binet and Goodenough were com
pared, This of course, indicated a significant difference. However,
the means made by the girls on both tests did not show a significant
difference, of .793 and t (118)^1.98.
It has been pointed out that Binet and Goodenough MA means were
equal at age 5, 7, and 8, i.e., at the lower* age levels, khether girls
(they were younger than the boys) caused the equal means at the lower
ages or whether the lower ages produced equal means in girls is debatable.
Further research with this problem could lead to some interesting and
worthwhile results.

CHAPTER V
SUMMARY AND CONCLUSIONS
The primary purpose of the study was to investigate the relation
ship between the Goodenough Intelligence Test and the I960 Stanford-
Binet with mentally subaverage children. A secondary problem was to
examine the relationship between the Binet vocabulary subtest and the
total Binet and Goodenough tests. Further, the difference between
individual Binet and Goodenough MA scores and scatter on the Binet was
studied. The subjects were 345 mentally subaverage (!Q*s of below 85
on either the Binet or Goodenough) children years 5 through 12 tested
at the University of Omaha Child Study Service.
Previous research with the Stanford-Binet and Goodenough was
mainly in the form of obtaining an overall correlation between the
two tests. The reported correlations were generally of moderate size,
between .40 and .70 with a few in the .80s, However, in the sole study
(Rohrs 4 Haworth, 1962) using the 1960 Binet the r was low and non
significant •
Only 2 investigations reported tests of mean differences. Birch
(1949) found a difference, significant at the .05 level, between the
Binet and Goodenough MA means. An apparent contradictory finding was
mad© by Rohrs § Haworth (1962) who reported no significant difference
between the Binet and Goodenough IQ means.
In the present investigation, Analysis of Variance, Analysis of
Covariance, t tests, partial correlations and correlations were the
major statistical techniques used, Derived from the Analysis of
Covariance was pooled within-class r of .140 between the Binet and

Goodenough MAs. Although extremely low, the r was significant at the .01
level with a sample size of 345* It was quite evident the size of this
correlation was not in line with prior research. However, the correlation
is not unlike the r yielded in the i960 Binet study by Rohrs and Haworth
(1962), They suggested the omitting of many performance items found
in the 1937 revision and not in the 1960 revision might account for the
low correlation, There are other possible explanations to reconcile
this study’s correlation with past research, Already mentioned is the
danger of obtaining a spuriously high overall correlation due to the
correlation of means. Many of the studies reported in the review of the
literature used multiple age groups and reported only an overall cor
relation. Perhaps the correlations were spuriously high duo to the
between mean r. Another feasible explanation lay in changes in drawings
made by children in 1926 as compared with the present. In the 37 years
which have elapsed since Goodenough standardized and published her test,,
the authors of the Stanford-Binet have felt it necessary to revise the
S-B test twice. Perhaps if the Goodenough scoring criteria were re-
standardized, the correlations between it and the Birset would be higher.
The fact remained, the r obtained in this study with this sample is
almost negligible. Interpreting r as either ’’the rate at which one
variable changes with another” or ’’how accurately we can predict by a
regression equation” (Mcbemar, 1962, p, 134) led to the conclusion
that changes in the Binet were not reflected by similiar changes in the
Goodenough and that prediction was unpractical and unwarranted, As
suming the Binet could be considered a criterion of intelligence, the
fact that it couldn’t be predicted places the Drawing test in an awk
ward position.

49An F test frrn the A NOV determined the existence of an overall
significant difference between the Binet and Goodenough MAs. A
significant interaction F led to the conclusion that the differences
did not exist throughout the entire age range* The individual age
groups were checked and significant differences were found at chrono
logical ages 6, 9* 10# 11, and 12 while no differences were observed at
ages 5, 7, and 8.
Attempts to account for these results on the basis of previous
research is complicated by many earlier researchers not having made
tests of mean differences. Johnson et al., (1950) typified the
character of the research when, in referring to the Binet and
Goodenough IQ means, he stated they "were numerically close to each
other." In her original publication, Goodenough (1926) made the means
of the Binet and Goodenough conspicuous by their absence, which, ipso
facto, implied they may not have been equal. The results of 2 studies
(Birch, 1949: Rohrs I* Haworth, 1962) made tests of mean differences
apparently contradict each other. Had they tested for interaction,
they may have obtained results similar to this study.
If the Binet is an adequate criterion of intelligence for children,
then the low correlations and significant differences between it and the
Goodenough would place the latter in a seemingly untenable position as a
children’s intelligence test. Unfortunately the matter is not that
simple. Intelligence is a complex concept and it would be flagrantly
presumptuous to assume the Stanford-Binet has embodied all its many
facets and ramifications. Yet, the Binet has demonstrated a remarkable

ability to sample many of the important aspects of what is generally
considered intelligence. With this in mind, it was concluded that the
Goodenough Drawing Test could, in no way be considered adequate as an
individual test of intelligence. Further, the advisability of using
the Goodenough as a group intelligence test is questionable and for
children beyond age 8 years it is not recommended. The questionable
use of the DAM as a group test is based on MA and not IQ, How well the
DAM compares with other group tests was not considered in this investiga
tion, These conclusions are, of course, limited to children similiar
in characteristics to those found in this sample.
Previous research with the Binet vocabulary and the total Binet
MA indicated a high degree of relationship. The vast majority of
product moment correlation coefficients fell in the ,60 to .90 range.
The coefficients yielded in this investigation ranged from ,62 to ,86
with a median r of .74 for the 8 age groups. These correlations are
quite in accord with previous findings and suggest that the vocabulary
subtest would make a satisfactory estimate of the kind of intelligence
measured by the 1960 Binet. All the correlation coefficients cited,
however, were probably somewhat inflated since the vocabulary subtest
contributes to the total Binet score and no correction was applied.
No studies were found which attempted to correlate the Binet
vocabulary with Goodenough mental age. The results of the attempt
made here showed none of the correlations attained significance at the
,01 level. Further discussion is therefore not offered.
Nothing in the literature was found regarding the relationship of
Binet scatter to the difference in Binet and Goodenough MA scores.
Endeavors to attach diagnostic significance to scatter were inconclusive.
Terroan postulated that scatter was a function of uneven manifestations
of intelligence in individuals. Perhaps the difference in Binet and
Goodenough HA scores was also a function of uneven Manifestations of
abilities (primarily verbal and performance) in individuals. If so,
scatter and the difference would show some degree of relationship or
association. To test this, the 2 variables were correlated* After
partial ling the effect of chronological age, an r of .23 m s obtained.
The correlation was significant beyond the .01 level. Although low,
the r did give evidence of a definite relationship between scatter and
differences in Binet and Goodenough MA scores* Indirectly this may seem
as lending support to Teraan’s belief that scatter is due to differing
patterns of ability.
BIBLIOGRAPHY
Anastasi, A* Psychological testing. New Yorks Macmillan, 1954.
Anastasi, A. Psychological testing. (2nd Ed.) New Yorks Macmillan, 1961.
Ansbacher, H* L. The Goodenough Draw-A-Man Test and primary mental abilities. J . consult. Psychol., 1952, 16, 176-180.
Binet, A., 6 Simon, T. The intelligence .of the,feebleminded. (Trans, by E. S, Kite) BaltimoreT'MlITams ancl i f "IsM.
Birch, J.W. The Goodenough Drawing Test and older mentally retarded children, Amer, J , a ant.* Pef ie,, 1949, 54, 218-224.
Boring, E. G, A history of experimental psychology. (2nd Ed.) New Yorks Appleton-£ent«i^ lS&'oY "'T'T1'1
Cronbach, L. J. Essentials of psychological testing. (2nd Ed.) New Yorks Harper, I960........... " ..
Cureton, E. E. Mental age equivalents for the revised Stanford*Binet vocabulary test. J. consult. Psychol., 1954, 18, 381*383.
Earl, C. J. G. The human figure drawings of adult defectives. J, ment. Sci., 1933, 79, 305-328. “
Elwood, M. J. A preliminary not© on the vocabulary test in the revised Stanford*Binet Scale, Form L, J, ©due. Psychol., 1939, 30, 632*634,
Freeman, F. S. Theory and practice of psychological, testing. (3rd Ed.) New York: Holt, kinehart' aiwi Iffiastoni TSoSV
Goodenough, F, I. Measurement of intelligence by drawing. Yonkers:World Book Co., IO T .---------------------------- *
Guilford. J, P. Fundamental statistics in psychology and education.(3rd Ed.) New Y o r l o ^ i r a S r S w ^ l l T r r i ^ ^ '
Farris, A, J,, 6 Shakow, D, The clinical significance of maaerical measures of scatter on the Stanford-Binet, Psychol. Bull*, 1937, 34,134-150.
Harris, A. J., 6 Shakow, D. Scatter on the Stanford-Binet in schizophrenics, normals, and delinquent adults. J. abnom, soc. Psychol.,1938, 33, 100-111.
Havighurst, R. J., Gunther, N« K,, 6 Pratt, I.E. Environment and the Draw-A-Man Test: The performance of Indian children. J. abnorm, soc. Psychol., 1946, 41, 50-63.

Heber, R. F. A manual on terminology and classification in mental retardation. Aster. J. went, Defic, Monoge. Suppl, 1959, 64, No, 2.
Hunt, J. McV,, 6 Cofer, C. N. Psychological deficit. In J, McV, Hunt (Ed.), Personality and the behavior disorders. Vol. XI, New Yorks Ronald h-ess', l$447"87I-#§" '
Johnson, A, P., Ellerd, A, A,, 8 Lahey, T. H. The Goodenough Test as an aid to interpretation of children’s school behavior. Araer. J, merit, gefic., 1950, 54, 516*520.
Johnson, G. 0, Education for the slow,learners. Englewood) Prentice*Hall, 1963. r.— ..,.
Levinson, B, M. Reevalu&tion of the revised Stanford*Binet Scale,Form L vocabulary as a test of intelligence for the kindergarten and primary school child, J, genet.. Psychol., 1958, 93, 237*248.
Lewinski, R, Vocabulary and mental measurement: a quantitative investigation and review of research, J. genet. Psychol,, 1948, 72, 247*281.
Mayman, M. Review of the literature on the tests.treated in this volume.In D. Rapaport, Diagnostic psychological testing. Vol. I. Chicago: Year Book Publishers, iWS7'r'' S-SsfcY"~ " ^.
McEiwee, E. W. The reliability of the Goodenough Intelligence Test used with subnormal children fourteen years of age, J, appl, Psychol., 1932, 16, 217-218.
McHugh, G. Changes in IQ at the public school kindergarten level, Psychol Monog, 1943, No. 250,
McHugh, G# Changes in Goodenough IQ at the public school kindergarten level. J, educ. Psychol., 1945, 36, 17-30 (a)
McHugh, G. Relationship between the Goodenough Drawing A Man Test and the 1937 Revision of the Stanford-Binet Test. J. educ, Psychol., 1945,36, 119-124. (b)
McNemar, Q. The revision of the Stanford-Binet Scale. Boston: Houghton Mifflin, 19427'" ‘ .. ’.........
McNemar, Q, Psychological statistics. (3rd Ed.) New York: John Wiley 6 Sons, 1962,
Peterson, J. Early concepts and tests of intelligence. Yonkers: World Book, 1925.
Pinneau, S. R. Changes in intelligence quotient infancy to maturity. Boston: Houghton SIf£ITn7 W£J7 ~lrr '' . 1ir ':r' 'rr “T~"r r
54Rohrs, F. W.f 4 Haworth, M.R. the 1960 Stanford*Binet, WISC and Good* enough Test with mentally retarded children* Araer. J. aent, Defic.,1962, 66, 853-859. ‘
Shakow, D., 6 Goldman, R, The effects of age on the Stanford*Binet vocabulary score of adults* J. Educ* Psychol* 1938, 19, 241*256.
Terraan, I*. M. The vocabulary test as a measure of intelligence* J * educ* Psychol., 1918, 9, 452*466. "rr~”
Tena&n, L • M,, 8 Merrill, M.A. Measuring intelligence. Bostons HoughtonMifflin, 1937. '
Terman, L. M., § Merrill, M*A. Stanford*Binet Intelligence Scale.Boston: Houghton Mifflin, I960.
Wechsler, D. hechsler Intelligence Scale for children, (manual) New York: P sycho logical".................... v' 'ril T",'J|i
Wechsler, D. The aieasuresient and appraisal of adult intelligence. (4th Ed.) Baltimore: hiliiais ' an " Wll¥ins,r YlfiS............ " “
West, J. II. Correlates of the Draw-A-Scene Test, J. clin* Psychol,,1960, 16, 44-45*
Williams, J, II, Validity and reliability of the Goodenough Intelligence Test. Sch. and Soc., 1935, 41, 653-656.
Winer, B. J. Statistical principles in experimental design* New York: McGraw-Hill, l$Ez»" ~.. ....... .- ........
Yepsen, L. M. The reliability of the Goodenough Drawing Test with feebleminded subjects, J. educ♦ Psyehol*, 1929, 20, 448-451.

Appendix
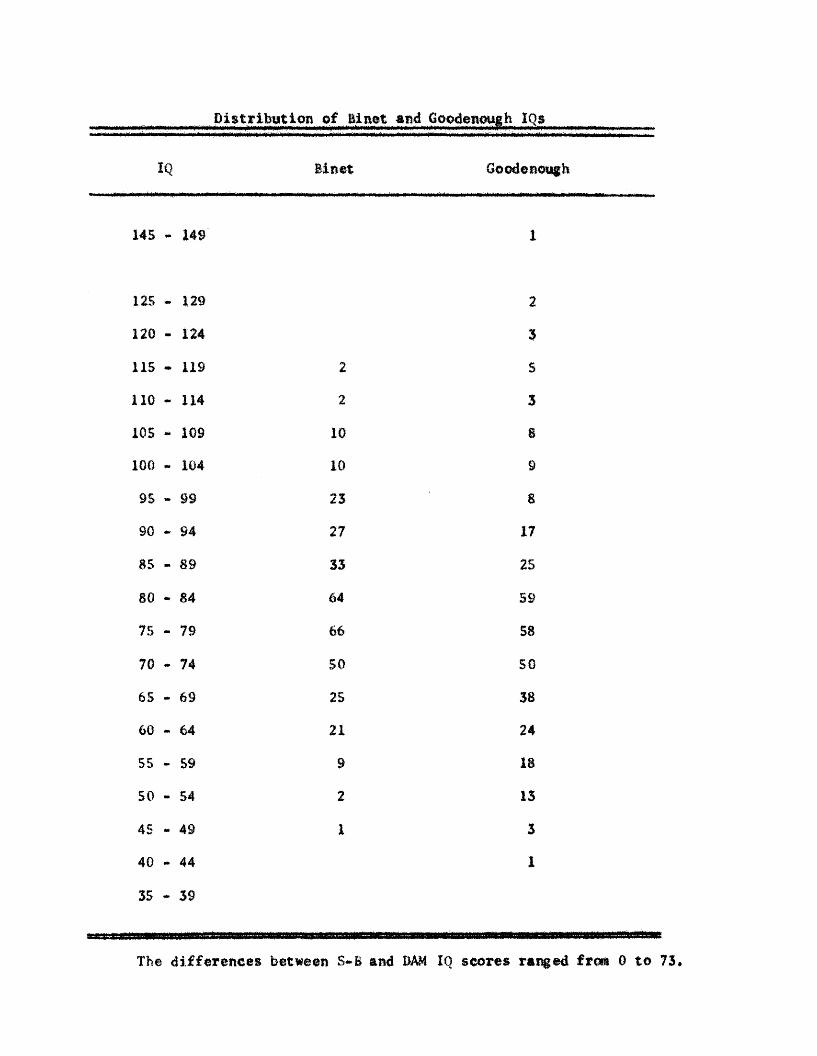
Distribution of Sinet and Goodenough IQs
IQ Binet Goodenough
145 - 149
125 - 129 2
120 - 124 3
115 - 119 2 5
110 - 114 2 3
105 * 109 10 S
100 - 104 10 9
95-99 23 8
90 - 94 27 17
85 - 89 33 25
80 - 84 64 59
75 - 79 66 58
70 - 74 50 50
6 5 -69 25 38
60-64 21 24
55 - 59 9 18
50-54 2 13
45 -49 1 3
40 - 44 1
35 - 39
The differences between S-B and DAM IQ scores ranged from 0 to 73.


![de la Real Academia de Ciencias Veterinarias1].pdf · 2014-03-13 · bajo del pedagogo Alfred Binet y su discípulo, ... tendieron el test Stanford-Binet o la escala de inteligencia](https://img.pdfslide.net/doc/110x75/5bb78f3909d3f2f7768dce69/de-la-real-academia-de-ciencias-1pdf-2014-03-13-bajo-del-pedagogo-alfred.jpg)