Embed Size (px)
Citation preview
União Europeia – Fundos Estruturais Governo da República Portuguesa 1
PROJECTOS DE INVESTIGAÇÃO CIENTÍFICA E DESENVOLVIMENTO TECNOLÓGICO
Ponto 8 RELATÓRIO FINAL
REFERÊNCIA DO PROJECTO Nº MIT-Pt/SES-GI/0008/2008
União Europeia – Fundos Estruturais Governo da República Portuguesa 2
Table of Contents
1 Introduction ........................................................................................................................ 5
2 Detailed Task description and achievements ..................................................................... 7
2.1 Task 1- Characterization of the electric power grid .................................................... 8
2.2 Task 2- Characterization of the existing light-duty fleet........................................... 14
2.3 Task 3-Life cycle energy consumption and CO2 emissions ..................................... 20
2.4 Task 4-Fleet model development .............................................................................. 29
2.5 Task 5- Electric power system model development .................................................. 31
2.6 Task 6-Impact on the electric power grid model development/Smart-grid .............. 32
2.7 Task 7-Cost benefit analysis ..................................................................................... 33
2.7.1 Cost-benefit from the users and society point of view ...................................... 33
2.7.2 Scenarios for fuel prices and alternative technologies for road vehicles in Portugal, between 2010-2050 ...................................................................................... 43
2.7.3 Economic, Energy and Environmental Impacts Simulator (EEEIS) ................. 54
2.8 Task 8- Final model development and application ................................................... 55
2.9 Task 9-Dissemination ................................................................................................ 56
3 Conclusions ...................................................................................................................... 63
4 References ........................................................................................................................ 65
5 Nomenclature ................................................................................................................... 69
FIGURES Figure 1 Medium voltage distribution network (15 kV). The numbers 1 to 5 identify the buses that are more prone to having voltage problems. The letters A to F identify the most congested branches. ......................................................................................... 9 Figure 2. Load profile during a typical summer day. .................................................... 9
Figure 3. Load profile during a typical winter day. ..................................................... 10
Figure 4. Flores island distribution network ................................................................ 11 Figure 5. Wind farm power output during the single disturbance simulation ............ 12
Figure 6. Wind farm power output during the continuous disturbances simulation ... 12
Figure 7. Demand and offer control across three areas, without EV participation (Left) and with EV participation (Wright). ............................................................................ 13 Figure 8. LisbonDt measured driving cycle. Speed (km/h) and road grade (%). ........ 16
Figure 9. CENEX official driving cycle. Speed (km/h), and 0% road grade............... 16
Figure 10 HEV (and PHEV) component selection method. ........................................ 19
Figure 11 Driving cycles requested kW/kg curve (dashed lines) and HEV available kW/kg (continuous line). Thin line regards 1 passenger (plus driver), and the thicker line the full vehicle occupancy. ................................................................................... 19 Figure 12. Drive cycle. Average speed 40 km/h, distance 33 km. .............................. 24
Figure 13. Full life cycle energy for selected vehicles (fuel cell hybrid plug-in, gasoline hybrid plug-in, pure electric, fuel cell hybrid, conventional diesel, gasoline full hybrid, B10 plug-in hybrid, conventional gasoline, conventional B100 and E85). ...................................................................................................................................... 24
União Europeia – Fundos Estruturais Governo da República Portuguesa 3
Figure 14: Scheme of the two possible bioH2 production pathways which were analyzed. PBR –photobioreactor; Pd/25 %Ag - Paladium with 25 % silver membrane. ...................................................................................................................................... 25
Figure 15. Scheme of the experimental stages of biomass production and the whole fermentation process: (A) Scenedesmus obliquus microalgae biomass production, (B) BM1 medium preparation, (C) Biomass hydrolysis and (D) Fermentation. ................ 26
Figure 16. Generalized unit process (Sullivan, 2012) .................................................. 26
Figure 17.Energy consumption and CO2 emissions of different hydrogen production (biological and industrial CSR, electrolysis) and other fuels, gasoline and diesel. ..... 27
Figure 18. Scheme of the PATTS model. .................................................................... 30 Figure 19 Discrete scenario evaluations. ..................................................................... 31 Figure 20 Combinatory analysis -Indicators ................................................................ 31 Figure 21. EV participation with DSO Smart Charging. ............................................. 32
Figure 22. EV participation in minimizing RES waste. Dumb vs Smart Charging. .... 33
Figure 23- Implementation of EVs and Public Charging Points (PCPs) in Portugal (MOBI.E, 2009) (APREN, 2010) ................................................................................ 39 Figure 24 - Total Cost of Emissions for LDV options for a regular user profile (2010 electric mix) ................................................................................................................. 42 Figure 25: Oil Barrel price Scenarios A - Low Price (blue); B - Medium Price (green); C - High Price (red). ..................................................................................................... 44 Figure 26: Scenario assumed for electricity price in Portugal. .................................... 44
Figure 27: Price evolution considered for Hydrogen as a road fuel in this study. ....... 45
Figure 28: Fleet mix for scenario 1 .............................................................................. 45 Figure 29: Fleet mix for scenario 2. ............................................................................. 46 Figure 30: Fleet mix for scenario 3. ............................................................................. 46 Figure 31: Retail sale price evolution obtained for scenario 1. ................................... 48
Figure 32: Retail sale price evolution obtained for scenario 2. ................................... 48
Figure 33: Retail sale price evolution for scenario 3. .................................................. 49
Figure 34: cost per kilometre driven (€/Km) for Scenario A1. .................................... 50
Figure 35: TOC (€) for scenario A1. ........................................................................... 50 Figure 36: Cost per kilometre driven (€/Km) for Scenario C2. ................................... 51
Figure 37: TOC (€) for scenario C2. ............................................................................ 51 Figure 38: Cost per Kilometre driven (€/Km) for Scenario C3. .................................. 52
Figure 39: TOC (€) for scenario C3. ............................................................................ 52 Figure 40: Average cost per kilometre for each alternative with maximum and minimum bars. ............................................................................................................. 53 Figure 41 Main inputs, intermediate data and outputs and simulation scheme ........... 55
TABLES Table 1 Predicted and accomplished physical research indicators ................................ 6
Table 2. LDV fleet characterization in terms of fuel distribution and engine displacement (year 2005). ............................................................................................ 14 Table 3. Annual TTW characterization for the Portuguese light-duty fleet in terms of energy consumption and emissions. ............................................................................ 14 Table 4 Taxi servicing: respective driving cycle, number of fleet vehicles, daily distance travelled, distance per service, and average occupancy rate. [25] Transport for London, http://www.tfl.gov.uk/accessed 2010-6-28; [26] IMTT - Instituto da Mobilidade e dos Transportes Terrestres, http://www.imtt.pt/sites/IMTT/English/accessed on 2011-07-05 ................................ 16
União Europeia – Fundos Estruturais Governo da República Portuguesa 4
Table 5 Driving cycle’s characteristics: duration time, distance, average speed, positive average acceleration, maximum VSP, positive average VSP, number of stops and idle time. [27] Diesel8et, http://www.dieselnet.com/ accessed on 2011-06-11 .... 17
Table 6 Conventional, reference, ICEV taxis. ............................................................. 17 Table 7. Fuel life cycle energy and CO2 WTT and TTW results for pure electric, fuel cell hybrid and hybrid plug-in, gasoline full hybrid, conventional and hybrids plug-in diesel and gasoline with biofuels blends. ..................................................................... 23 Table 8. Materials energy and CO2 cradle-to-grave for pure electric, fuel cell hybrid and hybrid plug-in, gasoline full hybrid, conventional diesel and gasoline, and hybrid plug-in diesel and gasoline vehicles. ........................................................................... 23 Table 9: Brief review of biological production of hydrogen studies. ......................... 24
Table 10 - Fuel Scenarios for Impact on Tax Revenues .............................................. 35
Table 11- Economical and Technological Assumptions for 2010 ............................... 35
Table 12 - Internal variables for electricity price and PHEV consumption for 2010 .. 36
Table 13 - Cost-per-km results for 2010 ...................................................................... 37 Table 14 - Technological Assumptions for 2020 ......................................................... 37
Table 15 – Cost-per-km results for 2020 ..................................................................... 37 Table 16 - New EV range due to increase of battery capacity up to break-even cost of ICEV (Diesel) per km .................................................................................................. 38 Table 17 - Impact on Tax Revenues for the 2010-2020 period ................................... 40
Table 18 - Fuel not imported (amount and cost) for the 2010-2020 period ................ 40
Table 19 - WTT energy values for EV - Portuguese electric mix 2009 ...................... 41
Table 20 - WTT emission values for Nissan Leaf (using the 2009 Portuguese electric mix) .............................................................................................................................. 41
Table 21 - Complete Lifecycle analysis for mobility options ...................................... 41
Table 22 - Driving mix %(Baptista et al, 2010); Externality Costs for PM2.5(European Commission,
2005) ............................................................................................................................... 41 Table 23 - Damage Costs for different types of pollutants(European Commission, 2005) ......... 41 Table 24: Technical characteristics for all vehicles assessed. ..................................... 43
Table 25: Kilometres driven in each year of useful life. (P.Baptista, 2009) ................ 47
União Europeia – Fundos Estruturais Governo da República Portuguesa 5
1 Introduction The project’s objective was to develop four main models/computational applications regarding:
1. A fleet model for road vehicles scoping the time period 2010-250 by characterizing scenarios for energy and emissions (HC, CO, NOx, PM, CO2) according to different choices of fleet turnover rates, technology penetration rate, biofuels rate of entering the market, population and mobility. Economic interaction between technology prices, energy prices, taxation policies and demand included;
2. A vehicle-grid interaction model to evaluate voltage control ability by electric
vehicles (both pure electric or plug-in hybrid technologies), including grid networks characterization, stochastic electric vehicles demand in fast, normal and home chargers, voltage congestion profiles, differences regarding dumb and smart-charging in terms of minimum waste of renewable sources;
3. A vehicle-grid interaction model to evaluate frequency control ability by
electric vehicles (both pure electric or plug-in hybrid technologies), including grid networks characterization, frequency control ability minimizing the differences between offer and demand at regional and inter-regional levels;
4. A economic model giving insight at electricity prices and user running costs
for different electric vehicles amount and electricity mixes with more or less renewable (mainly hydro power) incorporation.
And, finally, develop an integrated application of all models at island and mainland scales. These models have the potential to answer the following questions:
• What would be the impact on energy and emissions in the road transportation sector of introducing alternative powertrain technologies in Portugal, mainland and islands?
• What would be the impact of introducing vehicles requiring electricity on the electrical grid? What changes would be necessary to satisfy the demand?
• What would be the technology price evolution for Portugal, user point of view and society point of view?
Main innovative aspects of the project are:
• Life cycle integration for energy, CO2 emissions and local pollutants of different alternative vehicle technologies and energy sources pathways with forecast/backcast tool
• Scenario uncertainty, and estimation of maximum and minimum border lines for multi-scenario analysis of the road transportation sector in the time horizon 2010-2050
• Inclusion of trucks and buses • Cost and price analysis in the time horizon 2010-2050 for Portugal

União Europeia – Fundos Estruturais Governo da República Portuguesa 6
• Regarding power system analysis: o For steady state:
� Impact evaluation tool considering the stochastic behavior of EV
� Smart charging algorithm from different players’ perspectives o For dynamic:
� Scenarios with generation based only on renewable energy resources
� Droop control implementation on EV • Joint evaluation of LCA and power system analysis allowing a full extent
study from the transportation and electricity sectors.
The project physical research indicators were successfully accomplished and surpassed as can be seen in Table 1.
Table 1 Predicted and accomplished physical research indicators
Predicted Accomplished A - Publications 2 15 Books 0 5* International journals 2 10 National journals 0 0 B - Comunications 4 39
Internacional meetings 3 33
Nacional meetings 1 6
C - Reports 3 4 D – Organizations of events 0 0 E - Thesis 6 10
PhD 3 4
MSC 3 6
Other 0 0 F - Models 1 4 G – Computacional applications
1 4
H – Pilot instalacions 0 0 I – Laboratory prototypes 0 0 J - Patent 0 0 L- Other 0 0 *Book Chapters
Section 2 presents a detailed description of each task of the project and respective publications. Section 3 presents the main conclusions of the project.
União Europeia – Fundos Estruturais Governo da República Portuguesa 7
2 Detailed Task description and achievements The project was divided in 9 Tasks, respectively:
• Task1: Characterization of the electric power grid • Task 2: Characterization of the existing light-duty fleet • Task 3: Life cycle energy consumption and CO2 emissions • Task 4: Fleet model development • Task 5: Electric power systems model development • Task 6: Impact on the electric power grid model development/smart-grid • Task 7: Cost benefit analysis • Task 8:Final model development and application • Task 9: Dissemination
During the first year, special focus was given to Task1-4. Portugal mainland and Flores Island from the Archipelago of Azores were characterized in terms of generation system, distribution grids and energy demand. A detailed characterization of the existing Portuguese light-duty fleet was performed. The top sale light-duty vehicles (LDV) were identified having a typical power/weight ratio of 55W/kg. The fuel consumption and CO2 emissions of such vehicles and future powertrains of electric, hybrid and fuel cell vehicles were simulated and validated. A master thesis was developed regarding the study of driver behavior, charging frequency, road grade and cargo influence on vehicle/prototypes autonomy and electric and chemical fuel consumption. A complete life cycle analysis was assessed for the light-duty fleet representative actual and future technologies, regarding conventional diesel/gasoline fuel pathways, biofuels pathways for blending in diesel/gasoline fuels, electricity production (actual and future), hydrogen production via on-site electrolyses, centralized natural gas reforming, biomass fermentation. The Portuguese fleet model development, including light-duty and heavy duty vehicles, historic data on vehicle density per inhabitants, historic data of fleet turnover, historic data of sales, historic data on biofuels blending and historic data on fuels consumption was sketched and 7 scenarious were studies with inputs from GALP company: SCENARIO 1 - BASELINE TREND (8% of LDV fleet displaced); SCENARIO 2 – LIQUID FUELS BASED (70% of LDV fleet displaced); SCENARIO 3 – LIQUID FUELS BASED WITH LOWER DIESEL SHARE (70% of LDV fleet displaced); SCENARIO 4 – POLICY ORIENTED (44% of LDV fleet displaced); SCENARIO 5 – ELECTRICITY POWERED (90% of LDV fleet displaced); SCENARIO 6 – HYDROGEN POWERED (90% of LDV fleet displaced), for LDV; and SCENARIO 7 – HDV and BUSES (30% displacement in heavy duty vehciles) to add the contribution of HDV and buses to the total road transportation sector. A preliminary sensitive analysis of the developed model regarding electricity mix generation evolution effect on life cycle results was performed and also a preliminary application of the model to S. Miguel Island. Task 5-7 were initiated and was assessed a power electronic converter model capable of managing efficiently the energy flow between the Low Voltage grid and the EV battery and was assessed the Flores Island power system dynamic behaviour when different quantities of EV adhere to a smart charging scheme that provides an ancillary service, namely the participation in primary frequency control. , a preliminary energy systems modeling was applied to the Island
União Europeia – Fundos Estruturais Governo da República Portuguesa 8
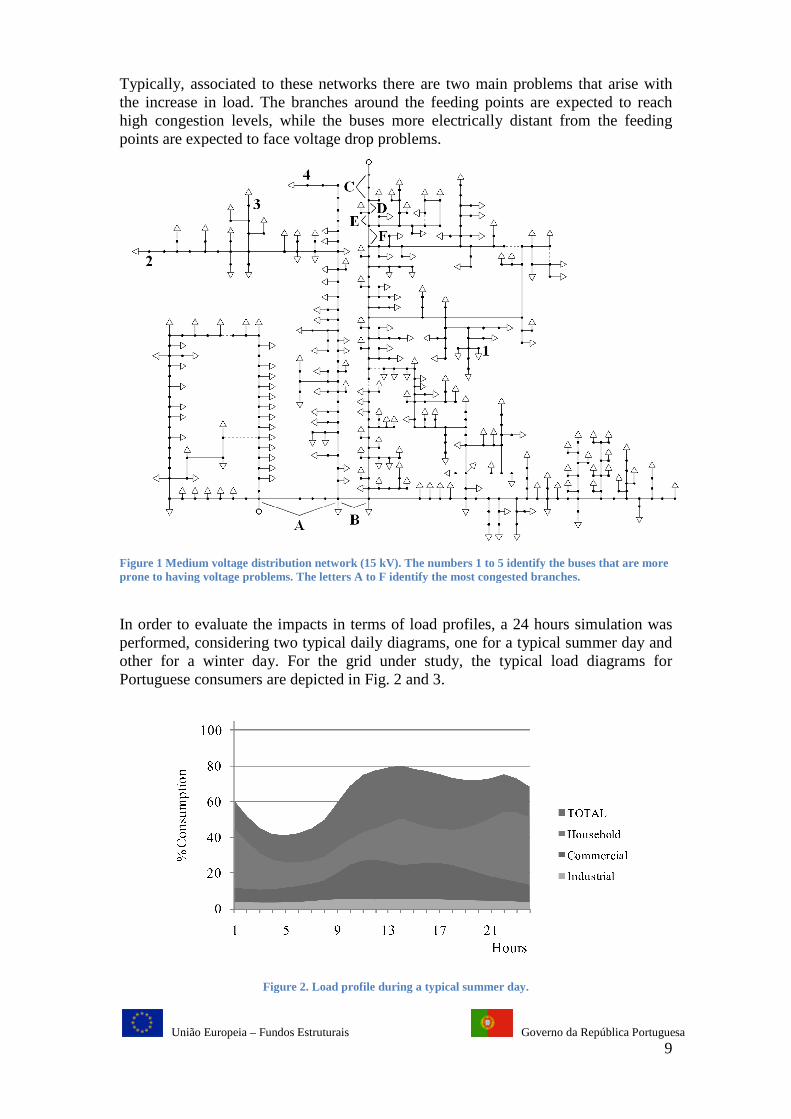
of São Miguel in Azores; was discussed the potential benefits of expanding responsive demand to help displace electric energy generated by fossil fuel power plants by adjusting the shape of the demand curve to increase use of electricity generated by renewable sources. Potential benefits of fast charging and strategic marketing plan for battery electric vehicles were analyzed. During the second year, special focus was given to Task 6-8. Preliminary Computer applications for vehicle-grid interactions were sketched. A grid steady state analysis model with a Monte Carlo approach for simulating the transitions of EV loads within a distribution network buses along a given period. Inputs: EV penetration, types of EV, mobility patterns (daily commute profiles), EV owner charging behaviour, conventional load diagram. Outputs: Load diagram (EV+conventional load), voltage profiles, branches congestion profiles, losses. Application: Flores island, S. Miguel island and typical networks from Portugal mainland. A grid dynamic simulation platform using a primary frequency control model for EV in isolated grids, based on a droop control implementation, using numerical integration method with a variable time step to perform the necessary simulations. Inputs: EV penetration, types of EV, mobility patterns (daily commute profiles), EV owner charging behaviour, conventional load diagram, generation units representations for dynamic studies, disturbances on the network or on resource availability. Outputs: voltage and frequency fluctuations, machines power and torque, EV and conventional load active and reactive power. Application: Flores and S. Miguel islands. Electricity price evolutions, cost-benefit analysis from the user and society points of view, management and business insights were further explored. Concerning Task 4 the PATTS was further developed and the biohydrogen energy vector was studied aiming it’s incorporation in this plattform. A first attempt of integration of the fleet model with vehicle-grid model in Flores Island was completed. During the third year, all models/computational applications regarding the fleet model (PATTS), the vehicle-grid interaction applications for voltage/frequency control analysis and the economic, energy and environmental impacts simulator (EEEIS), developed based on simulating the Iberian spot market using the hourly buying and selling bids available at the Iberian Electricity Market Operator, were finalized. 2.1 Task 1- Characterization of the electric power grid A typical electricity distribution network for a residential area in Portugal was used in order to assess the impact of integrating different levels of pure electric vehicles and plug-in hybrid vehicles in the grid. Fig. 1 describes the electricity distribution network used in this research, corresponding to a typical semi-urban, 15 kV, Medium Voltage (MV) grid. The clients of this type of grid are mainly residential consumers, providing a good platform for studying the impacts of EVs’ connection. It was assumed that each MV/LV (Low Voltage) transformer, represented by a triangular shape in the figure, plus the downstream LV grid, have the capability to accommodate all the EVs considered in each scenario without suffering any significant impacts. This assumption allows focusing the study in the MV grid, as it is intended with this work. This grid despite being meshed is explored using a radial configuration. There are two feeders energizing two separate areas, represented by the round shapes in the figure, whose specified voltage is 1.05 p.u..
União Europeia – Fundos Estruturais
Typically, associated to these networks there are two main problems that arise with the increase in load. The branches around the feeding points are expected to reach high congestion levels, while the buses more electrically distant from the feeding points are expected to face voltage drop problems.
Figure 1 Medium voltage distribution network (15 kV). The numbers 1 to 5 identify the buses that are more prone to having voltage problems. The letters A to F identify the most con
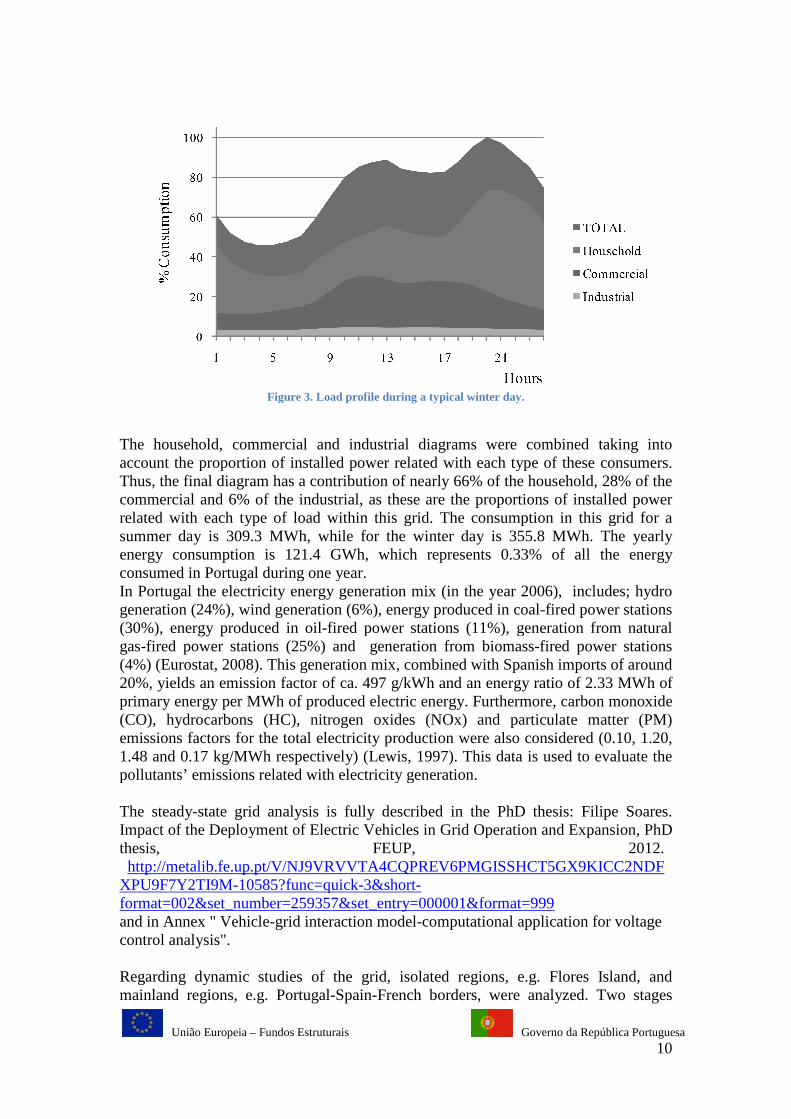
In order to evaluate the impacts in terms of load profiles, a 24 hours simulation was performed, considering two typical daily diagrams, one for a typical summer day and other for a winter day. For the grid under study, the typical load dPortuguese consumers are depicted in Fig. 2 and 3.
Figure
Fundos Estruturais Governo da República Portuguesa
Typically, associated to these networks there are two main problems that arise with the increase in load. The branches around the feeding points are expected to reach high congestion levels, while the buses more electrically distant from the feeding
ints are expected to face voltage drop problems.
Medium voltage distribution network (15 kV). The numbers 1 to 5 identify the buses that are more prone to having voltage problems. The letters A to F identify the most congested branches.
In order to evaluate the impacts in terms of load profiles, a 24 hours simulation was performed, considering two typical daily diagrams, one for a typical summer day and other for a winter day. For the grid under study, the typical load dPortuguese consumers are depicted in Fig. 2 and 3.
Figure 2. Load profile during a typical summer day.
Governo da República Portuguesa 9
Typically, associated to these networks there are two main problems that arise with the increase in load. The branches around the feeding points are expected to reach high congestion levels, while the buses more electrically distant from the feeding
Medium voltage distribution network (15 kV). The numbers 1 to 5 identify the buses that are more
gested branches.
In order to evaluate the impacts in terms of load profiles, a 24 hours simulation was performed, considering two typical daily diagrams, one for a typical summer day and other for a winter day. For the grid under study, the typical load diagrams for
União Europeia – Fundos Estruturais
Figure
The household, commercial andaccount the proportion of installed powerThus, the final diagram has a contribution of nearly 66% of the household, 28% of the commercial and 6% of the industrial, arelated with each type of load within this grid.summer day is 309.3 MWh, while for the winter day is 355.8 MWh. The yearly energy consumption is 121.4 GWh, which represents consumed in Portugal during one year.In Portugal the electricity energy generation mix (in the year 2006), includes; hydro generation (24%), wind generation (6%), energy produced in coal(30%), energy produced in oilgas-fired power stations (25%) and generation from biomass(4%) (Eurostat, 2008). This generation mix, combined with Spanish imports of around 20%, yields an emission factorprimary energy per MWh of produced electric energy. Furthermore, carbon monoxide (CO), hydrocarbons (HC), nitrogen oxides (NOx) and particulate matter (PM) emissions factors for the total electricity pro1.48 and 0.17 kg/MWh respectively) pollutants’ emissions related with electricity generation. The steady-state grid analysis is fully described in the PhD thesis: Impact of the Deployment of Electric Vehicles in Grid Operation and Expansion, PhD thesis, FEUP, 2012. http://metalib.fe.up.pt/V/NJ9VRVVTA4CQPREV6PMGISSHCT5GX9KICC2NDFXPU9F7Y2TI9M-10585?func=quickformat=002&set_number=259357&set_entry=000001&format=999and in Annex " Vehicle-grid interaction modelcontrol analysis". Regarding dynamic studies of the grid, isolated mainland regions, e.g. Portugal
Fundos Estruturais Governo da República Portuguesa
Figure 3. Load profile during a typical winter day.
The household, commercial and industrial diagrams were combined taking into account the proportion of installed power related with each type of these consumers. Thus, the final diagram has a contribution of nearly 66% of the household, 28% of the commercial and 6% of the industrial, as these are the proportions of installed power related with each type of load within this grid. The consumption in this grid for a summer day is 309.3 MWh, while for the winter day is 355.8 MWh. The yearly energy consumption is 121.4 GWh, which represents 0.33% of all the energy consumed in Portugal during one year. In Portugal the electricity energy generation mix (in the year 2006), includes; hydro generation (24%), wind generation (6%), energy produced in coal-fired power stations
d in oil-fired power stations (11%), generation from natural fired power stations (25%) and generation from biomass-fired power stations
This generation mix, combined with Spanish imports of around 20%, yields an emission factor of ca. 497 g/kWh and an energy ratio of 2.33 MWh of primary energy per MWh of produced electric energy. Furthermore, carbon monoxide (CO), hydrocarbons (HC), nitrogen oxides (NOx) and particulate matter (PM) emissions factors for the total electricity production were also considered (0.10, 1.20, 1.48 and 0.17 kg/MWh respectively) (Lewis, 1997). This data is used to evaluate the pollutants’ emissions related with electricity generation.
state grid analysis is fully described in the PhD thesis: Impact of the Deployment of Electric Vehicles in Grid Operation and Expansion, PhD thesis, FEUP, 2012.http://metalib.fe.up.pt/V/NJ9VRVVTA4CQPREV6PMGISSHCT5GX9KICC2NDF
10585?func=quick-3&short-format=002&set_number=259357&set_entry=000001&format=999
grid interaction model-computational application for voltage
Regarding dynamic studies of the grid, isolated regions, e.g. Flores Islande.g. Portugal-Spain-French borders, were analyzed.
Governo da República Portuguesa 10
industrial diagrams were combined taking into related with each type of these consumers.
Thus, the final diagram has a contribution of nearly 66% of the household, 28% of the s these are the proportions of installed power
The consumption in this grid for a summer day is 309.3 MWh, while for the winter day is 355.8 MWh. The yearly
0.33% of all the energy
In Portugal the electricity energy generation mix (in the year 2006), includes; hydro fired power stations
fired power stations (11%), generation from natural fired power stations
This generation mix, combined with Spanish imports of around of ca. 497 g/kWh and an energy ratio of 2.33 MWh of
primary energy per MWh of produced electric energy. Furthermore, carbon monoxide (CO), hydrocarbons (HC), nitrogen oxides (NOx) and particulate matter (PM)
duction were also considered (0.10, 1.20, This data is used to evaluate the
state grid analysis is fully described in the PhD thesis: Filipe Soares. Impact of the Deployment of Electric Vehicles in Grid Operation and Expansion, PhD thesis, FEUP, 2012. http://metalib.fe.up.pt/V/NJ9VRVVTA4CQPREV6PMGISSHCT5GX9KICC2NDF
application for voltage
e.g. Flores Island, and were analyzed. Two stages
União Europeia – Fundos Estruturais Governo da República Portuguesa 11
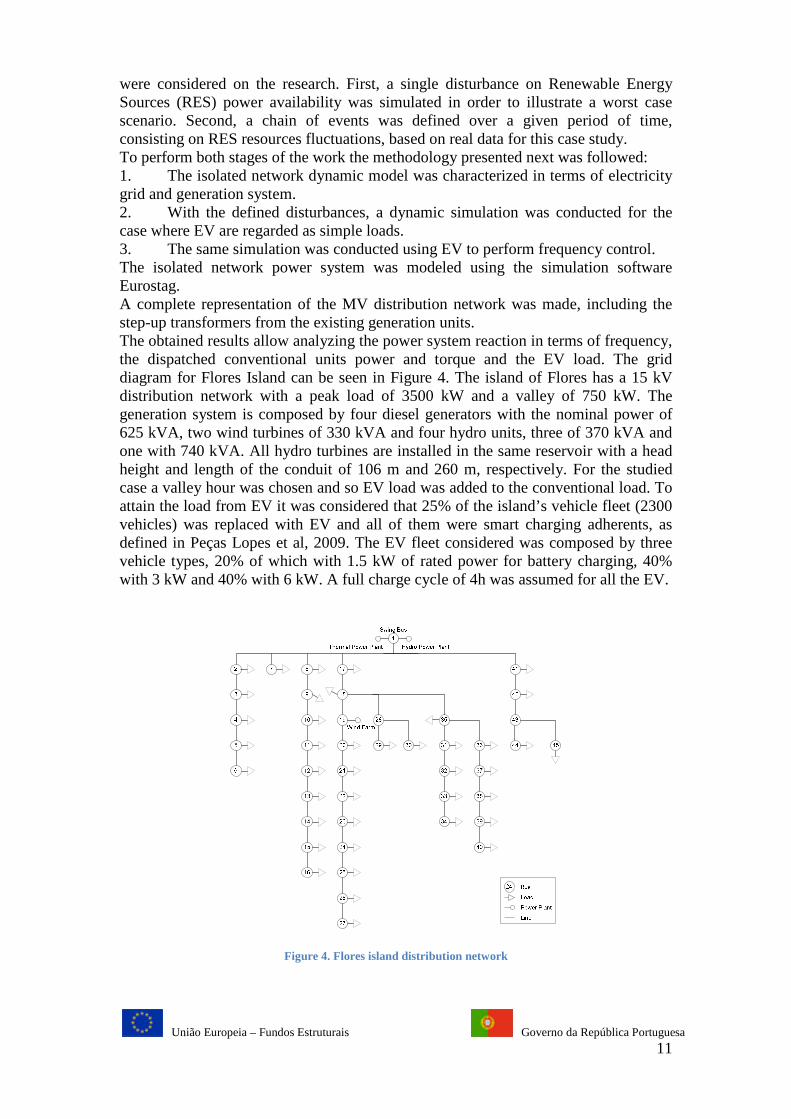
were considered on the research. First, a single disturbance on Renewable Energy Sources (RES) power availability was simulated in order to illustrate a worst case scenario. Second, a chain of events was defined over a given period of time, consisting on RES resources fluctuations, based on real data for this case study. To perform both stages of the work the methodology presented next was followed: 1. The isolated network dynamic model was characterized in terms of electricity grid and generation system. 2. With the defined disturbances, a dynamic simulation was conducted for the case where EV are regarded as simple loads. 3. The same simulation was conducted using EV to perform frequency control. The isolated network power system was modeled using the simulation software Eurostag. A complete representation of the MV distribution network was made, including the step-up transformers from the existing generation units. The obtained results allow analyzing the power system reaction in terms of frequency, the dispatched conventional units power and torque and the EV load. The grid diagram for Flores Island can be seen in Figure 4. The island of Flores has a 15 kV distribution network with a peak load of 3500 kW and a valley of 750 kW. The generation system is composed by four diesel generators with the nominal power of 625 kVA, two wind turbines of 330 kVA and four hydro units, three of 370 kVA and one with 740 kVA. All hydro turbines are installed in the same reservoir with a head height and length of the conduit of 106 m and 260 m, respectively. For the studied case a valley hour was chosen and so EV load was added to the conventional load. To attain the load from EV it was considered that 25% of the island’s vehicle fleet (2300 vehicles) was replaced with EV and all of them were smart charging adherents, as defined in Peças Lopes et al, 2009. The EV fleet considered was composed by three vehicle types, 20% of which with 1.5 kW of rated power for battery charging, 40% with 3 kW and 40% with 6 kW. A full charge cycle of 4h was assumed for all the EV.
Figure 4. Flores island distribution network
União Europeia – Fundos Estruturais Governo da República Portuguesa 12
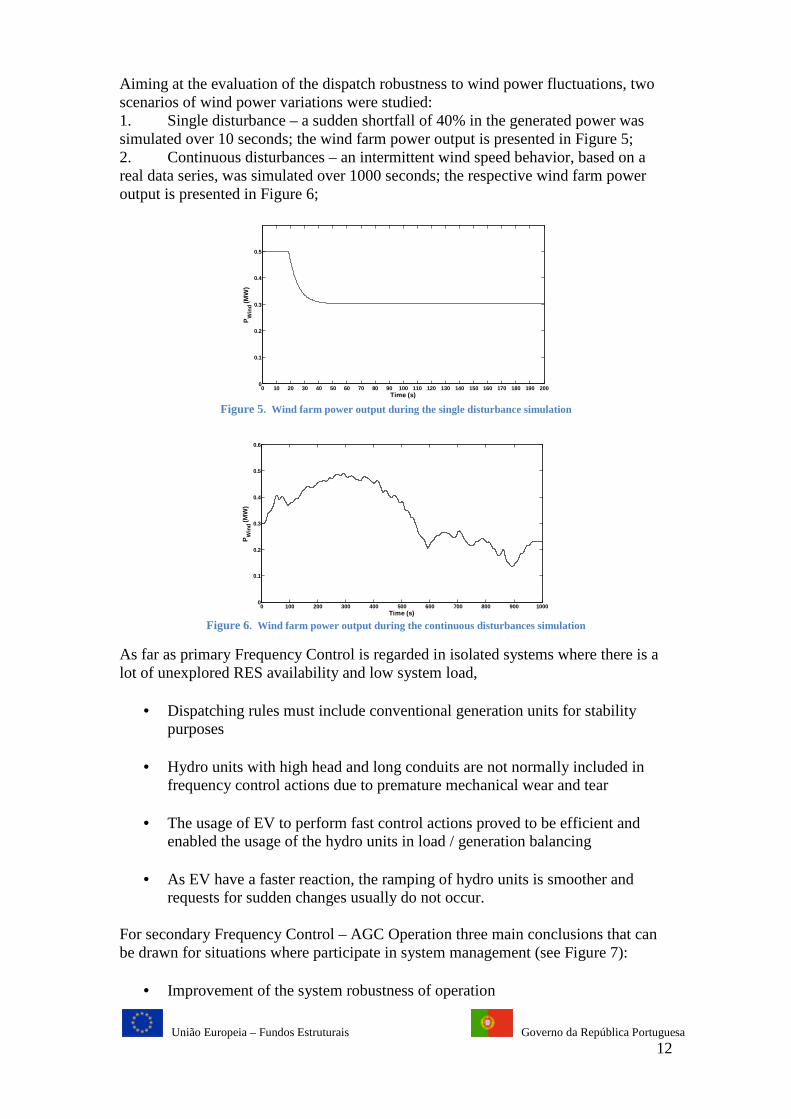
Aiming at the evaluation of the dispatch robustness to wind power fluctuations, two scenarios of wind power variations were studied: 1. Single disturbance – a sudden shortfall of 40% in the generated power was simulated over 10 seconds; the wind farm power output is presented in Figure 5; 2. Continuous disturbances – an intermittent wind speed behavior, based on a real data series, was simulated over 1000 seconds; the respective wind farm power output is presented in Figure 6;
Figure 5. Wind farm power output during the single disturbance simulation
Figure 6. Wind farm power output during the continuous disturbances simulation
As far as primary Frequency Control is regarded in isolated systems where there is a lot of unexplored RES availability and low system load,
• Dispatching rules must include conventional generation units for stability purposes
• Hydro units with high head and long conduits are not normally included in
frequency control actions due to premature mechanical wear and tear
• The usage of EV to perform fast control actions proved to be efficient and enabled the usage of the hydro units in load / generation balancing
• As EV have a faster reaction, the ramping of hydro units is smoother and
requests for sudden changes usually do not occur. For secondary Frequency Control – AGC Operation three main conclusions that can be drawn for situations where participate in system management (see Figure 7):
• Improvement of the system robustness of operation
0 10 20 30 40 50 60 70 80 90 100 110 120 130 140 150 160 170 180 190 2000
0.1
0.2
0.3
0.4
0.5
Time (s)
PW
ind (
MW
)
0 100 200 300 400 500 600 700 800 900 10000
0.1
0.2
0.3
0.4
0.5
0.6
Time (s)
PW
ind (
MW
)
União Europeia – Fundos Estruturais Governo da República Portuguesa 13
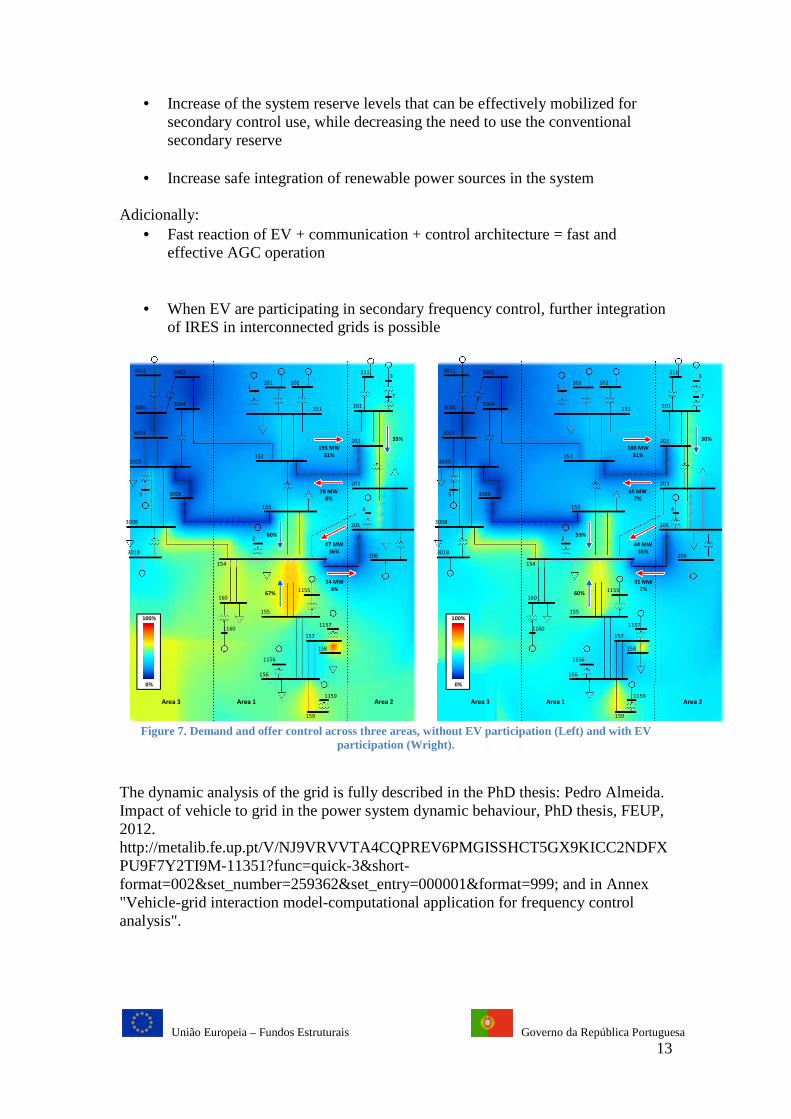
• Increase of the system reserve levels that can be effectively mobilized for
secondary control use, while decreasing the need to use the conventional secondary reserve
• Increase safe integration of renewable power sources in the system
Adicionally:
• Fast reaction of EV + communication + control architecture = fast and effective AGC operation
• When EV are participating in secondary frequency control, further integration of IRES in interconnected grids is possible
Figure 7. Demand and offer control across three areas, without EV participation (Left) and with EV
participation (Wright).
The dynamic analysis of the grid is fully described in the PhD thesis: Pedro Almeida. Impact of vehicle to grid in the power system dynamic behaviour, PhD thesis, FEUP, 2012. http://metalib.fe.up.pt/V/NJ9VRVVTA4CQPREV6PMGISSHCT5GX9KICC2NDFXPU9F7Y2TI9M-11351?func=quick-3&short-format=002&set_number=259362&set_entry=000001&format=999; and in Annex "Vehicle-grid interaction model-computational application for frequency control analysis".
1021011
151
211
201
202
203
205
206
152
153
154
160
1160
1155
1157
1159
1156
155
157
158
156
3018
3008
3006
3005
3004
3003
3002
3001
3011
Area 1 Area 2
159
3
7
4
5
2
Area 3
100%
0%
193 MW
31%
78 MW
8%
47 MW
36%
34 MW
8%
35%
60%
67%
1021011
151
211
201
202
203
205
206
152
153
154
160
1160
1155
1157
1159
1156
155
157
158
156
3018
3008
3006
3005
3004
3003
3002
3001
3011
Area 1 Area 2
159
3
7
4
5
2
Area 3
100%
0%
180 MW
31%
65 MW
7%
44 MW
35%
31 MW
7%
30%
59%
60%
União Europeia – Fundos Estruturais Governo da República Portuguesa 14
2.2 Task 2- Characterization of the existing light-duty fleet
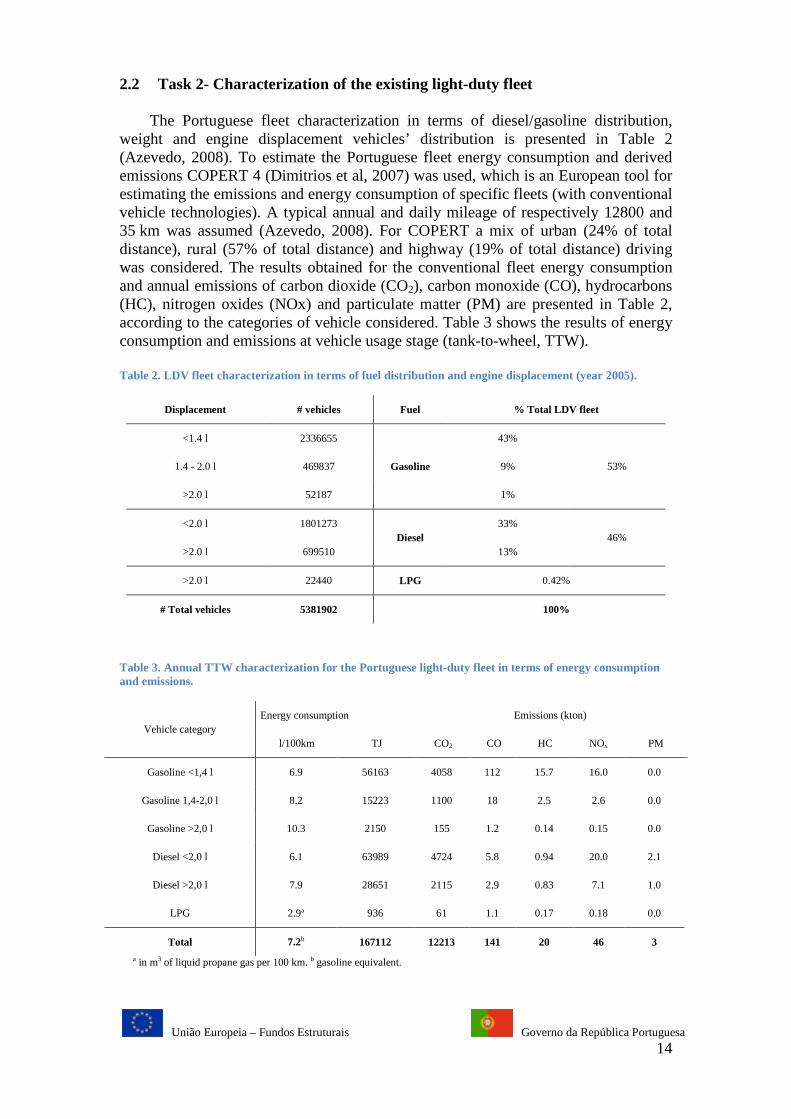
The Portuguese fleet characterization in terms of diesel/gasoline distribution, weight and engine displacement vehicles’ distribution is presented in Table 2 (Azevedo, 2008). To estimate the Portuguese fleet energy consumption and derived emissions COPERT 4 (Dimitrios et al, 2007) was used, which is an European tool for estimating the emissions and energy consumption of specific fleets (with conventional vehicle technologies). A typical annual and daily mileage of respectively 12800 and 35 km was assumed (Azevedo, 2008). For COPERT a mix of urban (24% of total distance), rural (57% of total distance) and highway (19% of total distance) driving was considered. The results obtained for the conventional fleet energy consumption and annual emissions of carbon dioxide (CO2), carbon monoxide (CO), hydrocarbons (HC), nitrogen oxides (NOx) and particulate matter (PM) are presented in Table 2, according to the categories of vehicle considered. Table 3 shows the results of energy consumption and emissions at vehicle usage stage (tank-to-wheel, TTW).
Table 2. LDV fleet characterization in terms of fuel distribution and engine displacement (year 2005).
Displacement # vehicles Fuel % Total LDV fleet
<1.4 l 2336655
Gasoline
43%
53% 1.4 - 2.0 l 469837 9%
>2.0 l 52187 1%
<2.0 l 1801273 Diesel
33% 46%
>2.0 l 699510 13%
>2.0 l 22440 LPG 0.42%
# Total vehicles 5381902 100%
Table 3. Annual TTW characterization for the Portuguese light-duty fleet in terms of energy consumption and emissions.
Vehicle category Energy consumption Emissions (kton)
l/100km TJ CO2 CO HC NOx PM
Gasoline <1,4 l 6.9 56163 4058 112 15.7 16.0 0.0
Gasoline 1,4-2,0 l 8.2 15223 1100 18 2.5 2.6 0.0
Gasoline >2,0 l 10.3 2150 155 1.2 0.14 0.15 0.0
Diesel <2,0 l 6.1 63989 4724 5.8 0.94 20.0 2.1
Diesel >2,0 l 7.9 28651 2115 2.9 0.83 7.1 1.0
LPG 2.9ª 936 61 1.1 0.17 0.18 0.0
Total 7.2b 167112 12213 141 20 46 3
a in m3 of liquid propane gas per 100 km. b gasoline equivalent.

União Europeia – Fundos Estruturais Governo da República Portuguesa 15
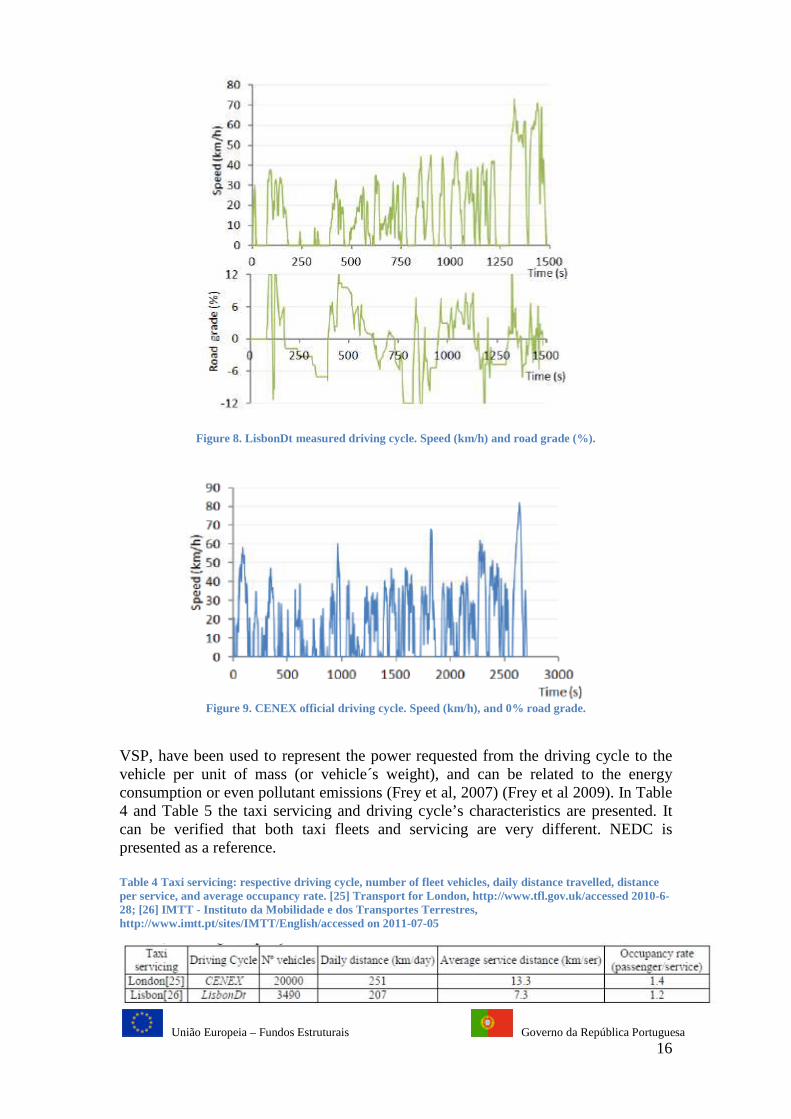
Summarizing, the Portuguese light-duty conventional road transport sector consumes 167112 TJ of fossil fuel energy and is responsible for a global annual CO2 emission of 12213 kton and for a local emission of 141 kton of CO, 20 kton of HC, 46 kton of NOx and 3 kton of PM. For small scale regions such as Anadia or Flores, the regional Inhabitants combined with the Portuguese vehicle density 510 vehicles per 1000 Inhabitants (ACAP, 2006), (INE, 2008), gives a scale factor for the fleet size. For specific taxi fleets, a methodology to study fleet conversions was derived, that can be useful to characterize future technology powertrains of other vehicle types. The focus was a possible approach for simulating the conversion of a conventional internal combustion engine drivetrain vehicle into a series hybrid (HEV) and plug-in hybrid (PHEV) drive. The main object refers to the taxi fleet of Lisbon and London, but can be used for any vehicle. Both cases are studied, including the distinct driving cycles, vehicles, taxi service and vehicle occupancy rate. Charging frequency is part of PHEV analysis. Vehicle drivetrain component selection is highlighted, aiming for energy consumption and CO2 emissions reduction. Vehicle Specific Power (VSP) is used in driving cycle analysis and for the selection of converted vehicle components characteristics. When compared to the conventional diesel (ICEV) taxi for Lisbon and London case respectively, the HEV drivetrain could reduce energy consumption by 37% and 9%, and the PHEV by 45-82% and 8-77% (depending if battery is recharged once a day or at the end of each service). A Well-to-Wheel (WTW) analysis showed that the conversion to HEVs could reduce energy and CO2 emissions by 37% for Lisbon and 9% for London taxi fleets. The best results were achieved by the PHEV that could allow an energy reduction up to 60% for both Lisbon and London taxi fleets, and CO2 emissions reductions of 70%. Lisbon and London are two different cities, served by two different taxi services as presented in Table 4 and Table 5. Real driving data in Lisbon downtown is used to represent the driving schedule for this case. This driving cycle were measured within Lisbon Metropolitan area, by using a speed sensor, a GPS system equipped with a barometric altimeter and data recovery from the OBD (On-Board Diagnostic) interface in the vehicle during the measurement. For London an official driving schedule is used, PCO-CENEX (Baptista et al, 2011). Figure 8 and Figure 9 show both driving cycles profile. To simplify, from now PCO-CENEX will be regarded as CENEX, and Lisbon downtown as LisbonDt.
União Europeia – Fundos Estruturais Governo da República Portuguesa 16
Figure 8. LisbonDt measured driving cycle. Speed (km/h) and road grade (%).
Figure 9. CENEX official driving cycle. Speed (km/h), and 0% road grade.
VSP, have been used to represent the power requested from the driving cycle to the vehicle per unit of mass (or vehicle´s weight), and can be related to the energy consumption or even pollutant emissions (Frey et al, 2007) (Frey et al 2009). In Table 4 and Table 5 the taxi servicing and driving cycle’s characteristics are presented. It can be verified that both taxi fleets and servicing are very different. NEDC is presented as a reference. Table 4 Taxi servicing: respective driving cycle, number of fleet vehicles, daily distance travelled, distance per service, and average occupancy rate. [25] Transport for London, http://www.tfl.gov.uk/accessed 2010-6-28; [26] IMTT - Instituto da Mobilidade e dos Transportes Terrestres, http://www.imtt.pt/sites/IMTT/English/accessed on 2011-07-05
União Europeia – Fundos Estruturais Governo da República Portuguesa 17
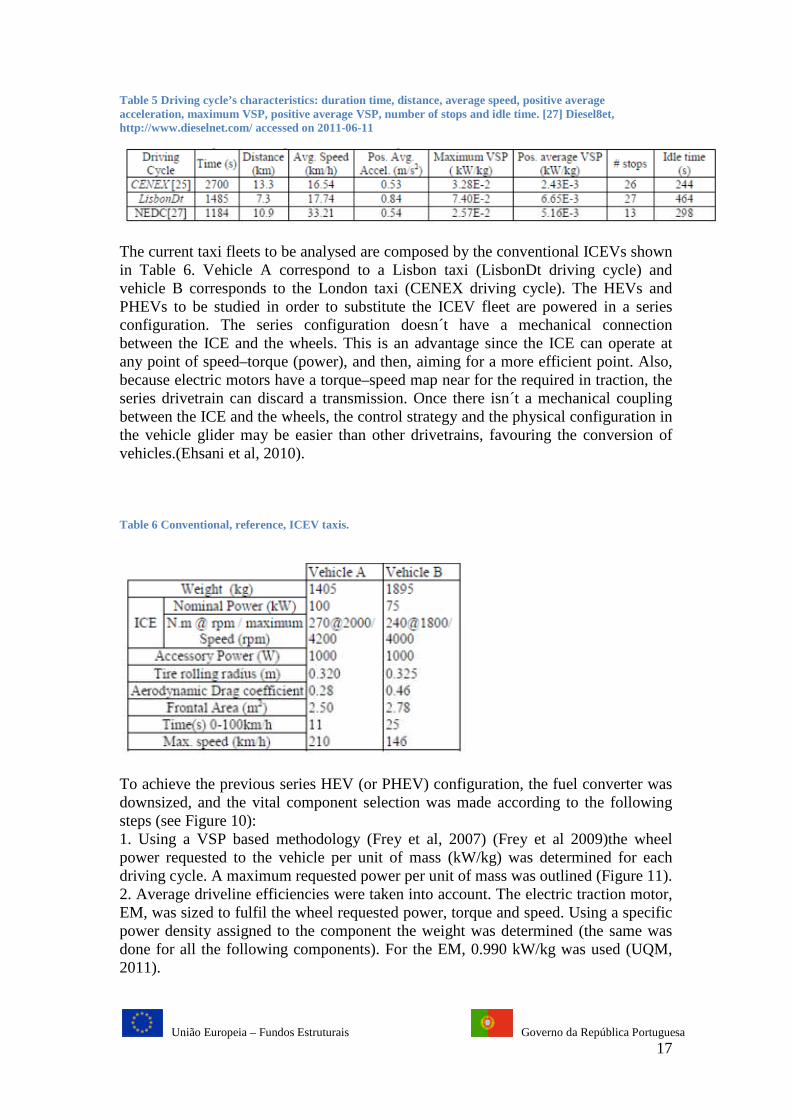
Table 5 Driving cycle’s characteristics: duration time, distance, average speed, positive average acceleration, maximum VSP, positive average VSP, number of stops and idle time. [27] Diesel8et, http://www.dieselnet.com/ accessed on 2011-06-11
The current taxi fleets to be analysed are composed by the conventional ICEVs shown in Table 6. Vehicle A correspond to a Lisbon taxi (LisbonDt driving cycle) and vehicle B corresponds to the London taxi (CENEX driving cycle). The HEVs and PHEVs to be studied in order to substitute the ICEV fleet are powered in a series configuration. The series configuration doesn´t have a mechanical connection between the ICE and the wheels. This is an advantage since the ICE can operate at any point of speed–torque (power), and then, aiming for a more efficient point. Also, because electric motors have a torque–speed map near for the required in traction, the series drivetrain can discard a transmission. Once there isn´t a mechanical coupling between the ICE and the wheels, the control strategy and the physical configuration in the vehicle glider may be easier than other drivetrains, favouring the conversion of vehicles.(Ehsani et al, 2010). Table 6 Conventional, reference, ICEV taxis.
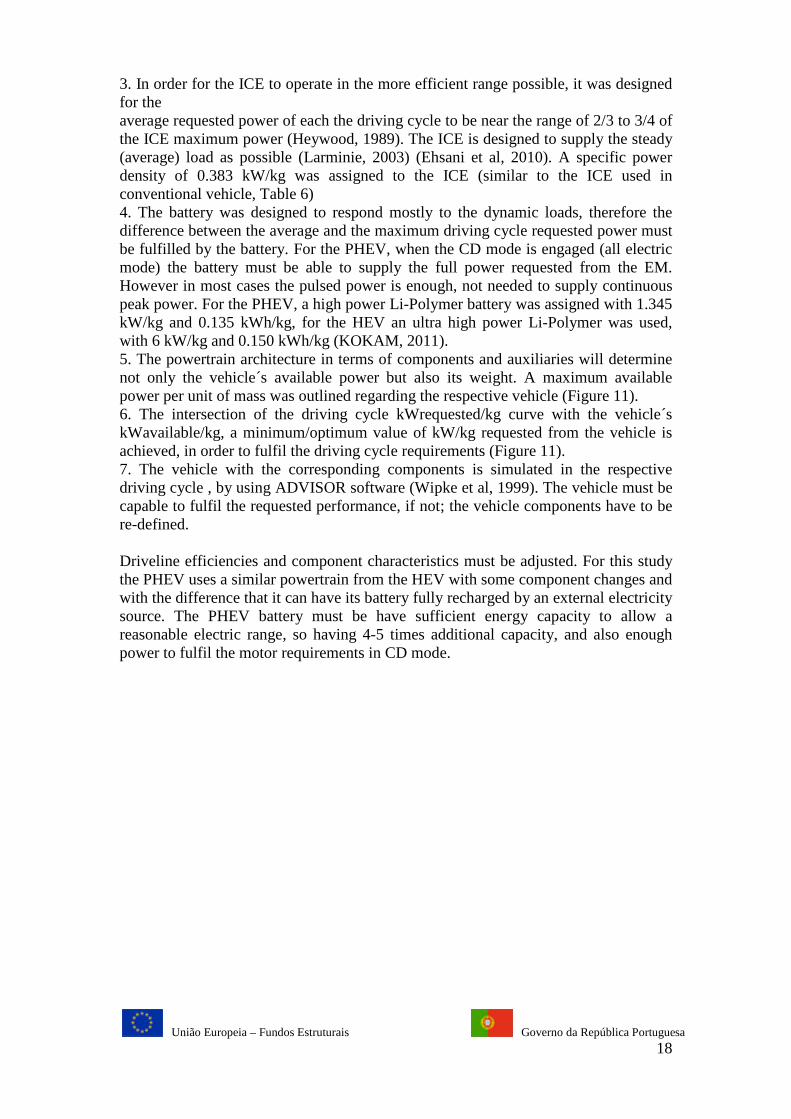
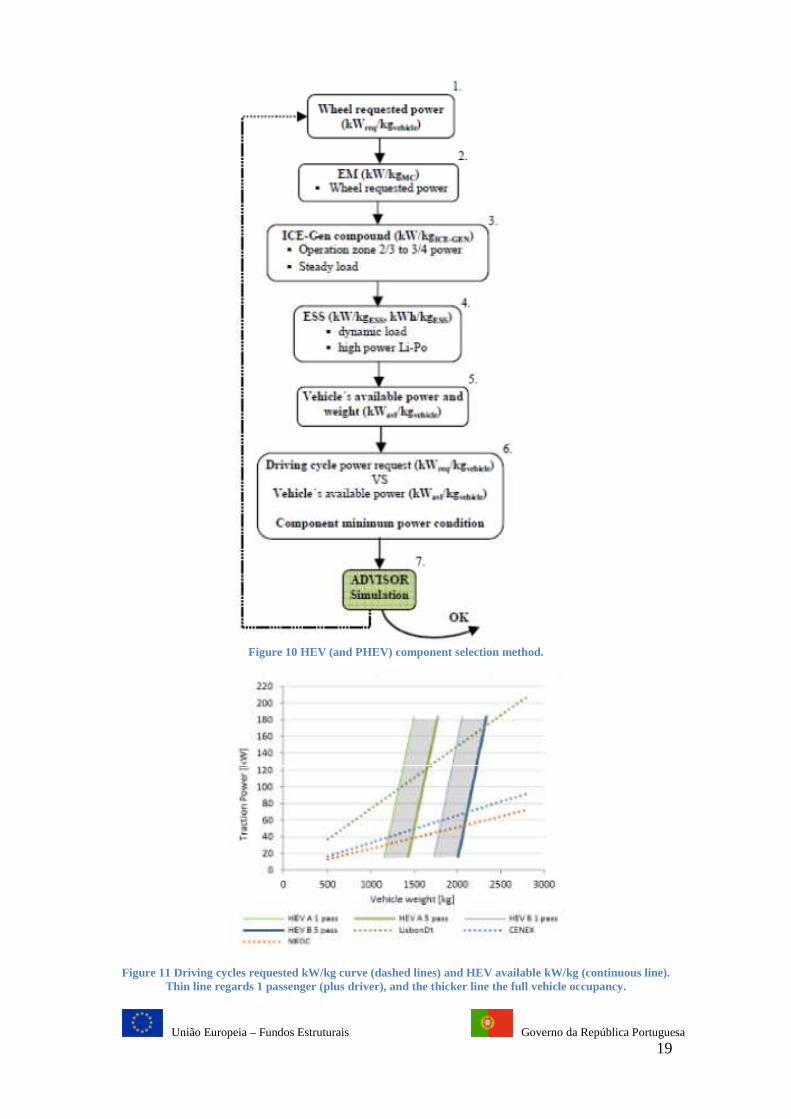
To achieve the previous series HEV (or PHEV) configuration, the fuel converter was downsized, and the vital component selection was made according to the following steps (see Figure 10): 1. Using a VSP based methodology (Frey et al, 2007) (Frey et al 2009)the wheel power requested to the vehicle per unit of mass (kW/kg) was determined for each driving cycle. A maximum requested power per unit of mass was outlined (Figure 11). 2. Average driveline efficiencies were taken into account. The electric traction motor, EM, was sized to fulfil the wheel requested power, torque and speed. Using a specific power density assigned to the component the weight was determined (the same was done for all the following components). For the EM, 0.990 kW/kg was used (UQM, 2011).
União Europeia – Fundos Estruturais Governo da República Portuguesa 18
3. In order for the ICE to operate in the more efficient range possible, it was designed for the average requested power of each the driving cycle to be near the range of 2/3 to 3/4 of the ICE maximum power (Heywood, 1989). The ICE is designed to supply the steady (average) load as possible (Larminie, 2003) (Ehsani et al, 2010). A specific power density of 0.383 kW/kg was assigned to the ICE (similar to the ICE used in conventional vehicle, Table 6) 4. The battery was designed to respond mostly to the dynamic loads, therefore the difference between the average and the maximum driving cycle requested power must be fulfilled by the battery. For the PHEV, when the CD mode is engaged (all electric mode) the battery must be able to supply the full power requested from the EM. However in most cases the pulsed power is enough, not needed to supply continuous peak power. For the PHEV, a high power Li-Polymer battery was assigned with 1.345 kW/kg and 0.135 kWh/kg, for the HEV an ultra high power Li-Polymer was used, with 6 kW/kg and 0.150 kWh/kg (KOKAM, 2011). 5. The powertrain architecture in terms of components and auxiliaries will determine not only the vehicle´s available power but also its weight. A maximum available power per unit of mass was outlined regarding the respective vehicle (Figure 11). 6. The intersection of the driving cycle kWrequested/kg curve with the vehicle´s kWavailable/kg, a minimum/optimum value of kW/kg requested from the vehicle is achieved, in order to fulfil the driving cycle requirements (Figure 11). 7. The vehicle with the corresponding components is simulated in the respective driving cycle , by using ADVISOR software (Wipke et al, 1999). The vehicle must be capable to fulfil the requested performance, if not; the vehicle components have to be re-defined. Driveline efficiencies and component characteristics must be adjusted. For this study the PHEV uses a similar powertrain from the HEV with some component changes and with the difference that it can have its battery fully recharged by an external electricity source. The PHEV battery must be have sufficient energy capacity to allow a reasonable electric range, so having 4-5 times additional capacity, and also enough power to fulfil the motor requirements in CD mode.
União Europeia – Fundos Estruturais Governo da República Portuguesa 19
Figure 10 HEV (and PHEV) component selection method.
Figure 11 Driving cycles requested kW/kg curve (dashed lines) and HEV available kW/kg (continuous line).
Thin line regards 1 passenger (plus driver), and the thicker line the full vehicle occupancy.
União Europeia – Fundos Estruturais Governo da República Portuguesa 20
This method Is fully explained in João P. Ribau, Carla M. Silva. Conventional to Hybrid and Plug-In Drive-train Taxi Fleet Conversion. European Electric Vehicle Congress, EEVC, Brussels, Belgium, 26-28 October 2011 http://www.sia.fr/files/evenement/onglet/2672/Programme_EEVC.pdf These fleet characterizations are a good approach for "time frozen" analysis (see Task 4). For time dependent evolutions, e.g. 2010-2050, historic data concerning fleet turnover, vehicle sales, fuels used, mobility as passengersxkm, must be considered. This is fully described in PhD thesis: Patricia Baptista, Evaluation of the impact of new vehicle and fuel technologies in the Portuguese road transportation sector, PhD thesis, IST, 2011. https://dspace.ist.utl.pt/bitstream/2295/1103721/1/51313%20PhD%20Thesis.pdf. 2.3 Task 3-Life cycle energy consumption and CO2 emissions This task allowed having a database of values to be used In Task 4 Fleet Model. To better understand how road vehicle technologies energy consumption and CO2 emissions compare with the fuel cell vehicles, a full life cycle perspective is used. This full live cycle comprises the fuel life cycle and materials cradle-to-grave life cycle. For this analysis the two fuel cell configurations described above were compared with the following vehicles/fuels with similar power to weight ratios (55 W/kg) (Silva et al,2008): - ICEV (Gasoline, E10, E85, E100): internal combustion engine vehicle that can run with gasoline and blends of gasoline and ethanol E10, E85 and E100, with a four cylinder explosion engine with 63 kW of power and total weight of 1139 kg; - ICEV (Diesel, B10, B20, B100): internal combustion engine vehicle that can run with diesel and blends of diesel and biodiesel B10, B20 and B100, with a four cylinder Diesel engine with 67 kW of power and total weight of 1210 kg; - PHEV (Gasoline, E10, E85, E100): plug-in hybrid electric vehicle that can work with gasoline and blends of gasoline and ethanol E10, E85, E100 and electricity. 53 kW internal explosion combustion engine/generator, 75 kW electric motor, Ni-MH 45 Ah 335 V battery , series technology with a total weight of 1323 kg; - PHEV (Diesel, B10, B20, B100): plug-in hybrid electric vehicle that can work with diesel and blends of diesel and biodiesel B10, B20, B100 and electricity. 53 kW internal Diesel combustion engine/generator, 75 kW electric motor, Ni-MH 45 Ah 335 V battery, series technology with a total weight of 1323 kg; - HEV FULL (Gasoline): hybrid electric vehicle with parallel and series technology, 43 kW internal explosion combustion engine, 31 kW electric motor, Ni-MH 6.5 Ah 308 V battery, 15 kW generator and 1332 kg; - EV (100% Electricity): pure electric vehicle with a 75 kW electric motor, Ni-MH 90 Ah 268 V battery, and a total weight of 1389 kg. The program ADVISOR (Wipke et al, 1999) was used to simulate the energy consumption and emissions of each vehicle in the specified driving cycle (see Figure 12).
União Europeia – Fundos Estruturais Governo da República Portuguesa 21
Table 7 shows the in-use energy consumption and CO2 emissions (Tank-to-Wheel part of the fuel life cycle). For the fuels production and distribution stage part of its life cycle “Well-to-Tank” analysis WTT, a database (Edwards et al, 2008) (GM, 2002) was used for the calculation of the energy spent and CO2 emissions for different fuels and different pathways. The fuel cycle has been defined as the energy spent to bring the fuel to the vehicle, not including the energy of the fuel itself. For each type of fuel a path was defined since its acquisition or production until it is available for use in the vehicles. The fuels used were gasoline, diesel, ethanol from sugar beet, pulp to heat (ethanol A), ethanol from sugar beet, animal feed export (ethanol B), biodiesel from rapeseed (biodiesel A), biodiesel from sunflower (biodiesel B), electricity, hydrogen from central natural gas reforming plants with steam co-generation (hydrogen A) and hydrogen produced in refuelling stations via onsite electrolysis generation (hydrogen B).
União Europeia – Fundos Estruturais Governo da República Portuguesa 22
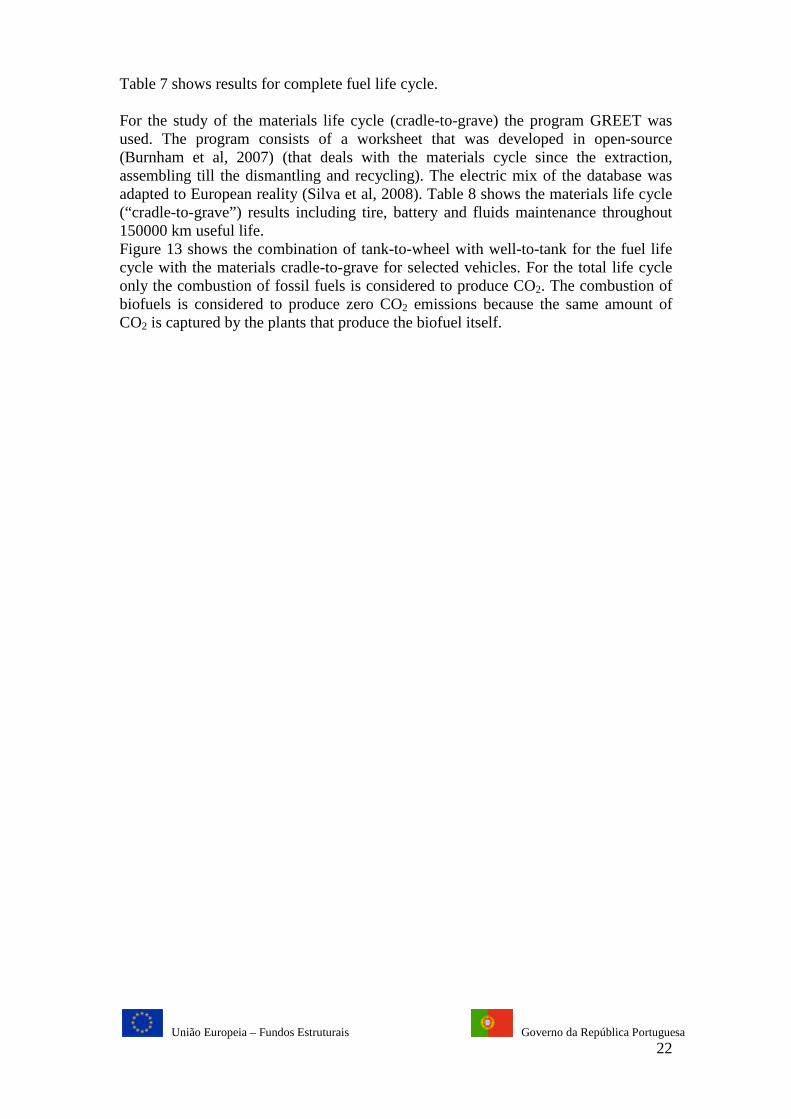
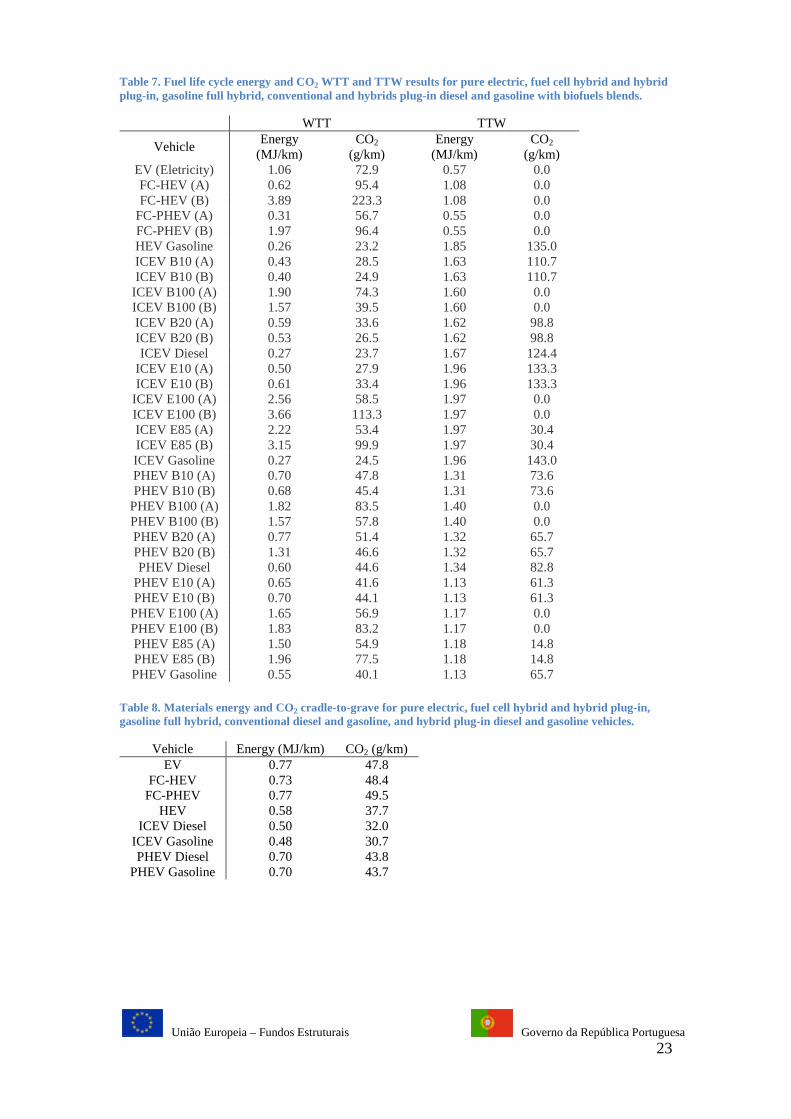
Table 7 shows results for complete fuel life cycle. For the study of the materials life cycle (cradle-to-grave) the program GREET was used. The program consists of a worksheet that was developed in open-source (Burnham et al, 2007) (that deals with the materials cycle since the extraction, assembling till the dismantling and recycling). The electric mix of the database was adapted to European reality (Silva et al, 2008). Table 8 shows the materials life cycle (“cradle-to-grave”) results including tire, battery and fluids maintenance throughout 150000 km useful life. Figure 13 shows the combination of tank-to-wheel with well-to-tank for the fuel life cycle with the materials cradle-to-grave for selected vehicles. For the total life cycle only the combustion of fossil fuels is considered to produce CO2. The combustion of biofuels is considered to produce zero CO2 emissions because the same amount of CO2 is captured by the plants that produce the biofuel itself.
União Europeia – Fundos Estruturais Governo da República Portuguesa 23
Table 7. Fuel life cycle energy and CO2 WTT and TTW results for pure electric, fuel cell hybrid and hybrid plug-in, gasoline full hybrid, conventional and hybrids plug-in diesel and gasoline with biofuels blends.
WTT TTW
Vehicle Energy
(MJ/km) CO2
(g/km) Energy
(MJ/km) CO2
(g/km) EV (Eletricity) 1.06 72.9 0.57 0.0 FC-HEV (A) 0.62 95.4 1.08 0.0 FC-HEV (B) 3.89 223.3 1.08 0.0
FC-PHEV (A) 0.31 56.7 0.55 0.0 FC-PHEV (B) 1.97 96.4 0.55 0.0 HEV Gasoline 0.26 23.2 1.85 135.0 ICEV B10 (A) 0.43 28.5 1.63 110.7 ICEV B10 (B) 0.40 24.9 1.63 110.7 ICEV B100 (A) 1.90 74.3 1.60 0.0 ICEV B100 (B) 1.57 39.5 1.60 0.0 ICEV B20 (A) 0.59 33.6 1.62 98.8 ICEV B20 (B) 0.53 26.5 1.62 98.8 ICEV Diesel 0.27 23.7 1.67 124.4
ICEV E10 (A) 0.50 27.9 1.96 133.3 ICEV E10 (B) 0.61 33.4 1.96 133.3
ICEV E100 (A) 2.56 58.5 1.97 0.0 ICEV E100 (B) 3.66 113.3 1.97 0.0 ICEV E85 (A) 2.22 53.4 1.97 30.4 ICEV E85 (B) 3.15 99.9 1.97 30.4 ICEV Gasoline 0.27 24.5 1.96 143.0 PHEV B10 (A) 0.70 47.8 1.31 73.6 PHEV B10 (B) 0.68 45.4 1.31 73.6
PHEV B100 (A) 1.82 83.5 1.40 0.0 PHEV B100 (B) 1.57 57.8 1.40 0.0 PHEV B20 (A) 0.77 51.4 1.32 65.7 PHEV B20 (B) 1.31 46.6 1.32 65.7 PHEV Diesel 0.60 44.6 1.34 82.8
PHEV E10 (A) 0.65 41.6 1.13 61.3 PHEV E10 (B) 0.70 44.1 1.13 61.3 PHEV E100 (A) 1.65 56.9 1.17 0.0 PHEV E100 (B) 1.83 83.2 1.17 0.0 PHEV E85 (A) 1.50 54.9 1.18 14.8 PHEV E85 (B) 1.96 77.5 1.18 14.8 PHEV Gasoline 0.55 40.1 1.13 65.7
Table 8. Materials energy and CO2 cradle-to-grave for pure electric, fuel cell hybrid and hybrid plug-in, gasoline full hybrid, conventional diesel and gasoline, and hybrid plug-in diesel and gasoline vehicles.
Vehicle Energy (MJ/km) CO2 (g/km) EV 0.77 47.8
FC-HEV 0.73 48.4 FC-PHEV 0.77 49.5
HEV 0.58 37.7 ICEV Diesel 0.50 32.0
ICEV Gasoline 0.48 30.7 PHEV Diesel 0.70 43.8
PHEV Gasoline 0.70 43.7
União Europeia – Fundos Estruturais Governo da República Portuguesa 24
Figure 12. Drive cycle. Average speed 40 km/h, distance 33 km.
Figure 13. Full life cycle energy for selected vehicles (fuel cell hybrid plug-in, gasoline hybrid plug-in, pure
electric, fuel cell hybrid, conventional diesel, gasoline full hybrid, B10 plug-in hybrid, conventional gasoline, conventional B100 and E85).
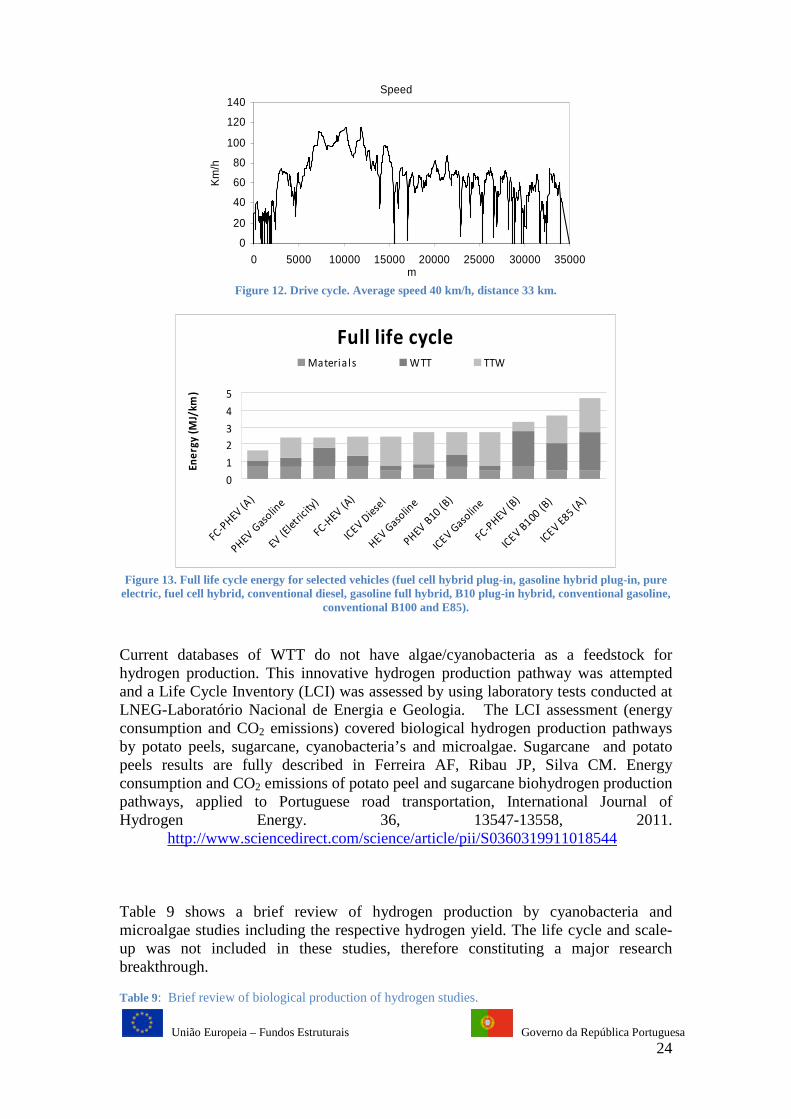
Current databases of WTT do not have algae/cyanobacteria as a feedstock for hydrogen production. This innovative hydrogen production pathway was attempted and a Life Cycle Inventory (LCI) was assessed by using laboratory tests conducted at LNEG-Laboratório Nacional de Energia e Geologia. The LCI assessment (energy consumption and CO2 emissions) covered biological hydrogen production pathways by potato peels, sugarcane, cyanobacteria’s and microalgae. Sugarcane and potato peels results are fully described in Ferreira AF, Ribau JP, Silva CM. Energy consumption and CO2 emissions of potato peel and sugarcane biohydrogen production pathways, applied to Portuguese road transportation, International Journal of Hydrogen Energy. 36, 13547-13558, 2011. http://www.sciencedirect.com/science/article/pii/S0360319911018544 Table 9 shows a brief review of hydrogen production by cyanobacteria and microalgae studies including the respective hydrogen yield. The life cycle and scale-up was not included in these studies, therefore constituting a major research breakthrough. Table 9: Brief review of biological production of hydrogen studies.
Speed
0
20
40
60
80
100
120
140
0 5000 10000 15000 20000 25000 30000 35000m
Km
/h
Full life cycle
0
1
2
3
4
5
FC-PHEV (A
)
PHEV Gaso
line
EV (Ele
tric
ity)
FC-HEV (A
)
ICEV D
iese
l
HEV Gaso
line
PHEV B10 (B
)
ICEV G
asolin
e
FC-PHEV (B
)
ICEV B
100 (B)
ICEV E
85 (A)
En
erg
y (
MJ/
km
)
Materia ls WTT TTW
União Europeia – Fundos Estruturais
Microorganism
Cyanobacteria Anabaena
Cyanobacteria Anabaena
Cyanobacteria Anabaena
Cyanobacteria Anabaena
Enterobacter cloacae DM11 n.s. *
Enterobacter aerogenes
*not specified
In the specific case of LNEG laboratory experiments, the patways for
hydrogen production are depicted in
Figure 14: Scheme of the twophotobioreactor; Pd/25 %Ag
Fundos Estruturais Governo da República Portuguesa
Method Substrate
Photobiological -
Photobiological -
Biophotolysis Photofermentation
(review) -
Photoautotrophic method and glucose addiction
-
Fermentation Glucose
Fermentation Organic urban solid
waste
Fermentation Biodiesel residues containing glycerol
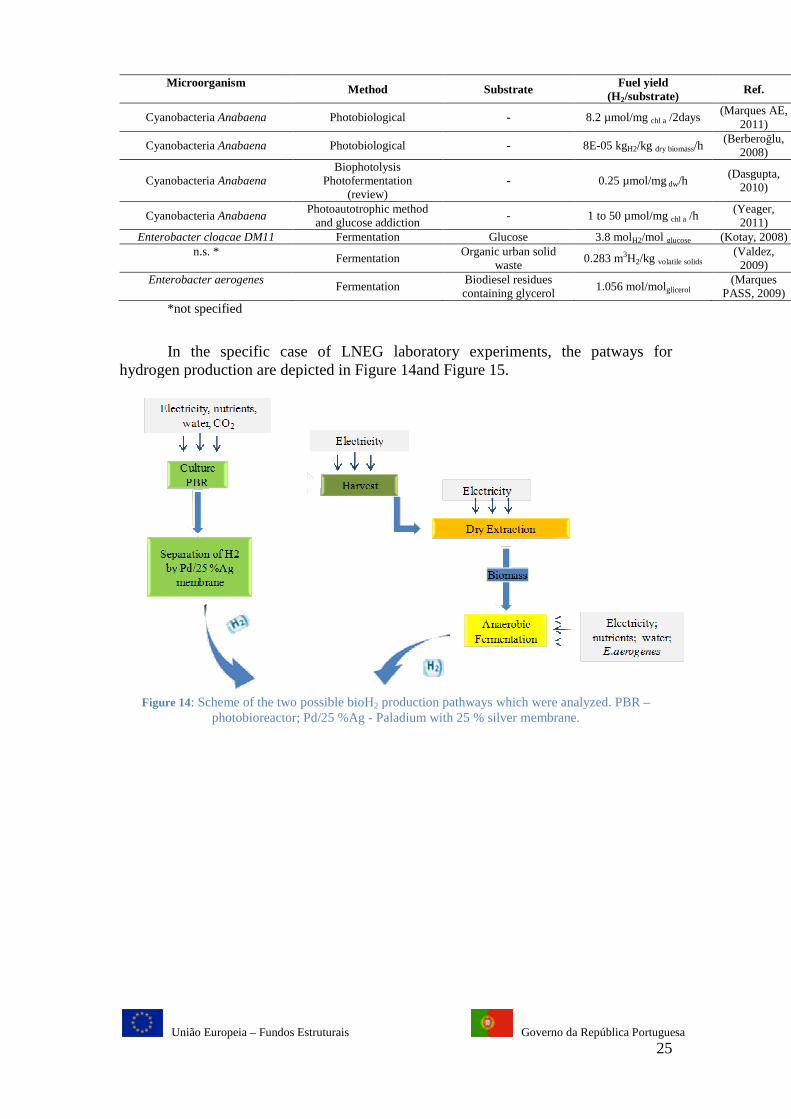
In the specific case of LNEG laboratory experiments, the patways for hydrogen production are depicted in Figure 14and Figure 15.
cheme of the two possible bioH2 production pathways which were analyzedphotobioreactor; Pd/25 %Ag - Paladium with 25 % silver membrane.
Governo da República Portuguesa 25
Fuel yield (H2/substrate) Ref.
8.2 µmol/mg chl a /2days (Marques AE,
2011)
8E-05 kgH2/kg dry biomass/h (Berberoğlu,
2008)
0.25 µmol/mg dw/h (Dasgupta,
2010)
1 to 50 µmol/mg chl a /h (Yeager,
2011) 3.8 molH2/mol glucose (Kotay, 2008)
0.283 m3H2/kg volatile solids (Valdez, 2009)
1.056 mol/molglicerol (Marques
PASS, 2009)
In the specific case of LNEG laboratory experiments, the patways for
production pathways which were analyzed. PBR –
Paladium with 25 % silver membrane.

União Europeia – Fundos Estruturais
Figure 15. Scheme of the experimental stages of biomass production and the whole fermprocess: (A) Scenedesmus obliquus
preparation, (C) Biomass hydrolysis and (D) Fermentation.
A representation of the flows required to characterize a unit process is depicted in Figure 16. manufacture most products (unit processes are needed for production of nutrients, gases, artificial light.operational processes were accounted in this study i.e. not including machinery production, vehicle production, storage, and residues treatment.
Figure
The SimaPro 7.1 software was used only water and gases and adapted for the Portuguese electricity generation mixmixes are also exploited bearing in mind other countries realitiesenergy inputs, from the equipment/lighting used, were specifications and working hours. The functional unit of energy consumption and COemissions are defined as MJ and grams per 1 MJ of H
Biohydrogen is compared with hydrogen production by industrial CSR (Central Selectrolysis and other energy resources such a
Figure 17). The laboratory hydrogen production from the fermentation of the sugars of microalgae biomass by/product hydrolyzate consumed 281.2
Fundos Estruturais Governo da República Portuguesa
Scheme of the experimental stages of biomass production and the whole ferm
Scenedesmus obliquus microalgae biomass production, (B) BM1 medium preparation, (C) Biomass hydrolysis and (D) Fermentation.
representation of the flows required to characterize a unit process is Typically, numerous such processes are required to
manufacture most products (Sullivan, 2012). For example, in microalgae unit processes are needed for production of nutrients, gases, artificial light.
nal processes were accounted in this study i.e. not including machinery production, vehicle production, storage, and residues treatment.
Figure 16. Generalized unit process (Sullivan, 2012)
The SimaPro 7.1 software was used only as database to fertilizers, nutrients, adapted for the Portuguese electricity generation mix
mixes are also exploited bearing in mind other countries realities. energy inputs, from the equipment/lighting used, were derived by device specifications and working hours. The functional unit of energy consumption and COemissions are defined as MJ and grams per 1 MJ of H2 produced, respectively.
Biohydrogen is compared with hydrogen production by industrial CSR (Central Steam Reforming), electrolysis and other energy resources such as gasoline and diesel (
The laboratory hydrogen production from the fermentation of the sugars of microalgae biomass by/product hydrolyzate consumed 281.2 - 404.9 MJ/MJH
Governo da República Portuguesa 26
Scheme of the experimental stages of biomass production and the whole fermentation microalgae biomass production, (B) BM1 medium
representation of the flows required to characterize a unit process is Typically, numerous such processes are required to
For example, in microalgae production, unit processes are needed for production of nutrients, gases, artificial light. Only
nal processes were accounted in this study i.e. not including machinery
database to fertilizers, nutrients, adapted for the Portuguese electricity generation mix, other
The remaining derived by device
specifications and working hours. The functional unit of energy consumption and CO2 produced, respectively.
team Reforming),
The laboratory hydrogen production from the fermentation of the sugars of 404.9 MJ/MJH2 of

União Europeia – Fundos Estruturais Governo da República Portuguesa 27
energy and emitted 24000 – 29000 g CO2/MJH2. Considering the microalgae growth/culture the while process consumed 7270 – 51308 MJ/MJH2 of energy and emitted 670000 – 4200000 g CO2/MJH2. The cyanobacterium H2 production consumed 1538 MJ/MJH2 of energy and emitted 114640 g CO2/MJH2. The use of phototrophic residual cyanobacteria as a substrate in a dark-fermentation process consumed 12.0% more of energy and emitted 12.1% more CO2 showing that although the process increased the overall efficiency of hydrogen production it was not a viable energy and CO2 emission solution. The scale-up to industrial production is not envisaged, but innumerous possibilities of process optimization are identified for future implementation.
Figure 17.Energy consumption and CO2 emissions of different hydrogen production (biological and industrial CSR, electrolysis) and other fuels, gasoline and diesel.
Regarding Cradle-To-Gate results, for the Portuguese context, the studied feedstocks for hydrogen production, potato peels and sugarcane, have potentially lower energy consumption and CO2 emissions than hydrogen production from natural gas reforming and electrolysis. Potato peels have an additional merit of contributing to Portuguese energy independency. Potato peel hydrogen production could potentially supply up to 8-24% of Portugal’s LDV fleet, reducing 45-52% of WTW energy consumption and 65-69% of WTW CO2 emissions in comparison to diesel and gasoline conventional vehicles. This same hydrogen pathway could supply the entire taxi fleet of Lisbon. However, for the same purposes, in the sugarcane case, approximately 2.8x10⁵ tons of sugar per year has to be considered for the same hydrogen potential achievement. A WTW analysis showed that, energetically and environmentally speaking, the use of fuel cell hybrid vehicles can be competitive in comparison with conventional ICE vehicles. Uncertainty varies WTW results in 10.8-

União Europeia – Fundos Estruturais Governo da República Portuguesa 28
15.6% for vehicles using battery power only, 10.3-11.4% for vehicles using internal combustion engine power, and 4.8-9.4% for vehicles using hydrogen fuel cell power. Hydrogen photoautotrophic production by Anabaena sp. was studied for different light intensities and gas atmospheres (pathway #1). The conducted laboratory experiments revealed that the best hydrogen yield (0.0128 kgH2/kgbiomass) was achieved for Ar+CO2+N2 gas atmosphere with high light intensity (678 W). This hydrogen yield was further increased by 8.1 %, by using the recovered or residual cyanobacteria through a fermentative process (pathway #2). Concerning energy consumption and CO2 emissions, the best value for H2 production ratio versus was obtained for Ar+CO2+ 20 % N2 gas atmosphere and medium light intensity conditions. The hydrogen yield value for this case was 0.0114 kgH2/kgbiomass which had a rough energy consumption of 1538 MJ/MJH2 and produced 114640gCO2/MJH2 (pathway #1). This hydrogen yield was increased to 0.0126 kgH2/kgbiomass by means of using the residual Anabaena biomass as a substrate in the fermentative process (pathway #2). However, this increase was at a detriment of higher energy consumption of 12.0 % and CO2 emissions of 12.1 %. The sensitiveness study of energy and CO2 values for the hydrogen yield (ηH2) and the renewable energy percentage in the electricity mix was considered. It revealed that an improvement in the hydrogen yield to 0.1 kgH2/kgbiomass, a value competitive with glucose yields, and using 80 % renewable electricity mix, allowing a 95 % decrease in energy and 96 % decrease in CO2 emissions. If ηH2=1 and used a 100 % renewable energy mix, this would allow a near 99% decrease in energy and CO2 emissions to values of 2.6 MJ/MJH2 and 72 gCO2/MJH2, respectively. This approach of recycling cyanobacteria biomass residue after photoautotrophic H2 production, in a sequential fermentative process, as well as the energy and CO2 balance applied are clearly innovative. In this work it was not intended to provide the scale up of the process at this stage, although the potential transfer of this methodology seems feasible with some improvements which allow decreasing the energy intensity of the whole processes, such as:
• elimination of the centrifugation process for cyanobacteria pre-concentration; • replacing existing laboratory equipment with more energy-efficient ones; • using wet cyanobacteria biomass (by decantation) as substrate for
fermentation, eliminating the centrifugation and drying steps; • elimination of artificial light during the cyanobacteria culture by using solar
light, which may have an effect on the hydrogen yield, at least on an hourly basis;
• using alternative renewable energies in the drying (e.g. solar dryer, wind tunnel) and other unit operations involved in the process;
• using wastewater rich in nutrients instead of deionised water. As far as wastewater use is concerned, the recycling of harvested water and using sea/wastewater as a water source, was already demonstrated by other authors (Clarens, 2010; Chinnasamy, 2010; Yang, 2011 and Singh, 2011). The elimination of the centrifugation, for the same hydrogen yield and electricity mix in the laboratory experiments, can have a positive impact by reducing energy and CO2 emissions by 66 % with respective values of 535 MJ/MJH2 and 39916 gCO2/MJH2. With a hydrogen yield of 0.1 kgH2/kgbiomass and an 80% renewable electricity mix, the values decrease to 26.5 MJ/MJH2 and 1659 gCO2/MJH2. Finally, this analysis shows that the biological production of hydrogen must be further investigated to make cyanobacteria-based biofuel production, energy and

União Europeia – Fundos Estruturais Governo da República Portuguesa 29
environmentally relevant. Biological hydrogen production by Clostridium butyricum from Scenedesmus obliquus hydrolizate attained a yield of 2.9 ± 0.3 molH2/molsugars. This H2 yield was obtained at the expense of 7270-51309 MJ/MJH2 of energy consumption and 674 - 4232 kgCO2/MJH2 of CO2 emissions, considering microalgae culture, harvesting, and drying and the subsequent hydrolysis and fermentation processes (fermentative medium preparation, degasification and incubation). These values are 3 orders of magnitude higher than conventional industrial hydrogen production. Special attention should be paid in reducing the use of artificial illumination during the microalgae culture stage and to the use of more renewables in the electricity mix used in the whole process. Biohydrogen from cyanobacteria/microalgae are not yet included in the fleet model due to its extremely high-energy consumption and resulting CO2 emissions at laboratory scale. 2.4 Task 4-Fleet model development Some static approaches (year frozen) were followed and tested before the implementation of dynamic (year forward 2010-2050) approach. Examples of static approaches can be found in: P. Baptista, M. Tomás and C. Silva. Hybrid plug-in fuel cell vehicles market penetration scenarios. International journal of hydrogen energy Vol. 35, Issue 18, Pg. 10024–10030. http://www.sciencedirect.com/science/article/pii/S0360319910001576; and, Carla Silva. Electric and plug-in hybrid vehicles influence on CO2 and water vapour emissions. International Journal of Hydrogen Energy. 36, 13225-13232, 2011. http://www.sciencedirect.com/science/article/pii/S0360319911016442 The dynamic approach is fully described In the PhD thesis: Patricia Baptista, Evaluation of the impact of new vehicle and fuel technologies in the Portuguese road transportation sector, PhD thesis, IST, 2011. https://dspace.ist.utl.pt/bitstream/2295/1103721/1/51313%20PhD%20Thesis.pdf. The scheme for such approach is presented in Figure 18, for the computational application PATTS- Projections for Alternative Transportation Technologies Simulation tool.

União Europeia – Fundos Estruturais
PATTS allows to have as output discrete Figure 19) or combinatory analysFigure 20): the user can be given the choice on several variables:
• Population, vehicle stock, diesel share in vehicle sales• Mobility vs BAU, congestion, mobility decrease due
technology • Vehicle technology:• Vision of road transportation sector (liquid fuel based, diversified, electricity,
hydrogen)-Availability, Aggressiveness, Maximum level• Energy source (Maximum level for biofuels, Electricity generatio
These allow to assess the results of a large number of scenarios through impact indicators: Evolution indicators (energy and emissions TTW, WTW and LCA reductions compared to 2010)
• Efficiency indicators (fleet’s average performance in MJ/km and g/kmTTW, WTW, LCA)
• Mobility indicator (influence of mobility in TTW results)• Shift indicators (shift in energy consumption to alternative fuelled vehicles or
alternative energy pathways, TTW and WTW)• Boundary indicators (defining energy consumption and emi
country, LCA national vs total)The final objective is creating easy to use deand decision makers.
Fundos Estruturais Governo da República Portuguesa
Figure 18. Scheme of the PATTS model.
PATTS allows to have as output discrete scenarios for time evolutions 2010) or combinatory analysis scenarios for a combinations of desired inputs (see : the user can be given the choice on several variables:
Population, vehicle stock, diesel share in vehicle sales Mobility vs BAU, congestion, mobility decrease due to shift to alternative
Vehicle technology: Vision of road transportation sector (liquid fuel based, diversified, electricity,
Availability, Aggressiveness, Maximum level Energy source (Maximum level for biofuels, Electricity generatio
assess the results of a large number of scenarios through impact
Evolution indicators (energy and emissions TTW, WTW and LCA reductions
Efficiency indicators (fleet’s average performance in MJ/km and g/kmTTW, WTW, LCA) Mobility indicator (influence of mobility in TTW results) Shift indicators (shift in energy consumption to alternative fuelled vehicles or alternative energy pathways, TTW and WTW) Boundary indicators (defining energy consumption and emissions within the country, LCA national vs total)
creating easy to use decision support guiding maps for planners
Governo da República Portuguesa 30
for time evolutions 2010-2050 (see for a combinations of desired inputs (see
to shift to alternative
Vision of road transportation sector (liquid fuel based, diversified, electricity,
Energy source (Maximum level for biofuels, Electricity generation mix) assess the results of a large number of scenarios through impact
Evolution indicators (energy and emissions TTW, WTW and LCA reductions
Efficiency indicators (fleet’s average performance in MJ/km and g/km in
Shift indicators (shift in energy consumption to alternative fuelled vehicles or
ssions within the
cision support guiding maps for planners

União Europeia – Fundos Estruturais
Figure 19 Discrete scenario evaluations.
- BAU, Policy based on currerenewable energy sources integration in the transportation sector.
- The Medium scenarios allowed 13BAU and the Policy scenario a 5% reduction.
- Maximum limit (obtained cofleet profile, without mobility reduction, in a vision that does not shifts to alternative vehicle technologies): 32% increase in 2050 compared to the BAU both for energy and CO
- Minimum limit (obtained cmobility reductions happening, in an hydrogen or electricity powered vision and a high shift to alternative vehicle technologies): 52% reduction in 2050 compared to the BAU for energy consumption and 64%
- LCA at national scale: - LCA at international scale:
Figure
2.5 Task 5- Electric power system model development The steady-state grid analysis is fully described in the PhD thesis: Impact of the Deployment of Electric Vehicles in Grid Operation and Expansion, PhD thesis, FEUP, 2012. http://metalib.fe.up.pt/V/NJ9VRVVTA4CQPREV6PMGISSHCT5GX9KICC2NDFXPU9F7Y2TI9M-10585?func=quickformat=002&set_number=259357&set_entry=000001&format=999
0
50
100
150
200
250
300
350
400
19
90
20
00
20
10
20
20
20
30
WT
W E
ne
rgy
co
nsu
mp
tio
n (
PJ)
Fundos Estruturais Governo da República Portuguesa
Discrete scenario evaluations.
BAU, Policy based on current targets for electric vehicle penetration and renewable energy sources integration in the transportation sector.The Medium scenarios allowed 13-16% reductions in 2050 compared to the BAU and the Policy scenario a 5% reduction. Maximum limit (obtained considering a high population, high vehicle density fleet profile, without mobility reduction, in a vision that does not shifts to alternative vehicle technologies): 32% increase in 2050 compared to the BAU both for energy and CO2. Minimum limit (obtained considering a low population and fleet profiles, with mobility reductions happening, in an hydrogen or electricity powered vision and a high shift to alternative vehicle technologies): 52% reduction in 2050 compared to the BAU for energy consumption and 64% for COLCA at national scale: ≈1% higher than WTW. LCA at international scale: ≈25% higher than WTW.
Figure 20 Combinatory analysis -Indicators
Electric power system model development
id analysis is fully described in the PhD thesis: Impact of the Deployment of Electric Vehicles in Grid Operation and Expansion, PhD thesis, FEUP, 2012.http://metalib.fe.up.pt/V/NJ9VRVVTA4CQPREV6PMGISSHCT5GX9KICC2NDF
10585?func=quick-3&short-format=002&set_number=259357&set_entry=000001&format=999
0.0E+00
5.0E+03
1.0E+04
1.5E+04
2.0E+04
2.5E+04
3.0E+04
19
90
20
00
20
10
WT
W C
O2
em
issi
on
s (k
ton
)
20
30
20
40
20
50
BAU
Policy
M1
M2
M3
M4
Min
Max
Governo da República Portuguesa 31
nt targets for electric vehicle penetration and renewable energy sources integration in the transportation sector.
16% reductions in 2050 compared to the
nsidering a high population, high vehicle density fleet profile, without mobility reduction, in a vision that does not shifts to alternative vehicle technologies): 32% increase in 2050 compared to the BAU
onsidering a low population and fleet profiles, with mobility reductions happening, in an hydrogen or electricity powered vision and a high shift to alternative vehicle technologies): 52% reduction in 2050
for CO2 emissions.
id analysis is fully described in the PhD thesis: Filipe Soares. Impact of the Deployment of Electric Vehicles in Grid Operation and Expansion, PhD thesis, FEUP, 2012. http://metalib.fe.up.pt/V/NJ9VRVVTA4CQPREV6PMGISSHCT5GX9KICC2NDF
20
10
20
20
20
30
20
40
20
50
BAU
Policy
M1
M2
M3
M4
Min
Max
União Europeia – Fundos Estruturais Governo da República Portuguesa 32
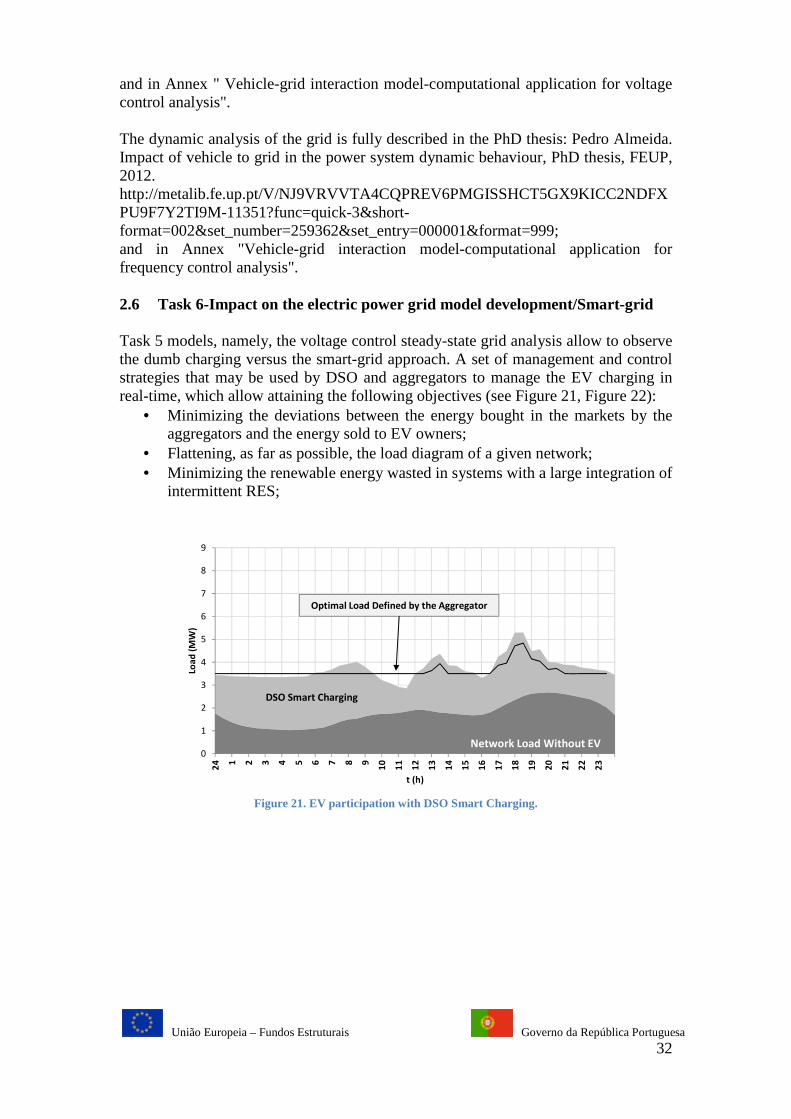
and in Annex " Vehicle-grid interaction model-computational application for voltage control analysis". The dynamic analysis of the grid is fully described in the PhD thesis: Pedro Almeida. Impact of vehicle to grid in the power system dynamic behaviour, PhD thesis, FEUP, 2012. http://metalib.fe.up.pt/V/NJ9VRVVTA4CQPREV6PMGISSHCT5GX9KICC2NDFXPU9F7Y2TI9M-11351?func=quick-3&short-format=002&set_number=259362&set_entry=000001&format=999; and in Annex "Vehicle-grid interaction model-computational application for frequency control analysis". 2.6 Task 6-Impact on the electric power grid model development/Smart-grid Task 5 models, namely, the voltage control steady-state grid analysis allow to observe the dumb charging versus the smart-grid approach. A set of management and control strategies that may be used by DSO and aggregators to manage the EV charging in real-time, which allow attaining the following objectives (see Figure 21, Figure 22):
• Minimizing the deviations between the energy bought in the markets by the aggregators and the energy sold to EV owners;
• Flattening, as far as possible, the load diagram of a given network; • Minimizing the renewable energy wasted in systems with a large integration of
intermittent RES;
Figure 21. EV participation with DSO Smart Charging.
0
1
2
3
4
5
6
7
8
9
24 1 2 3 4 5 6 7 8 9
10
11
12
13
14
15
16
17
18
19
20
21
22
23
Loa
d (
MW
)
t (h)
Network Load Without EV
DSO Smart Charging
Optimal Load Defined by the Aggregator
União Europeia – Fundos Estruturais
Figure 22. EV participation in minimizing RES waste. Dumb vs Smart Charging
2.7 Task 7-Cost benefit analysisIn this section is presented the achievement within this task:
• Cost-benefit from the users and society point of view• Scenarios for fuel prices and alternative technologies for road vehicles in
Portugal, between 2010• Economic, Energy a
2.7.1 Cost-benefit from the users and society point of viewThis work has the objective of performing a costimplementation of C-Segment passenger electric vehicles in Portugal, fand the society point of view. From the user’s point of view, all costs and revenues associated to the vehicle were considered: its acquisition and resale, maintenance, energy, insurance, periodic inspection and vehicle-to-technologies in the market for internal combustion engines, gasoline and dieselpowered and series and seriesFrom the society’s point of view, the emission of gases, at the tailpipower plant, for the different vehicles were studied and their costs for society. The contribution of the technologies in study for the European 2020 goals were also considered, as well as all costs supported by the Government due to the instthe electric vehicle public charging network, the incentives for the acquisition of vehicles and the changes in tax revenues. At current prices and incentives, the electric vehicle is the most favorable technology for the C-Segment consideringcharging conditions are not a problem. From the society’s point of view the electric
Fundos Estruturais Governo da República Portuguesa
. EV participation in minimizing RES waste. Dumb vs Smart Charging
Cost benefit analysis sented the methodology, main results and conclusions for ea
achievement within this task: benefit from the users and society point of view;
Scenarios for fuel prices and alternative technologies for road vehicles in Portugal, between 2010-2050;
nomic, Energy and Environmental Impacts Simulator (EEEIS)
benefit from the users and society point of view This work has the objective of performing a cost-benefit analysis of the
Segment passenger electric vehicles in Portugal, fand the society point of view. From the user’s point of view, all costs and revenues associated to the vehicle were considered: its acquisition and resale, maintenance, energy, insurance, periodic
-grid, comparing the electric vehicle to the best available technologies in the market for internal combustion engines, gasoline and dieselpowered and series and series-parallel hybrid gasoline vehicles. From the society’s point of view, the emission of gases, at the tailpipower plant, for the different vehicles were studied and their costs for society. The contribution of the technologies in study for the European 2020 goals were also considered, as well as all costs supported by the Government due to the instthe electric vehicle public charging network, the incentives for the acquisition of vehicles and the changes in tax revenues. At current prices and incentives, the electric vehicle is the most favorable technology
Segment considering the costs for the user, as long as the range and charging conditions are not a problem. From the society’s point of view the electric
Governo da República Portuguesa 33
. EV participation in minimizing RES waste. Dumb vs Smart Charging.
, main results and conclusions for each
Scenarios for fuel prices and alternative technologies for road vehicles in
nd Environmental Impacts Simulator (EEEIS).
benefit analysis of the Segment passenger electric vehicles in Portugal, from the user
From the user’s point of view, all costs and revenues associated to the vehicle were considered: its acquisition and resale, maintenance, energy, insurance, periodic
electric vehicle to the best available technologies in the market for internal combustion engines, gasoline and diesel-
From the society’s point of view, the emission of gases, at the tailpipe and at the power plant, for the different vehicles were studied and their costs for society. The contribution of the technologies in study for the European 2020 goals were also considered, as well as all costs supported by the Government due to the installation of the electric vehicle public charging network, the incentives for the acquisition of
At current prices and incentives, the electric vehicle is the most favorable technology the costs for the user, as long as the range and
charging conditions are not a problem. From the society’s point of view the electric
União Europeia – Fundos Estruturais Governo da República Portuguesa 34
vehicle incurs in a cost to human activity associated to externalities that is dependent on the source of the electricity used and may vary considerably. The C segment includes the majority of vehicles sold in Portugal. All monetary values are presented in 2010 Euro values and no inflation was considered. When comparing different LDV options, the best available technologies in each type of technology were chosen, with an average engine power of 80 kW. The fuel or energy consumption was calculated using the NEDC, combined cycle mode, which is the Standard Driving Cycle in Europe and for which all analyzed mobility options were assessed, with the exception of the PHEV, which was calculated using data released by Opel. Referred fuel consumption and CO2 emissions are approved by the Portuguese Institute of Land Transports (IMTT, 2010). Considering the best commercial technologies, the vehicles in study are:
• Internal Combustion Engine Vehicle Gasoline - VW Golf 1.2 TSI Bluemotion, with a 1197 cc engine, maximum power output of 75 kW, acceleration (0-100 km/h) of 11.3 seconds and a combined fuel consumption of 5.5 l/100km with corresponding CO2 emissions of 129 g/km;
• Internal Combustion Engine Vehicle Diesel - VW Golf MK6 1.6 TDi Bluemotion, with a 1598cc engine, maximum power output of 77 kW, acceleration (0-100 km/h) of 11.3 seconds and a combined fuel consumption of 3.8 l/100km with a corresponding CO2 emission rate of 99 g/km;
• Hybrid Electric Vehicle (Series-Parallel Powertrain) - Toyota Prius 1.8 HSD, with a 1798 cc engine, maximum power output of 73 kW (gasoline engine) and a 60 kW electric engine, which achieves a combined power of 100 kW and an acceleration (0-100 km/h) of 11.4 seconds. It has a combined fuel consumption of 3.9 l/100km with a corresponding CO2 emission rate of 92 g/km; Plug-In Hybrid Electric Vehicle (Series Powertrain) - At the moment this Thesis was written, only one commercial PHEV with a Series Powertrain was available: the Opel Ampera (also known as the Chevrolet Volt) equipped with a 111 kW electric engine, 16 kWh Li-Ion batteries and a 1400 cc/53 kW Gasoline ICE working as a Range Extender. The estimated acceleration (0-100 km/h) is 9 seconds. Currently there is no official data for fuel consumption for the European Standard or CO2 emissions. Opel refers a 1.6 l/100km (range extender) and 29.6 kWh/100km (considering 90% efficiency in the battery recharge process);
• Electric Vehicle - At the moment of this work, the only C-Segment EV available commercially was the Nissan Leaf, which has a 80 kW engine and an electric consumption of 16.7 kWh/100km (considering 90% efficiency in the battery recharge process), supplied by Li-ion batteries with 24 kWh capacity. The estimated acceleration (0-100 km/h) is 9 seconds.
Regarding the Lifecycle analysis, the Cradle-to-Grave, Well-to-Tank and Tank-to-Wheel stages were considered. In terms of the Cradle-to-Grave Analysis (materials lifecycle), this analysis was performed for energy, CO2, NOx and PM. These results were defined using the GREET software adapted to the European reality of vehicle production, which deals with the materials cycle since extraction, assembly, dismantling and recycling (Baptista, 2010) (Baudoin, 2007). As for the Well-to-Tank and Tank-to-Wheel Analysis (fuel lifecycle), it was used to compare energy consumption, CO2, NOx and PM emissions for different mobility
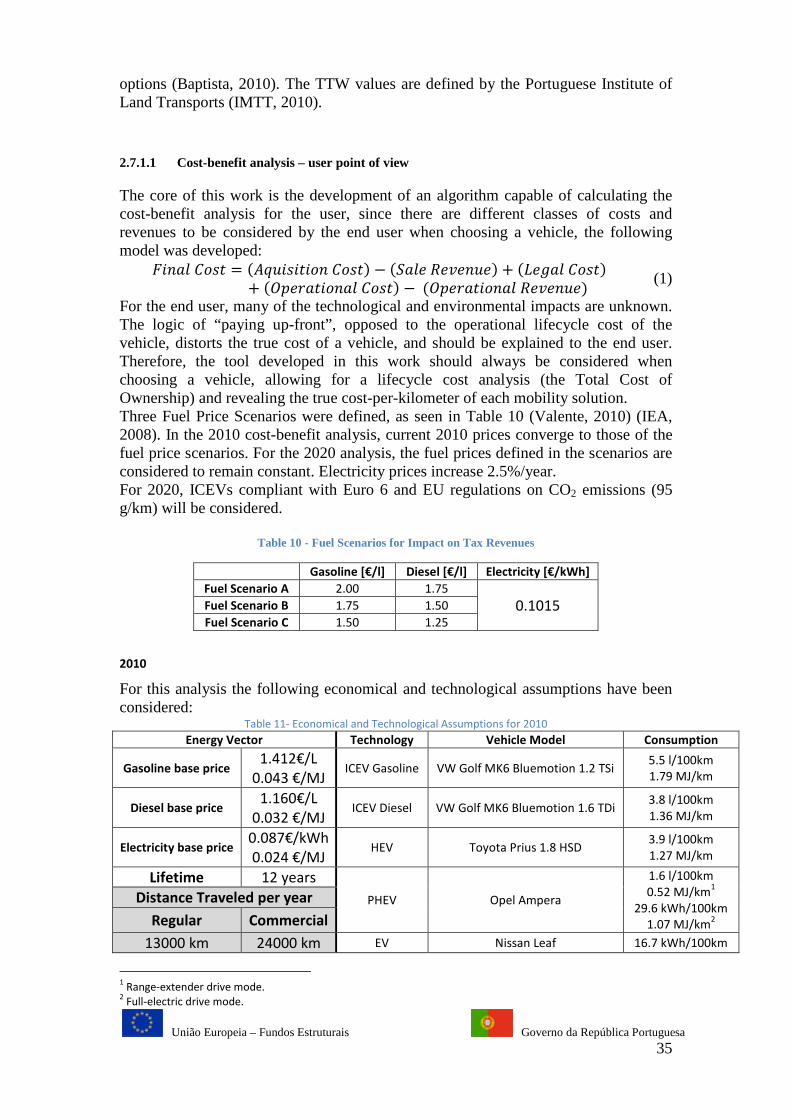
União Europeia – Fundos Estruturais Governo da República Portuguesa 35
options (Baptista, 2010). The TTW values are defined by the Portuguese Institute of Land Transports (IMTT, 2010).
2.7.1.1 Cost-benefit analysis – user point of view
The core of this work is the development of an algorithm capable of calculating the cost-benefit analysis for the user, since there are different classes of costs and revenues to be considered by the end user when choosing a vehicle, the following model was developed:
������� = � ���������� − ������������� + ���������+ �������������� −������������������� (1)
For the end user, many of the technological and environmental impacts are unknown. The logic of “paying up-front”, opposed to the operational lifecycle cost of the vehicle, distorts the true cost of a vehicle, and should be explained to the end user. Therefore, the tool developed in this work should always be considered when choosing a vehicle, allowing for a lifecycle cost analysis (the Total Cost of Ownership) and revealing the true cost-per-kilometer of each mobility solution. Three Fuel Price Scenarios were defined, as seen in Table 10 (Valente, 2010) (IEA, 2008). In the 2010 cost-benefit analysis, current 2010 prices converge to those of the fuel price scenarios. For the 2020 analysis, the fuel prices defined in the scenarios are considered to remain constant. Electricity prices increase 2.5%/year. For 2020, ICEVs compliant with Euro 6 and EU regulations on CO2 emissions (95 g/km) will be considered.
Table 10 - Fuel Scenarios for Impact on Tax Revenues
Gasoline [€/l] Diesel [€/l] Electricity [€/kWh]
Fuel Scenario A 2.00 1.75
0.1015 Fuel Scenario B 1.75 1.50
Fuel Scenario C 1.50 1.25
2010
For this analysis the following economical and technological assumptions have been considered:
Table 11- Economical and Technological Assumptions for 2010
Energy Vector Technology Vehicle Model Consumption
Gasoline base price 1.412€/L
0.043 €/MJ ICEV Gasoline VW Golf MK6 Bluemotion 1.2 TSi
5.5 l/100km
1.79 MJ/km
Diesel base price 1.160€/L
0.032 €/MJ ICEV Diesel VW Golf MK6 Bluemotion 1.6 TDi
3.8 l/100km
1.36 MJ/km
Electricity base price 0.087€/kWh
0.024 €/MJ HEV Toyota Prius 1.8 HSD
3.9 l/100km
1.27 MJ/km
Lifetime 12 years
PHEV Opel Ampera
1.6 l/100km
0.52 MJ/km1
29.6 kWh/100km
1.07 MJ/km2
Distance Traveled per year
Regular Commercial
13000 km 24000 km EV Nissan Leaf 16.7 kWh/100km
1 Range-extender drive mode.
2 Full-electric drive mode.
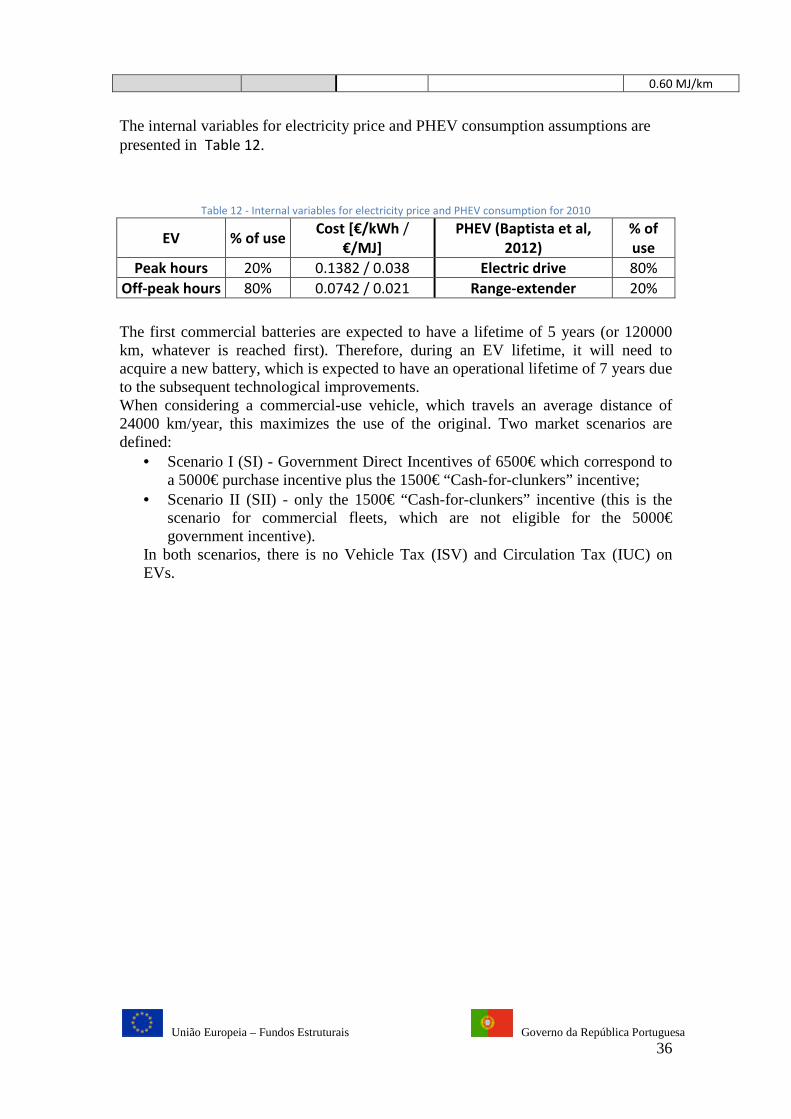
União Europeia – Fundos Estruturais Governo da República Portuguesa 36
0.60 MJ/km
The internal variables for electricity price and PHEV consumption assumptions are presented in Table 12.
Table 12 - Internal variables for electricity price and PHEV consumption for 2010
EV % of use Cost [€/kWh /
€/MJ]
PHEV (Baptista et al,
2012)
% of
use
Peak hours 20% 0.1382 / 0.038 Electric drive 80%
Off-peak hours 80% 0.0742 / 0.021 Range-extender 20%
The first commercial batteries are expected to have a lifetime of 5 years (or 120000 km, whatever is reached first). Therefore, during an EV lifetime, it will need to acquire a new battery, which is expected to have an operational lifetime of 7 years due to the subsequent technological improvements. When considering a commercial-use vehicle, which travels an average distance of 24000 km/year, this maximizes the use of the original. Two market scenarios are defined:
• Scenario I (SI) - Government Direct Incentives of 6500€ which correspond to a 5000€ purchase incentive plus the 1500€ “Cash-for-clunkers” incentive;
• Scenario II (SII) - only the 1500€ “Cash-for-clunkers” incentive (this is the scenario for commercial fleets, which are not eligible for the 5000€ government incentive).
In both scenarios, there is no Vehicle Tax (ISV) and Circulation Tax (IUC) on EVs.
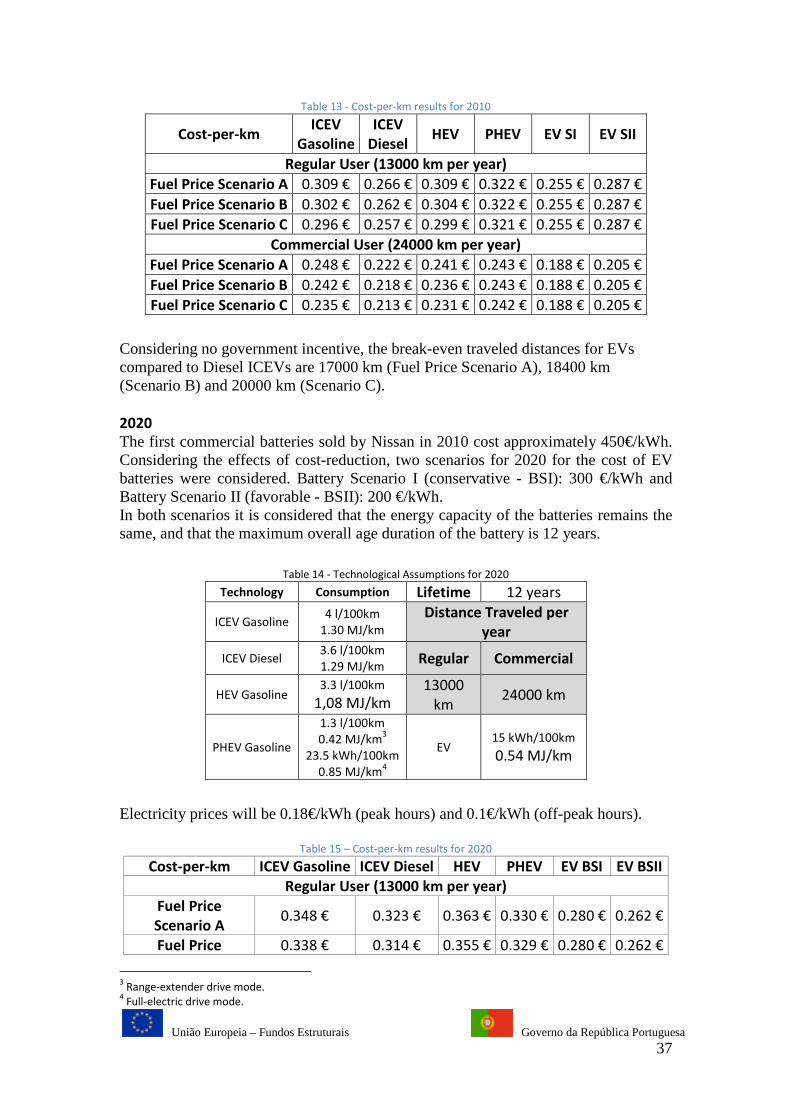
União Europeia – Fundos Estruturais Governo da República Portuguesa 37
Table 13 - Cost-per-km results for 2010
Cost-per-km ICEV
Gasoline
ICEV
Diesel HEV PHEV EV SI EV SII
Regular User (13000 km per year)
Fuel Price Scenario A 0.309 € 0.266 € 0.309 € 0.322 € 0.255 € 0.287 €
Fuel Price Scenario B 0.302 € 0.262 € 0.304 € 0.322 € 0.255 € 0.287 €
Fuel Price Scenario C 0.296 € 0.257 € 0.299 € 0.321 € 0.255 € 0.287 €
Commercial User (24000 km per year)
Fuel Price Scenario A 0.248 € 0.222 € 0.241 € 0.243 € 0.188 € 0.205 €
Fuel Price Scenario B 0.242 € 0.218 € 0.236 € 0.243 € 0.188 € 0.205 €
Fuel Price Scenario C 0.235 € 0.213 € 0.231 € 0.242 € 0.188 € 0.205 €
Considering no government incentive, the break-even traveled distances for EVs compared to Diesel ICEVs are 17000 km (Fuel Price Scenario A), 18400 km (Scenario B) and 20000 km (Scenario C). 2020
The first commercial batteries sold by Nissan in 2010 cost approximately 450€/kWh. Considering the effects of cost-reduction, two scenarios for 2020 for the cost of EV batteries were considered. Battery Scenario I (conservative - BSI): 300 €/kWh and Battery Scenario II (favorable - BSII): 200 €/kWh. In both scenarios it is considered that the energy capacity of the batteries remains the same, and that the maximum overall age duration of the battery is 12 years.
Table 14 - Technological Assumptions for 2020
Technology Consumption Lifetime 12 years
ICEV Gasoline 4 l/100km
1.30 MJ/km
Distance Traveled per
year
ICEV Diesel 3.6 l/100km
1.29 MJ/km Regular Commercial
HEV Gasoline 3.3 l/100km
1,08 MJ/km
13000
km 24000 km
PHEV Gasoline
1.3 l/100km
0.42 MJ/km3
23.5 kWh/100km
0.85 MJ/km4
EV 15 kWh/100km
0.54 MJ/km
Electricity prices will be 0.18€/kWh (peak hours) and 0.1€/kWh (off-peak hours).
Table 15 – Cost-per-km results for 2020
Cost-per-km ICEV Gasoline ICEV Diesel HEV PHEV EV BSI EV BSII
Regular User (13000 km per year)
Fuel Price
Scenario A 0.348 € 0.323 € 0.363 € 0.330 € 0.280 € 0.262 €
Fuel Price 0.338 € 0.314 € 0.355 € 0.329 € 0.280 € 0.262 €
3 Range-extender drive mode.
4 Full-electric drive mode.

União Europeia – Fundos Estruturais Governo da República Portuguesa 38
Scenario B
Fuel Price
Scenario C 0.328 € 0.305 € 0.347 € 0.329 € 0.280 € 0.262 €
Commercial User (24000 km per year)
Fuel Price
Scenario A 0.237 € 0.232 € 0.241 € 0.216 € 0.174 € 0.166 €
Fuel Price
Scenario B 0.227 € 0.223 € 0.233 € 0.216 € 0.174 € 0.166 €
Fuel Price
Scenario C 0.217 € 0.214 € 0.224 € 0.215 € 0.174 € 0.166 €
Increase in range – the break-even cost of EVs It is possible to calculate the break-even cost for the increase in range of EVs when compared to the best of the remaining mobility options. To do so, the cost-per-km of ICEV Diesel (the second best mobility option for 2020) is compared to that of an EV and the increase in battery capacity that is achievable with the break-even cost is calculated. The results are presented in Table 16. For the purpose of this calculation, it is considered that the consumption of the EV doesn’t increase although the increase in battery capacity will add weight to the vehicle.
Table 16 - New EV range due to increase of battery capacity up to break-even cost of ICEV (Diesel) per km
Fuel Price Scenario EV Battery Scenario I EV Battery Scenario II
A 275km 405km
B 258km 306km
C 234km 270km
Plotting for 2010, when considering a regular user that travels 13000 km each year, the best cost-benefit option is the EV (eligible for the 5000€ government incentive), followed by the ICEV Diesel. Even without government incentives, the EV has a lower Total Cost of Ownership (TCO) than Gasoline-powered ICEV, HEV and PHEV. When considering a user that travels 24000 km each year the EV is the best mobility option. When considering the evolution of best available technologies, fuel and electricity prices for 2020, for a distance traveled of 13000 km per year, the EV is the best mobility option. These results, however, must be considered over two different perspectives. In one hand, no tax policy has been included in the EV scenarios, which results in a lower TCO than that which is actually expect to exist after 2012 (with the terminus of the Portuguese Pilot-Period for electric mobility). Since this is a completely political decision, any attempt to take into account the effects on new taxation is subjected to dubious assumptions.
2.7.1.2 Cost-benefit analysis – Society point of view To assess the cost benefit from the society point of view, several areas of impact must be examined, such as the impact in tax revenues and the lifecycle assessment of emissions and their cost. The Impact on Tax Revenues in year i (����, in €) consists on several components:
���� = ����� + � �� − ! �� + ����� + � �� − ! �� (2)
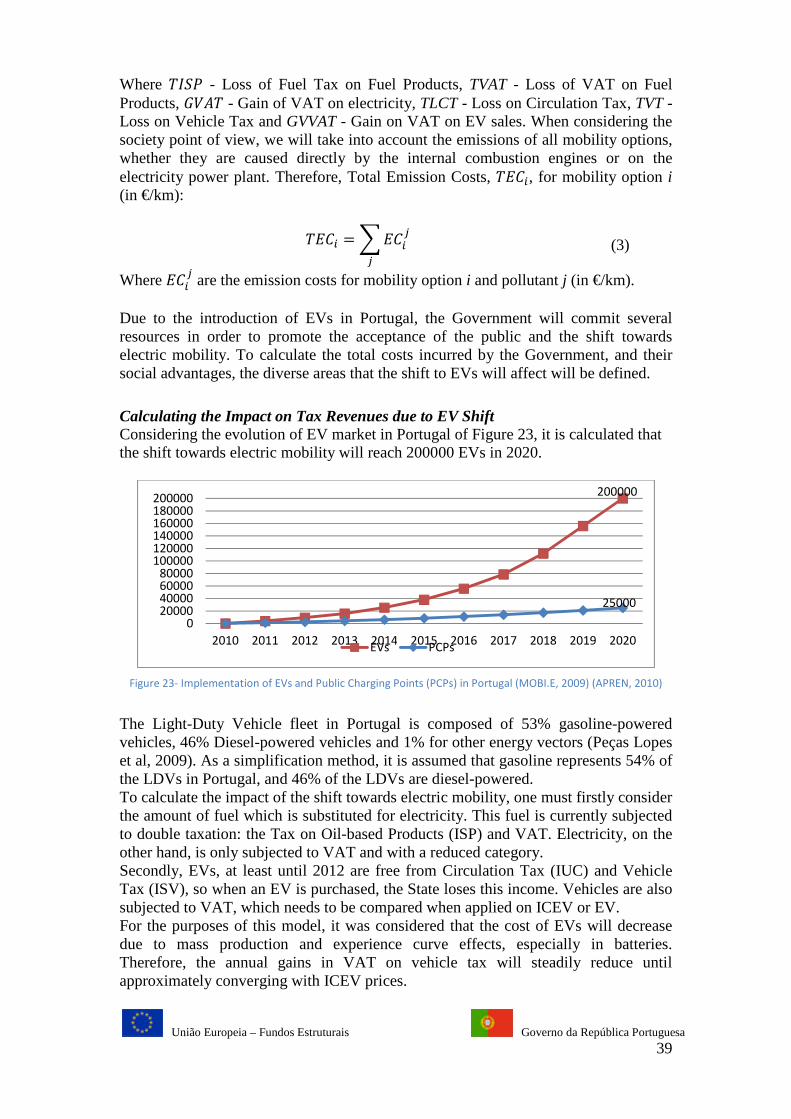
União Europeia – Fundos Estruturais Governo da República Portuguesa 39
Where ���� - Loss of Fuel Tax on Fuel Products, TVAT - Loss of VAT on Fuel Products, ! � - Gain of VAT on electricity, TLCT - Loss on Circulation Tax, TVT - Loss on Vehicle Tax and GVVAT - Gain on VAT on EV sales. When considering the society point of view, we will take into account the emissions of all mobility options, whether they are caused directly by the internal combustion engines or on the electricity power plant. Therefore, Total Emission Costs, �"��, for mobility option i (in €/km):
�"�� =#"��$$
(3)
Where "��$ are the emission costs for mobility option i and pollutant j (in €/km). Due to the introduction of EVs in Portugal, the Government will commit several resources in order to promote the acceptance of the public and the shift towards electric mobility. To calculate the total costs incurred by the Government, and their social advantages, the diverse areas that the shift to EVs will affect will be defined.
Calculating the Impact on Tax Revenues due to EV Shift Considering the evolution of EV market in Portugal of Figure 23, it is calculated that the shift towards electric mobility will reach 200000 EVs in 2020.
Figure 23- Implementation of EVs and Public Charging Points (PCPs) in Portugal (MOBI.E, 2009) (APREN, 2010)
The Light-Duty Vehicle fleet in Portugal is composed of 53% gasoline-powered vehicles, 46% Diesel-powered vehicles and 1% for other energy vectors (Peças Lopes et al, 2009). As a simplification method, it is assumed that gasoline represents 54% of the LDVs in Portugal, and 46% of the LDVs are diesel-powered.
To calculate the impact of the shift towards electric mobility, one must firstly consider the amount of fuel which is substituted for electricity. This fuel is currently subjected to double taxation: the Tax on Oil-based Products (ISP) and VAT. Electricity, on the other hand, is only subjected to VAT and with a reduced category. Secondly, EVs, at least until 2012 are free from Circulation Tax (IUC) and Vehicle Tax (ISV), so when an EV is purchased, the State loses this income. Vehicles are also subjected to VAT, which needs to be compared when applied on ICEV or EV. For the purposes of this model, it was considered that the cost of EVs will decrease due to mass production and experience curve effects, especially in batteries. Therefore, the annual gains in VAT on vehicle tax will steadily reduce until approximately converging with ICEV prices.
200000
25000
020000400006000080000
100000120000140000160000180000200000
2010 2011 2012 2013 2014 2015 2016 2017 2018 2019 2020EVs PCPs
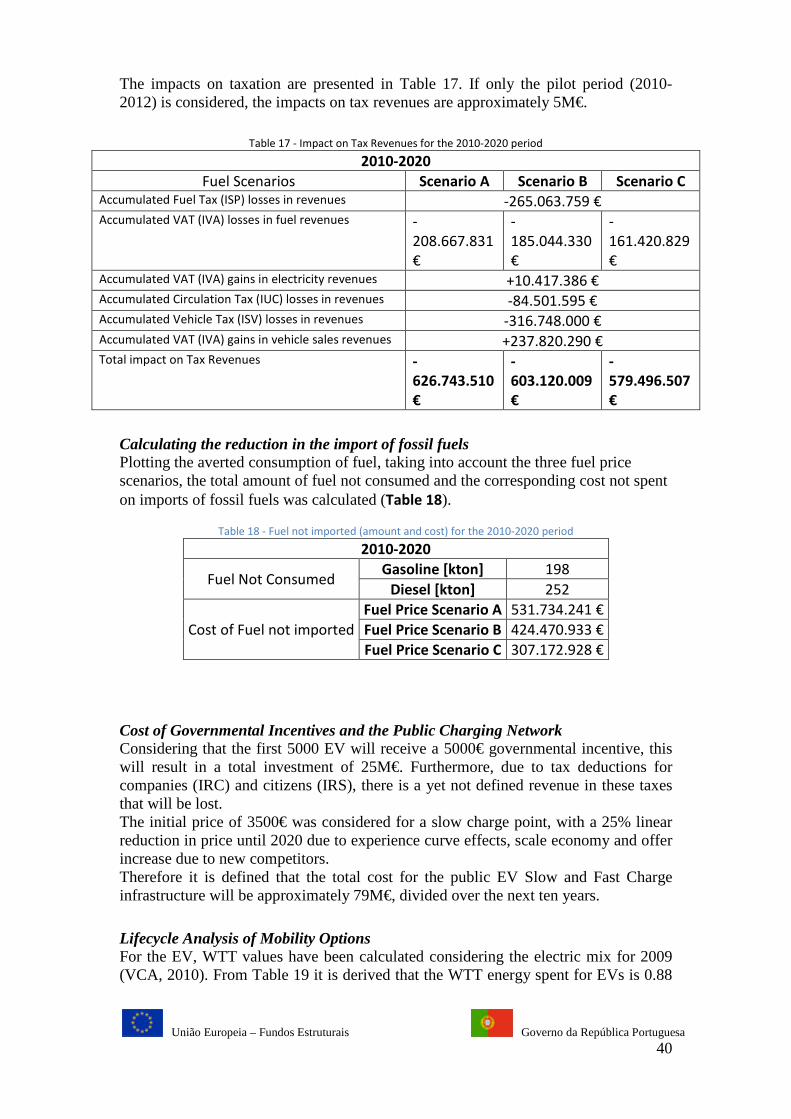
União Europeia – Fundos Estruturais Governo da República Portuguesa 40
The impacts on taxation are presented in Table 17. If only the pilot period (2010-2012) is considered, the impacts on tax revenues are approximately 5M€.
Table 17 - Impact on Tax Revenues for the 2010-2020 period
2010-2020
Fuel Scenarios Scenario A Scenario B Scenario C Accumulated Fuel Tax (ISP) losses in revenues -265.063.759 € Accumulated VAT (IVA) losses in fuel revenues -
208.667.831
€
-
185.044.330
€
-
161.420.829
€ Accumulated VAT (IVA) gains in electricity revenues +10.417.386 € Accumulated Circulation Tax (IUC) losses in revenues -84.501.595 € Accumulated Vehicle Tax (ISV) losses in revenues -316.748.000 € Accumulated VAT (IVA) gains in vehicle sales revenues +237.820.290 € Total impact on Tax Revenues -
626.743.510
€
-
603.120.009
€
-
579.496.507
€
Calculating the reduction in the import of fossil fuels Plotting the averted consumption of fuel, taking into account the three fuel price scenarios, the total amount of fuel not consumed and the corresponding cost not spent on imports of fossil fuels was calculated (Table 18).
Table 18 - Fuel not imported (amount and cost) for the 2010-2020 period
2010-2020
Fuel Not Consumed Gasoline [kton] 198
Diesel [kton] 252
Cost of Fuel not imported
Fuel Price Scenario A 531.734.241 €
Fuel Price Scenario B 424.470.933 €
Fuel Price Scenario C 307.172.928 €
Cost of Governmental Incentives and the Public Charging Network Considering that the first 5000 EV will receive a 5000€ governmental incentive, this will result in a total investment of 25M€. Furthermore, due to tax deductions for companies (IRC) and citizens (IRS), there is a yet not defined revenue in these taxes that will be lost. The initial price of 3500€ was considered for a slow charge point, with a 25% linear reduction in price until 2020 due to experience curve effects, scale economy and offer increase due to new competitors. Therefore it is defined that the total cost for the public EV Slow and Fast Charge infrastructure will be approximately 79M€, divided over the next ten years.
Lifecycle Analysis of Mobility Options For the EV, WTT values have been calculated considering the electric mix for 2009 (VCA, 2010). From Table 19 it is derived that the WTT energy spent for EVs is 0.88
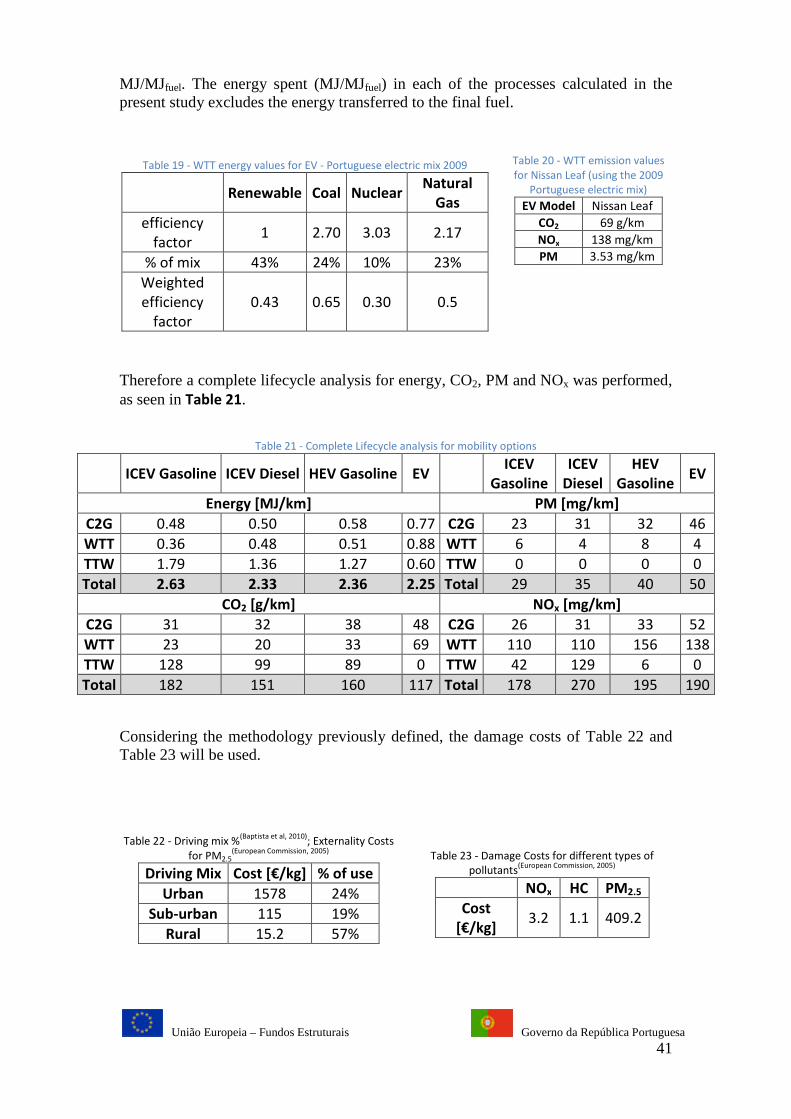
União Europeia – Fundos Estruturais Governo da República Portuguesa 41
MJ/MJfuel. The energy spent (MJ/MJfuel) in each of the processes calculated in the present study excludes the energy transferred to the final fuel.
Table 19 - WTT energy values for EV - Portuguese electric mix 2009
Renewable Coal Nuclear
Natural
Gas
efficiency
factor 1 2.70 3.03 2.17
% of mix 43% 24% 10% 23%
Weighted
efficiency
factor
0.43 0.65 0.30 0.5
Table 20 - WTT emission values
for Nissan Leaf (using the 2009
Portuguese electric mix)
EV Model Nissan Leaf
CO2 69 g/km
NOx 138 mg/km
PM 3.53 mg/km
Therefore a complete lifecycle analysis for energy, CO2, PM and NOx was performed, as seen in Table 21.
Table 21 - Complete Lifecycle analysis for mobility options
ICEV Gasoline ICEV Diesel HEV Gasoline EV
ICEV
Gasoline
ICEV
Diesel
HEV
Gasoline EV
Energy [MJ/km] PM [mg/km]
C2G 0.48 0.50 0.58 0.77 C2G 23 31 32 46
WTT 0.36 0.48 0.51 0.88 WTT 6 4 8 4
TTW 1.79 1.36 1.27 0.60 TTW 0 0 0 0
Total 2.63 2.33 2.36 2.25 Total 29 35 40 50
CO2 [g/km] NOx [mg/km]
C2G 31 32 38 48 C2G 26 31 33 52
WTT 23 20 33 69 WTT 110 110 156 138
TTW 128 99 89 0 TTW 42 129 6 0
Total 182 151 160 117 Total 178 270 195 190
Considering the methodology previously defined, the damage costs of Table 22 and Table 23 will be used.
Table 22 - Driving mix %(Baptista et al, 2010)
; Externality Costs
for PM2.5(European Commission, 2005)
Driving Mix Cost [€/kg] % of use
Urban 1578 24%
Sub-urban 115 19%
Rural 15.2 57%
Table 23 - Damage Costs for different types of
pollutants(European Commission, 2005)
NOx HC PM2.5
Cost
[€/kg] 3.2 1.1 409.2
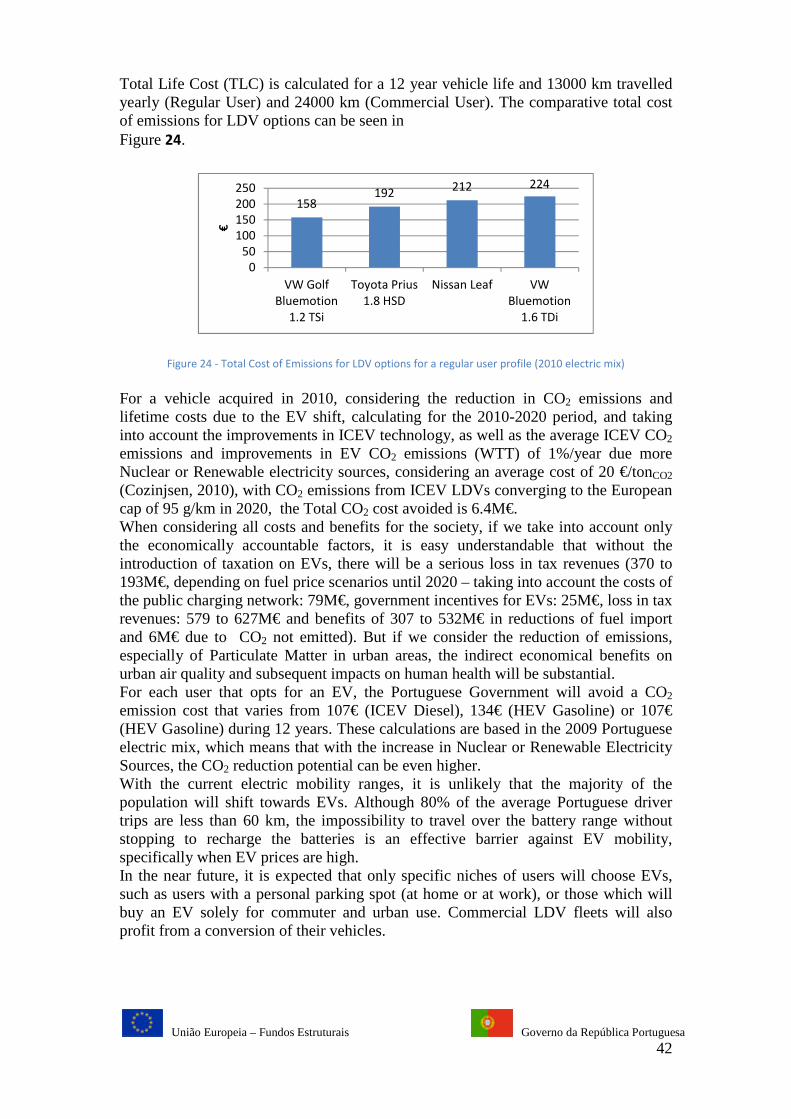
União Europeia – Fundos Estruturais Governo da República Portuguesa 42
Total Life Cost (TLC) is calculated for a 12 year vehicle life and 13000 km travelled yearly (Regular User) and 24000 km (Commercial User). The comparative total cost of emissions for LDV options can be seen in Figure 24.
Figure 24 - Total Cost of Emissions for LDV options for a regular user profile (2010 electric mix)
For a vehicle acquired in 2010, considering the reduction in CO2 emissions and lifetime costs due to the EV shift, calculating for the 2010-2020 period, and taking into account the improvements in ICEV technology, as well as the average ICEV CO2 emissions and improvements in EV CO2 emissions (WTT) of 1%/year due more Nuclear or Renewable electricity sources, considering an average cost of 20 €/tonCO2
(Cozinjsen, 2010), with CO2 emissions from ICEV LDVs converging to the European cap of 95 g/km in 2020, the Total CO2 cost avoided is 6.4M€. When considering all costs and benefits for the society, if we take into account only the economically accountable factors, it is easy understandable that without the introduction of taxation on EVs, there will be a serious loss in tax revenues (370 to 193M€, depending on fuel price scenarios until 2020 – taking into account the costs of the public charging network: 79M€, government incentives for EVs: 25M€, loss in tax revenues: 579 to 627M€ and benefits of 307 to 532M€ in reductions of fuel import and 6M€ due to CO2 not emitted). But if we consider the reduction of emissions, especially of Particulate Matter in urban areas, the indirect economical benefits on urban air quality and subsequent impacts on human health will be substantial. For each user that opts for an EV, the Portuguese Government will avoid a CO2 emission cost that varies from 107€ (ICEV Diesel), 134€ (HEV Gasoline) or 107€ (HEV Gasoline) during 12 years. These calculations are based in the 2009 Portuguese electric mix, which means that with the increase in Nuclear or Renewable Electricity Sources, the CO2 reduction potential can be even higher. With the current electric mobility ranges, it is unlikely that the majority of the population will shift towards EVs. Although 80% of the average Portuguese driver trips are less than 60 km, the impossibility to travel over the battery range without stopping to recharge the batteries is an effective barrier against EV mobility, specifically when EV prices are high. In the near future, it is expected that only specific niches of users will choose EVs, such as users with a personal parking spot (at home or at work), or those which will buy an EV solely for commuter and urban use. Commercial LDV fleets will also profit from a conversion of their vehicles.
158192
212 224
0
50
100
150
200
250
VW Golf
Bluemotion
1.2 TSi
Toyota Prius
1.8 HSD
Nissan Leaf VW
Bluemotion
1.6 TDi
€
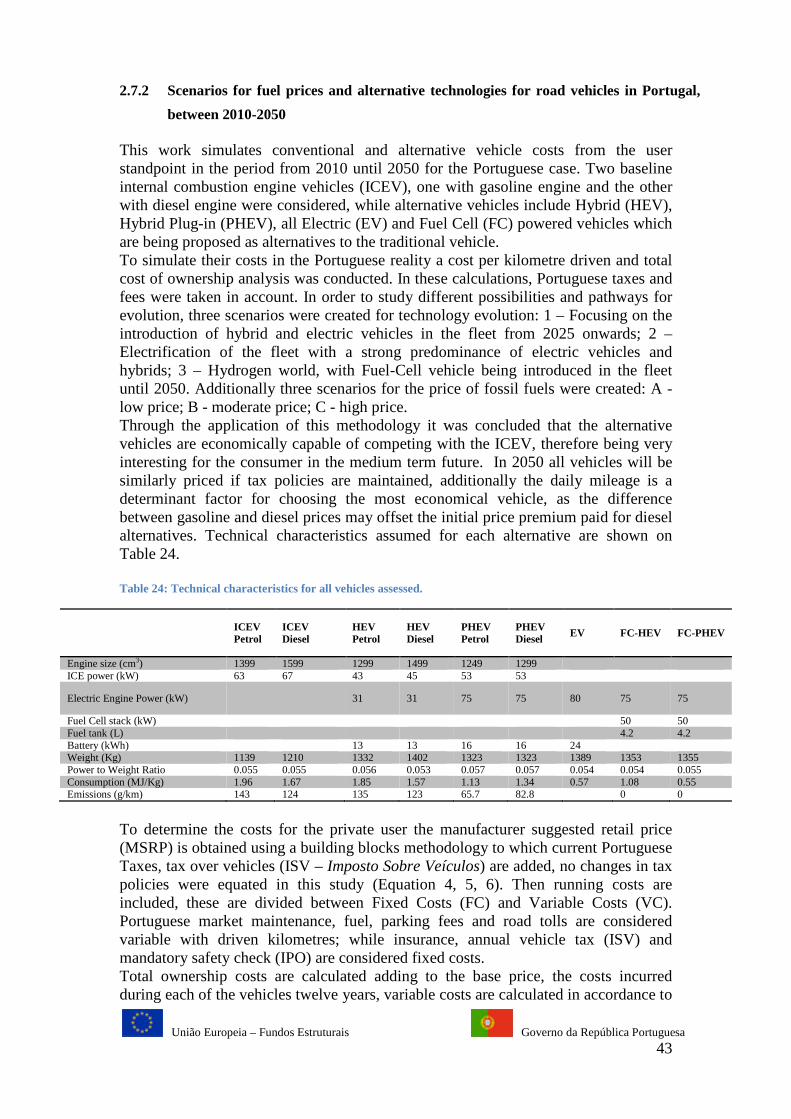
União Europeia – Fundos Estruturais Governo da República Portuguesa 43
2.7.2 Scenarios for fuel prices and alternative technologies for road vehicles in Portugal,
between 2010-2050 This work simulates conventional and alternative vehicle costs from the user standpoint in the period from 2010 until 2050 for the Portuguese case. Two baseline internal combustion engine vehicles (ICEV), one with gasoline engine and the other with diesel engine were considered, while alternative vehicles include Hybrid (HEV), Hybrid Plug-in (PHEV), all Electric (EV) and Fuel Cell (FC) powered vehicles which are being proposed as alternatives to the traditional vehicle. To simulate their costs in the Portuguese reality a cost per kilometre driven and total cost of ownership analysis was conducted. In these calculations, Portuguese taxes and fees were taken in account. In order to study different possibilities and pathways for evolution, three scenarios were created for technology evolution: 1 – Focusing on the introduction of hybrid and electric vehicles in the fleet from 2025 onwards; 2 – Electrification of the fleet with a strong predominance of electric vehicles and hybrids; 3 – Hydrogen world, with Fuel-Cell vehicle being introduced in the fleet until 2050. Additionally three scenarios for the price of fossil fuels were created: A - low price; B - moderate price; C - high price. Through the application of this methodology it was concluded that the alternative vehicles are economically capable of competing with the ICEV, therefore being very interesting for the consumer in the medium term future. In 2050 all vehicles will be similarly priced if tax policies are maintained, additionally the daily mileage is a determinant factor for choosing the most economical vehicle, as the difference between gasoline and diesel prices may offset the initial price premium paid for diesel alternatives. Technical characteristics assumed for each alternative are shown on Table 24. Table 24: Technical characteristics for all vehicles assessed.
ICEV Petrol
ICEV Diesel
HEV Petrol
HEV Diesel
PHEV Petrol
PHEV Diesel EV FC-HEV FC-PHEV
Engine size (cm3) 1399 1599 1299 1499 1249 1299 ICE power (kW) 63 67 43 45 53 53
Electric Engine Power (kW) 31 31 75 75 80 75 75
Fuel Cell stack (kW) 50 50 Fuel tank (L) 4.2 4.2 Battery (kWh) 13 13 16 16 24 Weight (Kg) 1139 1210 1332 1402 1323 1323 1389 1353 1355 Power to Weight Ratio 0.055 0.055 0.056 0.053 0.057 0.057 0.054 0.054 0.055 Consumption (MJ/Kg) 1.96 1.67 1.85 1.57 1.13 1.34 0.57 1.08 0.55 Emissions (g/km) 143 124 135 123 65.7 82.8 0 0
To determine the costs for the private user the manufacturer suggested retail price (MSRP) is obtained using a building blocks methodology to which current Portuguese Taxes, tax over vehicles (ISV – Imposto Sobre Veículos) are added, no changes in tax policies were equated in this study (Equation 4, 5, 6). Then running costs are included, these are divided between Fixed Costs (FC) and Variable Costs (VC). Portuguese market maintenance, fuel, parking fees and road tolls are considered variable with driven kilometres; while insurance, annual vehicle tax (ISV) and mandatory safety check (IPO) are considered fixed costs. Total ownership costs are calculated adding to the base price, the costs incurred during each of the vehicles twelve years, variable costs are calculated in accordance to
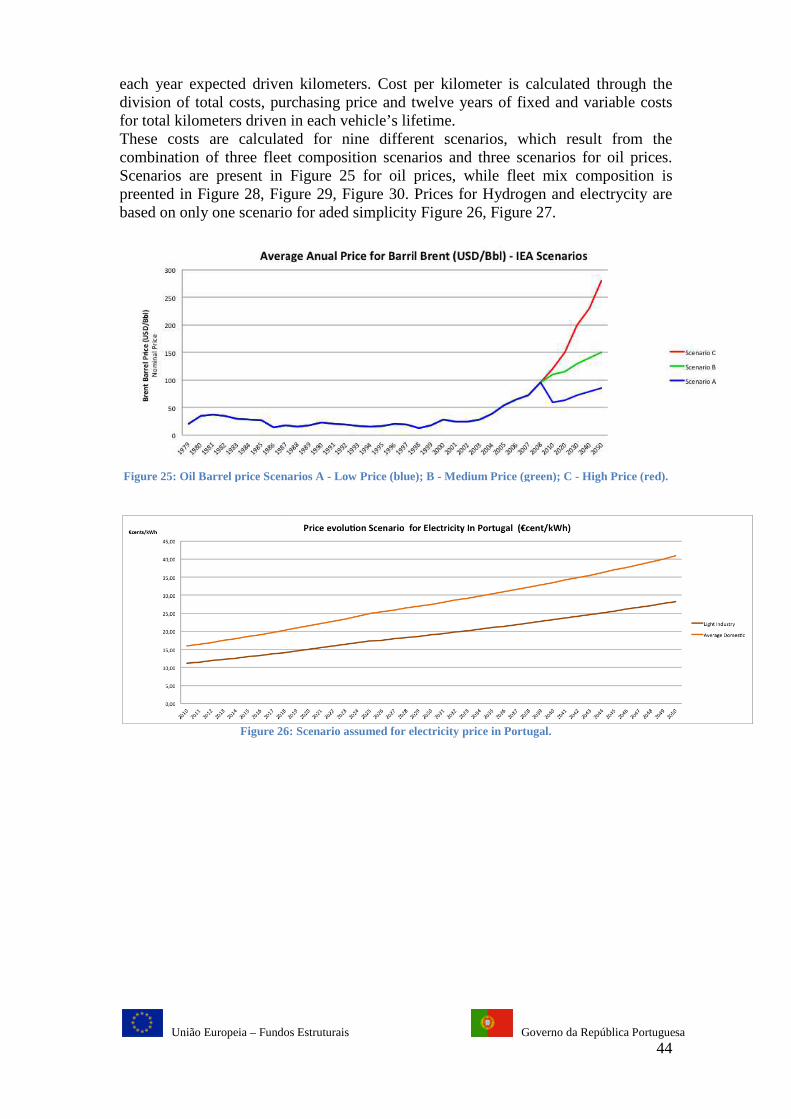
União Europeia – Fundos Estruturais
each year expected driven kilometers.division of total costs, purchasing price and twelve years of fixed and variable costs for total kilometers driven in each vehicle’s lifetime.These costs are calculated for nine different scenarios, which resucombination of three fleet composition scenarios and three scenarios for oil prices.Scenarios are present in preented in Figure 28, Figure based on only one scenario for aded simplicity
Figure 25: Oil Barrel price Scenarios A
Figure 26
Fundos Estruturais Governo da República Portuguesa
each year expected driven kilometers. Cost per kilometer is calculated through the division of total costs, purchasing price and twelve years of fixed and variable costs for total kilometers driven in each vehicle’s lifetime. These costs are calculated for nine different scenarios, which resucombination of three fleet composition scenarios and three scenarios for oil prices.Scenarios are present in Figure 25 for oil prices, while fleet mix composition is
Figure 29, Figure 30. Prices for Hydrogen and electrycity are based on only one scenario for aded simplicity Figure 26, Figure 27.
: Oil Barrel price Scenarios A - Low Price (blue); B - Medium Price (green); C
26: Scenario assumed for electricity price in Portugal.
Governo da República Portuguesa 44
Cost per kilometer is calculated through the division of total costs, purchasing price and twelve years of fixed and variable costs
These costs are calculated for nine different scenarios, which result from the combination of three fleet composition scenarios and three scenarios for oil prices.
for oil prices, while fleet mix composition is . Prices for Hydrogen and electrycity are
Medium Price (green); C - High Price (red).
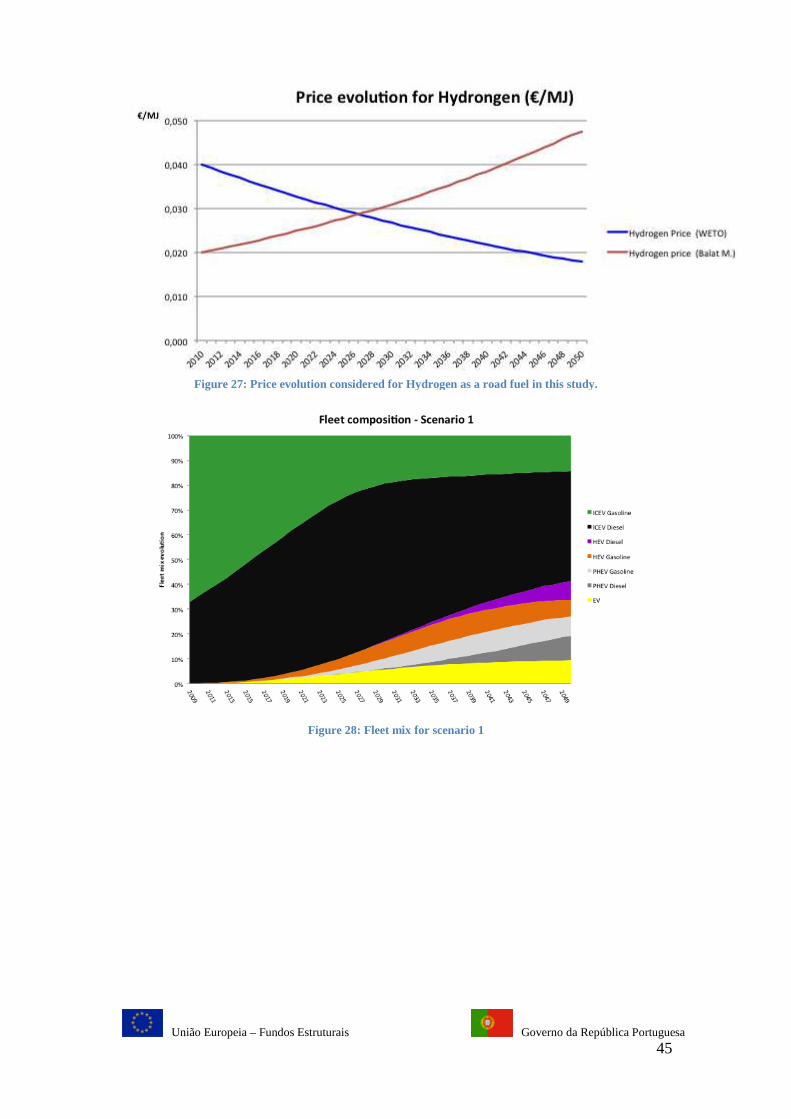
União Europeia – Fundos Estruturais
Figure 27: Price evolut
Fundos Estruturais Governo da República Portuguesa
: Price evolution considered for Hydrogen as a road fuel in this study.
Figure 28: Fleet mix for scenario 1
Governo da República Portuguesa 45
ion considered for Hydrogen as a road fuel in this study.

União Europeia – Fundos Estruturais
��� = �%� + �� & �1 +
€ ) *+ = �,-./0�&�1./20∑ 456786
9��� = �%� + �� & �1
Fundos Estruturais Governo da República Portuguesa
Figure 29: Fleet mix for scenario 2.
Figure 30: Fleet mix for scenario 3.
� + �� +#��� +1:
;#� �� & *+�1:
;�
/20�.∑ <=67866
+ ∑ � ���1:;
+ ��
Governo da República Portuguesa 46
(5)
(6)
(4)

União Europeia – Fundos Estruturais
Each of these mixes assumed for the fleet represewhich result in different prices during the years. Through a learning curve model a possible price variation for batteries and fuel cell is obtained.
Table 25: Kilometres driven in each year of usef
In forehand it is presented the price evolution expected for each scenario of fleet mix.Scenario 1 and 2 are similar in the beginning with a simlar starting price in 2010. However the larger number of alternative vehicles lower pricer sooner. In 2015 it can be expected that PHEV and EV to have a similar price to a Diesel powered ICEV reduci000€ an 18% reduction in 5 years, whilist on scenario 1 aonly happen close to 2020. In comparison with ICEV Gasoline the will is expected to achive a similar retail sale price by 2030, if scenario 2 conditions are met whilist on scenario 1 it won’t be abel tto undercut the ICEV GasoliThe results obtained show that in the medium term alternative vehicles will have a similar, if not lower, retail price to the matching ICEV. No changes in tax benefits were considered for this study. This benefit represents a 50% rebate for PHEV’s in ISV and 100% for EV and FC vehicles.
Fundos Estruturais Governo da República Portuguesa
Each of these mixes assumed for the fleet represent different evolution pathways, which result in different prices during the years. Through a learning curve model a possible price variation for batteries and fuel cell is obtained.
: Kilometres driven in each year of useful life. (P.Baptista, 2009)
In forehand it is presented the price evolution expected for each scenario of fleet mix.Scenario 1 and 2 are similar in the beginning with a simlar starting price in 2010. However the larger number of alternative vehicles considered for scenario 2 alows a lower pricer sooner. In 2015 it can be expected that PHEV and EV to have a similar price to a Diesel powered ICEV reducing their price form close to 40
€ an 18% reduction in 5 years, whilist on scenario 1 a equivalent reduction will only happen close to 2020. In comparison with ICEV Gasoline the will is expected to achive a similar retail sale price by 2030, if scenario 2 conditions are met whilist on scenario 1 it won’t be abel tto undercut the ICEV Gasoline sale price. The results obtained show that in the medium term alternative vehicles will have a similar, if not lower, retail price to the matching ICEV. No changes in tax benefits were considered for this study. This benefit represents a 50% rebate for PHEV’s in ISV and 100% for EV and FC vehicles.
Governo da República Portuguesa 47
nt different evolution pathways, which result in different prices during the years. Through a learning curve model a
In forehand it is presented the price evolution expected for each scenario of fleet mix. Scenario 1 and 2 are similar in the beginning with a simlar starting price in 2010.
considered for scenario 2 alows a lower pricer sooner. In 2015 it can be expected that PHEV and EV to have a similar
ng their price form close to 40 000€ to 33 equivalent reduction will
only happen close to 2020. In comparison with ICEV Gasoline the will is expected to achive a similar retail sale price by 2030, if scenario 2 conditions are met whilist on
The results obtained show that in the medium term alternative vehicles will have a similar, if not lower, retail price to the matching ICEV. No changes in tax benefits were considered for this study. This benefit represents a 50% rebate for HEV’s and
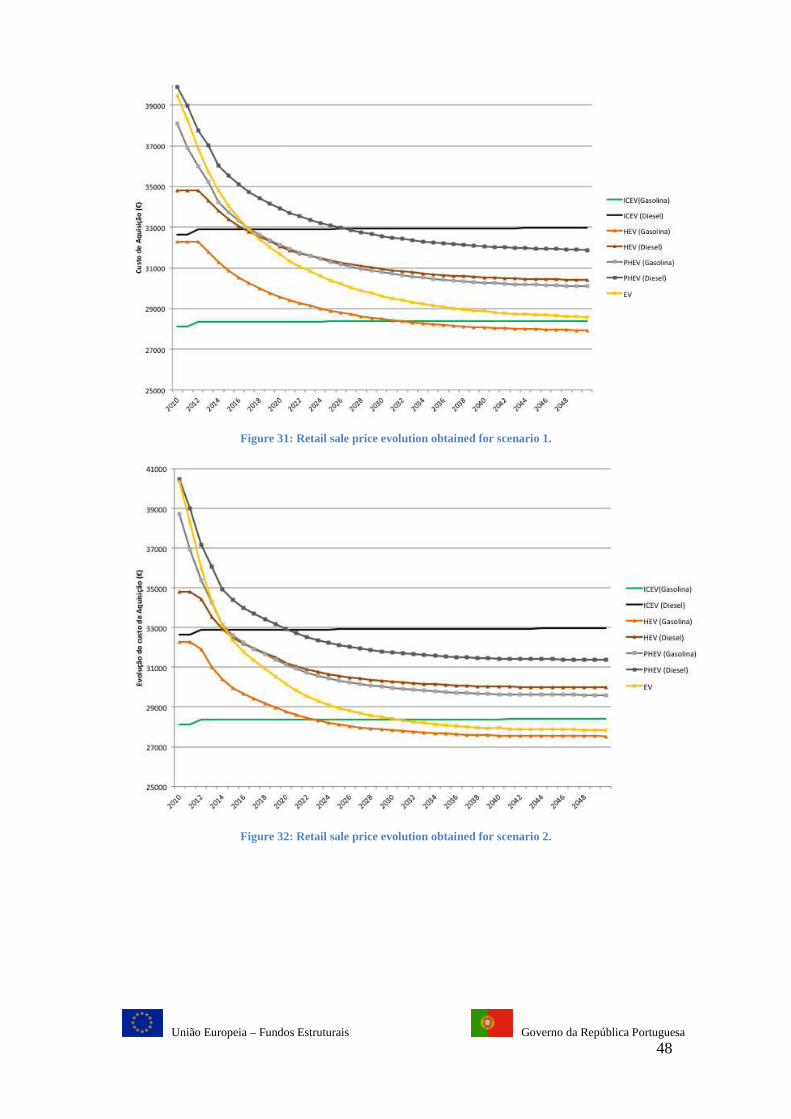
União Europeia – Fundos Estruturais
Figure 31
Figure 32
Fundos Estruturais Governo da República Portuguesa
31: Retail sale price evolution obtained for scenario 1.
32: Retail sale price evolution obtained for scenario 2.
Governo da República Portuguesa 48
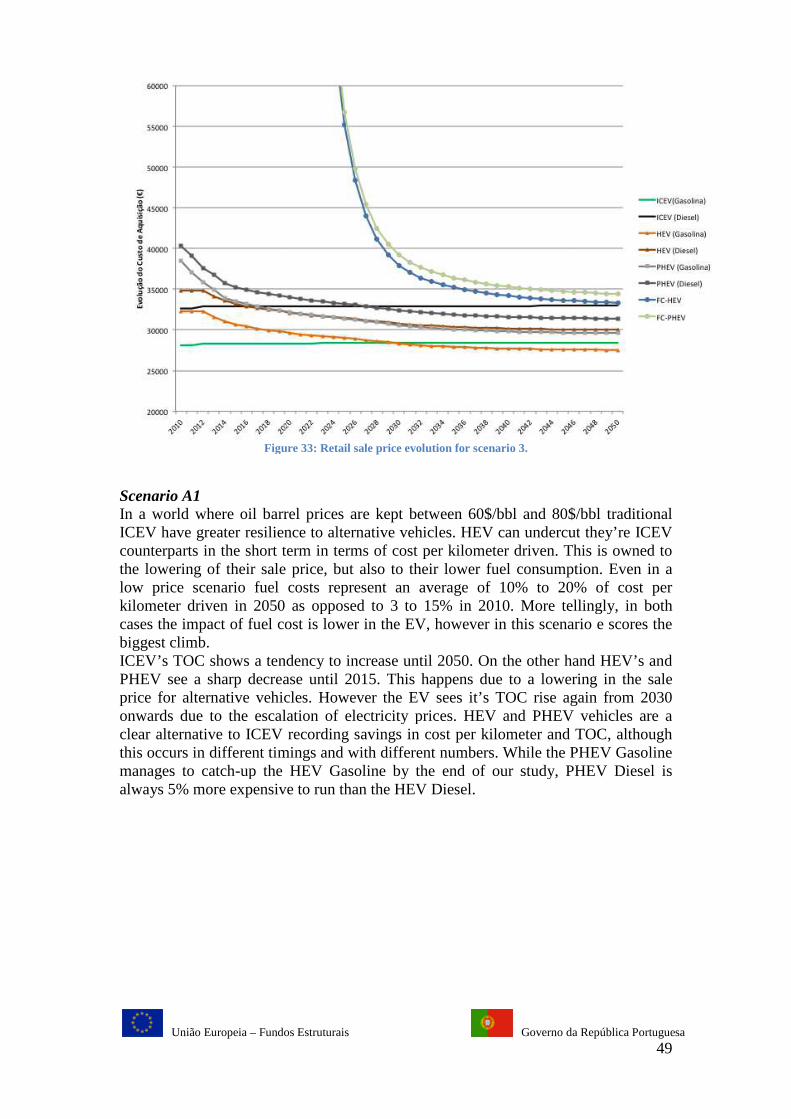
União Europeia – Fundos Estruturais
Figure
Scenario A1 In a world where oil barrel prices are kept between 60$/bbl and 80$/bbl traditional ICEV have greater resilience to alternative vehicles. counterparts in the short term in terms of cost per kilometer driven. This is owned to the lowering of their sale price, but also to their lower fuel consumption. Even in a low price scenario fuel costs represent an average of 10% to 20% of cost per kilometer driven in 2050 as opposed to 3 to 15% in 2010. More tellingly, in both cases the impact of fuel cost is lower in the EV, however in this scenario e scores the biggest climb. ICEV’s TOC shows a tendency to increase until 2050. On the other hand HEV’s and PHEV see a sharp decrease until 2015. This happens due to a lowering in the sale price for alternative vehicles. However the EV sees it’s TOC rise again from 2030 onwards due to the escalation of electricity prices. HEV and PHEV vehicles are a clear alternative to ICEV recording savings in cost per kilometer and TOC, although this occurs in different timings and with different numbers. While the PHEV Gasoline manages to catch-up the HEV Gasoline by the end of our study, PHEV Diesel is always 5% more expensive
Fundos Estruturais Governo da República Portuguesa
Figure 33: Retail sale price evolution for scenario 3.
In a world where oil barrel prices are kept between 60$/bbl and 80$/bbl traditional ICEV have greater resilience to alternative vehicles. HEV can undercut
rparts in the short term in terms of cost per kilometer driven. This is owned to the lowering of their sale price, but also to their lower fuel consumption. Even in a low price scenario fuel costs represent an average of 10% to 20% of cost per
iven in 2050 as opposed to 3 to 15% in 2010. More tellingly, in both cases the impact of fuel cost is lower in the EV, however in this scenario e scores the
ICEV’s TOC shows a tendency to increase until 2050. On the other hand HEV’s and V see a sharp decrease until 2015. This happens due to a lowering in the sale
price for alternative vehicles. However the EV sees it’s TOC rise again from 2030 onwards due to the escalation of electricity prices. HEV and PHEV vehicles are a
ve to ICEV recording savings in cost per kilometer and TOC, although this occurs in different timings and with different numbers. While the PHEV Gasoline
up the HEV Gasoline by the end of our study, PHEV Diesel is always 5% more expensive to run than the HEV Diesel.
Governo da República Portuguesa 49
In a world where oil barrel prices are kept between 60$/bbl and 80$/bbl traditional can undercut they’re ICEV
rparts in the short term in terms of cost per kilometer driven. This is owned to the lowering of their sale price, but also to their lower fuel consumption. Even in a low price scenario fuel costs represent an average of 10% to 20% of cost per
iven in 2050 as opposed to 3 to 15% in 2010. More tellingly, in both cases the impact of fuel cost is lower in the EV, however in this scenario e scores the
ICEV’s TOC shows a tendency to increase until 2050. On the other hand HEV’s and V see a sharp decrease until 2015. This happens due to a lowering in the sale
price for alternative vehicles. However the EV sees it’s TOC rise again from 2030 onwards due to the escalation of electricity prices. HEV and PHEV vehicles are a
ve to ICEV recording savings in cost per kilometer and TOC, although this occurs in different timings and with different numbers. While the PHEV Gasoline
up the HEV Gasoline by the end of our study, PHEV Diesel is
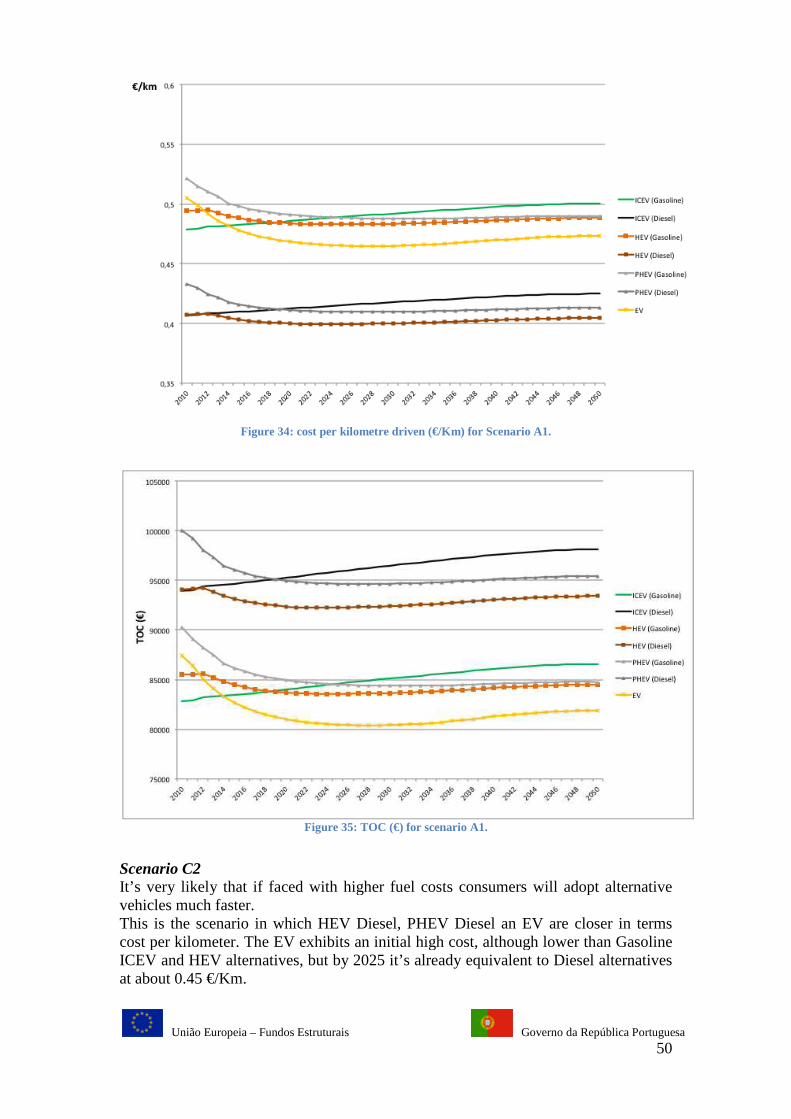
União Europeia – Fundos Estruturais
Figure 34
Scenario C2 It’s very likely that if faced with higher fuel costs consumersvehicles much faster. This is the scenario in which HEV Diesel, PHEV Diesel an EV are closer in terms cost per kilometer. The EV exhibits an initial high cost, although lower than Gasoline ICEV and HEV alternatives, but by 2025 it’sat about 0.45 €/Km.
Fundos Estruturais Governo da República Portuguesa
34: cost per kilometre driven (€/Km) for Scenario A1.
Figure 35: TOC (€) for scenario A1.
It’s very likely that if faced with higher fuel costs consumers will adopt alternative
This is the scenario in which HEV Diesel, PHEV Diesel an EV are closer in terms cost per kilometer. The EV exhibits an initial high cost, although lower than Gasoline ICEV and HEV alternatives, but by 2025 it’s already equivalent to Diesel alternatives
Governo da República Portuguesa 50
will adopt alternative
This is the scenario in which HEV Diesel, PHEV Diesel an EV are closer in terms cost per kilometer. The EV exhibits an initial high cost, although lower than Gasoline
already equivalent to Diesel alternatives
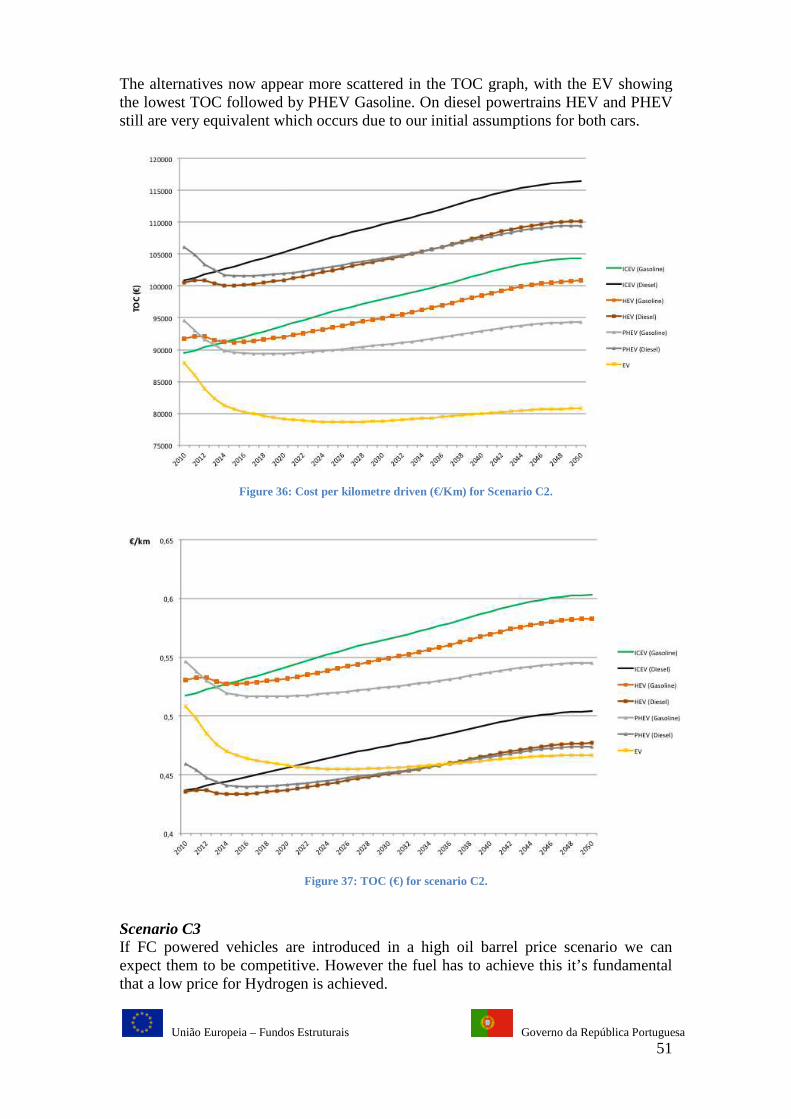
União Europeia – Fundos Estruturais
The alternatives now appear more scattered in the TOC graph, with the EV showing the lowest TOC followed by PHEV Gasoline. On diesel powertrains HEV and PHEV still are very equivalent which occ
Figure 36
Scenario C3 If FC powered vehicles are introduced inexpect them to be competitive. However the fuel has to achieve this it’s fundamental that a low price for Hydrogen is achieved.
Fundos Estruturais Governo da República Portuguesa
The alternatives now appear more scattered in the TOC graph, with the EV showing the lowest TOC followed by PHEV Gasoline. On diesel powertrains HEV and PHEV still are very equivalent which occurs due to our initial assumptions for both cars.
36: Cost per kilometre driven (€/Km) for Scenario C2.
Figure 37: TOC (€) for scenario C2.
If FC powered vehicles are introduced in a high oil barrel price scenario we can expect them to be competitive. However the fuel has to achieve this it’s fundamental that a low price for Hydrogen is achieved.
Governo da República Portuguesa 51
The alternatives now appear more scattered in the TOC graph, with the EV showing the lowest TOC followed by PHEV Gasoline. On diesel powertrains HEV and PHEV
urs due to our initial assumptions for both cars.
a high oil barrel price scenario we can expect them to be competitive. However the fuel has to achieve this it’s fundamental

União Europeia – Fundos Estruturais
The results obtained show that FCGasoline and Diesel alternatives making a compelling case from the consumer standpoint. It’s possible to achieve a 0.5which is less than 5% higher than that of PHEV and HEV Diesels.Overall TOC for FC vehicles are the lowscenario.
Figure 38
If we plot the average results for cost per kilomgraphic, Figure 40, we obtain the variation intervals for each vehicle in this study.
75000
80000
85000
90000
95000
100000
105000
110000
115000
120000
2010
2012
2014
2016
2018
2020
TO
C (
€)
Fundos Estruturais Governo da República Portuguesa
The results obtained show that FC-HEV and FC-HEV can be competitive with both and Diesel alternatives making a compelling case from the consumer
standpoint. It’s possible to achieve a 0.5€/km for both vehicles after 2040, a value which is less than 5% higher than that of PHEV and HEV Diesels. Overall TOC for FC vehicles are the lowest of any alternatives after 2035 in this
38: Cost per Kilometre driven (€/Km) for Scenario C3.
Figure 39: TOC (€) for scenario C3.
If we plot the average results for cost per kilometre obtained for each vehicle in a , we obtain the variation intervals for each vehicle in this study.
020
2022
2024
2026
2028
2030
2032
2034
2036
2038
2040
2042
2044
2046
2048
Governo da República Portuguesa 52
HEV can be competitive with both and Diesel alternatives making a compelling case from the consumer
€/km for both vehicles after 2040, a value
est of any alternatives after 2035 in this
etre obtained for each vehicle in a , we obtain the variation intervals for each vehicle in this study.
2048
2050
ICEV(Gasolina)
ICEV (Diesel)
HEV (Gasolina)
HEV (Diesel)
PHEV (Gasolina)
PHEV (Diesel)
FC-HEV
FC-PHEV
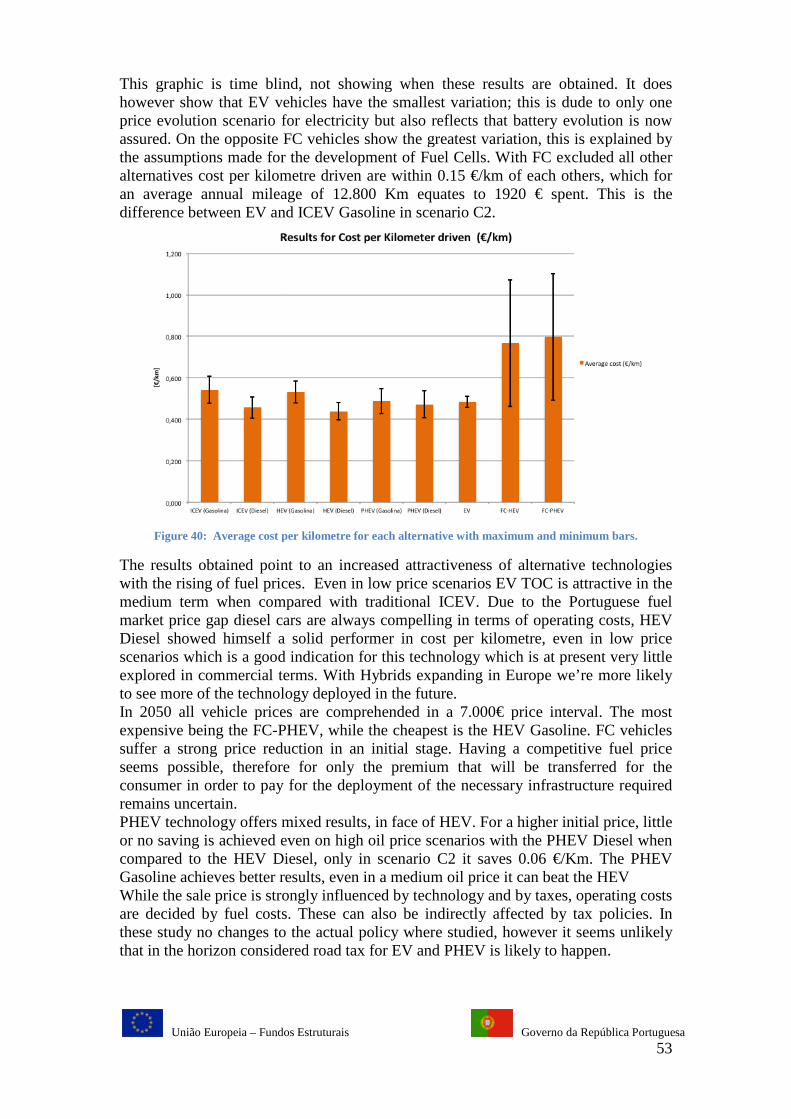
União Europeia – Fundos Estruturais
This graphic is time blind, not showing when these results are obtained. It does however show that EV vehiclprice evolution scenario for electricity but also reflects that battery evolution is now assured. On the opposite FC vehicles show the greatest variation, this is explained by the assumptions made for the development of Fuel Cells. With FC excluded all other alternatives cost per kilometre driven are within 0.15 an average annual mileage of 12.800 Km equates to 1920 difference between EV and ICEV Gas
Figure 40: Average cost per kilometre for each alternative with maximum and minimum bars.
The results obtained point to an increased attractiveness of alternative technologies with the rising of fuel pricesmedium term when compared with traditional ICEV. Due to the Portuguese fuel market price gap diesel cars are always compelling in terms of operating costs, HEV Diesel showed himself a solid performscenarios which is a good indication for this technology which is at present very little explored in commercial terms. With Hybrids expanding in Europe we’re more likely to see more of the technology deployed in In 2050 all vehicle prices are comprehended in a 7.000expensive being the FC-PHEV, while the cheapest is the HEV Gasoline. FC vehicles suffer a strong price reduction in an initial stage. Having a competitive fuel price seems possible, therefore for only the premium that will be transferred for the consumer in order to pay for the deployment of the necessary infrastructure required remains uncertain. PHEV technology offers mixed results, in face of HEV. For a higher initial price,or no saving is achieved even on high oil price scenarios with the PHEV Diesel when compared to the HEV Diesel, only in scenario CGasoline achieves better results, even in a medium oil price it can beat the HEVWhile the sale price is strongly influenced by technology and by taxes, operating costs are decided by fuel costs. These can also be indirectly these study no changes to the actual policy where studied, however it seems unlikely that in the horizon considered road tax for EV and PHEV is likely to happen.
Fundos Estruturais Governo da República Portuguesa
This graphic is time blind, not showing when these results are obtained. It does however show that EV vehicles have the smallest variation; this is dude to only one price evolution scenario for electricity but also reflects that battery evolution is now assured. On the opposite FC vehicles show the greatest variation, this is explained by
r the development of Fuel Cells. With FC excluded all other alternatives cost per kilometre driven are within 0.15 €/km of each others, which for an average annual mileage of 12.800 Km equates to 1920 € spent. This is the difference between EV and ICEV Gasoline in scenario C2.
: Average cost per kilometre for each alternative with maximum and minimum bars.
The results obtained point to an increased attractiveness of alternative technologies with the rising of fuel prices. Even in low price scenarios EV TOC is attractive in the medium term when compared with traditional ICEV. Due to the Portuguese fuel market price gap diesel cars are always compelling in terms of operating costs, HEV Diesel showed himself a solid performer in cost per kilometre, even in low price scenarios which is a good indication for this technology which is at present very little explored in commercial terms. With Hybrids expanding in Europe we’re more likely to see more of the technology deployed in the future. In 2050 all vehicle prices are comprehended in a 7.000€ price interval. The most
PHEV, while the cheapest is the HEV Gasoline. FC vehicles suffer a strong price reduction in an initial stage. Having a competitive fuel price
sible, therefore for only the premium that will be transferred for the consumer in order to pay for the deployment of the necessary infrastructure required
PHEV technology offers mixed results, in face of HEV. For a higher initial price,or no saving is achieved even on high oil price scenarios with the PHEV Diesel when compared to the HEV Diesel, only in scenario C2 it saves 0.06 €/Km. The PHEV Gasoline achieves better results, even in a medium oil price it can beat the HEVWhile the sale price is strongly influenced by technology and by taxes, operating costs are decided by fuel costs. These can also be indirectly affected by tax policies. In these study no changes to the actual policy where studied, however it seems unlikely that in the horizon considered road tax for EV and PHEV is likely to happen.
Governo da República Portuguesa 53
This graphic is time blind, not showing when these results are obtained. It does es have the smallest variation; this is dude to only one
price evolution scenario for electricity but also reflects that battery evolution is now assured. On the opposite FC vehicles show the greatest variation, this is explained by
r the development of Fuel Cells. With FC excluded all other €/km of each others, which for
€ spent. This is the
: Average cost per kilometre for each alternative with maximum and minimum bars.
The results obtained point to an increased attractiveness of alternative technologies . Even in low price scenarios EV TOC is attractive in the
medium term when compared with traditional ICEV. Due to the Portuguese fuel market price gap diesel cars are always compelling in terms of operating costs, HEV
er in cost per kilometre, even in low price scenarios which is a good indication for this technology which is at present very little explored in commercial terms. With Hybrids expanding in Europe we’re more likely
€ price interval. The most PHEV, while the cheapest is the HEV Gasoline. FC vehicles
suffer a strong price reduction in an initial stage. Having a competitive fuel price sible, therefore for only the premium that will be transferred for the
consumer in order to pay for the deployment of the necessary infrastructure required
PHEV technology offers mixed results, in face of HEV. For a higher initial price, little or no saving is achieved even on high oil price scenarios with the PHEV Diesel when
€/Km. The PHEV Gasoline achieves better results, even in a medium oil price it can beat the HEV While the sale price is strongly influenced by technology and by taxes, operating costs
affected by tax policies. In these study no changes to the actual policy where studied, however it seems unlikely that in the horizon considered road tax for EV and PHEV is likely to happen.
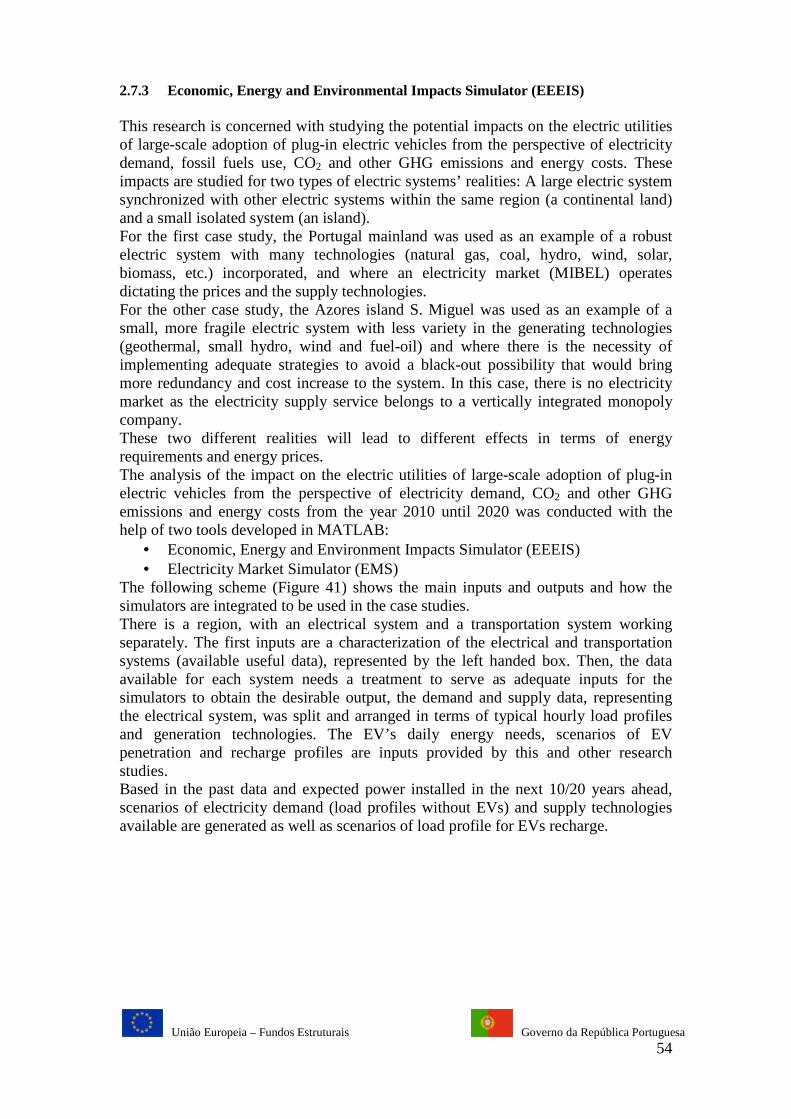
União Europeia – Fundos Estruturais Governo da República Portuguesa 54
2.7.3 Economic, Energy and Environmental Impacts Simulator (EEEIS) This research is concerned with studying the potential impacts on the electric utilities of large-scale adoption of plug-in electric vehicles from the perspective of electricity demand, fossil fuels use, CO2 and other GHG emissions and energy costs. These impacts are studied for two types of electric systems’ realities: A large electric system synchronized with other electric systems within the same region (a continental land) and a small isolated system (an island). For the first case study, the Portugal mainland was used as an example of a robust electric system with many technologies (natural gas, coal, hydro, wind, solar, biomass, etc.) incorporated, and where an electricity market (MIBEL) operates dictating the prices and the supply technologies. For the other case study, the Azores island S. Miguel was used as an example of a small, more fragile electric system with less variety in the generating technologies (geothermal, small hydro, wind and fuel-oil) and where there is the necessity of implementing adequate strategies to avoid a black-out possibility that would bring more redundancy and cost increase to the system. In this case, there is no electricity market as the electricity supply service belongs to a vertically integrated monopoly company. These two different realities will lead to different effects in terms of energy requirements and energy prices. The analysis of the impact on the electric utilities of large-scale adoption of plug-in electric vehicles from the perspective of electricity demand, CO2 and other GHG emissions and energy costs from the year 2010 until 2020 was conducted with the help of two tools developed in MATLAB:
• Economic, Energy and Environment Impacts Simulator (EEEIS) • Electricity Market Simulator (EMS)
The following scheme (Figure 41) shows the main inputs and outputs and how the simulators are integrated to be used in the case studies. There is a region, with an electrical system and a transportation system working separately. The first inputs are a characterization of the electrical and transportation systems (available useful data), represented by the left handed box. Then, the data available for each system needs a treatment to serve as adequate inputs for the simulators to obtain the desirable output, the demand and supply data, representing the electrical system, was split and arranged in terms of typical hourly load profiles and generation technologies. The EV’s daily energy needs, scenarios of EV penetration and recharge profiles are inputs provided by this and other research studies. Based in the past data and expected power installed in the next 10/20 years ahead, scenarios of electricity demand (load profiles without EVs) and supply technologies available are generated as well as scenarios of load profile for EVs recharge.
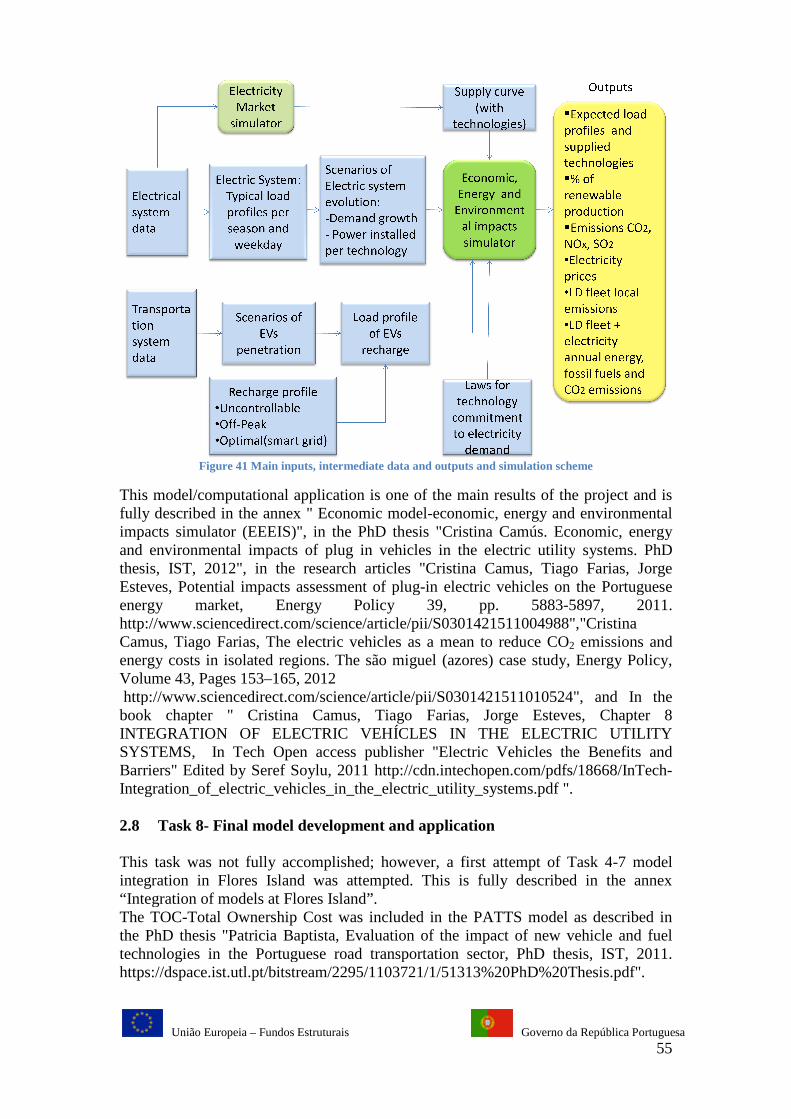
União Europeia – Fundos Estruturais
Figure 41 Main inputs, intermediate data and outputs and simulation scheme
This model/computational application is one of the main results of the project and is fully described in the annex "impacts simulator (EEEIS)and environmental impacts of plug in vehicles in the electric utilitythesis, IST, 2012", in the research articles "Esteves, Potential impacts assessment of plugenergy market, Energy Policy 39, pp. 5883http://www.sciencedirect.com/science/article/pii/S0301421511004988",Camus, Tiago Farias, The electric vehicles as a mean to reduce COenergy costs in isolated regions. The são miguel (azores) case study, Energy Policy, Volume 43, Pages 153–165, 2012 http://www.sciencedirect.com/science/article/pii/S03014215110book chapter " Cristina Camus, Tiago Farias, Jorge Esteves, Chapter 8 INTEGRATION OF ELECTRIC VEHÍCLES IN THE ELECTRIC UTILITY SYSTEMS, In Tech Open access publisher "Electric Vehicles the Benefits and Barriers" Edited by Seref Soylu, 2Integration_of_electric_vehicles_in_the_electric_utility_systems.pdf 2.8 Task 8- Final model development and application This task was not fully accomplishedintegration in Flores Island was attempted. “Integration of models at Flores Island”. The TOC-Total Ownership Cost wthe PhD thesis "Patricia Baptista, Evaluation of the impact technologies in the Portuguese road transportationhttps://dspace.ist.utl.pt/bitstream/2295/1103721/1/51313%20PhD%20Thesis.pdf
Fundos Estruturais Governo da República Portuguesa
Main inputs, intermediate data and outputs and simulation scheme
This model/computational application is one of the main results of the project and is fully described in the annex " Economic model-economic, energy and environmental impacts simulator (EEEIS)", in the PhD thesis "Cristina Camús. Economic, energy and environmental impacts of plug in vehicles in the electric utilitythesis, IST, 2012", in the research articles "Cristina Camus, Tiago Farias, Jorge Esteves, Potential impacts assessment of plug-in electric vehicles on the Portuguese energy market, Energy Policy 39, pp. 5883-5897http://www.sciencedirect.com/science/article/pii/S0301421511004988",
us, Tiago Farias, The electric vehicles as a mean to reduce CO2energy costs in isolated regions. The são miguel (azores) case study, Energy Policy,
165, 2012 http://www.sciencedirect.com/science/article/pii/S0301421511010524
Cristina Camus, Tiago Farias, Jorge Esteves, Chapter 8 INTEGRATION OF ELECTRIC VEHÍCLES IN THE ELECTRIC UTILITY SYSTEMS, In Tech Open access publisher "Electric Vehicles the Benefits and Barriers" Edited by Seref Soylu, 2011 http://cdn.intechopen.com/pdfs/18668/InTechIntegration_of_electric_vehicles_in_the_electric_utility_systems.pdf ".
Final model development and application
accomplished; however, a first attempt of Task 4ration in Flores Island was attempted. This is fully described
“Integration of models at Flores Island”. Total Ownership Cost was included in the PATTS model
Patricia Baptista, Evaluation of the impact of new vehicle and fuel technologies in the Portuguese road transportation sector, PhD thesis, IST, 2011. https://dspace.ist.utl.pt/bitstream/2295/1103721/1/51313%20PhD%20Thesis.pdf
Governo da República Portuguesa 55
Main inputs, intermediate data and outputs and simulation scheme
This model/computational application is one of the main results of the project and is economic, energy and environmental
Cristina Camús. Economic, energy and environmental impacts of plug in vehicles in the electric utility systems. PhD
Cristina Camus, Tiago Farias, Jorge in electric vehicles on the Portuguese
5897, 2011. http://www.sciencedirect.com/science/article/pii/S0301421511004988","Cristina
2 emissions and energy costs in isolated regions. The são miguel (azores) case study, Energy Policy,
10524", and In the Cristina Camus, Tiago Farias, Jorge Esteves, Chapter 8
INTEGRATION OF ELECTRIC VEHÍCLES IN THE ELECTRIC UTILITY SYSTEMS, In Tech Open access publisher "Electric Vehicles the Benefits and
011 http://cdn.intechopen.com/pdfs/18668/InTech-".
however, a first attempt of Task 4-7 model described in the annex
as included in the PATTS model as described in of new vehicle and fuel
sector, PhD thesis, IST, 2011. https://dspace.ist.utl.pt/bitstream/2295/1103721/1/51313%20PhD%20Thesis.pdf".

União Europeia – Fundos Estruturais Governo da República Portuguesa 56
2.9 Task 9-Dissemination Regarding the dissemination of the project regarding interim and final results, the following publications were achieved (in a total of 64):
1. 2012 Silva C. Research on Electric drive vehicles, 2º encontro de Jovens Investigadores do LAETA, 10-11 de Abril, 2012.
2. 2012 Baptista, P. C. Energy, environmental and economic impact evaluation of the massification of ICT solutions in urban mobility. GET 2012, 5-6 January 2012, Tomar, Portugal.
3. 2012 Ana F. Ferreira, Patricia Moura, Luísa Gouveia and Carla Silva.
Cyanobacteria and microalgae biohydrogen production - Life Cycle Inventory approach and process improvements. WHEC2012 – 19th Word Hydrogen Energy Conference, Toronto, Canada, 3 to 7 of June 2012. http://www.whec2012.com/wp-content/uploads/2012/05/WHEC_ConferenceProgram-Poster-Sessions.pdf
4. 2012 Cristina Camus, Tiago Farias, ELECTRIC VEHICLES AS A MEAN
TO REDUCE, ENERGY, EMISSIONS AND ELECTRICITY COSTS EEM 12 – The 9th International Conference on European Energy Market, Florence May 10-12, 2012.
5. 2012 Cristina Camus, Tiago Farias, The electric vehicles as a mean to reduce
CO2 emissions and energy costs in isolated regions. The são miguel (azores) case study, Energy Policy, Volume 43, Pages 153–165, 2012; http://www.sciencedirect.com/science/article/pii/S0301421511010524
6. 2012 Ana F. Ferreira, Ana C. Marques, Ana P. Batista, Paula A.S.S.
Marques, Luísa Gouveia, Carla M. Silva. Biological hydrogen production by Anabaena sp. -Yield, energy and CO2 analysis including fermentative biomass recovery. International Journal of Hydrogen Energy 37, 179-190, 2012; http://www.sciencedirect.com/science/article/pii/S0360319911021690
7. 2012 Cristina Camús. Economic, energy and environmental impacts of plug
in vehicles in the electric utility systems. PhD thesis, IST, 2012.
8. 2012 Filipe Soares. Impact of the Deployment of Electric Vehicles in Grid Operation and Expansion, PhD thesis, FEUP, 2012. http://metalib.fe.up.pt/V/NJ9VRVVTA4CQPREV6PMGISSHCT5GX9KICC2NDFXPU9F7Y2TI9M-10585?func=quick-3&short-format=002&set_number=259357&set_entry=000001&format=999
9. 2012 Pedro Almeida. Impact of vehicle to grid in the power system dynamic
behaviour, PhD thesis, FEUP, 2012. http://metalib.fe.up.pt/V/NJ9VRVVTA4CQPREV6PMGISSHCT5GX9KICC2NDFXPU9F7Y2TI9M-11351?func=quick-3&short-format=002&set_number=259362&set_entry=000001&format=999
União Europeia – Fundos Estruturais Governo da República Portuguesa 57
10. 2012 F. J. Soares, P. M. Rocha Almeida, J. A. Peças Lopes, Rodrigo Garcia-Valle, ”State of the Art on Different Types of Electric Vehicles,” in “Electric Vehicle Integration into Modern Power Networks,” Springer, 2012. http://www.springer.com/energy/systems%2C+storage+and+harvesting/book/978-1-4614-0133-9
11. 2012 F. J. Soares, P. M. Rocha Almeida, J. A. Peças Lopes, ”Advanced
Models and Simulation Tools to Address the Impacts of Electric Vehicles in the Power System (Steady State and Dynamic Behavior),” in “Electric Vehicle Integration into Modern Power Networks,” Springer, 2012. http://www.springer.com/energy/systems%2C+storage+and+harvesting/book/978-1-4614-0133-9
12. 2012 P. M. Rocha Almeida, F. J. Soares, J. A. Peças Lopes, “Impacts of
Large Scale Deployment of Electric Vehicles in the Electric Power System,” in “Electric Vehicle Integration into Modern Power Networks,” Springer, 2012. http://www.springer.com/energy/systems%2C+storage+and+harvesting/book/978-1-4614-0133-9
13. 2011 P. M. Rocha Almeida, C. L. Moreira, F. Soares, J. A. Peças Lopes, “Exploiting the Potential of Electric Vehicles to Improve Operating Conditions in Islanded Grids”, CIGRÉ 2011, Bologna, Italy, September 2011. http://cigre-bologna2011.ing.unibo.it/images/stories/full_program_cigre_2011_bologna_symposium.pdf
14. 2011 P. M. Rocha Almeida, J. A. Peças Lopes, F. J. Soares, L. Seca, “Electric Vehicles Participating in Frequency Control: Operating Islanded Systems with Large Penetration of Renewable Power Sources”, Powertech 2011, Trondheim, Norway, June, 2011. http://ieeexplore.ieee.org/stamp/stamp.jsp?tp=&arnumber=6019424&isnumber=6019147
15. 2011 F. J. Soares, J. A. Peças Lopes, P. M. Rocha Almeida, C. L. Moreira,
Luís Seca, “A Stochastic Model to Simulate Electric Vehicles Motion and Quantify the Energy Required from the Grid”, PSCC 2011, Stockholm, Sweden, August, 2011. http://www.pscc-central.org/uploads/tx_ethpublications/fp359.pdf
16. 2011 Ana F. Ferreira, Joana Ortigueira, L. Alves, Luísa Gouveia, Patrícia
Moura, Carla M. Silva – “Energetic and environmental evaluation of microalgae biomass fermentation for biohydrogen production”. 4th Internacional Seminar: Advances in Hydrogen Energy Technologies, Viana do Castelo, Portugal, 10- 11 November 2011. http://repositorio.lneg.pt/handle/10400.9/1432
17. 2011 João P. Ribau, Carla M. Silva. Conventional to Hybrid and Plug-In
Drive-train Taxi Fleet Conversion. European Electric Vehicle Congress, EEVC, Brussels, Belgium, 26-28 October 2011 http://www.sia.fr/files/evenement/onglet/2672/Programme_EEVC.pdf
União Europeia – Fundos Estruturais Governo da República Portuguesa 58
18. 2011 A.F.Ferreira, J.Ribau and C. Silva. Análise de Ciclo de Vida do
Biohidrogénio – sua aplicação a transportes em Portugal. GET 2011, 5-6 January 2011, Estremoz, Portugal https://dspace.ist.utl.pt/bitstream/2295/936970/2/get_2011.pdf
19. 2011 A.F.Ferreira, J. Ribau and C. Silva. Biohydrogen pathways for the
Portuguese road transportation sector - Uncertainty in the LCA analysis. IAMF 2011 8-9 March 2011, Geneve, Switzerland; https://dspace.ist.utl.pt/bitstream/2295/936965/2/biohydrogen%20pathways%20for%20the%20portuguese%20road%20transportation%20sector.pdf
20. 2011 João P. Ribau, Ana F. Ferreira, Carla M. Silva, Hybrid vehicle
alternative fuel converter, energy strategy optimization and application to a fuel cell plug-in hybrid vehicle. IAMF 2011, 8-9 March 2011, Genève, Switzerland https://dspace.ist.utl.pt/bitstream/2295/936968/3/hybrid%20vehicle%20alternative%20fuel%20converter,%20energy%20strategy%20optimization%20and%20application%20to%20a%20fuel%20cell%20plug-in%20hybrid%20vehicle.pdf
21. 2011 Cristina Camus, Tiago Farias, Jorge Esteves, IMPACTS OF
ELECTRIC VEHICLES’ CHARGING STRATEGIES IN THE ELECTRICITY PRICES EEM 11 –The 8th International Conference on European Energy Market, Zagreb May 25-27. http://ieeexplore.ieee.org/stamp/stamp.jsp?arnumber=05953125
22. 2011 J. A. Peças Lopes, F. J. Soares, P. M. Rocha Almeida, “Integration of
Electric Vehicles in the Electric Power System”, Proceedings of the IEEE, vol.99, no. 1, pp. 168–183, Jan. http://ieeexplore.ieee.org/stamp/stamp.jsp?tp=&arnumber=5593864
23. 2011 Christos Ioakimidis, Jorge Borges, Dimitris Savvidis. The use of
Electric Vehicles in Greece: A Case Study. 3rd European Conference SmartGrids & E-Mobility, Munich, October 17th – 18th, 2011.
24. 2011 J. Borges, C. S. Ioakimidis, T. C. de Barros. Fast Charging Station
Business analysis. 3rd European Conference SmartGrids & E-Mobility, Munich, October 17th – 18th, 2011.
25. 2011 Carlos Oliveira. Integração de Veículos Eléctricos em Redes Isoladas,
Tese de mestrado, FEUP, 2011. http://paginas.fe.up.pt/~ee02072/docs/Disserta%C3%A7%C3%A3o%20Carlos%20Oliveira.pdf
26. 2011 Camus, Tiago Farias, Jorge Esteves, Potential impacts assessment of
plug-in electric vehicles on the Portuguese energy market, Energy Policy 39, pp. 5883-5897. http://www.sciencedirect.com/science/article/pii/S0301421511004988
União Europeia – Fundos Estruturais Governo da República Portuguesa 59
27. 2011 Cristina Camus, Tiago Farias, Jorge Esteves, Chapter 8 INTEGRATION OF ELECTRIC VEHÍCLES IN THE ELECTRIC UTILITY SYSTEMS, In Tech Open access publisher "Electric Vehicles the Benefits and Barriers" Edited by Seref Soylu, 2011 http://cdn.intechopen.com/pdfs/18668/InTech-Integration_of_electric_vehicles_in_the_electric_utility_systems.pdf
28. 2011 Ferreira AF, Ribau JP, Silva CM. Energy consumption and CO2
emissions of potato peel and sugarcane biohydrogen production pathways, applied to Portuguese road transportation, International Journal of Hydrogen Energy. 36, 13547-13558, 2011. http://www.sciencedirect.com/science/article/pii/S0360319911018544
29. 2011 Carla Silva. Electric and plug-in hybrid vehicles influence on CO2 and
water vapour emissions. International Journal of Hydrogen Energy. 36, 13225-13232, 2011. http://www.sciencedirect.com/science/article/pii/S0360319911016442
30. 2011 Patricia Baptista, Evaluation of the impact of new vehicle and fuel
technologies in the Portuguese road transportation sector, PhD thesis, IST, 2011. https://dspace.ist.utl.pt/bitstream/2295/1103721/1/51313%20PhD%20Thesis.pdf
31. 2011 Manuel Valente. Cenários de evolução de preços dos combustíveis e
das novas tecnologias para veículos rodoviários até 2050. Tese de mestrado. IST, 2011. https://dspace.ist.utl.pt/bitstream/2295/1050581/1/Dissertacao.pdf
32. 2011 Patrícia C. Baptista1, Carla M. Silva, J. A. Peças Lopes, Filipe J. Soares,
Pedro R. Almeida. Evaluation of the benefits of the introduction of electricity powered vehicles in an island. Submitted to Energy conversion and Management.
33. 2010 Manuel Branco Nery Nina, Introduction of Electric Vehicles in Portugal - A Cost-benefit Analysis, Master thesis in Mechanical Engineering, IST, 2010. https://dspace.ist.utl.pt/bitstream/2295/742082/1/Dissertacao_Manuel_Nina_52578.pdf
34. 2010 Cristina Falcão. Energy consumption and CO2 emissions of the
Biohydrogen life cycle. Master thesis, IST, 2010. https://dspace.ist.utl.pt/bitstream/2295/748764/1/Dissertacao%20Cristina%20Falcao.pdf
35. 2010 Luis Oliveira. Development of a model to control an Energy Box in the
scope of V2G Technology.Master thesis, IST, 2010. https://dspace.ist.utl.pt/bitstream/2295/805902/1/Tese_Mestrado_LO_Dezembro_2010.pdf
União Europeia – Fundos Estruturais Governo da República Portuguesa 60
36. 2010 Silva, C.M , Life cycle assessment of alternative vehicles, 1º encontro
de Investigadores do LAETA, 15 de Novembro 2010.
37. 2010 Cristina Camus, Tiago Farias, Jorge Esteves, IMPACT OF THE INTRODUCTION OF PLUG IN ELECTRIC VEHICLES IN THE IBERIAN ELECTRICITY MARKET, EEM 10 - The 7th International Conference on European Energy Market, Madrid Jun. 17-19. http://www.eem10.com/program.shtml
38. 2010 J. A. Peças Lopes, P. M. Rocha Almeida, F. J. Soares, C. L. Moreira,
“Electric Vehicles in Isolated Power Systems: Conceptual Framework and Contributions to Improve the Grid Resilience”, CMTEE 2010 – Conference on Control Methodologies and Technology for Energy Efficiency, Vilamoura, Portugal,March. http://www.ifac-papersonline.net/Detailed/42974.html
39. 2010 6. Published - F. J. Soares, J. A. Peças Lopes, P. M. Rocha Almeida,
“A Monte Carlo Method to Evaluate Electric Vehicles Impacts in Distribution Networks”, 2010 IEEE Conference on Innovative Technologies for an Efficient and Reliable Electricity Supply, Boston, USA, September, 2010. http://ieeexplore.ieee.org/stamp/stamp.jsp?arnumber=05619777
40. 2010 R. J. Rei, F. J. Soares, P. M. Rocha Almeida, J. A. Peças Lopes, “Grid
Interactive Charging Control for Plug-in Electric Vehicles”, 13th International IEEE Conference on Intelligent Transportation Systems, Madeira, Portugal, September. http://ieeexplore.ieee.org/stamp/stamp.jsp?tp=&arnumber=5625073
41. 2010 F. J. Soares, P. M. Rocha Almeida, J. A. Peças Lopes, L. Seca, C. L.
Moreira, “A Technical Management and Market Operation Framework for Electric Vehicles Integration into Electric Power Systems”, 2nd European Conference on Smart Grids and E-Mobility, Brussels, Belgium, October.
42. 2010 C.S.Ioakimidis, J. Borges, P. Ferrão, Presentation ‘Business Approach
to Electric Vehicles Fast Charging Stations’, Proceedings of´SGM-3515, 2nd European Conference SmartGrids and E-Mobility´, Brussels, Belgium, 20-21 October, 2010, p.52-59.
43. 2010 L. Oliveira, C.S.Ioakimidis, P. Ferrão, Presentation ‘The Energy Box –
a Model for Optimizing the Electricity Management Decisions’, Proceedings of ´SGM-3515, 2nd European Conference SmartGrids and E-Mobility´, Brussels, Belgium, 20-21 October, 2010, p.156-161.
44. 2010 C.S. Ioakimidis, P. C. Ferrão, Presentation ‘Pathways towards an
Electric Vehicles Society’, Proceedings of The 25thInternational Battery, Hybrid and Fuel Cell Electric Vehicle Symposium and Exhibition (EVS25 Towards Zero Emission), Shenzhen, China, 5-9 November, 2010, p.8. http://www.docin.com/p-99072161.html

União Europeia – Fundos Estruturais Governo da República Portuguesa 61
45. 2010 J. Borges, C.S. Ioakimidis, P. C. Ferrão, Presentation ‘Business model for Electric Vehicles charging infrastructures’, Proceedings of The 25thInternational Battery, Hybrid and Fuel Cell Electric Vehicle Symposium and Exhibition (EVS25 Towards Zero Emission), Shenzhen, China, 5-9 November, 2010, p.6.
46. 2010 P.Baptista, C. Silva and T. Farias. Impacts in the Portuguese light-duty
road transportation sector of increasing market electrification scenarios. Fisita 2010-Automobiles and Sustainable Mobility, 30 May – 4 June, Budapest. http://www.fisita2010.com/programme/programme/pdf/F2010A129.pdf
47. 2010 Ana Filipa Ferreira, Patricia Baptista and Carla Silva. Analysis of
energy consumption and CO2 emissions of the life cycle of biohydrogen applied to the Portuguese road transportation sector. WHEC- World Hydrogen Energy Conference, May 16 - 21, 2010, Essen, Germany; http://juwel.fz-juelich.de:8080/dspace/bitstream/2128/4151/1/SA2_pp_Fer_da-Silva-Ferreira_rev0607.pdf
48. 2010 A. F. Ferreira, P.Baptista and C. Silva. Bio-hydrogen pathways for the
Portuguese road transportation sector. Fisita 2010-Automobiles and Sustainable Mobility, 30 May – 4 June, Budapest; http://www.fisita2010.com/programme/programme/F2010A113
49. 2010 P.Baptista, C. Silva and T. Farias. Energy and CO2 emissions scenarios
of introducing new vehicle technologies in the Portuguese fleet. IAMF 2010 -International Advanced Mobility Forum, 9-10 March 2010; NA
50. 2010 C. Camus, P. Baptista, C. Silva and T. Farias. Strategic marketing plan
for battery electric vehicles. the Portuguese case. IAMF 2010 – International Advanced Mobility Forum, 9-10 March 2010; NA
51. 2010 P.Baptista, C. Silva and T. Farias. Impacts on CO2 emissions of
market penetration of new technologies/fuels in the Portuguese light-duty road transportation sector. WCTR 2010-12th World Conference on Transport Research,11-15 July 2010, lisboa; NA
52. 2010 D. Livengood, F. Sim Sim, C.S.Ioakimidis, R.Larson, ´Responsive
Demand in Isolated Energy Systems´ First International Conference on Island Sustainability, Brac Island, Croacia, 19-21 April, 2010. http://library.witpress.com/pages/PaperInfo.asp?PaperID=20893
53. 2010 P. Baptista, M. Tomás and C. Silva. Hybrid plug-in fuel cell vehicles
market penetration scenarios. International journal of hydrogen energy Vol. 35, Issue 18, Pg. 10024–10030. http://www.sciencedirect.com/science/article/pii/S0360319910001576
54. 2010 J. Ribau, C. Silva and T. Farias. Electric and hydrogen consumption
analysis in plug-in road vehicles. International Journal of Energy and Environment. Volume 1, Issue 2, 2010, pp.199-220. http://www.ijee.ieefoundation.org/vol1/issue2/IJEE_02_v1n2.pdf
União Europeia – Fundos Estruturais Governo da República Portuguesa 62
55. 2010 Silva CM and Farias TL Evaluation of Energy Consumption,
Emissions and Cost of Plug-in Hybrid Vehicles. Elsevier's book: "Electric and Hybrid Vehicles." editor Gianfranco Pistoia, 2010. http://my.safaribooksonline.com/book/-/9780444535658/chapter-7dot-evaluation-of-energy-consumption-emissions-and-costs-of-plug-inhybrid/chapter_7_evaluation_of_energy
56. 2009 P. Baptista, C. Silva, G. Gonçalves and T. Farias. Full life cycle
analysis of market penetration of electricity based vehicles. World Electric Vehicle Journal Vol. 3 - ISSN 2032-6653. http://www.evs24.org/wevajournal/vol3/title.html
57. 2009 G. Gonçalves, J. Bravo, P. Baptista, C. Silva, and T. Farias. Monitoring
and Simulation of Fuel Cell Electric Vehicles. World Electric Vehicle Journal Vol. 3- ISSN 2032-6653. http://www.evs24.org/wevajournal/vol3/title.html
58. 2009 P. Kadurek, A. Pina, C. Ioakimidis, P. C. Ferrão, ‘São Miguel Island
as a case study on a possible usage of Electric vehicle to store energy’, Proceedings of The 24th International Battery, Hybrid and Fuel Cell Electric Vehicle Symposium and Exhibition, Stavanger, Norway, May 13-16, 2009. http://www.evs24.org/wevajournal/vol3/title.html
59. 2009 P. Kadurek, C.S. Ioakimidis, P. C. Ferrão, ‘Electric Vehicles and their
Impact to the Electric Grid in S. Miguel’, Proceedings of International Conference on Power Engineering, Energy and Electrical Drives, p. 49-54, Lisbon, Portugal March 18-20, 2009. ieeexplore.ieee.org/xpls/abs_all.jsp?arnumber=4915218
60. 2009 Patrícia Baptista, Cristina Camus, Carla Silva, Tiago Farias, Impact of
the introduction of electric based vehicles in São Miguel island, 10th International Conference on Energy for a Clean Environment, Lisbon Portugal, 7-10 July 2009. esd.mit.edu/symp09/submitted-papers/baptista-paper.pdf
61. 2009 Patricia Baptista, Carla Silva and Tiago Farias, Impact of the
introduction of new vehicle technologies in the Portuguese road transportation sector, 1st Transatlantic NECTAR Conference 2009, Arlington, Virginia USA, 18-20 June http://nectar.gmu.edu/program.html
62. 2009 João Ribau. Análise de factores de consumo eléctrico e de hidrogénio
em veículos puramente eléctricos e Plug-in eléctricos. Master thesis, IST, 2009. https://dspace.ist.utl.pt/bitstream/2295/568378/1/dissertacao.pdf
63. 2009 Green Feast 2009, Auditório do Estoril, Estoril, 18-25 Setembro 2009
NA
64. 2009 MIT-Mid-Program Event, Centro Cultural de Belém, Lisbon, 7 July 2009 NA
União Europeia – Fundos Estruturais Governo da República Portuguesa 63
3 Conclusions Main conclusions are as follows:
• For Portugal, roughly 80% energy and CO2 reduction is only achieved by 60% renewables, high level of vehicle electrification and low levels of mobility. It is concluded that the TOC for the several alternative vehicles (different powertrains) will converge over time.
• For the case of Flores Island, The results show that, if no alternative solutions are adopted, the road transportation sector LCA energy consumption will increase 58% in 2050, compared to 2009. In the most attractive scenario studied regarding EV integration in Flores, the LCA energy consumption in 2050 decreases by 34% and CO2 emissions by 39%, when comparing with Scenario 1. Moreover, the island’s electricity network is ready for EV arrival, at least until 2020. Thereafter, a smart charging scheme should be implemented to manage the vehicles’ energy demand according to the network technical limitations and the presence of RES should be reinforced, to decrease the island’s dependency on fossil fuels and, consequently, CO2 emissions.
• For the case of S. Miguel, The penetration up to 55% of electric based vehicles allows an energy consumption, CO2 and pollutants emissions reduction, even in a life-cycle framework (up to 15, 20 and 37% respectively). As was presented, the impacts of scenario 1, which corresponds to solely a low public transportation fleet replacement, is clearly insufficient. Only if the light-duty fleet is considered will the consequences in terms of energy and emissions be significant. Another important issue is that, based on today’s electricity generation mix, the electricity based vehicles will mostly be recharged by fossil fuels, since fuel oil will be used to fulfill demand needs. This leads to lower reductions in terms of WTT energy consumption and emissions than if the electricity was produced from renewable sources. As expected, scenarios of higher renewable integration in electricity generation are favorable for the introduction of these types of vehicles. Due to the characteristics of the renewable resources in São Miguel, and the typical load profiles there are synergies between EVs and electricity production that will, if fitted together, reduce overall emissions in the Island and fuel imports. The mass penetration of EVs, with the guarantee that they charge mainly during off peak hours, has the advantage of capturing the geothermal and wind energy produced in excess, in those hours, and avoid the investment in water pump power plants that should be needed to accommodate the excess renewable production during valley hours.
• The simulation platform developed for vehicle-grid interaction in terms of voltage control proved to be very efficient in performing a realistic evaluation of the impacts that result from a massive integration of EV in distribution networks. Besides the evaluation of the steady state operating conditions of the grid, it also allows identifying the most critical operation scenarios and the network components that are subjected to more demanding conditions and that might need to be upgraded. For the case of Flores Island, the island network is very robust, being therefore capable of integrating a large number of EV without the occurrence of line loading and voltage limits violations. With 25% of EV only a small number of voltage lower limit violations were recorded along the 10000 iterations performed. However, in the scenario with 50% of
União Europeia – Fundos Estruturais Governo da República Portuguesa 64
EV the number of violations registered was greatly increased. These results show that while the network resists to a 25% replacement of the conventional vehicles fleet by EV, it is impossible to proceed to a 50% replacement rate without making large investments in network reinforcements, in order to tackle the low voltage problems identified. Important findings were also made regarding the energy losses. Their value grows 58% from the scenario without EV to the one with 25% of EV and 140% to the one with 50% of EV. These values show that, for higher EV integration levels, losses are likely to become a very important issue for the system operator. Therefore, in such circumstances, the system operator should look for efficient mechanisms to manage EV charging, in order to avoid wasting large amounts of money in the energy distribution process and in network reinforcements.
• With the development of vehicle-grid frequency analysis it was possible understand how using EV to provide primary frequency control impacts not only the power system but also the SOC of the EV batteries. In the case of the island of Flores there is a lot of unexplored RES availability as the system load is low and typical dispatching rules must always include conventional generation units for stability purposes. Moreover, the existing hydro units would not be included in frequency control actions as the high head and the long conduit would cause premature mechanical wear and tear. The usage of EV to perform fast control actions proved efficient and enabled the usage of the hydro units in load / generation balancing. As EV have a faster reaction the ramping of hydro units is smoother and requests for sudden changes seldom occur. With EV control the system frequency oscillated in turn of 50 Hz in a band of 0.3 Hz, whereas if hydro units alone would be used to perform this control frequency would oscillate in a 1 Hz band. EV charging process was almost not affected as the amount of consumed energy deviated from the expected value by 0.08 %.
• The charging profile in a high EV penetration scenario has great impacts in the hourly market price. In a scenario of low hydro production, the price could reach 20 cents/kWh, for 2 Million EVs charging mainly at peak hours. In a high hydro production and low wholesale prices, an off peak recharge could reach the 5.6 cents/kWh. In these extreme conditions, EV energy prices were between 0.9-3.2€/100km.
• Biohydrogen from cyanobacteria/microalgae is not yet included in the fleet model due to its extremely high-energy consumption and resulting CO2 emissions at laboratory scale.
• Vehicle drivetrain component selection is highlighted, aiming for energy consumption and CO2 emissions reduction. VSP is used in driving cycle analysis and for the selection of converted vehicle components characteristics.
União Europeia – Fundos Estruturais Governo da República Portuguesa 65
4 References APREN, 2010. Roteiro Nacional das Energias Renováveis. Associação Portuguesa de
Energias Renováveis.
Associação Automóvel de Portugal (ACAP), “Statistics for the Portuguese Automotive
fleet”, 2006.
Azevedo, C.M.L. (2008), Métodos de estimativa de volumes anuais de tráfego
rodoviário - um modelo para Portugal. 2008, Instituto Superior Técnico, Universidade
Técnica de Lisboa.
Baptista, P., Rolim, C., Silva, C., Plug-In Vehicle Acceptance and Probable Utilization
Behaviour. Journal of Transportation Technologies, Vol.2, 1, PP.67-74, 2012.
P. Baptista, M. Tomás, C. Silva, Plug-in hybrid fuel cell vehicles market penetration scenarios, International Journal of Hydrogen Energy, 35 (2010), 10024-30. Baptista, P., Ribau, J. Bravo, J., Silva, C. M., Adcock, P., Kells, A.. Fuel cell hybrid taxi life cycle analysis. Energy Policy, 39(2011), 4683–4691.
Baudoin, J.-L., 2007. Avaliação energética e ambiental da produção e reciclagem de
materiais/componentes de veículos convencionais versus veículos híbridos. Tese de
Mestrado. Lisboa, Portugal: Instituto Superior Técnico.
Berberoğlu H, Jay J, Pilon L. (2008) Effect of nutrients media on photobiological
hydrogen production by Anabaena variabilis ATCC29413. International Journal of
Hydrogen Energy 2008; 33: 1172-1184.
Burnham, A. Wang, M. Wu Y. (2007), “Development and Applications of Greet 2.7 - The Transportation Vehicle-Cycle Model”, Energy Systems Division, Argonne National Laboratory, 2007. Clarens AF, Resurreccion EP, White MA, Colosi LM. Environmental life cycle comparison of algae to other bioenergy feedstocks. Environmental Science and Technology 2010, 44: 1813-1819.
Cozinjsen, J., 2010. CO2 Prices. [Online] Available at: www.co2prices.eu [Accessed 13
August 2010].
Dasgupta, CN, Jose GJ, Lindblad P, Heidorn SA, Skjanes K, Das D. (2010) Recent trends
on the development of photobiological processes and photobioreactors for the
improvement of hydrogen production. International Journal of Hydrogen Energy
2010; 35: 10218-10238.
Dimitrios Gkatzoflias, C.K., Leonidas Ntziachristos and Zissis Samaras, COPERT 4,
computer programme to calculate emissions from road transport. 2007, ETC/AEM.
União Europeia – Fundos Estruturais Governo da República Portuguesa 66
Edwards, R. Larivé, J-F. Mahieu, V. Rouveirolles, P. (2008). Well-to-Wheels analysis of future automotive fuels and powertrains in the European context, 2008 (Concawe, JRC,EUCAR) http://ies.jrc.ec.europa.eu/WTW.
Ehsani, M., Gao, Y. , Emadi A. (2010). Modern Electric, Hybrid Electric and Fuel Cell
Vehicles -Fundamentals, Theory, and Design, 2nd ed. CRC Press, 2010.
European Commission, 2005. ExternE - Externalities of Energy - Methodology 2005
Update. Community Research. European Commission.
Eurostat 2008- Energy and Environment Indicators, “EUROPA Eurostat – Data
Navigation Tree”, November 2008.
Frey, H. , Zhang, K.(2007). Implications of Measured In-Use Light Duty Gasoline
Vehicle Emissions for Emission Inventory Development at High Spatial and Temporal
Resolution, NC State University, Prepared for the 16th Annual International
Emission Inventory Conference Raleigh, 2007.
Frey, H.C., Choi, H.W., Pritchard E. and Lawrence J. (2009). In-Use Measurement of
the Activity, Energy Use, and Emissions of a Plug-in Hybrid Electric Vehicle. Paper
2009-A-242-AWMA, Proceedings, 102nd Annual Conference and Exhibition, Air &
Waste Management Association, Detroit, Michigan, 2009.
Heywood J.B. (1989). Internal Combustion Engine Fundamentals. McGraw Hill, 1989.
IMTT; ACAP; ADENE, 2010. Informação sobre consumo de combustível e emissão de
CO2. [Online] Available at: http://home.moonlight.pt/acapco2/dgv/pesquisa.asp
[Accessed 2 May 2010]
International Energy Agency, 2008. World Energy Outlook 2008. Paris, France:
OECD/IEA International Energy Agency.
Instituto Nacional de Estatística, “Population Statistics”, 2008.
KOKAM, http://www.kokam.com/new/ accessed on 2011-09-15
Kotay H, Das D. (2008) Biohydrogen as a renewable energy resource – Prospects and
potentials. International Journal of Hydrogen Energy 2008; 33: 258-263.
Larminie, J., Lowry J. (2003). Electric Vehicle Technology Explained. John Wiley &
Sons, 2003.
Lewis, C. A. (1997)“Fuel and Energy Production Emission Factors, MEET Project:
Methodologies for Estimating Air Pollutant Emissions from Transport”, ETSU Report,
No. R112, 1997.
União Europeia – Fundos Estruturais Governo da República Portuguesa 67
Peças Lopes, J.A., Soares, F. J., and Rocha Almeida, P. M. (2009)“Identifying
Management Procedures to Deal with Connection of Electric Vehicles in the Grid”,
PowerTech2009 - PowerTech 2009, Bucharest, Romania, June, 2009.
Marques AE, Barbosa AT, Jotta J, Tamagnini P, Caldeira-Coelho M, Gouveia L.
Biohydrogen production by Anabaena sp. PCC7120 wild-type and mutants under
different conditions: Light, Nickel, Propane, Carbon dioxide and Nitrogen. Journal of
Biomass and Bioenergy 2011; in press (doi:10.1016/j.biombioe.2011.08.014).
Marques PASS, Bartolomeu ML, Tomé MM, Neves LM. Bio-hydrogen production
from glycerol by a strain of Enterobacter aerogenes. Proceedings, Hypothesis VIII -
Hydrogen Systems And Materials For Sustainability (Eds. Rangel CM and Spazzafumo
G), 2009.
MOBI.E, 2009. MOBI.E - Portuguese Electric Mobility Program. MOBI.E - Mobilidade Eléctrica.
Motors, G., GM (2002) WTT analysis of energy use and GHG emissions of advanced fuel/vehicle systems - a European study. 2002.
Peças Lopes, J.A. et al., 2009. Quantification of Technical Impacts and Environmental
Benefits of Electric Vehicles Integration on Electricity Grids. In 8th International
Symposium on Advanced Electromechanical Motion Systems. Lille, France, 2009.
Silva, C.M. Baudoin J.-M., and Farias T.L. (2008) Full life cycle analysis of different vehicle technologies. FISITA 2008 - 32th FISITA World Automotive Congress, Munich, Germany, 15 - 19 September 2008. Singh A, Nigam PS, Murphy JD. Renewable fuels from algae: an answer to debatable land based fuels. Bioresource Technology 2011; 102: 10–16. Sullivan J.L., Gaines L. Status of life cycle inventories for batteries. Energy Conversion and Management 2012; 58: 134–148. UQM technologies, http://www.uqm.com/ accessed on 2011-09-15 Valdez-Vazquez I ,Acevedo-Benítez JA, Poggi-Varaldo HM. Potential of hydrogen production from organic urban solid waste fermentation in Mexico. International Journal of Environment and Waste Management 2009; 3: 36-50.
Valente, M.L., 2010. Cenários de evolução de preços dos combustíveis e das novas
tecnologias para veículos rodoviários até 2050. Tese de Mestrado. Lisboa, Portugal:
Instituto Superior Técnico.
Vehicle Certification Agency, 2010. VCA Car Fuel Database. [Online] Available at:
http://www.vcacarfueldata.org.uk/ [Accessed 7th July 2010].
União Europeia – Fundos Estruturais Governo da República Portuguesa 68
Wipke, K., Cuddy, M., Burch, S.(1999), ADVISOR 2.1: A User Friendly Advanced Powertrain Simulation Using a Combined Backward/Forward Approach. IEEE Transactions on Vehicular Tecnology, (48): p. 1751-1761, 1999. Yang J, Xu M, Zhang X, Hu Q, Sommerfeld M, Chen Y. Life-cycle analysis on biodiesel production from microalgae: water footprint and nutrients balance. Bioresources Technology 2011; 102: 159–165. Yeager CM, Milliken CE, Bagwell CE, Christopher E, Staples L, Berseth PA, Sessions HT. (2011). Evaluation of experimental conditions that influence hydrogen production among heterocystous Cyanobacteria. International Journal of Hydrogen Energy 2011; 36: 7487-7499.
União Europeia – Fundos Estruturais Governo da República Portuguesa 69
5 Nomenclature
AGC Automatic Generation Control cc Cubic centimeters CD Charge Depleting CS Charge Sustaining CTG Cradle-to-Grave DSO Distribution System Operators EEEIS Economic, Energy and Environment Impacts Simulator EMS Electricity Market Simulator EM Electrical Motor EV Electric Vehicle FC Fuel Cell FCPHEV Fuel Cell Plug-in Hybrid Electric Vehicle GHG Green-House Gas emissions HDV Heavy-Duty Vehicle ICE Internal Combustion Engine ICEV Internal Combustion Engine Vehicle IPO Inspecções Periódicas Obrigatórias (mandatory safety check) ISV Vehicle Tax (Imposto Sobre Veículos) ITR Impact on Tax Revenues IUC Circulation Tax (Imposto Unico de Circulação) LCA Life Cycle Analysis LCI Life Cycle Inventory LDV Light Duty Vehicle MSRP Manufacturer Suggested Retail Price PATTS Projections for Alternative Transportation Technologies Simulation
tool PHEV Plug-in Hybrid Electric Vehicle RES Renewable energy Sources SOC Battery State-of-Charge TEC Total Emission Costs TLC Total Life Cost TOC/TCO Total Ownership Cost TTW Tank-to-Wheel VAT Equivalent to IVA-Imposto sobre Valor Acrescentado VC Variable Cost VSP Vehicle Specific Power WTT Well-to-Tank WTW Well-to-wheel
![CHEMISTRY: SHAPING THE FUTURE - ULisboa · Pedro Góis 11h10-12h10 Oral (15 min) [O] Hélio Faustino (iMed-ULisboa) [O] Inês Mariz (IST-ULisboa) [O] Ivo Martins (IMM-ULisboa) [O]](https://img.pdfslide.net/doc/110x75/605b4e037f6ad14c3648b45d/chemistry-shaping-the-future-ulisboa-pedro-gis-11h10-12h10-oral-15-min-o.jpg)