Embed Size (px)
Citation preview
from the center peak corresponding to the Rabifrequency induced by the drive.
When both qubits are tuned to 6.4 GHzcorresponding to d ~ l, we observe a Mollowtriplet–like spectrum with a narrow resonancesuperimposed at its center frequency (Fig. 3). Thenarrow resonance becomes more discernible asthe drive power is decreased (Fig. 3B). Here andbelow, the Rayleigh scattered contribution wasremoved from the data for clarity. These twodistinct features, the Mollow triplet and narrowresonance, are due to the formation of super- andsubradiant states, respectively.
The effective two-level system |gg>,|B> isstrongly dressed by the drive field, resulting in aMollow triplet. The width ~52 MHz of the mainpeak, obtained by fitting to numerical calcula-tions (black lines in Fig. 3), is consistent with thevalue of GB extracted above. Ideally, the dark state|D⟩ is neither excited by the drive nor does it decayinto |gg⟩ due to selection rules. In practice, how-ever, it is weakly populated due to qubit dephas-ing, nonradiative decay from the state |ee⟩, andunequal single-qubit relaxation rates (23). As aresult, the dark state |D⟩ appears as a narrowresonance superimposed on the bright-state Mol-low triplet. Its linewidth, when compared to nu-merical results, is approximately GD/2p ~ 0.4 T0.2 MHz. We obtain adequate quantitative agree-ment between themeasured spectra and theory (seelines in Fig. 3) and find the ratio between super- andsubradiant lifetimes to be as high as GB/GD ≥ 100.
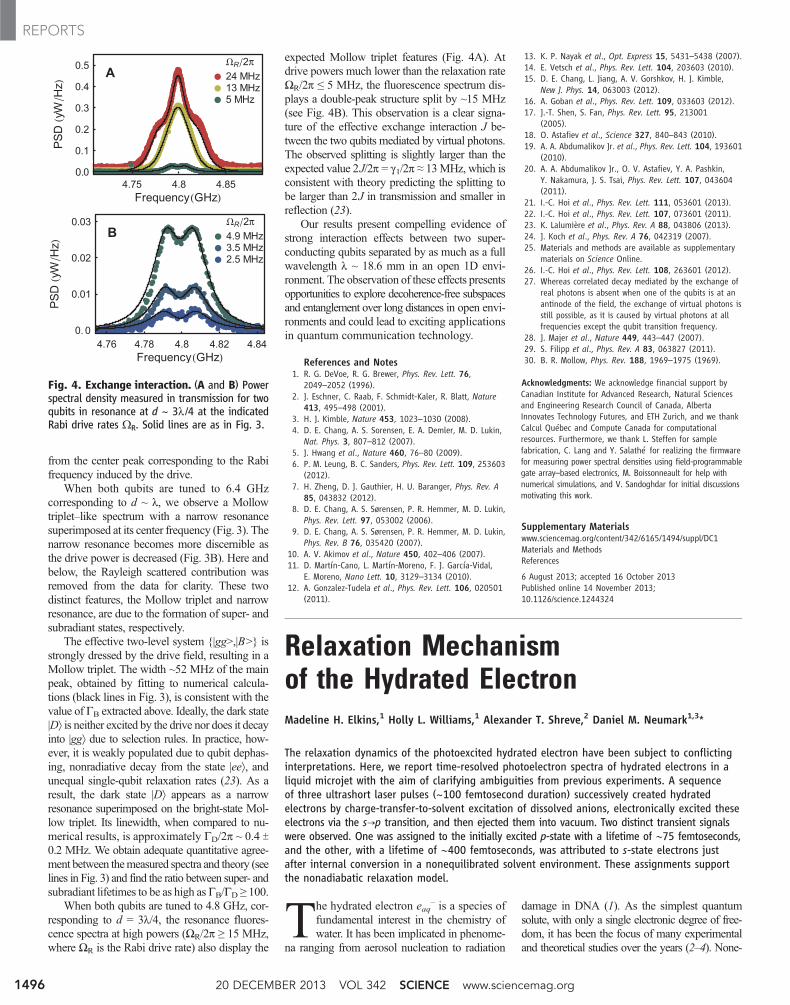
When both qubits are tuned to 4.8 GHz, cor-responding to d = 3l/4, the resonance fluores-cence spectra at high powers (ΩR/2p ≥ 15 MHz,where ΩR is the Rabi drive rate) also display the
expected Mollow triplet features (Fig. 4A). Atdrive powers much lower than the relaxation rateΩR/2p ≤ 5 MHz, the fluorescence spectrum dis-plays a double-peak structure split by ~15 MHz(see Fig. 4B). This observation is a clear signa-ture of the effective exchange interaction J be-tween the two qubits mediated by virtual photons.The observed splitting is slightly larger than theexpected value 2J/2p = g1/2p ≈ 13MHz, which isconsistent with theory predicting the splitting tobe larger than 2J in transmission and smaller inreflection (23).
Our results present compelling evidence ofstrong interaction effects between two super-conducting qubits separated by as much as a fullwavelength l ~ 18.6 mm in an open 1D envi-ronment. The observation of these effects presentsopportunities to explore decoherence-free subspacesand entanglement over long distances in open envi-ronments and could lead to exciting applicationsin quantum communication technology.
References and Notes1. R. G. DeVoe, R. G. Brewer, Phys. Rev. Lett. 76,
2049–2052 (1996).2. J. Eschner, C. Raab, F. Schmidt-Kaler, R. Blatt, Nature
413, 495–498 (2001).3. H. J. Kimble, Nature 453, 1023–1030 (2008).4. D. E. Chang, A. S. Sorensen, E. A. Demler, M. D. Lukin,
Nat. Phys. 3, 807–812 (2007).5. J. Hwang et al., Nature 460, 76–80 (2009).6. P. M. Leung, B. C. Sanders, Phys. Rev. Lett. 109, 253603
(2012).7. H. Zheng, D. J. Gauthier, H. U. Baranger, Phys. Rev. A
85, 043832 (2012).8. D. E. Chang, A. S. Sørensen, P. R. Hemmer, M. D. Lukin,
Phys. Rev. Lett. 97, 053002 (2006).9. D. E. Chang, A. S. Sørensen, P. R. Hemmer, M. D. Lukin,
Phys. Rev. B 76, 035420 (2007).10. A. V. Akimov et al., Nature 450, 402–406 (2007).11. D. Martín-Cano, L. Martín-Moreno, F. J. García-Vidal,
E. Moreno, Nano Lett. 10, 3129–3134 (2010).12. A. Gonzalez-Tudela et al., Phys. Rev. Lett. 106, 020501
(2011).
13. K. P. Nayak et al., Opt. Express 15, 5431–5438 (2007).14. E. Vetsch et al., Phys. Rev. Lett. 104, 203603 (2010).15. D. E. Chang, L. Jiang, A. V. Gorshkov, H. J. Kimble,
New J. Phys. 14, 063003 (2012).16. A. Goban et al., Phys. Rev. Lett. 109, 033603 (2012).17. J.-T. Shen, S. Fan, Phys. Rev. Lett. 95, 213001
(2005).18. O. Astafiev et al., Science 327, 840–843 (2010).19. A. A. Abdumalikov Jr. et al., Phys. Rev. Lett. 104, 193601
(2010).20. A. A. Abdumalikov Jr., O. V. Astafiev, Y. A. Pashkin,
Y. Nakamura, J. S. Tsai, Phys. Rev. Lett. 107, 043604(2011).
21. I.-C. Hoi et al., Phys. Rev. Lett. 111, 053601 (2013).22. I.-C. Hoi et al., Phys. Rev. Lett. 107, 073601 (2011).23. K. Lalumière et al., Phys. Rev. A 88, 043806 (2013).24. J. Koch et al., Phys. Rev. A 76, 042319 (2007).25. Materials and methods are available as supplementary
materials on Science Online.26. I.-C. Hoi et al., Phys. Rev. Lett. 108, 263601 (2012).27. Whereas correlated decay mediated by the exchange of
real photons is absent when one of the qubits is at anantinode of the field, the exchange of virtual photons isstill possible, as it is caused by virtual photons at allfrequencies except the qubit transition frequency.
28. J. Majer et al., Nature 449, 443–447 (2007).29. S. Filipp et al., Phys. Rev. A 83, 063827 (2011).30. B. R. Mollow, Phys. Rev. 188, 1969–1975 (1969).
Acknowledgments: We acknowledge financial support byCanadian Institute for Advanced Research, Natural Sciencesand Engineering Research Council of Canada, AlbertaInnovates Technology Futures, and ETH Zurich, and we thankCalcul Québec and Compute Canada for computationalresources. Furthermore, we thank L. Steffen for samplefabrication, C. Lang and Y. Salathé for realizing the firmwarefor measuring power spectral densities using field-programmablegate array–based electronics, M. Boissonneault for help withnumerical simulations, and V. Sandoghdar for initial discussionsmotivating this work.
Supplementary Materialswww.sciencemag.org/content/342/6165/1494/suppl/DC1Materials and MethodsReferences
6 August 2013; accepted 16 October 2013Published online 14 November 2013;10.1126/science.1244324
Relaxation Mechanismof the Hydrated ElectronMadeline H. Elkins,1 Holly L. Williams,1 Alexander T. Shreve,2 Daniel M. Neumark1,3*
The relaxation dynamics of the photoexcited hydrated electron have been subject to conflictinginterpretations. Here, we report time-resolved photoelectron spectra of hydrated electrons in aliquid microjet with the aim of clarifying ambiguities from previous experiments. A sequenceof three ultrashort laser pulses (~100 femtosecond duration) successively created hydratedelectrons by charge-transfer-to-solvent excitation of dissolved anions, electronically excited theseelectrons via the s→p transition, and then ejected them into vacuum. Two distinct transient signalswere observed. One was assigned to the initially excited p-state with a lifetime of ∼75 femtoseconds,and the other, with a lifetime of ∼400 femtoseconds, was attributed to s-state electrons justafter internal conversion in a nonequilibrated solvent environment. These assignments supportthe nonadiabatic relaxation model.
The hydrated electron eaq– is a species of
fundamental interest in the chemistry ofwater. It has been implicated in phenome-
na ranging from aerosol nucleation to radiation
damage in DNA (1). As the simplest quantumsolute, with only a single electronic degree of free-dom, it has been the focus of many experimentaland theoretical studies over the years (2–4). None-
π
π
Fig. 4. Exchange interaction. (A and B) Powerspectral density measured in transmission for twoqubits in resonance at d ~ 3l /4 at the indicatedRabi drive rates ΩR. Solid lines are as in Fig. 3.
20 DECEMBER 2013 VOL 342 SCIENCE www.sciencemag.org1496
REPORTS
theless, many of its key attributes remain contro-versial. For example, the standard picture (5) of anelectron residing in a cavity of radius ∼2.4 Å hasbeen repeatedly questioned (6). Another unresolvedissue concerns the relaxation mechanism of eaq
–
subsequent to electronic excitation. This mecha-nism, which represents a subtle interplay betweensolute-solvent interactions and electronically non-adiabatic dynamics, is of critical importance inhydrated electron chemistry and radiation biology,given that excited states of eaq
– are considerablymore reactive than its ground state (7). The relaxa-tion dynamics of eaq
– upon excitation have beenstudied in bulk water by using transient absorp-tion (TA) (8–10) and resonance Raman spec-troscopy (11). Complementary studies have alsobeen carried out in size-selected water clusteranions by using time-resolved photoelectron spec-troscopy (TRPES) (12). In this work, we connectthese very disparate experimental techniques usingTRPES of hydrated electrons in liquid water micro-jets in order to resolve key questions regardingthe relaxation mechanism of eaq
–.The hydrated electron has a characteristic
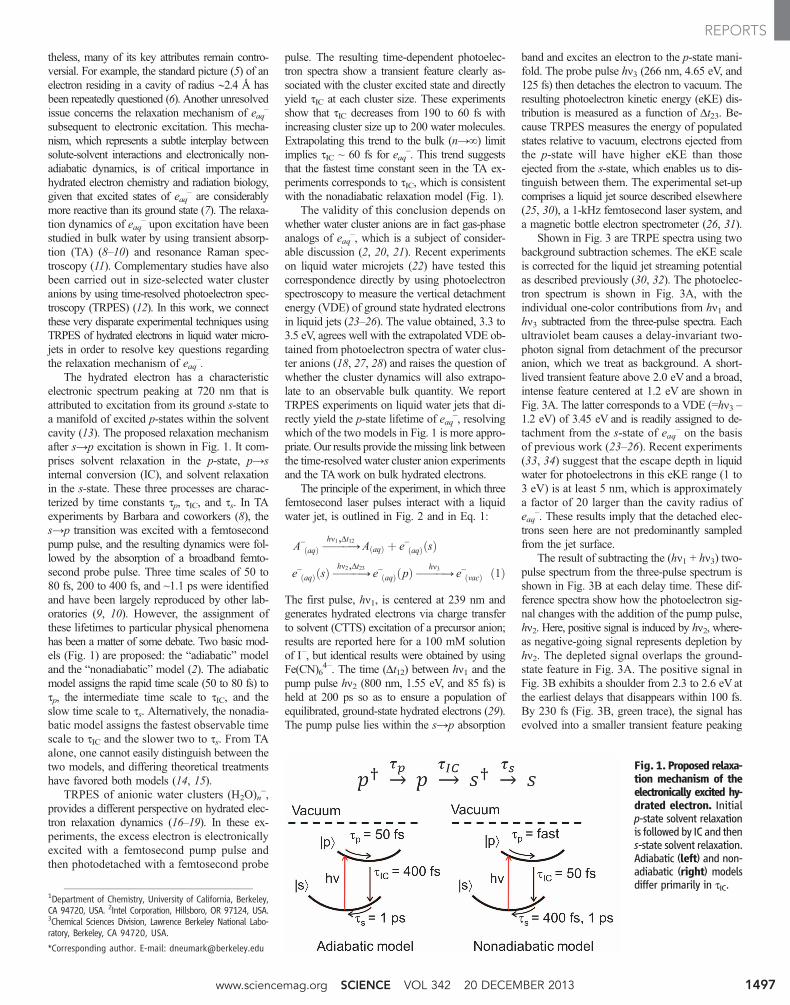
electronic spectrum peaking at 720 nm that isattributed to excitation from its ground s-state toa manifold of excited p-states within the solventcavity (13). The proposed relaxation mechanismafter s→p excitation is shown in Fig. 1. It com-prises solvent relaxation in the p-state, p→sinternal conversion (IC), and solvent relaxationin the s-state. These three processes are charac-terized by time constants tp, tIC, and ts. In TAexperiments by Barbara and coworkers (8), thes→p transition was excited with a femtosecondpump pulse, and the resulting dynamics were fol-lowed by the absorption of a broadband femto-second probe pulse. Three time scales of 50 to80 fs, 200 to 400 fs, and ~1.1 ps were identifiedand have been largely reproduced by other lab-oratories (9, 10). However, the assignment ofthese lifetimes to particular physical phenomenahas been a matter of some debate. Two basic mod-els (Fig. 1) are proposed: the “adiabatic” modeland the “nonadiabatic” model (2). The adiabaticmodel assigns the rapid time scale (50 to 80 fs) totp, the intermediate time scale to tIC, and theslow time scale to ts. Alternatively, the nonadia-batic model assigns the fastest observable timescale to tIC and the slower two to ts. From TAalone, one cannot easily distinguish between thetwo models, and differing theoretical treatmentshave favored both models (14, 15).
TRPES of anionic water clusters (H2O)n–,
provides a different perspective on hydrated elec-tron relaxation dynamics (16–19). In these ex-periments, the excess electron is electronicallyexcited with a femtosecond pump pulse andthen photodetached with a femtosecond probe
pulse. The resulting time-dependent photoelec-tron spectra show a transient feature clearly as-sociated with the cluster excited state and directlyyield tIC at each cluster size. These experimentsshow that tIC decreases from 190 to 60 fs withincreasing cluster size up to 200 water molecules.Extrapolating this trend to the bulk (n→∞) limitimplies tIC ~ 60 fs for eaq
–. This trend suggeststhat the fastest time constant seen in the TA ex-periments corresponds to tIC, which is consistentwith the nonadiabatic relaxation model (Fig. 1).
The validity of this conclusion depends onwhether water cluster anions are in fact gas-phaseanalogs of eaq
–, which is a subject of consider-able discussion (2, 20, 21). Recent experimentson liquid water microjets (22) have tested thiscorrespondence directly by using photoelectronspectroscopy to measure the vertical detachmentenergy (VDE) of ground state hydrated electronsin liquid jets (23–26). The value obtained, 3.3 to3.5 eV, agrees well with the extrapolated VDE ob-tained from photoelectron spectra of water clus-ter anions (18, 27, 28) and raises the question ofwhether the cluster dynamics will also extrapo-late to an observable bulk quantity. We reportTRPES experiments on liquid water jets that di-rectly yield the p-state lifetime of eaq
–, resolvingwhich of the two models in Fig. 1 is more appro-priate. Our results provide themissing link betweenthe time-resolved water cluster anion experimentsand the TAwork on bulk hydrated electrons.
The principle of the experiment, in which threefemtosecond laser pulses interact with a liquidwater jet, is outlined in Fig. 2 and in Eq. 1:
A−ðaqÞ →
hn1,Dt12AðaqÞ þ e−ðaqÞðsÞ
e−ðaqÞðsÞ→hn2,Dt23
e−ðaqÞðpÞ→hn3
e−ðvacÞ ð1Þ
The first pulse, hn1, is centered at 239 nm andgenerates hydrated electrons via charge transferto solvent (CTTS) excitation of a precursor anion;results are reported here for a 100 mM solutionof I–, but identical results were obtained by usingFe(CN)6
4–. The time (Dt12) between hn1 and thepump pulse hn2 (800 nm, 1.55 eV, and 85 fs) isheld at 200 ps so as to ensure a population ofequilibrated, ground-state hydrated electrons (29).The pump pulse lies within the s→p absorption
band and excites an electron to the p-state mani-fold. The probe pulse hn3 (266 nm, 4.65 eV, and125 fs) then detaches the electron to vacuum. Theresulting photoelectron kinetic energy (eKE) dis-tribution is measured as a function of Dt23. Be-cause TRPES measures the energy of populatedstates relative to vacuum, electrons ejected fromthe p-state will have higher eKE than thoseejected from the s-state, which enables us to dis-tinguish between them. The experimental set-upcomprises a liquid jet source described elsewhere(25, 30), a 1-kHz femtosecond laser system, anda magnetic bottle electron spectrometer (26, 31).
Shown in Fig. 3 are TRPE spectra using twobackground subtraction schemes. The eKE scaleis corrected for the liquid jet streaming potentialas described previously (30, 32). The photoelec-tron spectrum is shown in Fig. 3A, with theindividual one-color contributions from hn1 andhn3 subtracted from the three-pulse spectra. Eachultraviolet beam causes a delay-invariant two-photon signal from detachment of the precursoranion, which we treat as background. A short-lived transient feature above 2.0 eVand a broad,intense feature centered at 1.2 eV are shown inFig. 3A. The latter corresponds to a VDE (=hn3 –1.2 eV) of 3.45 eV and is readily assigned to de-tachment from the s-state of eaq
– on the basisof previous work (23–26). Recent experiments(33, 34) suggest that the escape depth in liquidwater for photoelectrons in this eKE range (1 to3 eV) is at least 5 nm, which is approximatelya factor of 20 larger than the cavity radius ofeaq
–. These results imply that the detached elec-trons seen here are not predominantly sampledfrom the jet surface.
The result of subtracting the (hn1 + hn3) two-pulse spectrum from the three-pulse spectrum isshown in Fig. 3B at each delay time. These dif-ference spectra show how the photoelectron sig-nal changes with the addition of the pump pulse,hn2. Here, positive signal is induced by hn2, where-as negative-going signal represents depletion byhn2. The depleted signal overlaps the ground-state feature in Fig. 3A. The positive signal inFig. 3B exhibits a shoulder from 2.3 to 2.6 eVatthe earliest delays that disappears within 100 fs.By 230 fs (Fig. 3B, green trace), the signal hasevolved into a smaller transient feature peaking
1Department of Chemistry, University of California, Berkeley,CA 94720, USA. 2Intel Corporation, Hillsboro, OR 97124, USA.3Chemical Sciences Division, Lawrence Berkeley National Labo-ratory, Berkeley, CA 94720, USA.
*Corresponding author. E-mail: [email protected]
Fig. 1. Proposed relaxa-tion mechanism of theelectronically excited hy-drated electron. Initialp-state solvent relaxationis followed by IC and thens-state solvent relaxation.Adiabatic (left) and non-adiabatic (right) modelsdiffer primarily in tIC.
www.sciencemag.org SCIENCE VOL 342 20 DECEMBER 2013 1497
REPORTS
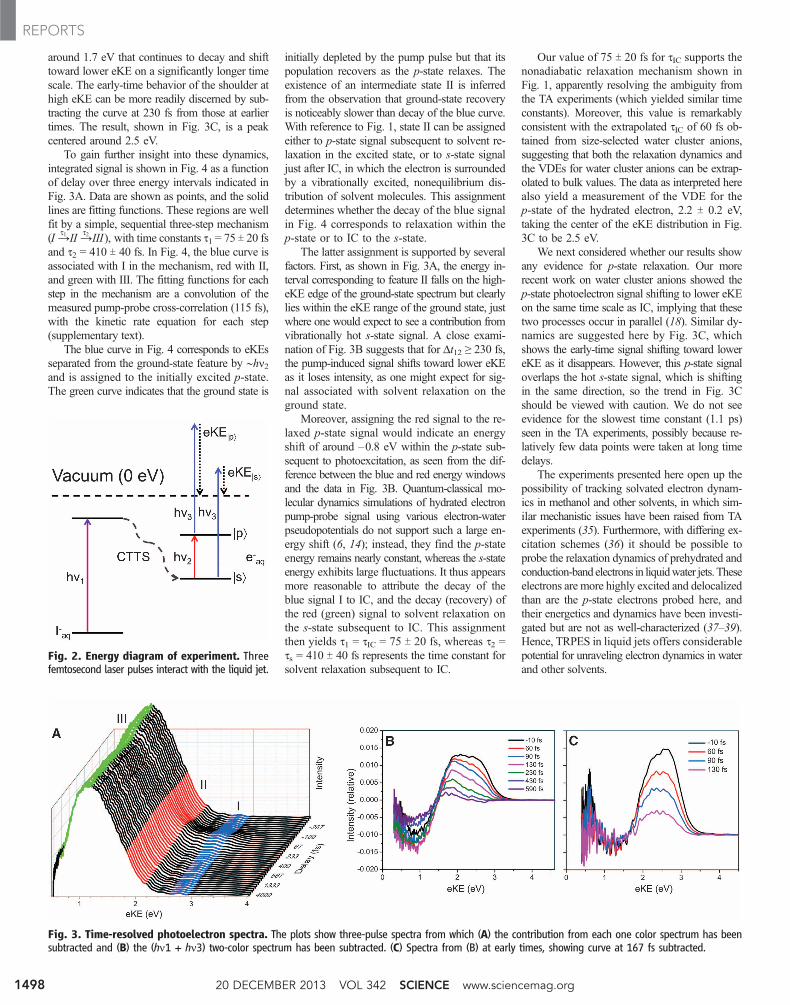
around 1.7 eV that continues to decay and shifttoward lower eKE on a significantly longer timescale. The early-time behavior of the shoulder athigh eKE can be more readily discerned by sub-tracting the curve at 230 fs from those at earliertimes. The result, shown in Fig. 3C, is a peakcentered around 2.5 eV.
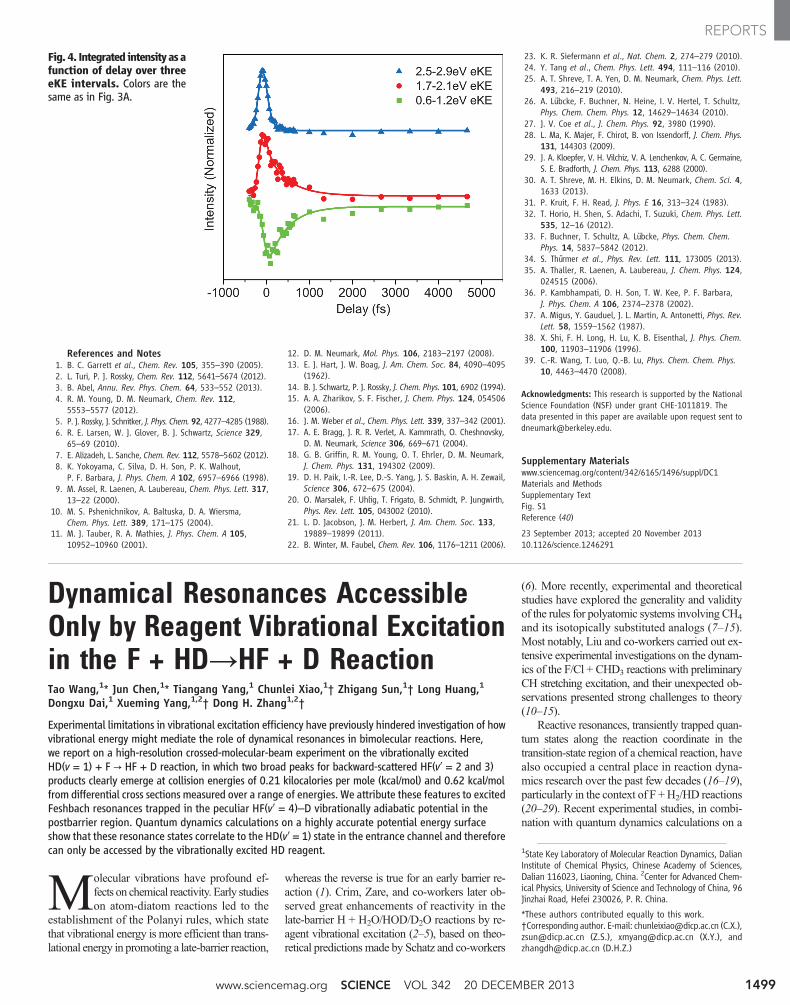
To gain further insight into these dynamics,integrated signal is shown in Fig. 4 as a functionof delay over three energy intervals indicated inFig. 3A. Data are shown as points, and the solidlines are fitting functions. These regions are wellfit by a simple, sequential three-step mechanism(I →
t1 II →t2 III), with time constants t1 = 75 T 20 fs
and t2 = 410 T 40 fs. In Fig. 4, the blue curve isassociated with I in the mechanism, red with II,and green with III. The fitting functions for eachstep in the mechanism are a convolution of themeasured pump-probe cross-correlation (115 fs),with the kinetic rate equation for each step(supplementary text).
The blue curve in Fig. 4 corresponds to eKEsseparated from the ground-state feature by ∼hn2and is assigned to the initially excited p-state.The green curve indicates that the ground state is
initially depleted by the pump pulse but that itspopulation recovers as the p-state relaxes. Theexistence of an intermediate state II is inferredfrom the observation that ground-state recoveryis noticeably slower than decay of the blue curve.With reference to Fig. 1, state II can be assignedeither to p-state signal subsequent to solvent re-laxation in the excited state, or to s-state signaljust after IC, in which the electron is surroundedby a vibrationally excited, nonequilibrium dis-tribution of solvent molecules. This assignmentdetermines whether the decay of the blue signalin Fig. 4 corresponds to relaxation within thep-state or to IC to the s-state.
The latter assignment is supported by severalfactors. First, as shown in Fig. 3A, the energy in-terval corresponding to feature II falls on the high-eKE edge of the ground-state spectrum but clearlylies within the eKE range of the ground state, justwhere one would expect to see a contribution fromvibrationally hot s-state signal. A close exami-nation of Fig. 3B suggests that for Dt12 ≥ 230 fs,the pump-induced signal shifts toward lower eKEas it loses intensity, as one might expect for sig-nal associated with solvent relaxation on theground state.
Moreover, assigning the red signal to the re-laxed p-state signal would indicate an energyshift of around –0.8 eV within the p-state sub-sequent to photoexcitation, as seen from the dif-ference between the blue and red energy windowsand the data in Fig. 3B. Quantum-classical mo-lecular dynamics simulations of hydrated electronpump-probe signal using various electron-waterpseudopotentials do not support such a large en-ergy shift (6, 14); instead, they find the p-stateenergy remains nearly constant, whereas the s-stateenergy exhibits large fluctuations. It thus appearsmore reasonable to attribute the decay of theblue signal I to IC, and the decay (recovery) ofthe red (green) signal to solvent relaxation onthe s-state subsequent to IC. This assignmentthen yields t1 = tIC = 75 T 20 fs, whereas t2 =ts = 410 T 40 fs represents the time constant forsolvent relaxation subsequent to IC.
Our value of 75 T 20 fs for tIC supports thenonadiabatic relaxation mechanism shown inFig. 1, apparently resolving the ambiguity fromthe TA experiments (which yielded similar timeconstants). Moreover, this value is remarkablyconsistent with the extrapolated tIC of 60 fs ob-tained from size-selected water cluster anions,suggesting that both the relaxation dynamics andthe VDEs for water cluster anions can be extrap-olated to bulk values. The data as interpreted herealso yield a measurement of the VDE for thep-state of the hydrated electron, 2.2 T 0.2 eV,taking the center of the eKE distribution in Fig.3C to be 2.5 eV.
We next considered whether our results showany evidence for p-state relaxation. Our morerecent work on water cluster anions showed thep-state photoelectron signal shifting to lower eKEon the same time scale as IC, implying that thesetwo processes occur in parallel (18). Similar dy-namics are suggested here by Fig. 3C, whichshows the early-time signal shifting toward lowereKE as it disappears. However, this p-state signaloverlaps the hot s-state signal, which is shiftingin the same direction, so the trend in Fig. 3Cshould be viewed with caution. We do not seeevidence for the slowest time constant (1.1 ps)seen in the TA experiments, possibly because re-latively few data points were taken at long timedelays.
The experiments presented here open up thepossibility of tracking solvated electron dynam-ics in methanol and other solvents, in which sim-ilar mechanistic issues have been raised from TAexperiments (35). Furthermore, with differing ex-citation schemes (36) it should be possible toprobe the relaxation dynamics of prehydrated andconduction-band electrons in liquidwater jets.Theseelectrons are more highly excited and delocalizedthan are the p-state electrons probed here, andtheir energetics and dynamics have been investi-gated but are not as well-characterized (37–39).Hence, TRPES in liquid jets offers considerablepotential for unraveling electron dynamics in waterand other solvents.
Fig. 2. Energy diagram of experiment. Threefemtosecond laser pulses interact with the liquid jet.
Fig. 3. Time-resolved photoelectron spectra. The plots show three-pulse spectra from which (A) the contribution from each one color spectrum has beensubtracted and (B) the (hn1 + hn3) two-color spectrum has been subtracted. (C) Spectra from (B) at early times, showing curve at 167 fs subtracted.
20 DECEMBER 2013 VOL 342 SCIENCE www.sciencemag.org1498
REPORTS
References and Notes1. B. C. Garrett et al., Chem. Rev. 105, 355–390 (2005).2. L. Turi, P. J. Rossky, Chem. Rev. 112, 5641–5674 (2012).3. B. Abel, Annu. Rev. Phys. Chem. 64, 533–552 (2013).4. R. M. Young, D. M. Neumark, Chem. Rev. 112,
5553–5577 (2012).5. P. J. Rossky, J. Schnitker, J. Phys. Chem. 92, 4277–4285 (1988).6. R. E. Larsen, W. J. Glover, B. J. Schwartz, Science 329,
65–69 (2010).7. E. Alizadeh, L. Sanche, Chem. Rev. 112, 5578–5602 (2012).8. K. Yokoyama, C. Silva, D. H. Son, P. K. Walhout,
P. F. Barbara, J. Phys. Chem. A 102, 6957–6966 (1998).9. M. Assel, R. Laenen, A. Laubereau, Chem. Phys. Lett. 317,
13–22 (2000).10. M. S. Pshenichnikov, A. Baltuska, D. A. Wiersma,
Chem. Phys. Lett. 389, 171–175 (2004).11. M. J. Tauber, R. A. Mathies, J. Phys. Chem. A 105,
10952–10960 (2001).
12. D. M. Neumark, Mol. Phys. 106, 2183–2197 (2008).13. E. J. Hart, J. W. Boag, J. Am. Chem. Soc. 84, 4090–4095
(1962).14. B. J. Schwartz, P. J. Rossky, J. Chem. Phys. 101, 6902 (1994).15. A. A. Zharikov, S. F. Fischer, J. Chem. Phys. 124, 054506
(2006).16. J. M. Weber et al., Chem. Phys. Lett. 339, 337–342 (2001).17. A. E. Bragg, J. R. R. Verlet, A. Kammrath, O. Cheshnovsky,
D. M. Neumark, Science 306, 669–671 (2004).18. G. B. Griffin, R. M. Young, O. T. Ehrler, D. M. Neumark,
J. Chem. Phys. 131, 194302 (2009).19. D. H. Paik, I.-R. Lee, D.-S. Yang, J. S. Baskin, A. H. Zewail,
Science 306, 672–675 (2004).20. O. Marsalek, F. Uhlig, T. Frigato, B. Schmidt, P. Jungwirth,
Phys. Rev. Lett. 105, 043002 (2010).21. L. D. Jacobson, J. M. Herbert, J. Am. Chem. Soc. 133,
19889–19899 (2011).22. B. Winter, M. Faubel, Chem. Rev. 106, 1176–1211 (2006).
23. K. R. Siefermann et al., Nat. Chem. 2, 274–279 (2010).24. Y. Tang et al., Chem. Phys. Lett. 494, 111–116 (2010).25. A. T. Shreve, T. A. Yen, D. M. Neumark, Chem. Phys. Lett.
493, 216–219 (2010).26. A. Lübcke, F. Buchner, N. Heine, I. V. Hertel, T. Schultz,
Phys. Chem. Chem. Phys. 12, 14629–14634 (2010).27. J. V. Coe et al., J. Chem. Phys. 92, 3980 (1990).28. L. Ma, K. Majer, F. Chirot, B. von Issendorff, J. Chem. Phys.
131, 144303 (2009).29. J. A. Kloepfer, V. H. Vilchiz, V. A. Lenchenkov, A. C. Germaine,
S. E. Bradforth, J. Chem. Phys. 113, 6288 (2000).30. A. T. Shreve, M. H. Elkins, D. M. Neumark, Chem. Sci. 4,
1633 (2013).31. P. Kruit, F. H. Read, J. Phys. E 16, 313–324 (1983).32. T. Horio, H. Shen, S. Adachi, T. Suzuki, Chem. Phys. Lett.
535, 12–16 (2012).33. F. Buchner, T. Schultz, A. Lübcke, Phys. Chem. Chem.
Phys. 14, 5837–5842 (2012).34. S. Thürmer et al., Phys. Rev. Lett. 111, 173005 (2013).35. A. Thaller, R. Laenen, A. Laubereau, J. Chem. Phys. 124,
024515 (2006).36. P. Kambhampati, D. H. Son, T. W. Kee, P. F. Barbara,
J. Phys. Chem. A 106, 2374–2378 (2002).37. A. Migus, Y. Gauduel, J. L. Martin, A. Antonetti, Phys. Rev.
Lett. 58, 1559–1562 (1987).38. X. Shi, F. H. Long, H. Lu, K. B. Eisenthal, J. Phys. Chem.
100, 11903–11906 (1996).39. C.-R. Wang, T. Luo, Q.-B. Lu, Phys. Chem. Chem. Phys.
10, 4463–4470 (2008).
Acknowledgments: This research is supported by the NationalScience Foundation (NSF) under grant CHE-1011819. Thedata presented in this paper are available upon request sent [email protected].
Supplementary Materialswww.sciencemag.org/content/342/6165/1496/suppl/DC1Materials and MethodsSupplementary TextFig. S1Reference (40)23 September 2013; accepted 20 November 201310.1126/science.1246291
Dynamical Resonances AccessibleOnly by Reagent Vibrational Excitationin the F + HDYHF + D ReactionTao Wang,1* Jun Chen,1* Tiangang Yang,1 Chunlei Xiao,1† Zhigang Sun,1† Long Huang,1Dongxu Dai,1 Xueming Yang,1,2† Dong H. Zhang1,2†
Experimental limitations in vibrational excitation efficiency have previously hindered investigation of howvibrational energy might mediate the role of dynamical resonances in bimolecular reactions. Here,we report on a high-resolution crossed-molecular-beam experiment on the vibrationally excitedHD(v = 1) + F → HF + D reaction, in which two broad peaks for backward-scattered HF(v′ = 2 and 3)products clearly emerge at collision energies of 0.21 kilocalories per mole (kcal/mol) and 0.62 kcal/molfrom differential cross sections measured over a range of energies. We attribute these features to excitedFeshbach resonances trapped in the peculiar HF(v′ = 4)–D vibrationally adiabatic potential in thepostbarrier region. Quantum dynamics calculations on a highly accurate potential energy surfaceshow that these resonance states correlate to the HD(v′ = 1) state in the entrance channel and thereforecan only be accessed by the vibrationally excited HD reagent.
Molecular vibrations have profound ef-fects on chemical reactivity. Early studieson atom-diatom reactions led to the
establishment of the Polanyi rules, which statethat vibrational energy is more efficient than trans-lational energy in promoting a late-barrier reaction,
whereas the reverse is true for an early barrier re-action (1). Crim, Zare, and co-workers later ob-served great enhancements of reactivity in thelate-barrier H + H2O/HOD/D2O reactions by re-agent vibrational excitation (2–5), based on theo-retical predictions made by Schatz and co-workers
(6). More recently, experimental and theoreticalstudies have explored the generality and validityof the rules for polyatomic systems involving CH4
and its isotopically substituted analogs (7–15).Most notably, Liu and co-workers carried out ex-tensive experimental investigations on the dynam-ics of the F/Cl + CHD3 reactions with preliminaryCH stretching excitation, and their unexpected ob-servations presented strong challenges to theory(10–15).
Reactive resonances, transiently trapped quan-tum states along the reaction coordinate in thetransition-state region of a chemical reaction, havealso occupied a central place in reaction dyna-mics research over the past few decades (16–19),particularly in the context of F +H2/HD reactions(20–29). Recent experimental studies, in combi-nation with quantum dynamics calculations on a
Fig. 4. Integrated intensityasafunction of delay over threeeKE intervals. Colors are thesame as in Fig. 3A.
1State Key Laboratory of Molecular Reaction Dynamics, DalianInstitute of Chemical Physics, Chinese Academy of Sciences,Dalian 116023, Liaoning, China. 2Center for Advanced Chem-ical Physics, University of Science and Technology of China, 96Jinzhai Road, Hefei 230026, P. R. China.
*These authors contributed equally to this work.†Corresponding author. E-mail: [email protected] (C.X.),[email protected] (Z.S.), [email protected] (X.Y.), [email protected] (D.H.Z.)
www.sciencemag.org SCIENCE VOL 342 20 DECEMBER 2013 1499
REPORTS