Embed Size (px)
Citation preview
1www.relaxofootwear.com
Relaxo Footwears Limited
Q3 FY2015 Performance Presentation
January 31, 2015
2
Forward Looking Statements
This presentation contains statements that contain “forward looking statements” including, but without
limitation, statements relating to the implementation of strategic initiatives, and other statements relating to
Relaxo Footwears’ (Relaxo) future business developments and economic performance.
While these forward looking statements indicate our assessment and future expectations concerning the
development of our business, a number of risks, uncertainties and other unknown factors could cause actual
developments and results to differ materially from our expectations.
These factors include, but are not limited to, general market, macro-economic, governmental and regulatory
trends, movements in currency exchange and interest rates, competitive pressures, technological developments,
changes in the financial conditions of third parties dealing with us, legislative developments, and other key
factors that could affect our business and financial performance.
Relaxo undertakes no obligation to publicly revise any forward looking statements to reflect future / likely
events or circumstances

4
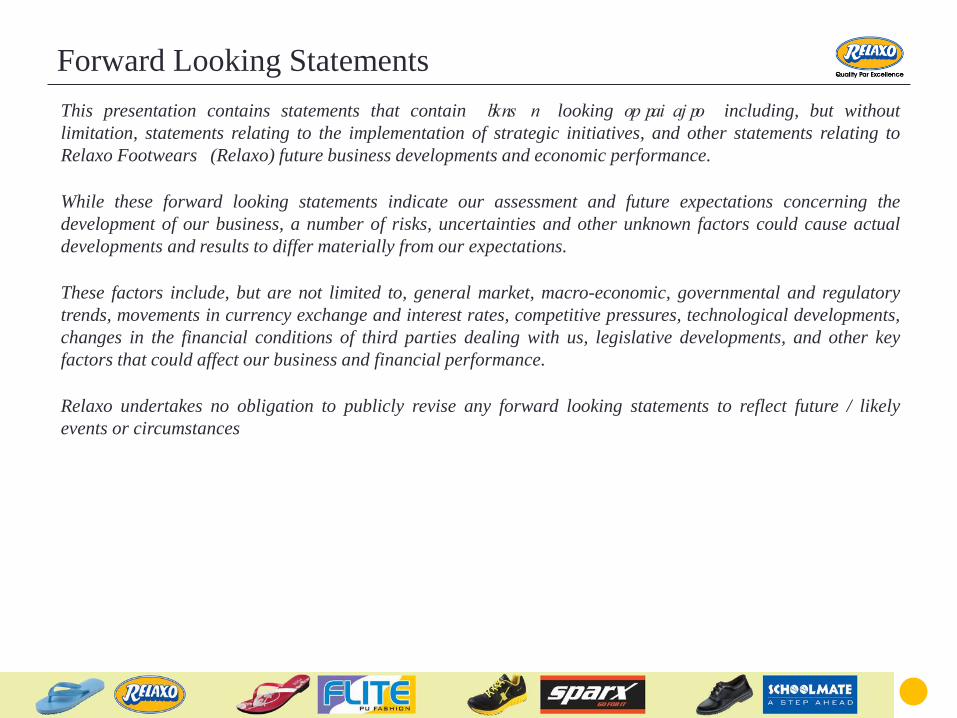
Financial Highlights
Net Sales increased by 27.6% to Rs. 33,066 Lacs
EBITDA increased by 46.3% to Rs. 4,315 Lacs; Margins expanded by 167 bps to 13.0%
Net Profit increased by 88.2% to Rs. 1,991 Lacs at a 6.0% margin; Margins expanded by 194 bps
Interest Coverage: 7.84x (Q3 FY2014: 4.18x)
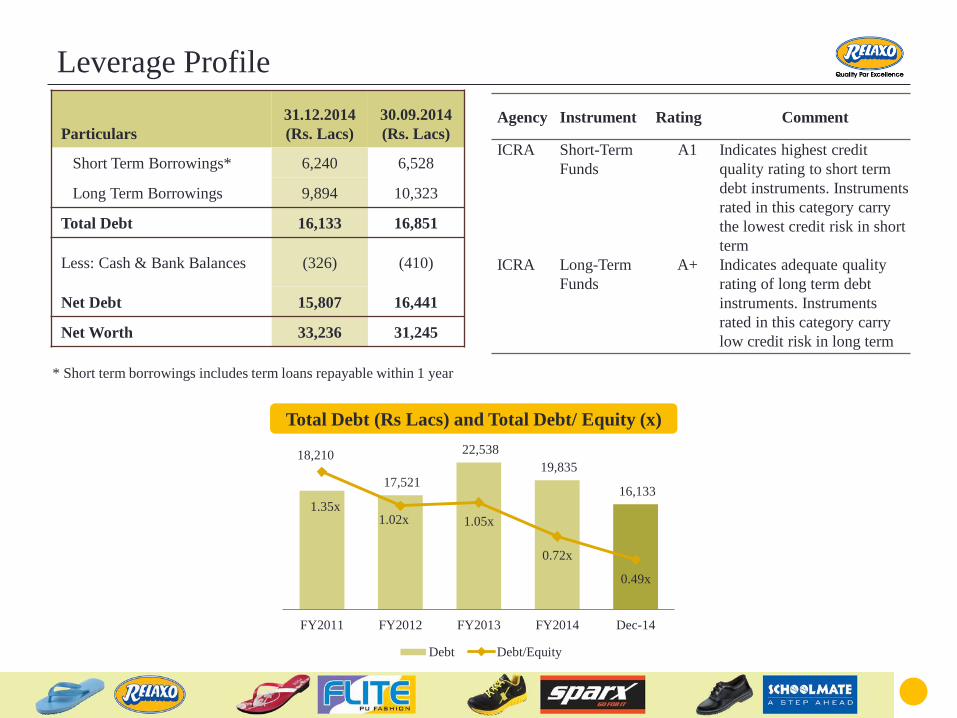
Net Debt reduced from Rs. 16,441 Lacs (Sept 2014) to Rs. 15,807 Lacs (Dec 2014)
Debt / Equity of 0.49x as of 31st Dec 2014 (0.54x as of 30th Sept 2014)
Net addition of 2 retail stores during the quarter; total stores stood at 199
Management Commentary
Highlights – Q3 FY2015 vs. Q3 FY2014
Commenting on the results and performance, Mr. Ramesh Kumar Dua, Managing Director said:
“This has been a remarkable quarter for Relaxo Footwears with revenue increasing by 27.6% and PAT by 88.2%, led by
significant volume growth. The growth momentum for Relaxo continues to be supported by our strategic initiatives, enhanced
capabilities and increasing traction for our brands. We continue to expand distribution network and our portfolio, thereby
resulting in a healthy mix of product premiumization and volume growth across all our brands. Robust growth in key brands and
markets underpins our belief in our strategy of continuous investments in capabilities. Our retail network continues to expand
with an aim to showcase our entire product portfolio.
We understand that our growth will be sustainable only if we have a strong team to support. In line with the same, we have
undertaken a journey on HR processes automation to enhance process efficiencies. We also have charted out improvement
opportunities in our value proposition to our employees and have a focused plan to increase engagement levels, thereby
improving retention and attracting better talent. A well structured ‘Leadership Development Program’ has also been undertaken
to develop individuals who can drive the organization’s strategic agenda in near future.
We are confident of our alignment with the needs of contemporary generation, with industry best practices and the quality that
our products bring. We believe that with well-directed efforts, Relaxo will continue its position as a market leader in the domain”
5
New TV Commercial with Sonakshi Sinha
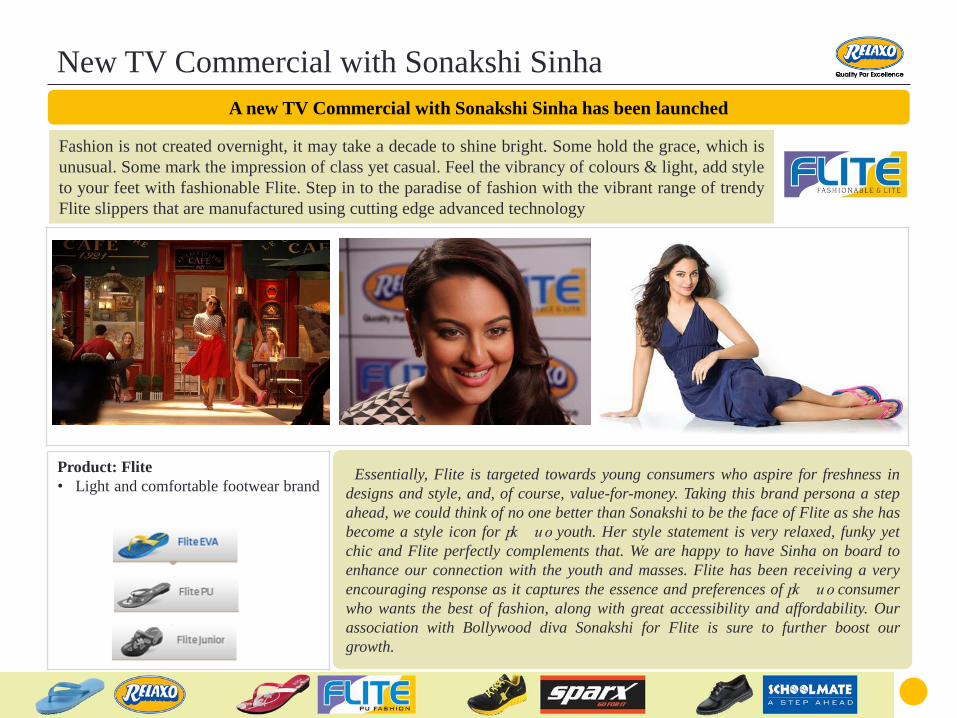
A new TV Commercial with Sonakshi Sinha has been launched
“Essentially, Flite is targeted towards young consumers who aspire for freshness in
designs and style, and, of course, value-for-money. Taking this brand persona a step
ahead, we could think of no one better than Sonakshi to be the face of Flite as she has
become a style icon for today’s youth. Her style statement is very relaxed, funky yet
chic and Flite perfectly complements that. We are happy to have Sinha on board to
enhance our connection with the youth and masses. Flite has been receiving a very
encouraging response as it captures the essence and preferences of today’s consumer
who wants the best of fashion, along with great accessibility and affordability. Our
association with Bollywood diva Sonakshi for Flite is sure to further boost our
growth.”
Fashion is not created overnight, it may take a decade to shine bright. Some hold the grace, which is
unusual. Some mark the impression of class yet casual. Feel the vibrancy of colours & light, add style
to your feet with fashionable Flite. Step in to the paradise of fashion with the vibrant range of trendy
Flite slippers that are manufactured using cutting edge advanced technology
Product: Flite
• Light and comfortable footwear brand
6
Financial Performance
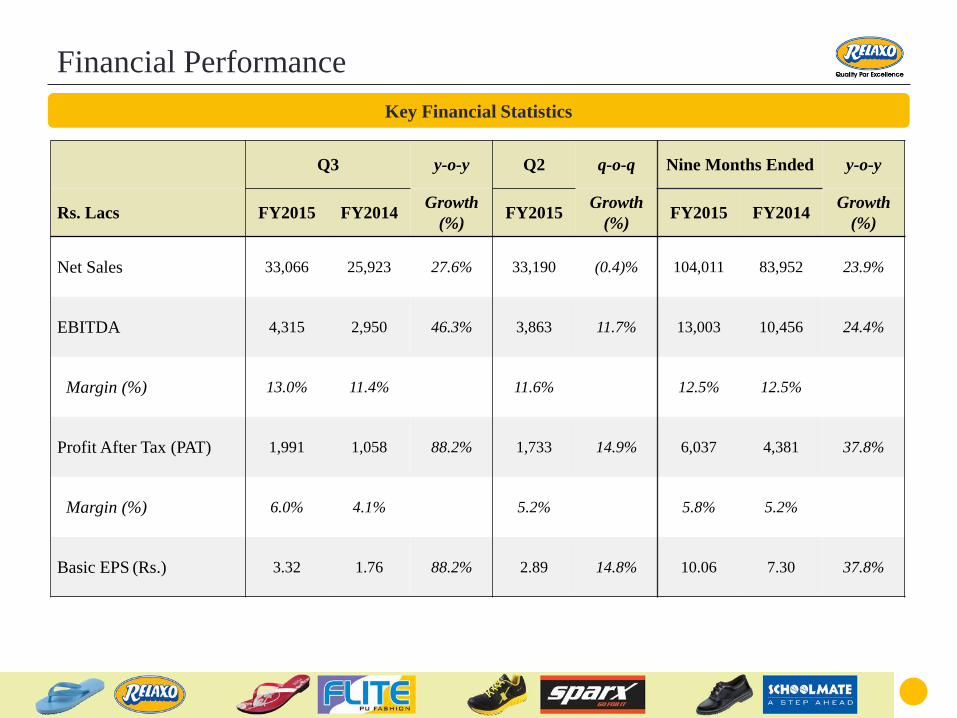
Key Financial Statistics
Q3 y-o-y Q2 q-o-q Nine Months Ended y-o-y
Rs. Lacs FY2015 FY2014Growth
(%)FY2015
Growth
(%)FY2015 FY2014
Growth
(%)
Net Sales 33,066 25,923 27.6% 33,190 (0.4)% 104,011 83,952 23.9%
EBITDA 4,315 2,950 46.3% 3,863 11.7% 13,003 10,456 24.4%
Margin (%) 13.0% 11.4% 11.6% 12.5% 12.5%
Profit After Tax (PAT) 1,991 1,058 88.2% 1,733 14.9% 6,037 4,381 37.8%
Margin (%) 6.0% 4.1% 5.2% 5.8% 5.2%
Basic EPS (Rs.) 3.32 1.76 88.2% 2.89 14.8% 10.06 7.30 37.8%
7
Financial Performance
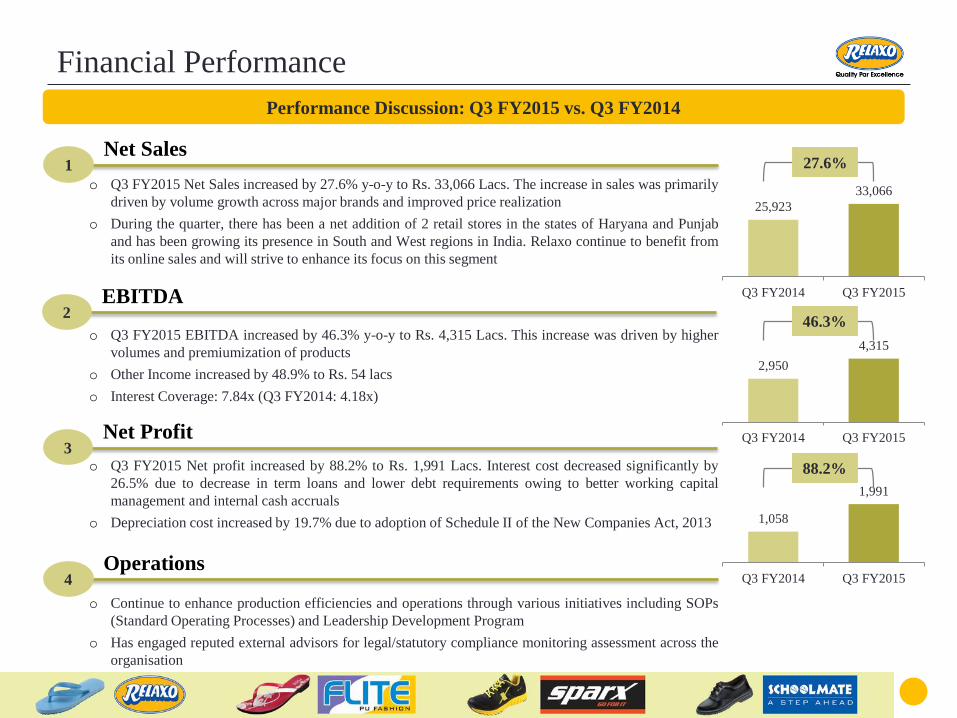
Performance Discussion: Q3 FY2015 vs. Q3 FY2014
Net Sales1
EBITDA2
Net Profit3
Operations4
o Q3 FY2015 EBITDA increased by 46.3% y-o-y to Rs. 4,315 Lacs. This increase was driven by higher
volumes and premiumization of products
o Other Income increased by 48.9% to Rs. 54 lacs
o Interest Coverage: 7.84x (Q3 FY2014: 4.18x)
o Q3 FY2015 Net Sales increased by 27.6% y-o-y to Rs. 33,066 Lacs. The increase in sales was primarily
driven by volume growth across major brands and improved price realization
o During the quarter, there has been a net addition of 2 retail stores in the states of Haryana and Punjab
and has been growing its presence in South and West regions in India. Relaxo continue to benefit from
its online sales and will strive to enhance its focus on this segment
o Continue to enhance production efficiencies and operations through various initiatives including SOPs
(Standard Operating Processes) and Leadership Development Program
o Has engaged reputed external advisors for legal/statutory compliance monitoring assessment across the
organisation
o Q3 FY2015 Net profit increased by 88.2% to Rs. 1,991 Lacs. Interest cost decreased significantly by
26.5% due to decrease in term loans and lower debt requirements owing to better working capital
management and internal cash accruals
o Depreciation cost increased by 19.7% due to adoption of Schedule II of the New Companies Act, 2013
25,923
33,066
Q3 FY2014 Q3 FY2015
2,950
4,315
Q3 FY2014 Q3 FY2015
1,058
1,991
Q3 FY2014 Q3 FY2015
27.6%
46.3%
88.2%
8
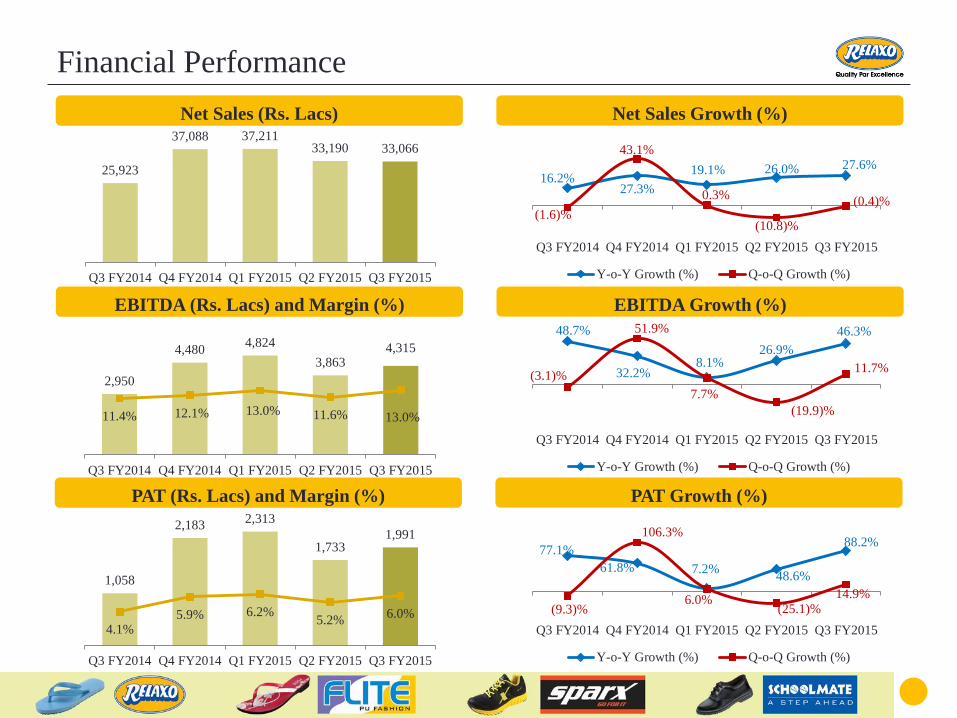
Net Sales (Rs. Lacs) Net Sales Growth (%)
EBITDA (Rs. Lacs) and Margin (%) EBITDA Growth (%)
PAT (Rs. Lacs) and Margin (%) PAT Growth (%)
Financial Performance
25,923
37,088 37,211 33,190 33,066
Q3 FY2014 Q4 FY2014 Q1 FY2015 Q2 FY2015 Q3 FY2015
2,950
4,480 4,824
3,863 4,315
11.4% 12.1% 13.0% 11.6% 13.0%
Q3 FY2014 Q4 FY2014 Q1 FY2015 Q2 FY2015 Q3 FY2015
1,058
2,183 2,313
1,733 1,991
4.1%5.9% 6.2%
5.2%6.0%
Q3 FY2014 Q4 FY2014 Q1 FY2015 Q2 FY2015 Q3 FY2015
16.2%27.3%
19.1% 26.0% 27.6%
(1.6)%
43.1%
0.3%
(10.8)%
(0.4)%
Q3 FY2014 Q4 FY2014 Q1 FY2015 Q2 FY2015 Q3 FY2015
Y-o-Y Growth (%) Q-o-Q Growth (%)
48.7%
32.2%8.1%
26.9%
46.3%
(3.1)%
51.9%
7.7%
(19.9)%
11.7%
Q3 FY2014 Q4 FY2014 Q1 FY2015 Q2 FY2015 Q3 FY2015
Y-o-Y Growth (%) Q-o-Q Growth (%)
77.1%
61.8% 7.2%48.6%
88.2%
(9.3)%
106.3%
6.0%(25.1)%
14.9%
Q3 FY2014 Q4 FY2014 Q1 FY2015 Q2 FY2015 Q3 FY2015
Y-o-Y Growth (%) Q-o-Q Growth (%)
9
Leverage Profile
Particulars
31.12.2014
(Rs. Lacs)
30.09.2014
(Rs. Lacs)
Short Term Borrowings* 6,240 6,528
Long Term Borrowings 9,894 10,323
Total Debt 16,133 16,851
Less: Cash & Bank Balances (326) (410)
Net Debt 15,807 16,441
Net Worth 33,236 31,245
Total Debt (Rs Lacs) and Total Debt/ Equity (x)
Agency Instrument Rating Comment
ICRA Short-Term
Funds
A1 Indicates highest credit
quality rating to short term
debt instruments. Instruments
rated in this category carry
the lowest credit risk in short
term
ICRA Long-Term
Funds
A+ Indicates adequate quality
rating of long term debt
instruments. Instruments
rated in this category carry
low credit risk in long term
* Short term borrowings includes term loans repayable within 1 year
18,210
17,521
22,538
19,835
16,133
1.35x1.02x 1.05x
0.72x
0.49x
FY2011 FY2012 FY2013 FY2014 Dec-14
Debt Debt/Equity
10
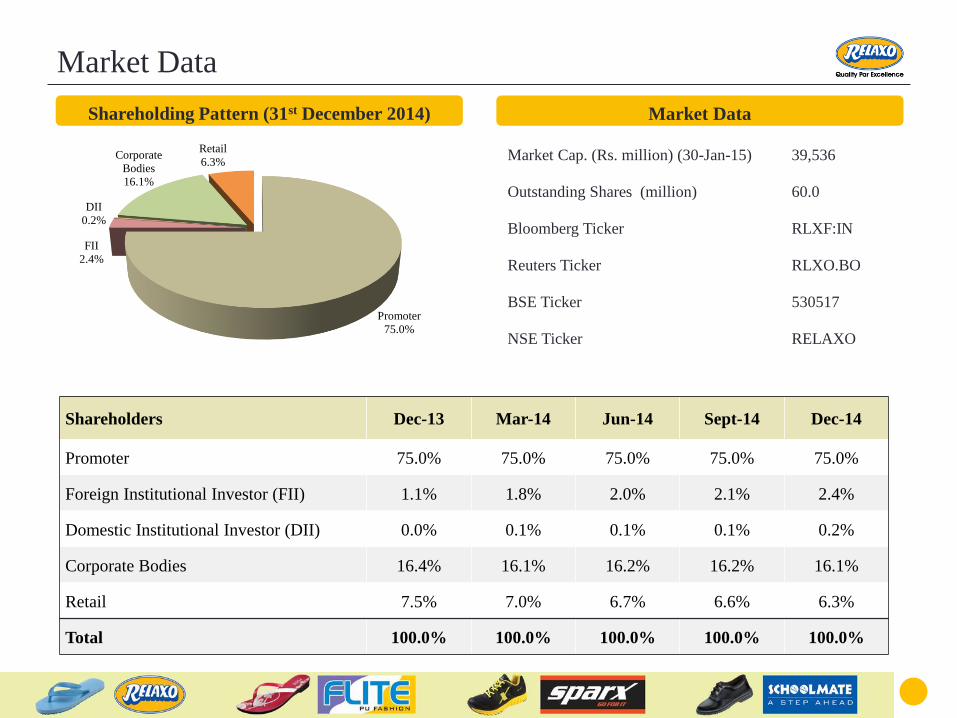
Market Data
Shareholding Pattern (31st December 2014) Market Data
Shareholders Dec-13 Mar-14 Jun-14 Sept-14 Dec-14
Promoter 75.0% 75.0% 75.0% 75.0% 75.0%
Foreign Institutional Investor (FII) 1.1% 1.8% 2.0% 2.1% 2.4%
Domestic Institutional Investor (DII) 0.0% 0.1% 0.1% 0.1% 0.2%
Corporate Bodies 16.4% 16.1% 16.2% 16.2% 16.1%
Retail 7.5% 7.0% 6.7% 6.6% 6.3%
Total 100.0% 100.0% 100.0% 100.0% 100.0%
Market Cap. (Rs. million) (30-Jan-15) 39,536
Outstanding Shares (million) 60.0
Bloomberg Ticker RLXF:IN
Reuters Ticker RLXO.BO
BSE Ticker 530517
NSE Ticker RELAXO
Promoter
75.0%
FII
2.4%
DII
0.2%
Corporate
Bodies
16.1%
Retail
6.3%
11
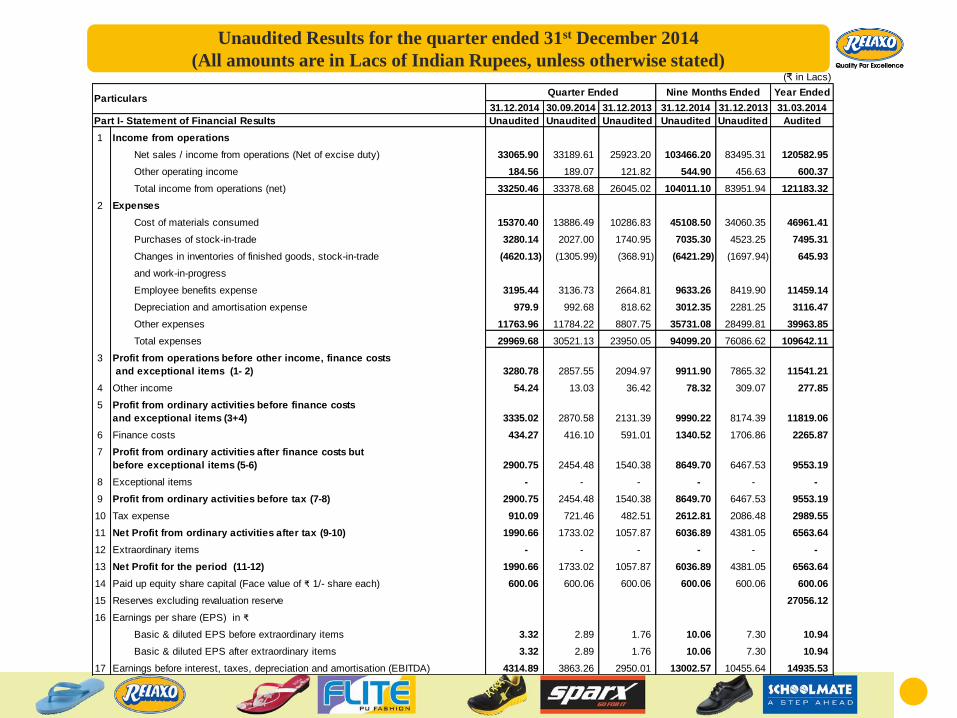
Statutory Financials (₹ in Lacs)
31.12.2014 30.09.2014 31.12.2013 31.12.2014 31.12.2013 31.03.2014
Part I- Statement of Financial Results Unaudited Unaudited Unaudited Unaudited Unaudited Audited
1 Income from operations
Net sales / income from operations (Net of excise duty) 33065.90 33189.61 25923.20 103466.20 83495.31 120582.95
Other operating income 184.56 189.07 121.82 544.90 456.63 600.37
Total income from operations (net) 33250.46 33378.68 26045.02 104011.10 83951.94 121183.32
2 Expenses
Cost of materials consumed 15370.40 13886.49 10286.83 45108.50 34060.35 46961.41
Purchases of stock-in-trade 3280.14 2027.00 1740.95 7035.30 4523.25 7495.31
Changes in inventories of finished goods, stock-in-trade (4620.13) (1305.99) (368.91) (6421.29) (1697.94) 645.93
and work-in-progress
Employee benefits expense 3195.44 3136.73 2664.81 9633.26 8419.90 11459.14
Depreciation and amortisation expense 979.9 992.68 818.62 3012.35 2281.25 3116.47
Other expenses 11763.96 11784.22 8807.75 35731.08 28499.81 39963.85
Total expenses 29969.68 30521.13 23950.05 94099.20 76086.62 109642.11
3 Profit from operations before other income, finance costs
and exceptional items (1- 2) 3280.78 2857.55 2094.97 9911.90 7865.32 11541.21
4 Other income 54.24 13.03 36.42 78.32 309.07 277.85
5 Profit from ordinary activities before finance costs
and exceptional items (3+4) 3335.02 2870.58 2131.39 9990.22 8174.39 11819.06
6 Finance costs 434.27 416.10 591.01 1340.52 1706.86 2265.87
7 Profit from ordinary activities after finance costs but
before exceptional items (5-6) 2900.75 2454.48 1540.38 8649.70 6467.53 9553.19
8 Exceptional items - - - - - -
9 Profit from ordinary activities before tax (7-8) 2900.75 2454.48 1540.38 8649.70 6467.53 9553.19
10 Tax expense 910.09 721.46 482.51 2612.81 2086.48 2989.55
11 Net Profit from ordinary activities after tax (9-10) 1990.66 1733.02 1057.87 6036.89 4381.05 6563.64
12 Extraordinary items - - - - - -
13 Net Profit for the period (11-12) 1990.66 1733.02 1057.87 6036.89 4381.05 6563.64
14 Paid up equity share capital (Face value of ₹ 1/- share each) 600.06 600.06 600.06 600.06 600.06 600.06
15 Reserves excluding revaluation reserve 27056.12
16 Earnings per share (EPS) in ₹
Basic & diluted EPS before extraordinary items 3.32 2.89 1.76 10.06 7.30 10.94
Basic & diluted EPS after extraordinary items 3.32 2.89 1.76 10.06 7.30 10.94
17 Earnings before interest, taxes, depreciation and amortisation (EBITDA) 4314.89 3863.26 2950.01 13002.57 10455.64 14935.53
Particulars Quarter Ended Nine Months Ended Year Ended
Unaudited Results for the quarter ended 31st December 2014
(All amounts are in Lacs of Indian Rupees, unless otherwise stated)
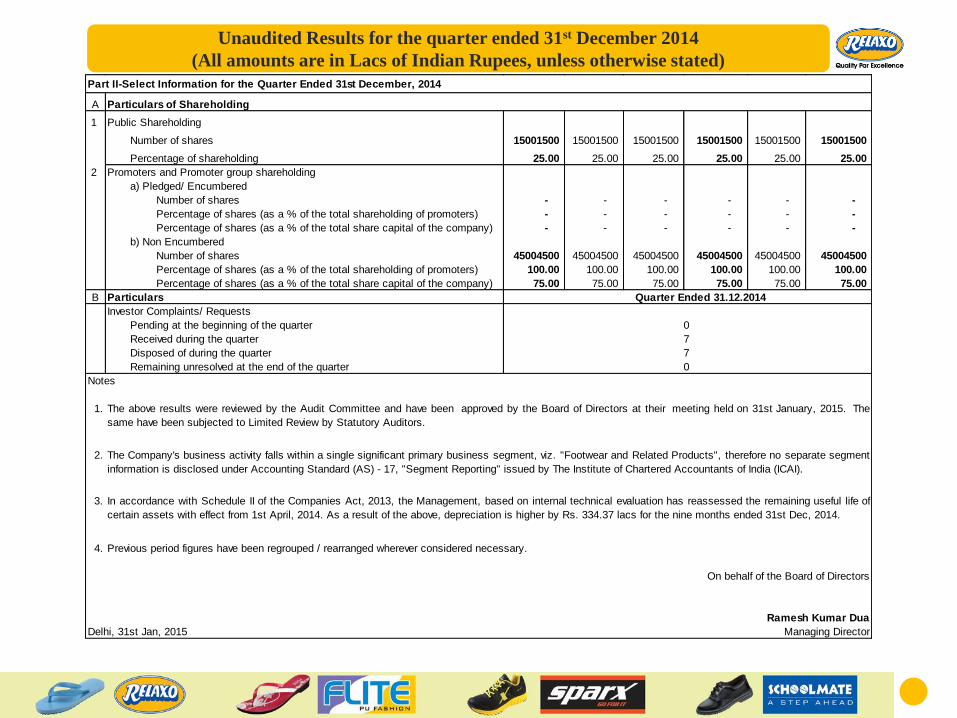
12
Statutory Financials
Unaudited Results for the quarter ended 31st December 2014
(All amounts are in Lacs of Indian Rupees, unless otherwise stated)
A
1 Public Shareholding
Number of shares 15001500 15001500 15001500 15001500 15001500 15001500
Percentage of shareholding 25.00 25.00 25.00 25.00 25.00 25.00
2 Promoters and Promoter group shareholding
a) Pledged/ Encumbered
Number of shares - - - - - -
Percentage of shares (as a % of the total shareholding of promoters) - - - - - -
Percentage of shares (as a % of the total share capital of the company) - - - - - -
b) Non Encumbered
Number of shares 45004500 45004500 45004500 45004500 45004500 45004500
Percentage of shares (as a % of the total shareholding of promoters) 100.00 100.00 100.00 100.00 100.00 100.00
Percentage of shares (as a % of the total share capital of the company) 75.00 75.00 75.00 75.00 75.00 75.00
B Particulars
Investor Complaints/ Requests
Pending at the beginning of the quarter
Received during the quarter
Disposed of during the quarter
Remaining unresolved at the end of the quarter
Notes
1.
2.
3.
4.
On behalf of the Board of Directors
Ramesh Kumar Dua
Delhi, 31st Jan, 2015 Managing Director
The above results were reviewed by the Audit Committee and have been approved by the Board of Directors at their meeting held on 31st January, 2015. The
same have been subjected to Limited Review by Statutory Auditors.
The Company's business activity falls within a single significant primary business segment, viz. "Footwear and Related Products", therefore no separate segment
information is disclosed under Accounting Standard (AS) - 17, "Segment Reporting" issued by The Institute of Chartered Accountants of India (ICAI).
In accordance with Schedule II of the Companies Act, 2013, the Management, based on internal technical evaluation has reassessed the remaining useful life of
certain assets with effect from 1st April, 2014. As a result of the above, depreciation is higher by Rs. 334.37 lacs for the nine months ended 31st Dec, 2014.
Previous period figures have been regrouped / rearranged wherever considered necessary.
7
0
7
Quarter Ended 31.12.2014
0
Part II-Select Information for the Quarter Ended 31st December, 2014
Particulars of Shareholding
13
Relaxo Footwears Limited(CIN: L74899DL1984PLC019097)
Aggarwal City Square, Plot No. 10,
Mangalam Palace, District Centre, Sector -3,
Rohini, New Delhi-110 085
Ph: +91 11 4680 0500 • Fax: +91 11 4680 0692
www.relaxofootwear.com
Sushil Batra
CFO - Relaxo Footwears
+91 11 4680 0500
Kapil Garg
Company Secretary - Relaxo Footwears
+91 11 4680 0500
Deepak Balwani
Churchgate Partners
+91 22 3953 7444