Embed Size (px)
Citation preview
allantools DocumentationRelease 2018.03
by the allantools team
May 30, 2018

Contents
1 AllanTools 1
2 Documentation 3
3 IPython notebooks with examples 5
4 Authors 7
5 Installation 9
6 Usage 11
7 Tests 13
8 Getting started 158.1 Installation . . . . . . . . . . . . . . . . . . . . . . . . . . . . . . . . . . . . . . . . . . . . . . . . 158.2 Basic usage . . . . . . . . . . . . . . . . . . . . . . . . . . . . . . . . . . . . . . . . . . . . . . . . 15
9 API 179.1 The Dataset() class . . . . . . . . . . . . . . . . . . . . . . . . . . . . . . . . . . . . . . . . . . . . 179.2 The Plot() class . . . . . . . . . . . . . . . . . . . . . . . . . . . . . . . . . . . . . . . . . . . . . . 189.3 Implemented statistics functions . . . . . . . . . . . . . . . . . . . . . . . . . . . . . . . . . . . . . 199.4 Low-level access to the statistics functions . . . . . . . . . . . . . . . . . . . . . . . . . . . . . . . 19
10 Function listing 2110.1 Statistics . . . . . . . . . . . . . . . . . . . . . . . . . . . . . . . . . . . . . . . . . . . . . . . . . 2110.2 Noise Generation . . . . . . . . . . . . . . . . . . . . . . . . . . . . . . . . . . . . . . . . . . . . . 2610.3 Utilities . . . . . . . . . . . . . . . . . . . . . . . . . . . . . . . . . . . . . . . . . . . . . . . . . . 27
11 Development 3111.1 To-do list . . . . . . . . . . . . . . . . . . . . . . . . . . . . . . . . . . . . . . . . . . . . . . . . . 3111.2 Notes for Pypi . . . . . . . . . . . . . . . . . . . . . . . . . . . . . . . . . . . . . . . . . . . . . . 31
12 References 3312.1 Code . . . . . . . . . . . . . . . . . . . . . . . . . . . . . . . . . . . . . . . . . . . . . . . . . . . 3312.2 Papers . . . . . . . . . . . . . . . . . . . . . . . . . . . . . . . . . . . . . . . . . . . . . . . . . . 33
Bibliography 35
i

ii
CHAPTER 1
AllanTools
A python library for calculating Allan deviation and related time & frequency statistics. LGPL v3+ license.
Developed at https://github.com/aewallin/allantools and also available on PyPi at https://pypi.python.org/pypi/AllanTools Discussion group at https://groups.google.com/d/forum/allantools
Input data should be evenly spaced observations of either fractional frequency, or phase in seconds. Deviations arecalculated for given tau values in seconds.
These statistics are currently included:
• adev() Allan deviation
• oadev() overlapping Allan deviation,
• mdev() modified Allan deviation,
• tdev() Time deviation
• hdev() Hadamard deviation
• ohdev() overlapping Hadamard deviation
• totdev() total Allan deviation
• mtie() Maximum time interval error
• tierms() Time interval error RMS
• mtotdev() Modified total deviation
• ttotdev() Time total deviation
• htotdev() Hadamard total deviation
• theo1() Thêo1 deviation
Noise generators for creating synthetic datasets are also included:
• violet noise with f^2 PSD
• white noise with f^0 PSD
1

allantools Documentation, Release 2018.03
• pink noise with f^-1 PSD
• Brownian or random walk noise with f^-2 PSD
see /tests for tests that compare allantools output to other (e.g. Stable32) programs. More test data, benchmarks,ipython notebooks, and comparisons to known-good algorithms are welcome!
2 Chapter 1. AllanTools
CHAPTER 2
Documentation
See /docs for documentation in sphinx format. On Ubuntu this requires the python-sphinx and python-numpydocpackages. html/pdf documentation using sphinx can be built locally with:
/docs$ make html/docs$ make latexpdf
this generates html documentation in docs/_build/html and pdf documentation in docs/_build/latex.
The sphinx documentation is also auto-generated online
• http://allantools.readthedocs.org
3
allantools Documentation, Release 2018.03
4 Chapter 2. Documentation
CHAPTER 3
IPython notebooks with examples
See /examples for some examples in IPython notebook format.
github formats the notebooks into nice web-pages, for example
• https://github.com/aewallin/allantools/blob/master/examples/noise-color-demo.ipynb
• https://github.com/aewallin/allantools/blob/master/examples/three-cornered-hat-demo.ipynb
todo: add here a very short guide on how to get started with ipython
5
allantools Documentation, Release 2018.03
6 Chapter 3. IPython notebooks with examples
CHAPTER 4
Authors
• Anders E.E. Wallin, anders.e.e.wallin “at” gmail.com
• Danny Price, https://github.com/telegraphic
• Cantwell G. Carson, carsonc “at” gmail.com
• Frédéric Meynadier, https://github.com/fmeynadier
7
allantools Documentation, Release 2018.03
8 Chapter 4. Authors
CHAPTER 5
Installation
clone from github, then install with:
sudo python setup.py install
(see python setup.py –help install for install options)
or download from pypi:
sudo pip install allantools
9
allantools Documentation, Release 2018.03
10 Chapter 5. Installation
CHAPTER 6
Usage
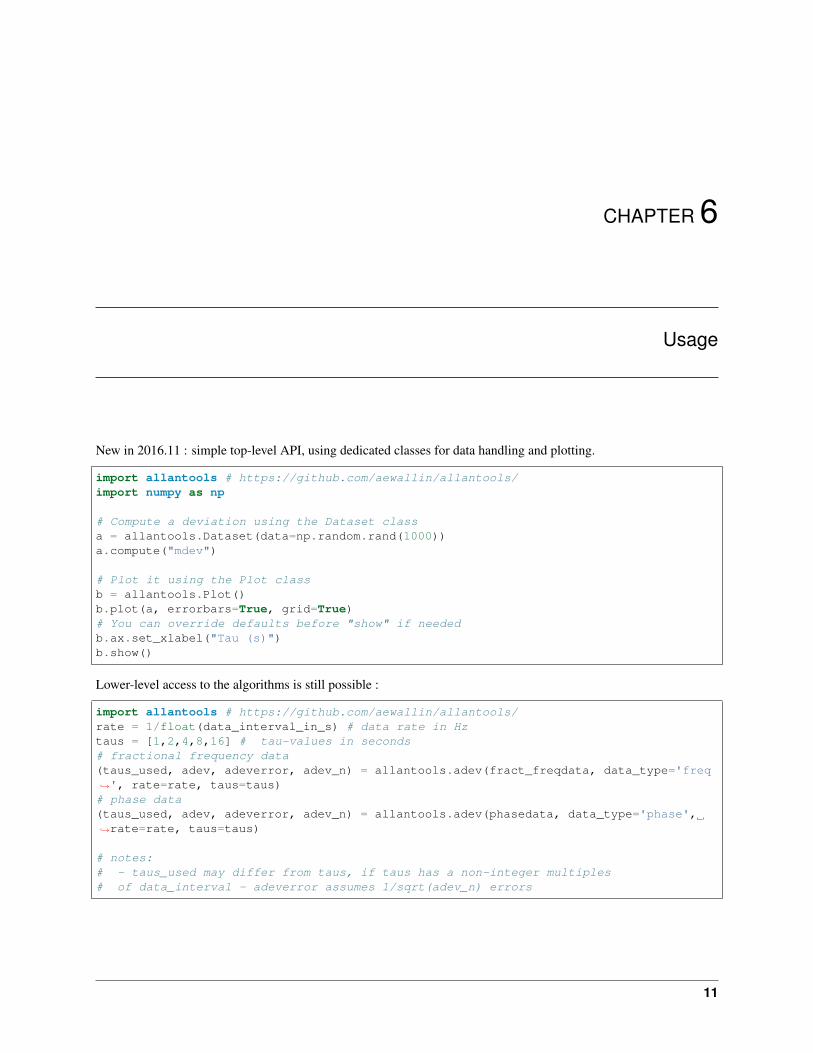
New in 2016.11 : simple top-level API, using dedicated classes for data handling and plotting.
import allantools # https://github.com/aewallin/allantools/import numpy as np
# Compute a deviation using the Dataset classa = allantools.Dataset(data=np.random.rand(1000))a.compute("mdev")
# Plot it using the Plot classb = allantools.Plot()b.plot(a, errorbars=True, grid=True)# You can override defaults before "show" if neededb.ax.set_xlabel("Tau (s)")b.show()
Lower-level access to the algorithms is still possible :
import allantools # https://github.com/aewallin/allantools/rate = 1/float(data_interval_in_s) # data rate in Hztaus = [1,2,4,8,16] # tau-values in seconds# fractional frequency data(taus_used, adev, adeverror, adev_n) = allantools.adev(fract_freqdata, data_type='freq→˓', rate=rate, taus=taus)# phase data(taus_used, adev, adeverror, adev_n) = allantools.adev(phasedata, data_type='phase',→˓rate=rate, taus=taus)
# notes:# - taus_used may differ from taus, if taus has a non-integer multiples# of data_interval - adeverror assumes 1/sqrt(adev_n) errors
11
allantools Documentation, Release 2018.03
12 Chapter 6. Usage
CHAPTER 7
Tests
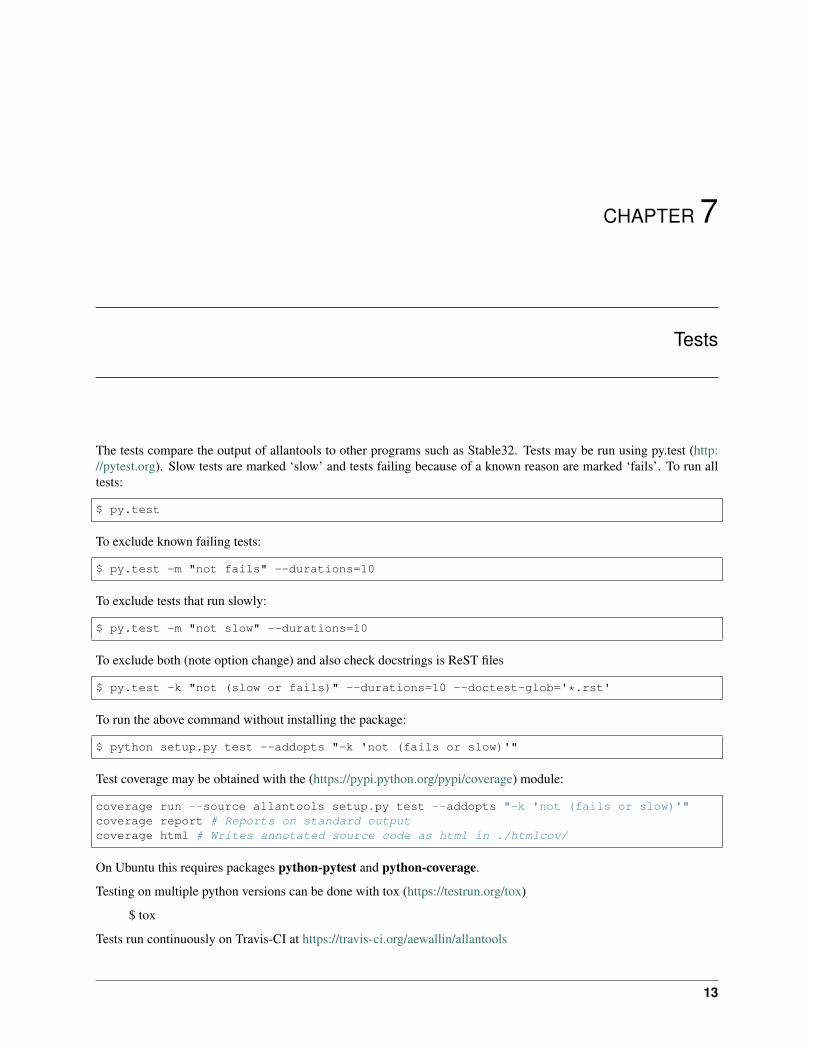
The tests compare the output of allantools to other programs such as Stable32. Tests may be run using py.test (http://pytest.org). Slow tests are marked ‘slow’ and tests failing because of a known reason are marked ‘fails’. To run alltests:
$ py.test
To exclude known failing tests:
$ py.test -m "not fails" --durations=10
To exclude tests that run slowly:
$ py.test -m "not slow" --durations=10
To exclude both (note option change) and also check docstrings is ReST files
$ py.test -k "not (slow or fails)" --durations=10 --doctest-glob='*.rst'
To run the above command without installing the package:
$ python setup.py test --addopts "-k 'not (fails or slow)'"
Test coverage may be obtained with the (https://pypi.python.org/pypi/coverage) module:
coverage run --source allantools setup.py test --addopts "-k 'not (fails or slow)'"coverage report # Reports on standard outputcoverage html # Writes annotated source code as html in ./htmlcov/
On Ubuntu this requires packages python-pytest and python-coverage.
Testing on multiple python versions can be done with tox (https://testrun.org/tox)
$ tox
Tests run continuously on Travis-CI at https://travis-ci.org/aewallin/allantools
13
allantools Documentation, Release 2018.03
14 Chapter 7. Tests
CHAPTER 8
Getting started
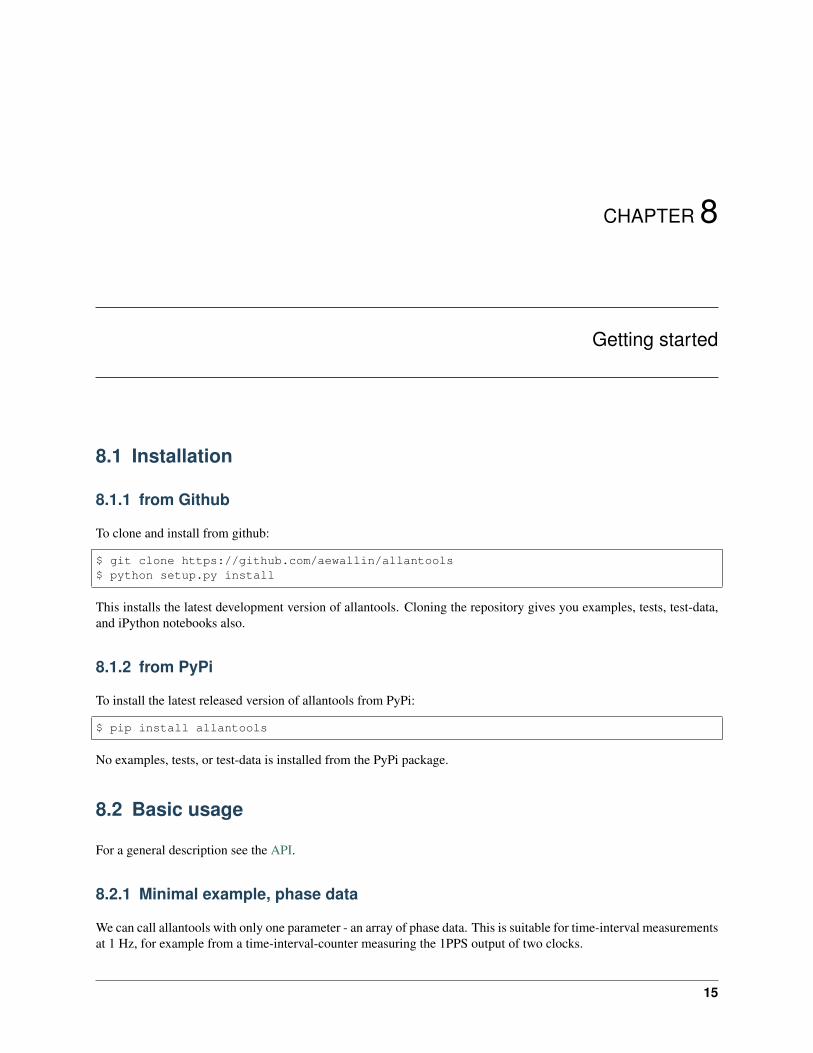
8.1 Installation
8.1.1 from Github
To clone and install from github:
$ git clone https://github.com/aewallin/allantools$ python setup.py install
This installs the latest development version of allantools. Cloning the repository gives you examples, tests, test-data,and iPython notebooks also.
8.1.2 from PyPi
To install the latest released version of allantools from PyPi:
$ pip install allantools
No examples, tests, or test-data is installed from the PyPi package.
8.2 Basic usage
For a general description see the API.
8.2.1 Minimal example, phase data
We can call allantools with only one parameter - an array of phase data. This is suitable for time-interval measurementsat 1 Hz, for example from a time-interval-counter measuring the 1PPS output of two clocks.
15
allantools Documentation, Release 2018.03
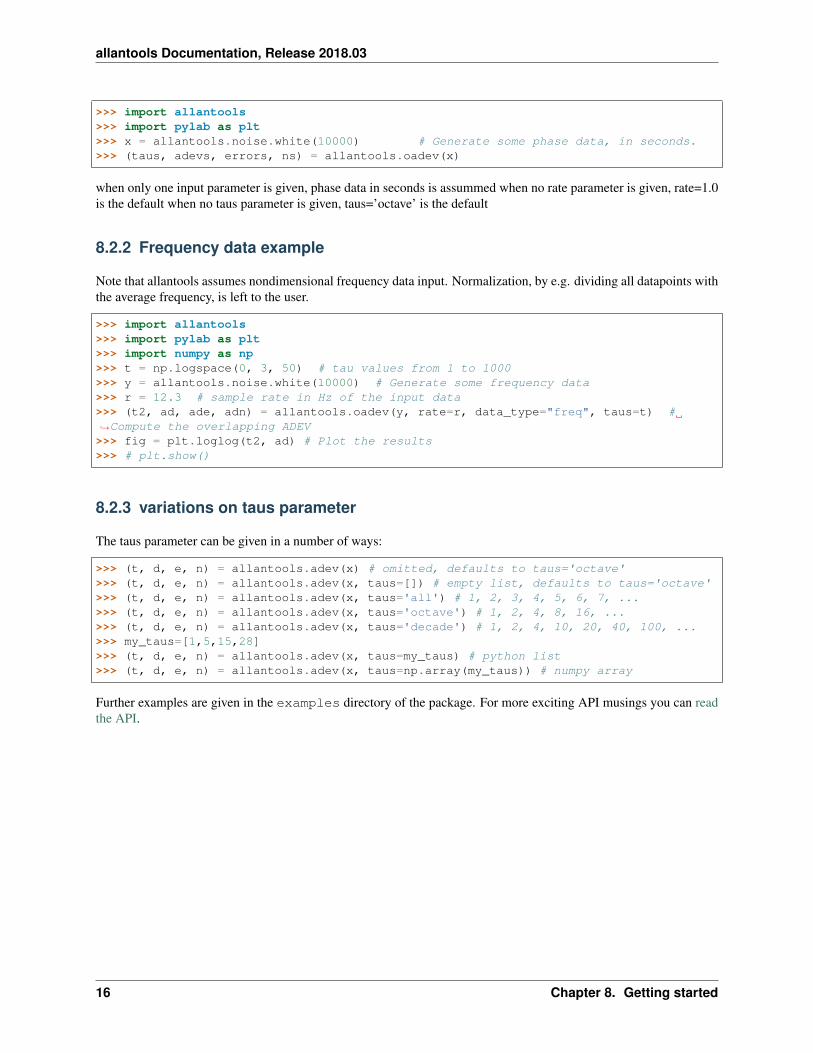
>>> import allantools>>> import pylab as plt>>> x = allantools.noise.white(10000) # Generate some phase data, in seconds.>>> (taus, adevs, errors, ns) = allantools.oadev(x)
when only one input parameter is given, phase data in seconds is assummed when no rate parameter is given, rate=1.0is the default when no taus parameter is given, taus=’octave’ is the default
8.2.2 Frequency data example
Note that allantools assumes nondimensional frequency data input. Normalization, by e.g. dividing all datapoints withthe average frequency, is left to the user.
>>> import allantools>>> import pylab as plt>>> import numpy as np>>> t = np.logspace(0, 3, 50) # tau values from 1 to 1000>>> y = allantools.noise.white(10000) # Generate some frequency data>>> r = 12.3 # sample rate in Hz of the input data>>> (t2, ad, ade, adn) = allantools.oadev(y, rate=r, data_type="freq", taus=t) #→˓Compute the overlapping ADEV>>> fig = plt.loglog(t2, ad) # Plot the results>>> # plt.show()
8.2.3 variations on taus parameter
The taus parameter can be given in a number of ways:
>>> (t, d, e, n) = allantools.adev(x) # omitted, defaults to taus='octave'>>> (t, d, e, n) = allantools.adev(x, taus=[]) # empty list, defaults to taus='octave'>>> (t, d, e, n) = allantools.adev(x, taus='all') # 1, 2, 3, 4, 5, 6, 7, ...>>> (t, d, e, n) = allantools.adev(x, taus='octave') # 1, 2, 4, 8, 16, ...>>> (t, d, e, n) = allantools.adev(x, taus='decade') # 1, 2, 4, 10, 20, 40, 100, ...>>> my_taus=[1,5,15,28]>>> (t, d, e, n) = allantools.adev(x, taus=my_taus) # python list>>> (t, d, e, n) = allantools.adev(x, taus=np.array(my_taus)) # numpy array
Further examples are given in the examples directory of the package. For more exciting API musings you can readthe API.
16 Chapter 8. Getting started
CHAPTER 9
API
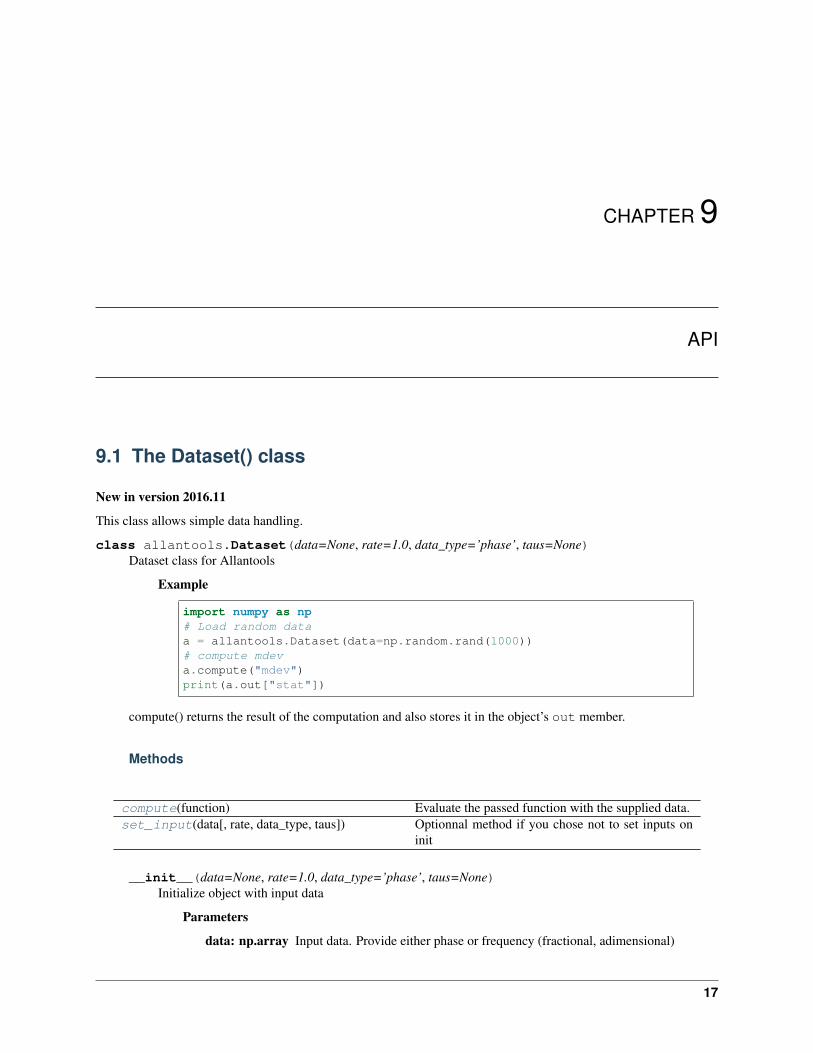
9.1 The Dataset() class
New in version 2016.11
This class allows simple data handling.
class allantools.Dataset(data=None, rate=1.0, data_type=’phase’, taus=None)Dataset class for Allantools
Example
import numpy as np# Load random dataa = allantools.Dataset(data=np.random.rand(1000))# compute mdeva.compute("mdev")print(a.out["stat"])
compute() returns the result of the computation and also stores it in the object’s out member.
Methods
compute(function) Evaluate the passed function with the supplied data.set_input(data[, rate, data_type, taus]) Optionnal method if you chose not to set inputs on
init
__init__(data=None, rate=1.0, data_type=’phase’, taus=None)Initialize object with input data
Parameters
data: np.array Input data. Provide either phase or frequency (fractional, adimensional)
17
allantools Documentation, Release 2018.03
rate: float The sampling rate for data, in Hz. Defaults to 1.0
data_typ: {‘phase’, ‘freq’} Data type, i.e. phase or frequency. Defaults to “phase”.
taus: np.array Array of tau values, in seconds, for which to compute statistic. Optionallyset taus=[“all”|”octave”|”decade”] for automatic calculation of taus list
Returns
Dataset() A Dataset() instance
inp = {'data': None, 'data_type': None, 'rate': None, 'taus': None}input data Dict, will be initialized by __init__()
out = {'stat': None, 'stat_err': None, 'stat_id': None, 'stat_n': None, 'stat_unc': None, 'taus': None}output data Dict, to be populated by compute()
set_input(data, rate=1.0, data_type=’phase’, taus=None)Optionnal method if you chose not to set inputs on init
Parameters
data: np.array Input data. Provide either phase or frequency (fractional, adimensional)
rate: float The sampling rate for data, in Hz. Defaults to 1.0
data_typ: {‘phase’, ‘freq’} Data type, i.e. phase or frequency. Defaults to “phase”.
taus: np.array Array of tau values, in seconds, for which to compute statistic. Optionallyset taus=[“all”|”octave”|”decade”] for automatic
compute(function)Evaluate the passed function with the supplied data.
Stores result in self.out.
Parameters
function: str Name of the allantools function to evaluate
Returns
result: dict The results of the calculation.
9.2 The Plot() class
New in version 2016.11
This class allows simple data plotting.
class allantools.Plot(no_display=False)A class for plotting data once computed by Allantools
Example import allantools import numpy as np a = allantools.Dataset(data=np.random.rand(1000))a.compute(“mdev”) b = allantools.Plot() b.plot(a) b.show()
Uses matplotlib. self.fig and self.ax stores the return values of matplotlib.pyplot.subplots(). plot() sets variousdefaults, but you can change them by using standard matplotlib method on self.fig and self.ax
Methods
18 Chapter 9. API
allantools Documentation, Release 2018.03
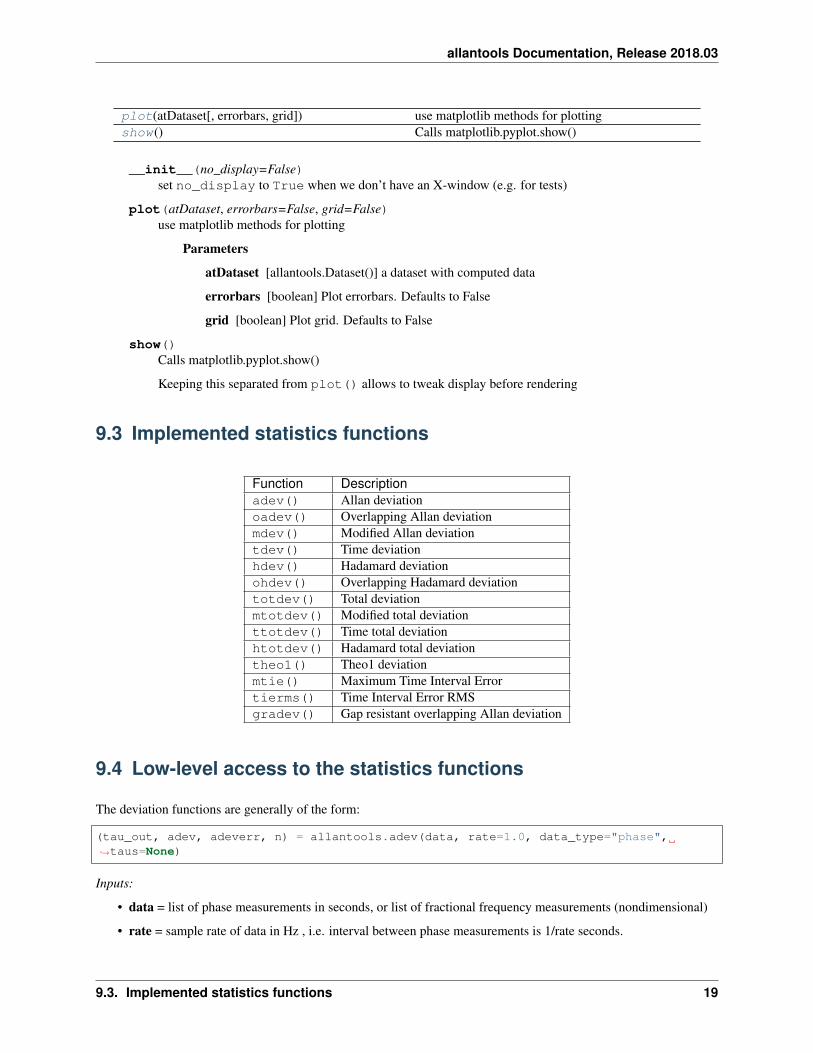
plot(atDataset[, errorbars, grid]) use matplotlib methods for plottingshow() Calls matplotlib.pyplot.show()
__init__(no_display=False)set no_display to True when we don’t have an X-window (e.g. for tests)
plot(atDataset, errorbars=False, grid=False)use matplotlib methods for plotting
Parameters
atDataset [allantools.Dataset()] a dataset with computed data
errorbars [boolean] Plot errorbars. Defaults to False
grid [boolean] Plot grid. Defaults to False
show()Calls matplotlib.pyplot.show()
Keeping this separated from plot() allows to tweak display before rendering
9.3 Implemented statistics functions
Function Descriptionadev() Allan deviationoadev() Overlapping Allan deviationmdev() Modified Allan deviationtdev() Time deviationhdev() Hadamard deviationohdev() Overlapping Hadamard deviationtotdev() Total deviationmtotdev() Modified total deviationttotdev() Time total deviationhtotdev() Hadamard total deviationtheo1() Theo1 deviationmtie() Maximum Time Interval Errortierms() Time Interval Error RMSgradev() Gap resistant overlapping Allan deviation
9.4 Low-level access to the statistics functions
The deviation functions are generally of the form:
(tau_out, adev, adeverr, n) = allantools.adev(data, rate=1.0, data_type="phase",→˓taus=None)
Inputs:
• data = list of phase measurements in seconds, or list of fractional frequency measurements (nondimensional)
• rate = sample rate of data in Hz , i.e. interval between phase measurements is 1/rate seconds.
9.3. Implemented statistics functions 19
allantools Documentation, Release 2018.03
• data_type= = either “phase” or “freq”
• taus = list of tau-values for ADEV computation. The keywords “all”, “octave”, or “decade” can also be used.
Outputs
• tau_out = list of tau-values for which deviations were computed
• adev = list of ADEV (or another statistic) deviations
• adeverr = list of estimated errors of allan deviations. some functions instead return a confidence interval (err_l,err_h)
• n = list of number of pairs in allan computation. standard error is adeverr = adev/sqrt(n)
20 Chapter 9. API
CHAPTER 10
Function listing
10.1 Statistics
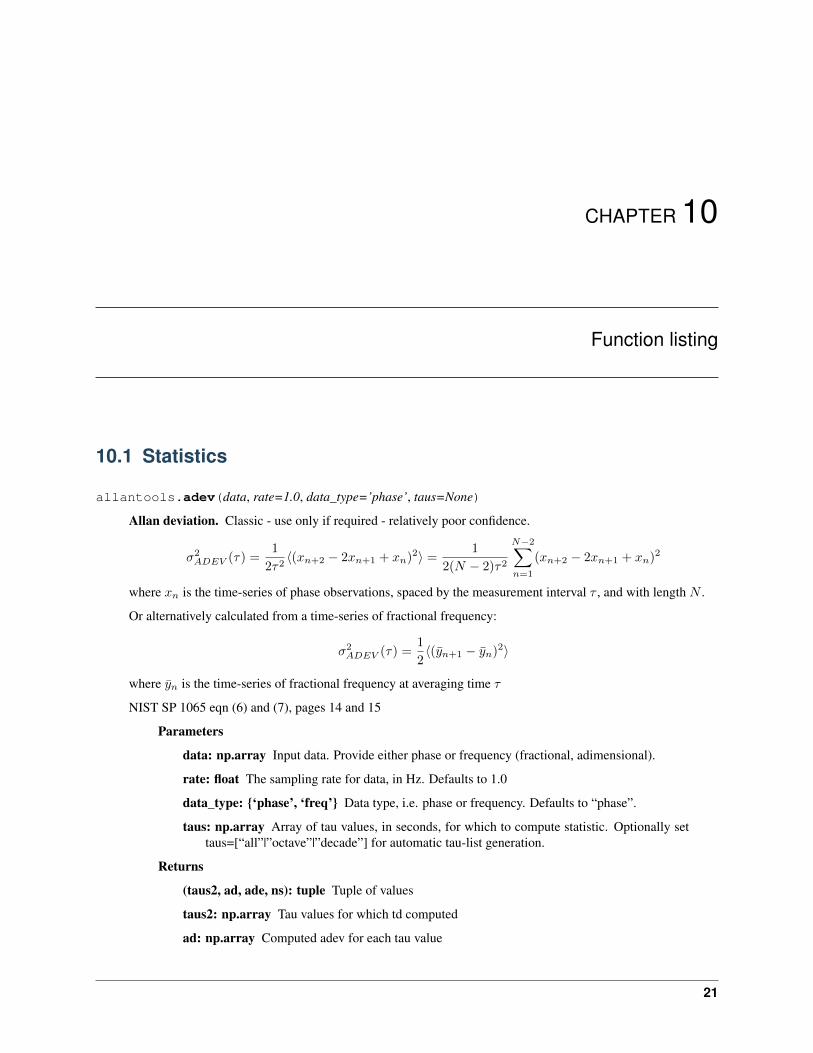
allantools.adev(data, rate=1.0, data_type=’phase’, taus=None)
Allan deviation. Classic - use only if required - relatively poor confidence.
𝜎2𝐴𝐷𝐸𝑉 (𝜏) =
1
2𝜏2⟨(𝑥𝑛+2 − 2𝑥𝑛+1 + 𝑥𝑛)2⟩ =
1
2(𝑁 − 2)𝜏2
𝑁−2∑︁𝑛=1
(𝑥𝑛+2 − 2𝑥𝑛+1 + 𝑥𝑛)2
where 𝑥𝑛 is the time-series of phase observations, spaced by the measurement interval 𝜏 , and with length 𝑁 .
Or alternatively calculated from a time-series of fractional frequency:
𝜎2𝐴𝐷𝐸𝑉 (𝜏) =
1
2⟨(𝑦𝑛+1 − 𝑦𝑛)2⟩
where 𝑦𝑛 is the time-series of fractional frequency at averaging time 𝜏
NIST SP 1065 eqn (6) and (7), pages 14 and 15
Parameters
data: np.array Input data. Provide either phase or frequency (fractional, adimensional).
rate: float The sampling rate for data, in Hz. Defaults to 1.0
data_type: {‘phase’, ‘freq’} Data type, i.e. phase or frequency. Defaults to “phase”.
taus: np.array Array of tau values, in seconds, for which to compute statistic. Optionally settaus=[“all”|”octave”|”decade”] for automatic tau-list generation.
Returns
(taus2, ad, ade, ns): tuple Tuple of values
taus2: np.array Tau values for which td computed
ad: np.array Computed adev for each tau value
21
allantools Documentation, Release 2018.03
ade: np.array adev errors
ns: np.array Values of N used in each adev calculation
allantools.oadev(data, rate=1.0, data_type=’phase’, taus=None)
overlapping Allan deviation. General purpose - most widely used - first choice
𝜎2𝑂𝐴𝐷𝐸𝑉 (𝑚𝜏0) =
1
2(𝑚𝜏0)2(𝑁 − 2𝑚)
𝑁−2𝑚∑︁𝑛=1
(𝑥𝑛+2𝑚 − 2𝑥𝑛+1𝑚 + 𝑥𝑛)2
where 𝜎2𝑥(𝑚𝜏0) is the overlapping Allan deviation at an averaging time of 𝜏 = 𝑚𝜏0, and 𝑥𝑛 is the time-series
of phase observations, spaced by the measurement interval 𝜏0, with length 𝑁 .
Parameters
data: np.array Input data. Provide either phase or frequency (fractional, adimensional).
rate: float The sampling rate for data, in Hz. Defaults to 1.0
data_type: {‘phase’, ‘freq’} Data type, i.e. phase or frequency. Defaults to “phase”.
taus: np.array Array of tau values, in seconds, for which to compute statistic. Optionally settaus=[“all”|”octave”|”decade”] for automatic tau-list generation.
Returns
(taus2, ad, ade, ns): tuple Tuple of values
taus2: np.array Tau values for which td computed
ad: np.array Computed oadev for each tau value
ade: np.array oadev errors
ns: np.array Values of N used in each oadev calculation
allantools.mdev(data, rate=1.0, data_type=’phase’, taus=None)
Modified Allan deviation. Used to distinguish between White and Flicker Phase Modulation.
𝜎2𝑀𝐷𝐸𝑉 (𝑚𝜏0) =
1
2(𝑚𝜏0)2(𝑁 − 3𝑚 + 1)
𝑁−3𝑚+1∑︁𝑗=1
{𝑗+𝑚−1∑︁
𝑖=𝑗
𝑥𝑖+2𝑚 − 2𝑥𝑖+𝑚 + 𝑥𝑖}2
Parameters
data: np.array Input data. Provide either phase or frequency (fractional, adimensional).
rate: float The sampling rate for data, in Hz. Defaults to 1.0
data_type: {‘phase’, ‘freq’} Data type, i.e. phase or frequency. Defaults to “phase”.
taus: np.array Array of tau values, in seconds, for which to compute statistic. Optionally settaus=[“all”|”octave”|”decade”] for automatic tau-list generation.
Returns
(taus2, md, mde, ns): tuple Tuple of values
taus2: np.array Tau values for which td computed
md: np.array Computed mdev for each tau value
mde: np.array mdev errors
ns: np.array Values of N used in each mdev calculation
22 Chapter 10. Function listing
allantools Documentation, Release 2018.03
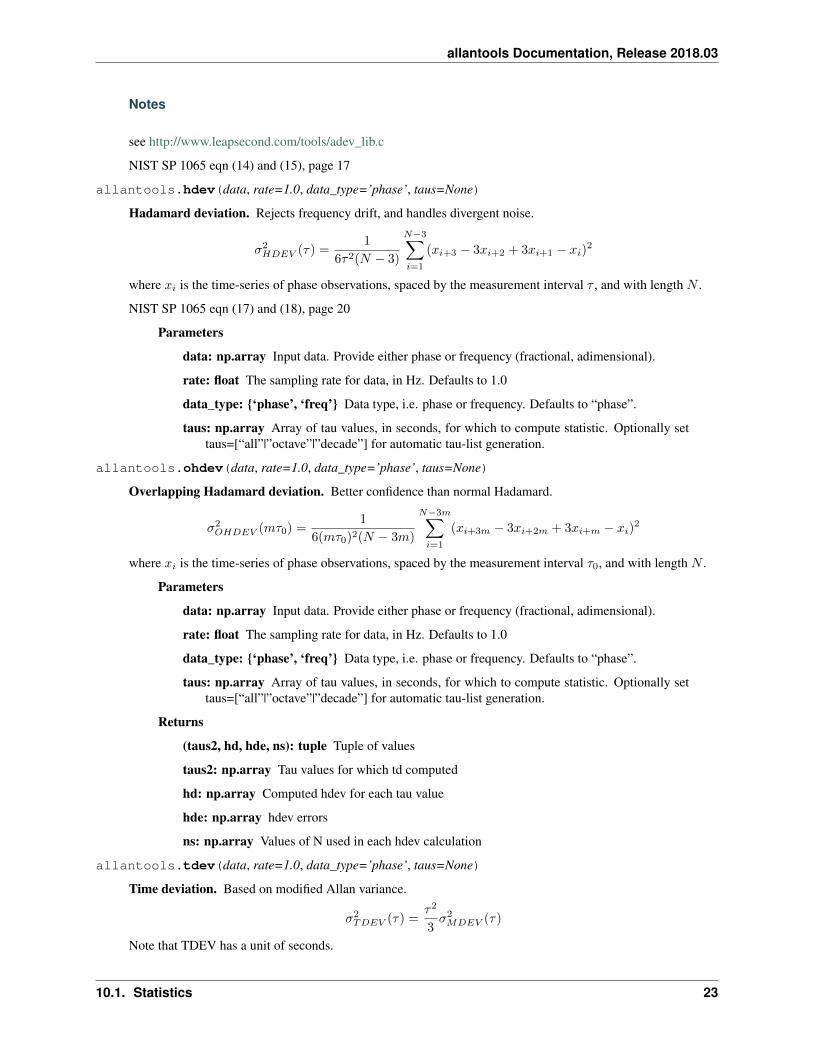
Notes
see http://www.leapsecond.com/tools/adev_lib.c
NIST SP 1065 eqn (14) and (15), page 17
allantools.hdev(data, rate=1.0, data_type=’phase’, taus=None)
Hadamard deviation. Rejects frequency drift, and handles divergent noise.
𝜎2𝐻𝐷𝐸𝑉 (𝜏) =
1
6𝜏2(𝑁 − 3)
𝑁−3∑︁𝑖=1
(𝑥𝑖+3 − 3𝑥𝑖+2 + 3𝑥𝑖+1 − 𝑥𝑖)2
where 𝑥𝑖 is the time-series of phase observations, spaced by the measurement interval 𝜏 , and with length 𝑁 .
NIST SP 1065 eqn (17) and (18), page 20
Parameters
data: np.array Input data. Provide either phase or frequency (fractional, adimensional).
rate: float The sampling rate for data, in Hz. Defaults to 1.0
data_type: {‘phase’, ‘freq’} Data type, i.e. phase or frequency. Defaults to “phase”.
taus: np.array Array of tau values, in seconds, for which to compute statistic. Optionally settaus=[“all”|”octave”|”decade”] for automatic tau-list generation.
allantools.ohdev(data, rate=1.0, data_type=’phase’, taus=None)
Overlapping Hadamard deviation. Better confidence than normal Hadamard.
𝜎2𝑂𝐻𝐷𝐸𝑉 (𝑚𝜏0) =
1
6(𝑚𝜏0)2(𝑁 − 3𝑚)
𝑁−3𝑚∑︁𝑖=1
(𝑥𝑖+3𝑚 − 3𝑥𝑖+2𝑚 + 3𝑥𝑖+𝑚 − 𝑥𝑖)2
where 𝑥𝑖 is the time-series of phase observations, spaced by the measurement interval 𝜏0, and with length 𝑁 .
Parameters
data: np.array Input data. Provide either phase or frequency (fractional, adimensional).
rate: float The sampling rate for data, in Hz. Defaults to 1.0
data_type: {‘phase’, ‘freq’} Data type, i.e. phase or frequency. Defaults to “phase”.
taus: np.array Array of tau values, in seconds, for which to compute statistic. Optionally settaus=[“all”|”octave”|”decade”] for automatic tau-list generation.
Returns
(taus2, hd, hde, ns): tuple Tuple of values
taus2: np.array Tau values for which td computed
hd: np.array Computed hdev for each tau value
hde: np.array hdev errors
ns: np.array Values of N used in each hdev calculation
allantools.tdev(data, rate=1.0, data_type=’phase’, taus=None)
Time deviation. Based on modified Allan variance.
𝜎2𝑇𝐷𝐸𝑉 (𝜏) =
𝜏2
3𝜎2𝑀𝐷𝐸𝑉 (𝜏)
Note that TDEV has a unit of seconds.
10.1. Statistics 23
allantools Documentation, Release 2018.03
Parameters
data: np.array Input data. Provide either phase or frequency (fractional, adimensional).
rate: float The sampling rate for data, in Hz. Defaults to 1.0
data_type: {‘phase’, ‘freq’} Data type, i.e. phase or frequency. Defaults to “phase”.
taus: np.array Array of tau values, in seconds, for which to compute statistic. Optionally settaus=[“all”|”octave”|”decade”] for automatic tau-list generation.
Returns
(taus, tdev, tdev_error, ns): tuple Tuple of values
taus: np.array Tau values for which td computed
tdev: np.array Computed time deviations (in seconds) for each tau value
tdev_errors: np.array Time deviation errors
ns: np.array Values of N used in mdev_phase()
Notes
http://en.wikipedia.org/wiki/Time_deviation
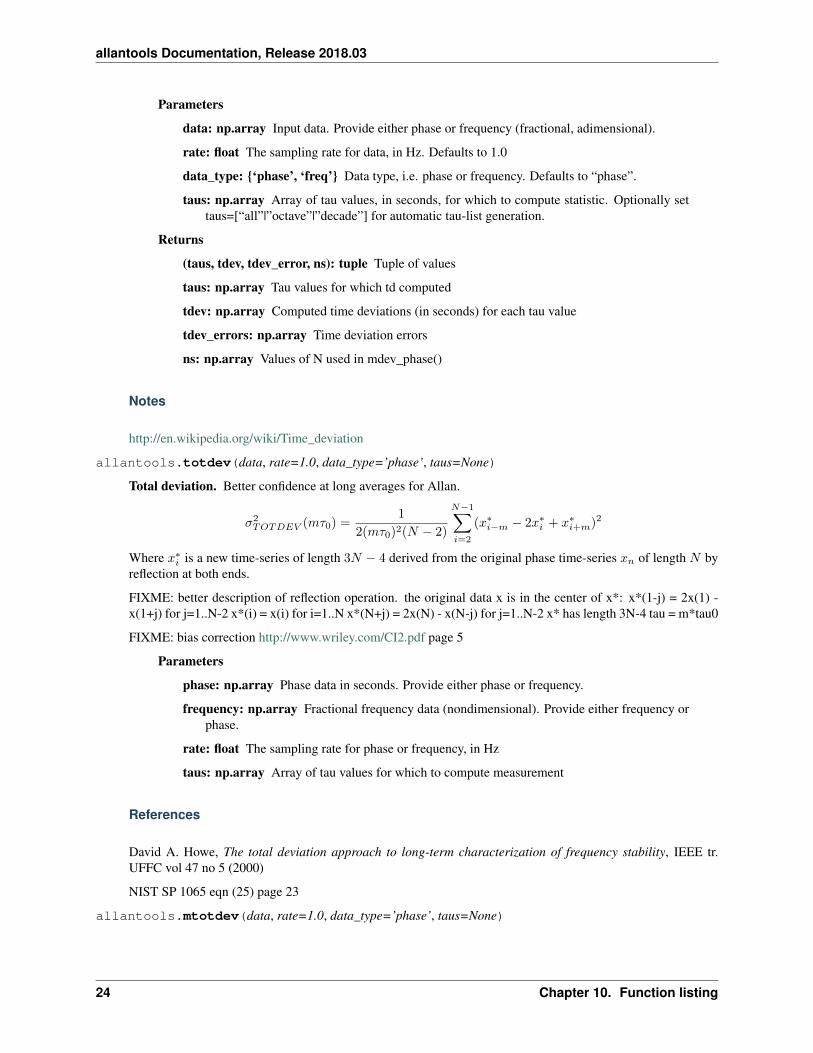
allantools.totdev(data, rate=1.0, data_type=’phase’, taus=None)
Total deviation. Better confidence at long averages for Allan.
𝜎2𝑇𝑂𝑇𝐷𝐸𝑉 (𝑚𝜏0) =
1
2(𝑚𝜏0)2(𝑁 − 2)
𝑁−1∑︁𝑖=2
(𝑥*𝑖−𝑚 − 2𝑥*
𝑖 + 𝑥*𝑖+𝑚)2
Where 𝑥*𝑖 is a new time-series of length 3𝑁 − 4 derived from the original phase time-series 𝑥𝑛 of length 𝑁 by
reflection at both ends.
FIXME: better description of reflection operation. the original data x is in the center of x*: x*(1-j) = 2x(1) -x(1+j) for j=1..N-2 x*(i) = x(i) for i=1..N x*(N+j) = 2x(N) - x(N-j) for j=1..N-2 x* has length 3N-4 tau = m*tau0
FIXME: bias correction http://www.wriley.com/CI2.pdf page 5
Parameters
phase: np.array Phase data in seconds. Provide either phase or frequency.
frequency: np.array Fractional frequency data (nondimensional). Provide either frequency orphase.
rate: float The sampling rate for phase or frequency, in Hz
taus: np.array Array of tau values for which to compute measurement
References
David A. Howe, The total deviation approach to long-term characterization of frequency stability, IEEE tr.UFFC vol 47 no 5 (2000)
NIST SP 1065 eqn (25) page 23
allantools.mtotdev(data, rate=1.0, data_type=’phase’, taus=None)
24 Chapter 10. Function listing
allantools Documentation, Release 2018.03
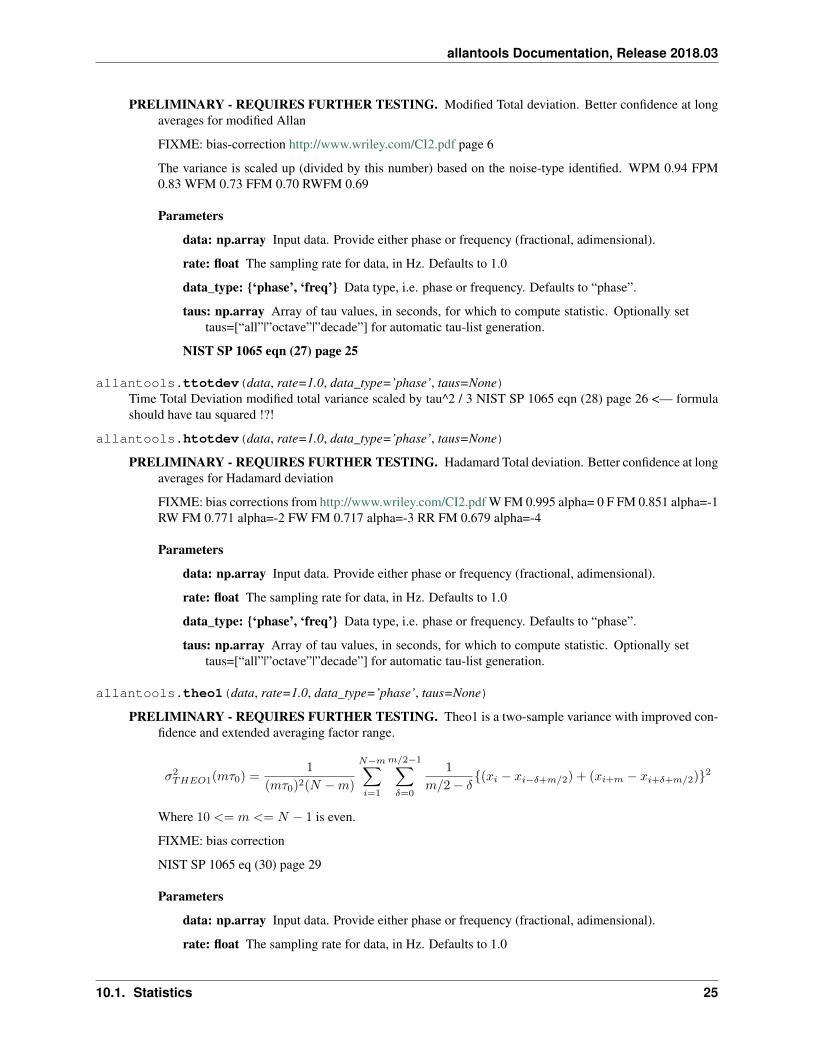
PRELIMINARY - REQUIRES FURTHER TESTING. Modified Total deviation. Better confidence at longaverages for modified Allan
FIXME: bias-correction http://www.wriley.com/CI2.pdf page 6
The variance is scaled up (divided by this number) based on the noise-type identified. WPM 0.94 FPM0.83 WFM 0.73 FFM 0.70 RWFM 0.69
Parameters
data: np.array Input data. Provide either phase or frequency (fractional, adimensional).
rate: float The sampling rate for data, in Hz. Defaults to 1.0
data_type: {‘phase’, ‘freq’} Data type, i.e. phase or frequency. Defaults to “phase”.
taus: np.array Array of tau values, in seconds, for which to compute statistic. Optionally settaus=[“all”|”octave”|”decade”] for automatic tau-list generation.
NIST SP 1065 eqn (27) page 25
allantools.ttotdev(data, rate=1.0, data_type=’phase’, taus=None)Time Total Deviation modified total variance scaled by tau^2 / 3 NIST SP 1065 eqn (28) page 26 <— formulashould have tau squared !?!
allantools.htotdev(data, rate=1.0, data_type=’phase’, taus=None)
PRELIMINARY - REQUIRES FURTHER TESTING. Hadamard Total deviation. Better confidence at longaverages for Hadamard deviation
FIXME: bias corrections from http://www.wriley.com/CI2.pdf W FM 0.995 alpha= 0 F FM 0.851 alpha=-1RW FM 0.771 alpha=-2 FW FM 0.717 alpha=-3 RR FM 0.679 alpha=-4
Parameters
data: np.array Input data. Provide either phase or frequency (fractional, adimensional).
rate: float The sampling rate for data, in Hz. Defaults to 1.0
data_type: {‘phase’, ‘freq’} Data type, i.e. phase or frequency. Defaults to “phase”.
taus: np.array Array of tau values, in seconds, for which to compute statistic. Optionally settaus=[“all”|”octave”|”decade”] for automatic tau-list generation.
allantools.theo1(data, rate=1.0, data_type=’phase’, taus=None)
PRELIMINARY - REQUIRES FURTHER TESTING. Theo1 is a two-sample variance with improved con-fidence and extended averaging factor range.
𝜎2𝑇𝐻𝐸𝑂1(𝑚𝜏0) =
1
(𝑚𝜏0)2(𝑁 −𝑚)
𝑁−𝑚∑︁𝑖=1
𝑚/2−1∑︁𝛿=0
1
𝑚/2 − 𝛿{(𝑥𝑖 − 𝑥𝑖−𝛿+𝑚/2) + (𝑥𝑖+𝑚 − 𝑥𝑖+𝛿+𝑚/2)}2
Where 10 <= 𝑚 <= 𝑁 − 1 is even.
FIXME: bias correction
NIST SP 1065 eq (30) page 29
Parameters
data: np.array Input data. Provide either phase or frequency (fractional, adimensional).
rate: float The sampling rate for data, in Hz. Defaults to 1.0
10.1. Statistics 25
allantools Documentation, Release 2018.03
data_type: {‘phase’, ‘freq’} Data type, i.e. phase or frequency. Defaults to “phase”.
taus: np.array Array of tau values, in seconds, for which to compute statistic. Optionally settaus=[“all”|”octave”|”decade”] for automatic tau-list generation.
allantools.mtie(data, rate=1.0, data_type=’phase’, taus=None)Maximum Time Interval Error.
Parameters
data: np.array Input data. Provide either phase or frequency (fractional, adimensional).
rate: float The sampling rate for data, in Hz. Defaults to 1.0
data_type: {‘phase’, ‘freq’} Data type, i.e. phase or frequency. Defaults to “phase”.
taus: np.array Array of tau values, in seconds, for which to compute statistic. Optionally settaus=[“all”|”octave”|”decade”] for automatic tau-list generation.
Notes
this seems to correspond to Stable32 setting “Fast(u)” Stable32 also has “Decade” and “Octave” modes wherethe dataset is extended somehow?
allantools.tierms(data, rate=1.0, data_type=’phase’, taus=None)Time Interval Error RMS.
Parameters
data: np.array Input data. Provide either phase or frequency (fractional, adimensional).
rate: float The sampling rate for data, in Hz. Defaults to 1.0
data_type: {‘phase’, ‘freq’} Data type, i.e. phase or frequency. Defaults to “phase”.
taus: np.array Array of tau values, in seconds, for which to compute statistic. Optionally settaus=[“all”|”octave”|”decade”] for automatic tau-list generation.
10.2 Noise Generation
allantools.noise.white(num_points=1024, b0=1.0, fs=1.0)generate time series with white noise that has constant PSD = b0, up to the nyquist frequency fs/2 N = numberof samples b0 = desired power-spectral density in [X^2/Hz] where X is the unit of x fs = sampling frequency,i.e. 1/fs is the time-interval between datapoints
the pre-factor corresponds to the area ‘box’ under the PSD-curve: The PSD is at ‘height’ b0 and extends from 0Hz up to the nyquist frequency fs/2
allantools.noise.brown(num_points=1024, b2=1.0, fs=1.0)Brownian or random walk (diffusion) noise with 1/f^2 PSD (not really a color. . . rather Brownian or random-walk)
N = number of samples b2 = desired PSD is b2*f^-2 fs = sampling frequency
we integrate white-noise to get Brownian noise.
allantools.noise.violet(num_points)violet noise with f^2 PSD
26 Chapter 10. Function listing
allantools Documentation, Release 2018.03
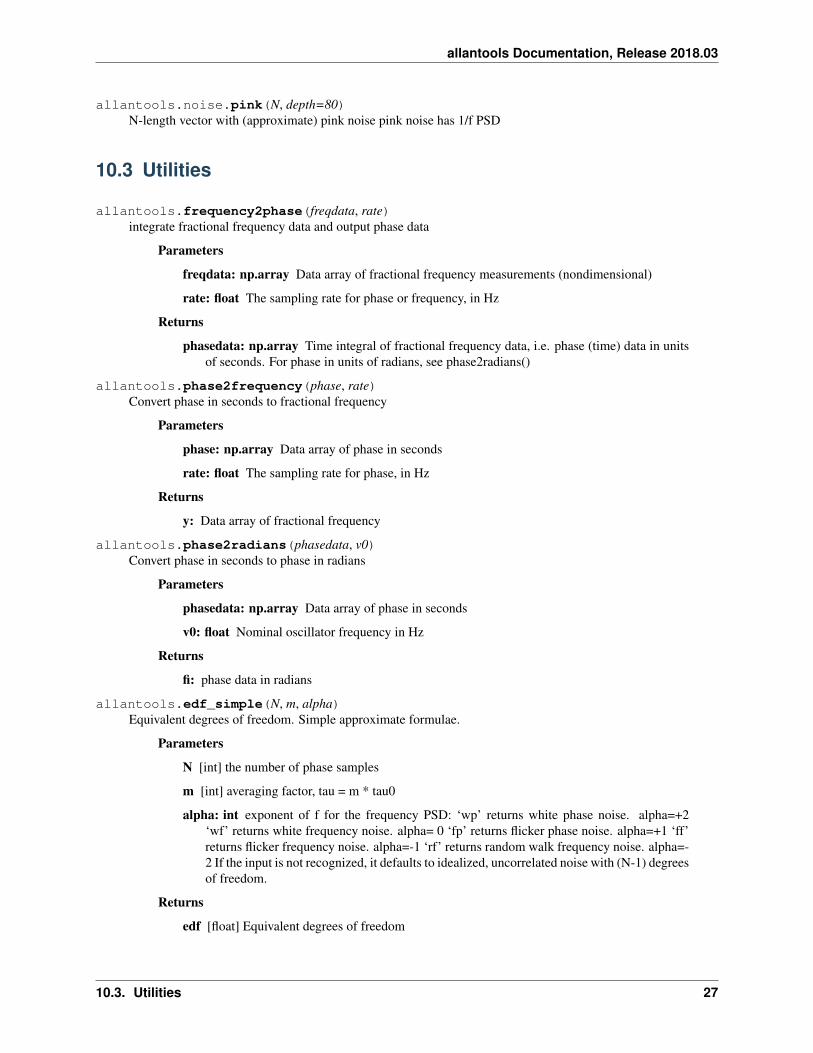
allantools.noise.pink(N, depth=80)N-length vector with (approximate) pink noise pink noise has 1/f PSD
10.3 Utilities
allantools.frequency2phase(freqdata, rate)integrate fractional frequency data and output phase data
Parameters
freqdata: np.array Data array of fractional frequency measurements (nondimensional)
rate: float The sampling rate for phase or frequency, in Hz
Returns
phasedata: np.array Time integral of fractional frequency data, i.e. phase (time) data in unitsof seconds. For phase in units of radians, see phase2radians()
allantools.phase2frequency(phase, rate)Convert phase in seconds to fractional frequency
Parameters
phase: np.array Data array of phase in seconds
rate: float The sampling rate for phase, in Hz
Returns
y: Data array of fractional frequency
allantools.phase2radians(phasedata, v0)Convert phase in seconds to phase in radians
Parameters
phasedata: np.array Data array of phase in seconds
v0: float Nominal oscillator frequency in Hz
Returns
fi: phase data in radians
allantools.edf_simple(N, m, alpha)Equivalent degrees of freedom. Simple approximate formulae.
Parameters
N [int] the number of phase samples
m [int] averaging factor, tau = m * tau0
alpha: int exponent of f for the frequency PSD: ‘wp’ returns white phase noise. alpha=+2‘wf’ returns white frequency noise. alpha= 0 ‘fp’ returns flicker phase noise. alpha=+1 ‘ff’returns flicker frequency noise. alpha=-1 ‘rf’ returns random walk frequency noise. alpha=-2 If the input is not recognized, it defaults to idealized, uncorrelated noise with (N-1) degreesof freedom.
Returns
edf [float] Equivalent degrees of freedom
10.3. Utilities 27
allantools Documentation, Release 2018.03
Notes
S. Stein, Frequency and Time - Their Measurement and Characterization. Precision Frequency Control Vol 2,1985, pp 191-416. http://tf.boulder.nist.gov/general/pdf/666.pdf
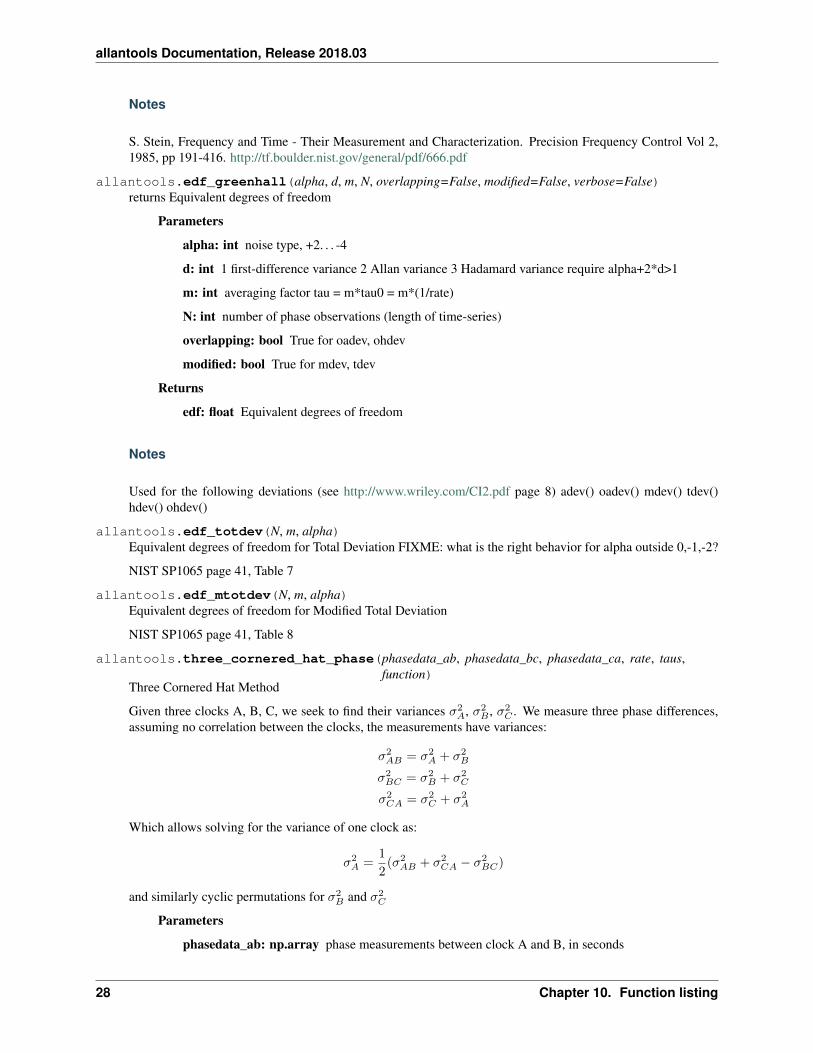
allantools.edf_greenhall(alpha, d, m, N, overlapping=False, modified=False, verbose=False)returns Equivalent degrees of freedom
Parameters
alpha: int noise type, +2. . . -4
d: int 1 first-difference variance 2 Allan variance 3 Hadamard variance require alpha+2*d>1
m: int averaging factor tau = m*tau0 = m*(1/rate)
N: int number of phase observations (length of time-series)
overlapping: bool True for oadev, ohdev
modified: bool True for mdev, tdev
Returns
edf: float Equivalent degrees of freedom
Notes
Used for the following deviations (see http://www.wriley.com/CI2.pdf page 8) adev() oadev() mdev() tdev()hdev() ohdev()
allantools.edf_totdev(N, m, alpha)Equivalent degrees of freedom for Total Deviation FIXME: what is the right behavior for alpha outside 0,-1,-2?
NIST SP1065 page 41, Table 7
allantools.edf_mtotdev(N, m, alpha)Equivalent degrees of freedom for Modified Total Deviation
NIST SP1065 page 41, Table 8
allantools.three_cornered_hat_phase(phasedata_ab, phasedata_bc, phasedata_ca, rate, taus,function)
Three Cornered Hat Method
Given three clocks A, B, C, we seek to find their variances 𝜎2𝐴, 𝜎2
𝐵 , 𝜎2𝐶 . We measure three phase differences,
assuming no correlation between the clocks, the measurements have variances:
𝜎2𝐴𝐵 = 𝜎2
𝐴 + 𝜎2𝐵
𝜎2𝐵𝐶 = 𝜎2
𝐵 + 𝜎2𝐶
𝜎2𝐶𝐴 = 𝜎2
𝐶 + 𝜎2𝐴
Which allows solving for the variance of one clock as:
𝜎2𝐴 =
1
2(𝜎2
𝐴𝐵 + 𝜎2𝐶𝐴 − 𝜎2
𝐵𝐶)
and similarly cyclic permutations for 𝜎2𝐵 and 𝜎2
𝐶
Parameters
phasedata_ab: np.array phase measurements between clock A and B, in seconds
28 Chapter 10. Function listing
allantools Documentation, Release 2018.03
phasedata_bc: np.array phase measurements between clock B and C, in seconds
phasedata_ca: np.array phase measurements between clock C and A, in seconds
rate: float The sampling rate for phase, in Hz
taus: np.array The tau values for deviations, in seconds
function: allantools deviation function The type of statistic to compute, e.g. allantools.oadev
Returns
tau_ab: np.array Tau values corresponding to output deviations
dev_a: np.array List of computed values for clock A
References
http://www.wriley.com/3-CornHat.htm
10.3. Utilities 29

allantools Documentation, Release 2018.03
30 Chapter 10. Function listing
CHAPTER 11
Development
11.1 To-do list
Here follows an un-ordered to do list:
• Statistics and core algorithms
– The mtie_phase_fast approach to MTIE, using a binary tree (see BREGNI reference)
– TheoH
– Confidence intervals based on identified noise-type and equivalent degrees of freedom.
– Bias corrections for biased statistics (totdev, mtotdev, htotdev, theo1)
– Multi-threading for faster processing of (very) large datasets
– Faster algorithms for mtotdev() and htotdev() which are currently very slow
• Improve documentation
• Improve packaging for PyPi and/or other packaging systems (PPA for Ubuntu/Debian?)
• Stable32-style plots using matplotlib
• Tests for different noise types according to IEEE 1139, include power-spectral-density calculations
• Conversion between phase noise and Allan variance
• Phase noise calculations and plots
• Comparison to other libraries such as GPSTk
Make sure your patch does not break any of the tests, and does not significantly reduce the readability of the code.
11.2 Notes for Pypi
Creating a source distribution
31
allantools Documentation, Release 2018.03
python setup.py sdist
This creates a package in dist/ Testing the source distribution. The install takes a long time while compiling numpyand scipy.
$ virtualenv tmp$ tmp/bin/pip install dist/AllanTools-2016.2.tar.gz$ tmp/bin/python>>> import allantools
Uploading to PyPi. (requries a ~/.pypirc with username and password)
$ twine upload dist/*
Check result at https://pypi.python.org/pypi/AllanTools
32 Chapter 11. Development
CHAPTER 12
References
12.1 Code
• http://www.mathworks.com/matlabcentral/fileexchange/26659-allan-v3-0
• http://www.mathworks.com/matlabcentral/fileexchange/26637-allanmodified
• http://www.leapsecond.com/tools/adev_lib.c
12.2 Papers
33
allantools Documentation, Release 2018.03
34 Chapter 12. References
Bibliography
[Greenhall2004] Greenhall & Riley, “UNCERTAINTY OF STABILITY VARIANCES BASED ON FINITE DIF-FERENCES” 35th Annual Precise Time and Time Interval (PTTI) Meeting https://ntrs.nasa.gov/archive/nasa/casi.ntrs.nasa.gov/20050061319.pdf
[wikipedia_adev] http://en.wikipedia.org/wiki/Allan_variance
[SP1065] NIST Special Publication 1065 http://tf.nist.gov/timefreq/general/pdf/2220.pdf
[IEEE1139] 1139-2008 - IEEE Standard Definitions of Physical Quantities for Fundamental Frequency and TimeMetrology - Random Instabilities http://dx.doi.org/10.1109/IEEESTD.2008.4797525
[Riley_Stable32] http://www.stable32.com/Handbook.pdf
[Riley_CI] Confidence Intervals and Bias Corrections for the Stable32 Variance Functions W.J. Riley, Hamilton Tech-nical Services http://www.wriley.com/CI2.pdf
[Vernotte2011] F. Vernotte, “Variance Measurements”, 2011 IFCS & EFTF http://www.ieee-uffc.org/frequency-control/learning/pdf/Vernotte-Varience_Measurements.pdf
[Stein1985] S. Stein, Frequency and Time - Their Measurement and Characterization. Precision Frequency ControlVol 2, 1985, pp 191-416. http://tf.boulder.nist.gov/general/pdf/666.pdf
[Riley_1] W.J.Riley, “THE CALCULATION OF TIME DOMAIN FREQUENCY STABILITY” http://www.wriley.com/paper1ht.htm
[Sesia2011] SESIA I., GALLEANI L., TAVELLA P., Application of the Dynamic Allan Variance for the Characteri-zation of Space Clock Behavior, http://dx.doi.org/10.1109/TAES.2011.5751232
[Bregni2001] S. BREGNI, Fast Algorithms for TVAR and MTIE Computation in Characterization of Network Syn-chronization Performance. http://home.deib.polimi.it/bregni/papers/cscc2001_fastalgo.pdf
[Howe2000] David A. Howe, The total deviation approach to long-term characterization of frequency stability, IEEEtr. UFFC vol 47 no 5 (2000) http://dx.doi.org/10.1109/58.869040
[Sesia2008] Ilaria Sesia and Patrizia Tavella, Estimating the Allan variance in the presence of long periods of missingdata and outliers. 2008 Metrologia 45 S134 http://dx.doi.org/10.1088/0026-1394/45/6/S19
[Howe_theo1] D.A. Howe and T.N. Tasset THEO1: CHARACTERIZATION OF VERY LONG-TERM FRE-QUENCY STABILITY http://tf.nist.gov/general/pdf/1990.pdf
35
allantools Documentation, Release 2018.03
36 Bibliography
Index
Symbols__init__() (allantools.Dataset method), 17__init__() (allantools.Plot method), 19
Aadev() (in module allantools), 21
Bbrown() (in module allantools.noise), 26
Ccompute() (allantools.Dataset method), 18
DDataset (class in allantools), 17
Eedf_greenhall() (in module allantools), 28edf_mtotdev() (in module allantools), 28edf_simple() (in module allantools), 27edf_totdev() (in module allantools), 28
Ffrequency2phase() (in module allantools), 27
Hhdev() (in module allantools), 23htotdev() (in module allantools), 25
Iinp (allantools.Dataset attribute), 18
Mmdev() (in module allantools), 22mtie() (in module allantools), 26mtotdev() (in module allantools), 24
Ooadev() (in module allantools), 22
ohdev() (in module allantools), 23out (allantools.Dataset attribute), 18
Pphase2frequency() (in module allantools), 27phase2radians() (in module allantools), 27pink() (in module allantools.noise), 26Plot (class in allantools), 18plot() (allantools.Plot method), 19
Sset_input() (allantools.Dataset method), 18show() (allantools.Plot method), 19
Ttdev() (in module allantools), 23theo1() (in module allantools), 25three_cornered_hat_phase() (in module allantools), 28tierms() (in module allantools), 26totdev() (in module allantools), 24ttotdev() (in module allantools), 25
Vviolet() (in module allantools.noise), 26
Wwhite() (in module allantools.noise), 26
37


![Fast Background Initialization with Recursive Hadamard ... · 2. The Hadamard Transform The Hadamard transform [7, 9] belongs to the gener-alized class of Fourier transforms and it](https://img.pdfslide.net/doc/110x75/5f13c09011c737592655ec87/fast-background-initialization-with-recursive-hadamard-2-the-hadamard-transform.jpg)